Robinette, WV Map & Demographics
Robinette Map
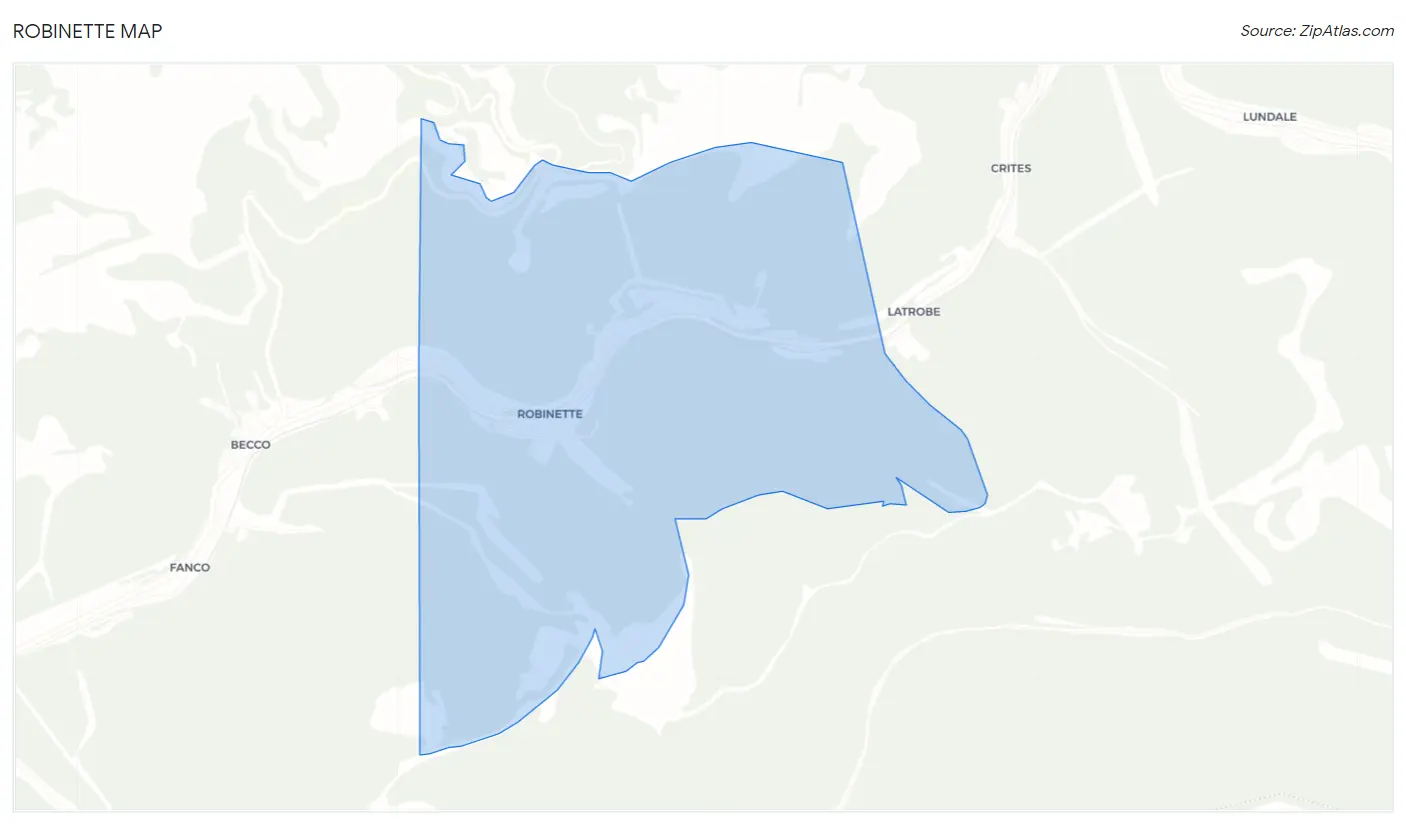
Robinette Overview
$25,558
PER CAPITA INCOME
$24,766
AVG FAMILY INCOME
$23,819
AVG HOUSEHOLD INCOME
0.54
INEQUALITY / GINI INDEX
471
TOTAL POPULATION
196
MALE POPULATION
275
FEMALE POPULATION
71.27
MALES / 100 FEMALES
140.31
FEMALES / 100 MALES
47.5
MEDIAN AGE
2.5
AVG FAMILY SIZE
2.2
AVG HOUSEHOLD SIZE
101
LABOR FORCE [ PEOPLE ]
22.3%
PERCENT IN LABOR FORCE
9.9%
UNEMPLOYMENT RATE
Robinette Area Codes
Income in Robinette
Income Overview in Robinette
Per Capita Income in Robinette is $25,558, while median incomes of families and households are $24,766 and $23,819 respectively.
| Characteristic | Number | Measure |
| Per Capita Income | 471 | $25,558 |
| Median Family Income | 164 | $24,766 |
| Mean Family Income | 164 | $54,377 |
| Median Household Income | 208 | $23,819 |
| Mean Household Income | 208 | $49,013 |
| Income Deficit | 164 | $0 |
| Wage / Income Gap (%) | 471 | 0.00% |
| Wage / Income Gap ($) | 471 | 100.00¢ per $1 |
| Gini / Inequality Index | 471 | 0.54 |
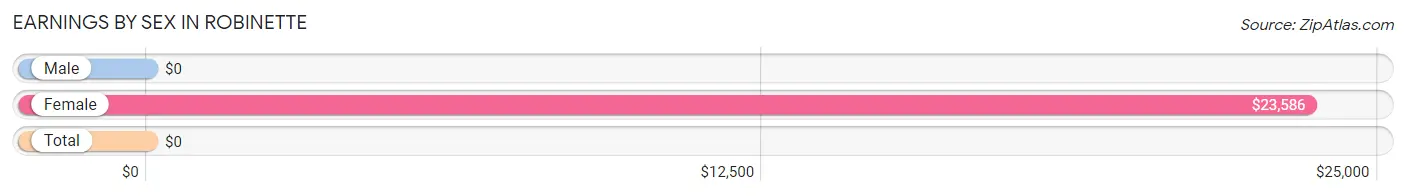
Earnings by Sex in Robinette
| Sex | Number | Average Earnings |
| Male | 43 (44.8%) | $0 |
| Female | 53 (55.2%) | $23,586 |
| Total | 96 (100.0%) | $0 |
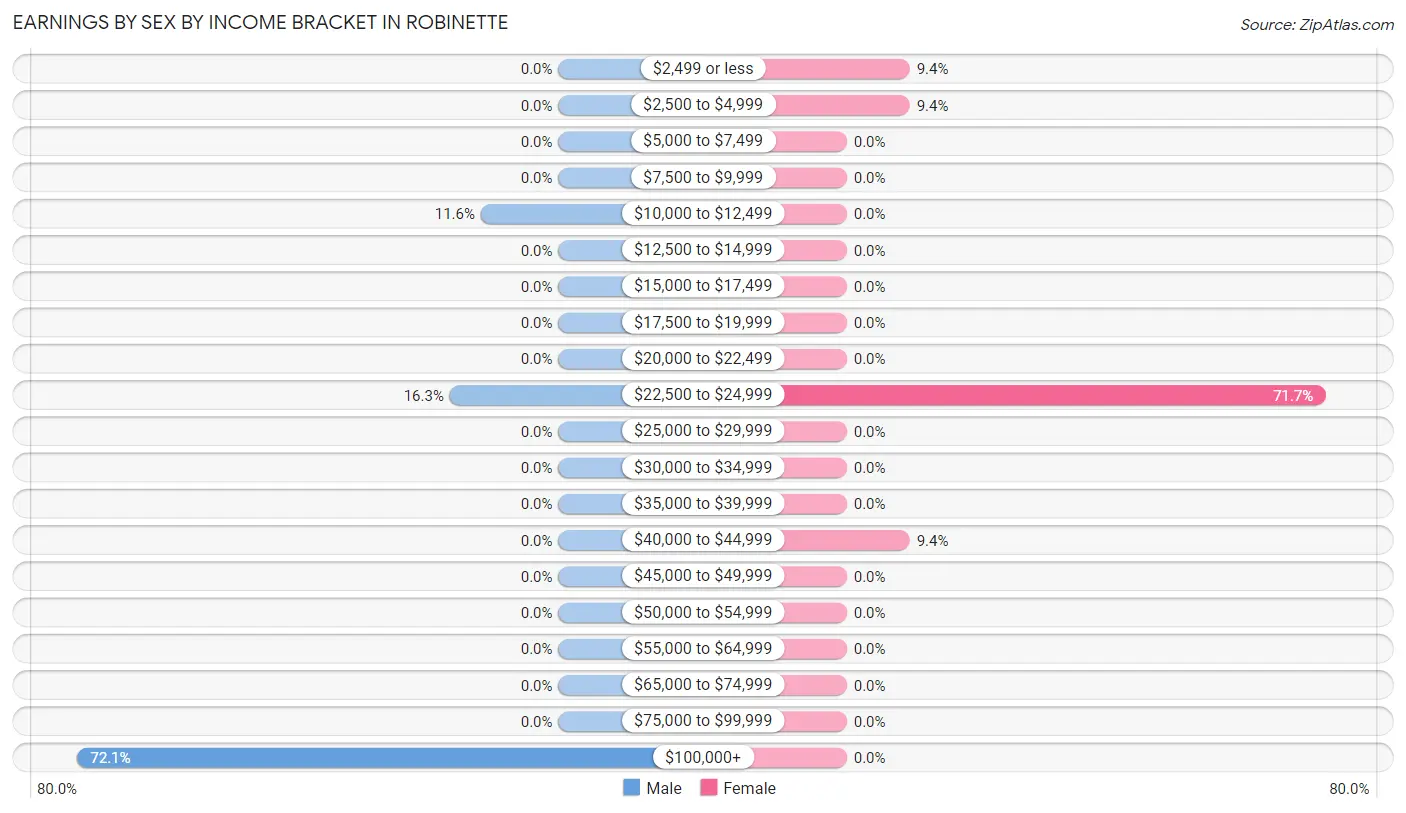
Earnings by Sex by Income Bracket in Robinette
The most common earnings brackets in Robinette are $100,000+ for men (31 | 72.1%) and $22,500 to $24,999 for women (38 | 71.7%).
| Income | Male | Female |
| $2,499 or less | 0 (0.0%) | 5 (9.4%) |
| $2,500 to $4,999 | 0 (0.0%) | 5 (9.4%) |
| $5,000 to $7,499 | 0 (0.0%) | 0 (0.0%) |
| $7,500 to $9,999 | 0 (0.0%) | 0 (0.0%) |
| $10,000 to $12,499 | 5 (11.6%) | 0 (0.0%) |
| $12,500 to $14,999 | 0 (0.0%) | 0 (0.0%) |
| $15,000 to $17,499 | 0 (0.0%) | 0 (0.0%) |
| $17,500 to $19,999 | 0 (0.0%) | 0 (0.0%) |
| $20,000 to $22,499 | 0 (0.0%) | 0 (0.0%) |
| $22,500 to $24,999 | 7 (16.3%) | 38 (71.7%) |
| $25,000 to $29,999 | 0 (0.0%) | 0 (0.0%) |
| $30,000 to $34,999 | 0 (0.0%) | 0 (0.0%) |
| $35,000 to $39,999 | 0 (0.0%) | 0 (0.0%) |
| $40,000 to $44,999 | 0 (0.0%) | 5 (9.4%) |
| $45,000 to $49,999 | 0 (0.0%) | 0 (0.0%) |
| $50,000 to $54,999 | 0 (0.0%) | 0 (0.0%) |
| $55,000 to $64,999 | 0 (0.0%) | 0 (0.0%) |
| $65,000 to $74,999 | 0 (0.0%) | 0 (0.0%) |
| $75,000 to $99,999 | 0 (0.0%) | 0 (0.0%) |
| $100,000+ | 31 (72.1%) | 0 (0.0%) |
| Total | 43 (100.0%) | 53 (100.0%) |
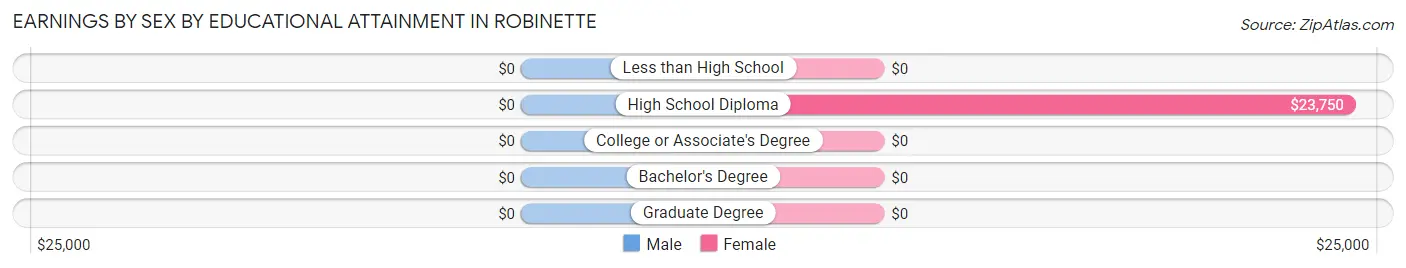
Earnings by Sex by Educational Attainment in Robinette
| Educational Attainment | Male Income | Female Income |
| Less than High School | - | - |
| High School Diploma | - | - |
| College or Associate's Degree | - | - |
| Bachelor's Degree | - | - |
| Graduate Degree | - | - |
| Total | - | - |
Family Income in Robinette
Family Income Brackets in Robinette
According to the Robinette family income data, there are 58 families falling into the $15,000 to $24,999 income range, which is the most common income bracket and makes up 35.4% of all families.
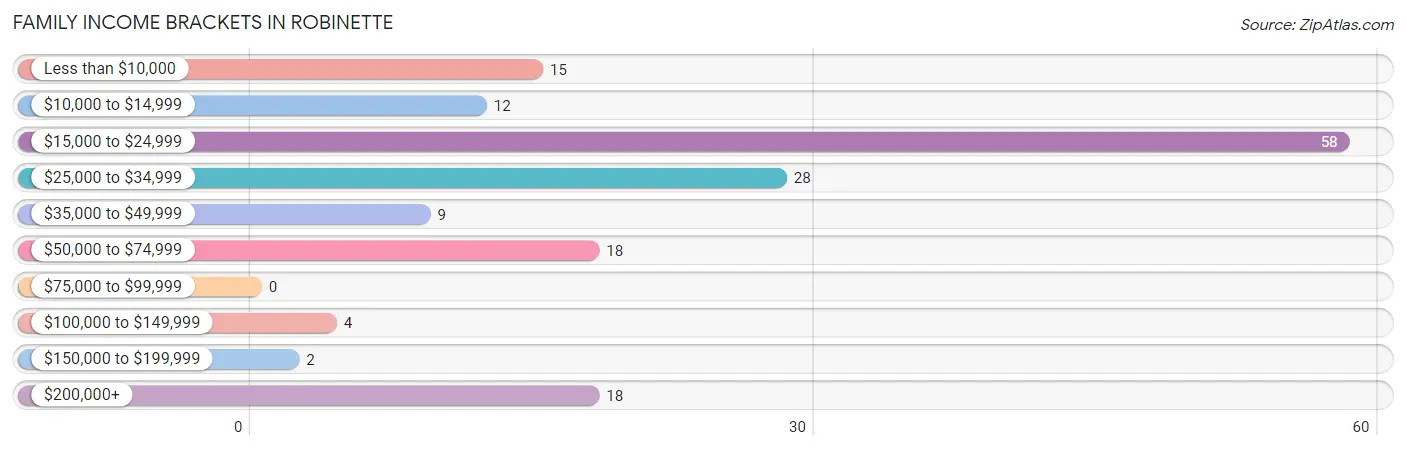
| Income Bracket | # Families | % Families |
| Less than $10,000 | 15 | 9.1% |
| $10,000 to $14,999 | 12 | 7.3% |
| $15,000 to $24,999 | 58 | 35.4% |
| $25,000 to $34,999 | 28 | 17.1% |
| $35,000 to $49,999 | 9 | 5.5% |
| $50,000 to $74,999 | 18 | 11.0% |
| $75,000 to $99,999 | 0 | 0.0% |
| $100,000 to $149,999 | 4 | 2.4% |
| $150,000 to $199,999 | 2 | 1.2% |
| $200,000+ | 18 | 11.0% |
Family Income by Famaliy Size in Robinette
2-person families (103 | 62.8%) account for the highest median family income in Robinette with $22,356 per family, while 2-person families (103 | 62.8%) have the highest median income of $11,178 per family member.
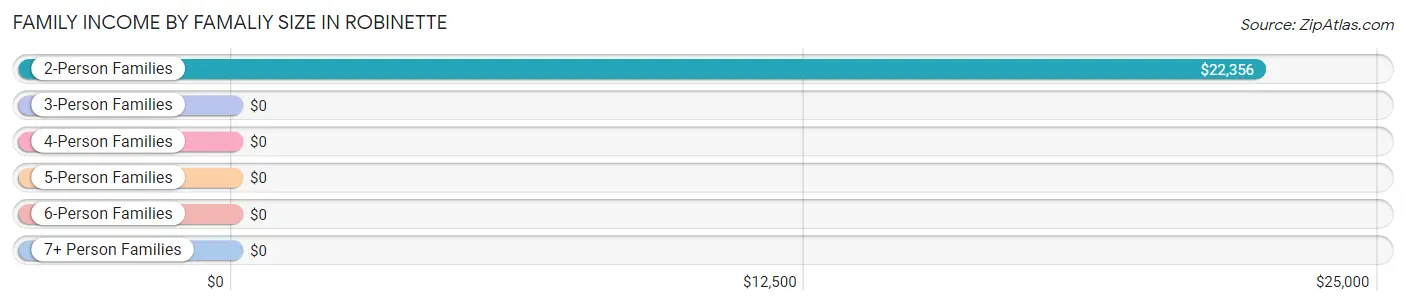
| Income Bracket | # Families | Median Income |
| 2-Person Families | 103 (62.8%) | $22,356 |
| 3-Person Families | 43 (26.2%) | $0 |
| 4-Person Families | 18 (11.0%) | $0 |
| 5-Person Families | 0 (0.0%) | $0 |
| 6-Person Families | 0 (0.0%) | $0 |
| 7+ Person Families | 0 (0.0%) | $0 |
| Total | 164 (100.0%) | $24,766 |
Family Income by Number of Earners in Robinette
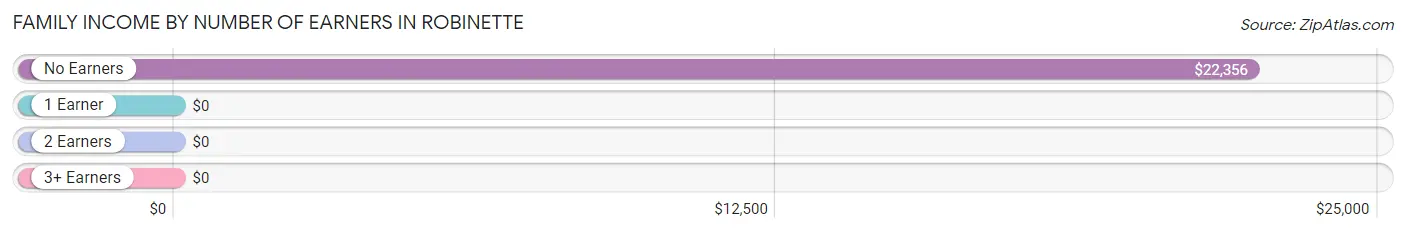
| Number of Earners | # Families | Median Income |
| No Earners | 103 (62.8%) | $22,356 |
| 1 Earner | 54 (32.9%) | $0 |
| 2 Earners | 5 (3.0%) | $0 |
| 3+ Earners | 2 (1.2%) | $0 |
| Total | 164 (100.0%) | $24,766 |
Household Income in Robinette
Household Income Brackets in Robinette
With 94 households falling in the category, the $15,000 to $24,999 income range is the most frequent in Robinette, accounting for 45.2% of all households.
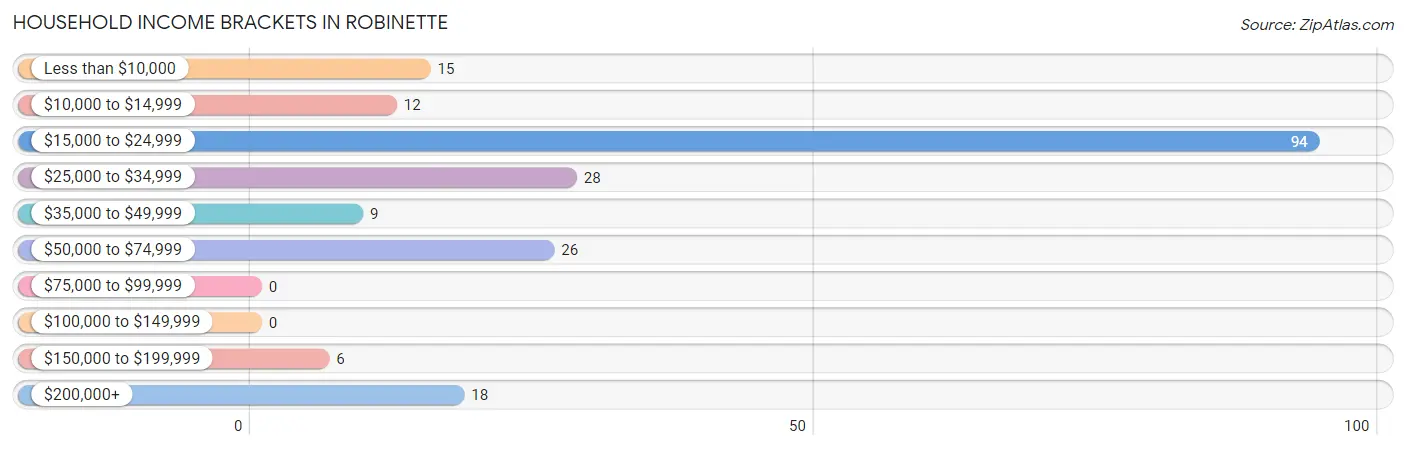
| Income Bracket | # Households | % Households |
| Less than $10,000 | 15 | 7.2% |
| $10,000 to $14,999 | 12 | 5.8% |
| $15,000 to $24,999 | 94 | 45.2% |
| $25,000 to $34,999 | 28 | 13.5% |
| $35,000 to $49,999 | 9 | 4.3% |
| $50,000 to $74,999 | 26 | 12.5% |
| $75,000 to $99,999 | 0 | 0.0% |
| $100,000 to $149,999 | 0 | 0.0% |
| $150,000 to $199,999 | 6 | 2.9% |
| $200,000+ | 18 | 8.7% |
Household Income by Householder Age in Robinette
The median household income in Robinette is $23,819, with the highest median household income of $22,452 found in the 45 to 64 years age bracket for the primary householder. A total of 93 households (44.7%) fall into this category.
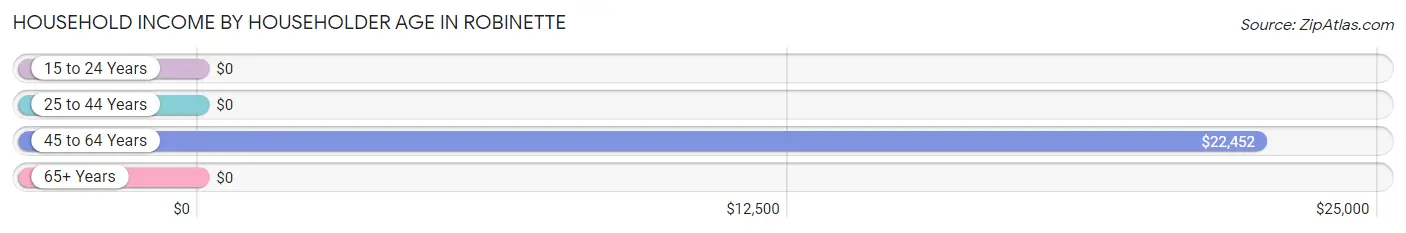
| Income Bracket | # Households | Median Income |
| 15 to 24 Years | 0 (0.0%) | $0 |
| 25 to 44 Years | 21 (10.1%) | $0 |
| 45 to 64 Years | 93 (44.7%) | $22,452 |
| 65+ Years | 94 (45.2%) | $0 |
| Total | 208 (100.0%) | $23,819 |
Poverty in Robinette
Income Below Poverty by Sex and Age in Robinette
With 8.2% poverty level for males and 17.1% for females among the residents of Robinette, 16 and 17 year old males and 16 and 17 year old females are the most vulnerable to poverty, with 4 males (100.0%) and 13 females (100.0%) in their respective age groups living below the poverty level.
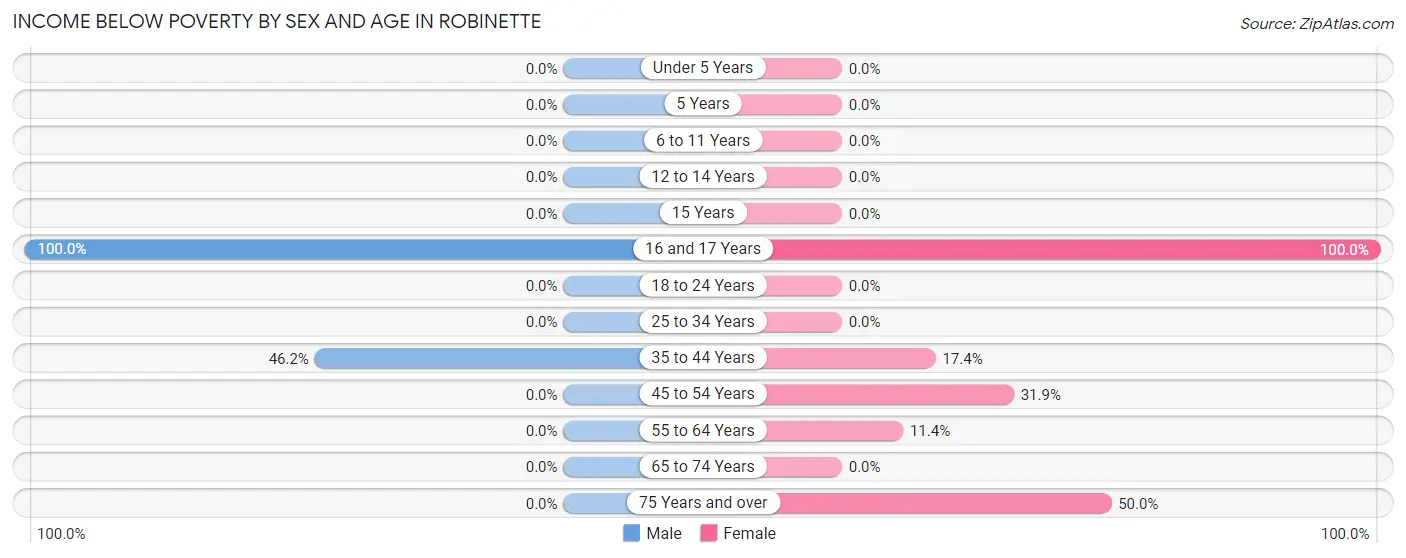
| Age Bracket | Male | Female |
| Under 5 Years | 0 (0.0%) | 0 (0.0%) |
| 5 Years | 0 (0.0%) | 0 (0.0%) |
| 6 to 11 Years | 0 (0.0%) | 0 (0.0%) |
| 12 to 14 Years | 0 (0.0%) | 0 (0.0%) |
| 15 Years | 0 (0.0%) | 0 (0.0%) |
| 16 and 17 Years | 4 (100.0%) | 13 (100.0%) |
| 18 to 24 Years | 0 (0.0%) | 0 (0.0%) |
| 25 to 34 Years | 0 (0.0%) | 0 (0.0%) |
| 35 to 44 Years | 12 (46.2%) | 12 (17.4%) |
| 45 to 54 Years | 0 (0.0%) | 15 (31.9%) |
| 55 to 64 Years | 0 (0.0%) | 5 (11.4%) |
| 65 to 74 Years | 0 (0.0%) | 0 (0.0%) |
| 75 Years and over | 0 (0.0%) | 2 (50.0%) |
| Total | 16 (8.2%) | 47 (17.1%) |
Income Above Poverty by Sex and Age in Robinette
According to the poverty statistics in Robinette, males aged 12 to 14 years and females aged 18 to 24 years are the age groups that are most secure financially, with 100.0% of males and 100.0% of females in these age groups living above the poverty line.
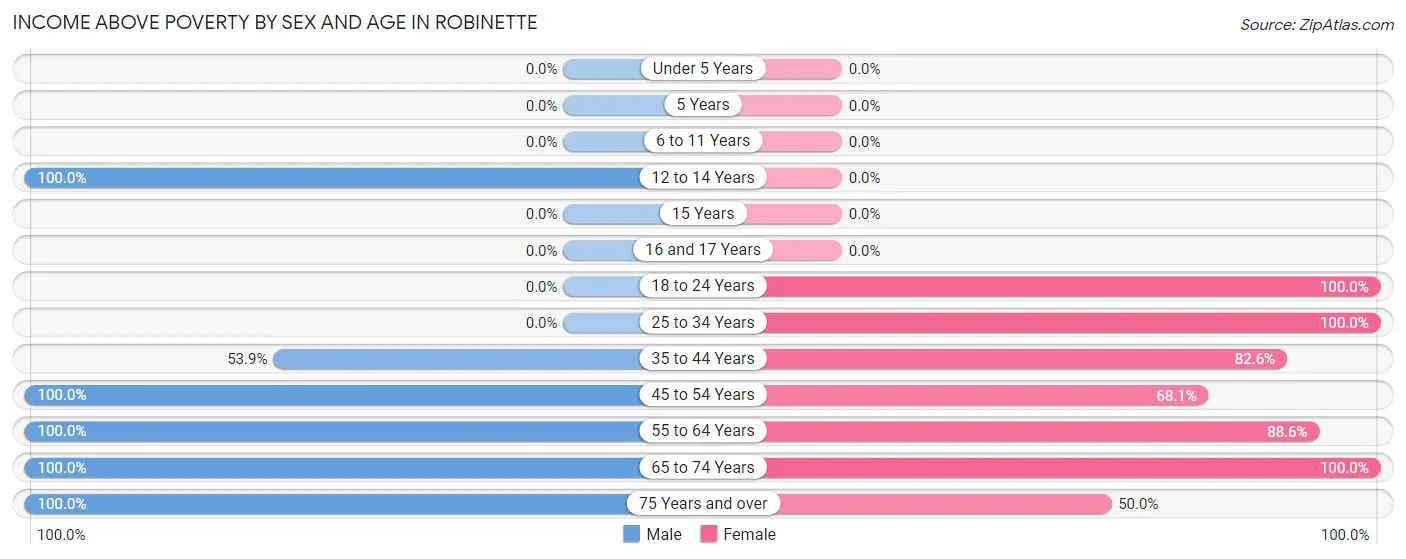
| Age Bracket | Male | Female |
| Under 5 Years | 0 (0.0%) | 0 (0.0%) |
| 5 Years | 0 (0.0%) | 0 (0.0%) |
| 6 to 11 Years | 0 (0.0%) | 0 (0.0%) |
| 12 to 14 Years | 18 (100.0%) | 0 (0.0%) |
| 15 Years | 0 (0.0%) | 0 (0.0%) |
| 16 and 17 Years | 0 (0.0%) | 0 (0.0%) |
| 18 to 24 Years | 0 (0.0%) | 34 (100.0%) |
| 25 to 34 Years | 0 (0.0%) | 5 (100.0%) |
| 35 to 44 Years | 14 (53.8%) | 57 (82.6%) |
| 45 to 54 Years | 37 (100.0%) | 32 (68.1%) |
| 55 to 64 Years | 32 (100.0%) | 39 (88.6%) |
| 65 to 74 Years | 71 (100.0%) | 59 (100.0%) |
| 75 Years and over | 8 (100.0%) | 2 (50.0%) |
| Total | 180 (91.8%) | 228 (82.9%) |
Income Below Poverty Among Married-Couple Families in Robinette
The poverty statistics for married-couple families in Robinette show that 9.8% or 12 of the total 122 families live below the poverty line. Families with no children have the highest poverty rate of 13.3%, comprising of 12 families. On the other hand, families with 1 or 2 children have the lowest poverty rate of 0.0%, which includes 0 families.
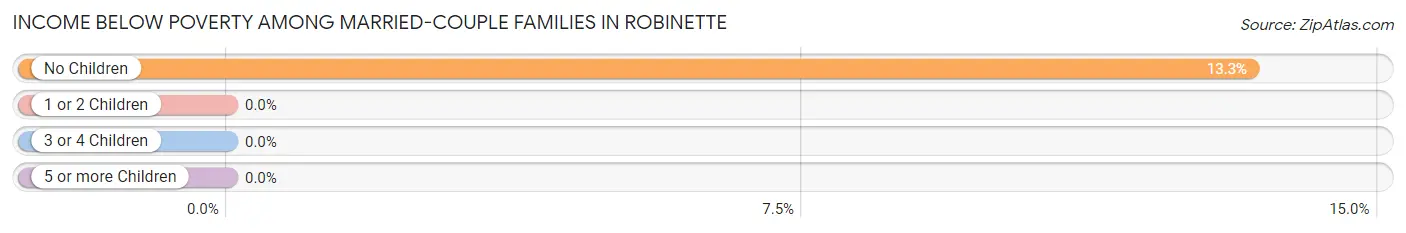
| Children | Above Poverty | Below Poverty |
| No Children | 78 (86.7%) | 12 (13.3%) |
| 1 or 2 Children | 32 (100.0%) | 0 (0.0%) |
| 3 or 4 Children | 0 (0.0%) | 0 (0.0%) |
| 5 or more Children | 0 (0.0%) | 0 (0.0%) |
| Total | 110 (90.2%) | 12 (9.8%) |
Income Below Poverty Among Single-Parent Households in Robinette
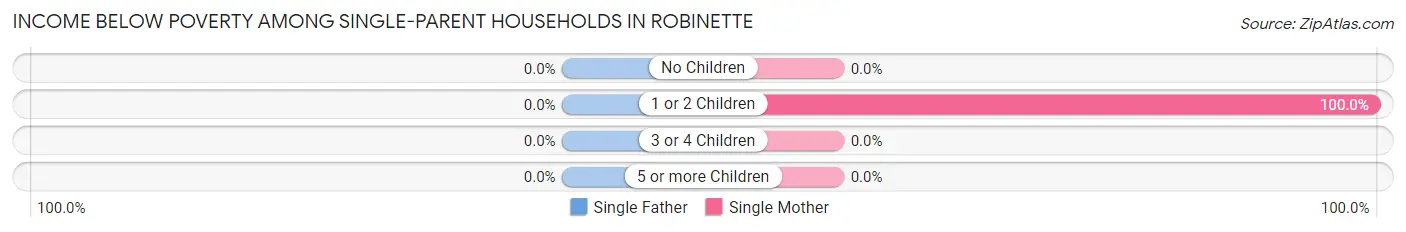
| Children | Single Father | Single Mother |
| No Children | 0 (0.0%) | 0 (0.0%) |
| 1 or 2 Children | 0 (0.0%) | 15 (100.0%) |
| 3 or 4 Children | 0 (0.0%) | 0 (0.0%) |
| 5 or more Children | 0 (0.0%) | 0 (0.0%) |
| Total | 0 (0.0%) | 15 (39.5%) |
Income Below Poverty Among Married-Couple vs Single-Parent Households in Robinette
The poverty data for Robinette shows that 12 of the married-couple family households (9.8%) and 15 of the single-parent households (35.7%) are living below the poverty level. Within the married-couple family households, those with no children have the highest poverty rate, with 12 households (13.3%) falling below the poverty line. Among the single-parent households, those with 1 or 2 children have the highest poverty rate, with 15 household (78.9%) living below poverty.
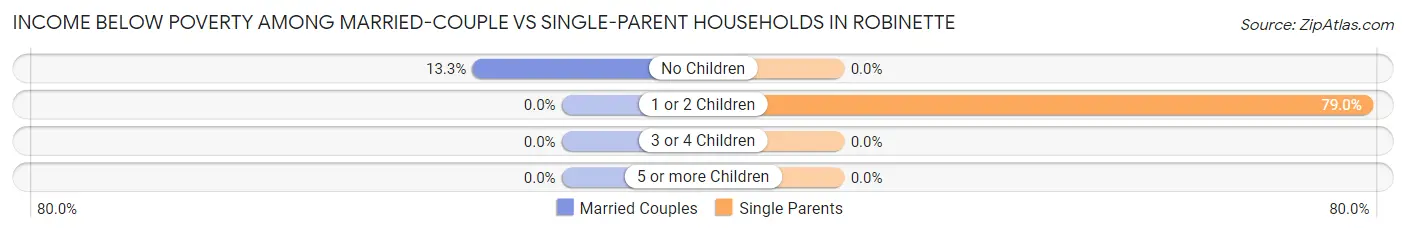
| Children | Married-Couple Families | Single-Parent Households |
| No Children | 12 (13.3%) | 0 (0.0%) |
| 1 or 2 Children | 0 (0.0%) | 15 (78.9%) |
| 3 or 4 Children | 0 (0.0%) | 0 (0.0%) |
| 5 or more Children | 0 (0.0%) | 0 (0.0%) |
| Total | 12 (9.8%) | 15 (35.7%) |
Race in Robinette
The most populous races in Robinette are White / Caucasian (471 | 100.0%), and Hispanic or Latino (2 | 0.4%).
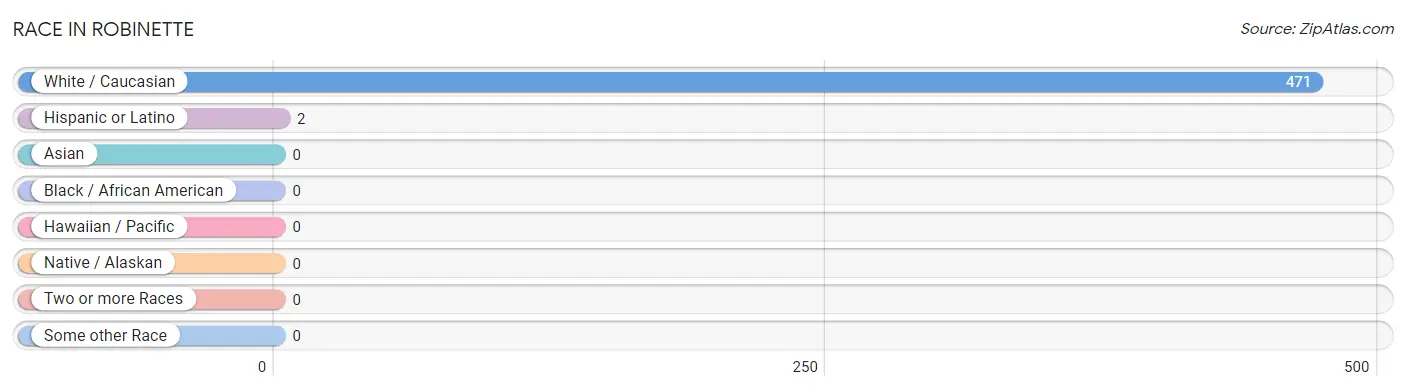
| Race | # Population | % Population |
| Asian | 0 | 0.0% |
| Black / African American | 0 | 0.0% |
| Hawaiian / Pacific | 0 | 0.0% |
| Hispanic or Latino | 2 | 0.4% |
| Native / Alaskan | 0 | 0.0% |
| White / Caucasian | 471 | 100.0% |
| Two or more Races | 0 | 0.0% |
| Some other Race | 0 | 0.0% |
| Total | 471 | 100.0% |
Ancestry in Robinette
The most populous ancestries reported in Robinette are American (64 | 13.6%), English (51 | 10.8%), Irish (36 | 7.6%), Hungarian (15 | 3.2%), and Italian (13 | 2.8%), together accounting for 38.0% of all Robinette residents.
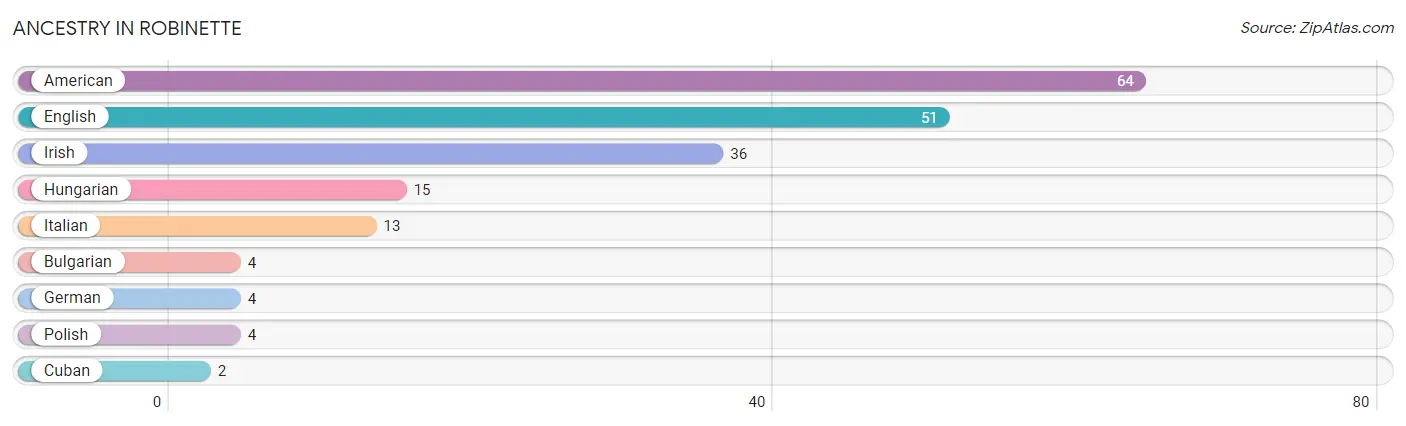
| Ancestry | # Population | % Population |
| American | 64 | 13.6% |
| Bulgarian | 4 | 0.9% |
| Cuban | 2 | 0.4% |
| English | 51 | 10.8% |
| German | 4 | 0.9% |
| Hungarian | 15 | 3.2% |
| Irish | 36 | 7.6% |
| Italian | 13 | 2.8% |
| Polish | 4 | 0.9% | View All 9 Rows |
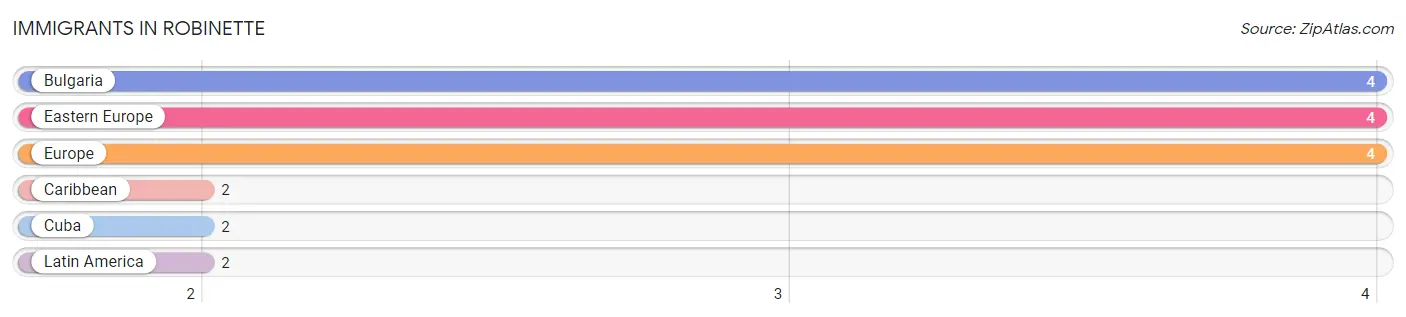
Immigrants in Robinette
The most numerous immigrant groups reported in Robinette came from Bulgaria (4 | 0.9%), Eastern Europe (4 | 0.9%), Europe (4 | 0.9%), Caribbean (2 | 0.4%), and Cuba (2 | 0.4%), together accounting for 3.4% of all Robinette residents.
| Immigration Origin | # Population | % Population |
| Bulgaria | 4 | 0.9% |
| Caribbean | 2 | 0.4% |
| Cuba | 2 | 0.4% |
| Eastern Europe | 4 | 0.9% |
| Europe | 4 | 0.9% |
| Latin America | 2 | 0.4% | View All 6 Rows |
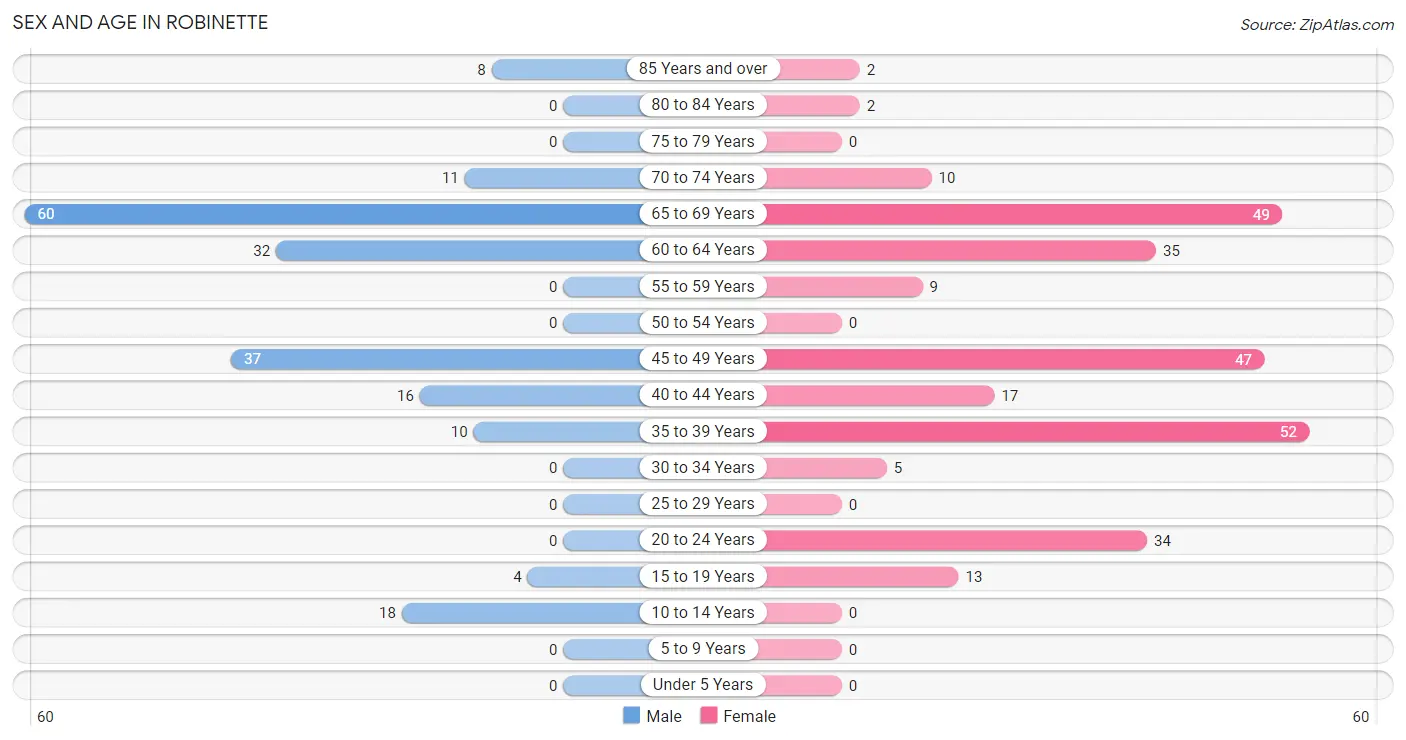
Sex and Age in Robinette
Sex and Age in Robinette
The most populous age groups in Robinette are 65 to 69 Years (60 | 30.6%) for men and 35 to 39 Years (52 | 18.9%) for women.
| Age Bracket | Male | Female |
| Under 5 Years | 0 (0.0%) | 0 (0.0%) |
| 5 to 9 Years | 0 (0.0%) | 0 (0.0%) |
| 10 to 14 Years | 18 (9.2%) | 0 (0.0%) |
| 15 to 19 Years | 4 (2.0%) | 13 (4.7%) |
| 20 to 24 Years | 0 (0.0%) | 34 (12.4%) |
| 25 to 29 Years | 0 (0.0%) | 0 (0.0%) |
| 30 to 34 Years | 0 (0.0%) | 5 (1.8%) |
| 35 to 39 Years | 10 (5.1%) | 52 (18.9%) |
| 40 to 44 Years | 16 (8.2%) | 17 (6.2%) |
| 45 to 49 Years | 37 (18.9%) | 47 (17.1%) |
| 50 to 54 Years | 0 (0.0%) | 0 (0.0%) |
| 55 to 59 Years | 0 (0.0%) | 9 (3.3%) |
| 60 to 64 Years | 32 (16.3%) | 35 (12.7%) |
| 65 to 69 Years | 60 (30.6%) | 49 (17.8%) |
| 70 to 74 Years | 11 (5.6%) | 10 (3.6%) |
| 75 to 79 Years | 0 (0.0%) | 0 (0.0%) |
| 80 to 84 Years | 0 (0.0%) | 2 (0.7%) |
| 85 Years and over | 8 (4.1%) | 2 (0.7%) |
| Total | 196 (100.0%) | 275 (100.0%) |
Families and Households in Robinette
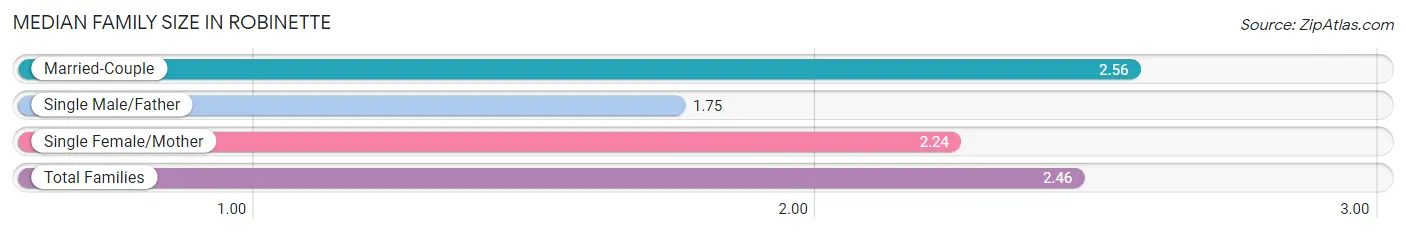
Median Family Size in Robinette
The median family size in Robinette is 2.46 persons per family, with married-couple families (122 | 74.4%) accounting for the largest median family size of 2.56 persons per family. On the other hand, single male/father families (4 | 2.4%) represent the smallest median family size with 1.75 persons per family.
| Family Type | # Families | Family Size |
| Married-Couple | 122 (74.4%) | 2.56 |
| Single Male/Father | 4 (2.4%) | 1.75 |
| Single Female/Mother | 38 (23.2%) | 2.24 |
| Total Families | 164 (100.0%) | 2.46 |
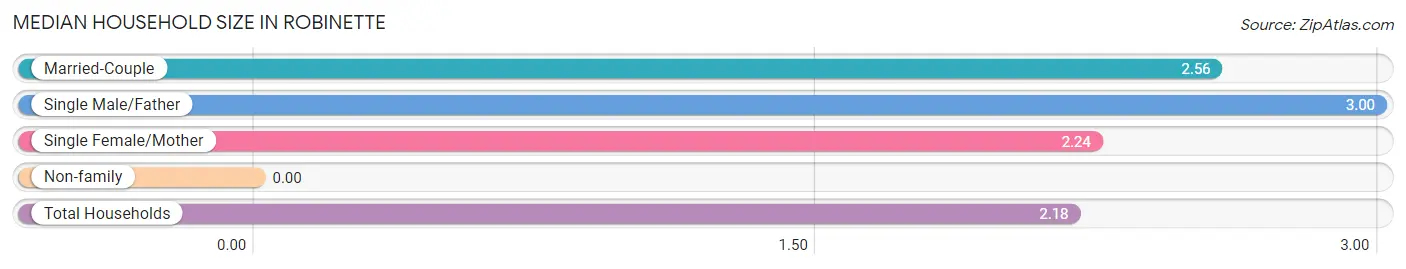
Median Household Size in Robinette
| Household Type | # Households | Household Size |
| Married-Couple | 122 (58.7%) | 2.56 |
| Single Male/Father | 4 (1.9%) | 3.00 |
| Single Female/Mother | 38 (18.3%) | 2.24 |
| Non-family | 44 (21.1%) | - |
| Total Households | 208 (100.0%) | 2.18 |
Household Size by Marriage Status in Robinette
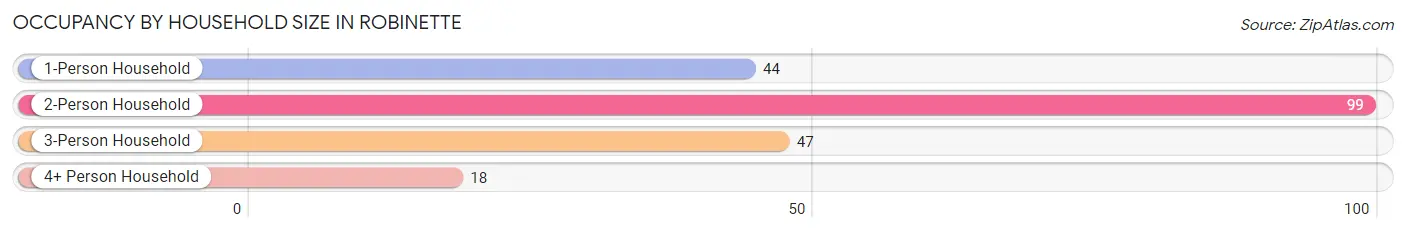
Out of a total of 208 households in Robinette, 164 (78.8%) are family households, while 44 (21.1%) are nonfamily households. The most numerous type of family households are 2-person households, comprising 99, and the most common type of nonfamily households are 1-person households, comprising 44.
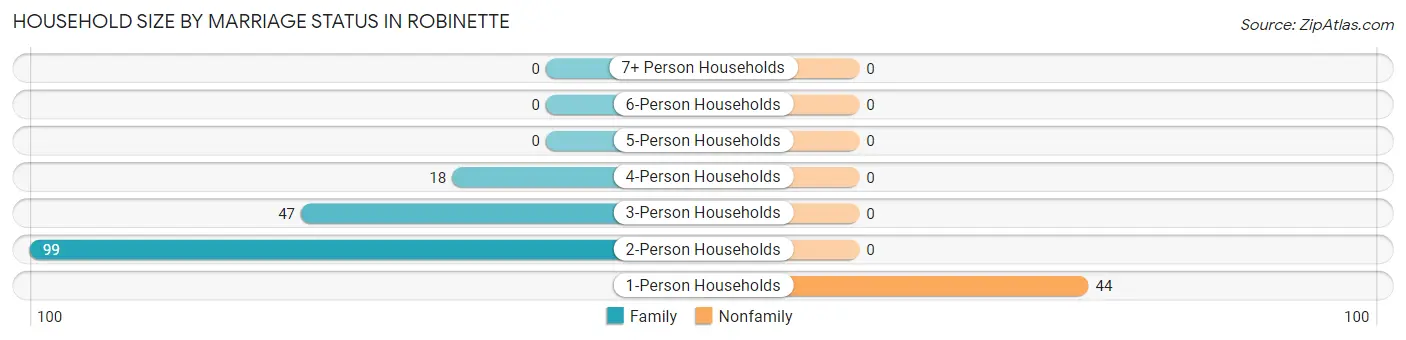
| Household Size | Family Households | Nonfamily Households |
| 1-Person Households | - | 44 (21.1%) |
| 2-Person Households | 99 (47.6%) | 0 (0.0%) |
| 3-Person Households | 47 (22.6%) | 0 (0.0%) |
| 4-Person Households | 18 (8.6%) | 0 (0.0%) |
| 5-Person Households | 0 (0.0%) | 0 (0.0%) |
| 6-Person Households | 0 (0.0%) | 0 (0.0%) |
| 7+ Person Households | 0 (0.0%) | 0 (0.0%) |
| Total | 164 (78.8%) | 44 (21.1%) |
Female Fertility in Robinette
Fertility by Age in Robinette
| Age Bracket | Women with Births | Births / 1,000 Women |
| 15 to 19 years | 0 (0.0%) | 0.0 |
| 20 to 34 years | 0 (0.0%) | 0.0 |
| 35 to 50 years | 0 (0.0%) | 0.0 |
| Total | 0 (0.0%) | 0.0 |
Fertility by Age by Marriage Status in Robinette
| Age Bracket | Married | Unmarried |
| 15 to 19 years | 0 (0.0%) | 0 (0.0%) |
| 20 to 34 years | 0 (0.0%) | 0 (0.0%) |
| 35 to 50 years | 0 (0.0%) | 0 (0.0%) |
| Total | 0 (0.0%) | 0 (0.0%) |
Fertility by Education in Robinette
| Educational Attainment | Women with Births | Births / 1,000 Women |
| Less than High School | 0 (0.0%) | 0.0 |
| High School Diploma | 0 (0.0%) | 0.0 |
| College or Associate's Degree | 0 (0.0%) | 0.0 |
| Bachelor's Degree | 0 (0.0%) | 0.0 |
| Graduate Degree | 0 (0.0%) | 0.0 |
| Total | 0 (0.0%) | 0.0 |
Fertility by Education by Marriage Status in Robinette
| Educational Attainment | Married | Unmarried |
| Less than High School | 0 (0.0%) | 0 (0.0%) |
| High School Diploma | 0 (0.0%) | 0 (0.0%) |
| College or Associate's Degree | 0 (0.0%) | 0 (0.0%) |
| Bachelor's Degree | 0 (0.0%) | 0 (0.0%) |
| Graduate Degree | 0 (0.0%) | 0 (0.0%) |
| Total | 0 (0.0%) | 0 (0.0%) |
Employment Characteristics in Robinette
Employment by Class of Employer in Robinette
Among the 91 employed individuals in Robinette, private company employees (82 | 90.1%), and local government employees (9 | 9.9%) make up the most common classes of employment.
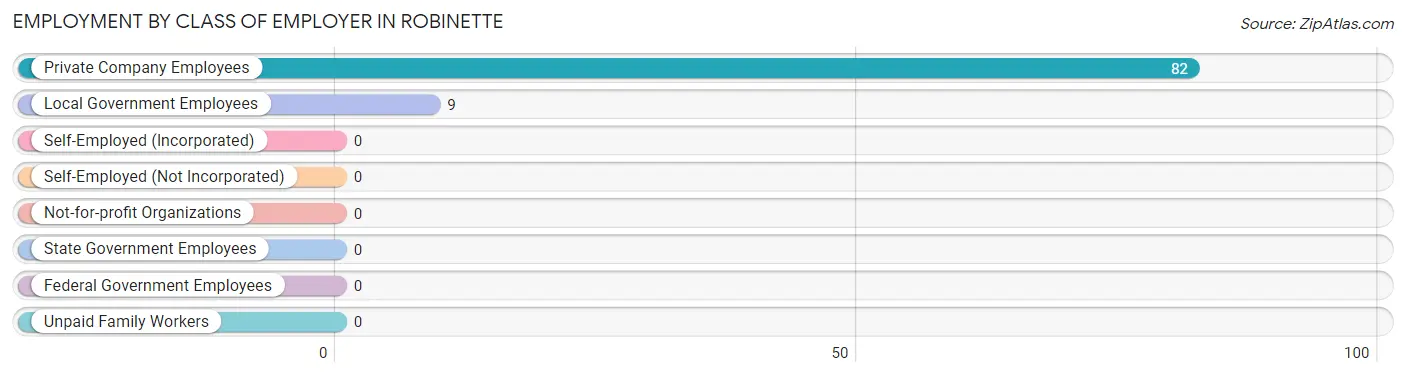
| Employer Class | # Employees | % Employees |
| Private Company Employees | 82 | 90.1% |
| Self-Employed (Incorporated) | 0 | 0.0% |
| Self-Employed (Not Incorporated) | 0 | 0.0% |
| Not-for-profit Organizations | 0 | 0.0% |
| Local Government Employees | 9 | 9.9% |
| State Government Employees | 0 | 0.0% |
| Federal Government Employees | 0 | 0.0% |
| Unpaid Family Workers | 0 | 0.0% |
| Total | 91 | 100.0% |
Employment Status by Age in Robinette
According to the labor force statistics for Robinette, out of the total population over 16 years of age (453), 22.3% or 101 individuals are in the labor force, with 9.9% or 10 of them unemployed. The age group with the highest labor force participation rate is 30 to 34 years, with 100.0% or 5 individuals in the labor force. Within the labor force, the 45 to 54 years age range has the highest percentage of unemployed individuals, with 14.5% or 10 of them being unemployed.
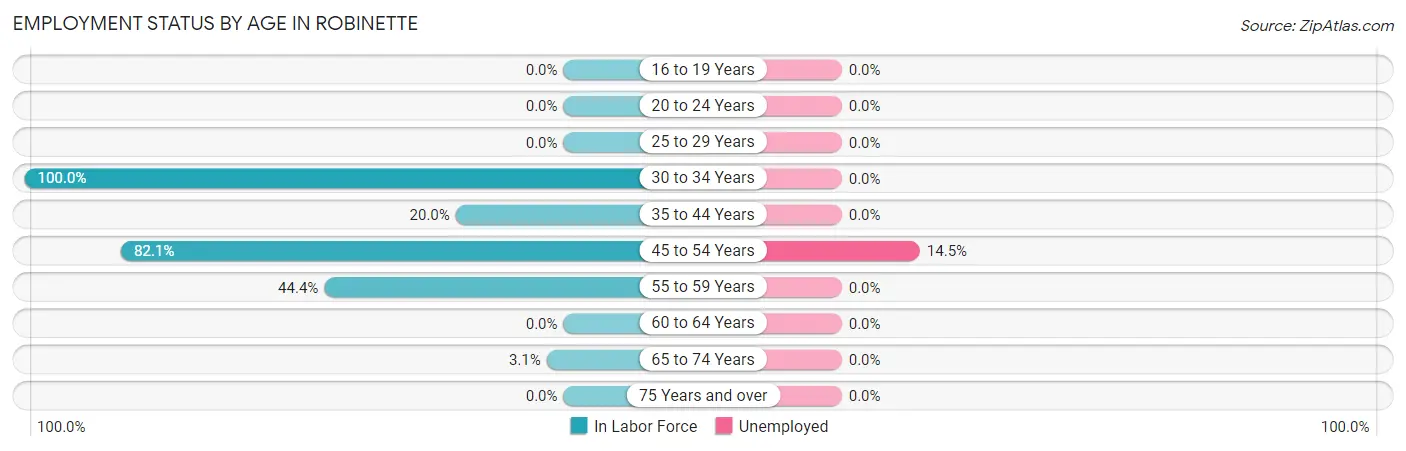
| Age Bracket | In Labor Force | Unemployed |
| 16 to 19 Years | 0 (0.0%) | 0 (0.0%) |
| 20 to 24 Years | 0 (0.0%) | 0 (0.0%) |
| 25 to 29 Years | 0 (0.0%) | 0 (0.0%) |
| 30 to 34 Years | 5 (100.0%) | 0 (0.0%) |
| 35 to 44 Years | 19 (20.0%) | 0 (0.0%) |
| 45 to 54 Years | 69 (82.1%) | 10 (14.5%) |
| 55 to 59 Years | 4 (44.4%) | 0 (0.0%) |
| 60 to 64 Years | 0 (0.0%) | 0 (0.0%) |
| 65 to 74 Years | 4 (3.1%) | 0 (0.0%) |
| 75 Years and over | 0 (0.0%) | 0 (0.0%) |
| Total | 101 (22.3%) | 10 (9.9%) |
Employment Status by Educational Attainment in Robinette
According to labor force statistics for Robinette, 37.3% of individuals (97) out of the total population between 25 and 64 years of age (260) are in the labor force, with 10.3% or 10 of them being unemployed. The group with the highest labor force participation rate are those with the educational attainment of high school diploma, with 46.8% or 87 individuals in the labor force. Within the labor force, individuals with less than high school education have the highest percentage of unemployment, with 100.0% or 10 of them being unemployed.
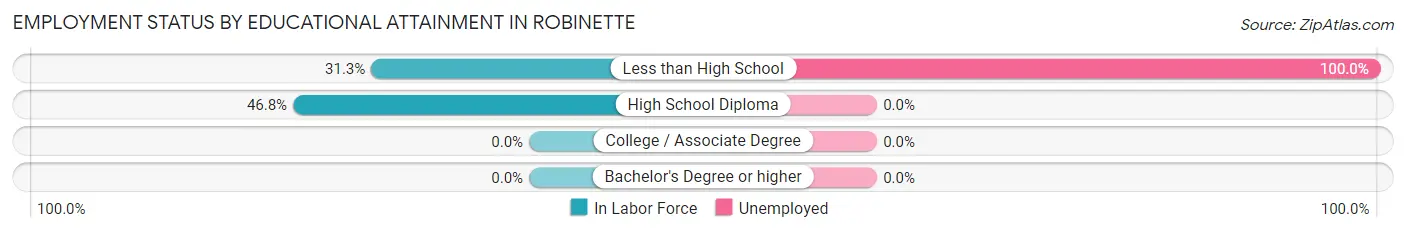
| Educational Attainment | In Labor Force | Unemployed |
| Less than High School | 10 (31.3%) | 32 (100.0%) |
| High School Diploma | 87 (46.8%) | 0 (0.0%) |
| College / Associate Degree | 0 (0.0%) | 0 (0.0%) |
| Bachelor's Degree or higher | 0 (0.0%) | 0 (0.0%) |
| Total | 97 (37.3%) | 27 (10.3%) |
Employment Occupations by Sex in Robinette
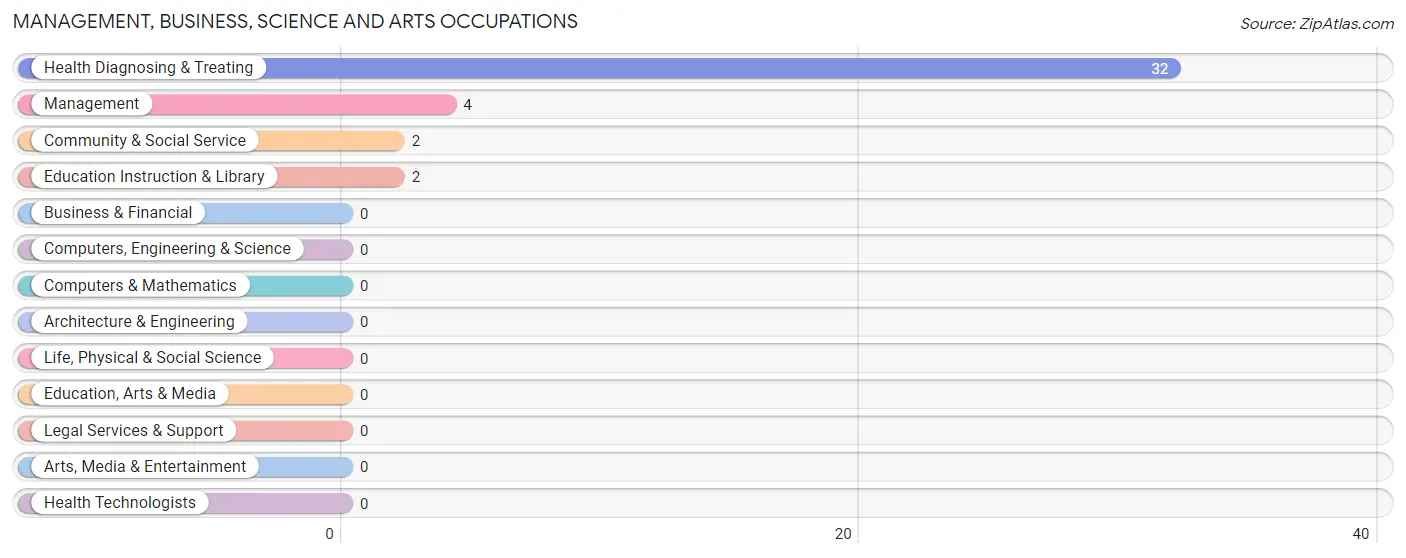
Management, Business, Science and Arts Occupations
The most common Management, Business, Science and Arts occupations in Robinette are Health Diagnosing & Treating (32 | 35.2%), Management (4 | 4.4%), Community & Social Service (2 | 2.2%), and Education Instruction & Library (2 | 2.2%).
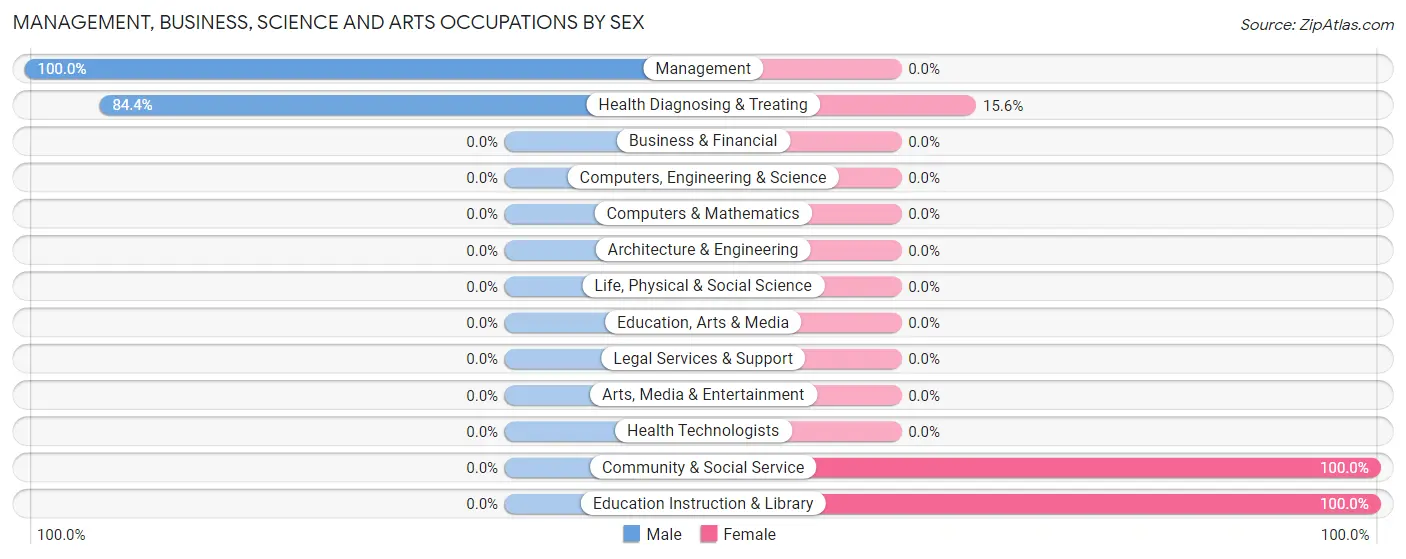
Management, Business, Science and Arts Occupations by Sex
Within the Management, Business, Science and Arts occupations in Robinette, the most male-oriented occupations are Management (100.0%), and Health Diagnosing & Treating (84.4%), while the most female-oriented occupations are Community & Social Service (100.0%), Education Instruction & Library (100.0%), and Health Diagnosing & Treating (15.6%).
| Occupation | Male | Female |
| Management | 4 (100.0%) | 0 (0.0%) |
| Business & Financial | 0 (0.0%) | 0 (0.0%) |
| Computers, Engineering & Science | 0 (0.0%) | 0 (0.0%) |
| Computers & Mathematics | 0 (0.0%) | 0 (0.0%) |
| Architecture & Engineering | 0 (0.0%) | 0 (0.0%) |
| Life, Physical & Social Science | 0 (0.0%) | 0 (0.0%) |
| Community & Social Service | 0 (0.0%) | 2 (100.0%) |
| Education, Arts & Media | 0 (0.0%) | 0 (0.0%) |
| Legal Services & Support | 0 (0.0%) | 0 (0.0%) |
| Education Instruction & Library | 0 (0.0%) | 2 (100.0%) |
| Arts, Media & Entertainment | 0 (0.0%) | 0 (0.0%) |
| Health Diagnosing & Treating | 27 (84.4%) | 5 (15.6%) |
| Health Technologists | 0 (0.0%) | 0 (0.0%) |
| Total (Category) | 31 (81.6%) | 7 (18.4%) |
| Total (Overall) | 43 (47.2%) | 48 (52.7%) |
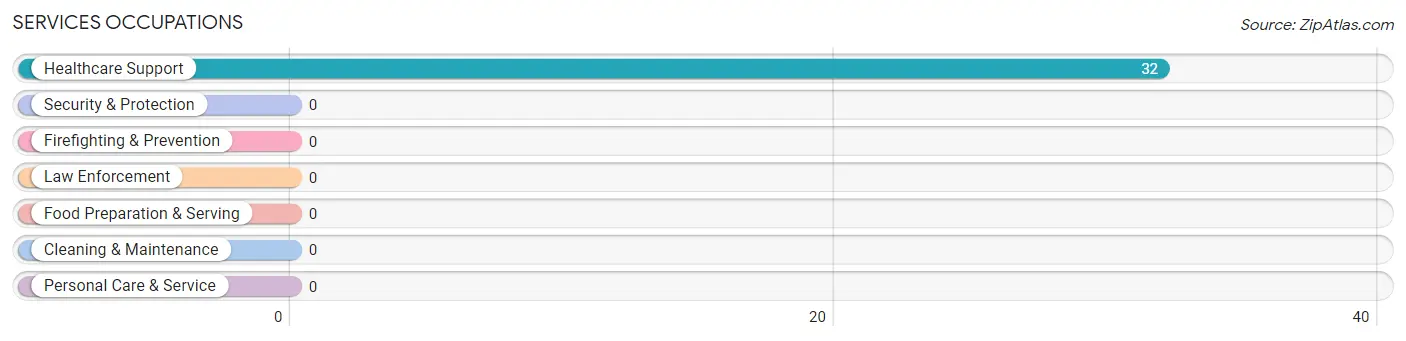
Services Occupations
The most common Services occupations in Robinette are , and Healthcare Support (32 | 35.2%).
Services Occupations by Sex
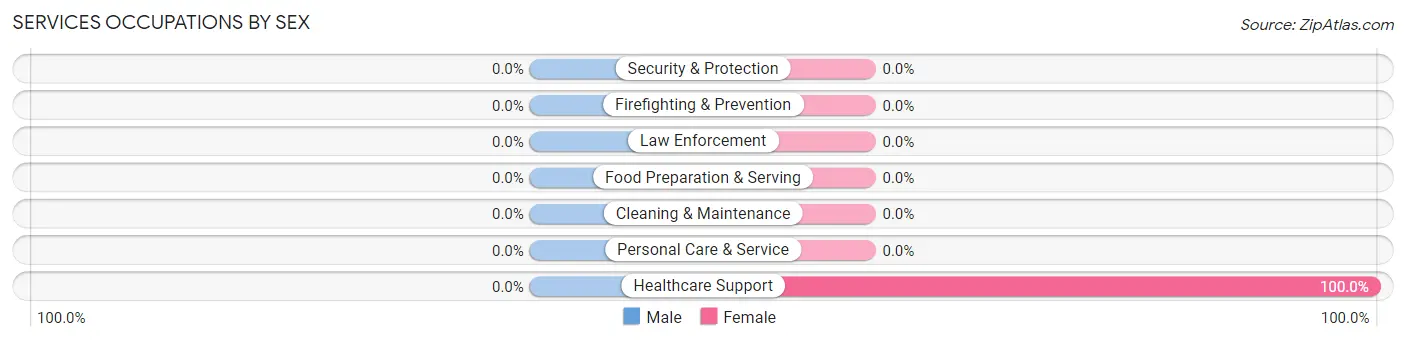
| Occupation | Male | Female |
| Healthcare Support | 0 (0.0%) | 32 (100.0%) |
| Security & Protection | 0 (0.0%) | 0 (0.0%) |
| Firefighting & Prevention | 0 (0.0%) | 0 (0.0%) |
| Law Enforcement | 0 (0.0%) | 0 (0.0%) |
| Food Preparation & Serving | 0 (0.0%) | 0 (0.0%) |
| Cleaning & Maintenance | 0 (0.0%) | 0 (0.0%) |
| Personal Care & Service | 0 (0.0%) | 0 (0.0%) |
| Total (Category) | 0 (0.0%) | 32 (100.0%) |
| Total (Overall) | 43 (47.2%) | 48 (52.7%) |
Sales and Office Occupations
The most common Sales and Office occupations in Robinette are Office & Administration (6 | 6.6%), and Sales & Related (5 | 5.5%).
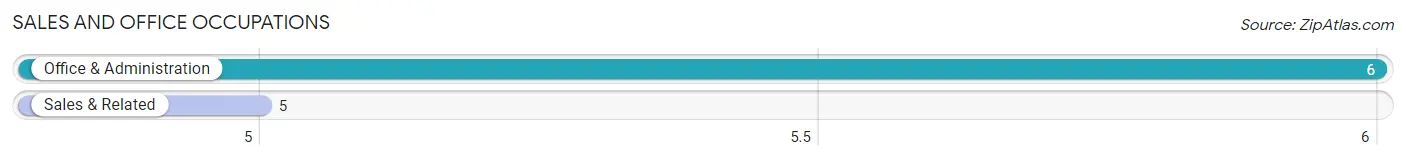
Sales and Office Occupations by Sex
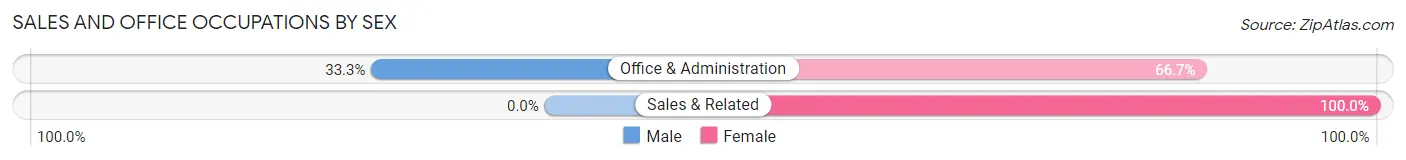
| Occupation | Male | Female |
| Sales & Related | 0 (0.0%) | 5 (100.0%) |
| Office & Administration | 2 (33.3%) | 4 (66.7%) |
| Total (Category) | 2 (18.2%) | 9 (81.8%) |
| Total (Overall) | 43 (47.2%) | 48 (52.7%) |
Natural Resources, Construction and Maintenance Occupations
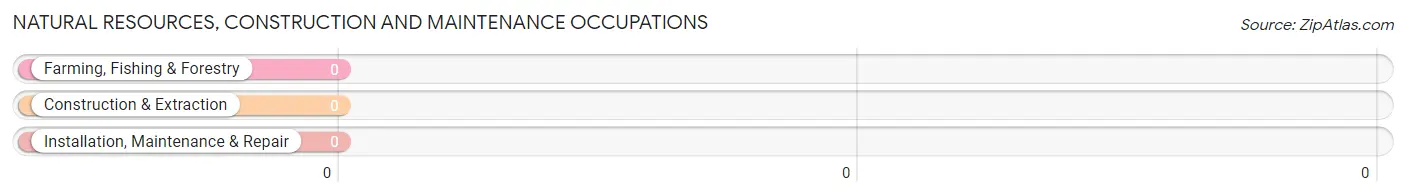
Natural Resources, Construction and Maintenance Occupations by Sex
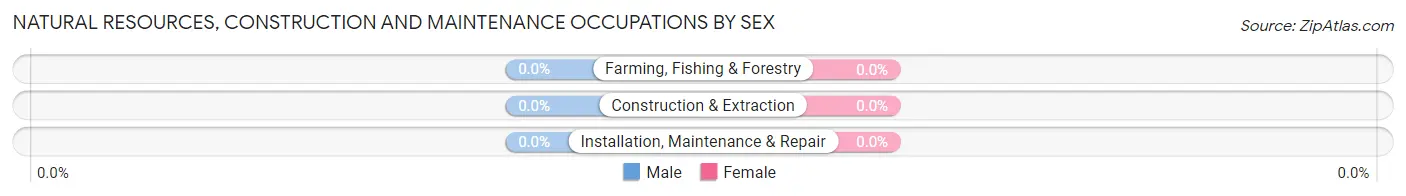
| Occupation | Male | Female |
| Farming, Fishing & Forestry | 0 (0.0%) | 0 (0.0%) |
| Construction & Extraction | 0 (0.0%) | 0 (0.0%) |
| Installation, Maintenance & Repair | 0 (0.0%) | 0 (0.0%) |
| Total (Category) | 0 (0.0%) | 0 (0.0%) |
| Total (Overall) | 43 (47.2%) | 48 (52.7%) |
Production, Transportation and Moving Occupations
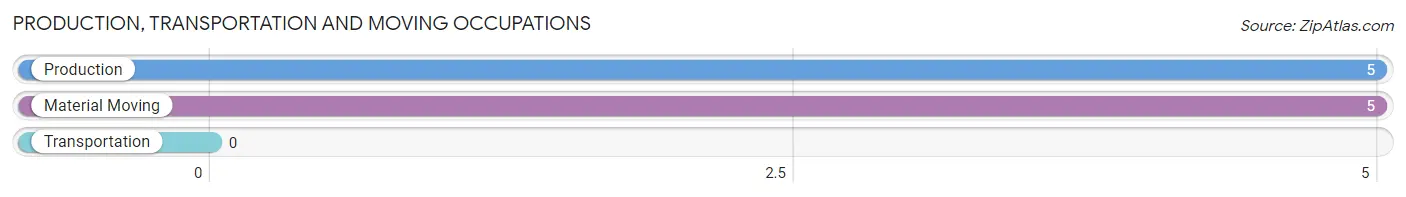
The most common Production, Transportation and Moving occupations in Robinette are Production (5 | 5.5%), and Material Moving (5 | 5.5%).
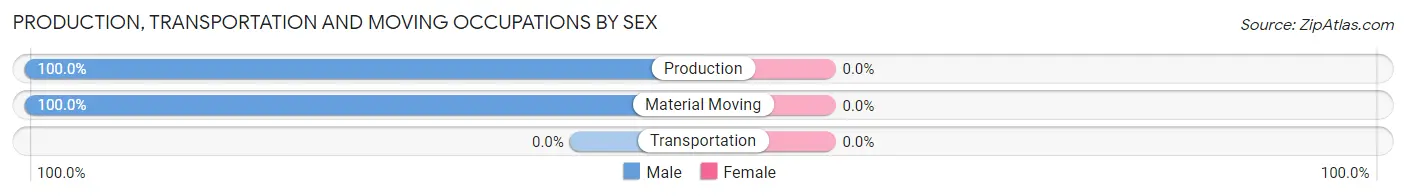
Production, Transportation and Moving Occupations by Sex
| Occupation | Male | Female |
| Production | 5 (100.0%) | 0 (0.0%) |
| Transportation | 0 (0.0%) | 0 (0.0%) |
| Material Moving | 5 (100.0%) | 0 (0.0%) |
| Total (Category) | 10 (100.0%) | 0 (0.0%) |
| Total (Overall) | 43 (47.2%) | 48 (52.7%) |
Employment Industries by Sex in Robinette
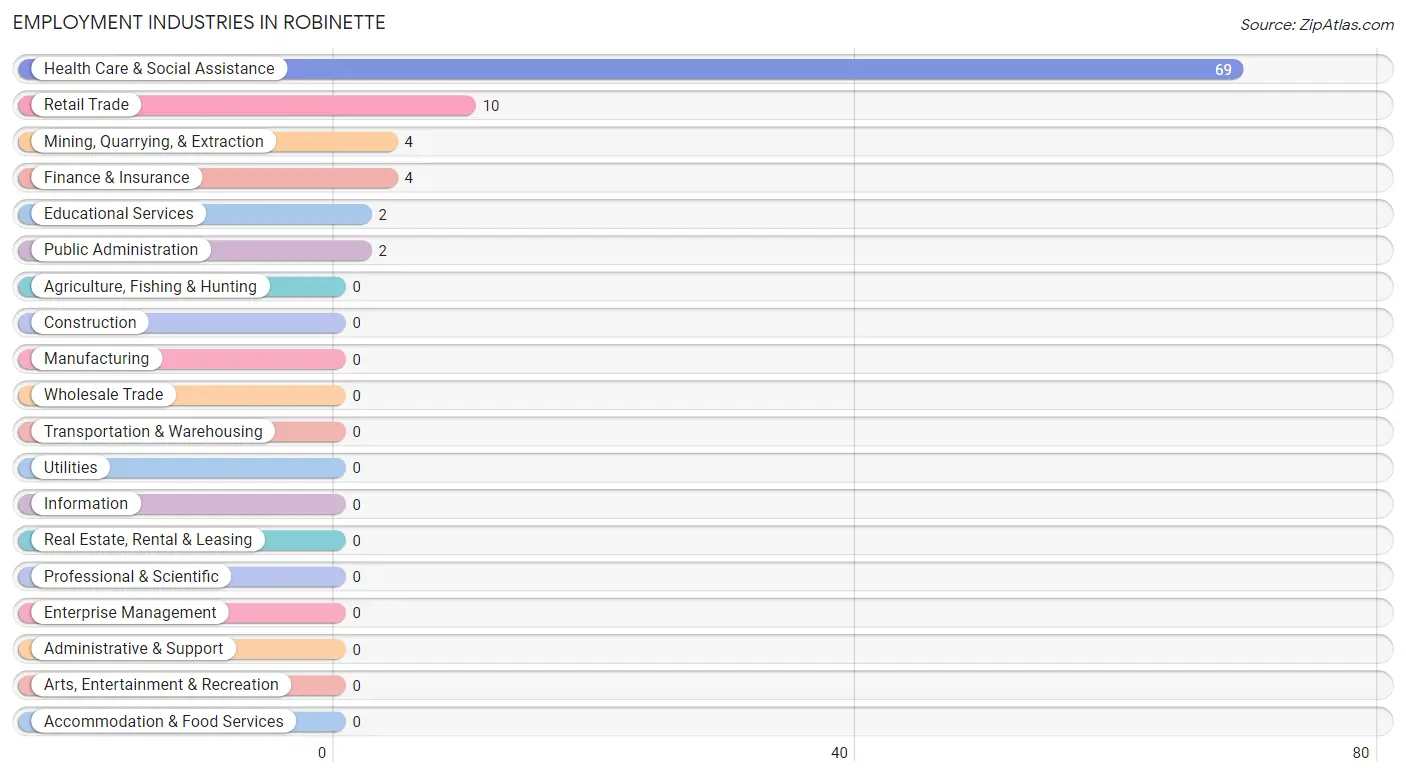
Employment Industries in Robinette
The major employment industries in Robinette include Health Care & Social Assistance (69 | 75.8%), Retail Trade (10 | 11.0%), Mining, Quarrying, & Extraction (4 | 4.4%), Finance & Insurance (4 | 4.4%), and Educational Services (2 | 2.2%).
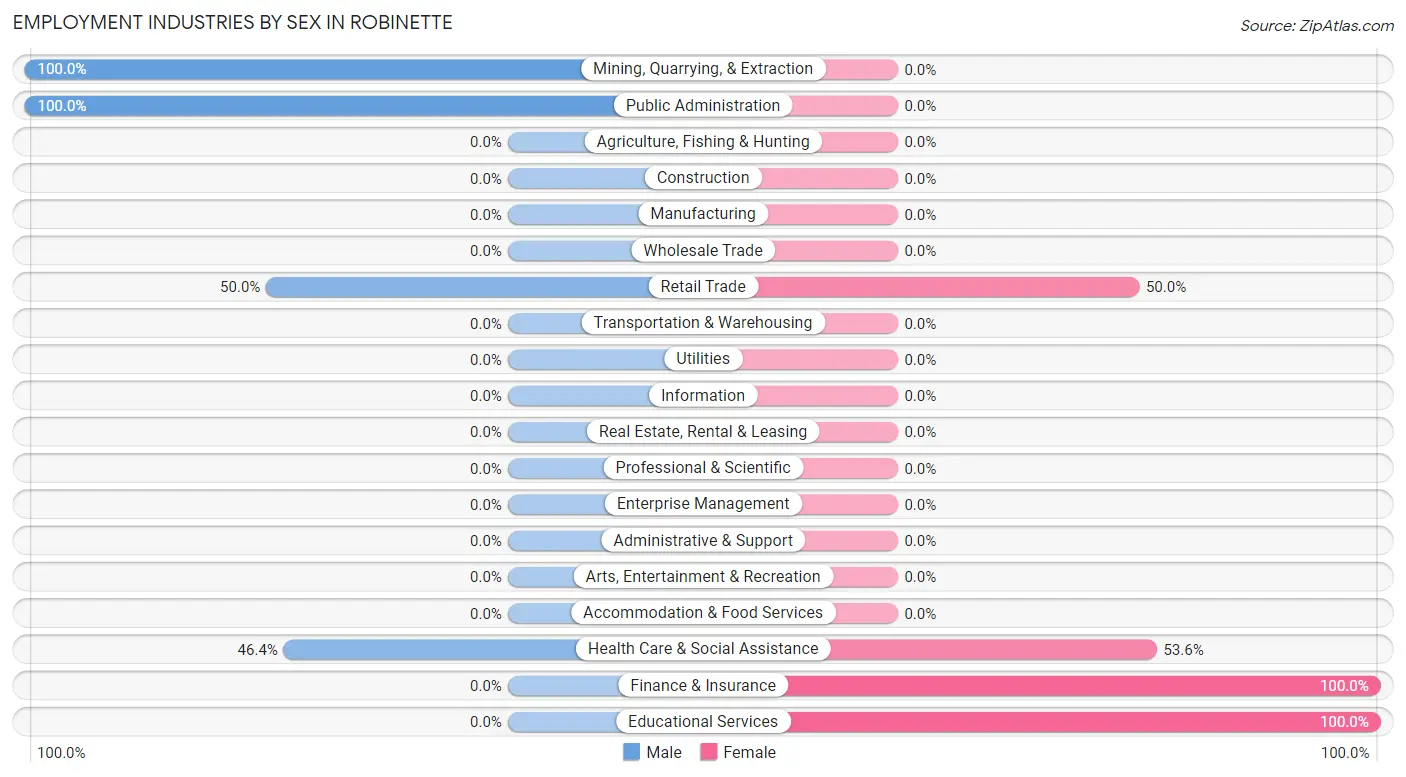
Employment Industries by Sex in Robinette
The Robinette industries that see more men than women are Mining, Quarrying, & Extraction (100.0%), Public Administration (100.0%), and Retail Trade (50.0%), whereas the industries that tend to have a higher number of women are Finance & Insurance (100.0%), Educational Services (100.0%), and Health Care & Social Assistance (53.6%).
| Industry | Male | Female |
| Agriculture, Fishing & Hunting | 0 (0.0%) | 0 (0.0%) |
| Mining, Quarrying, & Extraction | 4 (100.0%) | 0 (0.0%) |
| Construction | 0 (0.0%) | 0 (0.0%) |
| Manufacturing | 0 (0.0%) | 0 (0.0%) |
| Wholesale Trade | 0 (0.0%) | 0 (0.0%) |
| Retail Trade | 5 (50.0%) | 5 (50.0%) |
| Transportation & Warehousing | 0 (0.0%) | 0 (0.0%) |
| Utilities | 0 (0.0%) | 0 (0.0%) |
| Information | 0 (0.0%) | 0 (0.0%) |
| Finance & Insurance | 0 (0.0%) | 4 (100.0%) |
| Real Estate, Rental & Leasing | 0 (0.0%) | 0 (0.0%) |
| Professional & Scientific | 0 (0.0%) | 0 (0.0%) |
| Enterprise Management | 0 (0.0%) | 0 (0.0%) |
| Administrative & Support | 0 (0.0%) | 0 (0.0%) |
| Educational Services | 0 (0.0%) | 2 (100.0%) |
| Health Care & Social Assistance | 32 (46.4%) | 37 (53.6%) |
| Arts, Entertainment & Recreation | 0 (0.0%) | 0 (0.0%) |
| Accommodation & Food Services | 0 (0.0%) | 0 (0.0%) |
| Public Administration | 2 (100.0%) | 0 (0.0%) |
| Total | 43 (47.2%) | 48 (52.7%) |
Education in Robinette
School Enrollment in Robinette
The most common levels of schooling among the 31 students in Robinette are middle school (18 | 58.1%), and high school (13 | 41.9%).
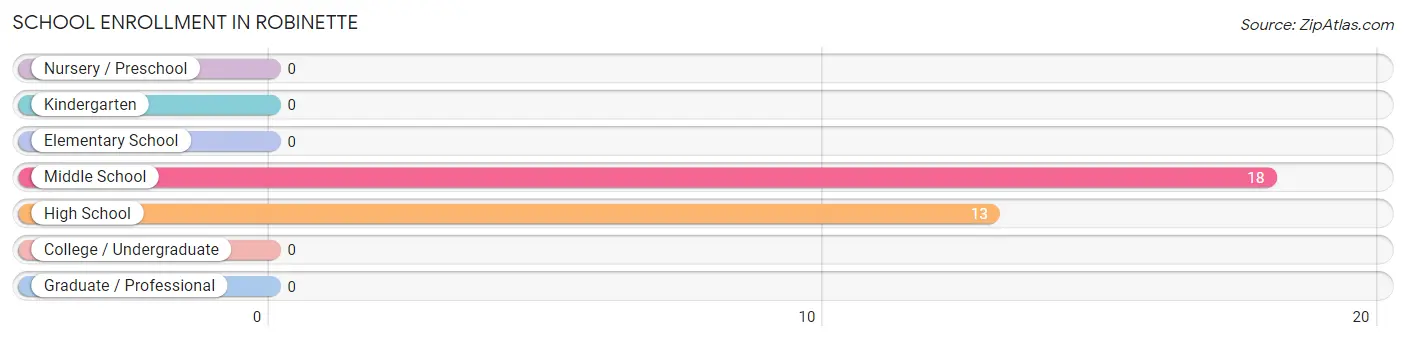
| School Level | # Students | % Students |
| Nursery / Preschool | 0 | 0.0% |
| Kindergarten | 0 | 0.0% |
| Elementary School | 0 | 0.0% |
| Middle School | 18 | 58.1% |
| High School | 13 | 41.9% |
| College / Undergraduate | 0 | 0.0% |
| Graduate / Professional | 0 | 0.0% |
| Total | 31 | 100.0% |
School Enrollment by Age by Funding Source in Robinette
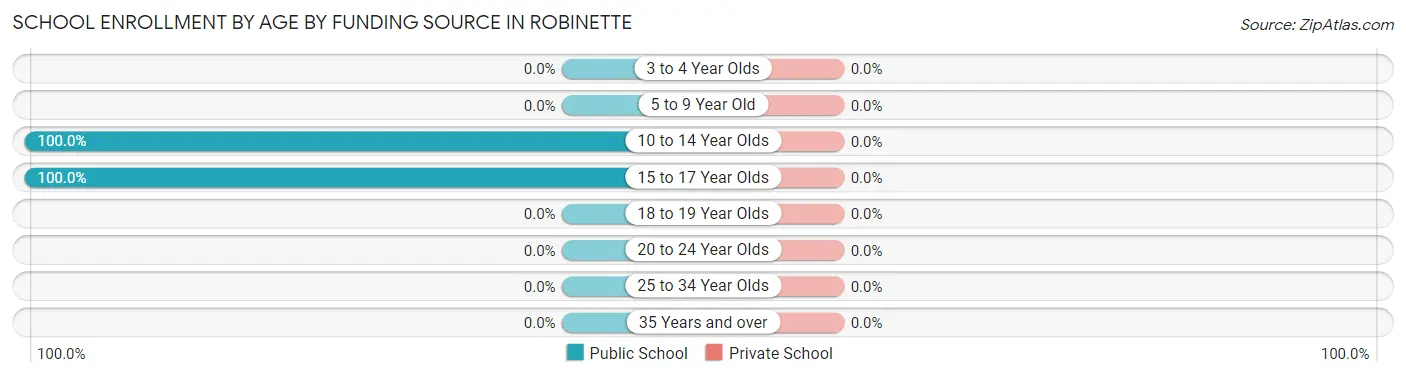
| Age Bracket | Public School | Private School |
| 3 to 4 Year Olds | 0 (0.0%) | 0 (0.0%) |
| 5 to 9 Year Old | 0 (0.0%) | 0 (0.0%) |
| 10 to 14 Year Olds | 18 (100.0%) | 0 (0.0%) |
| 15 to 17 Year Olds | 13 (100.0%) | 0 (0.0%) |
| 18 to 19 Year Olds | 0 (0.0%) | 0 (0.0%) |
| 20 to 24 Year Olds | 0 (0.0%) | 0 (0.0%) |
| 25 to 34 Year Olds | 0 (0.0%) | 0 (0.0%) |
| 35 Years and over | 0 (0.0%) | 0 (0.0%) |
| Total | 31 (100.0%) | 0 (0.0%) |
Educational Attainment by Field of Study in Robinette
, and education (7 | 100.0%) are the most common fields of study among 7 individuals in Robinette who have obtained a bachelor's degree or higher.
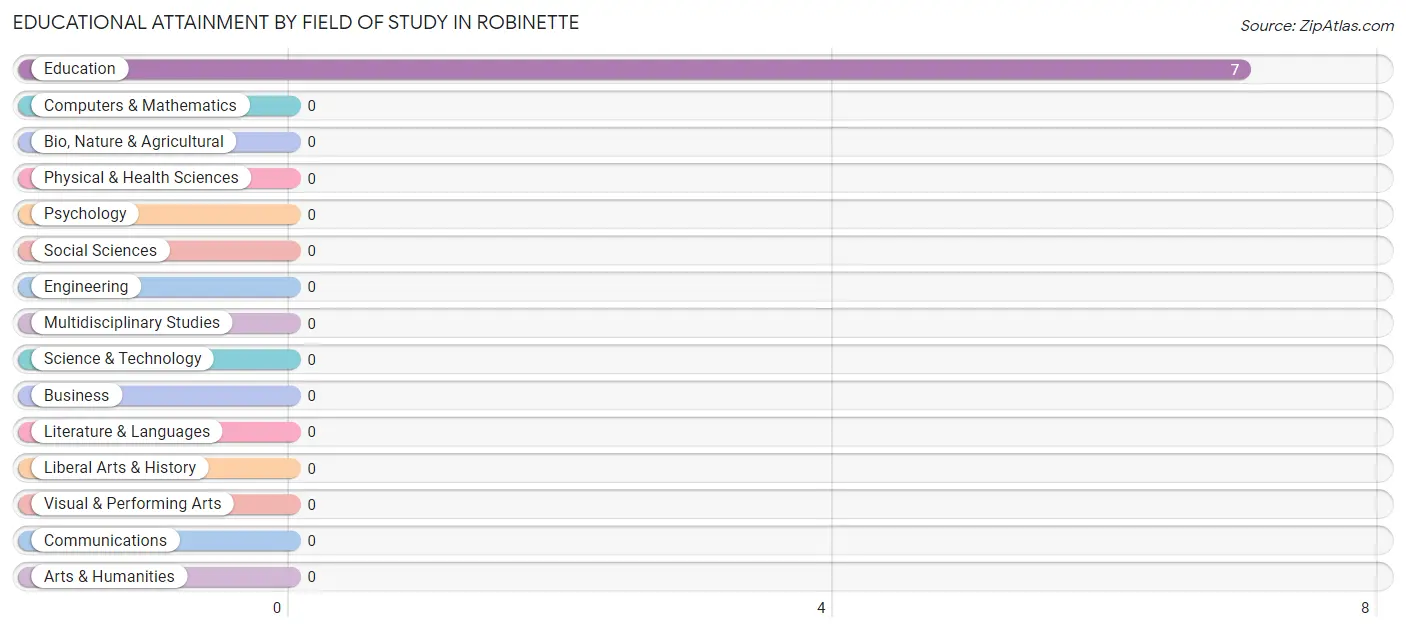
| Field of Study | # Graduates | % Graduates |
| Computers & Mathematics | 0 | 0.0% |
| Bio, Nature & Agricultural | 0 | 0.0% |
| Physical & Health Sciences | 0 | 0.0% |
| Psychology | 0 | 0.0% |
| Social Sciences | 0 | 0.0% |
| Engineering | 0 | 0.0% |
| Multidisciplinary Studies | 0 | 0.0% |
| Science & Technology | 0 | 0.0% |
| Business | 0 | 0.0% |
| Education | 7 | 100.0% |
| Literature & Languages | 0 | 0.0% |
| Liberal Arts & History | 0 | 0.0% |
| Visual & Performing Arts | 0 | 0.0% |
| Communications | 0 | 0.0% |
| Arts & Humanities | 0 | 0.0% |
| Total | 7 | 100.0% |
Transportation & Commute in Robinette
Vehicle Availability by Sex in Robinette
The most prevalent vehicle ownership categories in Robinette are males with 3 vehicles (33, accounting for 86.8%) and females with 3 vehicles (7, making up 68.8%).
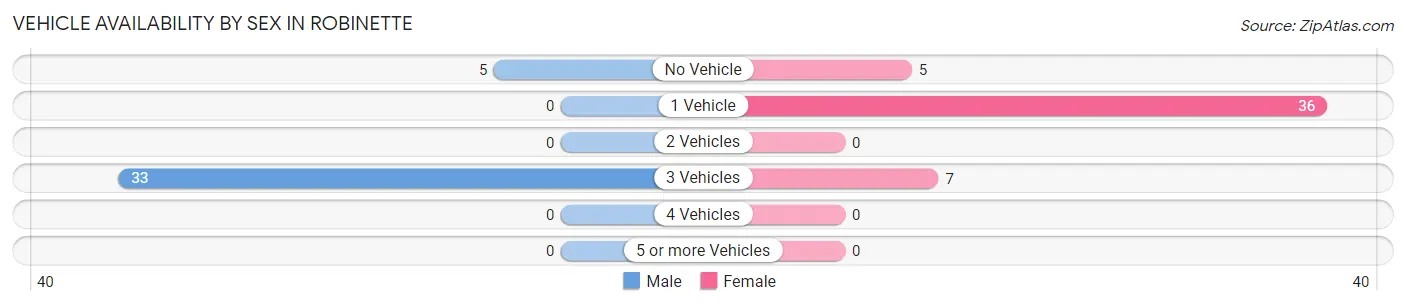
| Vehicles Available | Male | Female |
| No Vehicle | 5 (13.2%) | 5 (10.4%) |
| 1 Vehicle | 0 (0.0%) | 36 (75.0%) |
| 2 Vehicles | 0 (0.0%) | 0 (0.0%) |
| 3 Vehicles | 33 (86.8%) | 7 (14.6%) |
| 4 Vehicles | 0 (0.0%) | 0 (0.0%) |
| 5 or more Vehicles | 0 (0.0%) | 0 (0.0%) |
| Total | 38 (100.0%) | 48 (100.0%) |
Commute Time in Robinette
The most frequently occuring commute durations in Robinette are less than 5 minutes (37 commuters, 40.7%), 60 to 89 minutes (27 commuters, 29.7%), and 30 to 34 minutes (7 commuters, 7.7%).
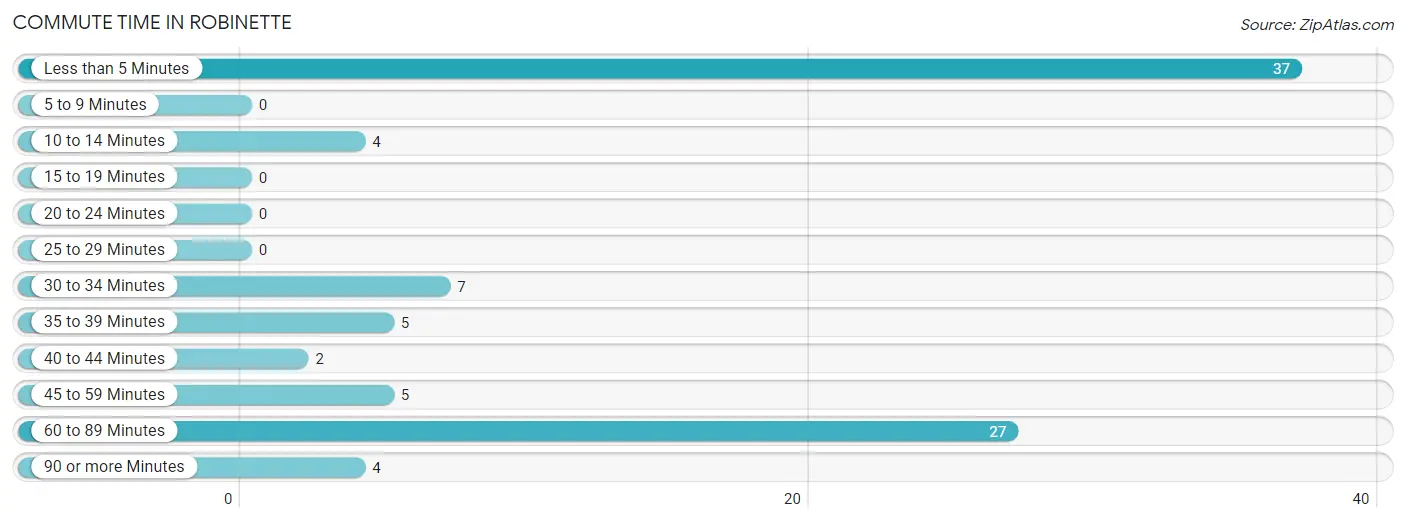
| Commute Time | # Commuters | % Commuters |
| Less than 5 Minutes | 37 | 40.7% |
| 5 to 9 Minutes | 0 | 0.0% |
| 10 to 14 Minutes | 4 | 4.4% |
| 15 to 19 Minutes | 0 | 0.0% |
| 20 to 24 Minutes | 0 | 0.0% |
| 25 to 29 Minutes | 0 | 0.0% |
| 30 to 34 Minutes | 7 | 7.7% |
| 35 to 39 Minutes | 5 | 5.5% |
| 40 to 44 Minutes | 2 | 2.2% |
| 45 to 59 Minutes | 5 | 5.5% |
| 60 to 89 Minutes | 27 | 29.7% |
| 90 or more Minutes | 4 | 4.4% |
Commute Time by Sex in Robinette
The most common commute times in Robinette are 60 to 89 minutes (27 commuters, 62.8%) for males and less than 5 minutes (37 commuters, 77.1%) for females.
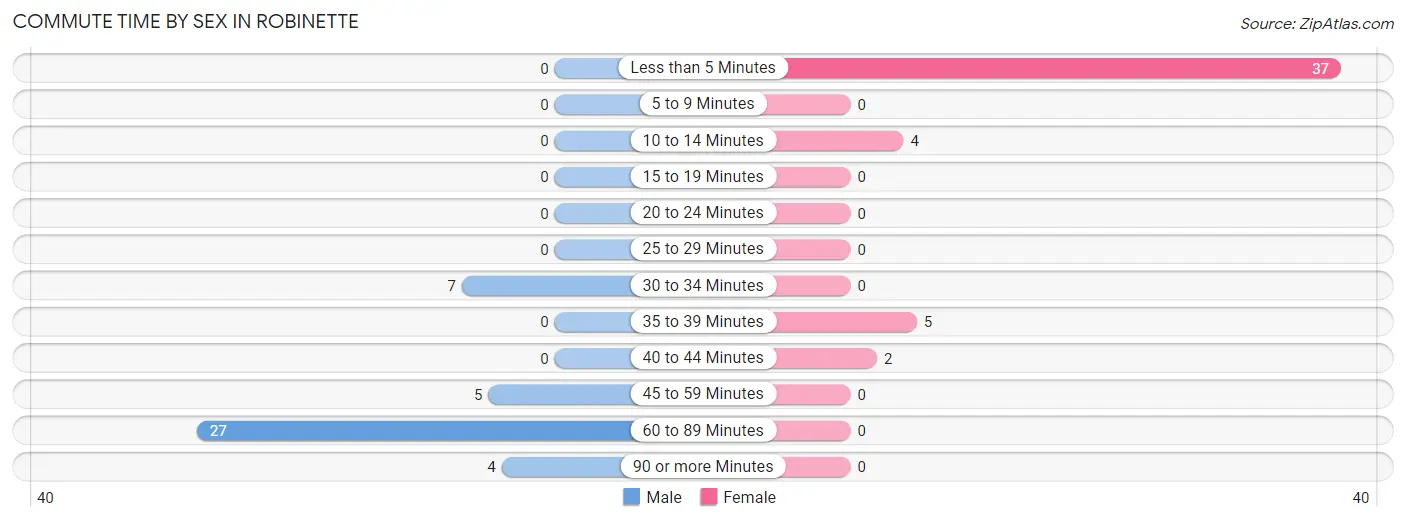
| Commute Time | Male | Female |
| Less than 5 Minutes | 0 (0.0%) | 37 (77.1%) |
| 5 to 9 Minutes | 0 (0.0%) | 0 (0.0%) |
| 10 to 14 Minutes | 0 (0.0%) | 4 (8.3%) |
| 15 to 19 Minutes | 0 (0.0%) | 0 (0.0%) |
| 20 to 24 Minutes | 0 (0.0%) | 0 (0.0%) |
| 25 to 29 Minutes | 0 (0.0%) | 0 (0.0%) |
| 30 to 34 Minutes | 7 (16.3%) | 0 (0.0%) |
| 35 to 39 Minutes | 0 (0.0%) | 5 (10.4%) |
| 40 to 44 Minutes | 0 (0.0%) | 2 (4.2%) |
| 45 to 59 Minutes | 5 (11.6%) | 0 (0.0%) |
| 60 to 89 Minutes | 27 (62.8%) | 0 (0.0%) |
| 90 or more Minutes | 4 (9.3%) | 0 (0.0%) |
Time of Departure to Work by Sex in Robinette
The most frequent times of departure to work in Robinette are 4:00 PM to 11:59 PM (27, 62.8%) for males and 4:00 PM to 11:59 PM (37, 77.1%) for females.
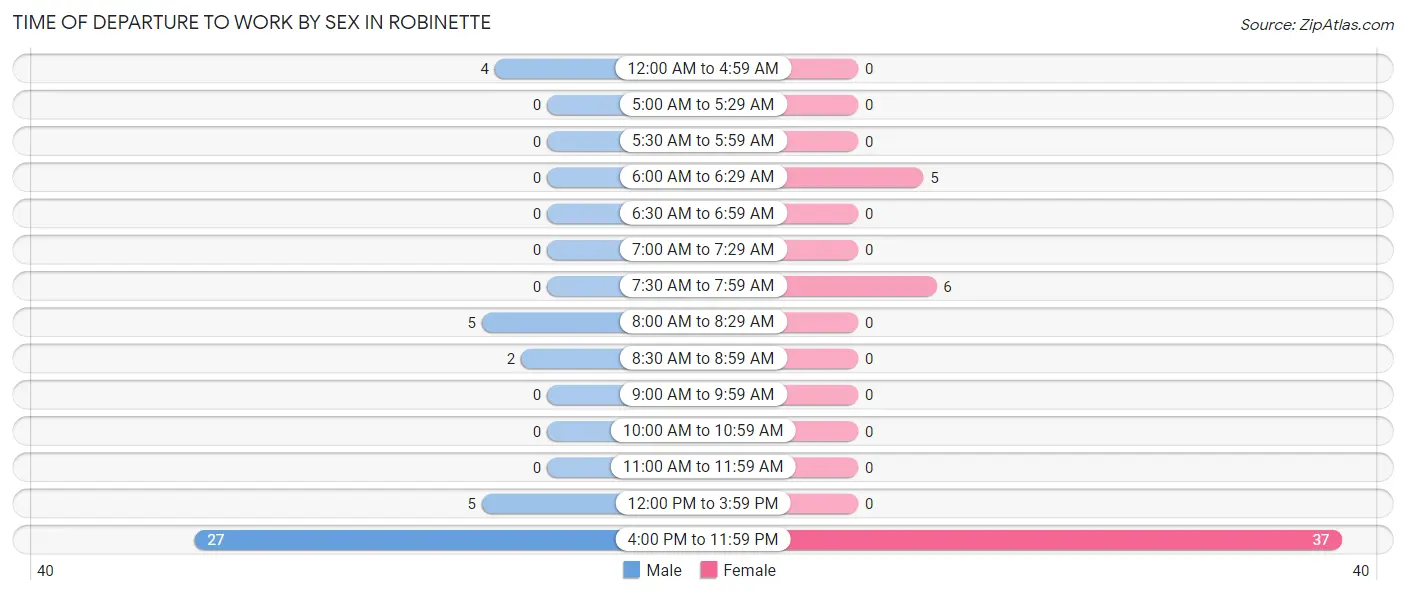
| Time of Departure | Male | Female |
| 12:00 AM to 4:59 AM | 4 (9.3%) | 0 (0.0%) |
| 5:00 AM to 5:29 AM | 0 (0.0%) | 0 (0.0%) |
| 5:30 AM to 5:59 AM | 0 (0.0%) | 0 (0.0%) |
| 6:00 AM to 6:29 AM | 0 (0.0%) | 5 (10.4%) |
| 6:30 AM to 6:59 AM | 0 (0.0%) | 0 (0.0%) |
| 7:00 AM to 7:29 AM | 0 (0.0%) | 0 (0.0%) |
| 7:30 AM to 7:59 AM | 0 (0.0%) | 6 (12.5%) |
| 8:00 AM to 8:29 AM | 5 (11.6%) | 0 (0.0%) |
| 8:30 AM to 8:59 AM | 2 (4.6%) | 0 (0.0%) |
| 9:00 AM to 9:59 AM | 0 (0.0%) | 0 (0.0%) |
| 10:00 AM to 10:59 AM | 0 (0.0%) | 0 (0.0%) |
| 11:00 AM to 11:59 AM | 0 (0.0%) | 0 (0.0%) |
| 12:00 PM to 3:59 PM | 5 (11.6%) | 0 (0.0%) |
| 4:00 PM to 11:59 PM | 27 (62.8%) | 37 (77.1%) |
| Total | 43 (100.0%) | 48 (100.0%) |
Housing Occupancy in Robinette
Occupancy by Ownership in Robinette
Of the total 208 dwellings in Robinette, owner-occupied units account for 124 (59.6%), while renter-occupied units make up 84 (40.4%).
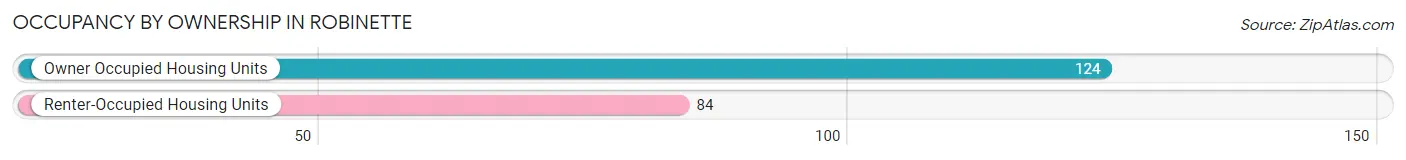
| Occupancy | # Housing Units | % Housing Units |
| Owner Occupied Housing Units | 124 | 59.6% |
| Renter-Occupied Housing Units | 84 | 40.4% |
| Total Occupied Housing Units | 208 | 100.0% |
Occupancy by Household Size in Robinette
| Household Size | # Housing Units | % Housing Units |
| 1-Person Household | 44 | 21.1% |
| 2-Person Household | 99 | 47.6% |
| 3-Person Household | 47 | 22.6% |
| 4+ Person Household | 18 | 8.6% |
| Total Housing Units | 208 | 100.0% |
Occupancy by Ownership by Household Size in Robinette
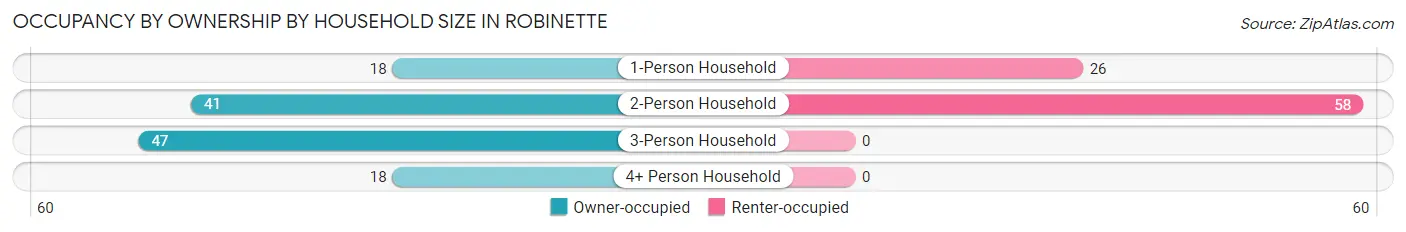
| Household Size | Owner-occupied | Renter-occupied |
| 1-Person Household | 18 (40.9%) | 26 (59.1%) |
| 2-Person Household | 41 (41.4%) | 58 (58.6%) |
| 3-Person Household | 47 (100.0%) | 0 (0.0%) |
| 4+ Person Household | 18 (100.0%) | 0 (0.0%) |
| Total Housing Units | 124 (59.6%) | 84 (40.4%) |
Occupancy by Educational Attainment in Robinette
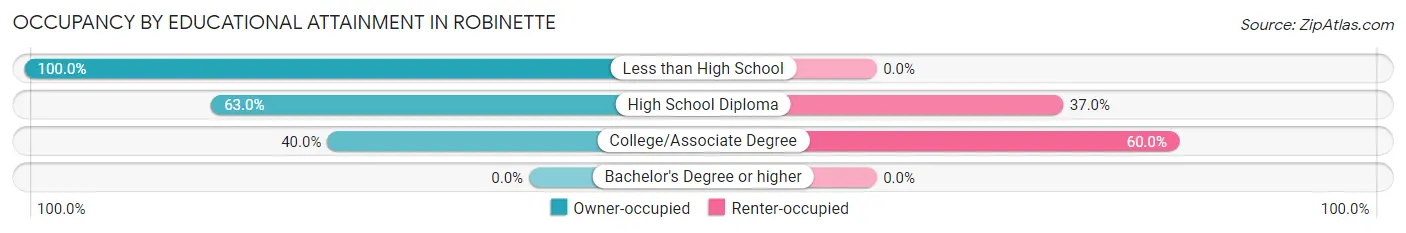
| Household Size | Owner-occupied | Renter-occupied |
| Less than High School | 9 (100.0%) | 0 (0.0%) |
| High School Diploma | 97 (63.0%) | 57 (37.0%) |
| College/Associate Degree | 18 (40.0%) | 27 (60.0%) |
| Bachelor's Degree or higher | 0 (0.0%) | 0 (0.0%) |
Occupancy by Age of Householder in Robinette
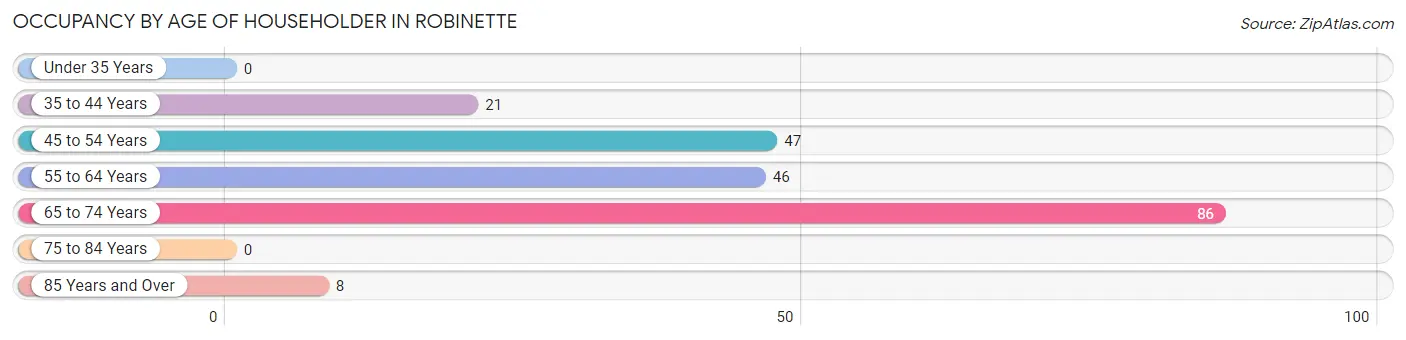
| Age Bracket | # Households | % Households |
| Under 35 Years | 0 | 0.0% |
| 35 to 44 Years | 21 | 10.1% |
| 45 to 54 Years | 47 | 22.6% |
| 55 to 64 Years | 46 | 22.1% |
| 65 to 74 Years | 86 | 41.3% |
| 75 to 84 Years | 0 | 0.0% |
| 85 Years and Over | 8 | 3.8% |
| Total | 208 | 100.0% |
Housing Finances in Robinette
Median Income by Occupancy in Robinette
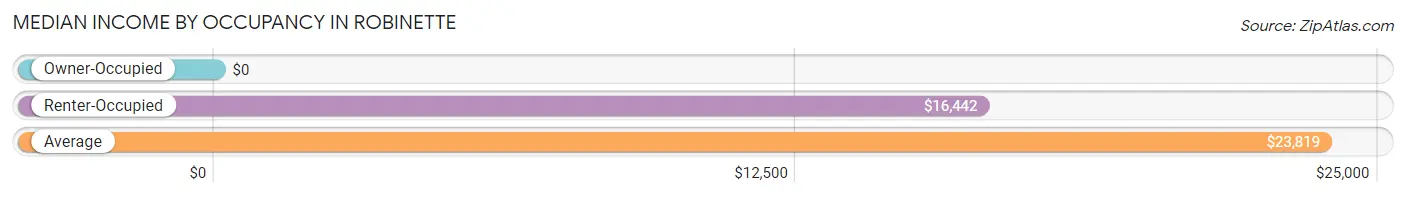
| Occupancy Type | # Households | Median Income |
| Owner-Occupied | 124 (59.6%) | $0 |
| Renter-Occupied | 84 (40.4%) | $16,442 |
| Average | 208 (100.0%) | $23,819 |
Occupancy by Householder Income Bracket in Robinette
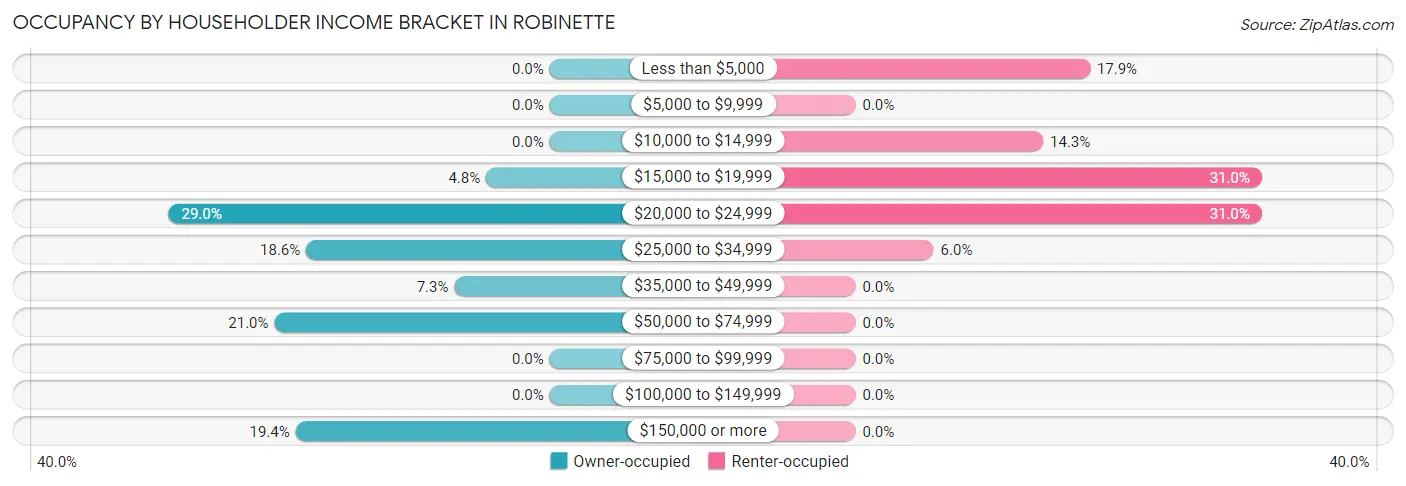
| Income Bracket | Owner-occupied | Renter-occupied |
| Less than $5,000 | 0 (0.0%) | 15 (17.9%) |
| $5,000 to $9,999 | 0 (0.0%) | 0 (0.0%) |
| $10,000 to $14,999 | 0 (0.0%) | 12 (14.3%) |
| $15,000 to $19,999 | 6 (4.8%) | 26 (30.9%) |
| $20,000 to $24,999 | 36 (29.0%) | 26 (30.9%) |
| $25,000 to $34,999 | 23 (18.5%) | 5 (5.9%) |
| $35,000 to $49,999 | 9 (7.3%) | 0 (0.0%) |
| $50,000 to $74,999 | 26 (21.0%) | 0 (0.0%) |
| $75,000 to $99,999 | 0 (0.0%) | 0 (0.0%) |
| $100,000 to $149,999 | 0 (0.0%) | 0 (0.0%) |
| $150,000 or more | 24 (19.4%) | 0 (0.0%) |
| Total | 124 (100.0%) | 84 (100.0%) |
Monthly Housing Cost Tiers in Robinette
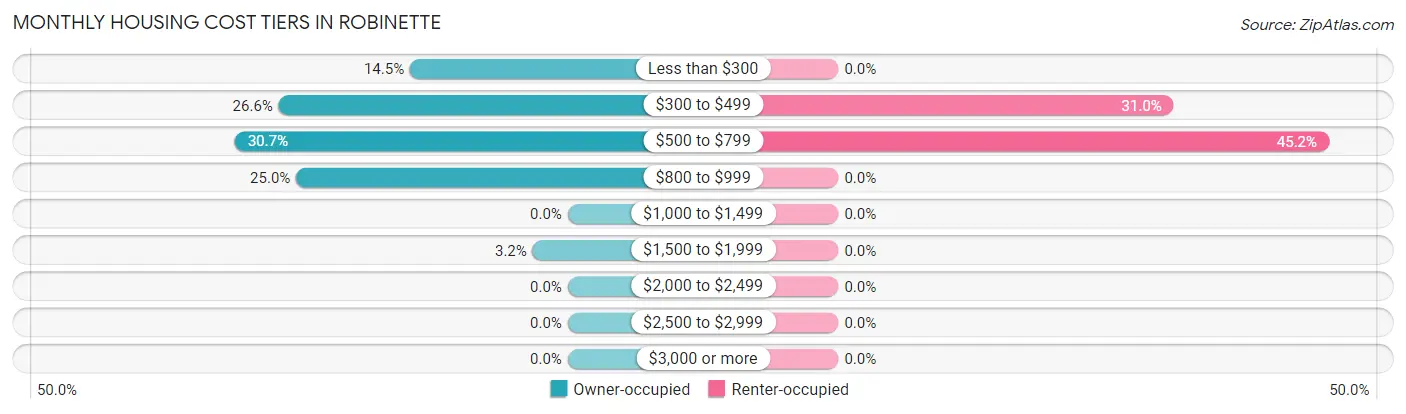
| Monthly Cost | Owner-occupied | Renter-occupied |
| Less than $300 | 18 (14.5%) | 0 (0.0%) |
| $300 to $499 | 33 (26.6%) | 26 (30.9%) |
| $500 to $799 | 38 (30.6%) | 38 (45.2%) |
| $800 to $999 | 31 (25.0%) | 0 (0.0%) |
| $1,000 to $1,499 | 0 (0.0%) | 0 (0.0%) |
| $1,500 to $1,999 | 4 (3.2%) | 0 (0.0%) |
| $2,000 to $2,499 | 0 (0.0%) | 0 (0.0%) |
| $2,500 to $2,999 | 0 (0.0%) | 0 (0.0%) |
| $3,000 or more | 0 (0.0%) | 0 (0.0%) |
| Total | 124 (100.0%) | 84 (100.0%) |
Physical Housing Characteristics in Robinette
Housing Structures in Robinette
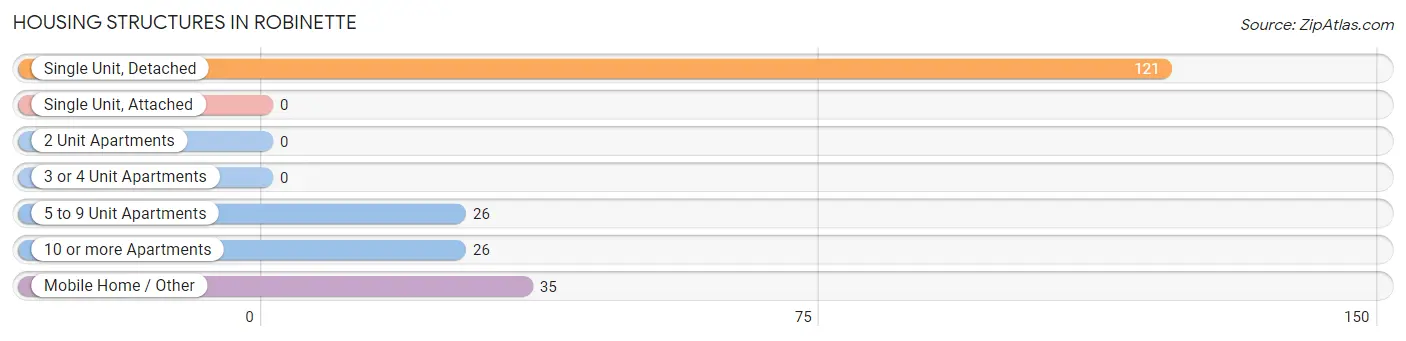
| Structure Type | # Housing Units | % Housing Units |
| Single Unit, Detached | 121 | 58.2% |
| Single Unit, Attached | 0 | 0.0% |
| 2 Unit Apartments | 0 | 0.0% |
| 3 or 4 Unit Apartments | 0 | 0.0% |
| 5 to 9 Unit Apartments | 26 | 12.5% |
| 10 or more Apartments | 26 | 12.5% |
| Mobile Home / Other | 35 | 16.8% |
| Total | 208 | 100.0% |
Housing Structures by Occupancy in Robinette
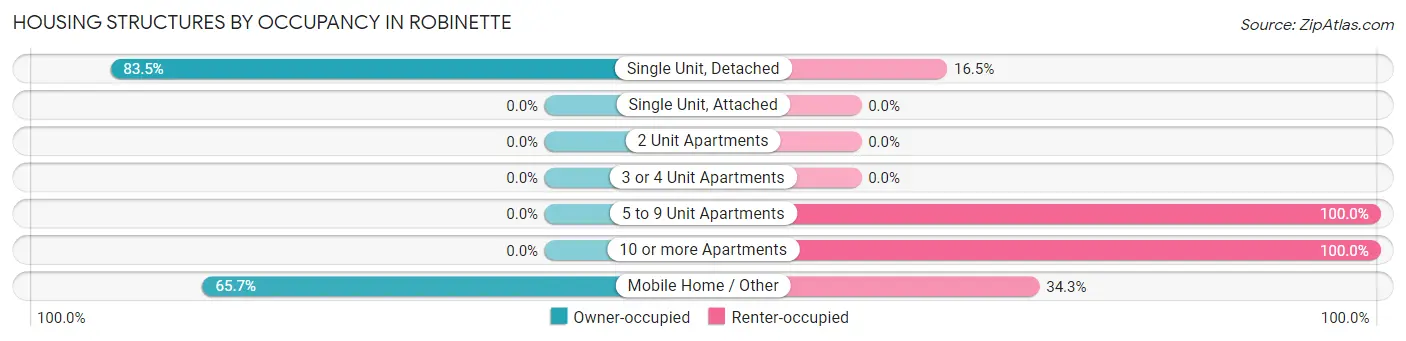
| Structure Type | Owner-occupied | Renter-occupied |
| Single Unit, Detached | 101 (83.5%) | 20 (16.5%) |
| Single Unit, Attached | 0 (0.0%) | 0 (0.0%) |
| 2 Unit Apartments | 0 (0.0%) | 0 (0.0%) |
| 3 or 4 Unit Apartments | 0 (0.0%) | 0 (0.0%) |
| 5 to 9 Unit Apartments | 0 (0.0%) | 26 (100.0%) |
| 10 or more Apartments | 0 (0.0%) | 26 (100.0%) |
| Mobile Home / Other | 23 (65.7%) | 12 (34.3%) |
| Total | 124 (59.6%) | 84 (40.4%) |
Housing Structures by Number of Rooms in Robinette
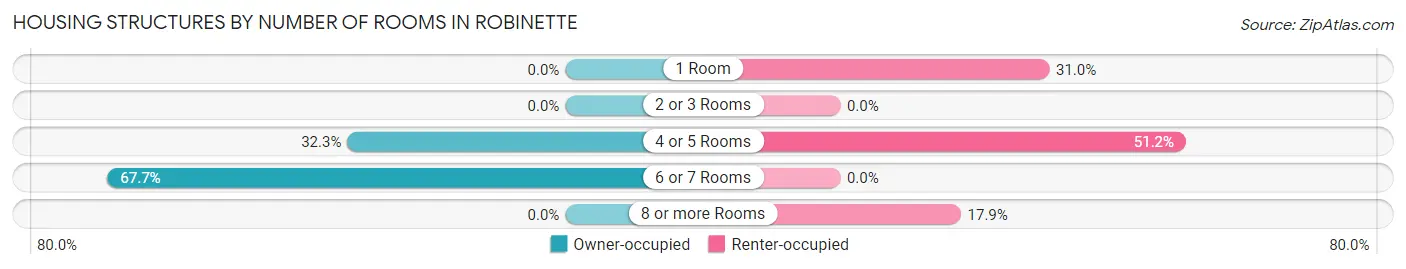
| Number of Rooms | Owner-occupied | Renter-occupied |
| 1 Room | 0 (0.0%) | 26 (30.9%) |
| 2 or 3 Rooms | 0 (0.0%) | 0 (0.0%) |
| 4 or 5 Rooms | 40 (32.3%) | 43 (51.2%) |
| 6 or 7 Rooms | 84 (67.7%) | 0 (0.0%) |
| 8 or more Rooms | 0 (0.0%) | 15 (17.9%) |
| Total | 124 (100.0%) | 84 (100.0%) |
Housing Structure by Heating Type in Robinette
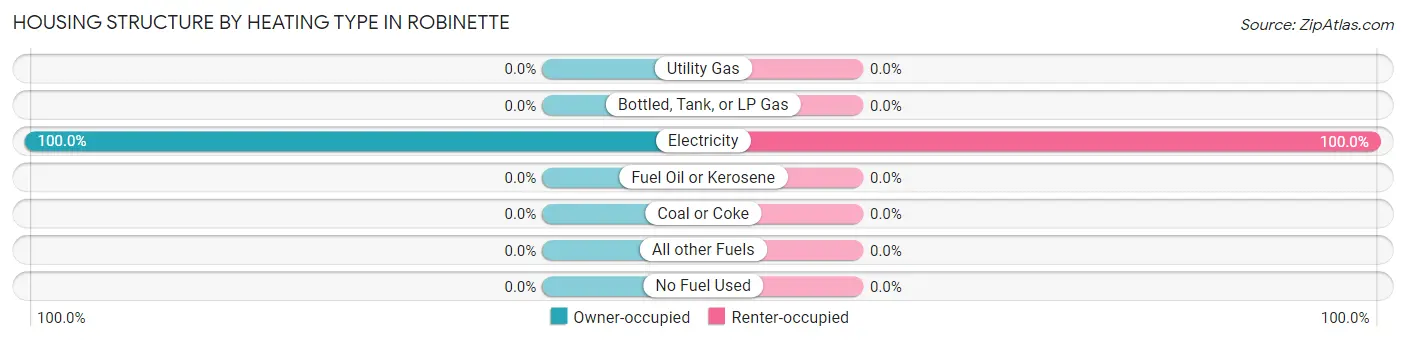
| Heating Type | Owner-occupied | Renter-occupied |
| Utility Gas | 0 (0.0%) | 0 (0.0%) |
| Bottled, Tank, or LP Gas | 0 (0.0%) | 0 (0.0%) |
| Electricity | 124 (100.0%) | 84 (100.0%) |
| Fuel Oil or Kerosene | 0 (0.0%) | 0 (0.0%) |
| Coal or Coke | 0 (0.0%) | 0 (0.0%) |
| All other Fuels | 0 (0.0%) | 0 (0.0%) |
| No Fuel Used | 0 (0.0%) | 0 (0.0%) |
| Total | 124 (100.0%) | 84 (100.0%) |
Household Vehicle Usage in Robinette
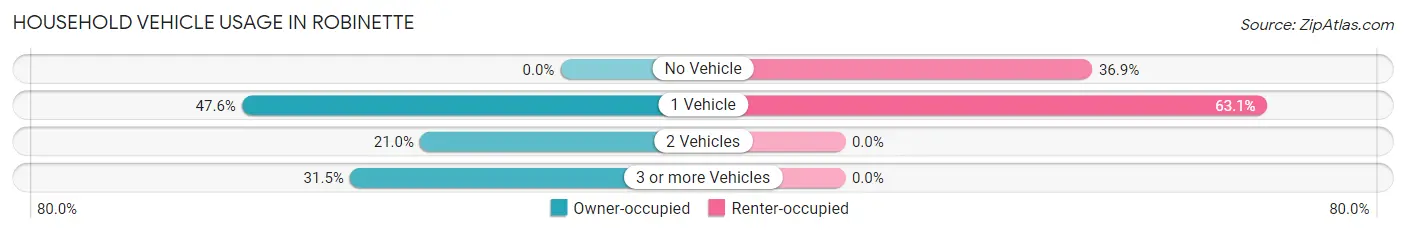
| Vehicles per Household | Owner-occupied | Renter-occupied |
| No Vehicle | 0 (0.0%) | 31 (36.9%) |
| 1 Vehicle | 59 (47.6%) | 53 (63.1%) |
| 2 Vehicles | 26 (21.0%) | 0 (0.0%) |
| 3 or more Vehicles | 39 (31.5%) | 0 (0.0%) |
| Total | 124 (100.0%) | 84 (100.0%) |
Real Estate & Mortgages in Robinette
Real Estate and Mortgage Overview in Robinette
| Characteristic | Without Mortgage | With Mortgage |
| Housing Units | 89 | 35 |
| Median Property Value | $66,700 | $63,900 |
| Median Household Income | $28,207 | $22 |
| Monthly Housing Costs | - | - |
| Real Estate Taxes | $313 | $0 |
Property Value by Mortgage Status in Robinette
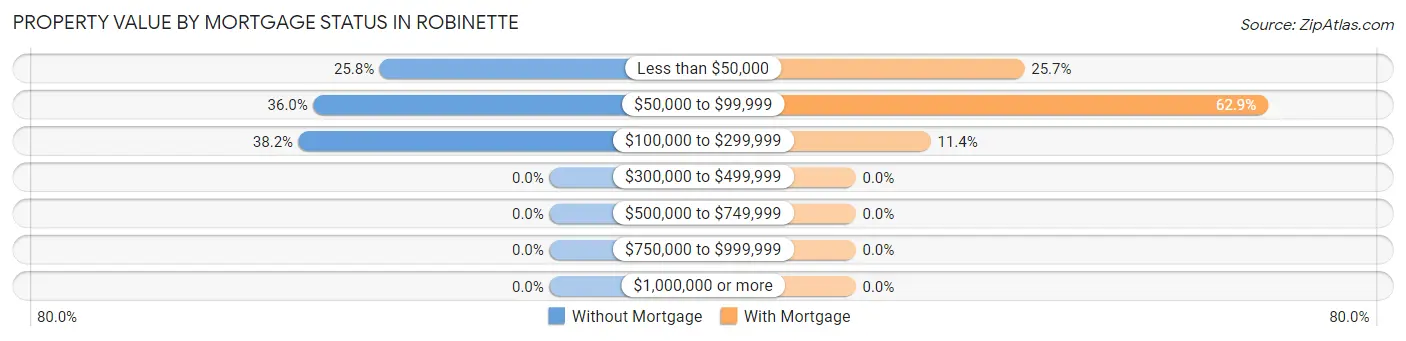
| Property Value | Without Mortgage | With Mortgage |
| Less than $50,000 | 23 (25.8%) | 9 (25.7%) |
| $50,000 to $99,999 | 32 (36.0%) | 22 (62.9%) |
| $100,000 to $299,999 | 34 (38.2%) | 4 (11.4%) |
| $300,000 to $499,999 | 0 (0.0%) | 0 (0.0%) |
| $500,000 to $749,999 | 0 (0.0%) | 0 (0.0%) |
| $750,000 to $999,999 | 0 (0.0%) | 0 (0.0%) |
| $1,000,000 or more | 0 (0.0%) | 0 (0.0%) |
| Total | 89 (100.0%) | 35 (100.0%) |
Household Income by Mortgage Status in Robinette
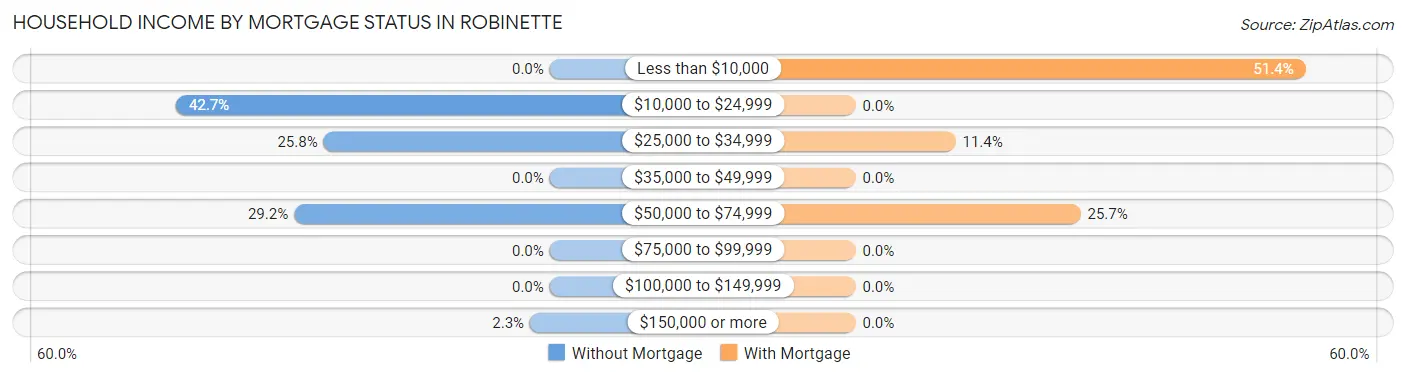
| Household Income | Without Mortgage | With Mortgage |
| Less than $10,000 | 0 (0.0%) | 18 (51.4%) |
| $10,000 to $24,999 | 38 (42.7%) | 0 (0.0%) |
| $25,000 to $34,999 | 23 (25.8%) | 4 (11.4%) |
| $35,000 to $49,999 | 0 (0.0%) | 0 (0.0%) |
| $50,000 to $74,999 | 26 (29.2%) | 9 (25.7%) |
| $75,000 to $99,999 | 0 (0.0%) | 0 (0.0%) |
| $100,000 to $149,999 | 0 (0.0%) | 0 (0.0%) |
| $150,000 or more | 2 (2.2%) | 0 (0.0%) |
| Total | 89 (100.0%) | 35 (100.0%) |
Property Value to Household Income Ratio in Robinette
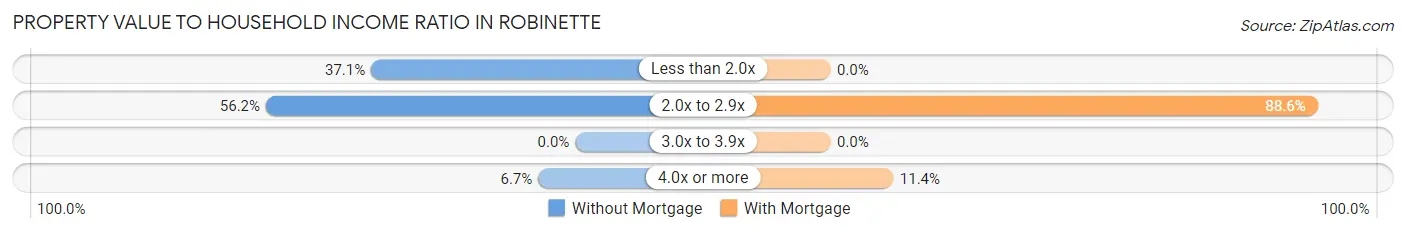
| Value-to-Income Ratio | Without Mortgage | With Mortgage |
| Less than 2.0x | 33 (37.1%) | 0 (0.0%) |
| 2.0x to 2.9x | 50 (56.2%) | 31 (88.6%) |
| 3.0x to 3.9x | 0 (0.0%) | 0 (0.0%) |
| 4.0x or more | 6 (6.7%) | 4 (11.4%) |
| Total | 89 (100.0%) | 35 (100.0%) |
Real Estate Taxes by Mortgage Status in Robinette
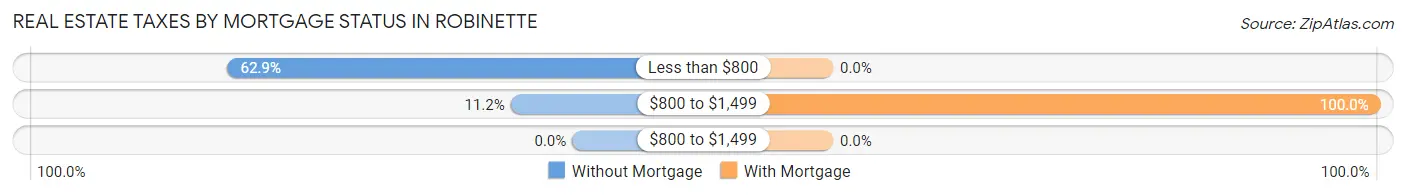
| Property Taxes | Without Mortgage | With Mortgage |
| Less than $800 | 56 (62.9%) | 0 (0.0%) |
| $800 to $1,499 | 10 (11.2%) | 35 (100.0%) |
| $800 to $1,499 | 0 (0.0%) | 0 (0.0%) |
| Total | 89 (100.0%) | 35 (100.0%) |
Health & Disability in Robinette
Health Insurance Coverage by Age in Robinette
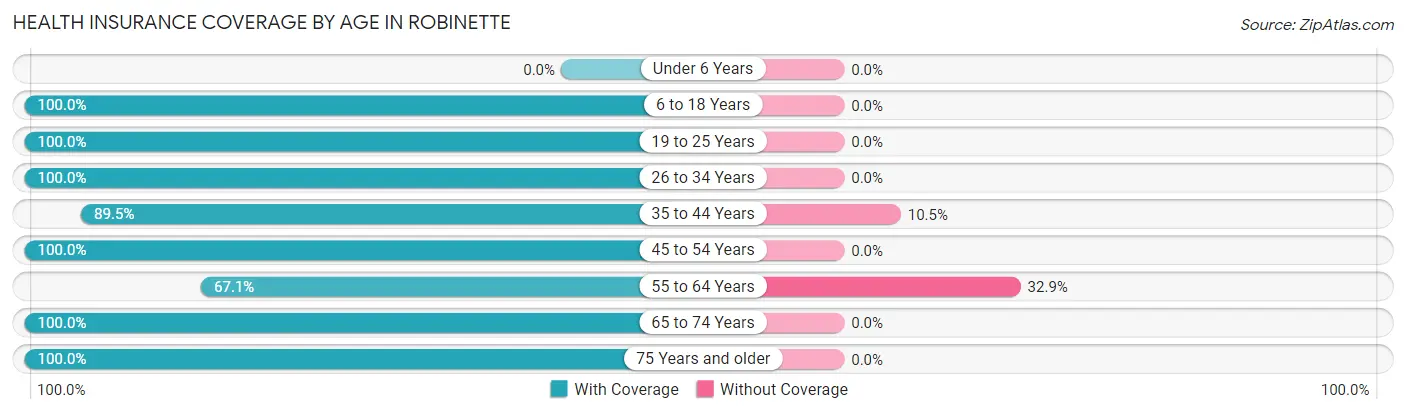
| Age Bracket | With Coverage | Without Coverage |
| Under 6 Years | 0 (0.0%) | 0 (0.0%) |
| 6 to 18 Years | 35 (100.0%) | 0 (0.0%) |
| 19 to 25 Years | 34 (100.0%) | 0 (0.0%) |
| 26 to 34 Years | 5 (100.0%) | 0 (0.0%) |
| 35 to 44 Years | 85 (89.5%) | 10 (10.5%) |
| 45 to 54 Years | 84 (100.0%) | 0 (0.0%) |
| 55 to 64 Years | 51 (67.1%) | 25 (32.9%) |
| 65 to 74 Years | 130 (100.0%) | 0 (0.0%) |
| 75 Years and older | 12 (100.0%) | 0 (0.0%) |
| Total | 436 (92.6%) | 35 (7.4%) |
Health Insurance Coverage by Citizenship Status in Robinette
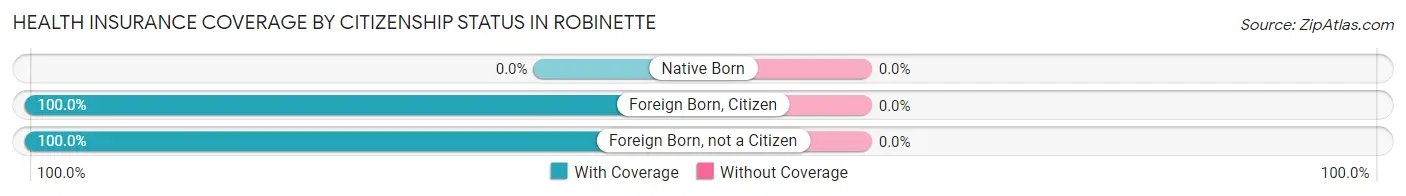
| Citizenship Status | With Coverage | Without Coverage |
| Native Born | 0 (0.0%) | 0 (0.0%) |
| Foreign Born, Citizen | 35 (100.0%) | 0 (0.0%) |
| Foreign Born, not a Citizen | 34 (100.0%) | 0 (0.0%) |
Health Insurance Coverage by Household Income in Robinette
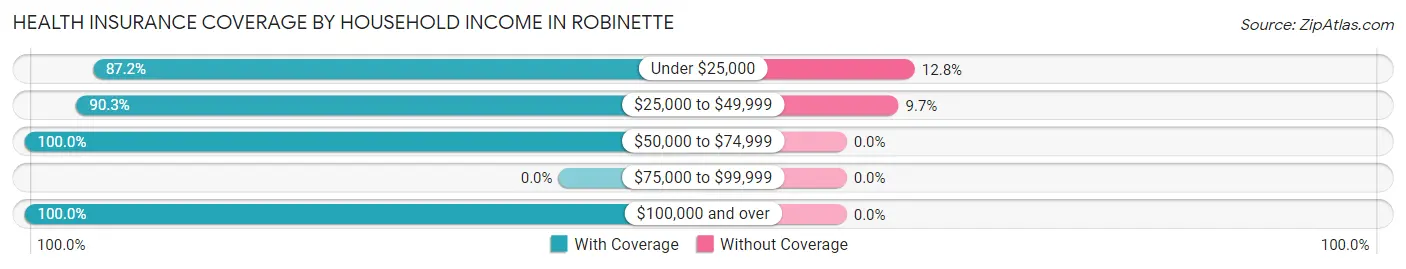
| Household Income | With Coverage | Without Coverage |
| Under $25,000 | 171 (87.2%) | 25 (12.8%) |
| $25,000 to $49,999 | 93 (90.3%) | 10 (9.7%) |
| $50,000 to $74,999 | 42 (100.0%) | 0 (0.0%) |
| $75,000 to $99,999 | 0 (0.0%) | 0 (0.0%) |
| $100,000 and over | 112 (100.0%) | 0 (0.0%) |
Public vs Private Health Insurance Coverage by Age in Robinette
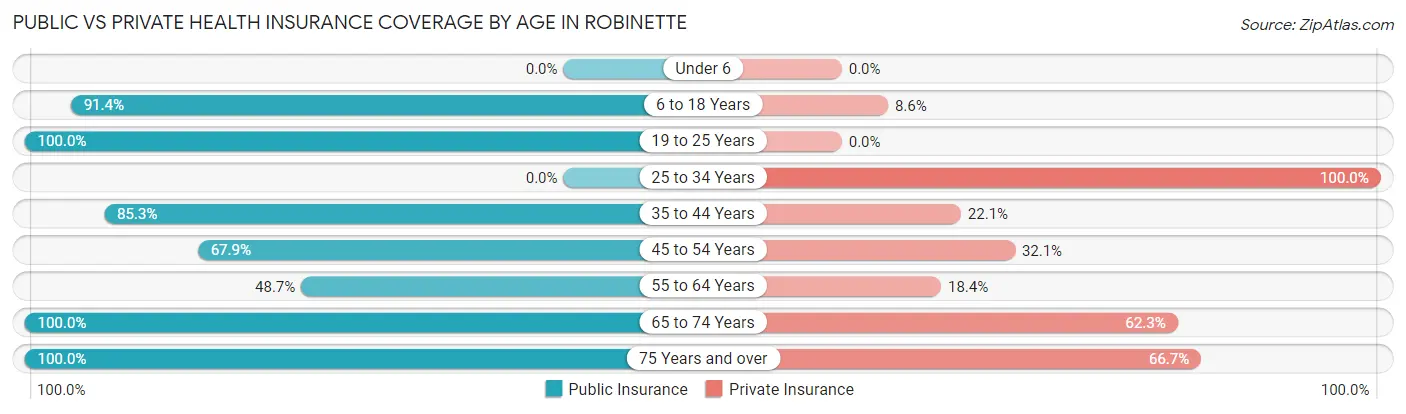
| Age Bracket | Public Insurance | Private Insurance |
| Under 6 | 0 (0.0%) | 0 (0.0%) |
| 6 to 18 Years | 32 (91.4%) | 3 (8.6%) |
| 19 to 25 Years | 34 (100.0%) | 0 (0.0%) |
| 25 to 34 Years | 0 (0.0%) | 5 (100.0%) |
| 35 to 44 Years | 81 (85.3%) | 21 (22.1%) |
| 45 to 54 Years | 57 (67.9%) | 27 (32.1%) |
| 55 to 64 Years | 37 (48.7%) | 14 (18.4%) |
| 65 to 74 Years | 130 (100.0%) | 81 (62.3%) |
| 75 Years and over | 12 (100.0%) | 8 (66.7%) |
| Total | 383 (81.3%) | 159 (33.8%) |
Disability Status by Sex by Age in Robinette
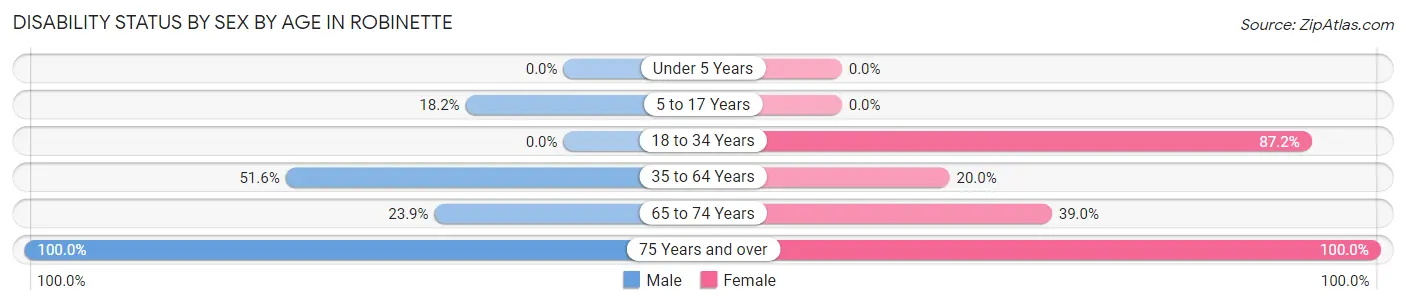
| Age Bracket | Male | Female |
| Under 5 Years | 0 (0.0%) | 0 (0.0%) |
| 5 to 17 Years | 4 (18.2%) | 0 (0.0%) |
| 18 to 34 Years | 0 (0.0%) | 34 (87.2%) |
| 35 to 64 Years | 49 (51.6%) | 32 (20.0%) |
| 65 to 74 Years | 17 (23.9%) | 23 (39.0%) |
| 75 Years and over | 8 (100.0%) | 4 (100.0%) |
Disability Class by Sex by Age in Robinette
Disability Class: Hearing Difficulty
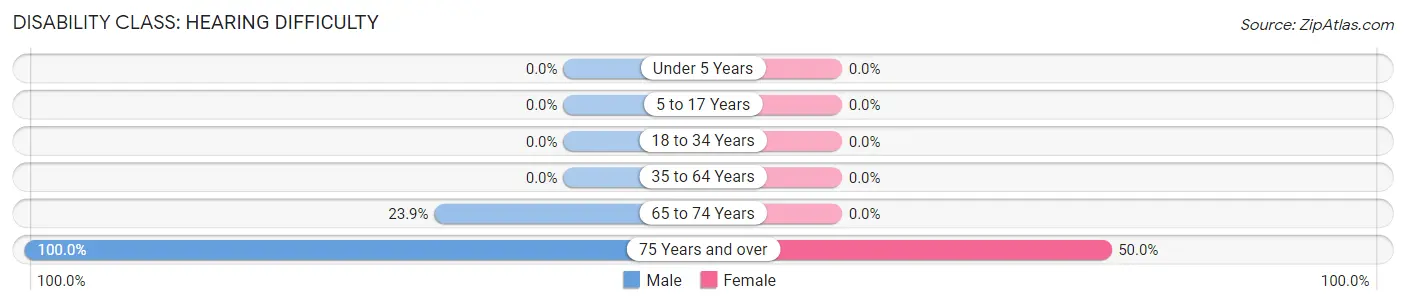
| Age Bracket | Male | Female |
| Under 5 Years | 0 (0.0%) | 0 (0.0%) |
| 5 to 17 Years | 0 (0.0%) | 0 (0.0%) |
| 18 to 34 Years | 0 (0.0%) | 0 (0.0%) |
| 35 to 64 Years | 0 (0.0%) | 0 (0.0%) |
| 65 to 74 Years | 17 (23.9%) | 0 (0.0%) |
| 75 Years and over | 8 (100.0%) | 2 (50.0%) |
Disability Class: Vision Difficulty
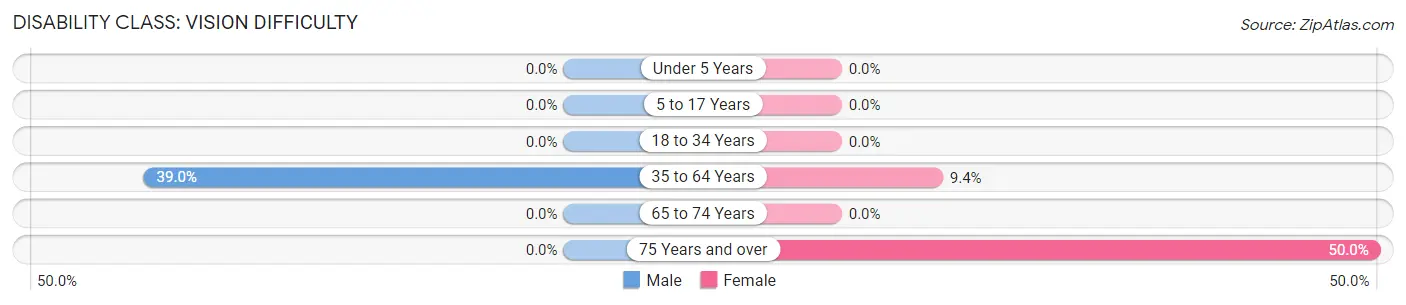
| Age Bracket | Male | Female |
| Under 5 Years | 0 (0.0%) | 0 (0.0%) |
| 5 to 17 Years | 0 (0.0%) | 0 (0.0%) |
| 18 to 34 Years | 0 (0.0%) | 0 (0.0%) |
| 35 to 64 Years | 37 (39.0%) | 15 (9.4%) |
| 65 to 74 Years | 0 (0.0%) | 0 (0.0%) |
| 75 Years and over | 0 (0.0%) | 2 (50.0%) |
Disability Class: Cognitive Difficulty
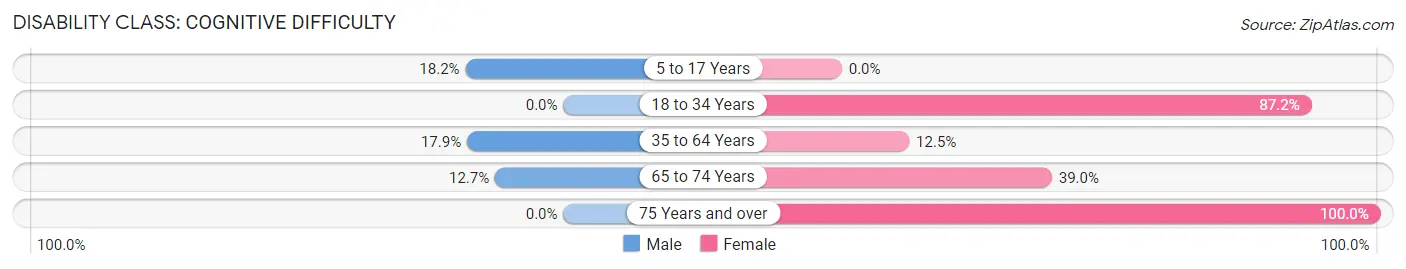
| Age Bracket | Male | Female |
| 5 to 17 Years | 4 (18.2%) | 0 (0.0%) |
| 18 to 34 Years | 0 (0.0%) | 34 (87.2%) |
| 35 to 64 Years | 17 (17.9%) | 20 (12.5%) |
| 65 to 74 Years | 9 (12.7%) | 23 (39.0%) |
| 75 Years and over | 0 (0.0%) | 4 (100.0%) |
Disability Class: Ambulatory Difficulty
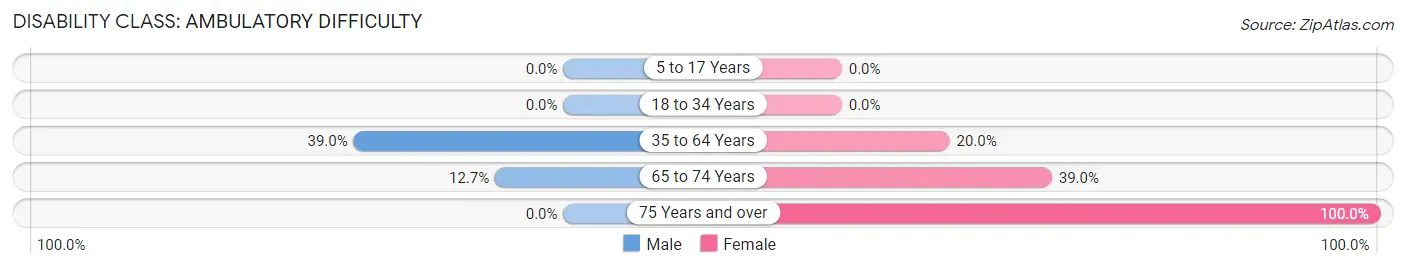
| Age Bracket | Male | Female |
| 5 to 17 Years | 0 (0.0%) | 0 (0.0%) |
| 18 to 34 Years | 0 (0.0%) | 0 (0.0%) |
| 35 to 64 Years | 37 (39.0%) | 32 (20.0%) |
| 65 to 74 Years | 9 (12.7%) | 23 (39.0%) |
| 75 Years and over | 0 (0.0%) | 4 (100.0%) |
Disability Class: Self-Care Difficulty
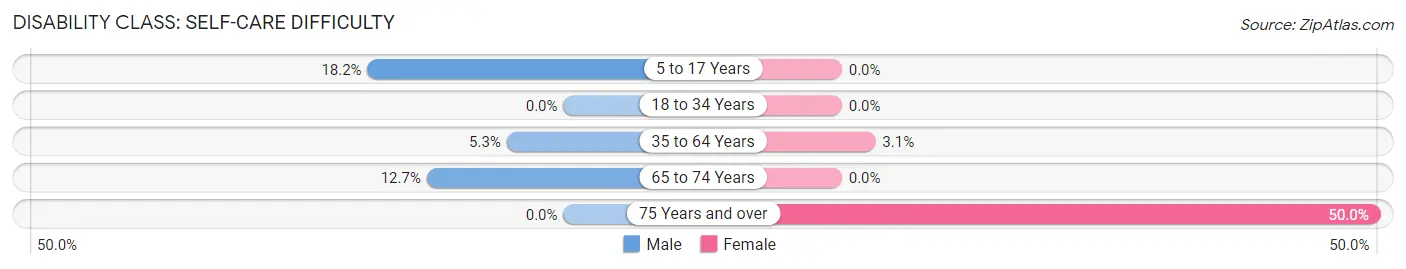
| Age Bracket | Male | Female |
| 5 to 17 Years | 4 (18.2%) | 0 (0.0%) |
| 18 to 34 Years | 0 (0.0%) | 0 (0.0%) |
| 35 to 64 Years | 5 (5.3%) | 5 (3.1%) |
| 65 to 74 Years | 9 (12.7%) | 0 (0.0%) |
| 75 Years and over | 0 (0.0%) | 2 (50.0%) |
Technology Access in Robinette
Computing Device Access in Robinette
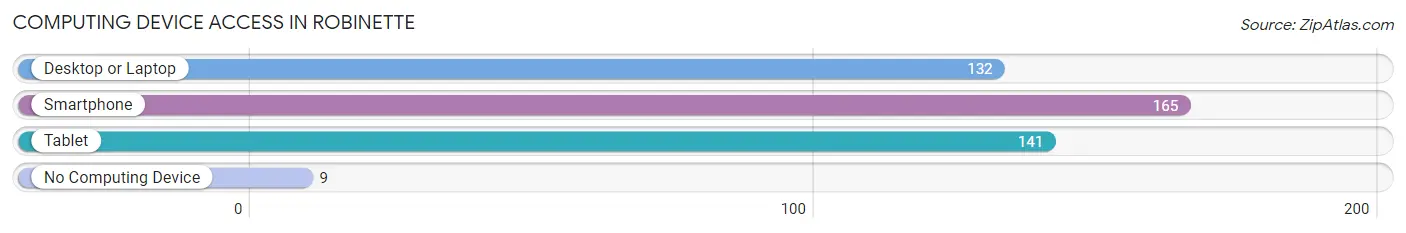
| Device Type | # Households | % Households |
| Desktop or Laptop | 132 | 63.5% |
| Smartphone | 165 | 79.3% |
| Tablet | 141 | 67.8% |
| No Computing Device | 9 | 4.3% |
| Total | 208 | 100.0% |
Internet Access in Robinette
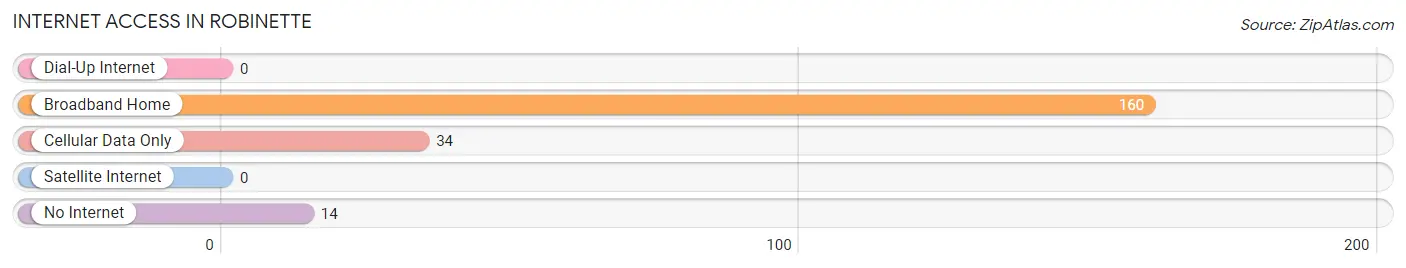
| Internet Type | # Households | % Households |
| Dial-Up Internet | 0 | 0.0% |
| Broadband Home | 160 | 76.9% |
| Cellular Data Only | 34 | 16.4% |
| Satellite Internet | 0 | 0.0% |
| No Internet | 14 | 6.7% |
| Total | 208 | 100.0% |
Robinette Summary
Robette, West Virginia is a small town located in the Appalachian Mountains of West Virginia. It is situated in the northern part of the state, in the county of McDowell. The town has a population of just over 1,000 people, and is the county seat of McDowell County.
Robette was founded in 1891 by the Robette Coal Company, which was owned by the Robette family. The town was named after the family, and the coal company was the main employer in the area. The coal industry was the main source of income for the town, and it was the primary employer until the mid-20th century.
The town of Robette is located in a rural area, and is surrounded by mountains and forests. The town is situated at an elevation of 1,800 feet, and is located in the Appalachian Mountains. The climate in Robette is humid and subtropical, with hot summers and cold winters.
The economy of Robette is largely based on agriculture and tourism. The town is home to several farms, and the surrounding area is known for its production of apples, peaches, and other fruits and vegetables. The town also has a few small businesses, including a grocery store, a hardware store, and a few restaurants.
Robette is also home to a few tourist attractions, including the Robette Coal Mine Museum, which is located in the old coal mine. The museum features exhibits on the history of the coal industry in the area, as well as artifacts from the coal mine. The town also has a few historic sites, including the Robette Historic District, which is listed on the National Register of Historic Places.
Robette is served by the McDowell County School System, which includes two elementary schools, one middle school, and one high school. The town also has a few churches, including the Robette United Methodist Church, which was founded in 1891.
Robette is a small town with a rich history and a unique culture. The town is home to a diverse population, and is a great place to visit for those looking to explore the Appalachian Mountains. The town is also home to a variety of outdoor activities, including hiking, camping, fishing, and hunting. The town is also home to a few festivals, including the Robette Apple Festival, which is held every year in October.
Common Questions
What is Per Capita Income in Robinette?
Per Capita income in Robinette is $25,558.
What is the Median Family Income in Robinette?
Median Family Income in Robinette is $24,766.
What is the Median Household income in Robinette?
Median Household Income in Robinette is $23,819.
What is Inequality or Gini Index in Robinette?
Inequality or Gini Index in Robinette is 0.54.
What is the Total Population of Robinette?
Total Population of Robinette is 471.
What is the Total Male Population of Robinette?
Total Male Population of Robinette is 196.
What is the Total Female Population of Robinette?
Total Female Population of Robinette is 275.
What is the Ratio of Males per 100 Females in Robinette?
There are 71.27 Males per 100 Females in Robinette.
What is the Ratio of Females per 100 Males in Robinette?
There are 140.31 Females per 100 Males in Robinette.
What is the Median Population Age in Robinette?
Median Population Age in Robinette is 47.5 Years.
What is the Average Family Size in Robinette
Average Family Size in Robinette is 2.5 People.
What is the Average Household Size in Robinette
Average Household Size in Robinette is 2.2 People.
How Large is the Labor Force in Robinette?
There are 101 People in the Labor Forcein in Robinette.
What is the Percentage of People in the Labor Force in Robinette?
22.3% of People are in the Labor Force in Robinette.
What is the Unemployment Rate in Robinette?
Unemployment Rate in Robinette is 9.9%.