Man, WV Map & Demographics
Man Map
Man Overview
$31,544
PER CAPITA INCOME
$80,694
AVG FAMILY INCOME
$70,481
AVG HOUSEHOLD INCOME
65.8%
WAGE / INCOME GAP [ % ]
34.2¢/ $1
WAGE / INCOME GAP [ $ ]
0.48
INEQUALITY / GINI INDEX
1,185
TOTAL POPULATION
548
MALE POPULATION
637
FEMALE POPULATION
86.03
MALES / 100 FEMALES
116.24
FEMALES / 100 MALES
33.0
MEDIAN AGE
3.3
AVG FAMILY SIZE
3.1
AVG HOUSEHOLD SIZE
439
LABOR FORCE [ PEOPLE ]
50.4%
PERCENT IN LABOR FORCE
18.5%
UNEMPLOYMENT RATE
Man Zip Codes
Income in Man
Income Overview in Man
Per Capita Income in Man is $31,544, while median incomes of families and households are $80,694 and $70,481 respectively.
| Characteristic | Number | Measure |
| Per Capita Income | 1,185 | $31,544 |
| Median Family Income | 307 | $80,694 |
| Mean Family Income | 307 | $103,316 |
| Median Household Income | 387 | $70,481 |
| Mean Household Income | 387 | $94,719 |
| Income Deficit | 307 | $0 |
| Wage / Income Gap (%) | 1,185 | 65.83% |
| Wage / Income Gap ($) | 1,185 | 34.17¢ per $1 |
| Gini / Inequality Index | 1,185 | 0.48 |
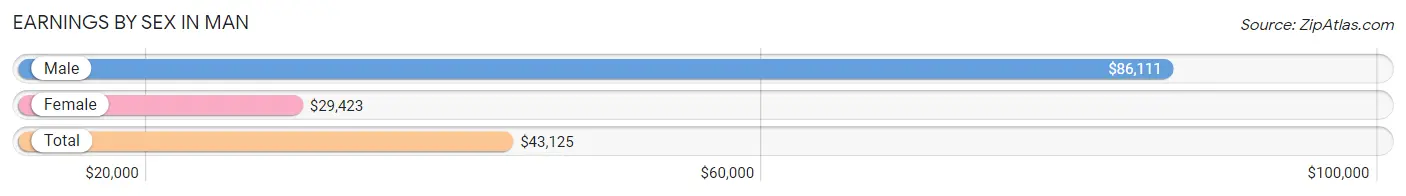
Earnings by Sex in Man
Average Earnings in Man are $43,125, $86,111 for men and $29,423 for women, a difference of 65.8%.
| Sex | Number | Average Earnings |
| Male | 228 (53.8%) | $86,111 |
| Female | 196 (46.2%) | $29,423 |
| Total | 424 (100.0%) | $43,125 |
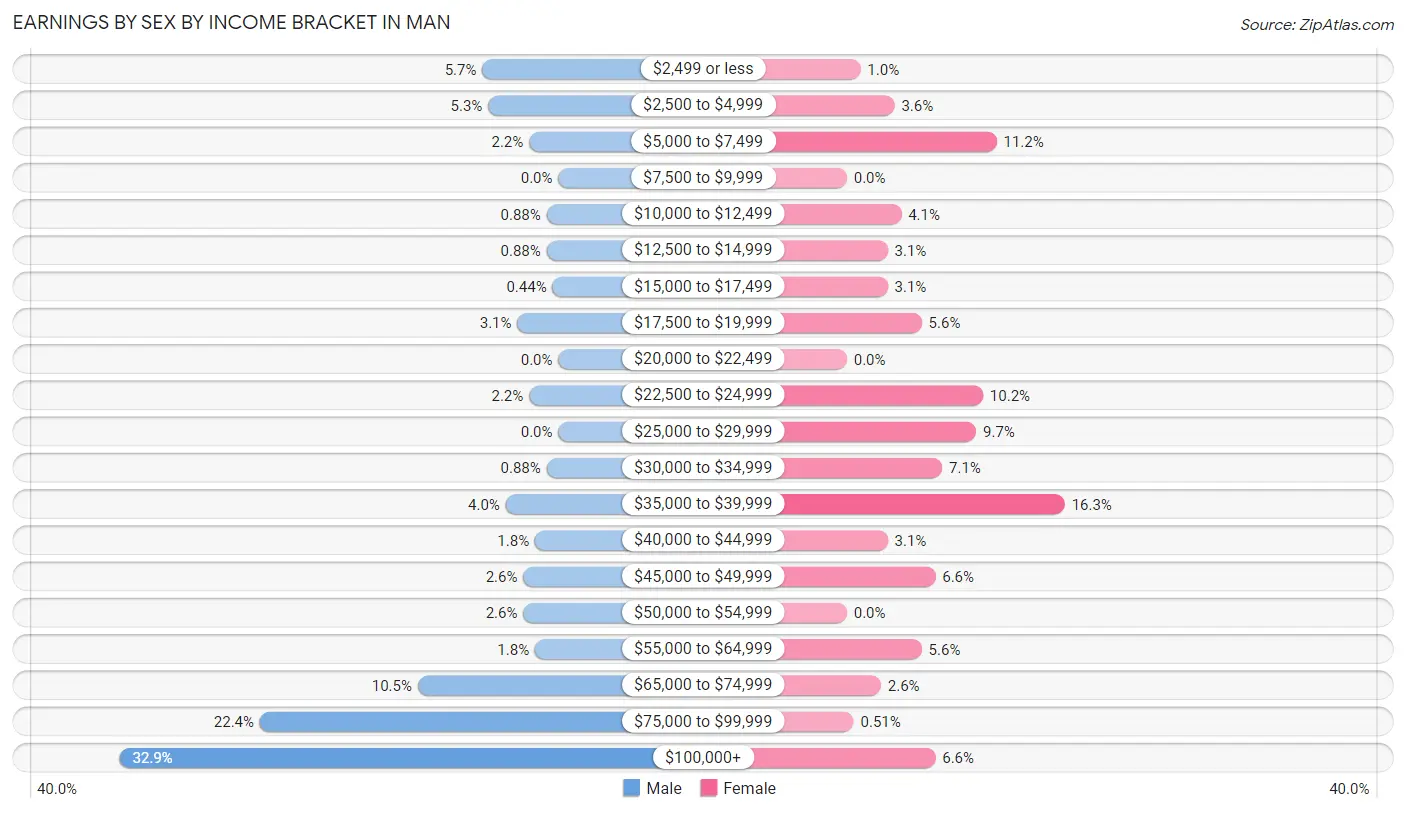
Earnings by Sex by Income Bracket in Man
The most common earnings brackets in Man are $100,000+ for men (75 | 32.9%) and $35,000 to $39,999 for women (32 | 16.3%).
| Income | Male | Female |
| $2,499 or less | 13 (5.7%) | 2 (1.0%) |
| $2,500 to $4,999 | 12 (5.3%) | 7 (3.6%) |
| $5,000 to $7,499 | 5 (2.2%) | 22 (11.2%) |
| $7,500 to $9,999 | 0 (0.0%) | 0 (0.0%) |
| $10,000 to $12,499 | 2 (0.9%) | 8 (4.1%) |
| $12,500 to $14,999 | 2 (0.9%) | 6 (3.1%) |
| $15,000 to $17,499 | 1 (0.4%) | 6 (3.1%) |
| $17,500 to $19,999 | 7 (3.1%) | 11 (5.6%) |
| $20,000 to $22,499 | 0 (0.0%) | 0 (0.0%) |
| $22,500 to $24,999 | 5 (2.2%) | 20 (10.2%) |
| $25,000 to $29,999 | 0 (0.0%) | 19 (9.7%) |
| $30,000 to $34,999 | 2 (0.9%) | 14 (7.1%) |
| $35,000 to $39,999 | 9 (4.0%) | 32 (16.3%) |
| $40,000 to $44,999 | 4 (1.8%) | 6 (3.1%) |
| $45,000 to $49,999 | 6 (2.6%) | 13 (6.6%) |
| $50,000 to $54,999 | 6 (2.6%) | 0 (0.0%) |
| $55,000 to $64,999 | 4 (1.8%) | 11 (5.6%) |
| $65,000 to $74,999 | 24 (10.5%) | 5 (2.5%) |
| $75,000 to $99,999 | 51 (22.4%) | 1 (0.5%) |
| $100,000+ | 75 (32.9%) | 13 (6.6%) |
| Total | 228 (100.0%) | 196 (100.0%) |
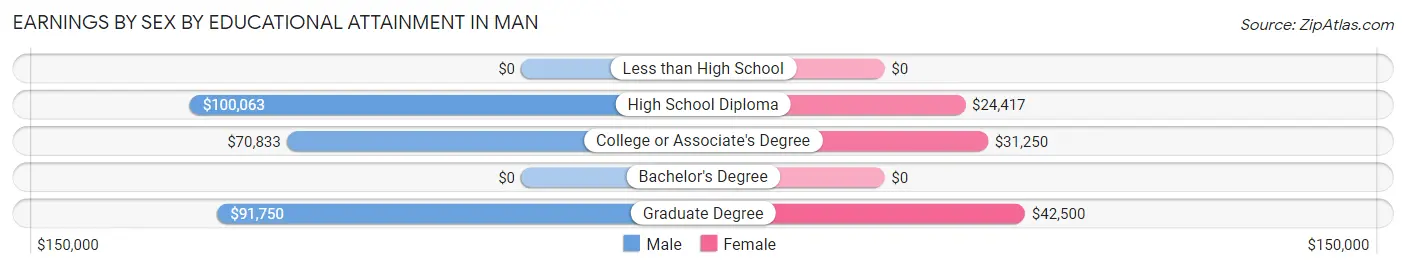
Earnings by Sex by Educational Attainment in Man
Average earnings in Man are $89,000 for men and $34,750 for women, a difference of 61.0%. Men with an educational attainment of high school diploma enjoy the highest average annual earnings of $100,063, while those with college or associate's degree education earn the least with $70,833. Women with an educational attainment of graduate degree earn the most with the average annual earnings of $42,500, while those with high school diploma education have the smallest earnings of $24,417.
| Educational Attainment | Male Income | Female Income |
| Less than High School | - | - |
| High School Diploma | $100,063 | $24,417 |
| College or Associate's Degree | $70,833 | $31,250 |
| Bachelor's Degree | - | - |
| Graduate Degree | $91,750 | $42,500 |
| Total | $89,000 | $34,750 |
Family Income in Man
Family Income Brackets in Man
According to the Man family income data, there are 53 families falling into the $100,000 to $149,999 income range, which is the most common income bracket and makes up 17.3% of all families. Conversely, the less than $10,000 income bracket is the least frequent group with only 9 families (2.9%) belonging to this category.
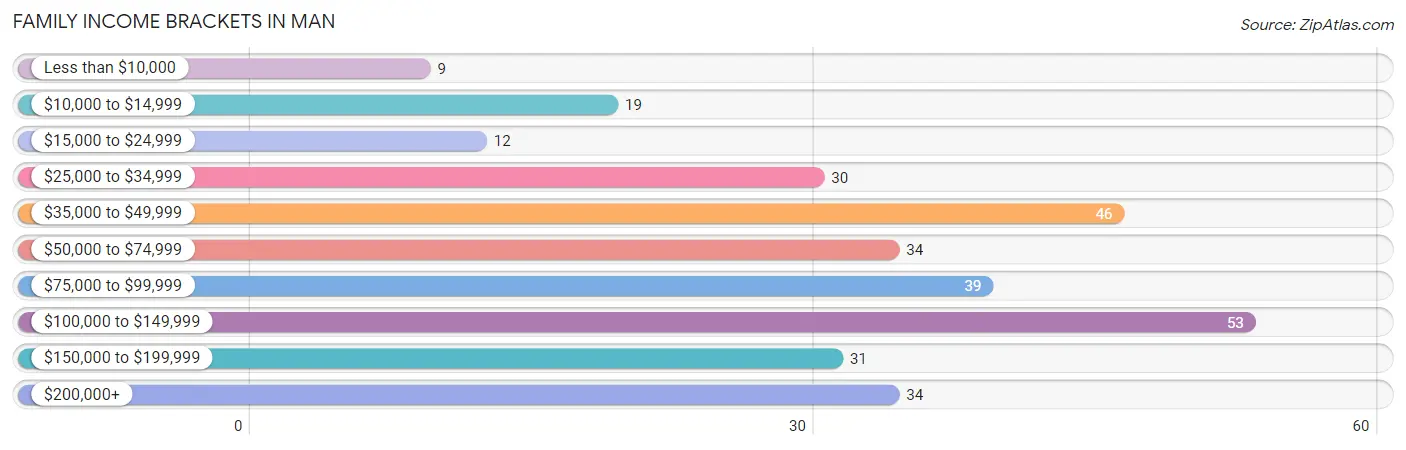
| Income Bracket | # Families | % Families |
| Less than $10,000 | 9 | 2.9% |
| $10,000 to $14,999 | 19 | 6.2% |
| $15,000 to $24,999 | 12 | 3.9% |
| $25,000 to $34,999 | 30 | 9.8% |
| $35,000 to $49,999 | 46 | 15.0% |
| $50,000 to $74,999 | 34 | 11.1% |
| $75,000 to $99,999 | 39 | 12.7% |
| $100,000 to $149,999 | 53 | 17.3% |
| $150,000 to $199,999 | 31 | 10.1% |
| $200,000+ | 34 | 11.1% |
Family Income by Famaliy Size in Man
3-person families (67 | 21.8%) account for the highest median family income in Man with $141,563 per family, while 3-person families (67 | 21.8%) have the highest median income of $47,188 per family member.
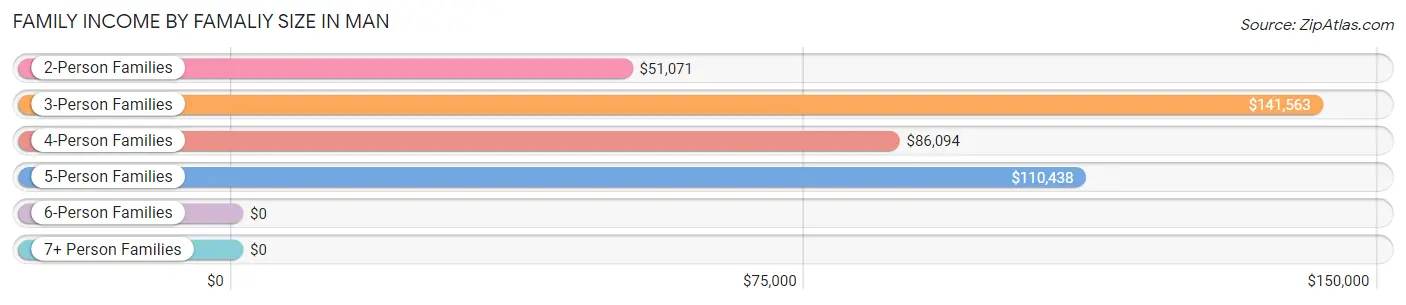
| Income Bracket | # Families | Median Income |
| 2-Person Families | 126 (41.0%) | $51,071 |
| 3-Person Families | 67 (21.8%) | $141,563 |
| 4-Person Families | 73 (23.8%) | $86,094 |
| 5-Person Families | 37 (12.0%) | $110,438 |
| 6-Person Families | 4 (1.3%) | $0 |
| 7+ Person Families | 0 (0.0%) | $0 |
| Total | 307 (100.0%) | $80,694 |
Family Income by Number of Earners in Man
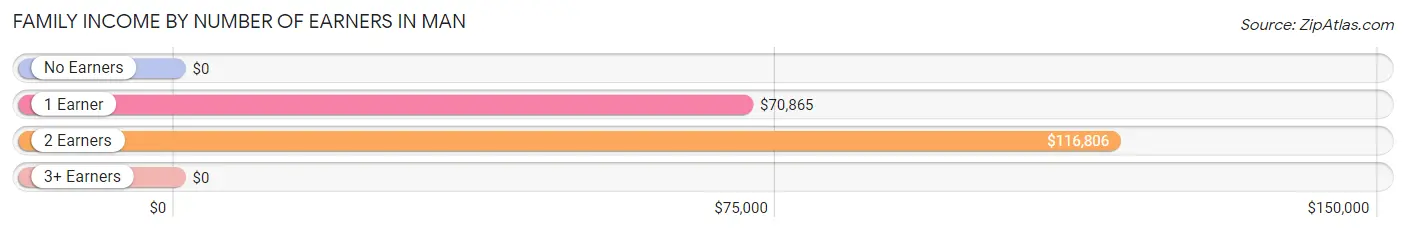
| Number of Earners | # Families | Median Income |
| No Earners | 66 (21.5%) | $0 |
| 1 Earner | 149 (48.5%) | $70,865 |
| 2 Earners | 77 (25.1%) | $116,806 |
| 3+ Earners | 15 (4.9%) | $0 |
| Total | 307 (100.0%) | $80,694 |
Household Income in Man
Household Income Brackets in Man
With 65 households falling in the category, the $35,000 to $49,999 income range is the most frequent in Man, accounting for 16.8% of all households. In contrast, only 15 households (3.9%) fall into the less than $10,000 income bracket, making it the least populous group.
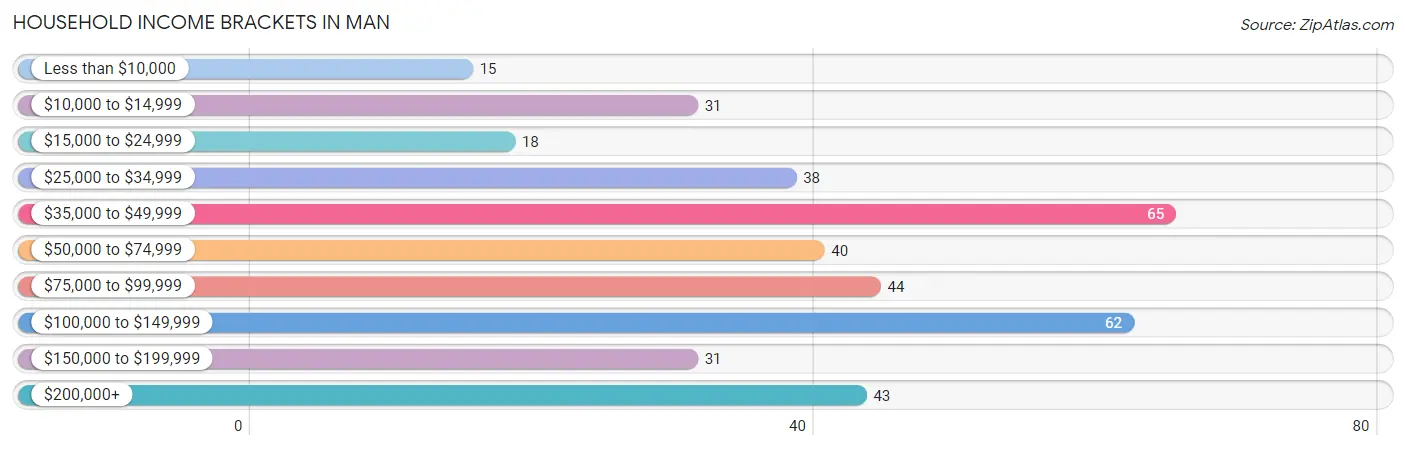
| Income Bracket | # Households | % Households |
| Less than $10,000 | 15 | 3.9% |
| $10,000 to $14,999 | 31 | 8.0% |
| $15,000 to $24,999 | 18 | 4.7% |
| $25,000 to $34,999 | 38 | 9.8% |
| $35,000 to $49,999 | 65 | 16.8% |
| $50,000 to $74,999 | 40 | 10.3% |
| $75,000 to $99,999 | 44 | 11.4% |
| $100,000 to $149,999 | 62 | 16.0% |
| $150,000 to $199,999 | 31 | 8.0% |
| $200,000+ | 43 | 11.1% |
Household Income by Householder Age in Man
The median household income in Man is $70,481, with the highest median household income of $86,406 found in the 25 to 44 years age bracket for the primary householder. A total of 123 households (31.8%) fall into this category. Meanwhile, the 15 to 24 years age bracket for the primary householder has the lowest median household income of $0, with 7 households (1.8%) in this group.
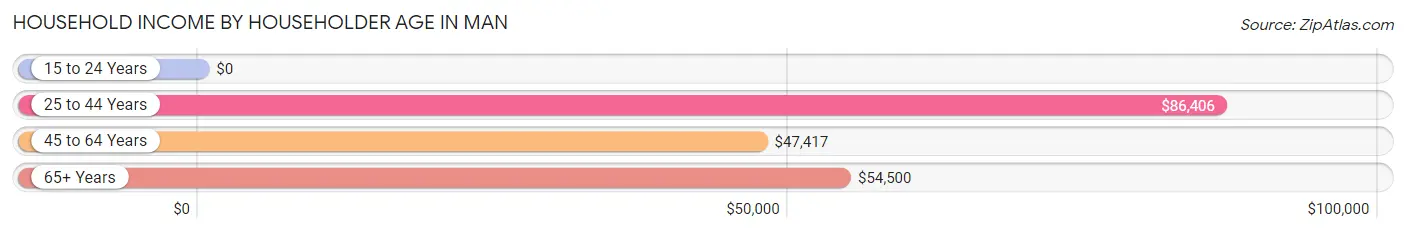
| Income Bracket | # Households | Median Income |
| 15 to 24 Years | 7 (1.8%) | $0 |
| 25 to 44 Years | 123 (31.8%) | $86,406 |
| 45 to 64 Years | 155 (40.1%) | $47,417 |
| 65+ Years | 102 (26.4%) | $54,500 |
| Total | 387 (100.0%) | $70,481 |
Poverty in Man
Income Below Poverty by Sex and Age in Man
With 16.4% poverty level for males and 16.3% for females among the residents of Man, 15 year old males and 5 year old females are the most vulnerable to poverty, with 2 males (50.0%) and 3 females (100.0%) in their respective age groups living below the poverty level.
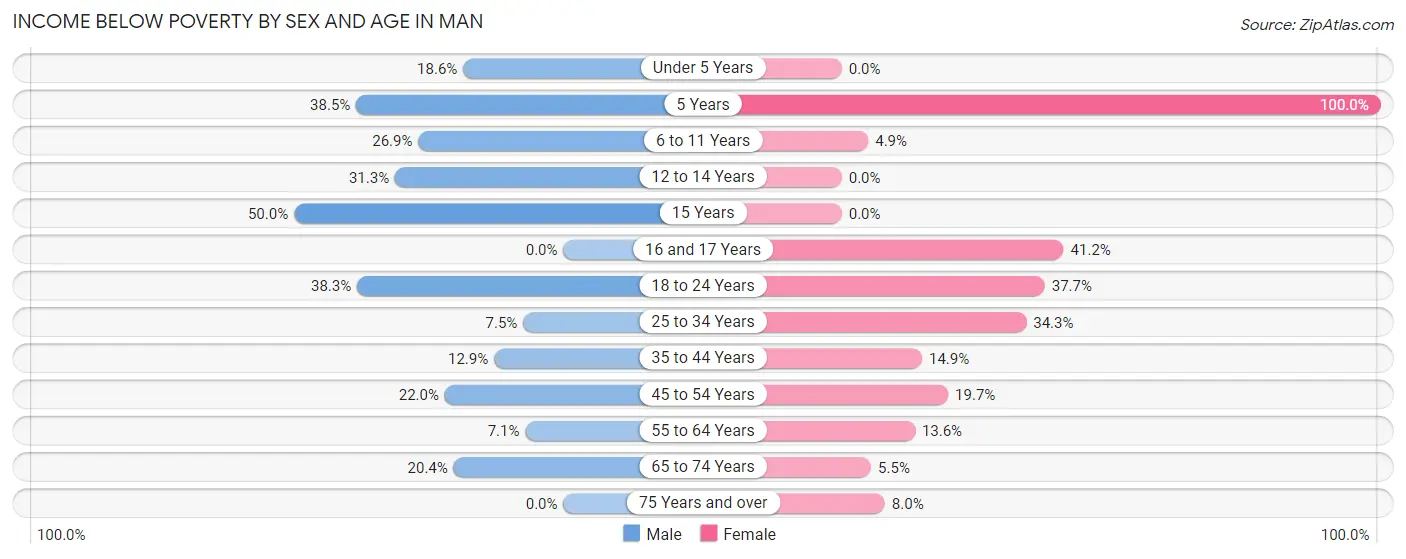
| Age Bracket | Male | Female |
| Under 5 Years | 8 (18.6%) | 0 (0.0%) |
| 5 Years | 5 (38.5%) | 3 (100.0%) |
| 6 to 11 Years | 7 (26.9%) | 3 (4.9%) |
| 12 to 14 Years | 5 (31.2%) | 0 (0.0%) |
| 15 Years | 2 (50.0%) | 0 (0.0%) |
| 16 and 17 Years | 0 (0.0%) | 7 (41.2%) |
| 18 to 24 Years | 18 (38.3%) | 26 (37.7%) |
| 25 to 34 Years | 5 (7.5%) | 25 (34.3%) |
| 35 to 44 Years | 9 (12.9%) | 7 (14.9%) |
| 45 to 54 Years | 11 (22.0%) | 15 (19.7%) |
| 55 to 64 Years | 6 (7.1%) | 11 (13.6%) |
| 65 to 74 Years | 11 (20.4%) | 3 (5.4%) |
| 75 Years and over | 0 (0.0%) | 2 (8.0%) |
| Total | 87 (16.4%) | 102 (16.3%) |
Income Above Poverty by Sex and Age in Man
According to the poverty statistics in Man, males aged 16 and 17 years and females aged under 5 years are the age groups that are most secure financially, with 100.0% of males and 100.0% of females in these age groups living above the poverty line.
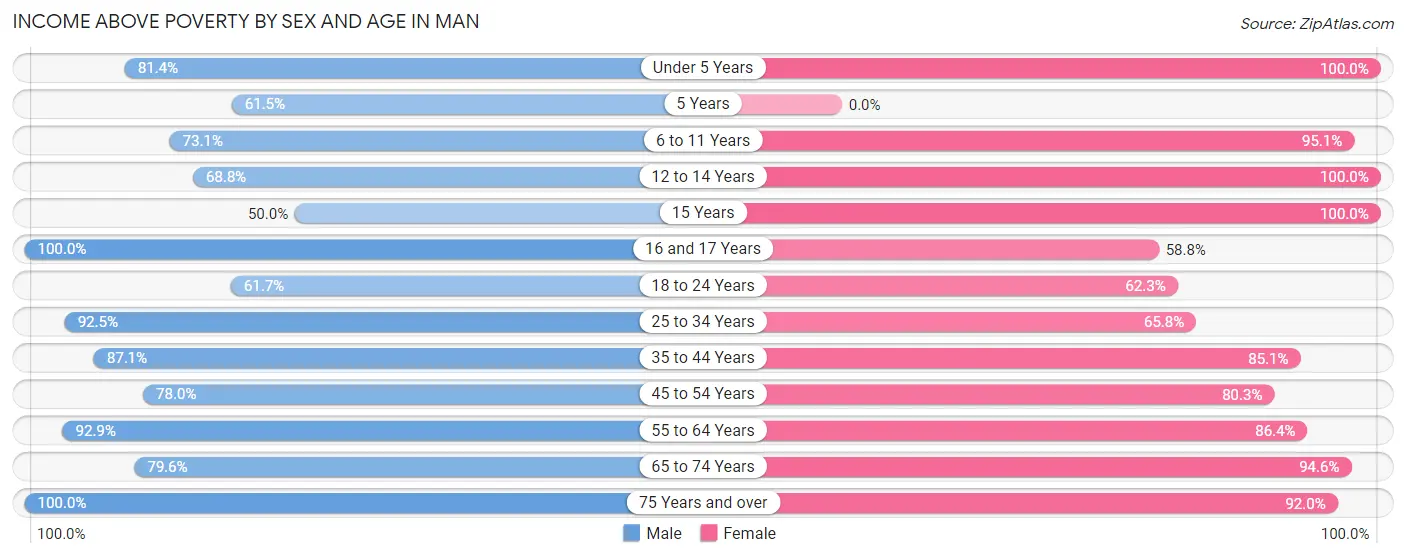
| Age Bracket | Male | Female |
| Under 5 Years | 35 (81.4%) | 36 (100.0%) |
| 5 Years | 8 (61.5%) | 0 (0.0%) |
| 6 to 11 Years | 19 (73.1%) | 58 (95.1%) |
| 12 to 14 Years | 11 (68.8%) | 58 (100.0%) |
| 15 Years | 2 (50.0%) | 26 (100.0%) |
| 16 and 17 Years | 11 (100.0%) | 10 (58.8%) |
| 18 to 24 Years | 29 (61.7%) | 43 (62.3%) |
| 25 to 34 Years | 62 (92.5%) | 48 (65.7%) |
| 35 to 44 Years | 61 (87.1%) | 40 (85.1%) |
| 45 to 54 Years | 39 (78.0%) | 61 (80.3%) |
| 55 to 64 Years | 79 (92.9%) | 70 (86.4%) |
| 65 to 74 Years | 43 (79.6%) | 52 (94.6%) |
| 75 Years and over | 44 (100.0%) | 23 (92.0%) |
| Total | 443 (83.6%) | 525 (83.7%) |
Income Below Poverty Among Married-Couple Families in Man
The poverty statistics for married-couple families in Man show that 5.7% or 13 of the total 230 families live below the poverty line. Families with 3 or 4 children have the highest poverty rate of 18.5%, comprising of 5 families. On the other hand, families with no children have the lowest poverty rate of 2.2%, which includes 3 families.
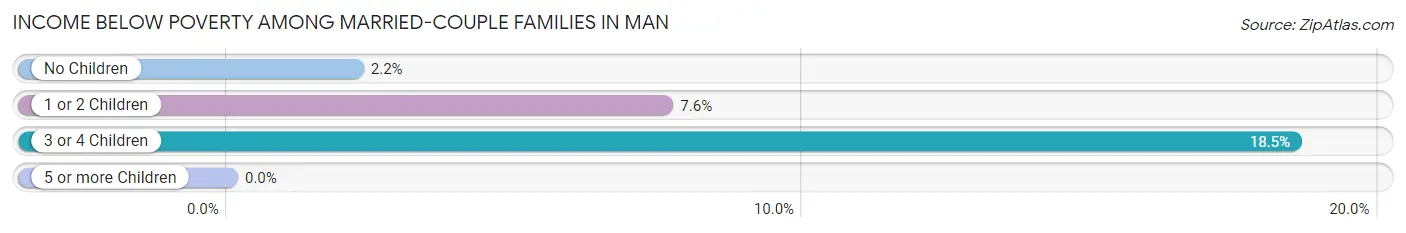
| Children | Above Poverty | Below Poverty |
| No Children | 134 (97.8%) | 3 (2.2%) |
| 1 or 2 Children | 61 (92.4%) | 5 (7.6%) |
| 3 or 4 Children | 22 (81.5%) | 5 (18.5%) |
| 5 or more Children | 0 (0.0%) | 0 (0.0%) |
| Total | 217 (94.4%) | 13 (5.7%) |
Income Below Poverty Among Single-Parent Households in Man
According to the poverty data in Man, 54.8% or 17 single-father households and 23.9% or 11 single-mother households are living below the poverty line. Among single-father households, those with no children have the highest poverty rate, with 8 households (57.1%) experiencing poverty. Likewise, among single-mother households, those with no children have the highest poverty rate, with 2 households (25.0%) falling below the poverty line.
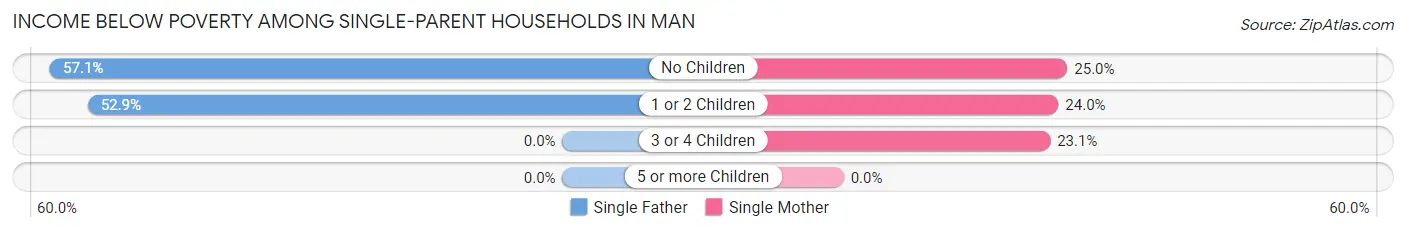
| Children | Single Father | Single Mother |
| No Children | 8 (57.1%) | 2 (25.0%) |
| 1 or 2 Children | 9 (52.9%) | 6 (24.0%) |
| 3 or 4 Children | 0 (0.0%) | 3 (23.1%) |
| 5 or more Children | 0 (0.0%) | 0 (0.0%) |
| Total | 17 (54.8%) | 11 (23.9%) |
Income Below Poverty Among Married-Couple vs Single-Parent Households in Man
The poverty data for Man shows that 13 of the married-couple family households (5.7%) and 28 of the single-parent households (36.4%) are living below the poverty level. Within the married-couple family households, those with 3 or 4 children have the highest poverty rate, with 5 households (18.5%) falling below the poverty line. Among the single-parent households, those with no children have the highest poverty rate, with 10 household (45.5%) living below poverty.
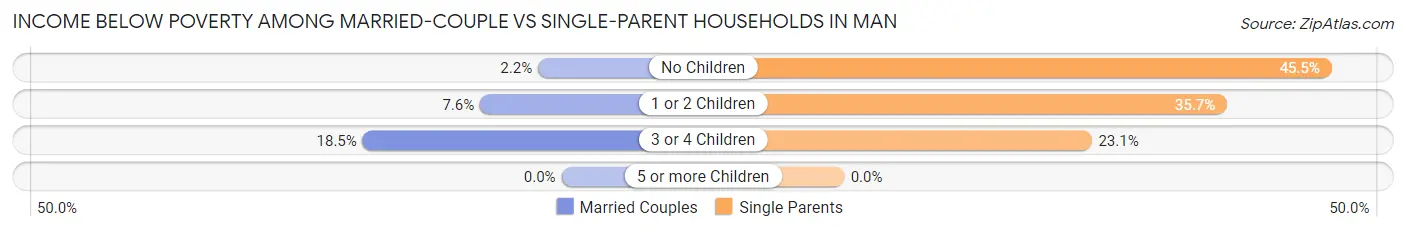
| Children | Married-Couple Families | Single-Parent Households |
| No Children | 3 (2.2%) | 10 (45.5%) |
| 1 or 2 Children | 5 (7.6%) | 15 (35.7%) |
| 3 or 4 Children | 5 (18.5%) | 3 (23.1%) |
| 5 or more Children | 0 (0.0%) | 0 (0.0%) |
| Total | 13 (5.7%) | 28 (36.4%) |
Race in Man
The most populous races in Man are White / Caucasian (1,142 | 96.4%), Two or more Races (26 | 2.2%), and Black / African American (15 | 1.3%).
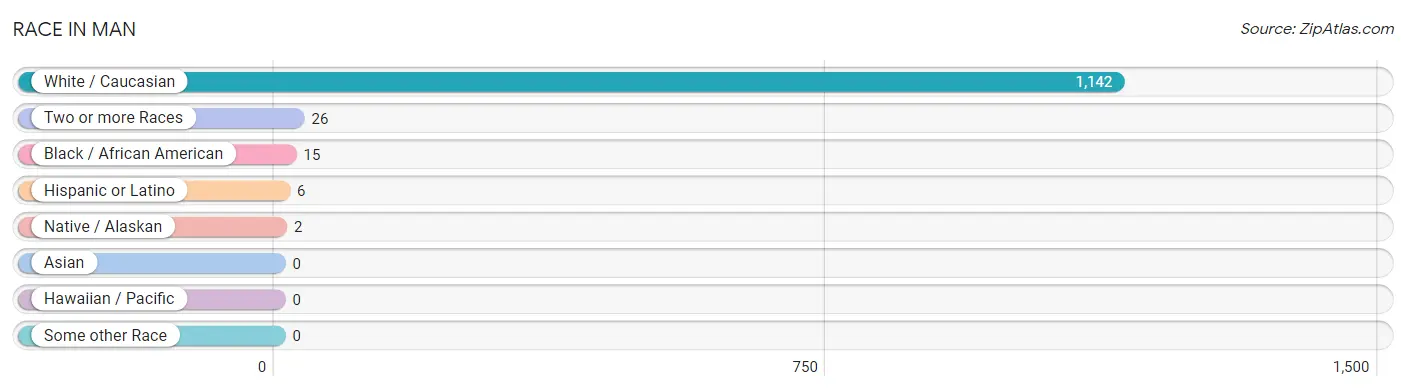
| Race | # Population | % Population |
| Asian | 0 | 0.0% |
| Black / African American | 15 | 1.3% |
| Hawaiian / Pacific | 0 | 0.0% |
| Hispanic or Latino | 6 | 0.5% |
| Native / Alaskan | 2 | 0.2% |
| White / Caucasian | 1,142 | 96.4% |
| Two or more Races | 26 | 2.2% |
| Some other Race | 0 | 0.0% |
| Total | 1,185 | 100.0% |
Ancestry in Man
The most populous ancestries reported in Man are English (119 | 10.0%), Irish (82 | 6.9%), American (47 | 4.0%), German (44 | 3.7%), and French (27 | 2.3%), together accounting for 26.9% of all Man residents.
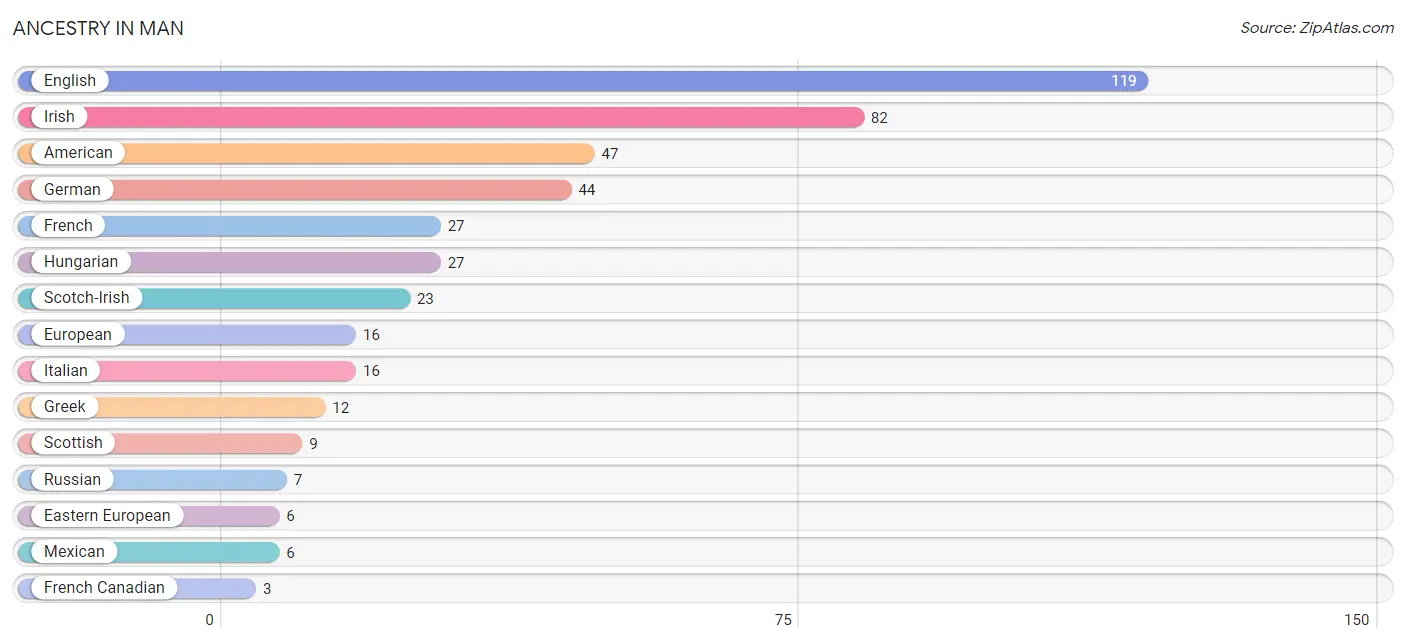
| Ancestry | # Population | % Population |
| American | 47 | 4.0% |
| Dutch | 2 | 0.2% |
| Eastern European | 6 | 0.5% |
| English | 119 | 10.0% |
| European | 16 | 1.3% |
| French | 27 | 2.3% |
| French Canadian | 3 | 0.3% |
| German | 44 | 3.7% |
| Greek | 12 | 1.0% |
| Hungarian | 27 | 2.3% |
| Irish | 82 | 6.9% |
| Italian | 16 | 1.3% |
| Mexican | 6 | 0.5% |
| Russian | 7 | 0.6% |
| Scandinavian | 2 | 0.2% |
| Scotch-Irish | 23 | 1.9% |
| Scottish | 9 | 0.8% | View All 17 Rows |
Immigrants in Man

| Immigration Origin | # Population | % Population | View All 0 Rows |
Sex and Age in Man
Sex and Age in Man
The most populous age groups in Man are 60 to 64 Years (65 | 11.9%) for men and 10 to 14 Years (73 | 11.5%) for women.
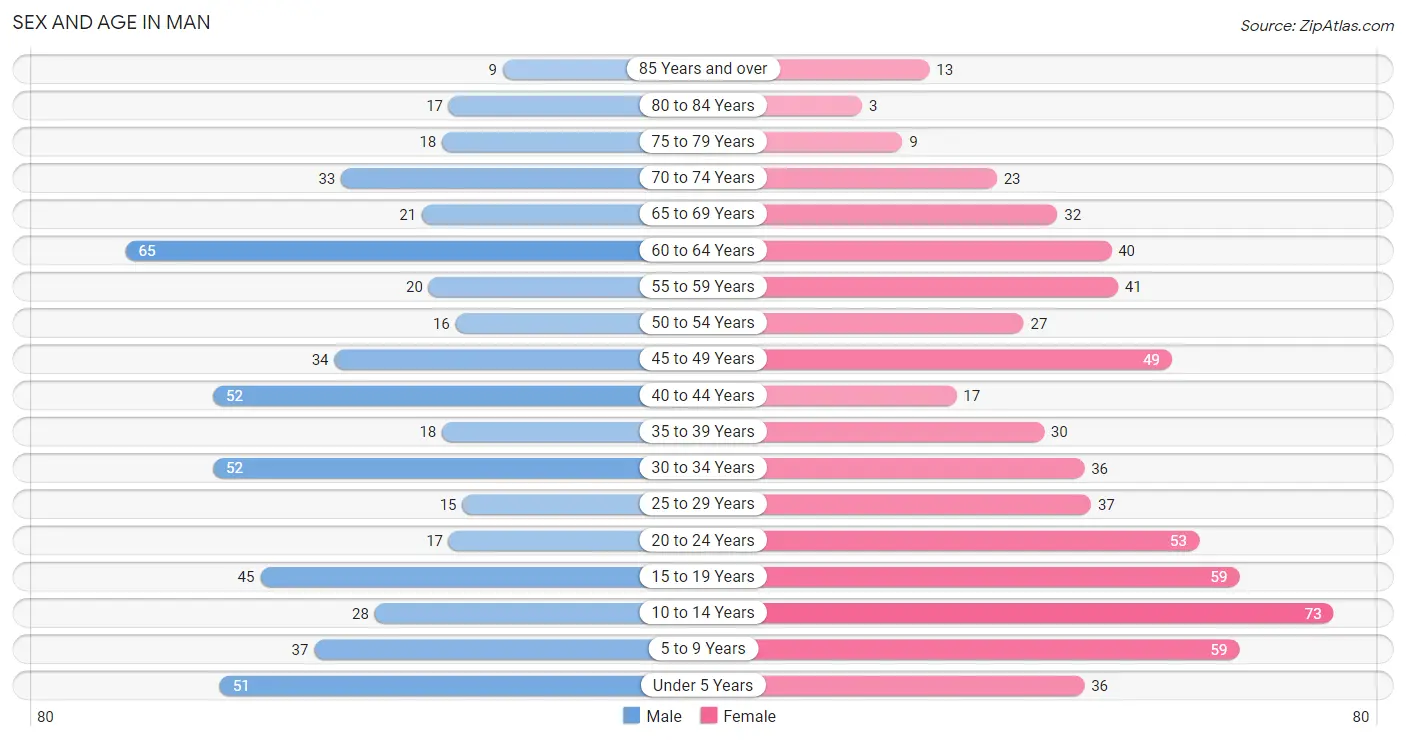
| Age Bracket | Male | Female |
| Under 5 Years | 51 (9.3%) | 36 (5.7%) |
| 5 to 9 Years | 37 (6.8%) | 59 (9.3%) |
| 10 to 14 Years | 28 (5.1%) | 73 (11.5%) |
| 15 to 19 Years | 45 (8.2%) | 59 (9.3%) |
| 20 to 24 Years | 17 (3.1%) | 53 (8.3%) |
| 25 to 29 Years | 15 (2.7%) | 37 (5.8%) |
| 30 to 34 Years | 52 (9.5%) | 36 (5.7%) |
| 35 to 39 Years | 18 (3.3%) | 30 (4.7%) |
| 40 to 44 Years | 52 (9.5%) | 17 (2.7%) |
| 45 to 49 Years | 34 (6.2%) | 49 (7.7%) |
| 50 to 54 Years | 16 (2.9%) | 27 (4.2%) |
| 55 to 59 Years | 20 (3.6%) | 41 (6.4%) |
| 60 to 64 Years | 65 (11.9%) | 40 (6.3%) |
| 65 to 69 Years | 21 (3.8%) | 32 (5.0%) |
| 70 to 74 Years | 33 (6.0%) | 23 (3.6%) |
| 75 to 79 Years | 18 (3.3%) | 9 (1.4%) |
| 80 to 84 Years | 17 (3.1%) | 3 (0.5%) |
| 85 Years and over | 9 (1.6%) | 13 (2.0%) |
| Total | 548 (100.0%) | 637 (100.0%) |
Families and Households in Man
Median Family Size in Man
The median family size in Man is 3.32 persons per family, with single female/mother families (46 | 15.0%) accounting for the largest median family size of 4.37 persons per family. On the other hand, single male/father families (31 | 10.1%) represent the smallest median family size with 2.81 persons per family.
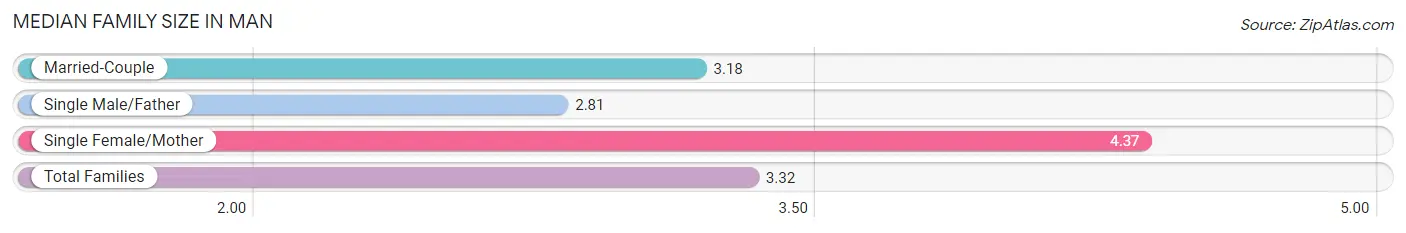
| Family Type | # Families | Family Size |
| Married-Couple | 230 (74.9%) | 3.18 |
| Single Male/Father | 31 (10.1%) | 2.81 |
| Single Female/Mother | 46 (15.0%) | 4.37 |
| Total Families | 307 (100.0%) | 3.32 |
Median Household Size in Man
The median household size in Man is 3.06 persons per household, with single female/mother households (46 | 11.9%) accounting for the largest median household size of 4.96 persons per household. non-family households (80 | 20.7%) represent the smallest median household size with 1.48 persons per household.
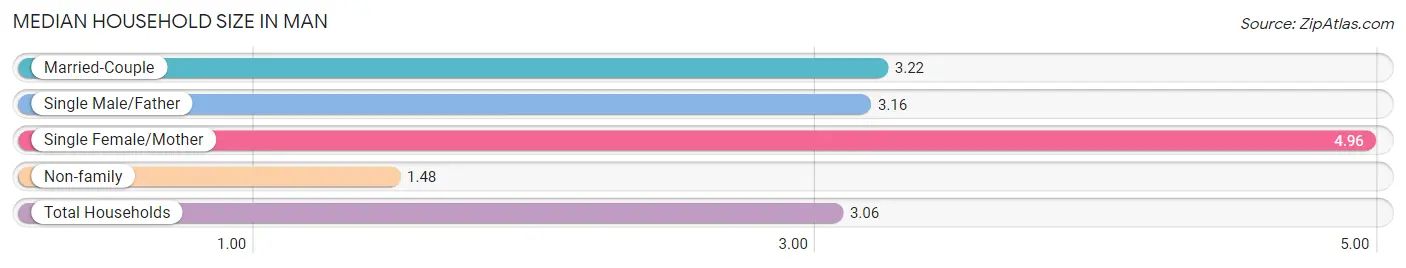
| Household Type | # Households | Household Size |
| Married-Couple | 230 (59.4%) | 3.22 |
| Single Male/Father | 31 (8.0%) | 3.16 |
| Single Female/Mother | 46 (11.9%) | 4.96 |
| Non-family | 80 (20.7%) | 1.48 |
| Total Households | 387 (100.0%) | 3.06 |
Household Size by Marriage Status in Man
Out of a total of 387 households in Man, 307 (79.3%) are family households, while 80 (20.7%) are nonfamily households. The most numerous type of family households are 2-person households, comprising 108, and the most common type of nonfamily households are 1-person households, comprising 65.
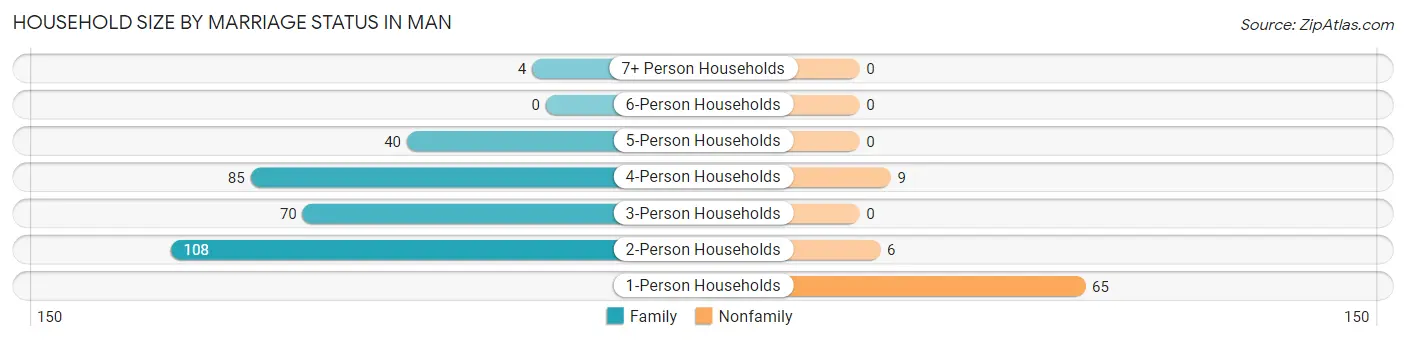
| Household Size | Family Households | Nonfamily Households |
| 1-Person Households | - | 65 (16.8%) |
| 2-Person Households | 108 (27.9%) | 6 (1.5%) |
| 3-Person Households | 70 (18.1%) | 0 (0.0%) |
| 4-Person Households | 85 (22.0%) | 9 (2.3%) |
| 5-Person Households | 40 (10.3%) | 0 (0.0%) |
| 6-Person Households | 0 (0.0%) | 0 (0.0%) |
| 7+ Person Households | 4 (1.0%) | 0 (0.0%) |
| Total | 307 (79.3%) | 80 (20.7%) |
Female Fertility in Man
Fertility by Age in Man
Average fertility rate in Man is 31.0 births per 1,000 women. Women in the age bracket of 20 to 34 years have the highest fertility rate with 71.0 births per 1,000 women. Women in the age bracket of 20 to 34 years acount for 100.0% of all women with births.
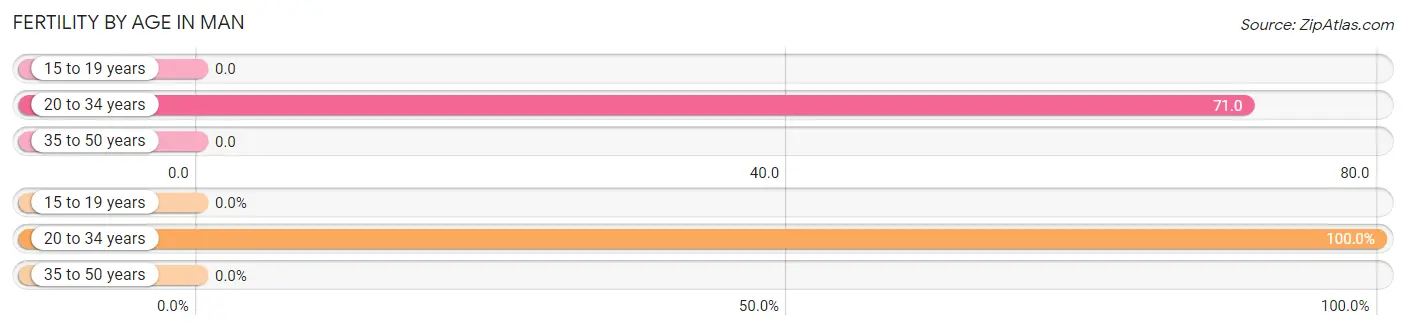
| Age Bracket | Women with Births | Births / 1,000 Women |
| 15 to 19 years | 0 (0.0%) | 0.0 |
| 20 to 34 years | 9 (100.0%) | 71.0 |
| 35 to 50 years | 0 (0.0%) | 0.0 |
| Total | 9 (100.0%) | 31.0 |
Fertility by Age by Marriage Status in Man
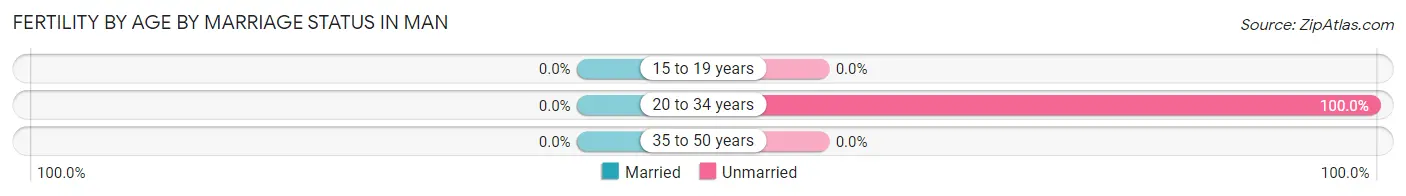
| Age Bracket | Married | Unmarried |
| 15 to 19 years | 0 (0.0%) | 0 (0.0%) |
| 20 to 34 years | 0 (0.0%) | 9 (100.0%) |
| 35 to 50 years | 0 (0.0%) | 0 (0.0%) |
| Total | 0 (0.0%) | 9 (100.0%) |
Fertility by Education in Man
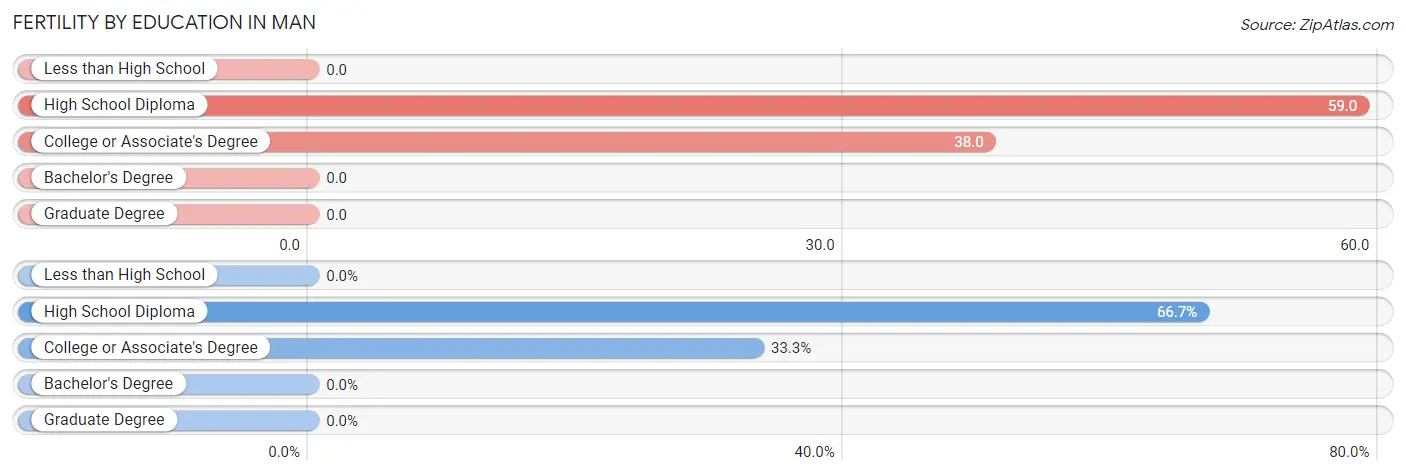
| Educational Attainment | Women with Births | Births / 1,000 Women |
| Less than High School | 0 (0.0%) | 0.0 |
| High School Diploma | 6 (66.7%) | 59.0 |
| College or Associate's Degree | 3 (33.3%) | 38.0 |
| Bachelor's Degree | 0 (0.0%) | 0.0 |
| Graduate Degree | 0 (0.0%) | 0.0 |
| Total | 9 (100.0%) | 31.0 |
Fertility by Education by Marriage Status in Man
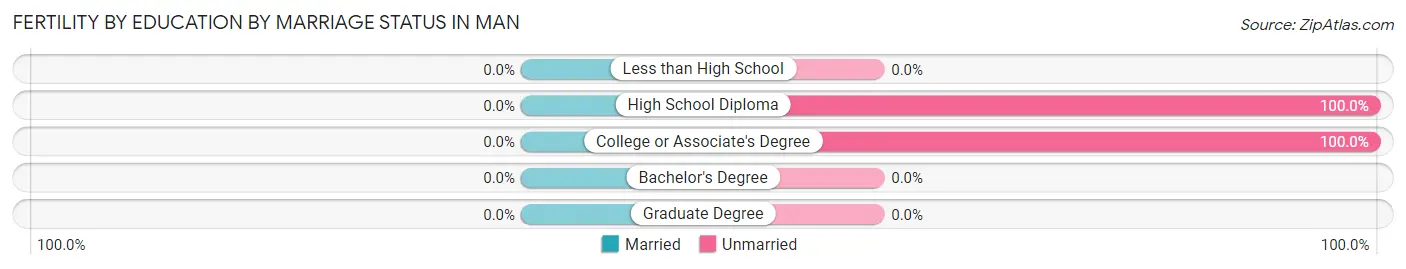
| Educational Attainment | Married | Unmarried |
| Less than High School | 0 (0.0%) | 0 (0.0%) |
| High School Diploma | 0 (0.0%) | 6 (100.0%) |
| College or Associate's Degree | 0 (0.0%) | 3 (100.0%) |
| Bachelor's Degree | 0 (0.0%) | 0 (0.0%) |
| Graduate Degree | 0 (0.0%) | 0 (0.0%) |
| Total | 0 (0.0%) | 9 (100.0%) |
Employment Characteristics in Man
Employment by Class of Employer in Man
Among the 350 employed individuals in Man, private company employees (233 | 66.6%), local government employees (48 | 13.7%), and self-employed (not incorporated) (20 | 5.7%) make up the most common classes of employment.
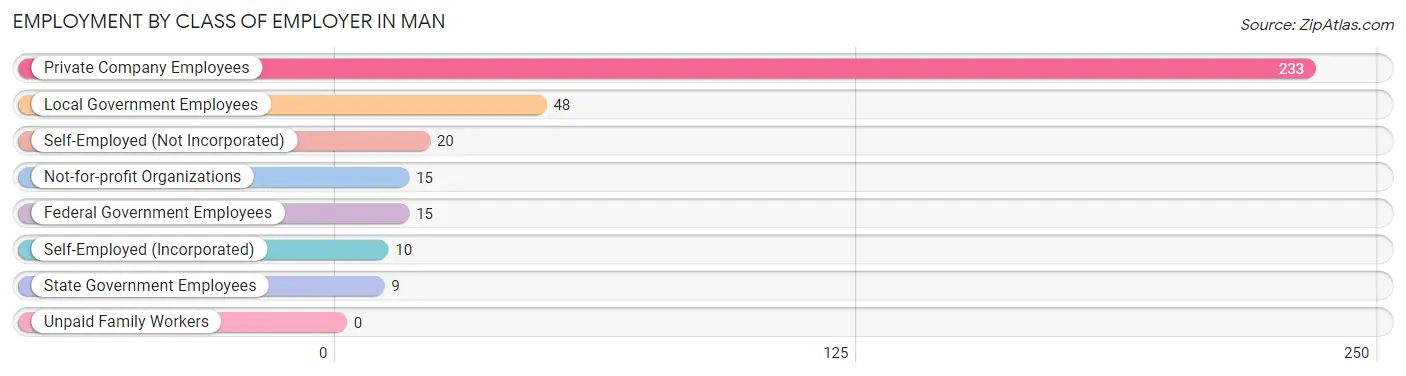
| Employer Class | # Employees | % Employees |
| Private Company Employees | 233 | 66.6% |
| Self-Employed (Incorporated) | 10 | 2.9% |
| Self-Employed (Not Incorporated) | 20 | 5.7% |
| Not-for-profit Organizations | 15 | 4.3% |
| Local Government Employees | 48 | 13.7% |
| State Government Employees | 9 | 2.6% |
| Federal Government Employees | 15 | 4.3% |
| Unpaid Family Workers | 0 | 0.0% |
| Total | 350 | 100.0% |
Employment Status by Age in Man
According to the labor force statistics for Man, out of the total population over 16 years of age (871), 50.4% or 439 individuals are in the labor force, with 18.5% or 81 of them unemployed. The age group with the highest labor force participation rate is 35 to 44 years, with 90.6% or 106 individuals in the labor force. Within the labor force, the 16 to 19 years age range has the highest percentage of unemployed individuals, with 54.5% or 12 of them being unemployed.
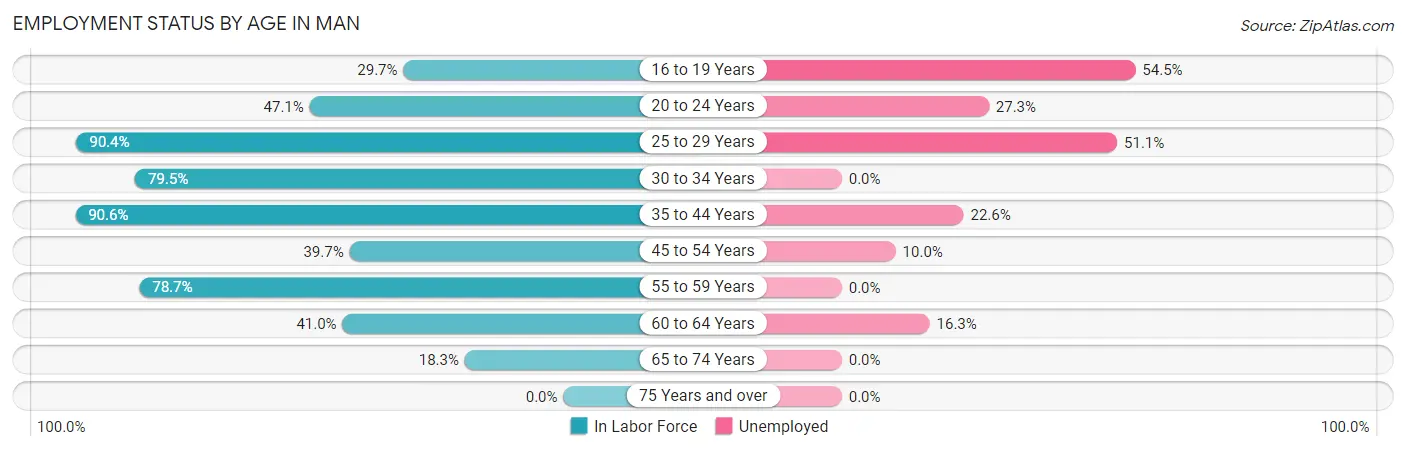
| Age Bracket | In Labor Force | Unemployed |
| 16 to 19 Years | 22 (29.7%) | 12 (54.5%) |
| 20 to 24 Years | 33 (47.1%) | 9 (27.3%) |
| 25 to 29 Years | 47 (90.4%) | 24 (51.1%) |
| 30 to 34 Years | 70 (79.5%) | 0 (0.0%) |
| 35 to 44 Years | 106 (90.6%) | 24 (22.6%) |
| 45 to 54 Years | 50 (39.7%) | 5 (10.0%) |
| 55 to 59 Years | 48 (78.7%) | 0 (0.0%) |
| 60 to 64 Years | 43 (41.0%) | 7 (16.3%) |
| 65 to 74 Years | 20 (18.3%) | 0 (0.0%) |
| 75 Years and over | 0 (0.0%) | 0 (0.0%) |
| Total | 439 (50.4%) | 81 (18.5%) |
Employment Status by Educational Attainment in Man
According to labor force statistics for Man, 66.3% of individuals (364) out of the total population between 25 and 64 years of age (549) are in the labor force, with 16.5% or 60 of them being unemployed. The group with the highest labor force participation rate are those with the educational attainment of college / associate degree, with 91.5% or 150 individuals in the labor force. Within the labor force, individuals with less than high school education have the highest percentage of unemployment, with 100.0% or 5 of them being unemployed.
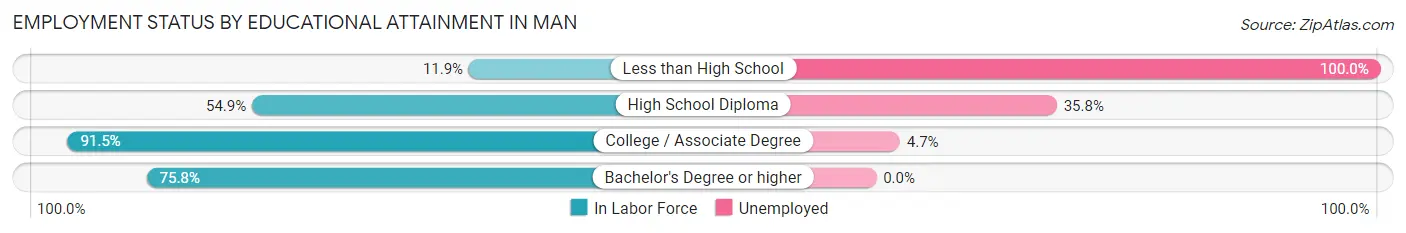
| Educational Attainment | In Labor Force | Unemployed |
| Less than High School | 5 (11.9%) | 42 (100.0%) |
| High School Diploma | 134 (54.9%) | 87 (35.8%) |
| College / Associate Degree | 150 (91.5%) | 8 (4.7%) |
| Bachelor's Degree or higher | 75 (75.8%) | 0 (0.0%) |
| Total | 364 (66.3%) | 91 (16.5%) |
Employment Occupations by Sex in Man
Management, Business, Science and Arts Occupations
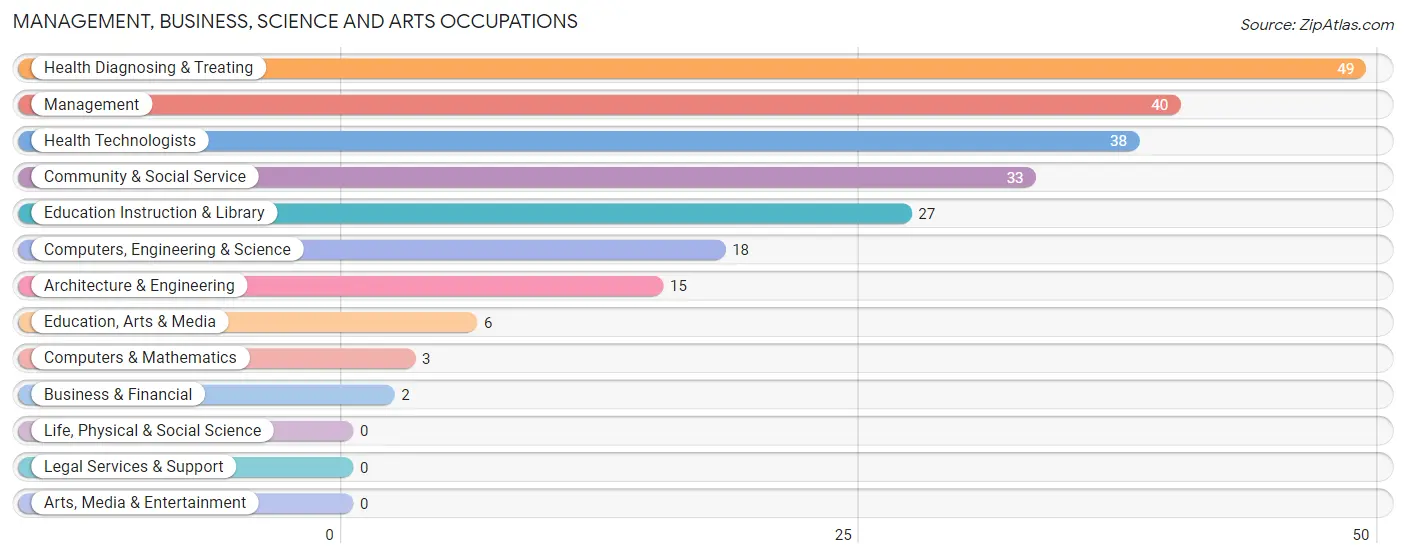
The most common Management, Business, Science and Arts occupations in Man are Health Diagnosing & Treating (49 | 13.7%), Management (40 | 11.2%), Health Technologists (38 | 10.6%), Community & Social Service (33 | 9.2%), and Education Instruction & Library (27 | 7.5%).
Management, Business, Science and Arts Occupations by Sex
Within the Management, Business, Science and Arts occupations in Man, the most male-oriented occupations are Business & Financial (100.0%), Computers, Engineering & Science (100.0%), and Computers & Mathematics (100.0%), while the most female-oriented occupations are Education Instruction & Library (100.0%), Community & Social Service (81.8%), and Management (70.0%).
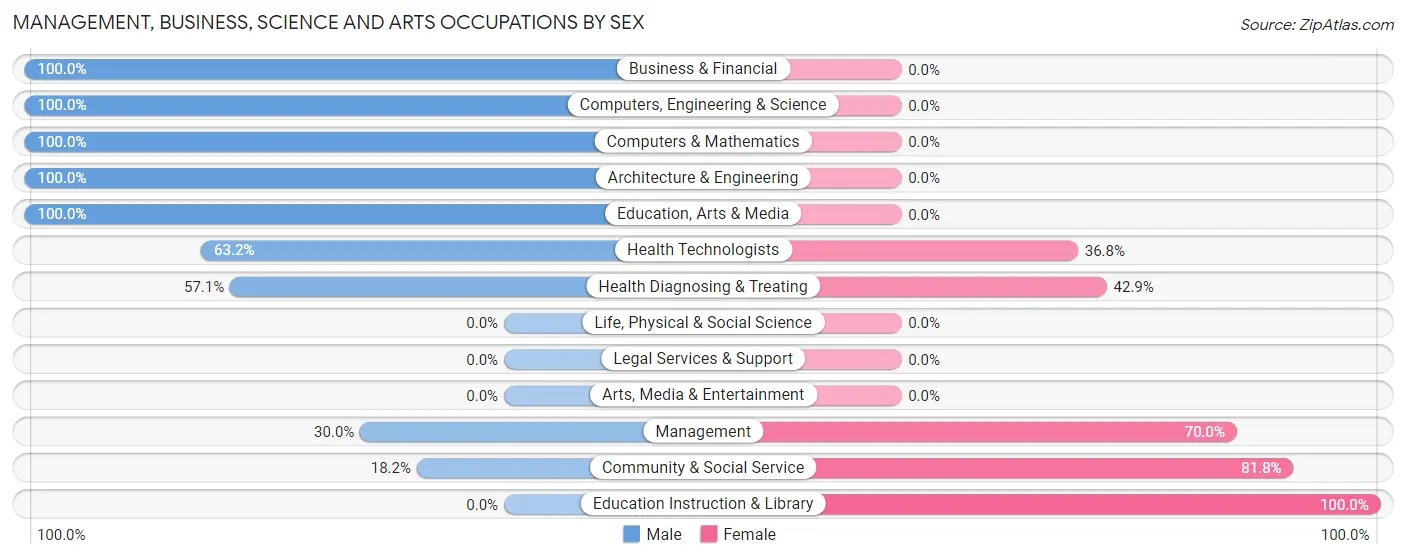
| Occupation | Male | Female |
| Management | 12 (30.0%) | 28 (70.0%) |
| Business & Financial | 2 (100.0%) | 0 (0.0%) |
| Computers, Engineering & Science | 18 (100.0%) | 0 (0.0%) |
| Computers & Mathematics | 3 (100.0%) | 0 (0.0%) |
| Architecture & Engineering | 15 (100.0%) | 0 (0.0%) |
| Life, Physical & Social Science | 0 (0.0%) | 0 (0.0%) |
| Community & Social Service | 6 (18.2%) | 27 (81.8%) |
| Education, Arts & Media | 6 (100.0%) | 0 (0.0%) |
| Legal Services & Support | 0 (0.0%) | 0 (0.0%) |
| Education Instruction & Library | 0 (0.0%) | 27 (100.0%) |
| Arts, Media & Entertainment | 0 (0.0%) | 0 (0.0%) |
| Health Diagnosing & Treating | 28 (57.1%) | 21 (42.9%) |
| Health Technologists | 24 (63.2%) | 14 (36.8%) |
| Total (Category) | 66 (46.5%) | 76 (53.5%) |
| Total (Overall) | 186 (52.0%) | 172 (48.0%) |
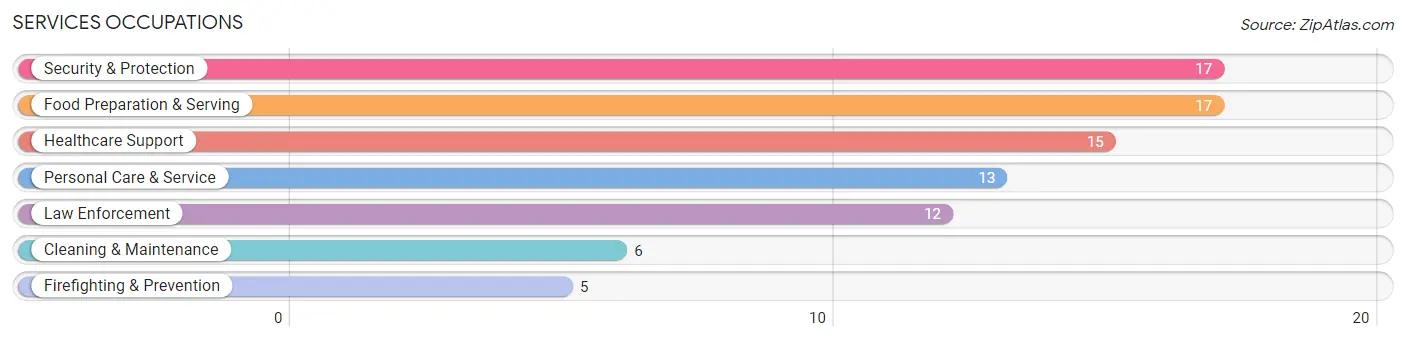
Services Occupations
The most common Services occupations in Man are Security & Protection (17 | 4.8%), Food Preparation & Serving (17 | 4.8%), Healthcare Support (15 | 4.2%), Personal Care & Service (13 | 3.6%), and Law Enforcement (12 | 3.4%).
Services Occupations by Sex
Within the Services occupations in Man, the most male-oriented occupations are Security & Protection (100.0%), Firefighting & Prevention (100.0%), and Law Enforcement (100.0%), while the most female-oriented occupations are Healthcare Support (100.0%), Personal Care & Service (100.0%), and Food Preparation & Serving (64.7%).
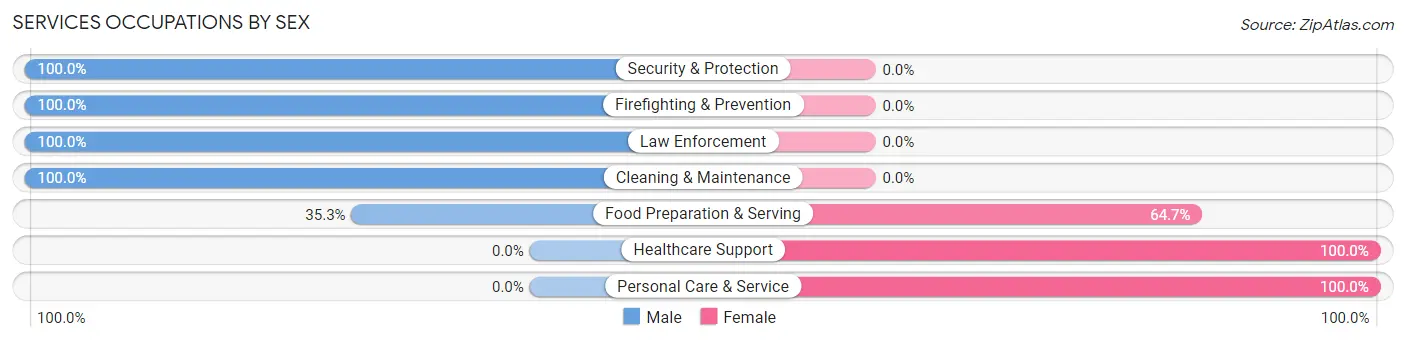
| Occupation | Male | Female |
| Healthcare Support | 0 (0.0%) | 15 (100.0%) |
| Security & Protection | 17 (100.0%) | 0 (0.0%) |
| Firefighting & Prevention | 5 (100.0%) | 0 (0.0%) |
| Law Enforcement | 12 (100.0%) | 0 (0.0%) |
| Food Preparation & Serving | 6 (35.3%) | 11 (64.7%) |
| Cleaning & Maintenance | 6 (100.0%) | 0 (0.0%) |
| Personal Care & Service | 0 (0.0%) | 13 (100.0%) |
| Total (Category) | 29 (42.6%) | 39 (57.4%) |
| Total (Overall) | 186 (52.0%) | 172 (48.0%) |
Sales and Office Occupations
The most common Sales and Office occupations in Man are Office & Administration (44 | 12.3%), and Sales & Related (26 | 7.3%).

Sales and Office Occupations by Sex

| Occupation | Male | Female |
| Sales & Related | 13 (50.0%) | 13 (50.0%) |
| Office & Administration | 0 (0.0%) | 44 (100.0%) |
| Total (Category) | 13 (18.6%) | 57 (81.4%) |
| Total (Overall) | 186 (52.0%) | 172 (48.0%) |
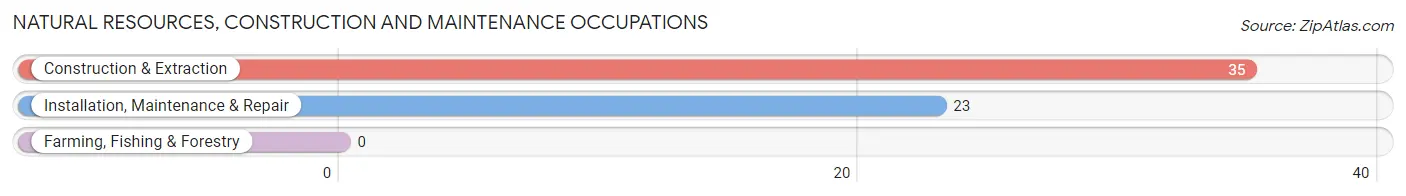
Natural Resources, Construction and Maintenance Occupations
The most common Natural Resources, Construction and Maintenance occupations in Man are Construction & Extraction (35 | 9.8%), and Installation, Maintenance & Repair (23 | 6.4%).
Natural Resources, Construction and Maintenance Occupations by Sex

| Occupation | Male | Female |
| Farming, Fishing & Forestry | 0 (0.0%) | 0 (0.0%) |
| Construction & Extraction | 35 (100.0%) | 0 (0.0%) |
| Installation, Maintenance & Repair | 23 (100.0%) | 0 (0.0%) |
| Total (Category) | 58 (100.0%) | 0 (0.0%) |
| Total (Overall) | 186 (52.0%) | 172 (48.0%) |
Production, Transportation and Moving Occupations
The most common Production, Transportation and Moving occupations in Man are Transportation (12 | 3.4%), and Production (8 | 2.2%).
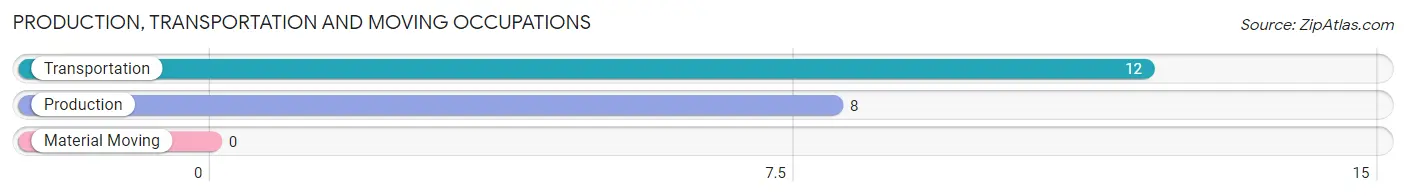
Production, Transportation and Moving Occupations by Sex
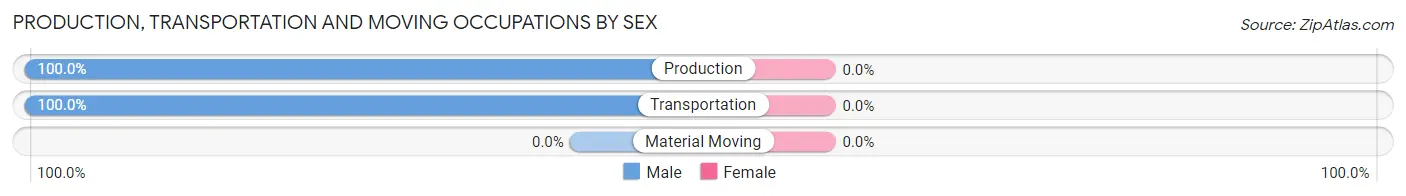
| Occupation | Male | Female |
| Production | 8 (100.0%) | 0 (0.0%) |
| Transportation | 12 (100.0%) | 0 (0.0%) |
| Material Moving | 0 (0.0%) | 0 (0.0%) |
| Total (Category) | 20 (100.0%) | 0 (0.0%) |
| Total (Overall) | 186 (52.0%) | 172 (48.0%) |
Employment Industries by Sex in Man
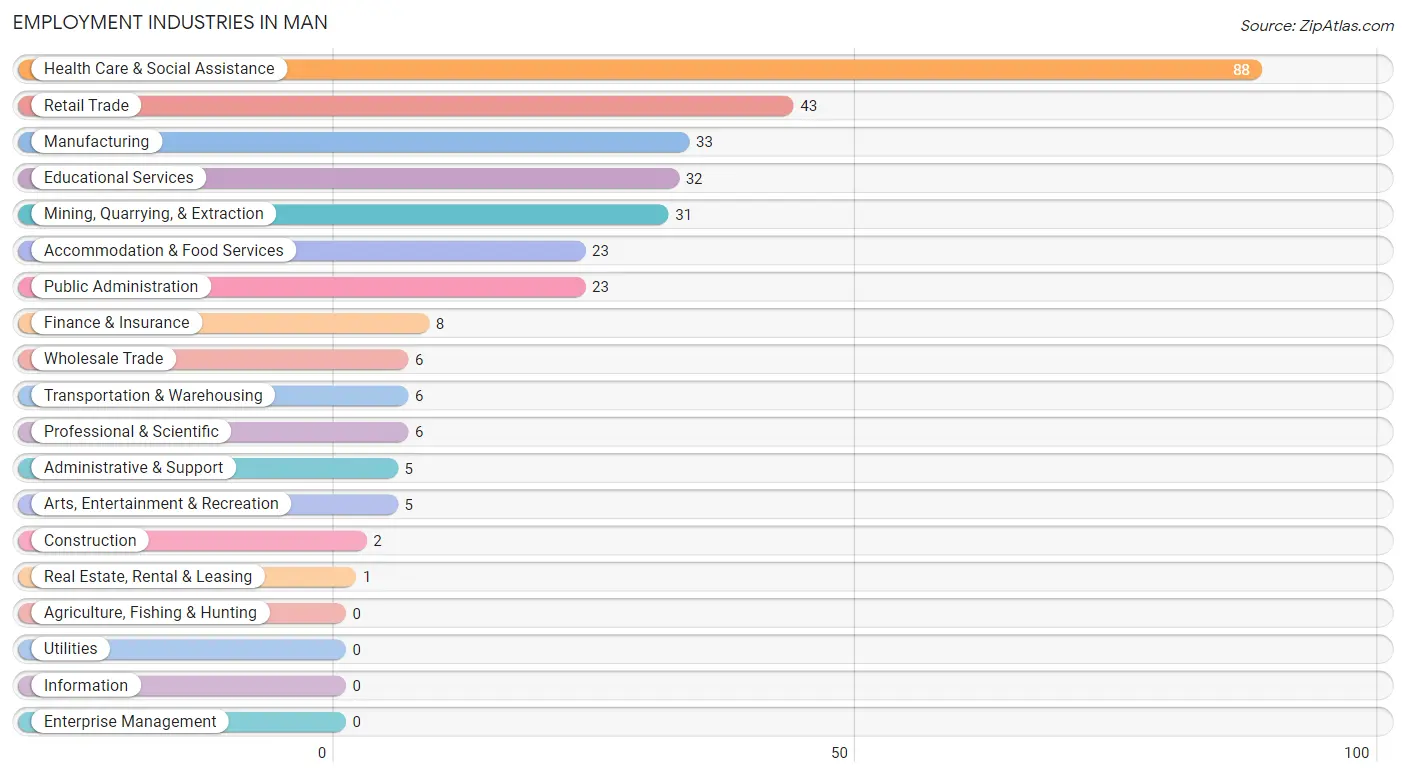
Employment Industries in Man
The major employment industries in Man include Health Care & Social Assistance (88 | 24.6%), Retail Trade (43 | 12.0%), Manufacturing (33 | 9.2%), Educational Services (32 | 8.9%), and Mining, Quarrying, & Extraction (31 | 8.7%).
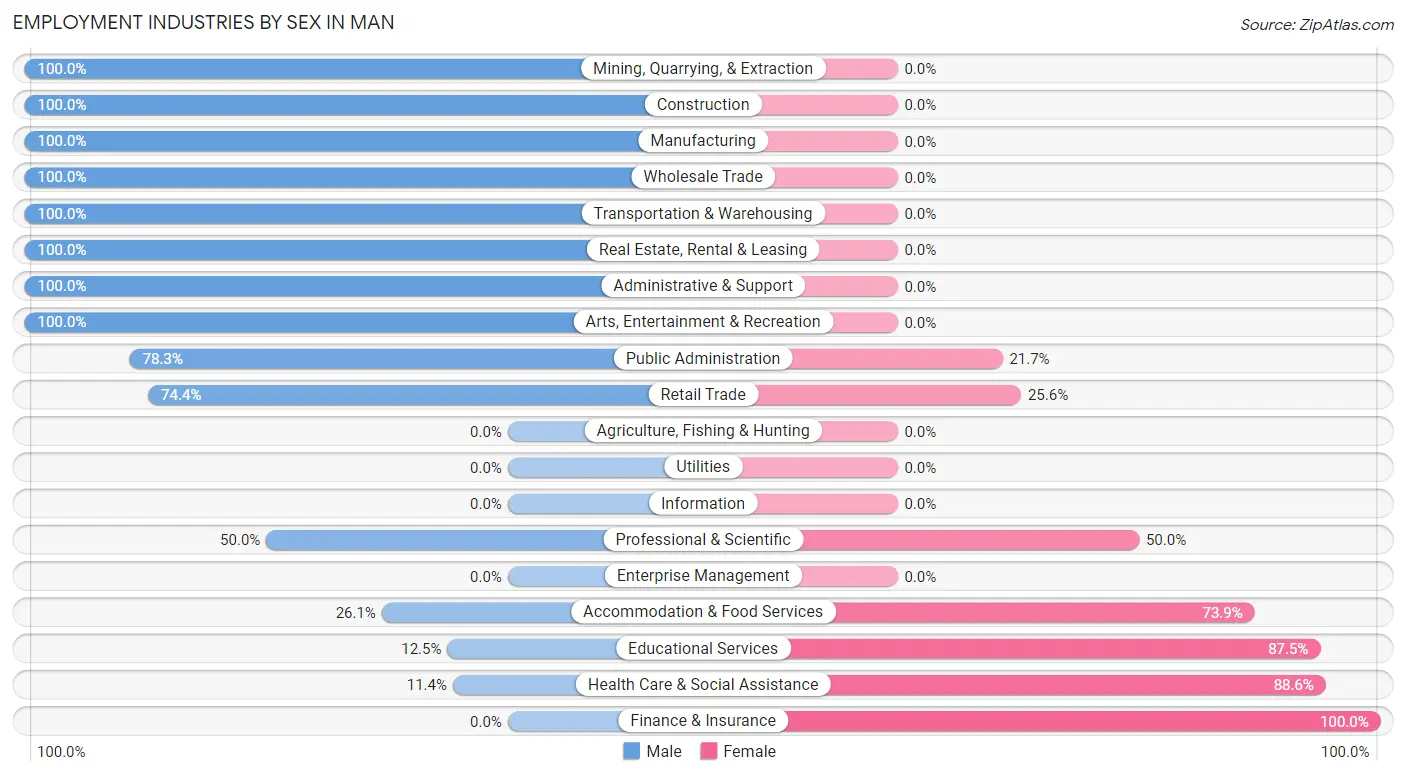
Employment Industries by Sex in Man
The Man industries that see more men than women are Mining, Quarrying, & Extraction (100.0%), Construction (100.0%), and Manufacturing (100.0%), whereas the industries that tend to have a higher number of women are Finance & Insurance (100.0%), Health Care & Social Assistance (88.6%), and Educational Services (87.5%).
| Industry | Male | Female |
| Agriculture, Fishing & Hunting | 0 (0.0%) | 0 (0.0%) |
| Mining, Quarrying, & Extraction | 31 (100.0%) | 0 (0.0%) |
| Construction | 2 (100.0%) | 0 (0.0%) |
| Manufacturing | 33 (100.0%) | 0 (0.0%) |
| Wholesale Trade | 6 (100.0%) | 0 (0.0%) |
| Retail Trade | 32 (74.4%) | 11 (25.6%) |
| Transportation & Warehousing | 6 (100.0%) | 0 (0.0%) |
| Utilities | 0 (0.0%) | 0 (0.0%) |
| Information | 0 (0.0%) | 0 (0.0%) |
| Finance & Insurance | 0 (0.0%) | 8 (100.0%) |
| Real Estate, Rental & Leasing | 1 (100.0%) | 0 (0.0%) |
| Professional & Scientific | 3 (50.0%) | 3 (50.0%) |
| Enterprise Management | 0 (0.0%) | 0 (0.0%) |
| Administrative & Support | 5 (100.0%) | 0 (0.0%) |
| Educational Services | 4 (12.5%) | 28 (87.5%) |
| Health Care & Social Assistance | 10 (11.4%) | 78 (88.6%) |
| Arts, Entertainment & Recreation | 5 (100.0%) | 0 (0.0%) |
| Accommodation & Food Services | 6 (26.1%) | 17 (73.9%) |
| Public Administration | 18 (78.3%) | 5 (21.7%) |
| Total | 186 (52.0%) | 172 (48.0%) |
Education in Man
School Enrollment in Man
The most common levels of schooling among the 297 students in Man are middle school (101 | 34.0%), elementary school (76 | 25.6%), and high school (59 | 19.9%).
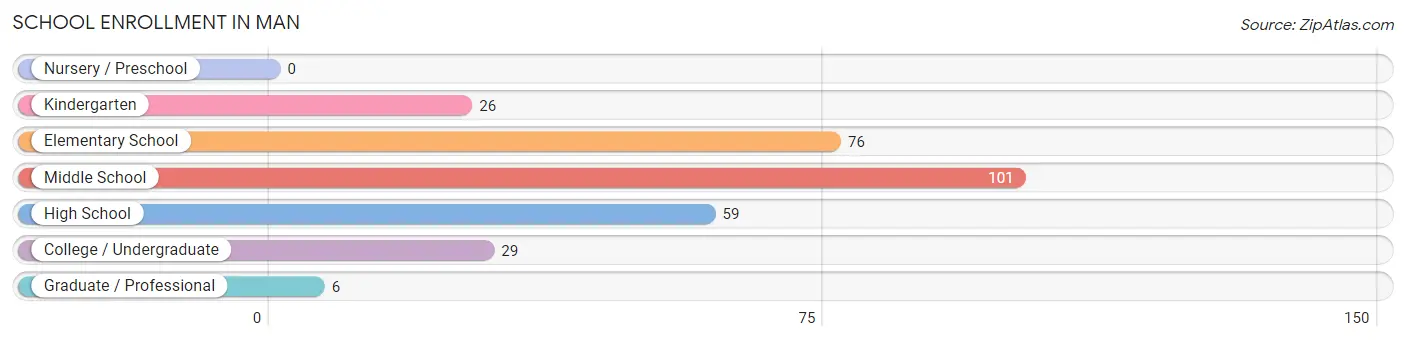
| School Level | # Students | % Students |
| Nursery / Preschool | 0 | 0.0% |
| Kindergarten | 26 | 8.7% |
| Elementary School | 76 | 25.6% |
| Middle School | 101 | 34.0% |
| High School | 59 | 19.9% |
| College / Undergraduate | 29 | 9.8% |
| Graduate / Professional | 6 | 2.0% |
| Total | 297 | 100.0% |
School Enrollment by Age by Funding Source in Man
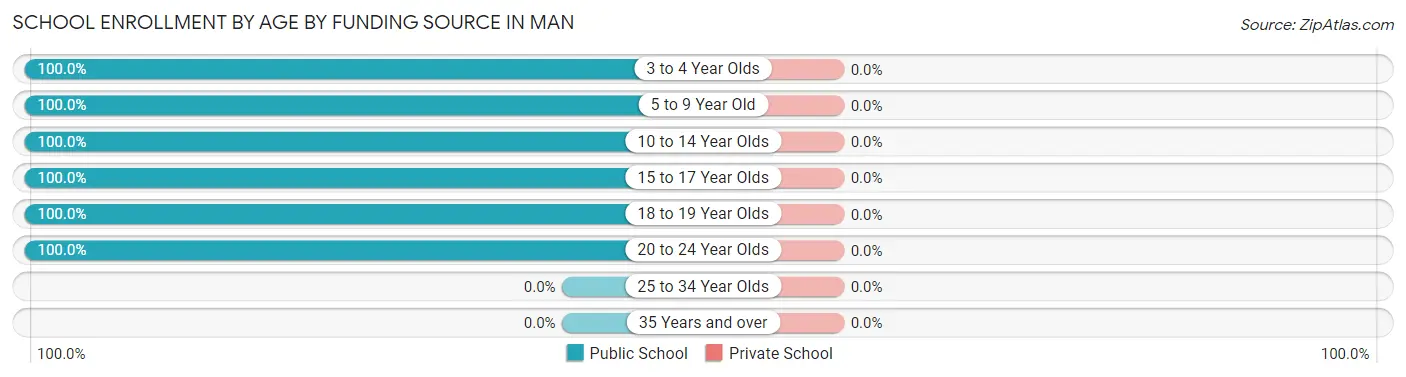
| Age Bracket | Public School | Private School |
| 3 to 4 Year Olds | 9 (100.0%) | 0 (0.0%) |
| 5 to 9 Year Old | 88 (100.0%) | 0 (0.0%) |
| 10 to 14 Year Olds | 101 (100.0%) | 0 (0.0%) |
| 15 to 17 Year Olds | 54 (100.0%) | 0 (0.0%) |
| 18 to 19 Year Olds | 32 (100.0%) | 0 (0.0%) |
| 20 to 24 Year Olds | 13 (100.0%) | 0 (0.0%) |
| 25 to 34 Year Olds | 0 (0.0%) | 0 (0.0%) |
| 35 Years and over | 0 (0.0%) | 0 (0.0%) |
| Total | 297 (100.0%) | 0 (0.0%) |
Educational Attainment by Field of Study in Man
Science & technology (37 | 25.9%), education (36 | 25.2%), bio, nature & agricultural (20 | 14.0%), engineering (15 | 10.5%), and business (15 | 10.5%) are the most common fields of study among 143 individuals in Man who have obtained a bachelor's degree or higher.
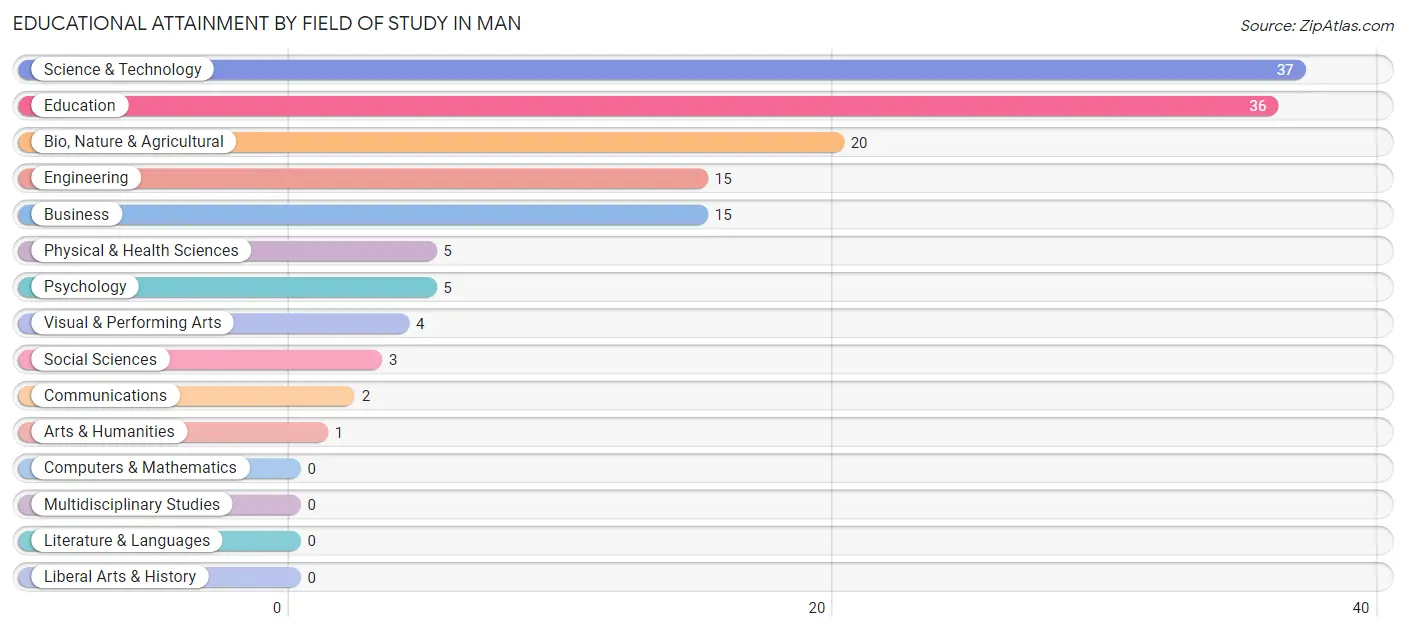
| Field of Study | # Graduates | % Graduates |
| Computers & Mathematics | 0 | 0.0% |
| Bio, Nature & Agricultural | 20 | 14.0% |
| Physical & Health Sciences | 5 | 3.5% |
| Psychology | 5 | 3.5% |
| Social Sciences | 3 | 2.1% |
| Engineering | 15 | 10.5% |
| Multidisciplinary Studies | 0 | 0.0% |
| Science & Technology | 37 | 25.9% |
| Business | 15 | 10.5% |
| Education | 36 | 25.2% |
| Literature & Languages | 0 | 0.0% |
| Liberal Arts & History | 0 | 0.0% |
| Visual & Performing Arts | 4 | 2.8% |
| Communications | 2 | 1.4% |
| Arts & Humanities | 1 | 0.7% |
| Total | 143 | 100.0% |
Transportation & Commute in Man
Vehicle Availability by Sex in Man
The most prevalent vehicle ownership categories in Man are males with 2 vehicles (76, accounting for 40.9%) and females with 2 vehicles (83, making up 46.3%).
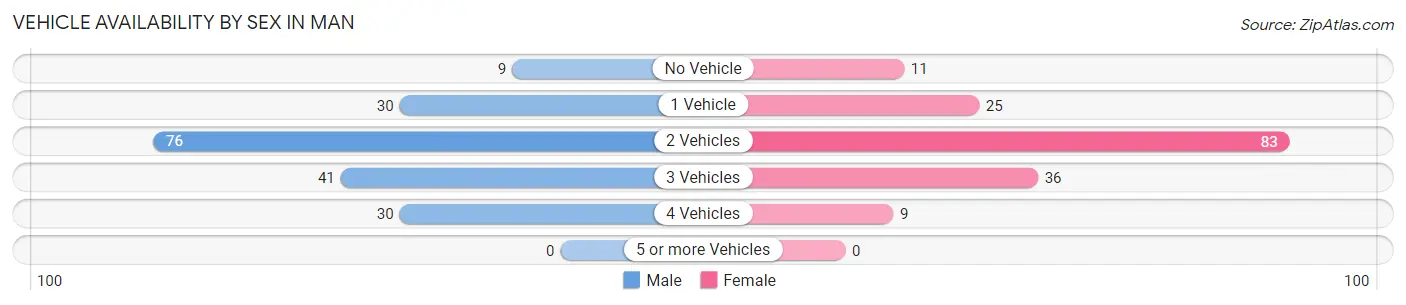
| Vehicles Available | Male | Female |
| No Vehicle | 9 (4.8%) | 11 (6.7%) |
| 1 Vehicle | 30 (16.1%) | 25 (15.2%) |
| 2 Vehicles | 76 (40.9%) | 83 (50.6%) |
| 3 Vehicles | 41 (22.0%) | 36 (22.0%) |
| 4 Vehicles | 30 (16.1%) | 9 (5.5%) |
| 5 or more Vehicles | 0 (0.0%) | 0 (0.0%) |
| Total | 186 (100.0%) | 164 (100.0%) |
Commute Time in Man
The most frequently occuring commute durations in Man are 20 to 24 minutes (67 commuters, 20.6%), less than 5 minutes (47 commuters, 14.5%), and 10 to 14 minutes (45 commuters, 13.9%).
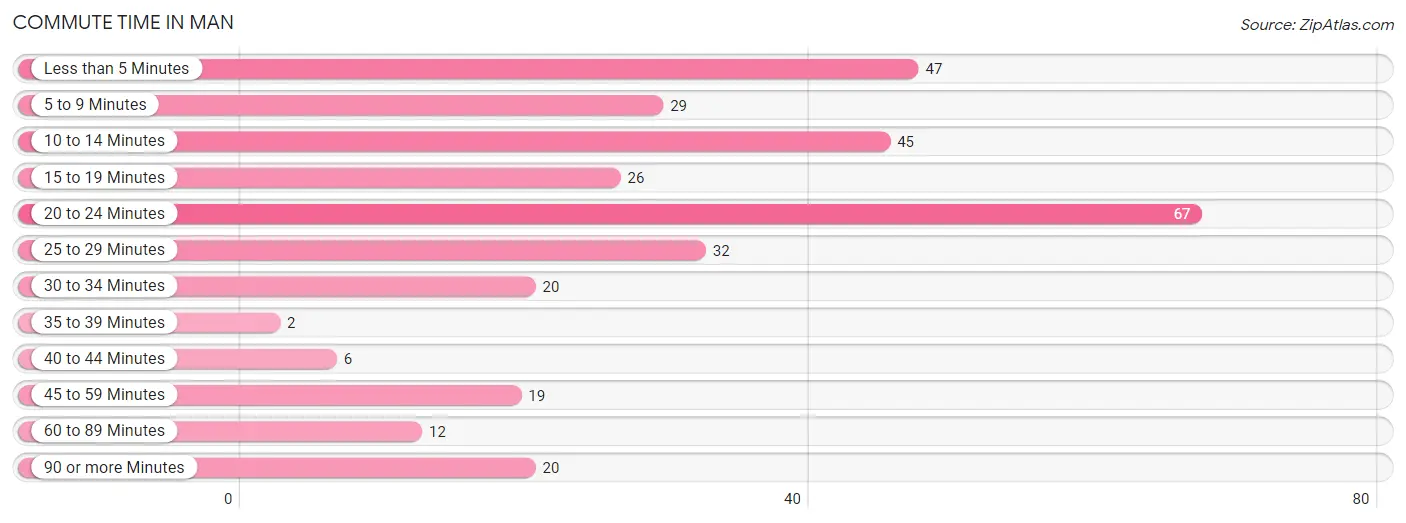
| Commute Time | # Commuters | % Commuters |
| Less than 5 Minutes | 47 | 14.5% |
| 5 to 9 Minutes | 29 | 8.9% |
| 10 to 14 Minutes | 45 | 13.9% |
| 15 to 19 Minutes | 26 | 8.0% |
| 20 to 24 Minutes | 67 | 20.6% |
| 25 to 29 Minutes | 32 | 9.9% |
| 30 to 34 Minutes | 20 | 6.1% |
| 35 to 39 Minutes | 2 | 0.6% |
| 40 to 44 Minutes | 6 | 1.8% |
| 45 to 59 Minutes | 19 | 5.9% |
| 60 to 89 Minutes | 12 | 3.7% |
| 90 or more Minutes | 20 | 6.1% |
Commute Time by Sex in Man
The most common commute times in Man are 10 to 14 minutes (23 commuters, 13.5%) for males and 20 to 24 minutes (50 commuters, 32.3%) for females.
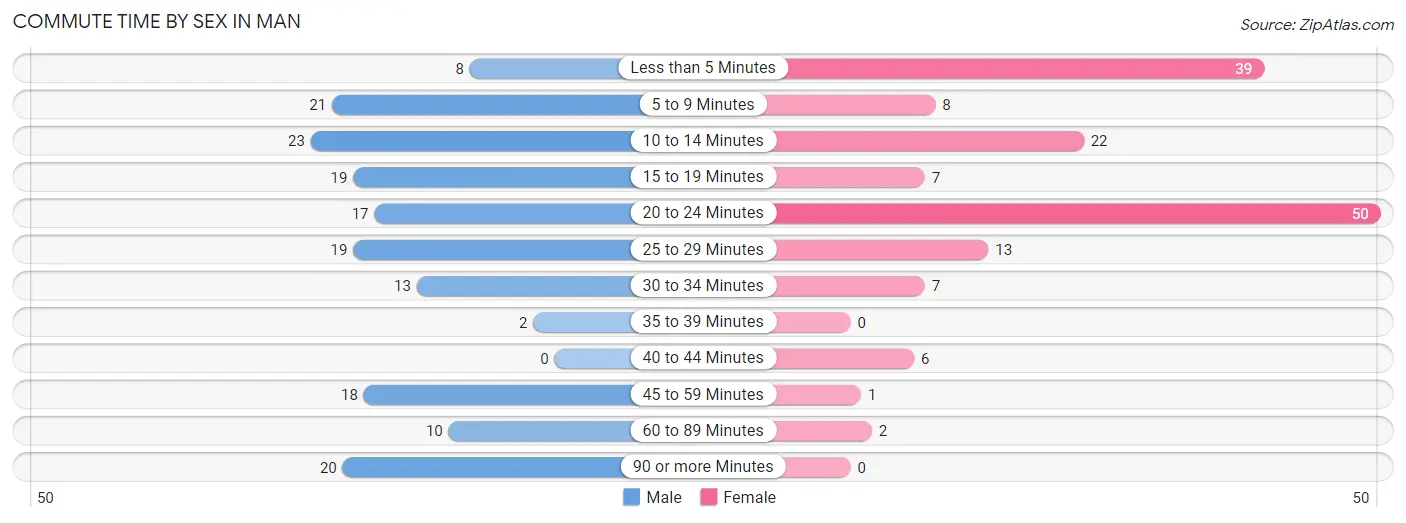
| Commute Time | Male | Female |
| Less than 5 Minutes | 8 (4.7%) | 39 (25.2%) |
| 5 to 9 Minutes | 21 (12.3%) | 8 (5.2%) |
| 10 to 14 Minutes | 23 (13.5%) | 22 (14.2%) |
| 15 to 19 Minutes | 19 (11.2%) | 7 (4.5%) |
| 20 to 24 Minutes | 17 (10.0%) | 50 (32.3%) |
| 25 to 29 Minutes | 19 (11.2%) | 13 (8.4%) |
| 30 to 34 Minutes | 13 (7.6%) | 7 (4.5%) |
| 35 to 39 Minutes | 2 (1.2%) | 0 (0.0%) |
| 40 to 44 Minutes | 0 (0.0%) | 6 (3.9%) |
| 45 to 59 Minutes | 18 (10.6%) | 1 (0.6%) |
| 60 to 89 Minutes | 10 (5.9%) | 2 (1.3%) |
| 90 or more Minutes | 20 (11.8%) | 0 (0.0%) |
Time of Departure to Work by Sex in Man
The most frequent times of departure to work in Man are 7:30 AM to 7:59 AM (32, 18.8%) for males and 7:30 AM to 7:59 AM (35, 22.6%) for females.
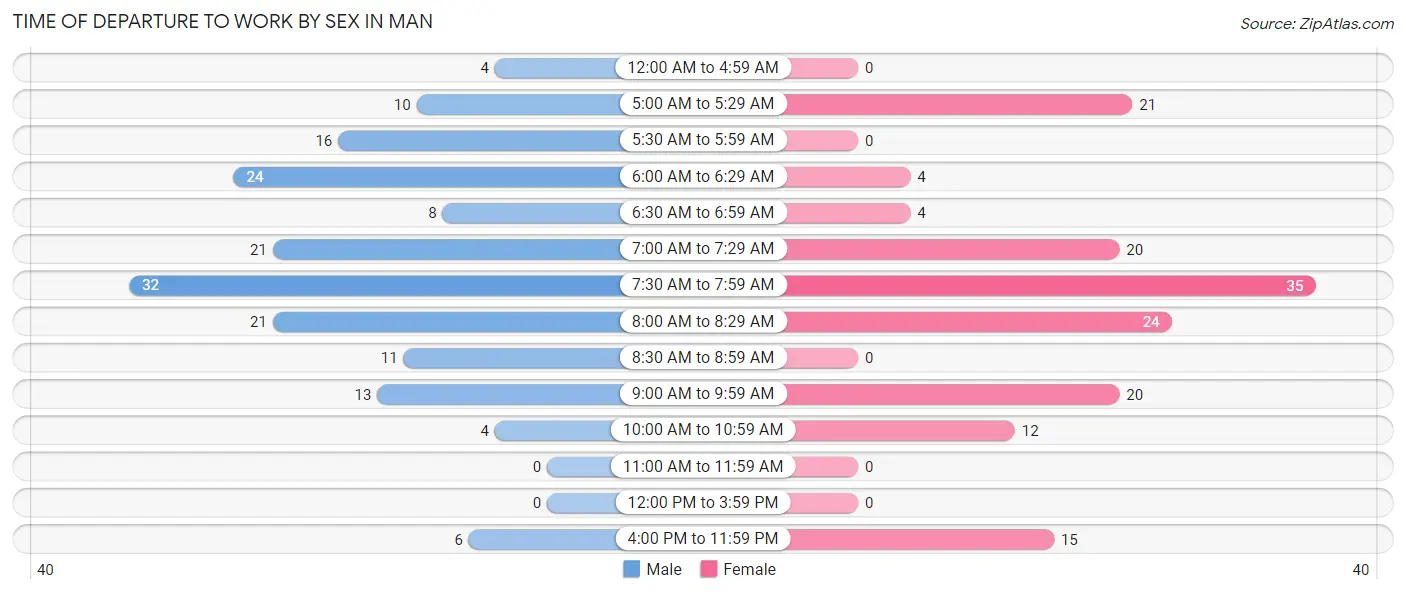
| Time of Departure | Male | Female |
| 12:00 AM to 4:59 AM | 4 (2.4%) | 0 (0.0%) |
| 5:00 AM to 5:29 AM | 10 (5.9%) | 21 (13.6%) |
| 5:30 AM to 5:59 AM | 16 (9.4%) | 0 (0.0%) |
| 6:00 AM to 6:29 AM | 24 (14.1%) | 4 (2.6%) |
| 6:30 AM to 6:59 AM | 8 (4.7%) | 4 (2.6%) |
| 7:00 AM to 7:29 AM | 21 (12.3%) | 20 (12.9%) |
| 7:30 AM to 7:59 AM | 32 (18.8%) | 35 (22.6%) |
| 8:00 AM to 8:29 AM | 21 (12.3%) | 24 (15.5%) |
| 8:30 AM to 8:59 AM | 11 (6.5%) | 0 (0.0%) |
| 9:00 AM to 9:59 AM | 13 (7.6%) | 20 (12.9%) |
| 10:00 AM to 10:59 AM | 4 (2.4%) | 12 (7.7%) |
| 11:00 AM to 11:59 AM | 0 (0.0%) | 0 (0.0%) |
| 12:00 PM to 3:59 PM | 0 (0.0%) | 0 (0.0%) |
| 4:00 PM to 11:59 PM | 6 (3.5%) | 15 (9.7%) |
| Total | 170 (100.0%) | 155 (100.0%) |
Housing Occupancy in Man
Occupancy by Ownership in Man
Of the total 387 dwellings in Man, owner-occupied units account for 305 (78.8%), while renter-occupied units make up 82 (21.2%).
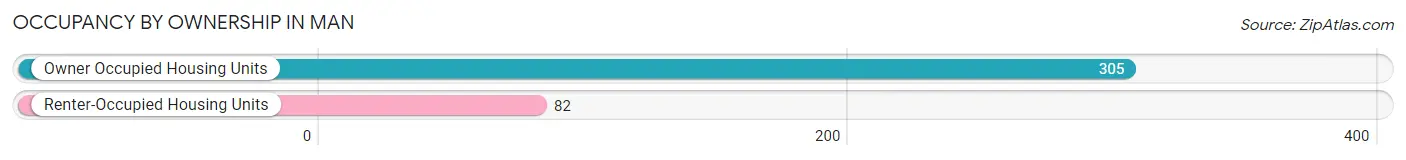
| Occupancy | # Housing Units | % Housing Units |
| Owner Occupied Housing Units | 305 | 78.8% |
| Renter-Occupied Housing Units | 82 | 21.2% |
| Total Occupied Housing Units | 387 | 100.0% |
Occupancy by Household Size in Man
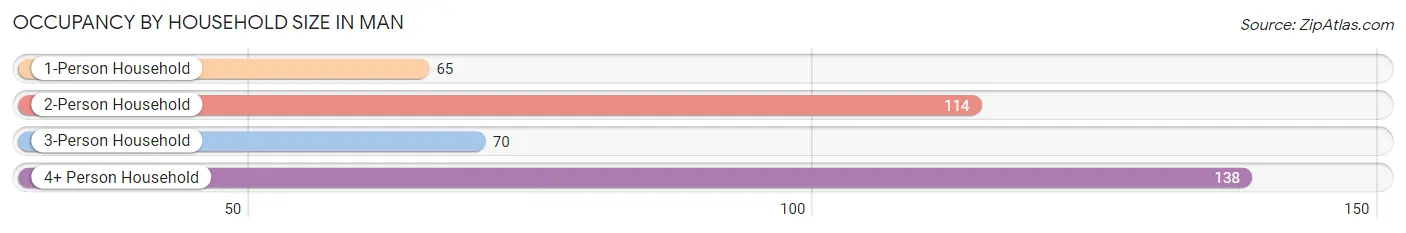
| Household Size | # Housing Units | % Housing Units |
| 1-Person Household | 65 | 16.8% |
| 2-Person Household | 114 | 29.5% |
| 3-Person Household | 70 | 18.1% |
| 4+ Person Household | 138 | 35.7% |
| Total Housing Units | 387 | 100.0% |
Occupancy by Ownership by Household Size in Man
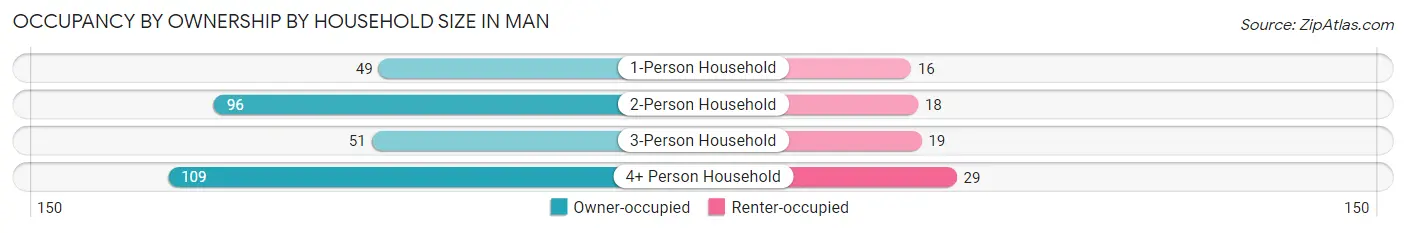
| Household Size | Owner-occupied | Renter-occupied |
| 1-Person Household | 49 (75.4%) | 16 (24.6%) |
| 2-Person Household | 96 (84.2%) | 18 (15.8%) |
| 3-Person Household | 51 (72.9%) | 19 (27.1%) |
| 4+ Person Household | 109 (79.0%) | 29 (21.0%) |
| Total Housing Units | 305 (78.8%) | 82 (21.2%) |
Occupancy by Educational Attainment in Man
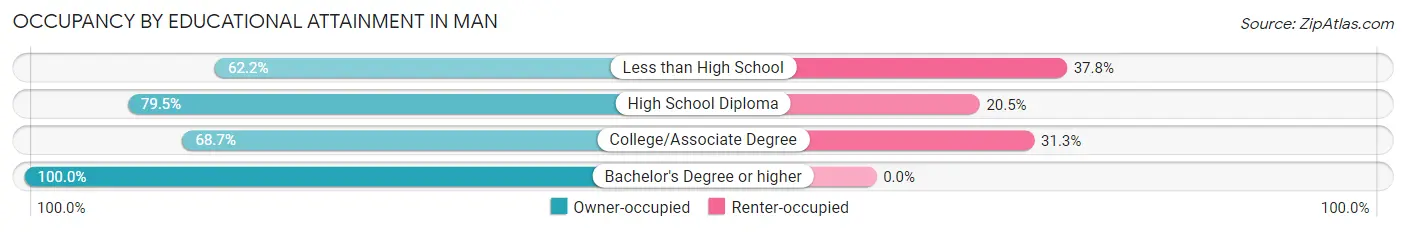
| Household Size | Owner-occupied | Renter-occupied |
| Less than High School | 28 (62.2%) | 17 (37.8%) |
| High School Diploma | 132 (79.5%) | 34 (20.5%) |
| College/Associate Degree | 68 (68.7%) | 31 (31.3%) |
| Bachelor's Degree or higher | 77 (100.0%) | 0 (0.0%) |
Occupancy by Age of Householder in Man
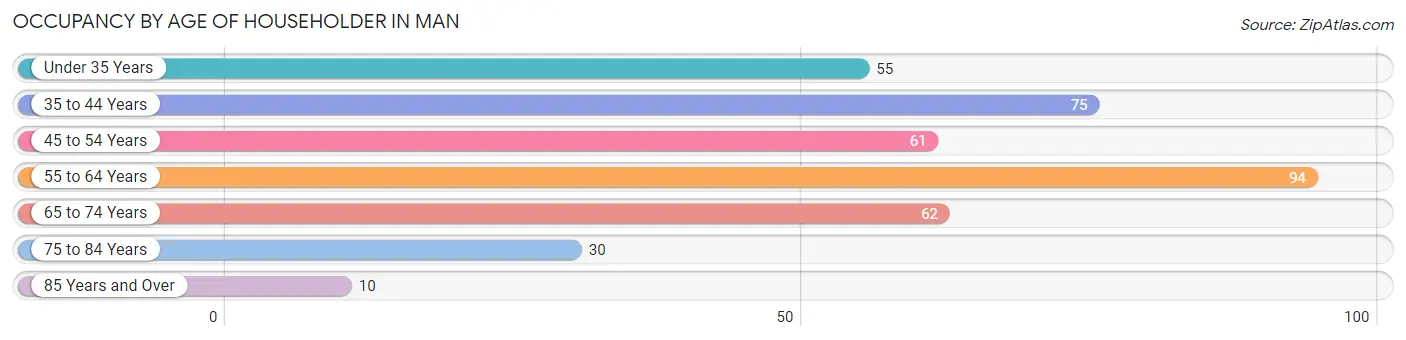
| Age Bracket | # Households | % Households |
| Under 35 Years | 55 | 14.2% |
| 35 to 44 Years | 75 | 19.4% |
| 45 to 54 Years | 61 | 15.8% |
| 55 to 64 Years | 94 | 24.3% |
| 65 to 74 Years | 62 | 16.0% |
| 75 to 84 Years | 30 | 7.7% |
| 85 Years and Over | 10 | 2.6% |
| Total | 387 | 100.0% |
Housing Finances in Man
Median Income by Occupancy in Man
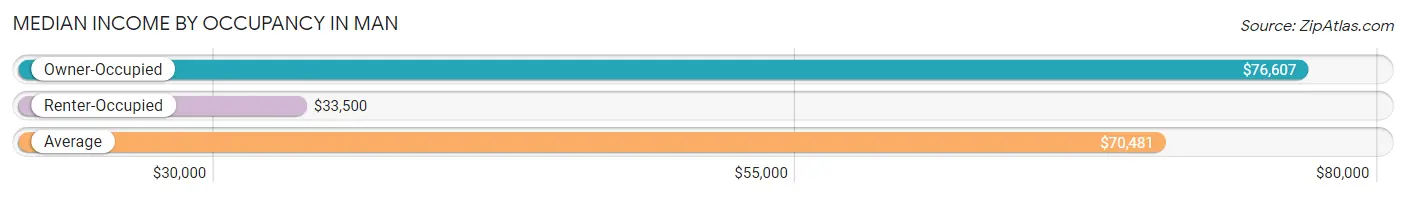
| Occupancy Type | # Households | Median Income |
| Owner-Occupied | 305 (78.8%) | $76,607 |
| Renter-Occupied | 82 (21.2%) | $33,500 |
| Average | 387 (100.0%) | $70,481 |
Occupancy by Householder Income Bracket in Man
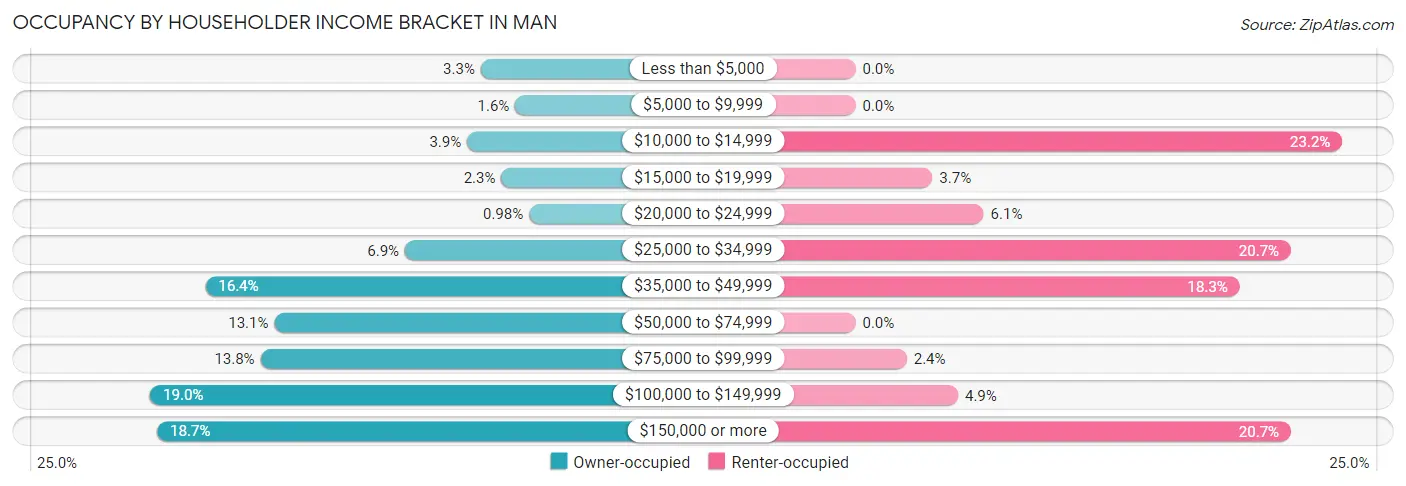
| Income Bracket | Owner-occupied | Renter-occupied |
| Less than $5,000 | 10 (3.3%) | 0 (0.0%) |
| $5,000 to $9,999 | 5 (1.6%) | 0 (0.0%) |
| $10,000 to $14,999 | 12 (3.9%) | 19 (23.2%) |
| $15,000 to $19,999 | 7 (2.3%) | 3 (3.7%) |
| $20,000 to $24,999 | 3 (1.0%) | 5 (6.1%) |
| $25,000 to $34,999 | 21 (6.9%) | 17 (20.7%) |
| $35,000 to $49,999 | 50 (16.4%) | 15 (18.3%) |
| $50,000 to $74,999 | 40 (13.1%) | 0 (0.0%) |
| $75,000 to $99,999 | 42 (13.8%) | 2 (2.4%) |
| $100,000 to $149,999 | 58 (19.0%) | 4 (4.9%) |
| $150,000 or more | 57 (18.7%) | 17 (20.7%) |
| Total | 305 (100.0%) | 82 (100.0%) |
Monthly Housing Cost Tiers in Man
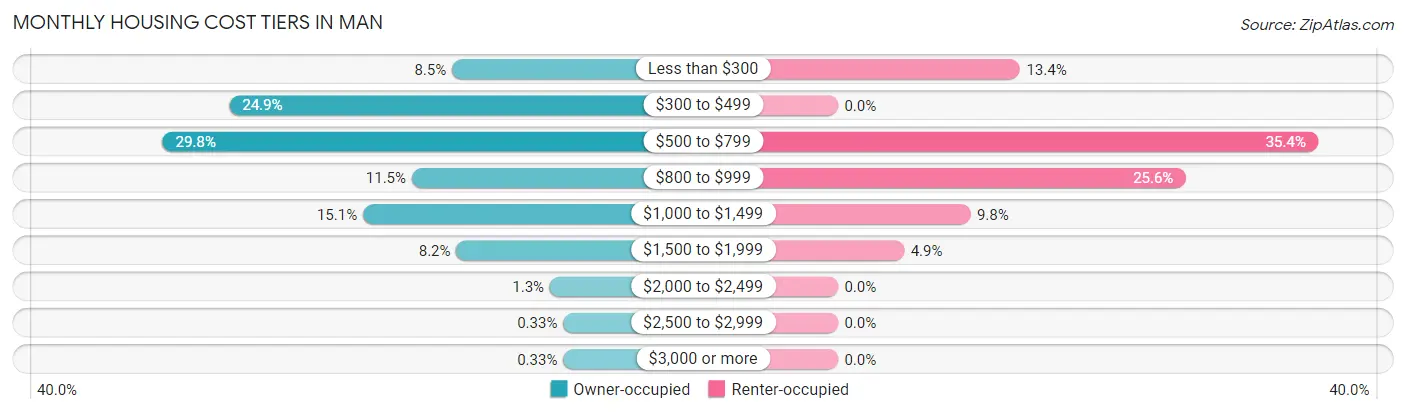
| Monthly Cost | Owner-occupied | Renter-occupied |
| Less than $300 | 26 (8.5%) | 11 (13.4%) |
| $300 to $499 | 76 (24.9%) | 0 (0.0%) |
| $500 to $799 | 91 (29.8%) | 29 (35.4%) |
| $800 to $999 | 35 (11.5%) | 21 (25.6%) |
| $1,000 to $1,499 | 46 (15.1%) | 8 (9.8%) |
| $1,500 to $1,999 | 25 (8.2%) | 4 (4.9%) |
| $2,000 to $2,499 | 4 (1.3%) | 0 (0.0%) |
| $2,500 to $2,999 | 1 (0.3%) | 0 (0.0%) |
| $3,000 or more | 1 (0.3%) | 0 (0.0%) |
| Total | 305 (100.0%) | 82 (100.0%) |
Physical Housing Characteristics in Man
Housing Structures in Man
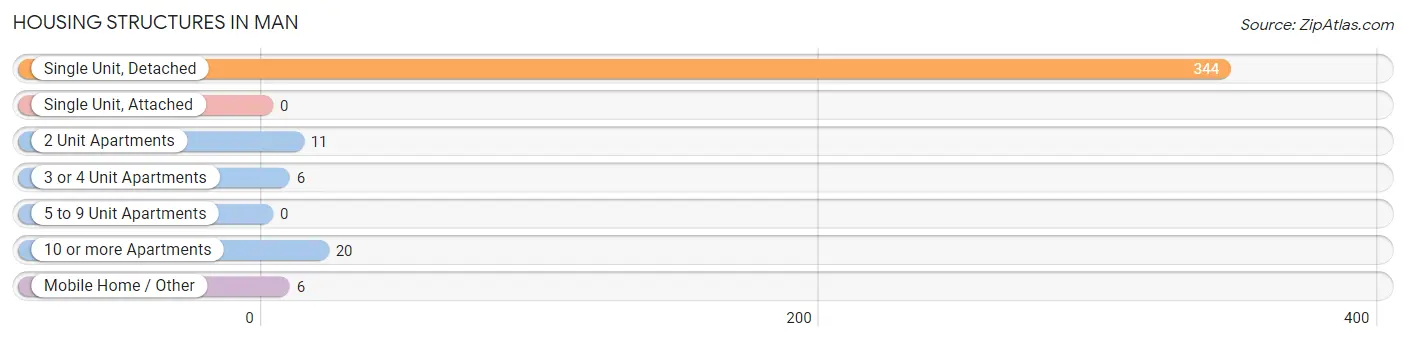
| Structure Type | # Housing Units | % Housing Units |
| Single Unit, Detached | 344 | 88.9% |
| Single Unit, Attached | 0 | 0.0% |
| 2 Unit Apartments | 11 | 2.8% |
| 3 or 4 Unit Apartments | 6 | 1.5% |
| 5 to 9 Unit Apartments | 0 | 0.0% |
| 10 or more Apartments | 20 | 5.2% |
| Mobile Home / Other | 6 | 1.5% |
| Total | 387 | 100.0% |
Housing Structures by Occupancy in Man
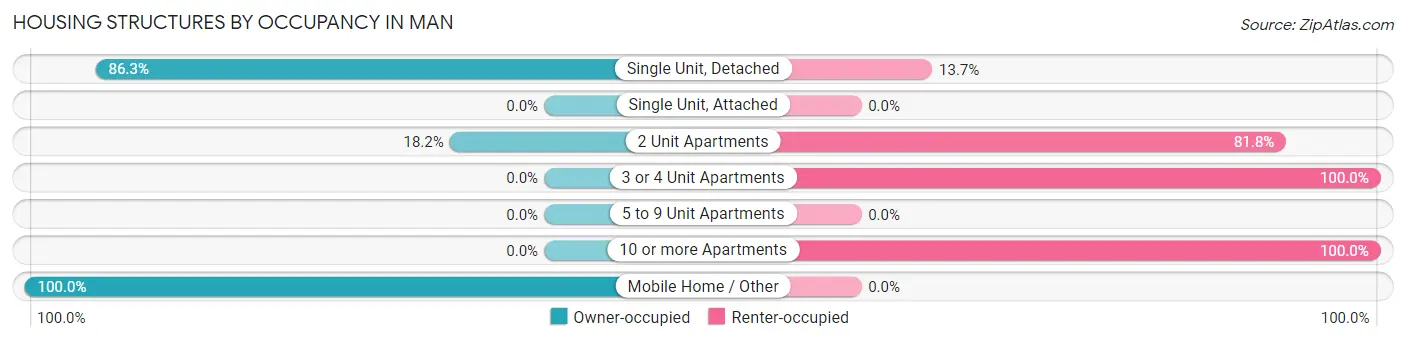
| Structure Type | Owner-occupied | Renter-occupied |
| Single Unit, Detached | 297 (86.3%) | 47 (13.7%) |
| Single Unit, Attached | 0 (0.0%) | 0 (0.0%) |
| 2 Unit Apartments | 2 (18.2%) | 9 (81.8%) |
| 3 or 4 Unit Apartments | 0 (0.0%) | 6 (100.0%) |
| 5 to 9 Unit Apartments | 0 (0.0%) | 0 (0.0%) |
| 10 or more Apartments | 0 (0.0%) | 20 (100.0%) |
| Mobile Home / Other | 6 (100.0%) | 0 (0.0%) |
| Total | 305 (78.8%) | 82 (21.2%) |
Housing Structures by Number of Rooms in Man
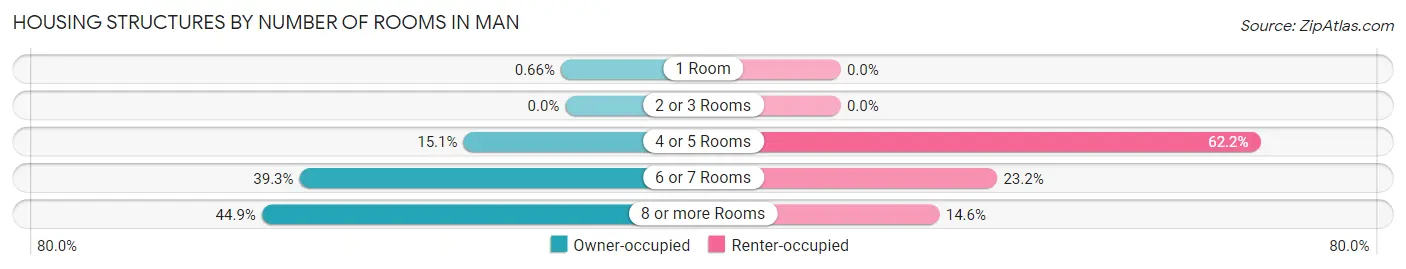
| Number of Rooms | Owner-occupied | Renter-occupied |
| 1 Room | 2 (0.7%) | 0 (0.0%) |
| 2 or 3 Rooms | 0 (0.0%) | 0 (0.0%) |
| 4 or 5 Rooms | 46 (15.1%) | 51 (62.2%) |
| 6 or 7 Rooms | 120 (39.3%) | 19 (23.2%) |
| 8 or more Rooms | 137 (44.9%) | 12 (14.6%) |
| Total | 305 (100.0%) | 82 (100.0%) |
Housing Structure by Heating Type in Man
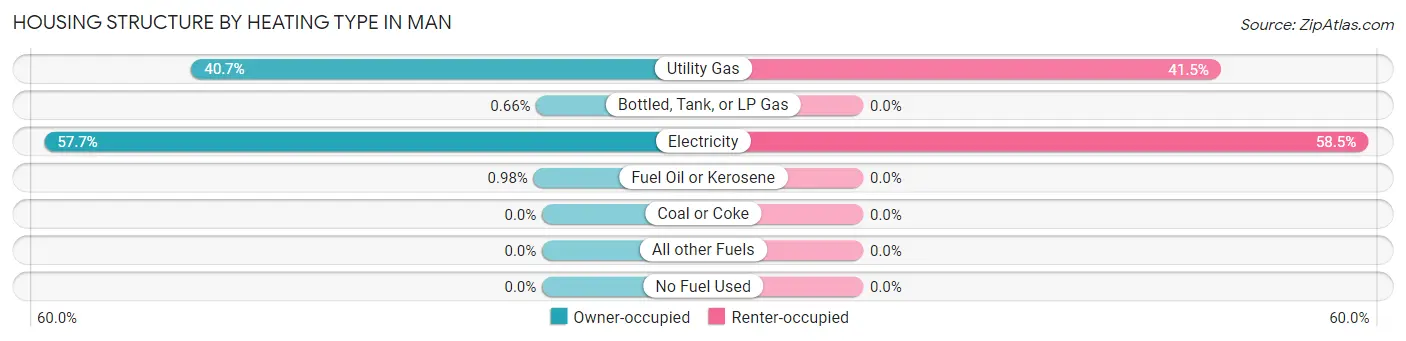
| Heating Type | Owner-occupied | Renter-occupied |
| Utility Gas | 124 (40.7%) | 34 (41.5%) |
| Bottled, Tank, or LP Gas | 2 (0.7%) | 0 (0.0%) |
| Electricity | 176 (57.7%) | 48 (58.5%) |
| Fuel Oil or Kerosene | 3 (1.0%) | 0 (0.0%) |
| Coal or Coke | 0 (0.0%) | 0 (0.0%) |
| All other Fuels | 0 (0.0%) | 0 (0.0%) |
| No Fuel Used | 0 (0.0%) | 0 (0.0%) |
| Total | 305 (100.0%) | 82 (100.0%) |
Household Vehicle Usage in Man
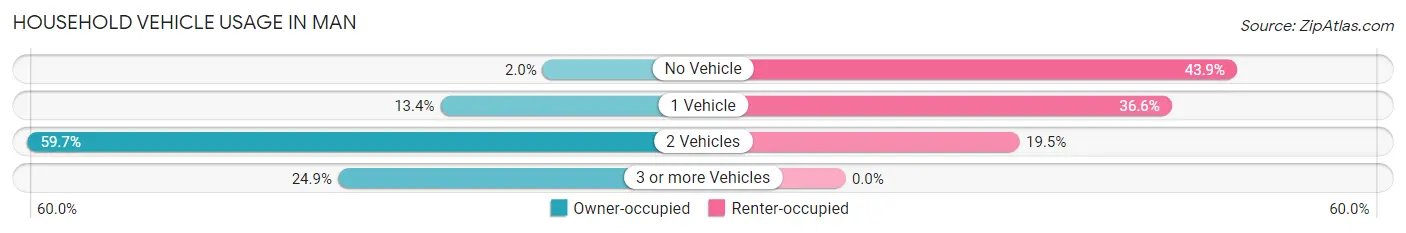
| Vehicles per Household | Owner-occupied | Renter-occupied |
| No Vehicle | 6 (2.0%) | 36 (43.9%) |
| 1 Vehicle | 41 (13.4%) | 30 (36.6%) |
| 2 Vehicles | 182 (59.7%) | 16 (19.5%) |
| 3 or more Vehicles | 76 (24.9%) | 0 (0.0%) |
| Total | 305 (100.0%) | 82 (100.0%) |
Real Estate & Mortgages in Man
Real Estate and Mortgage Overview in Man
| Characteristic | Without Mortgage | With Mortgage |
| Housing Units | 177 | 128 |
| Median Property Value | $142,300 | $152,700 |
| Median Household Income | $61,250 | $34 |
| Monthly Housing Costs | $487 | $0 |
| Real Estate Taxes | $763 | $0 |
Property Value by Mortgage Status in Man
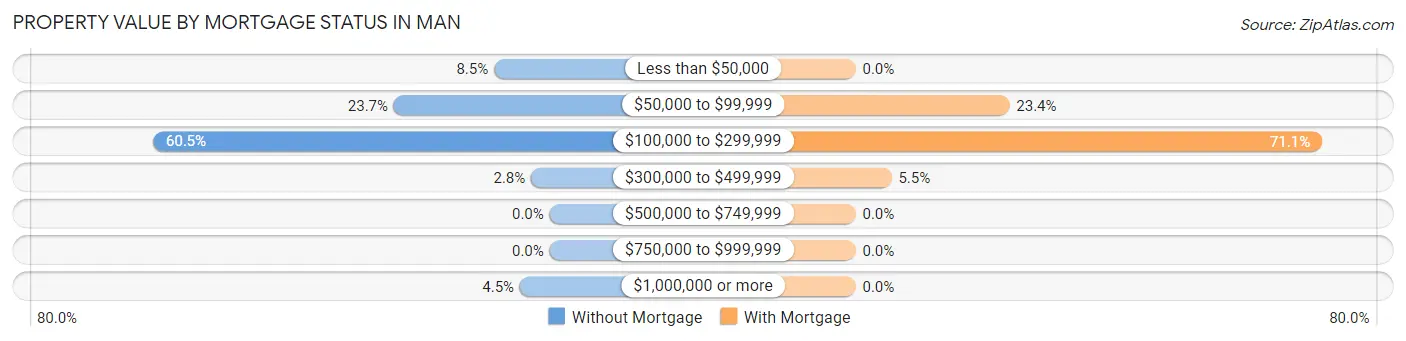
| Property Value | Without Mortgage | With Mortgage |
| Less than $50,000 | 15 (8.5%) | 0 (0.0%) |
| $50,000 to $99,999 | 42 (23.7%) | 30 (23.4%) |
| $100,000 to $299,999 | 107 (60.5%) | 91 (71.1%) |
| $300,000 to $499,999 | 5 (2.8%) | 7 (5.5%) |
| $500,000 to $749,999 | 0 (0.0%) | 0 (0.0%) |
| $750,000 to $999,999 | 0 (0.0%) | 0 (0.0%) |
| $1,000,000 or more | 8 (4.5%) | 0 (0.0%) |
| Total | 177 (100.0%) | 128 (100.0%) |
Household Income by Mortgage Status in Man
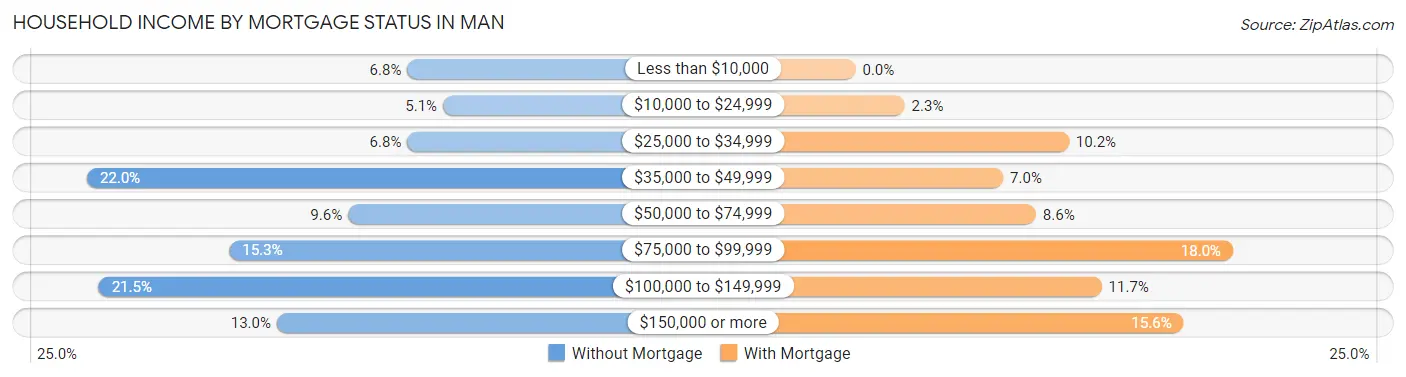
| Household Income | Without Mortgage | With Mortgage |
| Less than $10,000 | 12 (6.8%) | 0 (0.0%) |
| $10,000 to $24,999 | 9 (5.1%) | 3 (2.3%) |
| $25,000 to $34,999 | 12 (6.8%) | 13 (10.2%) |
| $35,000 to $49,999 | 39 (22.0%) | 9 (7.0%) |
| $50,000 to $74,999 | 17 (9.6%) | 11 (8.6%) |
| $75,000 to $99,999 | 27 (15.2%) | 23 (18.0%) |
| $100,000 to $149,999 | 38 (21.5%) | 15 (11.7%) |
| $150,000 or more | 23 (13.0%) | 20 (15.6%) |
| Total | 177 (100.0%) | 128 (100.0%) |
Property Value to Household Income Ratio in Man
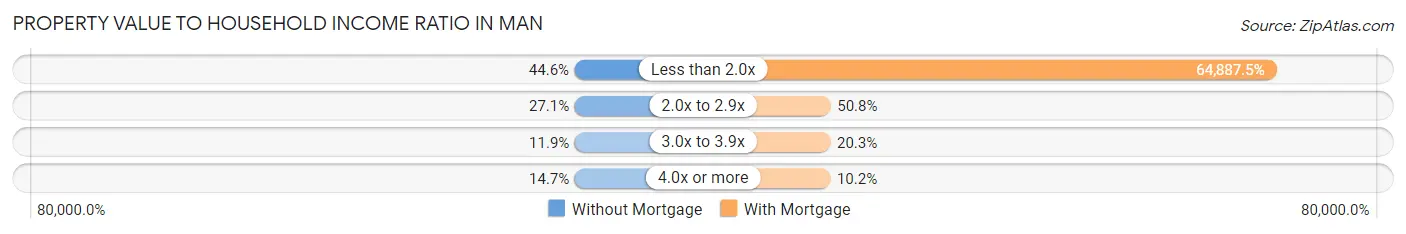
| Value-to-Income Ratio | Without Mortgage | With Mortgage |
| Less than 2.0x | 79 (44.6%) | 83,056 (64,887.5%) |
| 2.0x to 2.9x | 48 (27.1%) | 65 (50.8%) |
| 3.0x to 3.9x | 21 (11.9%) | 26 (20.3%) |
| 4.0x or more | 26 (14.7%) | 13 (10.2%) |
| Total | 177 (100.0%) | 128 (100.0%) |
Real Estate Taxes by Mortgage Status in Man
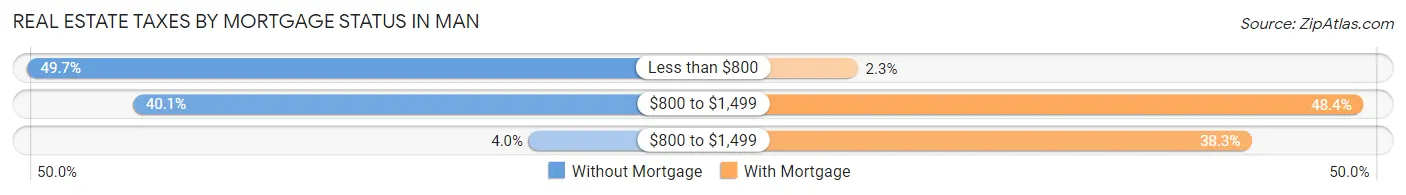
| Property Taxes | Without Mortgage | With Mortgage |
| Less than $800 | 88 (49.7%) | 3 (2.3%) |
| $800 to $1,499 | 71 (40.1%) | 62 (48.4%) |
| $800 to $1,499 | 7 (4.0%) | 49 (38.3%) |
| Total | 177 (100.0%) | 128 (100.0%) |
Health & Disability in Man
Health Insurance Coverage by Age in Man
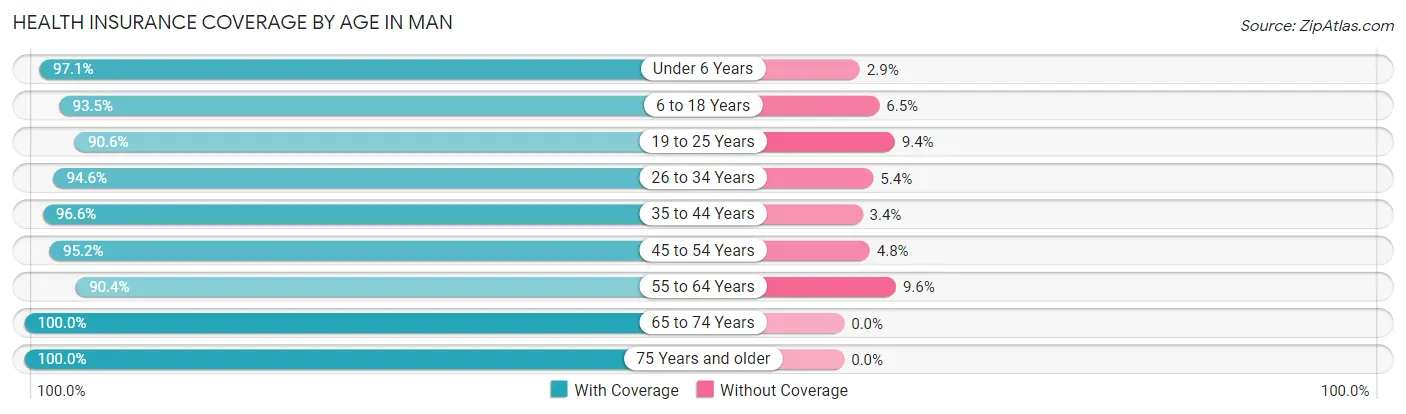
| Age Bracket | With Coverage | Without Coverage |
| Under 6 Years | 100 (97.1%) | 3 (2.9%) |
| 6 to 18 Years | 243 (93.5%) | 17 (6.5%) |
| 19 to 25 Years | 96 (90.6%) | 10 (9.4%) |
| 26 to 34 Years | 122 (94.6%) | 7 (5.4%) |
| 35 to 44 Years | 113 (96.6%) | 4 (3.4%) |
| 45 to 54 Years | 120 (95.2%) | 6 (4.8%) |
| 55 to 64 Years | 150 (90.4%) | 16 (9.6%) |
| 65 to 74 Years | 109 (100.0%) | 0 (0.0%) |
| 75 Years and older | 69 (100.0%) | 0 (0.0%) |
| Total | 1,122 (94.7%) | 63 (5.3%) |
Health Insurance Coverage by Citizenship Status in Man
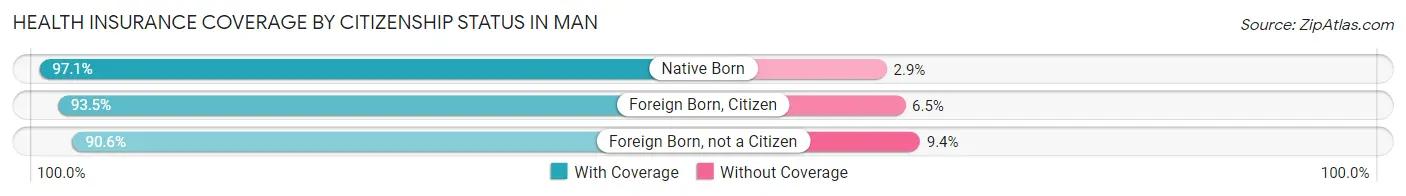
| Citizenship Status | With Coverage | Without Coverage |
| Native Born | 100 (97.1%) | 3 (2.9%) |
| Foreign Born, Citizen | 243 (93.5%) | 17 (6.5%) |
| Foreign Born, not a Citizen | 96 (90.6%) | 10 (9.4%) |
Health Insurance Coverage by Household Income in Man
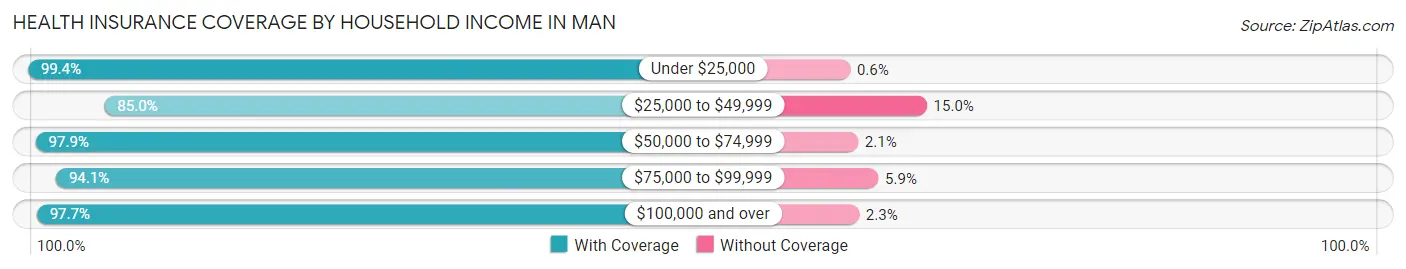
| Household Income | With Coverage | Without Coverage |
| Under $25,000 | 166 (99.4%) | 1 (0.6%) |
| $25,000 to $49,999 | 233 (85.0%) | 41 (15.0%) |
| $50,000 to $74,999 | 94 (97.9%) | 2 (2.1%) |
| $75,000 to $99,999 | 112 (94.1%) | 7 (5.9%) |
| $100,000 and over | 517 (97.7%) | 12 (2.3%) |
Public vs Private Health Insurance Coverage by Age in Man
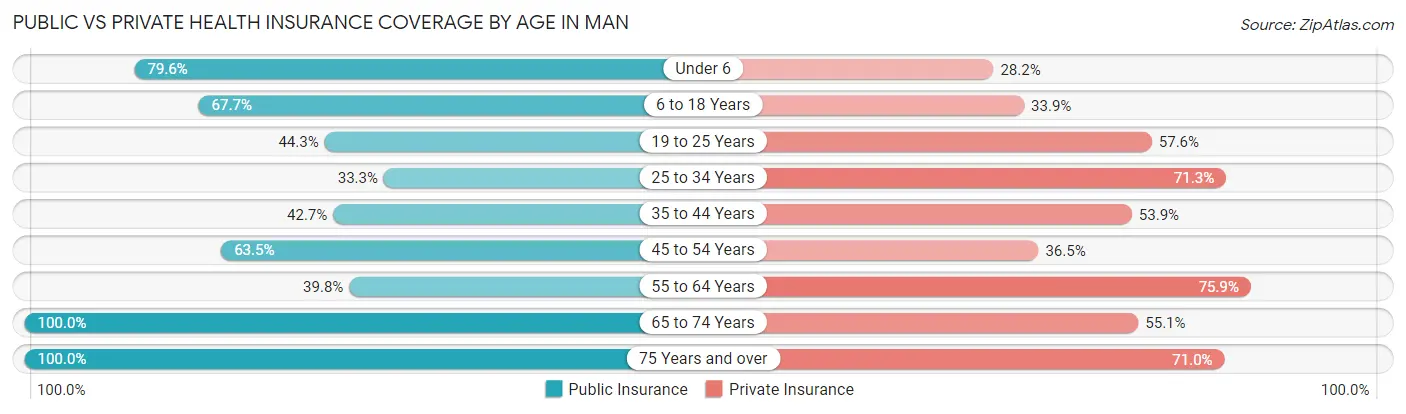
| Age Bracket | Public Insurance | Private Insurance |
| Under 6 | 82 (79.6%) | 29 (28.2%) |
| 6 to 18 Years | 176 (67.7%) | 88 (33.9%) |
| 19 to 25 Years | 47 (44.3%) | 61 (57.6%) |
| 25 to 34 Years | 43 (33.3%) | 92 (71.3%) |
| 35 to 44 Years | 50 (42.7%) | 63 (53.8%) |
| 45 to 54 Years | 80 (63.5%) | 46 (36.5%) |
| 55 to 64 Years | 66 (39.8%) | 126 (75.9%) |
| 65 to 74 Years | 109 (100.0%) | 60 (55.0%) |
| 75 Years and over | 69 (100.0%) | 49 (71.0%) |
| Total | 722 (60.9%) | 614 (51.8%) |
Disability Status by Sex by Age in Man
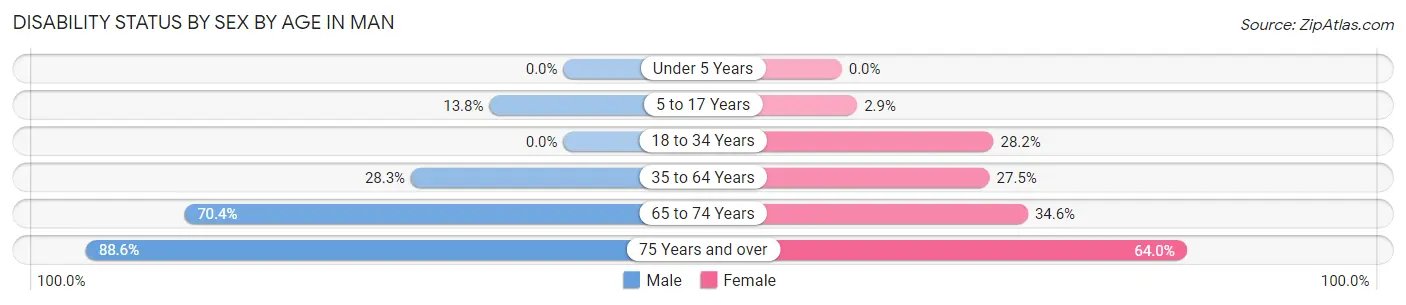
| Age Bracket | Male | Female |
| Under 5 Years | 0 (0.0%) | 0 (0.0%) |
| 5 to 17 Years | 11 (13.8%) | 5 (2.9%) |
| 18 to 34 Years | 0 (0.0%) | 40 (28.2%) |
| 35 to 64 Years | 58 (28.3%) | 56 (27.5%) |
| 65 to 74 Years | 38 (70.4%) | 19 (34.5%) |
| 75 Years and over | 39 (88.6%) | 16 (64.0%) |
Disability Class by Sex by Age in Man
Disability Class: Hearing Difficulty
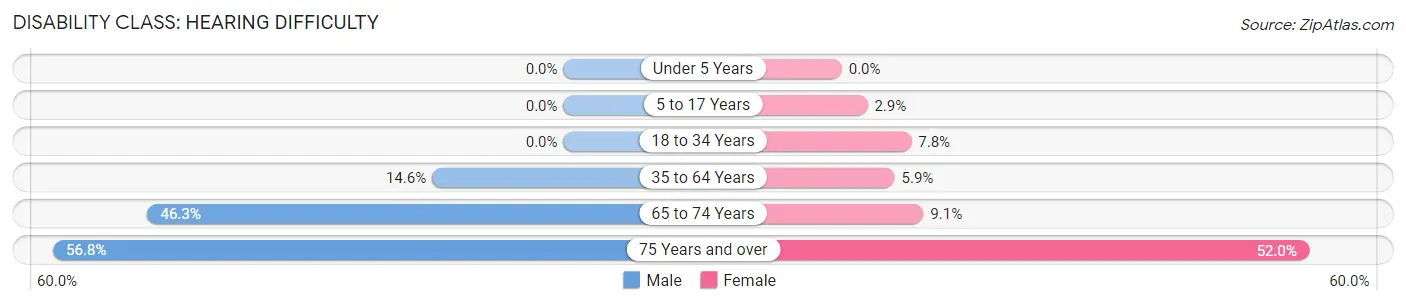
| Age Bracket | Male | Female |
| Under 5 Years | 0 (0.0%) | 0 (0.0%) |
| 5 to 17 Years | 0 (0.0%) | 5 (2.9%) |
| 18 to 34 Years | 0 (0.0%) | 11 (7.7%) |
| 35 to 64 Years | 30 (14.6%) | 12 (5.9%) |
| 65 to 74 Years | 25 (46.3%) | 5 (9.1%) |
| 75 Years and over | 25 (56.8%) | 13 (52.0%) |
Disability Class: Vision Difficulty
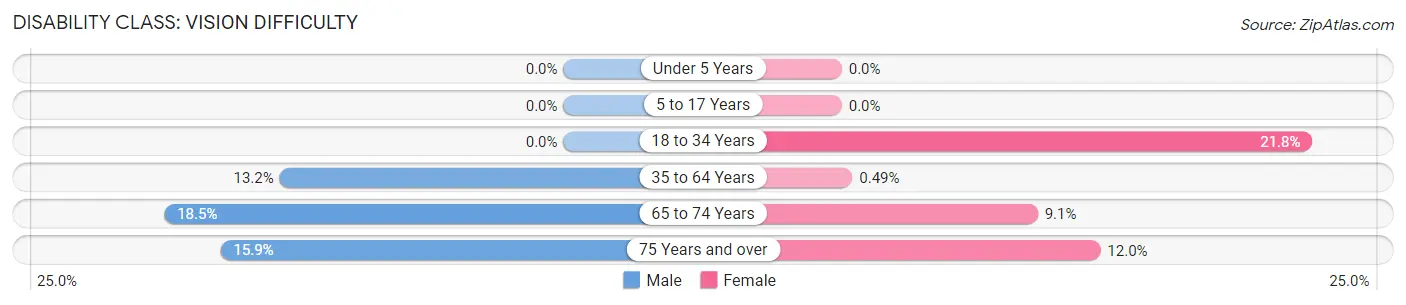
| Age Bracket | Male | Female |
| Under 5 Years | 0 (0.0%) | 0 (0.0%) |
| 5 to 17 Years | 0 (0.0%) | 0 (0.0%) |
| 18 to 34 Years | 0 (0.0%) | 31 (21.8%) |
| 35 to 64 Years | 27 (13.2%) | 1 (0.5%) |
| 65 to 74 Years | 10 (18.5%) | 5 (9.1%) |
| 75 Years and over | 7 (15.9%) | 3 (12.0%) |
Disability Class: Cognitive Difficulty
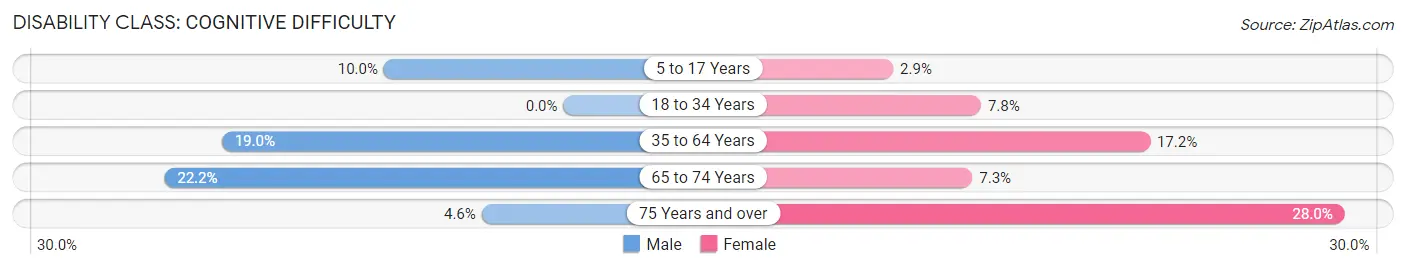
| Age Bracket | Male | Female |
| 5 to 17 Years | 8 (10.0%) | 5 (2.9%) |
| 18 to 34 Years | 0 (0.0%) | 11 (7.7%) |
| 35 to 64 Years | 39 (19.0%) | 35 (17.2%) |
| 65 to 74 Years | 12 (22.2%) | 4 (7.3%) |
| 75 Years and over | 2 (4.5%) | 7 (28.0%) |
Disability Class: Ambulatory Difficulty
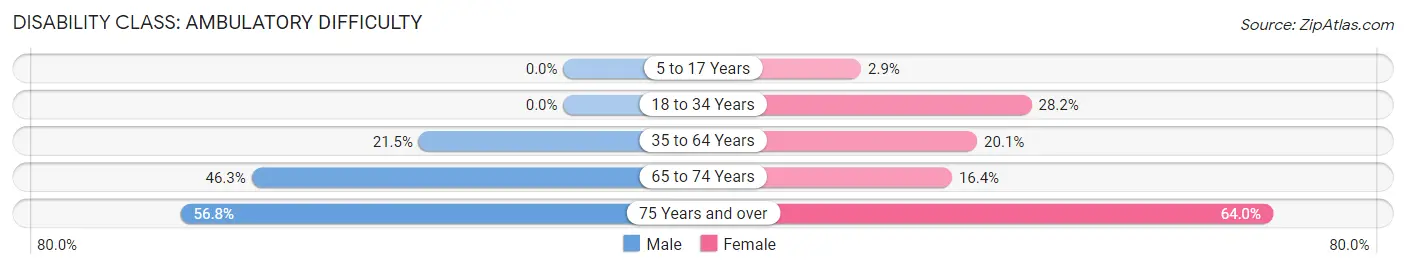
| Age Bracket | Male | Female |
| 5 to 17 Years | 0 (0.0%) | 5 (2.9%) |
| 18 to 34 Years | 0 (0.0%) | 40 (28.2%) |
| 35 to 64 Years | 44 (21.5%) | 41 (20.1%) |
| 65 to 74 Years | 25 (46.3%) | 9 (16.4%) |
| 75 Years and over | 25 (56.8%) | 16 (64.0%) |
Disability Class: Self-Care Difficulty
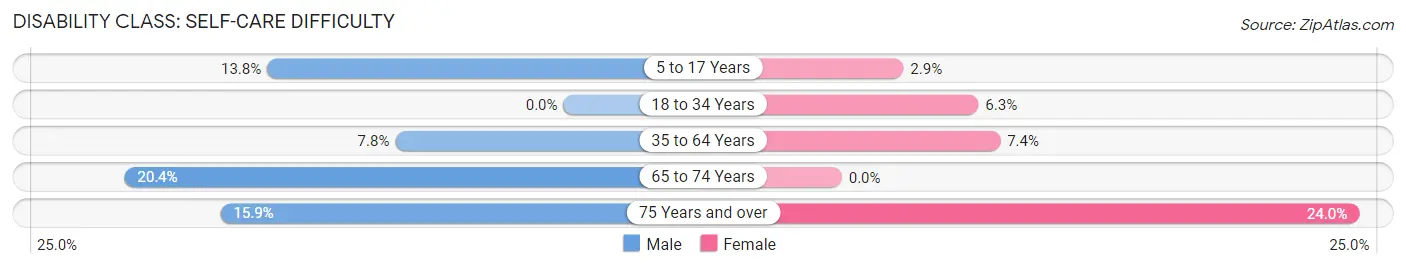
| Age Bracket | Male | Female |
| 5 to 17 Years | 11 (13.8%) | 5 (2.9%) |
| 18 to 34 Years | 0 (0.0%) | 9 (6.3%) |
| 35 to 64 Years | 16 (7.8%) | 15 (7.3%) |
| 65 to 74 Years | 11 (20.4%) | 0 (0.0%) |
| 75 Years and over | 7 (15.9%) | 6 (24.0%) |
Technology Access in Man
Computing Device Access in Man
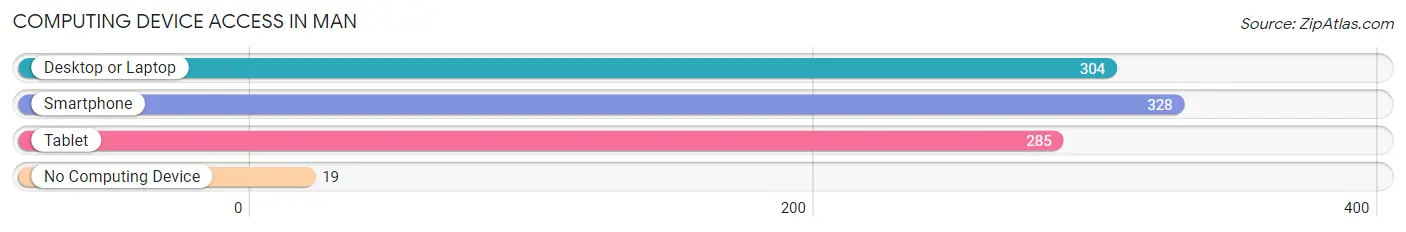
| Device Type | # Households | % Households |
| Desktop or Laptop | 304 | 78.5% |
| Smartphone | 328 | 84.8% |
| Tablet | 285 | 73.6% |
| No Computing Device | 19 | 4.9% |
| Total | 387 | 100.0% |
Internet Access in Man
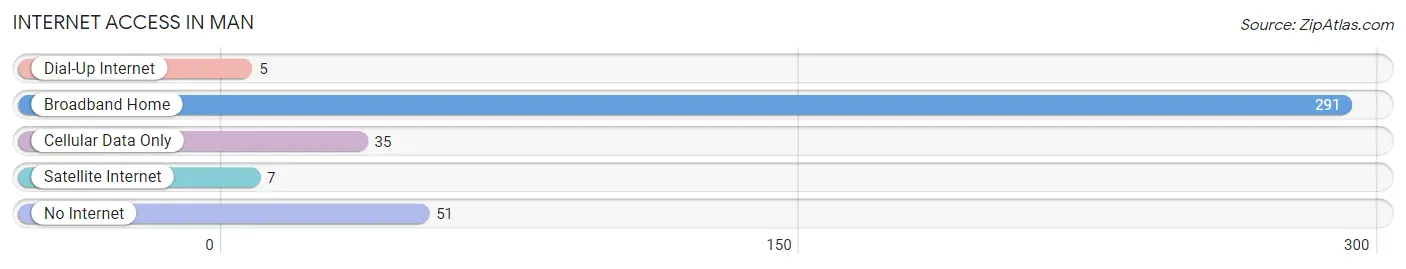
| Internet Type | # Households | % Households |
| Dial-Up Internet | 5 | 1.3% |
| Broadband Home | 291 | 75.2% |
| Cellular Data Only | 35 | 9.0% |
| Satellite Internet | 7 | 1.8% |
| No Internet | 51 | 13.2% |
| Total | 387 | 100.0% |
Man Summary
West Virginia is a state located in the Appalachian region of the Southern United States. It is bordered by Virginia to the southeast, Kentucky to the southwest, Ohio to the northwest, and Pennsylvania and Maryland to the northeast. West Virginia is the 41st largest state by area and ranks 38th in population. The capital and largest city is Charleston.
History
West Virginia was originally part of the British colony of Virginia. In 1776, the western counties of Virginia declared their independence from the British and formed the state of West Virginia. The state was admitted to the Union in 1863 as a result of the American Civil War.
West Virginia was a major battleground during the Civil War. The Battle of Gettysburg was fought in the state, and the Battle of Antietam was fought nearby. West Virginia was also the site of the Battle of Droop Mountain, the last major battle of the war.
Geography
West Virginia is located in the Appalachian region of the United States. It is bordered by Virginia to the southeast, Kentucky to the southwest, Ohio to the northwest, and Pennsylvania and Maryland to the northeast. The state is divided into two distinct regions: the Allegheny Plateau in the west and the Appalachian Mountains in the east.
The Allegheny Plateau is a plateau that covers most of the western part of the state. It is characterized by rolling hills and valleys, and is home to many of the state’s major cities, including Charleston, Huntington, and Parkersburg.
The Appalachian Mountains are a mountain range that runs through the eastern part of the state. The highest point in the state is Spruce Knob, which is located in the Appalachian Mountains.
Economy
West Virginia’s economy is largely based on the extraction and processing of natural resources, such as coal, natural gas, and timber. The state is the second-largest producer of coal in the United States, and the third-largest producer of natural gas.
West Virginia is also home to a number of manufacturing industries, including chemicals, food processing, and automotive parts. Tourism is also an important part of the state’s economy, with many visitors coming to the state to enjoy its natural beauty and outdoor recreation opportunities.
Demographics
As of the 2010 census, West Virginia had a population of 1,852,994. The state is predominantly white, with 84.3% of the population identifying as white. African Americans make up 6.5% of the population, and Hispanics and Latinos make up 2.2%.
West Virginia is also home to a large number of Native Americans, with 1.2% of the population identifying as Native American. The state also has a large population of people of Appalachian descent, with 11.7% of the population identifying as Appalachian.
West Virginia is a rural state, with most of its population living in small towns and rural areas. The largest cities in the state are Charleston, Huntington, Parkersburg, Morgantown, and Wheeling.
Common Questions
What is Per Capita Income in Man?
Per Capita income in Man is $31,544.
What is the Median Family Income in Man?
Median Family Income in Man is $80,694.
What is the Median Household income in Man?
Median Household Income in Man is $70,481.
What is Income or Wage Gap in Man?
Income or Wage Gap in Man is 65.8%.
Women in Man earn 34.2 cents for every dollar earned by a man.
What is Inequality or Gini Index in Man?
Inequality or Gini Index in Man is 0.48.
What is the Total Population of Man?
Total Population of Man is 1,185.
What is the Total Male Population of Man?
Total Male Population of Man is 548.
What is the Total Female Population of Man?
Total Female Population of Man is 637.
What is the Ratio of Males per 100 Females in Man?
There are 86.03 Males per 100 Females in Man.
What is the Ratio of Females per 100 Males in Man?
There are 116.24 Females per 100 Males in Man.
What is the Median Population Age in Man?
Median Population Age in Man is 33.0 Years.
What is the Average Family Size in Man
Average Family Size in Man is 3.3 People.
What is the Average Household Size in Man
Average Household Size in Man is 3.1 People.
How Large is the Labor Force in Man?
There are 439 People in the Labor Forcein in Man.
What is the Percentage of People in the Labor Force in Man?
50.4% of People are in the Labor Force in Man.
What is the Unemployment Rate in Man?
Unemployment Rate in Man is 18.5%.