Ghent, WV Map & Demographics
Ghent Map
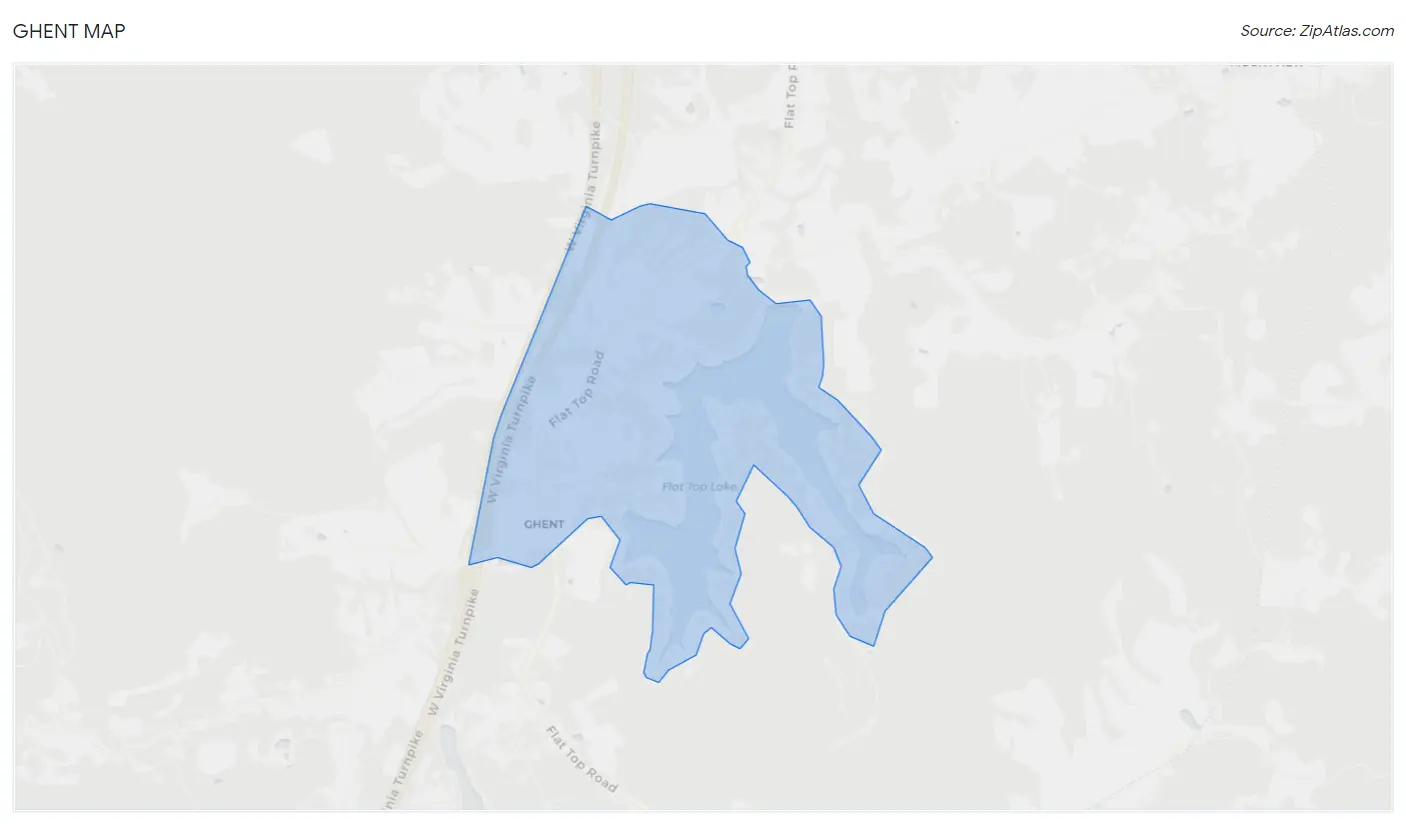
Ghent Overview
$71,502
PER CAPITA INCOME
$195,491
AVG FAMILY INCOME
$102,204
AVG HOUSEHOLD INCOME
15.8%
WAGE / INCOME GAP [ % ]
84.2¢/ $1
WAGE / INCOME GAP [ $ ]
0.30
INEQUALITY / GINI INDEX
390
TOTAL POPULATION
142
MALE POPULATION
248
FEMALE POPULATION
57.26
MALES / 100 FEMALES
174.65
FEMALES / 100 MALES
48.6
MEDIAN AGE
1.7
AVG FAMILY SIZE
1.4
AVG HOUSEHOLD SIZE
238
LABOR FORCE [ PEOPLE ]
61.0%
PERCENT IN LABOR FORCE
Ghent Zip Codes
Ghent Area Codes
Income in Ghent
Income Overview in Ghent
Per Capita Income in Ghent is $71,502, while median incomes of families and households are $195,491 and $102,204 respectively.
| Characteristic | Number | Measure |
| Per Capita Income | 390 | $71,502 |
| Median Family Income | 159 | $195,491 |
| Mean Family Income | 159 | $158,548 |
| Median Household Income | 272 | $102,204 |
| Mean Household Income | 272 | $123,141 |
| Income Deficit | 159 | $0 |
| Wage / Income Gap (%) | 390 | 15.85% |
| Wage / Income Gap ($) | 390 | 84.15¢ per $1 |
| Gini / Inequality Index | 390 | 0.30 |
Earnings by Sex in Ghent
Average Earnings in Ghent are $100,609, $86,161 for men and $102,385 for women, a difference of 15.9%.
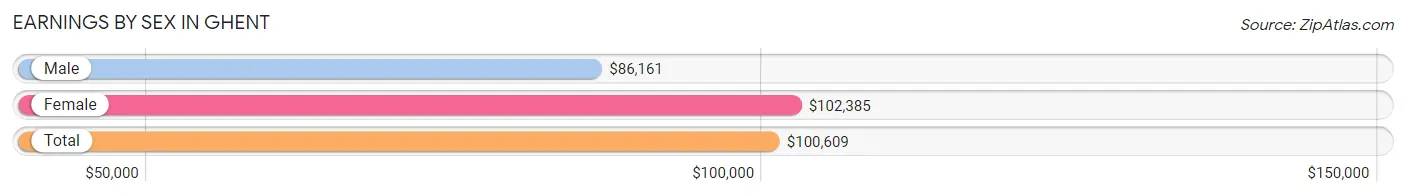
| Sex | Number | Average Earnings |
| Male | 108 (42.7%) | $86,161 |
| Female | 145 (57.3%) | $102,385 |
| Total | 253 (100.0%) | $100,609 |
Earnings by Sex by Income Bracket in Ghent
The most common earnings brackets in Ghent are $75,000 to $99,999 for men (93 | 86.1%) and $100,000+ for women (145 | 100.0%).
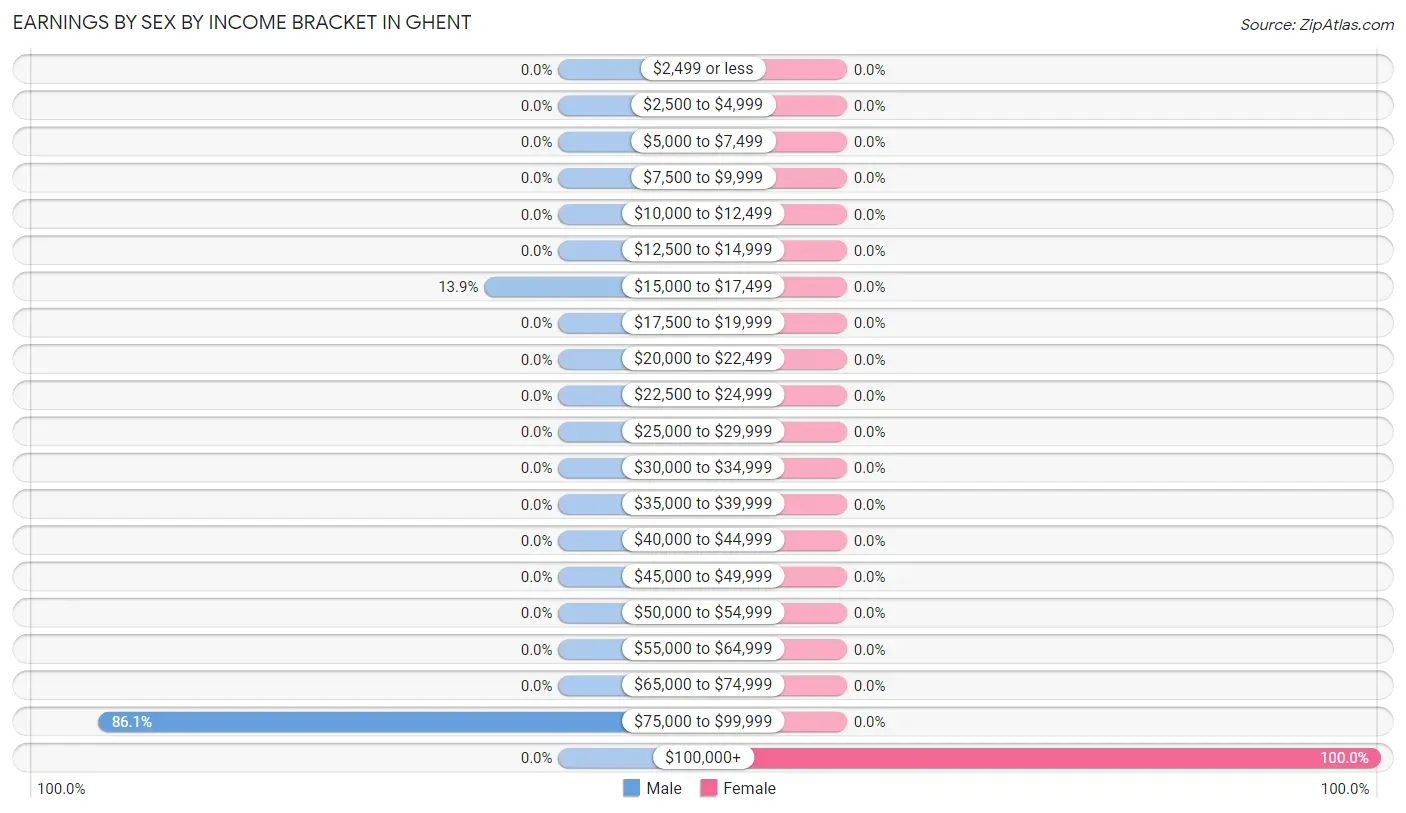
| Income | Male | Female |
| $2,499 or less | 0 (0.0%) | 0 (0.0%) |
| $2,500 to $4,999 | 0 (0.0%) | 0 (0.0%) |
| $5,000 to $7,499 | 0 (0.0%) | 0 (0.0%) |
| $7,500 to $9,999 | 0 (0.0%) | 0 (0.0%) |
| $10,000 to $12,499 | 0 (0.0%) | 0 (0.0%) |
| $12,500 to $14,999 | 0 (0.0%) | 0 (0.0%) |
| $15,000 to $17,499 | 15 (13.9%) | 0 (0.0%) |
| $17,500 to $19,999 | 0 (0.0%) | 0 (0.0%) |
| $20,000 to $22,499 | 0 (0.0%) | 0 (0.0%) |
| $22,500 to $24,999 | 0 (0.0%) | 0 (0.0%) |
| $25,000 to $29,999 | 0 (0.0%) | 0 (0.0%) |
| $30,000 to $34,999 | 0 (0.0%) | 0 (0.0%) |
| $35,000 to $39,999 | 0 (0.0%) | 0 (0.0%) |
| $40,000 to $44,999 | 0 (0.0%) | 0 (0.0%) |
| $45,000 to $49,999 | 0 (0.0%) | 0 (0.0%) |
| $50,000 to $54,999 | 0 (0.0%) | 0 (0.0%) |
| $55,000 to $64,999 | 0 (0.0%) | 0 (0.0%) |
| $65,000 to $74,999 | 0 (0.0%) | 0 (0.0%) |
| $75,000 to $99,999 | 93 (86.1%) | 0 (0.0%) |
| $100,000+ | 0 (0.0%) | 145 (100.0%) |
| Total | 108 (100.0%) | 145 (100.0%) |
Earnings by Sex by Educational Attainment in Ghent
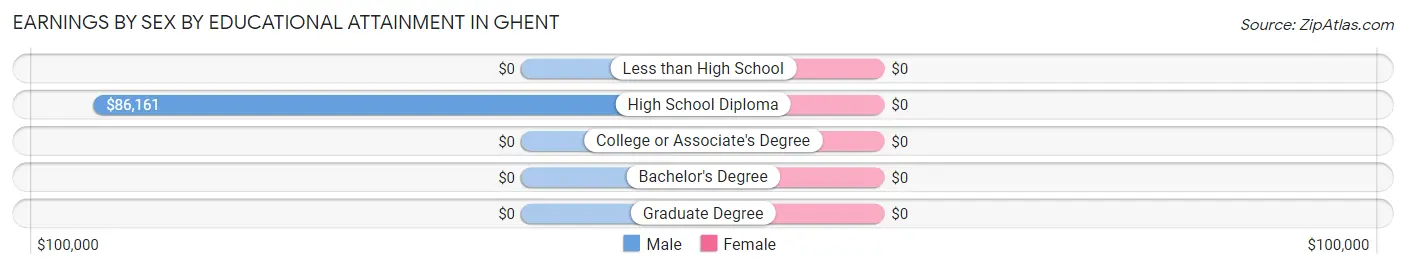
| Educational Attainment | Male Income | Female Income |
| Less than High School | - | - |
| High School Diploma | $86,161 | $0 |
| College or Associate's Degree | - | - |
| Bachelor's Degree | - | - |
| Graduate Degree | - | - |
| Total | $86,161 | $102,385 |
Family Income in Ghent
Family Income Brackets in Ghent
According to the Ghent family income data, there are 84 families falling into the $150,000 to $199,999 income range, which is the most common income bracket and makes up 52.8% of all families.
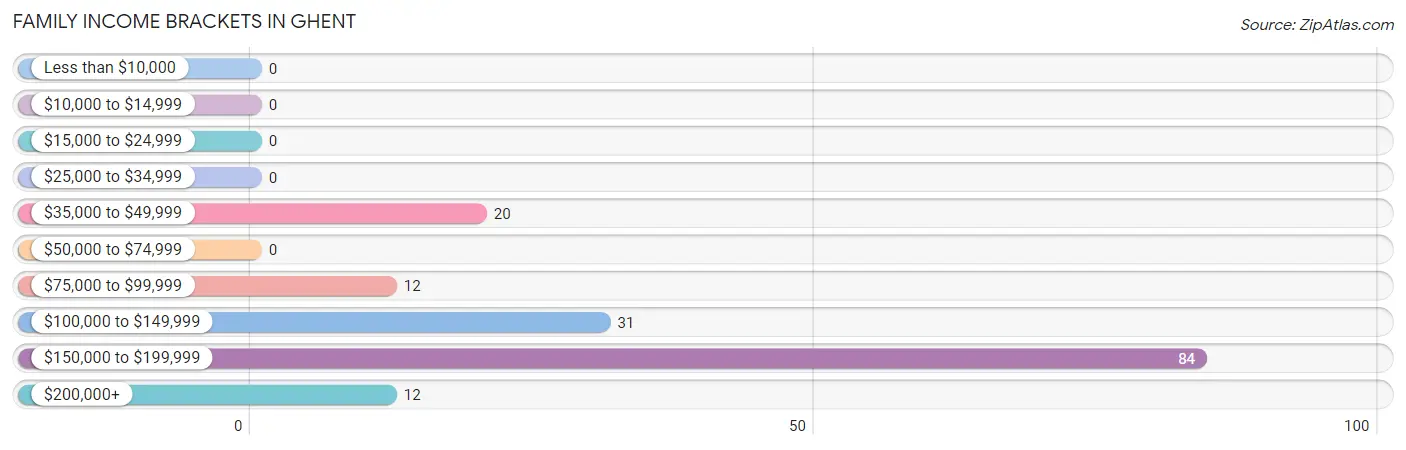
| Income Bracket | # Families | % Families |
| Less than $10,000 | 0 | 0.0% |
| $10,000 to $14,999 | 0 | 0.0% |
| $15,000 to $24,999 | 0 | 0.0% |
| $25,000 to $34,999 | 0 | 0.0% |
| $35,000 to $49,999 | 20 | 12.6% |
| $50,000 to $74,999 | 0 | 0.0% |
| $75,000 to $99,999 | 12 | 7.5% |
| $100,000 to $149,999 | 31 | 19.5% |
| $150,000 to $199,999 | 84 | 52.8% |
| $200,000+ | 12 | 7.5% |
Family Income by Famaliy Size in Ghent
2-person families (159 | 100.0%) account for the highest median family income in Ghent with $195,491 per family, while 2-person families (159 | 100.0%) have the highest median income of $97,746 per family member.
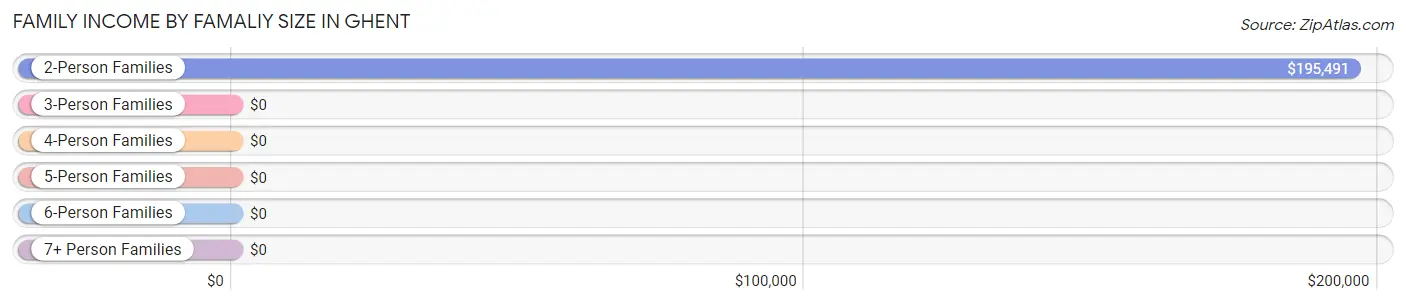
| Income Bracket | # Families | Median Income |
| 2-Person Families | 159 (100.0%) | $195,491 |
| 3-Person Families | 0 (0.0%) | $0 |
| 4-Person Families | 0 (0.0%) | $0 |
| 5-Person Families | 0 (0.0%) | $0 |
| 6-Person Families | 0 (0.0%) | $0 |
| 7+ Person Families | 0 (0.0%) | $0 |
| Total | 159 (100.0%) | $195,491 |
Family Income by Number of Earners in Ghent
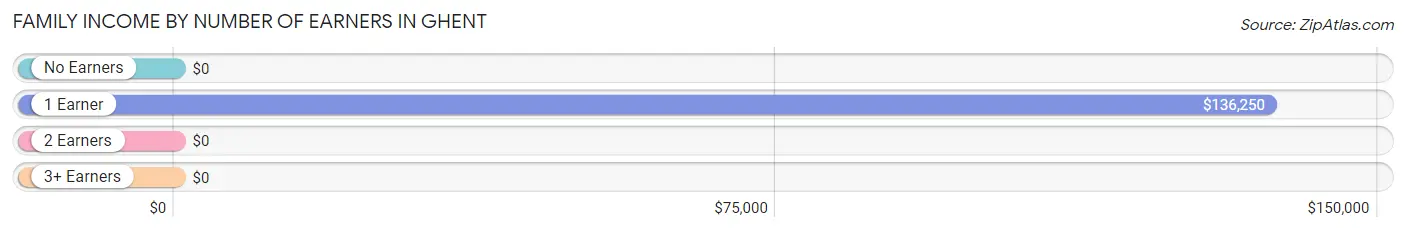
| Number of Earners | # Families | Median Income |
| No Earners | 20 (12.6%) | $0 |
| 1 Earner | 55 (34.6%) | $136,250 |
| 2 Earners | 84 (52.8%) | $0 |
| 3+ Earners | 0 (0.0%) | $0 |
| Total | 159 (100.0%) | $195,491 |
Household Income in Ghent
Household Income Brackets in Ghent
With 107 households falling in the category, the $100,000 to $149,999 income range is the most frequent in Ghent, accounting for 39.3% of all households.
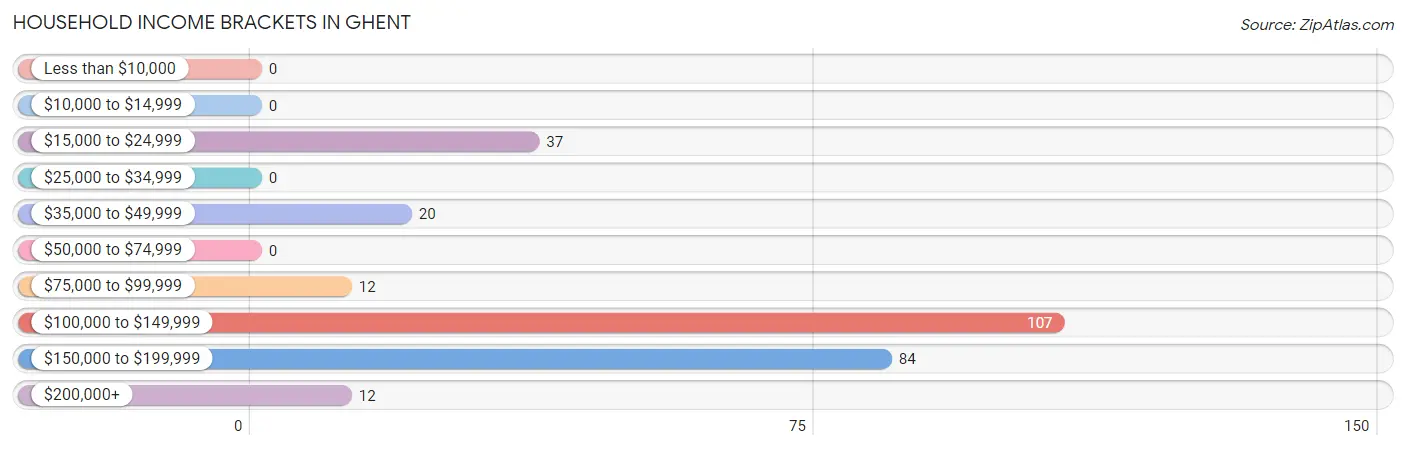
| Income Bracket | # Households | % Households |
| Less than $10,000 | 0 | 0.0% |
| $10,000 to $14,999 | 0 | 0.0% |
| $15,000 to $24,999 | 37 | 13.6% |
| $25,000 to $34,999 | 0 | 0.0% |
| $35,000 to $49,999 | 20 | 7.4% |
| $50,000 to $74,999 | 0 | 0.0% |
| $75,000 to $99,999 | 12 | 4.4% |
| $100,000 to $149,999 | 107 | 39.3% |
| $150,000 to $199,999 | 84 | 30.9% |
| $200,000+ | 12 | 4.4% |
Household Income by Householder Age in Ghent
The median household income in Ghent is $102,204, with the highest median household income of $195,789 found in the 45 to 64 years age bracket for the primary householder. A total of 139 households (51.1%) fall into this category.
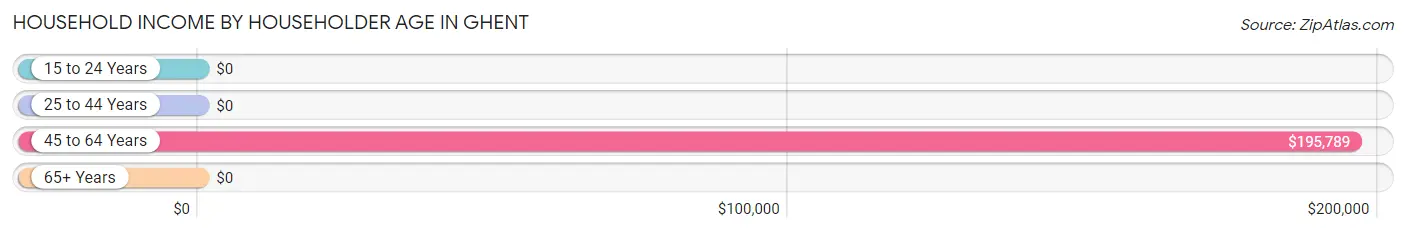
| Income Bracket | # Households | Median Income |
| 15 to 24 Years | 0 (0.0%) | $0 |
| 25 to 44 Years | 76 (27.9%) | $0 |
| 45 to 64 Years | 139 (51.1%) | $195,789 |
| 65+ Years | 57 (21.0%) | $0 |
| Total | 272 (100.0%) | $102,204 |
Poverty in Ghent
Income Below Poverty by Sex and Age in Ghent
| Age Bracket | Male | Female |
| Under 5 Years | 0 (0.0%) | 0 (0.0%) |
| 5 Years | 0 (0.0%) | 0 (0.0%) |
| 6 to 11 Years | 0 (0.0%) | 0 (0.0%) |
| 12 to 14 Years | 0 (0.0%) | 0 (0.0%) |
| 15 Years | 0 (0.0%) | 0 (0.0%) |
| 16 and 17 Years | 0 (0.0%) | 0 (0.0%) |
| 18 to 24 Years | 0 (0.0%) | 0 (0.0%) |
| 25 to 34 Years | 0 (0.0%) | 0 (0.0%) |
| 35 to 44 Years | 0 (0.0%) | 0 (0.0%) |
| 45 to 54 Years | 0 (0.0%) | 0 (0.0%) |
| 55 to 64 Years | 0 (0.0%) | 0 (0.0%) |
| 65 to 74 Years | 0 (0.0%) | 0 (0.0%) |
| 75 Years and over | 0 (0.0%) | 0 (0.0%) |
| Total | 0 (0.0%) | 0 (0.0%) |
Income Above Poverty by Sex and Age in Ghent
According to the poverty statistics in Ghent, males aged 45 to 54 years and females aged 25 to 34 years are the age groups that are most secure financially, with 100.0% of males and 100.0% of females in these age groups living above the poverty line.
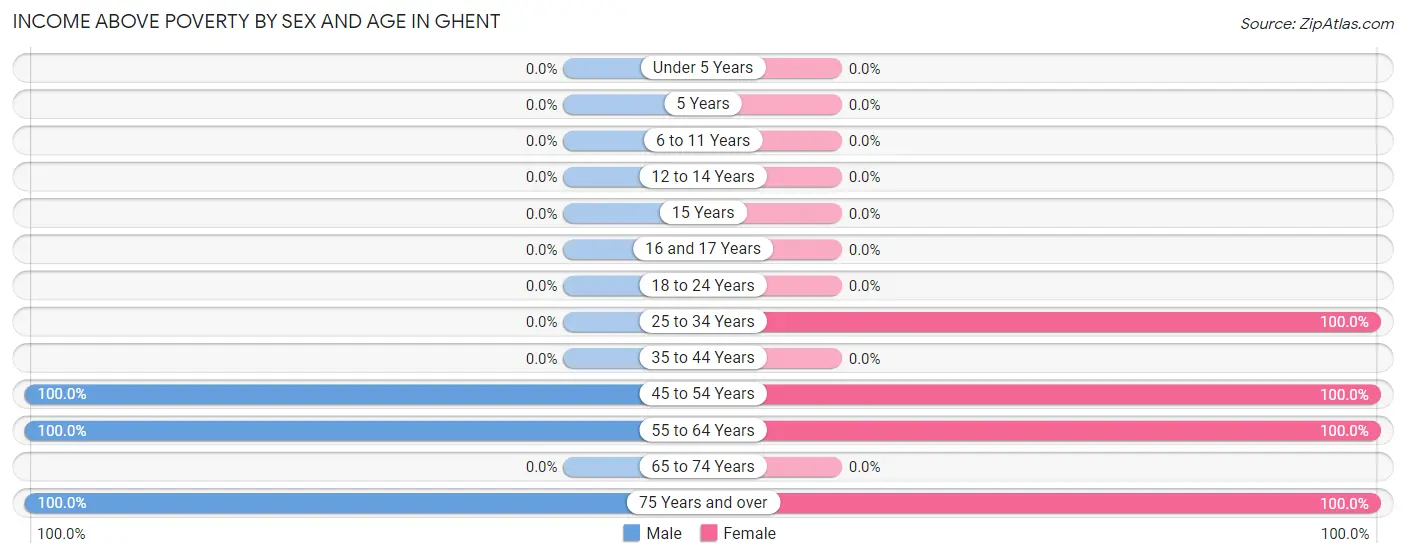
| Age Bracket | Male | Female |
| Under 5 Years | 0 (0.0%) | 0 (0.0%) |
| 5 Years | 0 (0.0%) | 0 (0.0%) |
| 6 to 11 Years | 0 (0.0%) | 0 (0.0%) |
| 12 to 14 Years | 0 (0.0%) | 0 (0.0%) |
| 15 Years | 0 (0.0%) | 0 (0.0%) |
| 16 and 17 Years | 0 (0.0%) | 0 (0.0%) |
| 18 to 24 Years | 0 (0.0%) | 0 (0.0%) |
| 25 to 34 Years | 0 (0.0%) | 76 (100.0%) |
| 35 to 44 Years | 0 (0.0%) | 0 (0.0%) |
| 45 to 54 Years | 84 (100.0%) | 88 (100.0%) |
| 55 to 64 Years | 38 (100.0%) | 24 (100.0%) |
| 65 to 74 Years | 0 (0.0%) | 0 (0.0%) |
| 75 Years and over | 20 (100.0%) | 60 (100.0%) |
| Total | 142 (100.0%) | 248 (100.0%) |
Income Below Poverty Among Married-Couple Families in Ghent
| Children | Above Poverty | Below Poverty |
| No Children | 159 (100.0%) | 0 (0.0%) |
| 1 or 2 Children | 0 (0.0%) | 0 (0.0%) |
| 3 or 4 Children | 0 (0.0%) | 0 (0.0%) |
| 5 or more Children | 0 (0.0%) | 0 (0.0%) |
| Total | 159 (100.0%) | 0 (0.0%) |
Income Below Poverty Among Single-Parent Households in Ghent
| Children | Single Father | Single Mother |
| No Children | 0 (0.0%) | 0 (0.0%) |
| 1 or 2 Children | 0 (0.0%) | 0 (0.0%) |
| 3 or 4 Children | 0 (0.0%) | 0 (0.0%) |
| 5 or more Children | 0 (0.0%) | 0 (0.0%) |
| Total | 0 (0.0%) | 0 (0.0%) |
Income Below Poverty Among Married-Couple vs Single-Parent Households in Ghent
| Children | Married-Couple Families | Single-Parent Households |
| No Children | 0 (0.0%) | 0 (0.0%) |
| 1 or 2 Children | 0 (0.0%) | 0 (0.0%) |
| 3 or 4 Children | 0 (0.0%) | 0 (0.0%) |
| 5 or more Children | 0 (0.0%) | 0 (0.0%) |
| Total | 0 (0.0%) | 0 (0.0%) |
Race in Ghent
The most populous races in Ghent are , and White / Caucasian (390 | 100.0%).
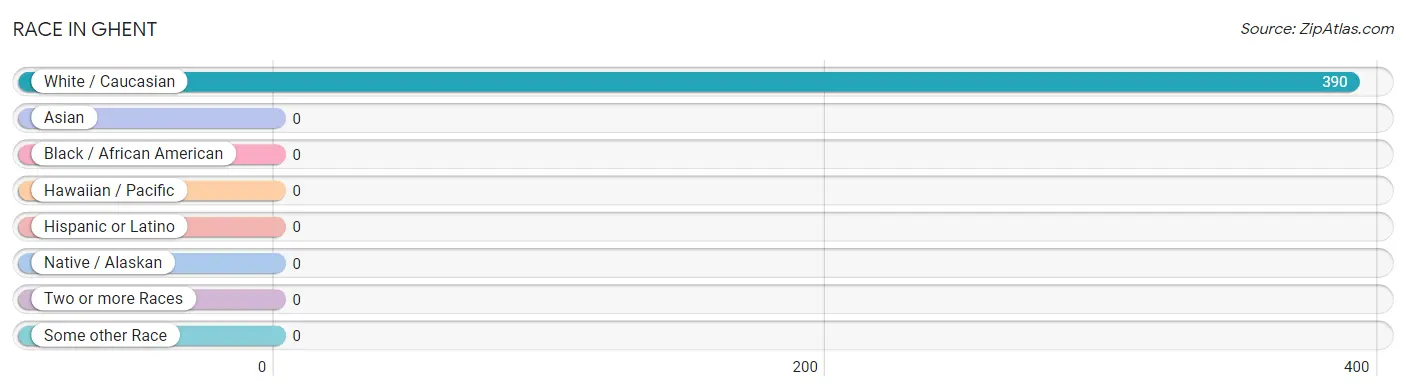
| Race | # Population | % Population |
| Asian | 0 | 0.0% |
| Black / African American | 0 | 0.0% |
| Hawaiian / Pacific | 0 | 0.0% |
| Hispanic or Latino | 0 | 0.0% |
| Native / Alaskan | 0 | 0.0% |
| White / Caucasian | 390 | 100.0% |
| Two or more Races | 0 | 0.0% |
| Some other Race | 0 | 0.0% |
| Total | 390 | 100.0% |
Ancestry in Ghent
The most populous ancestries reported in Ghent are English (107 | 27.4%), Irish (68 | 17.4%), American (57 | 14.6%), Italian (15 | 3.8%), and Polish (14 | 3.6%), together accounting for 66.9% of all Ghent residents.
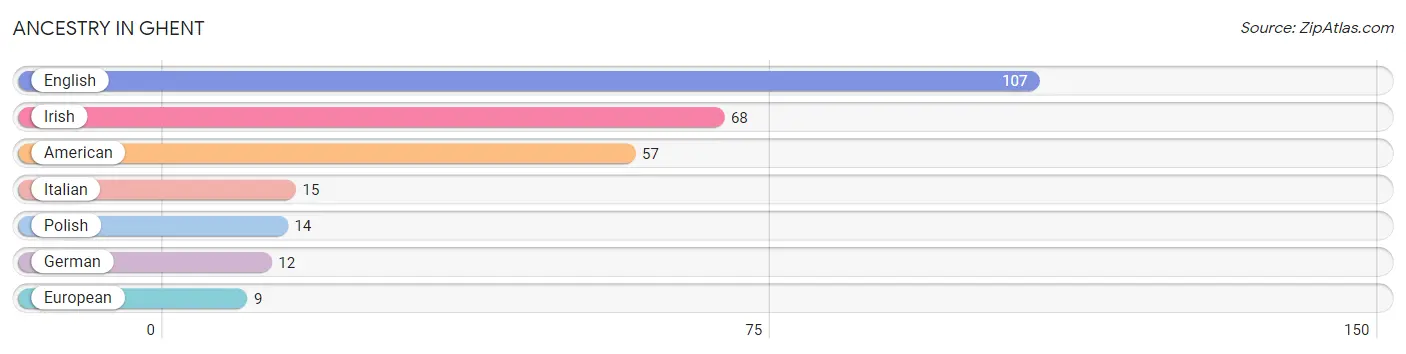
| Ancestry | # Population | % Population |
| American | 57 | 14.6% |
| English | 107 | 27.4% |
| European | 9 | 2.3% |
| German | 12 | 3.1% |
| Irish | 68 | 17.4% |
| Italian | 15 | 3.8% |
| Polish | 14 | 3.6% | View All 7 Rows |
Immigrants in Ghent

| Immigration Origin | # Population | % Population | View All 0 Rows |
Sex and Age in Ghent
Sex and Age in Ghent
The most populous age groups in Ghent are 45 to 49 Years (84 | 59.2%) for men and 30 to 34 Years (76 | 30.6%) for women.
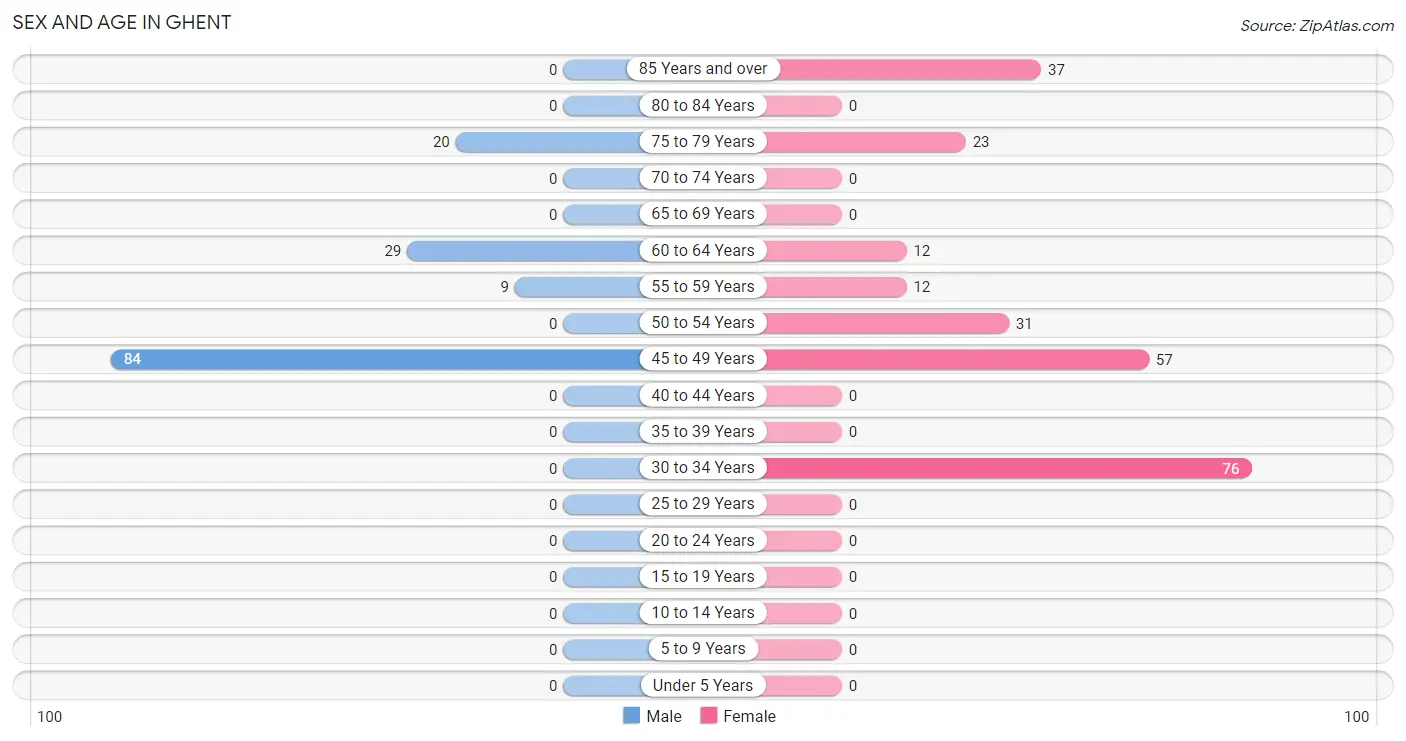
| Age Bracket | Male | Female |
| Under 5 Years | 0 (0.0%) | 0 (0.0%) |
| 5 to 9 Years | 0 (0.0%) | 0 (0.0%) |
| 10 to 14 Years | 0 (0.0%) | 0 (0.0%) |
| 15 to 19 Years | 0 (0.0%) | 0 (0.0%) |
| 20 to 24 Years | 0 (0.0%) | 0 (0.0%) |
| 25 to 29 Years | 0 (0.0%) | 0 (0.0%) |
| 30 to 34 Years | 0 (0.0%) | 76 (30.6%) |
| 35 to 39 Years | 0 (0.0%) | 0 (0.0%) |
| 40 to 44 Years | 0 (0.0%) | 0 (0.0%) |
| 45 to 49 Years | 84 (59.2%) | 57 (23.0%) |
| 50 to 54 Years | 0 (0.0%) | 31 (12.5%) |
| 55 to 59 Years | 9 (6.3%) | 12 (4.8%) |
| 60 to 64 Years | 29 (20.4%) | 12 (4.8%) |
| 65 to 69 Years | 0 (0.0%) | 0 (0.0%) |
| 70 to 74 Years | 0 (0.0%) | 0 (0.0%) |
| 75 to 79 Years | 20 (14.1%) | 23 (9.3%) |
| 80 to 84 Years | 0 (0.0%) | 0 (0.0%) |
| 85 Years and over | 0 (0.0%) | 37 (14.9%) |
| Total | 142 (100.0%) | 248 (100.0%) |
Families and Households in Ghent
Median Family Size in Ghent
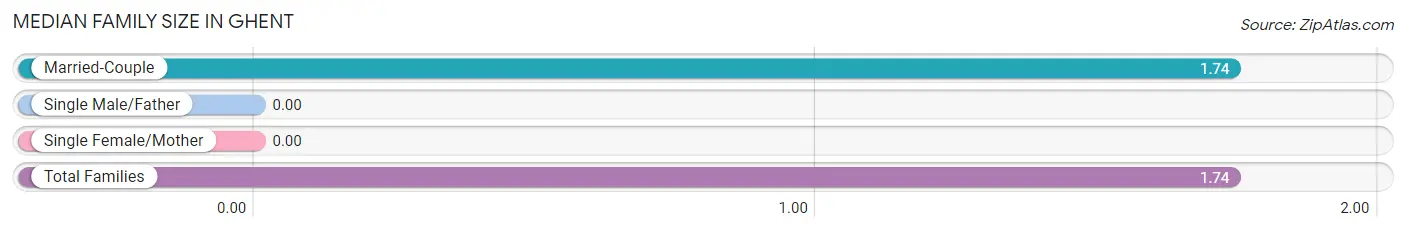
| Family Type | # Families | Family Size |
| Married-Couple | 159 (100.0%) | 1.74 |
| Single Male/Father | 0 (0.0%) | - |
| Single Female/Mother | 0 (0.0%) | - |
| Total Families | 159 (100.0%) | 1.74 |
Median Household Size in Ghent
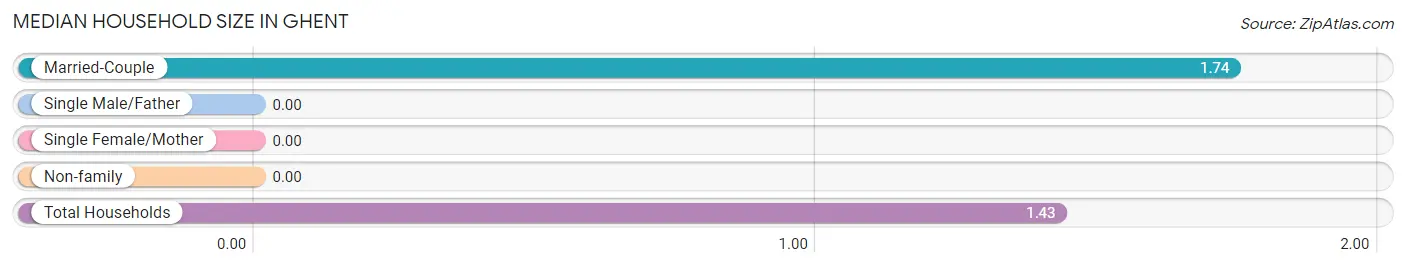
| Household Type | # Households | Household Size |
| Married-Couple | 159 (58.5%) | 1.74 |
| Single Male/Father | 0 (0.0%) | - |
| Single Female/Mother | 0 (0.0%) | - |
| Non-family | 113 (41.5%) | - |
| Total Households | 272 (100.0%) | 1.43 |
Household Size by Marriage Status in Ghent
Out of a total of 272 households in Ghent, 159 (58.5%) are family households, while 113 (41.5%) are nonfamily households. The most numerous type of family households are 2-person households, comprising 159, and the most common type of nonfamily households are 1-person households, comprising 113.
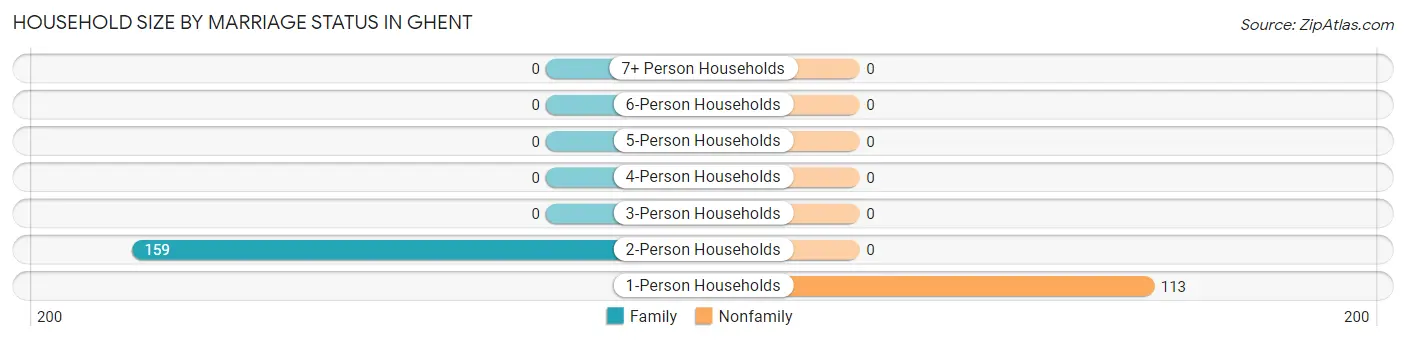
| Household Size | Family Households | Nonfamily Households |
| 1-Person Households | - | 113 (41.5%) |
| 2-Person Households | 159 (58.5%) | 0 (0.0%) |
| 3-Person Households | 0 (0.0%) | 0 (0.0%) |
| 4-Person Households | 0 (0.0%) | 0 (0.0%) |
| 5-Person Households | 0 (0.0%) | 0 (0.0%) |
| 6-Person Households | 0 (0.0%) | 0 (0.0%) |
| 7+ Person Households | 0 (0.0%) | 0 (0.0%) |
| Total | 159 (58.5%) | 113 (41.5%) |
Female Fertility in Ghent
Fertility by Age in Ghent
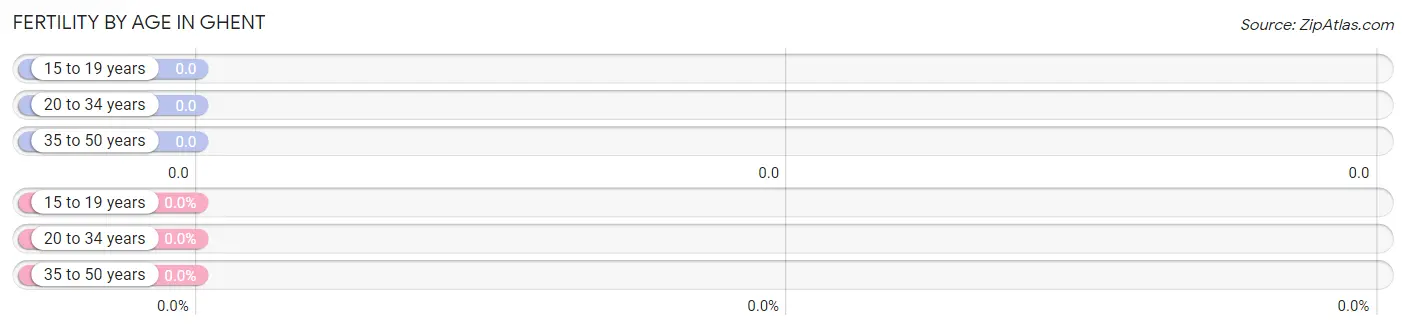
| Age Bracket | Women with Births | Births / 1,000 Women |
| 15 to 19 years | 0 (0.0%) | 0.0 |
| 20 to 34 years | 0 (0.0%) | 0.0 |
| 35 to 50 years | 0 (0.0%) | 0.0 |
| Total | 0 (0.0%) | 0.0 |
Fertility by Age by Marriage Status in Ghent
| Age Bracket | Married | Unmarried |
| 15 to 19 years | 0 (0.0%) | 0 (0.0%) |
| 20 to 34 years | 0 (0.0%) | 0 (0.0%) |
| 35 to 50 years | 0 (0.0%) | 0 (0.0%) |
| Total | 0 (0.0%) | 0 (0.0%) |
Fertility by Education in Ghent
| Educational Attainment | Women with Births | Births / 1,000 Women |
| Less than High School | 0 (0.0%) | 0.0 |
| High School Diploma | 0 (0.0%) | 0.0 |
| College or Associate's Degree | 0 (0.0%) | 0.0 |
| Bachelor's Degree | 0 (0.0%) | 0.0 |
| Graduate Degree | 0 (0.0%) | 0.0 |
| Total | 0 (0.0%) | 0.0 |
Fertility by Education by Marriage Status in Ghent
| Educational Attainment | Married | Unmarried |
| Less than High School | 0 (0.0%) | 0 (0.0%) |
| High School Diploma | 0 (0.0%) | 0 (0.0%) |
| College or Associate's Degree | 0 (0.0%) | 0 (0.0%) |
| Bachelor's Degree | 0 (0.0%) | 0 (0.0%) |
| Graduate Degree | 0 (0.0%) | 0 (0.0%) |
| Total | 0 (0.0%) | 0 (0.0%) |
Employment Characteristics in Ghent
Employment by Class of Employer in Ghent
Among the 238 employed individuals in Ghent, private company employees (88 | 37.0%), federal government employees (81 | 34.0%), and state government employees (60 | 25.2%) make up the most common classes of employment.
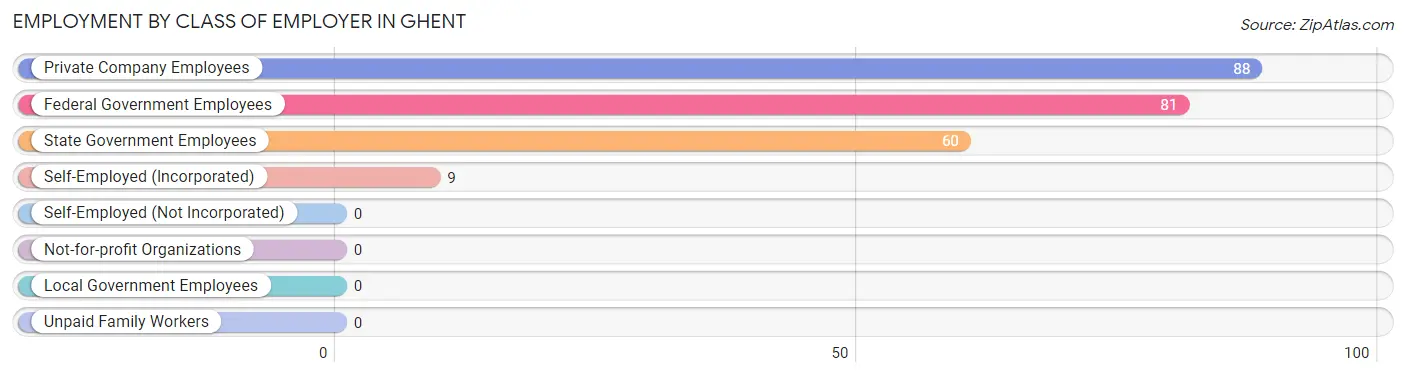
| Employer Class | # Employees | % Employees |
| Private Company Employees | 88 | 37.0% |
| Self-Employed (Incorporated) | 9 | 3.8% |
| Self-Employed (Not Incorporated) | 0 | 0.0% |
| Not-for-profit Organizations | 0 | 0.0% |
| Local Government Employees | 0 | 0.0% |
| State Government Employees | 60 | 25.2% |
| Federal Government Employees | 81 | 34.0% |
| Unpaid Family Workers | 0 | 0.0% |
| Total | 238 | 100.0% |
Employment Status by Age in Ghent
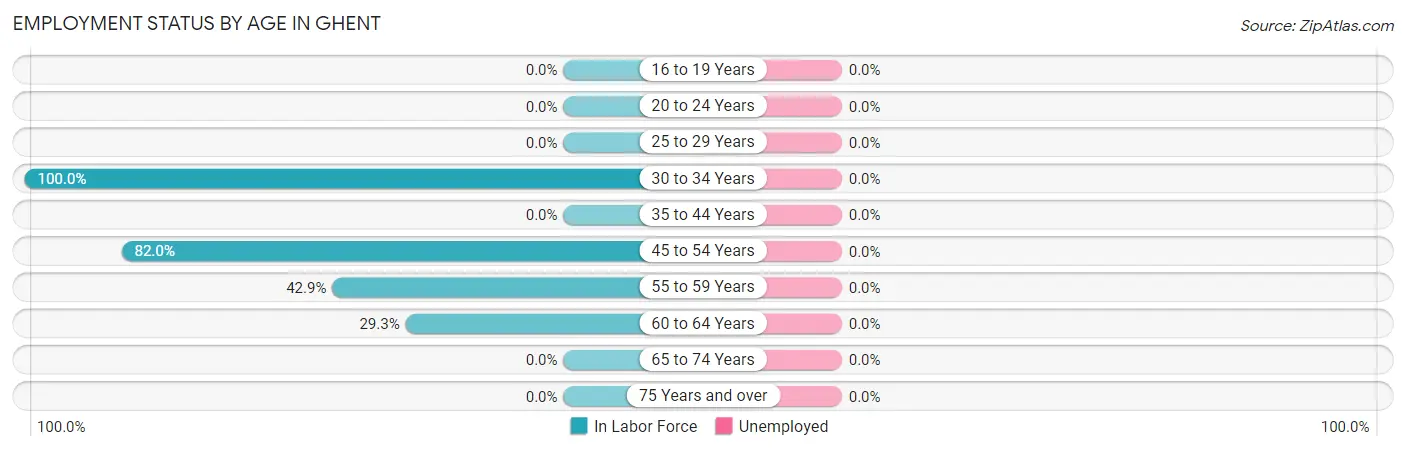
| Age Bracket | In Labor Force | Unemployed |
| 16 to 19 Years | 0 (0.0%) | 0 (0.0%) |
| 20 to 24 Years | 0 (0.0%) | 0 (0.0%) |
| 25 to 29 Years | 0 (0.0%) | 0 (0.0%) |
| 30 to 34 Years | 76 (100.0%) | 0 (0.0%) |
| 35 to 44 Years | 0 (0.0%) | 0 (0.0%) |
| 45 to 54 Years | 141 (82.0%) | 0 (0.0%) |
| 55 to 59 Years | 9 (42.9%) | 0 (0.0%) |
| 60 to 64 Years | 12 (29.3%) | 0 (0.0%) |
| 65 to 74 Years | 0 (0.0%) | 0 (0.0%) |
| 75 Years and over | 0 (0.0%) | 0 (0.0%) |
| Total | 238 (61.0%) | 0 (0.0%) |
Employment Status by Educational Attainment in Ghent
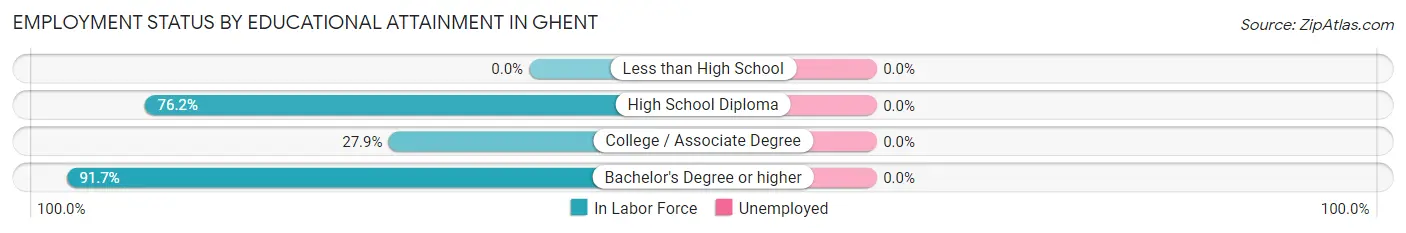
| Educational Attainment | In Labor Force | Unemployed |
| Less than High School | 0 (0.0%) | 0 (0.0%) |
| High School Diploma | 93 (76.2%) | 0 (0.0%) |
| College / Associate Degree | 12 (27.9%) | 0 (0.0%) |
| Bachelor's Degree or higher | 133 (91.7%) | 0 (0.0%) |
| Total | 238 (76.8%) | 0 (0.0%) |
Employment Occupations by Sex in Ghent
Management, Business, Science and Arts Occupations
The most common Management, Business, Science and Arts occupations in Ghent are Business & Financial (76 | 31.9%), and Management (69 | 29.0%).
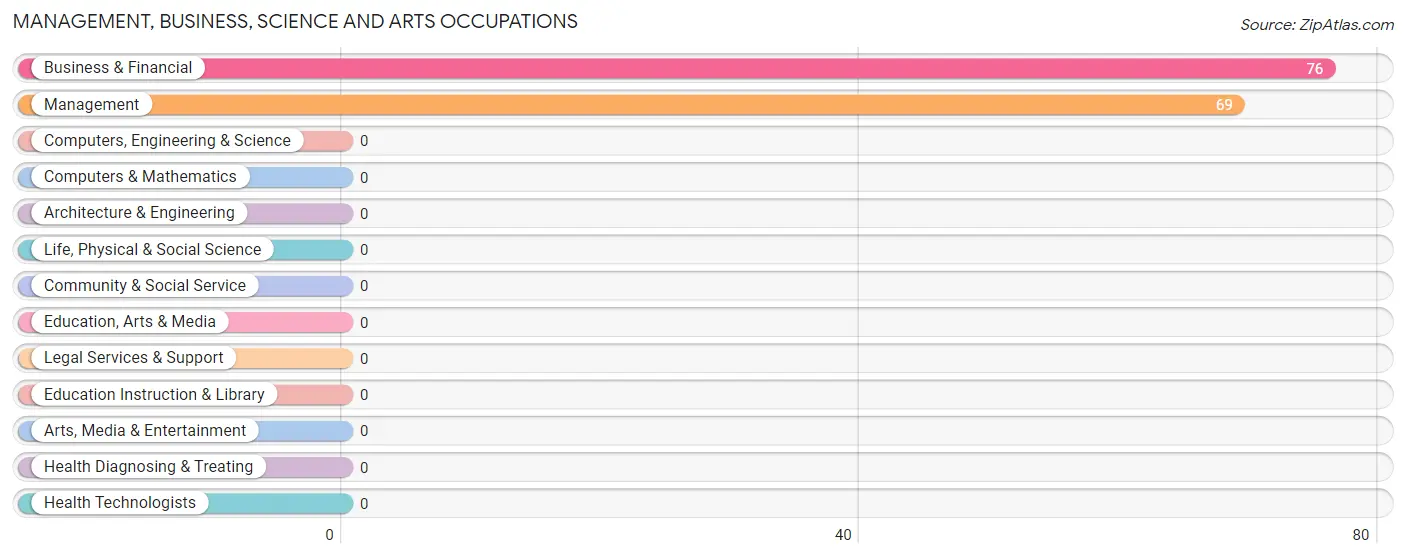
Management, Business, Science and Arts Occupations by Sex
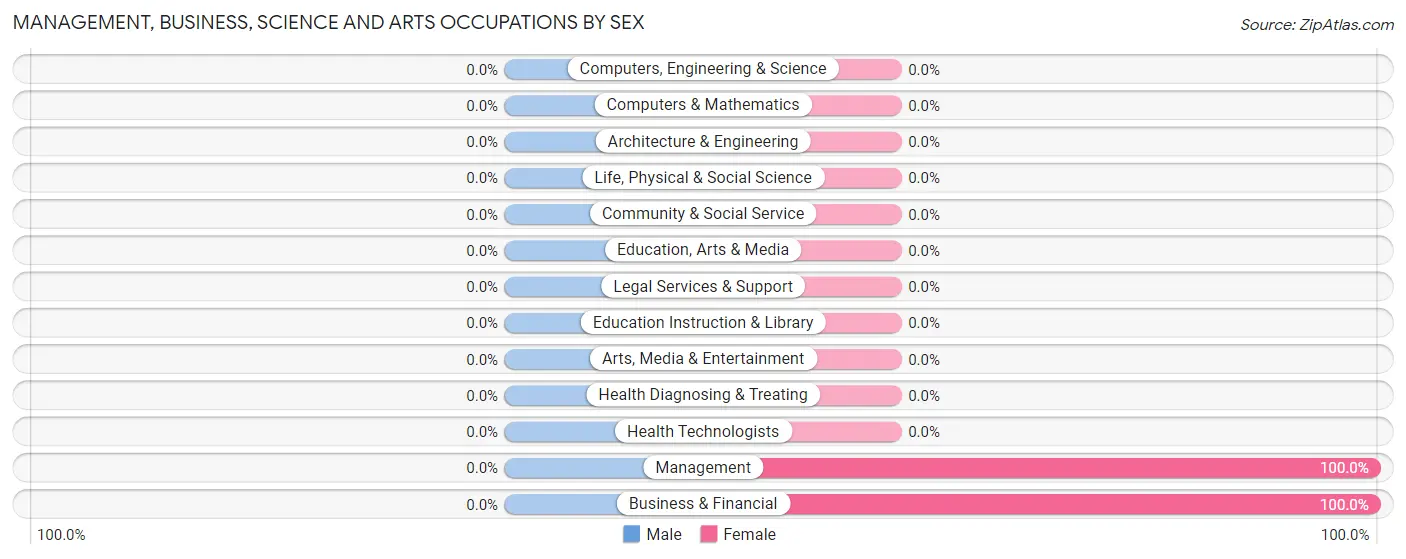
| Occupation | Male | Female |
| Management | 0 (0.0%) | 69 (100.0%) |
| Business & Financial | 0 (0.0%) | 76 (100.0%) |
| Computers, Engineering & Science | 0 (0.0%) | 0 (0.0%) |
| Computers & Mathematics | 0 (0.0%) | 0 (0.0%) |
| Architecture & Engineering | 0 (0.0%) | 0 (0.0%) |
| Life, Physical & Social Science | 0 (0.0%) | 0 (0.0%) |
| Community & Social Service | 0 (0.0%) | 0 (0.0%) |
| Education, Arts & Media | 0 (0.0%) | 0 (0.0%) |
| Legal Services & Support | 0 (0.0%) | 0 (0.0%) |
| Education Instruction & Library | 0 (0.0%) | 0 (0.0%) |
| Arts, Media & Entertainment | 0 (0.0%) | 0 (0.0%) |
| Health Diagnosing & Treating | 0 (0.0%) | 0 (0.0%) |
| Health Technologists | 0 (0.0%) | 0 (0.0%) |
| Total (Category) | 0 (0.0%) | 145 (100.0%) |
| Total (Overall) | 93 (39.1%) | 145 (60.9%) |
Services Occupations
Services Occupations by Sex
| Occupation | Male | Female |
| Healthcare Support | 0 (0.0%) | 0 (0.0%) |
| Security & Protection | 0 (0.0%) | 0 (0.0%) |
| Firefighting & Prevention | 0 (0.0%) | 0 (0.0%) |
| Law Enforcement | 0 (0.0%) | 0 (0.0%) |
| Food Preparation & Serving | 0 (0.0%) | 0 (0.0%) |
| Cleaning & Maintenance | 0 (0.0%) | 0 (0.0%) |
| Personal Care & Service | 0 (0.0%) | 0 (0.0%) |
| Total (Category) | 0 (0.0%) | 0 (0.0%) |
| Total (Overall) | 93 (39.1%) | 145 (60.9%) |
Sales and Office Occupations
The most common Sales and Office occupations in Ghent are , and Sales & Related (9 | 3.8%).
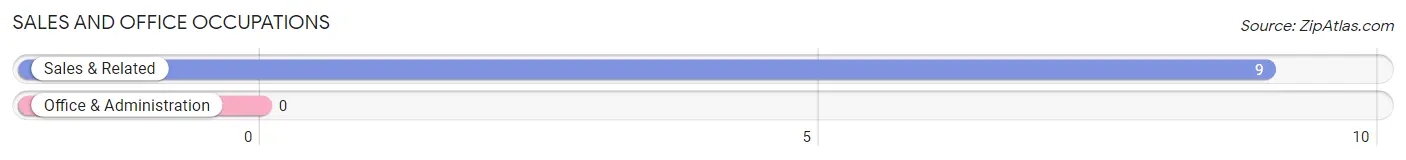
Sales and Office Occupations by Sex
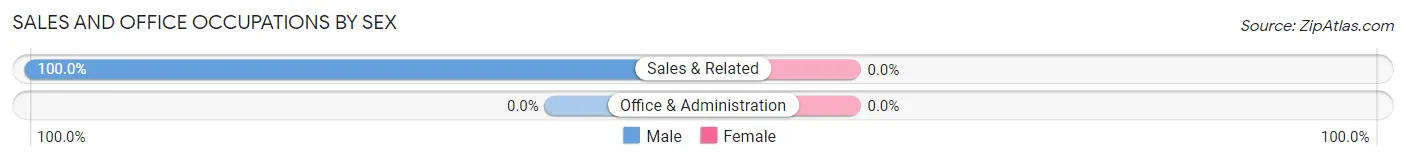
| Occupation | Male | Female |
| Sales & Related | 9 (100.0%) | 0 (0.0%) |
| Office & Administration | 0 (0.0%) | 0 (0.0%) |
| Total (Category) | 9 (100.0%) | 0 (0.0%) |
| Total (Overall) | 93 (39.1%) | 145 (60.9%) |
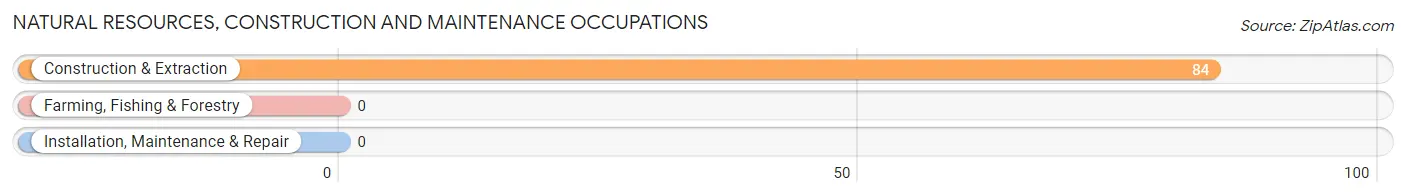
Natural Resources, Construction and Maintenance Occupations
The most common Natural Resources, Construction and Maintenance occupations in Ghent are , and Construction & Extraction (84 | 35.3%).
Natural Resources, Construction and Maintenance Occupations by Sex
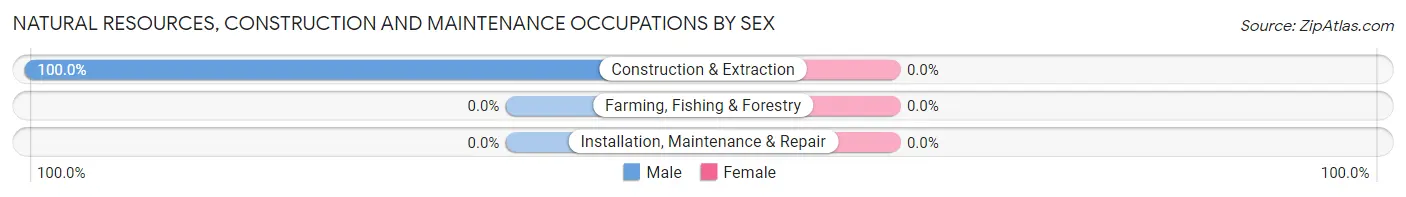
| Occupation | Male | Female |
| Farming, Fishing & Forestry | 0 (0.0%) | 0 (0.0%) |
| Construction & Extraction | 84 (100.0%) | 0 (0.0%) |
| Installation, Maintenance & Repair | 0 (0.0%) | 0 (0.0%) |
| Total (Category) | 84 (100.0%) | 0 (0.0%) |
| Total (Overall) | 93 (39.1%) | 145 (60.9%) |
Production, Transportation and Moving Occupations
Production, Transportation and Moving Occupations by Sex
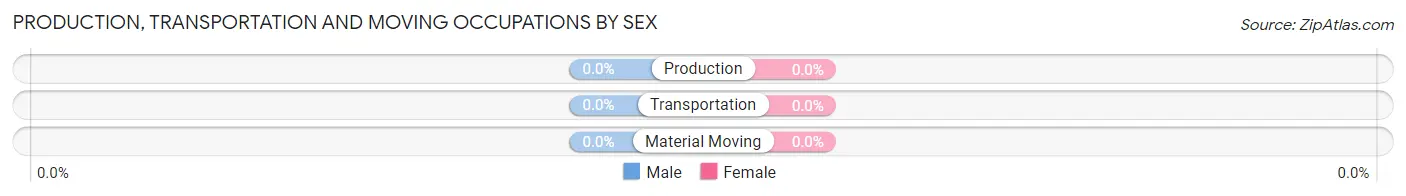
| Occupation | Male | Female |
| Production | 0 (0.0%) | 0 (0.0%) |
| Transportation | 0 (0.0%) | 0 (0.0%) |
| Material Moving | 0 (0.0%) | 0 (0.0%) |
| Total (Category) | 0 (0.0%) | 0 (0.0%) |
| Total (Overall) | 93 (39.1%) | 145 (60.9%) |
Employment Industries by Sex in Ghent
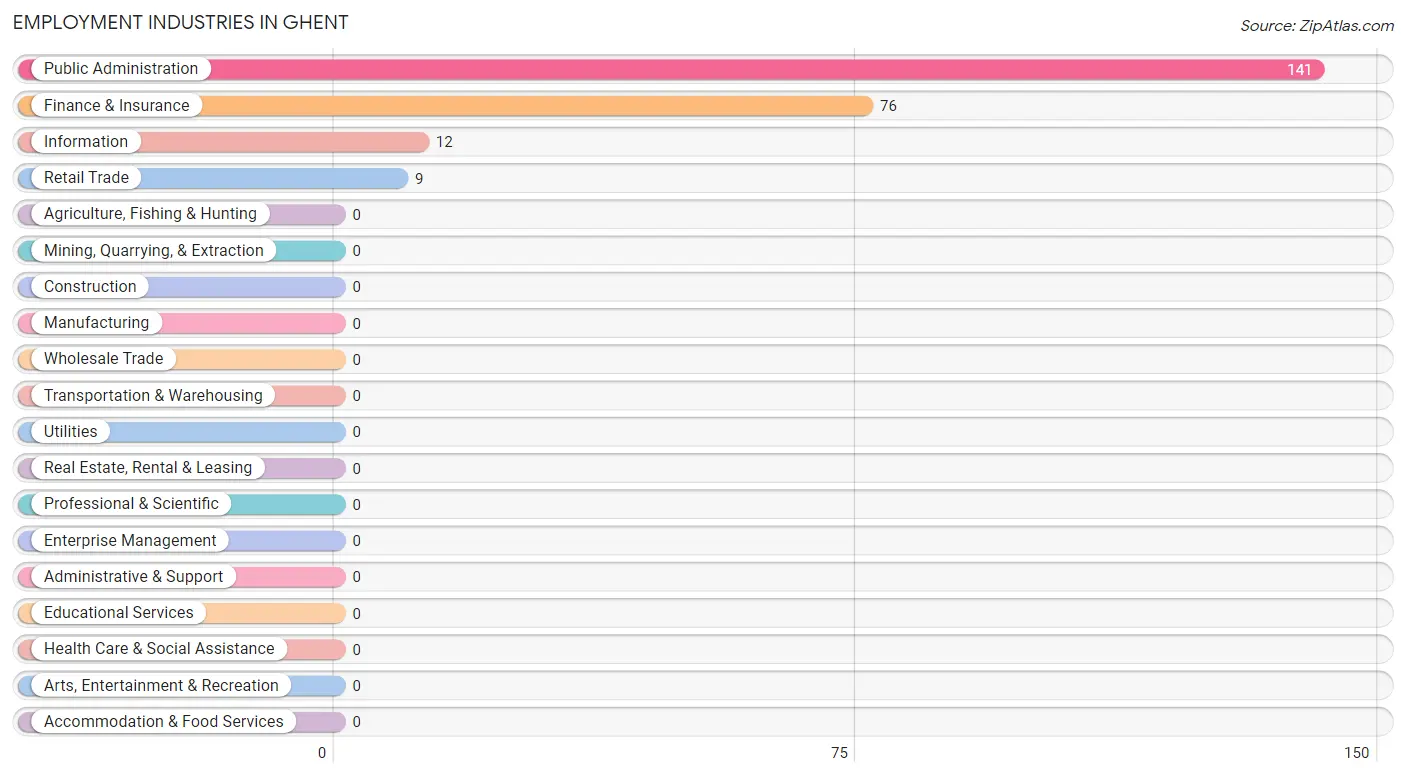
Employment Industries in Ghent
The major employment industries in Ghent include Public Administration (141 | 59.2%), Finance & Insurance (76 | 31.9%), Information (12 | 5.0%), and Retail Trade (9 | 3.8%).
Employment Industries by Sex in Ghent
The Ghent industries that see more men than women are Retail Trade (100.0%), and Public Administration (59.6%), whereas the industries that tend to have a higher number of women are Information (100.0%), Finance & Insurance (100.0%), and Public Administration (40.4%).
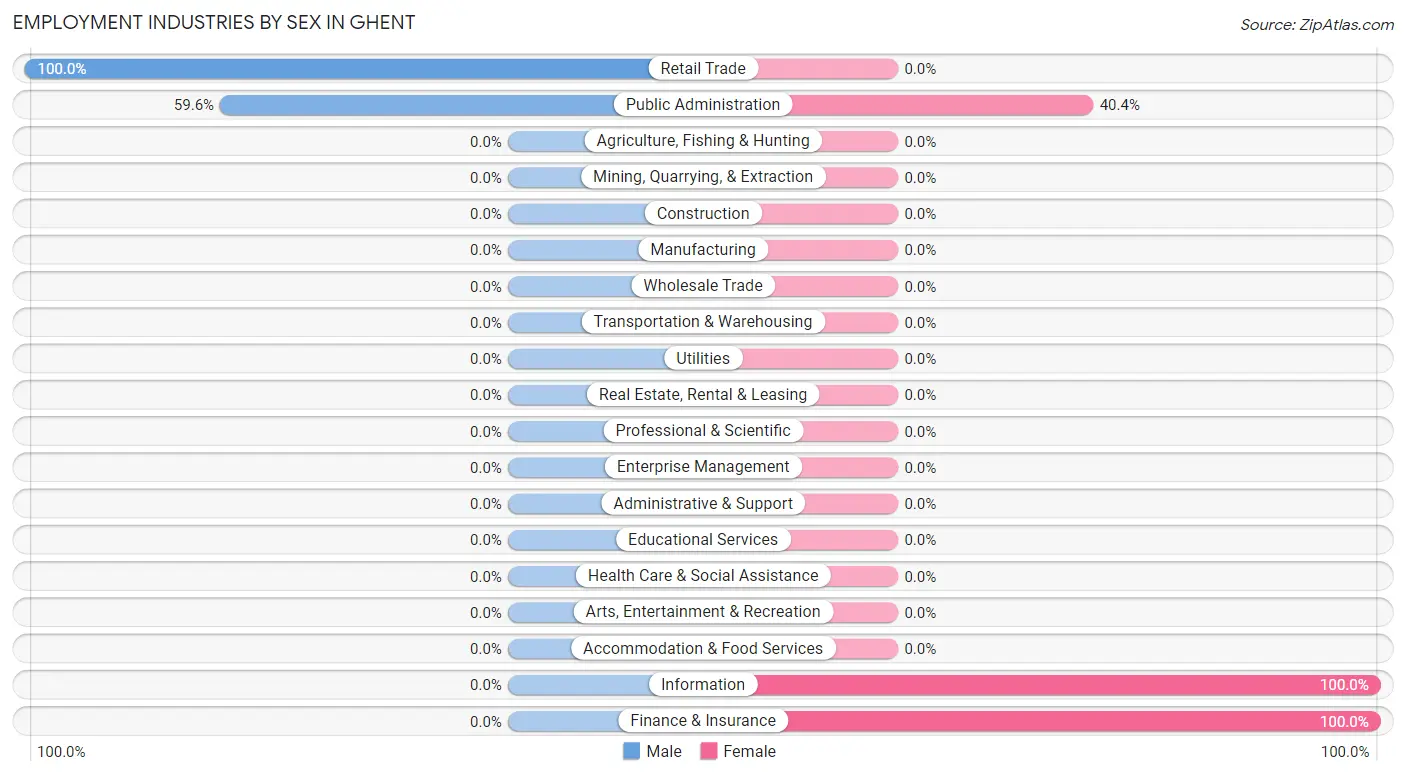
| Industry | Male | Female |
| Agriculture, Fishing & Hunting | 0 (0.0%) | 0 (0.0%) |
| Mining, Quarrying, & Extraction | 0 (0.0%) | 0 (0.0%) |
| Construction | 0 (0.0%) | 0 (0.0%) |
| Manufacturing | 0 (0.0%) | 0 (0.0%) |
| Wholesale Trade | 0 (0.0%) | 0 (0.0%) |
| Retail Trade | 9 (100.0%) | 0 (0.0%) |
| Transportation & Warehousing | 0 (0.0%) | 0 (0.0%) |
| Utilities | 0 (0.0%) | 0 (0.0%) |
| Information | 0 (0.0%) | 12 (100.0%) |
| Finance & Insurance | 0 (0.0%) | 76 (100.0%) |
| Real Estate, Rental & Leasing | 0 (0.0%) | 0 (0.0%) |
| Professional & Scientific | 0 (0.0%) | 0 (0.0%) |
| Enterprise Management | 0 (0.0%) | 0 (0.0%) |
| Administrative & Support | 0 (0.0%) | 0 (0.0%) |
| Educational Services | 0 (0.0%) | 0 (0.0%) |
| Health Care & Social Assistance | 0 (0.0%) | 0 (0.0%) |
| Arts, Entertainment & Recreation | 0 (0.0%) | 0 (0.0%) |
| Accommodation & Food Services | 0 (0.0%) | 0 (0.0%) |
| Public Administration | 84 (59.6%) | 57 (40.4%) |
| Total | 93 (39.1%) | 145 (60.9%) |
Education in Ghent
School Enrollment in Ghent
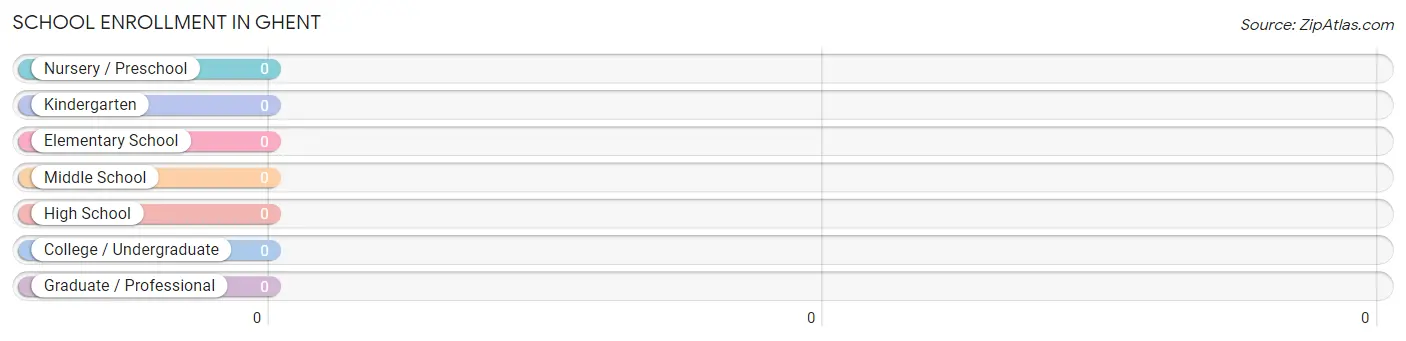
| School Level | # Students | % Students |
| Nursery / Preschool | 0 | 0.0% |
| Kindergarten | 0 | 0.0% |
| Elementary School | 0 | 0.0% |
| Middle School | 0 | 0.0% |
| High School | 0 | 0.0% |
| College / Undergraduate | 0 | 0.0% |
| Graduate / Professional | 0 | 0.0% |
| Total | 0 | 0.0% |
School Enrollment by Age by Funding Source in Ghent
| Age Bracket | Public School | Private School |
| 3 to 4 Year Olds | 0 (0.0%) | 0 (0.0%) |
| 5 to 9 Year Old | 0 (0.0%) | 0 (0.0%) |
| 10 to 14 Year Olds | 0 (0.0%) | 0 (0.0%) |
| 15 to 17 Year Olds | 0 (0.0%) | 0 (0.0%) |
| 18 to 19 Year Olds | 0 (0.0%) | 0 (0.0%) |
| 20 to 24 Year Olds | 0 (0.0%) | 0 (0.0%) |
| 25 to 34 Year Olds | 0 (0.0%) | 0 (0.0%) |
| 35 Years and over | 0 (0.0%) | 0 (0.0%) |
| Total | 0 (0.0%) | 0 (0.0%) |
Educational Attainment by Field of Study in Ghent
Business (113 | 77.9%), and education (32 | 22.1%) are the most common fields of study among 145 individuals in Ghent who have obtained a bachelor's degree or higher.
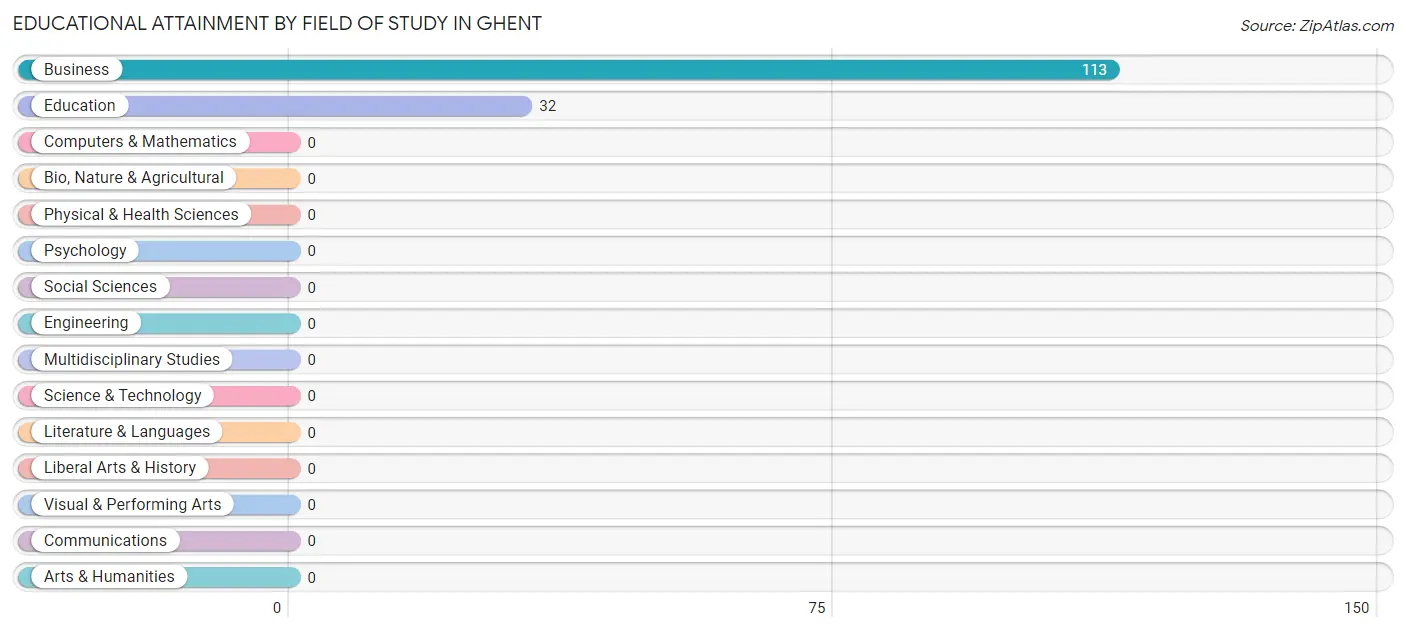
| Field of Study | # Graduates | % Graduates |
| Computers & Mathematics | 0 | 0.0% |
| Bio, Nature & Agricultural | 0 | 0.0% |
| Physical & Health Sciences | 0 | 0.0% |
| Psychology | 0 | 0.0% |
| Social Sciences | 0 | 0.0% |
| Engineering | 0 | 0.0% |
| Multidisciplinary Studies | 0 | 0.0% |
| Science & Technology | 0 | 0.0% |
| Business | 113 | 77.9% |
| Education | 32 | 22.1% |
| Literature & Languages | 0 | 0.0% |
| Liberal Arts & History | 0 | 0.0% |
| Visual & Performing Arts | 0 | 0.0% |
| Communications | 0 | 0.0% |
| Arts & Humanities | 0 | 0.0% |
| Total | 145 | 100.0% |
Transportation & Commute in Ghent
Vehicle Availability by Sex in Ghent
The most prevalent vehicle ownership categories in Ghent are males with 3 vehicles (84, accounting for 90.3%) and females with 3 vehicles (57, making up 57.9%).
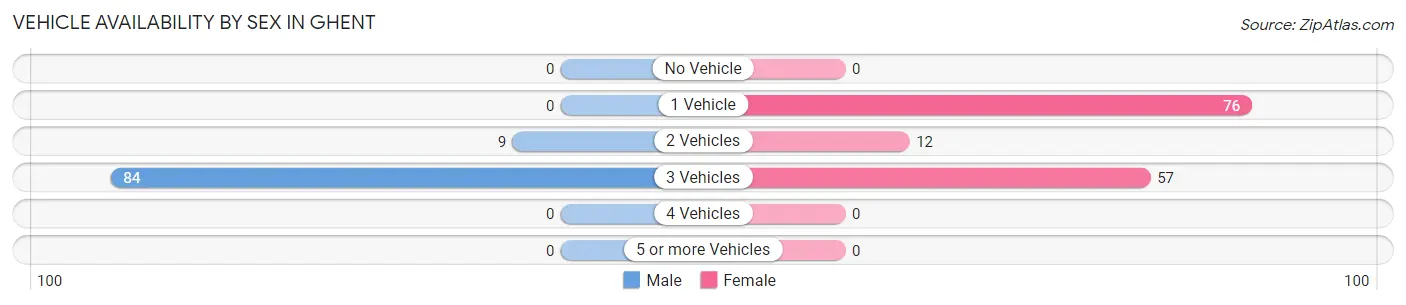
| Vehicles Available | Male | Female |
| No Vehicle | 0 (0.0%) | 0 (0.0%) |
| 1 Vehicle | 0 (0.0%) | 76 (52.4%) |
| 2 Vehicles | 9 (9.7%) | 12 (8.3%) |
| 3 Vehicles | 84 (90.3%) | 57 (39.3%) |
| 4 Vehicles | 0 (0.0%) | 0 (0.0%) |
| 5 or more Vehicles | 0 (0.0%) | 0 (0.0%) |
| Total | 93 (100.0%) | 145 (100.0%) |
Commute Time in Ghent
The most frequently occuring commute durations in Ghent are 90 or more minutes (141 commuters, 59.2%), 15 to 19 minutes (76 commuters, 31.9%), and 35 to 39 minutes (12 commuters, 5.0%).
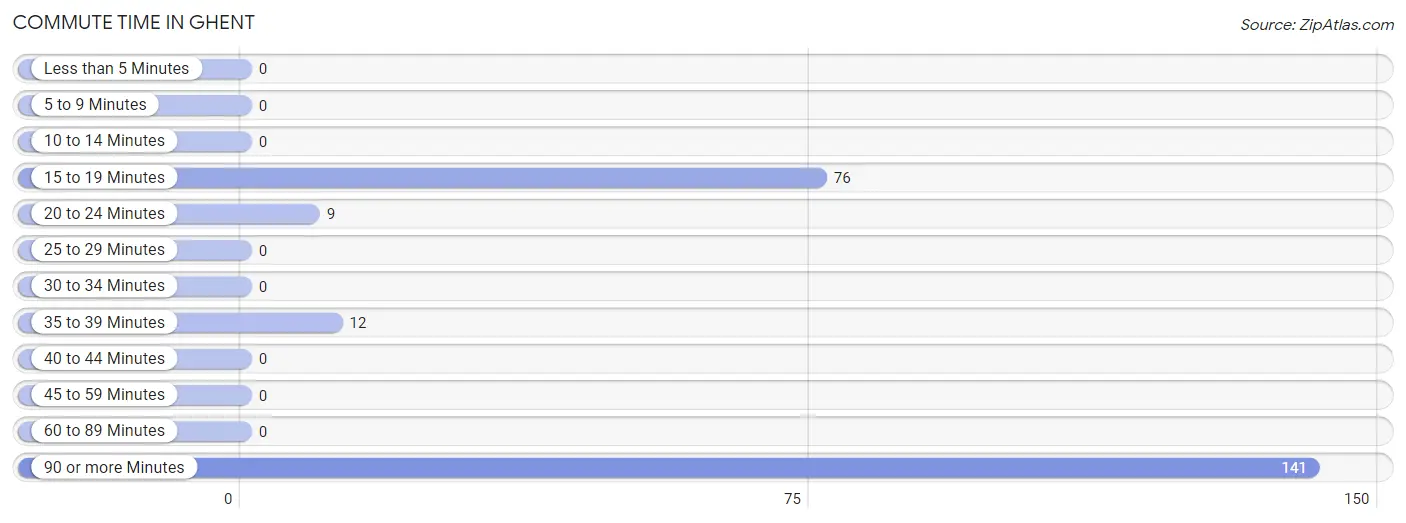
| Commute Time | # Commuters | % Commuters |
| Less than 5 Minutes | 0 | 0.0% |
| 5 to 9 Minutes | 0 | 0.0% |
| 10 to 14 Minutes | 0 | 0.0% |
| 15 to 19 Minutes | 76 | 31.9% |
| 20 to 24 Minutes | 9 | 3.8% |
| 25 to 29 Minutes | 0 | 0.0% |
| 30 to 34 Minutes | 0 | 0.0% |
| 35 to 39 Minutes | 12 | 5.0% |
| 40 to 44 Minutes | 0 | 0.0% |
| 45 to 59 Minutes | 0 | 0.0% |
| 60 to 89 Minutes | 0 | 0.0% |
| 90 or more Minutes | 141 | 59.2% |
Commute Time by Sex in Ghent
The most common commute times in Ghent are 90 or more minutes (84 commuters, 90.3%) for males and 15 to 19 minutes (76 commuters, 52.4%) for females.
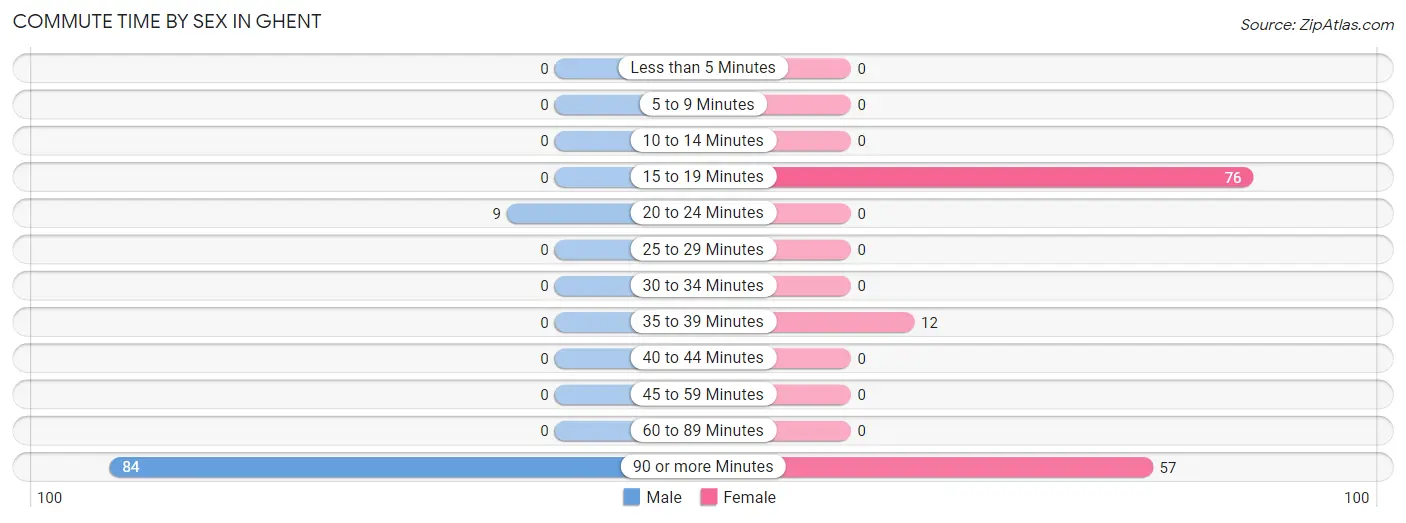
| Commute Time | Male | Female |
| Less than 5 Minutes | 0 (0.0%) | 0 (0.0%) |
| 5 to 9 Minutes | 0 (0.0%) | 0 (0.0%) |
| 10 to 14 Minutes | 0 (0.0%) | 0 (0.0%) |
| 15 to 19 Minutes | 0 (0.0%) | 76 (52.4%) |
| 20 to 24 Minutes | 9 (9.7%) | 0 (0.0%) |
| 25 to 29 Minutes | 0 (0.0%) | 0 (0.0%) |
| 30 to 34 Minutes | 0 (0.0%) | 0 (0.0%) |
| 35 to 39 Minutes | 0 (0.0%) | 12 (8.3%) |
| 40 to 44 Minutes | 0 (0.0%) | 0 (0.0%) |
| 45 to 59 Minutes | 0 (0.0%) | 0 (0.0%) |
| 60 to 89 Minutes | 0 (0.0%) | 0 (0.0%) |
| 90 or more Minutes | 84 (90.3%) | 57 (39.3%) |
Time of Departure to Work by Sex in Ghent
The most frequent times of departure to work in Ghent are 12:00 AM to 4:59 AM (93, 100.0%) for males and 9:00 AM to 9:59 AM (76, 52.4%) for females.
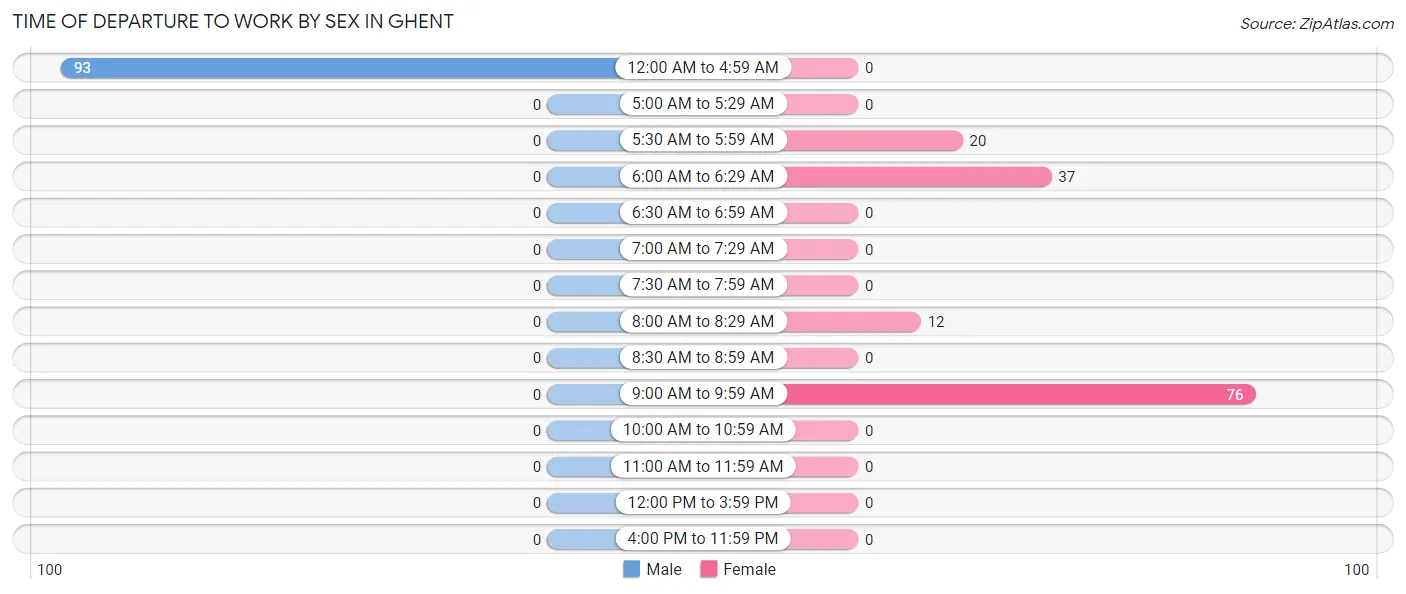
| Time of Departure | Male | Female |
| 12:00 AM to 4:59 AM | 93 (100.0%) | 0 (0.0%) |
| 5:00 AM to 5:29 AM | 0 (0.0%) | 0 (0.0%) |
| 5:30 AM to 5:59 AM | 0 (0.0%) | 20 (13.8%) |
| 6:00 AM to 6:29 AM | 0 (0.0%) | 37 (25.5%) |
| 6:30 AM to 6:59 AM | 0 (0.0%) | 0 (0.0%) |
| 7:00 AM to 7:29 AM | 0 (0.0%) | 0 (0.0%) |
| 7:30 AM to 7:59 AM | 0 (0.0%) | 0 (0.0%) |
| 8:00 AM to 8:29 AM | 0 (0.0%) | 12 (8.3%) |
| 8:30 AM to 8:59 AM | 0 (0.0%) | 0 (0.0%) |
| 9:00 AM to 9:59 AM | 0 (0.0%) | 76 (52.4%) |
| 10:00 AM to 10:59 AM | 0 (0.0%) | 0 (0.0%) |
| 11:00 AM to 11:59 AM | 0 (0.0%) | 0 (0.0%) |
| 12:00 PM to 3:59 PM | 0 (0.0%) | 0 (0.0%) |
| 4:00 PM to 11:59 PM | 0 (0.0%) | 0 (0.0%) |
| Total | 93 (100.0%) | 145 (100.0%) |
Housing Occupancy in Ghent
Occupancy by Ownership in Ghent
Of the total 272 dwellings in Ghent, owner-occupied units account for 235 (86.4%), while renter-occupied units make up 37 (13.6%).
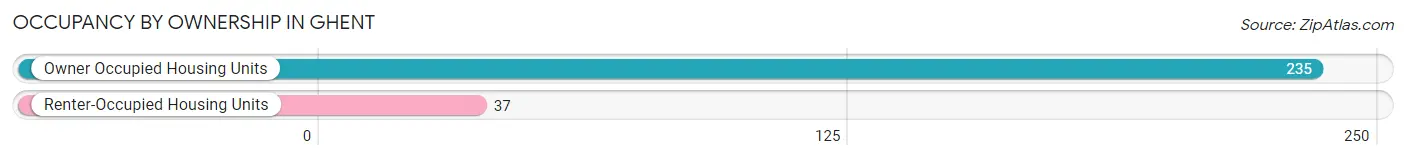
| Occupancy | # Housing Units | % Housing Units |
| Owner Occupied Housing Units | 235 | 86.4% |
| Renter-Occupied Housing Units | 37 | 13.6% |
| Total Occupied Housing Units | 272 | 100.0% |
Occupancy by Household Size in Ghent
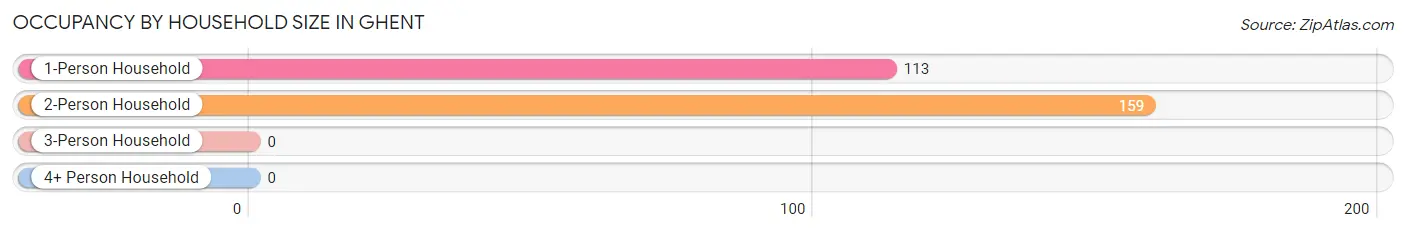
| Household Size | # Housing Units | % Housing Units |
| 1-Person Household | 113 | 41.5% |
| 2-Person Household | 159 | 58.5% |
| 3-Person Household | 0 | 0.0% |
| 4+ Person Household | 0 | 0.0% |
| Total Housing Units | 272 | 100.0% |
Occupancy by Ownership by Household Size in Ghent
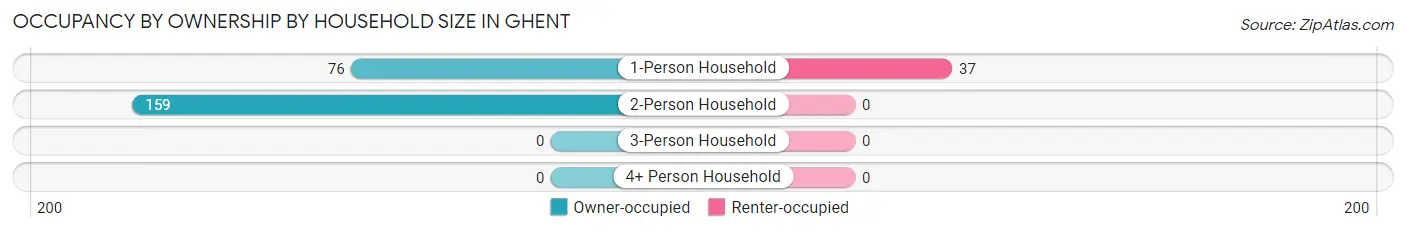
| Household Size | Owner-occupied | Renter-occupied |
| 1-Person Household | 76 (67.3%) | 37 (32.7%) |
| 2-Person Household | 159 (100.0%) | 0 (0.0%) |
| 3-Person Household | 0 (0.0%) | 0 (0.0%) |
| 4+ Person Household | 0 (0.0%) | 0 (0.0%) |
| Total Housing Units | 235 (86.4%) | 37 (13.6%) |
Occupancy by Educational Attainment in Ghent
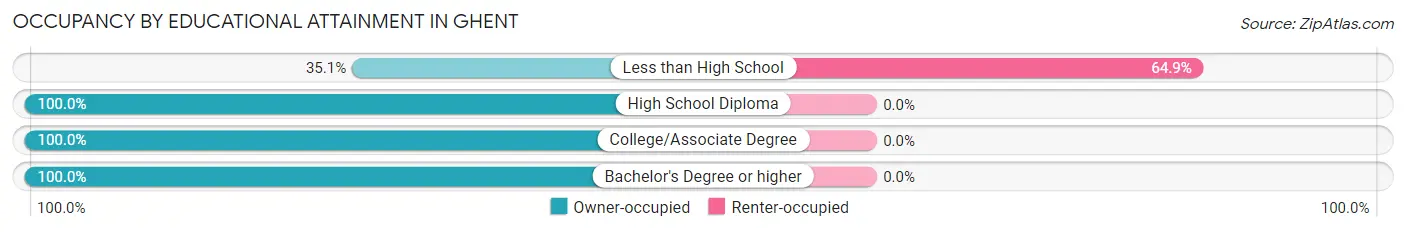
| Household Size | Owner-occupied | Renter-occupied |
| Less than High School | 20 (35.1%) | 37 (64.9%) |
| High School Diploma | 84 (100.0%) | 0 (0.0%) |
| College/Associate Degree | 43 (100.0%) | 0 (0.0%) |
| Bachelor's Degree or higher | 88 (100.0%) | 0 (0.0%) |
Occupancy by Age of Householder in Ghent
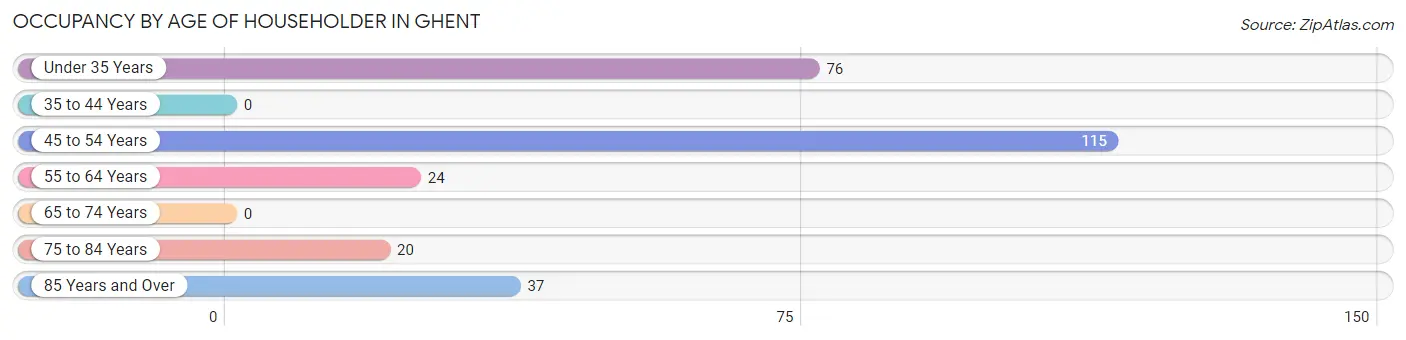
| Age Bracket | # Households | % Households |
| Under 35 Years | 76 | 27.9% |
| 35 to 44 Years | 0 | 0.0% |
| 45 to 54 Years | 115 | 42.3% |
| 55 to 64 Years | 24 | 8.8% |
| 65 to 74 Years | 0 | 0.0% |
| 75 to 84 Years | 20 | 7.3% |
| 85 Years and Over | 37 | 13.6% |
| Total | 272 | 100.0% |
Housing Finances in Ghent
Median Income by Occupancy in Ghent
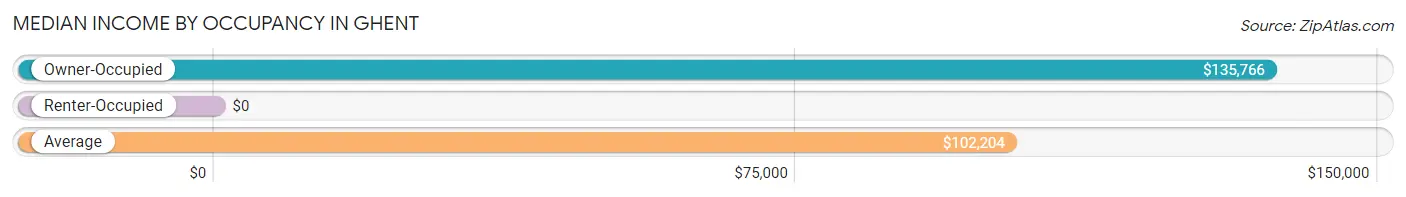
| Occupancy Type | # Households | Median Income |
| Owner-Occupied | 235 (86.4%) | $135,766 |
| Renter-Occupied | 37 (13.6%) | $0 |
| Average | 272 (100.0%) | $102,204 |
Occupancy by Householder Income Bracket in Ghent
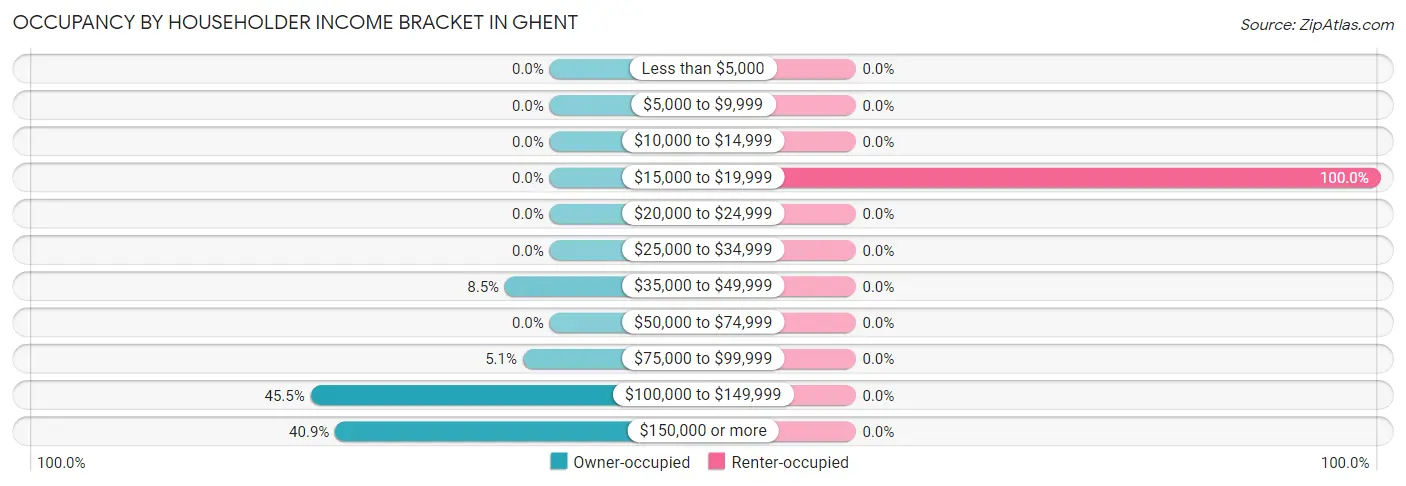
| Income Bracket | Owner-occupied | Renter-occupied |
| Less than $5,000 | 0 (0.0%) | 0 (0.0%) |
| $5,000 to $9,999 | 0 (0.0%) | 0 (0.0%) |
| $10,000 to $14,999 | 0 (0.0%) | 0 (0.0%) |
| $15,000 to $19,999 | 0 (0.0%) | 37 (100.0%) |
| $20,000 to $24,999 | 0 (0.0%) | 0 (0.0%) |
| $25,000 to $34,999 | 0 (0.0%) | 0 (0.0%) |
| $35,000 to $49,999 | 20 (8.5%) | 0 (0.0%) |
| $50,000 to $74,999 | 0 (0.0%) | 0 (0.0%) |
| $75,000 to $99,999 | 12 (5.1%) | 0 (0.0%) |
| $100,000 to $149,999 | 107 (45.5%) | 0 (0.0%) |
| $150,000 or more | 96 (40.8%) | 0 (0.0%) |
| Total | 235 (100.0%) | 37 (100.0%) |
Monthly Housing Cost Tiers in Ghent
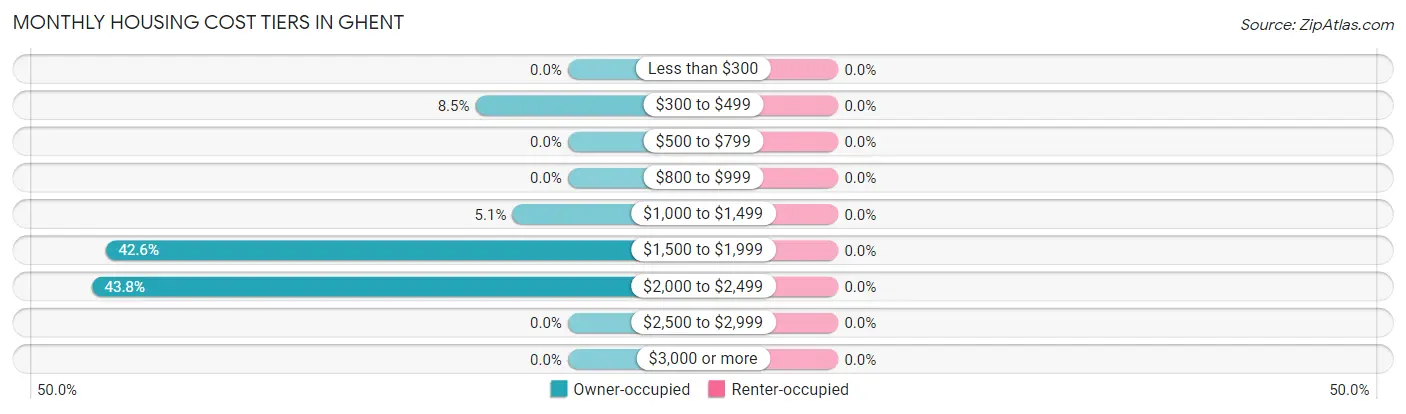
| Monthly Cost | Owner-occupied | Renter-occupied |
| Less than $300 | 0 (0.0%) | 0 (0.0%) |
| $300 to $499 | 20 (8.5%) | 0 (0.0%) |
| $500 to $799 | 0 (0.0%) | 0 (0.0%) |
| $800 to $999 | 0 (0.0%) | 0 (0.0%) |
| $1,000 to $1,499 | 12 (5.1%) | 0 (0.0%) |
| $1,500 to $1,999 | 100 (42.5%) | 0 (0.0%) |
| $2,000 to $2,499 | 103 (43.8%) | 0 (0.0%) |
| $2,500 to $2,999 | 0 (0.0%) | 0 (0.0%) |
| $3,000 or more | 0 (0.0%) | 0 (0.0%) |
| Total | 235 (100.0%) | 37 (100.0%) |
Physical Housing Characteristics in Ghent
Housing Structures in Ghent
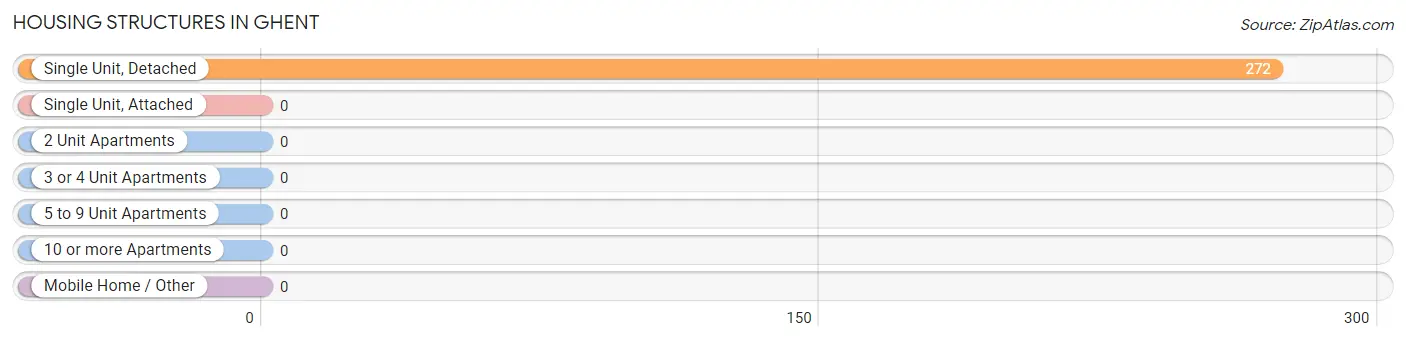
| Structure Type | # Housing Units | % Housing Units |
| Single Unit, Detached | 272 | 100.0% |
| Single Unit, Attached | 0 | 0.0% |
| 2 Unit Apartments | 0 | 0.0% |
| 3 or 4 Unit Apartments | 0 | 0.0% |
| 5 to 9 Unit Apartments | 0 | 0.0% |
| 10 or more Apartments | 0 | 0.0% |
| Mobile Home / Other | 0 | 0.0% |
| Total | 272 | 100.0% |
Housing Structures by Occupancy in Ghent
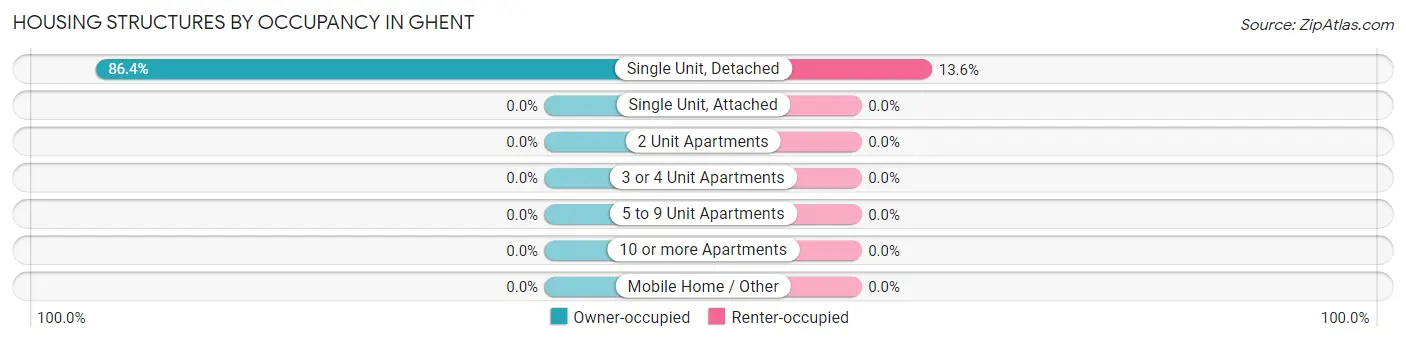
| Structure Type | Owner-occupied | Renter-occupied |
| Single Unit, Detached | 235 (86.4%) | 37 (13.6%) |
| Single Unit, Attached | 0 (0.0%) | 0 (0.0%) |
| 2 Unit Apartments | 0 (0.0%) | 0 (0.0%) |
| 3 or 4 Unit Apartments | 0 (0.0%) | 0 (0.0%) |
| 5 to 9 Unit Apartments | 0 (0.0%) | 0 (0.0%) |
| 10 or more Apartments | 0 (0.0%) | 0 (0.0%) |
| Mobile Home / Other | 0 (0.0%) | 0 (0.0%) |
| Total | 235 (86.4%) | 37 (13.6%) |
Housing Structures by Number of Rooms in Ghent
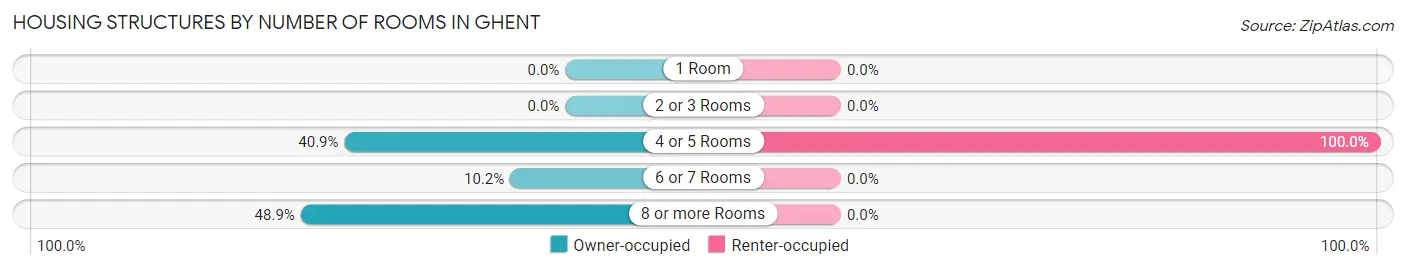
| Number of Rooms | Owner-occupied | Renter-occupied |
| 1 Room | 0 (0.0%) | 0 (0.0%) |
| 2 or 3 Rooms | 0 (0.0%) | 0 (0.0%) |
| 4 or 5 Rooms | 96 (40.8%) | 37 (100.0%) |
| 6 or 7 Rooms | 24 (10.2%) | 0 (0.0%) |
| 8 or more Rooms | 115 (48.9%) | 0 (0.0%) |
| Total | 235 (100.0%) | 37 (100.0%) |
Housing Structure by Heating Type in Ghent
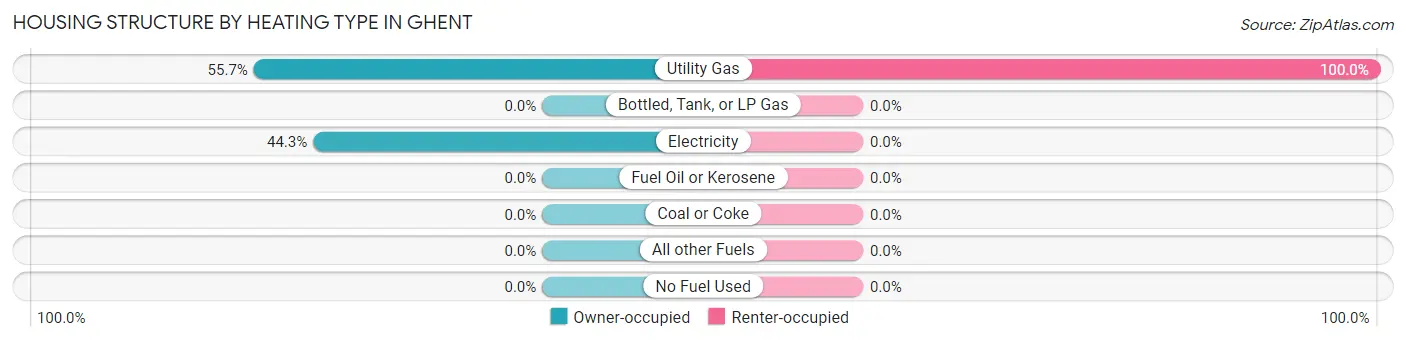
| Heating Type | Owner-occupied | Renter-occupied |
| Utility Gas | 131 (55.7%) | 37 (100.0%) |
| Bottled, Tank, or LP Gas | 0 (0.0%) | 0 (0.0%) |
| Electricity | 104 (44.3%) | 0 (0.0%) |
| Fuel Oil or Kerosene | 0 (0.0%) | 0 (0.0%) |
| Coal or Coke | 0 (0.0%) | 0 (0.0%) |
| All other Fuels | 0 (0.0%) | 0 (0.0%) |
| No Fuel Used | 0 (0.0%) | 0 (0.0%) |
| Total | 235 (100.0%) | 37 (100.0%) |
Household Vehicle Usage in Ghent
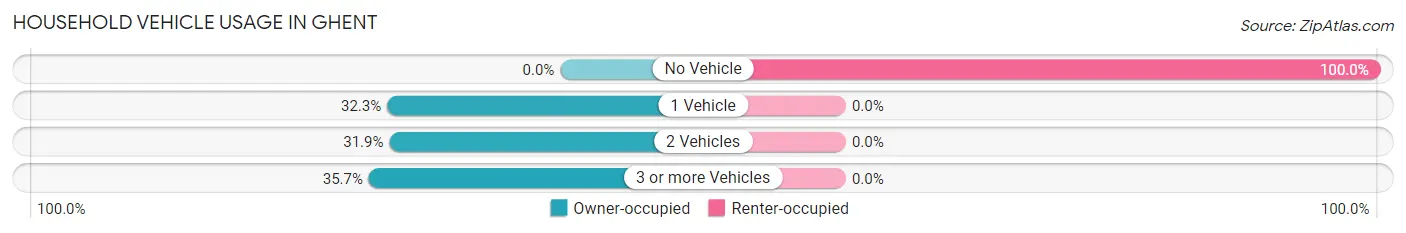
| Vehicles per Household | Owner-occupied | Renter-occupied |
| No Vehicle | 0 (0.0%) | 37 (100.0%) |
| 1 Vehicle | 76 (32.3%) | 0 (0.0%) |
| 2 Vehicles | 75 (31.9%) | 0 (0.0%) |
| 3 or more Vehicles | 84 (35.7%) | 0 (0.0%) |
| Total | 235 (100.0%) | 37 (100.0%) |
Real Estate & Mortgages in Ghent
Real Estate and Mortgage Overview in Ghent
| Characteristic | Without Mortgage | With Mortgage |
| Housing Units | 51 | 184 |
| Median Property Value | - | - |
| Median Household Income | - | - |
| Monthly Housing Costs | - | - |
| Real Estate Taxes | - | - |
Property Value by Mortgage Status in Ghent
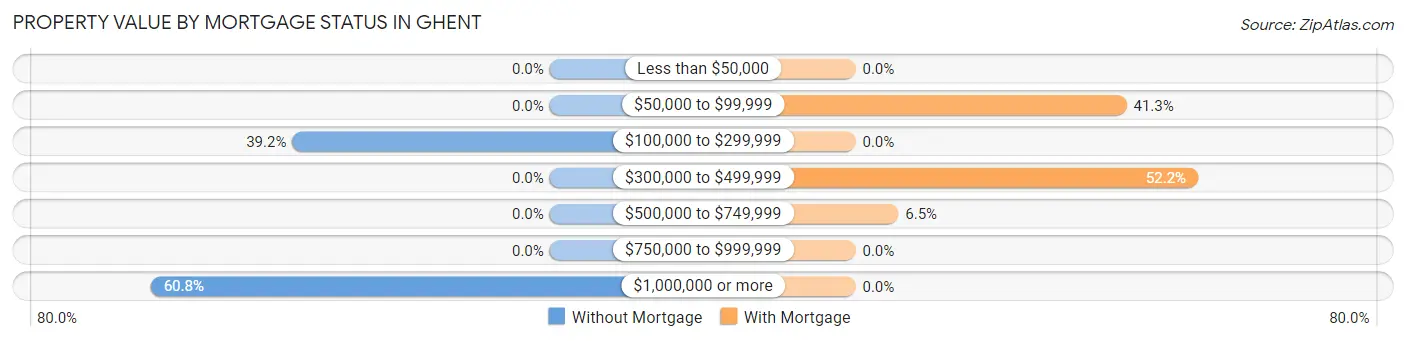
| Property Value | Without Mortgage | With Mortgage |
| Less than $50,000 | 0 (0.0%) | 0 (0.0%) |
| $50,000 to $99,999 | 0 (0.0%) | 76 (41.3%) |
| $100,000 to $299,999 | 20 (39.2%) | 0 (0.0%) |
| $300,000 to $499,999 | 0 (0.0%) | 96 (52.2%) |
| $500,000 to $749,999 | 0 (0.0%) | 12 (6.5%) |
| $750,000 to $999,999 | 0 (0.0%) | 0 (0.0%) |
| $1,000,000 or more | 31 (60.8%) | 0 (0.0%) |
| Total | 51 (100.0%) | 184 (100.0%) |
Household Income by Mortgage Status in Ghent
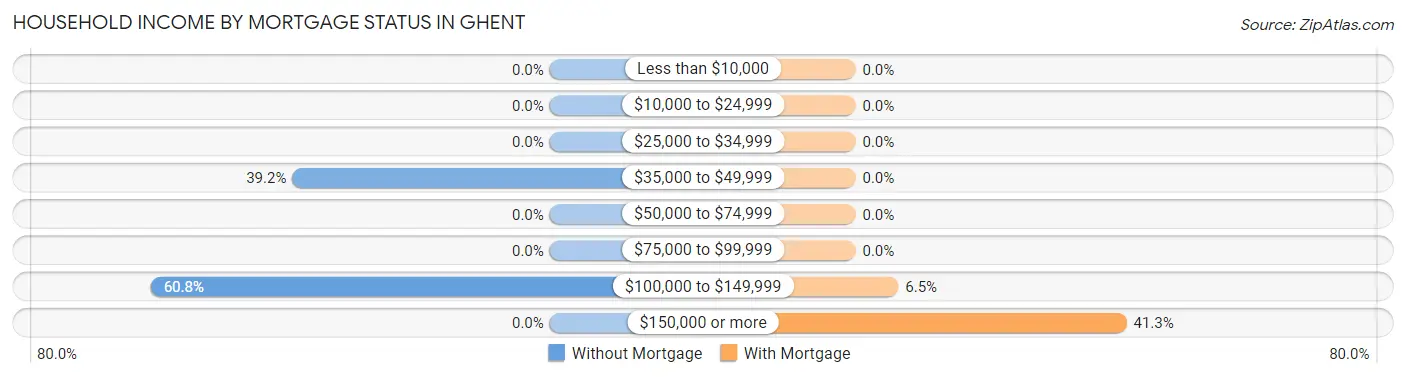
| Household Income | Without Mortgage | With Mortgage |
| Less than $10,000 | 0 (0.0%) | 0 (0.0%) |
| $10,000 to $24,999 | 0 (0.0%) | 0 (0.0%) |
| $25,000 to $34,999 | 0 (0.0%) | 0 (0.0%) |
| $35,000 to $49,999 | 20 (39.2%) | 0 (0.0%) |
| $50,000 to $74,999 | 0 (0.0%) | 0 (0.0%) |
| $75,000 to $99,999 | 0 (0.0%) | 0 (0.0%) |
| $100,000 to $149,999 | 31 (60.8%) | 12 (6.5%) |
| $150,000 or more | 0 (0.0%) | 76 (41.3%) |
| Total | 51 (100.0%) | 184 (100.0%) |
Property Value to Household Income Ratio in Ghent
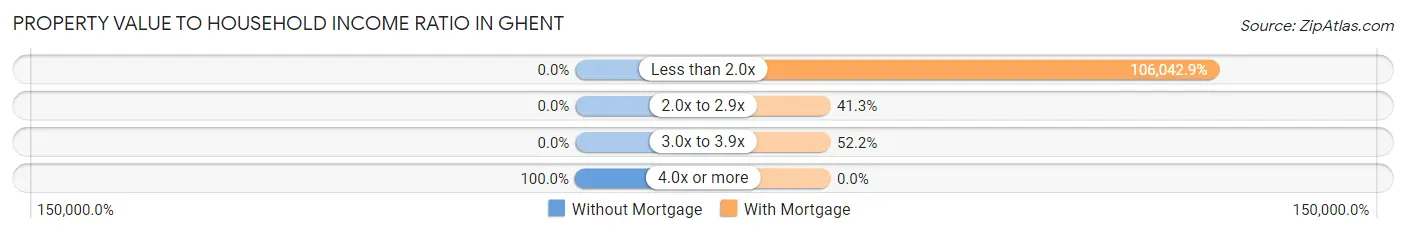
| Value-to-Income Ratio | Without Mortgage | With Mortgage |
| Less than 2.0x | 0 (0.0%) | 195,119 (106,042.9%) |
| 2.0x to 2.9x | 0 (0.0%) | 76 (41.3%) |
| 3.0x to 3.9x | 0 (0.0%) | 96 (52.2%) |
| 4.0x or more | 51 (100.0%) | 0 (0.0%) |
| Total | 51 (100.0%) | 184 (100.0%) |
Real Estate Taxes by Mortgage Status in Ghent
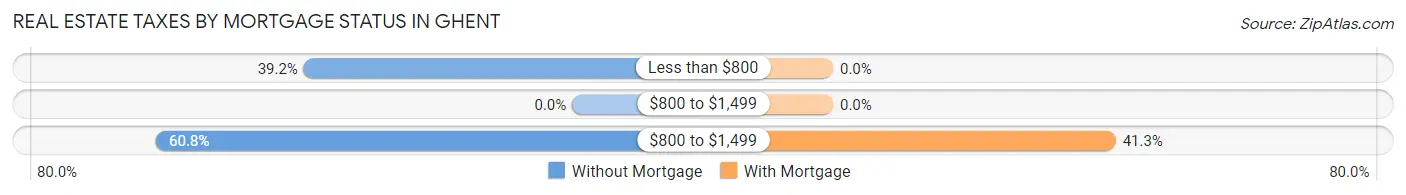
| Property Taxes | Without Mortgage | With Mortgage |
| Less than $800 | 20 (39.2%) | 0 (0.0%) |
| $800 to $1,499 | 0 (0.0%) | 0 (0.0%) |
| $800 to $1,499 | 31 (60.8%) | 76 (41.3%) |
| Total | 51 (100.0%) | 184 (100.0%) |
Health & Disability in Ghent
Health Insurance Coverage by Age in Ghent
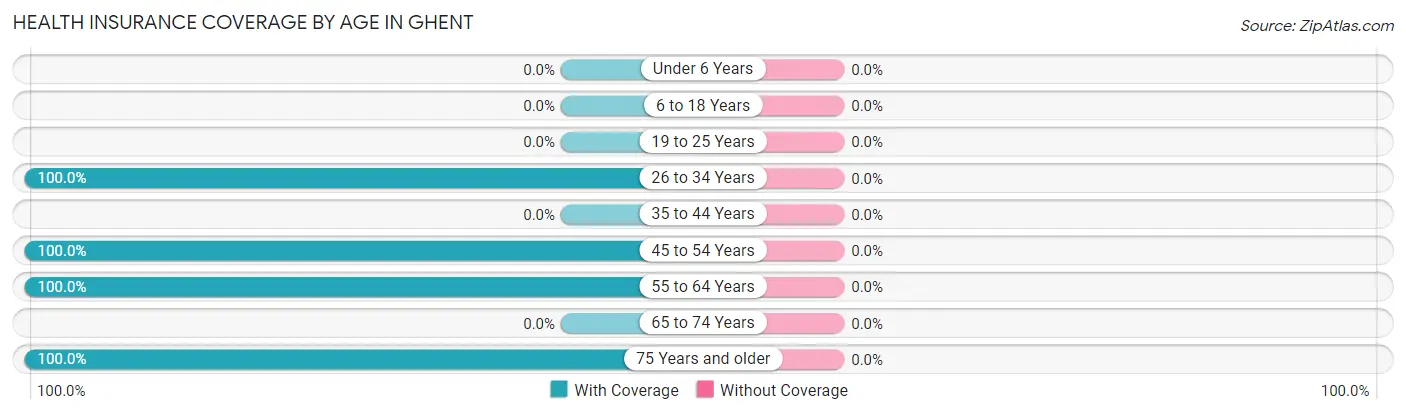
| Age Bracket | With Coverage | Without Coverage |
| Under 6 Years | 0 (0.0%) | 0 (0.0%) |
| 6 to 18 Years | 0 (0.0%) | 0 (0.0%) |
| 19 to 25 Years | 0 (0.0%) | 0 (0.0%) |
| 26 to 34 Years | 76 (100.0%) | 0 (0.0%) |
| 35 to 44 Years | 0 (0.0%) | 0 (0.0%) |
| 45 to 54 Years | 172 (100.0%) | 0 (0.0%) |
| 55 to 64 Years | 62 (100.0%) | 0 (0.0%) |
| 65 to 74 Years | 0 (0.0%) | 0 (0.0%) |
| 75 Years and older | 80 (100.0%) | 0 (0.0%) |
| Total | 390 (100.0%) | 0 (0.0%) |
Health Insurance Coverage by Citizenship Status in Ghent
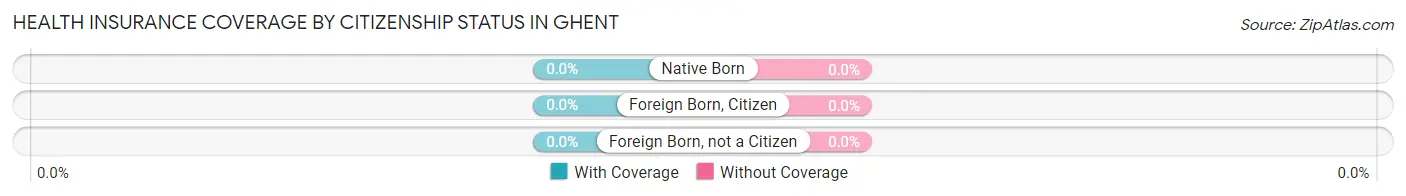
| Citizenship Status | With Coverage | Without Coverage |
| Native Born | 0 (0.0%) | 0 (0.0%) |
| Foreign Born, Citizen | 0 (0.0%) | 0 (0.0%) |
| Foreign Born, not a Citizen | 0 (0.0%) | 0 (0.0%) |
Health Insurance Coverage by Household Income in Ghent
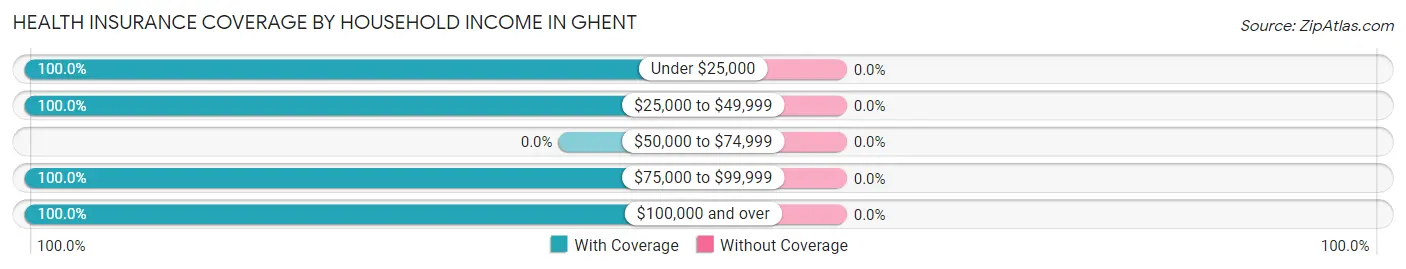
| Household Income | With Coverage | Without Coverage |
| Under $25,000 | 37 (100.0%) | 0 (0.0%) |
| $25,000 to $49,999 | 43 (100.0%) | 0 (0.0%) |
| $50,000 to $74,999 | 0 (0.0%) | 0 (0.0%) |
| $75,000 to $99,999 | 27 (100.0%) | 0 (0.0%) |
| $100,000 and over | 283 (100.0%) | 0 (0.0%) |
Public vs Private Health Insurance Coverage by Age in Ghent
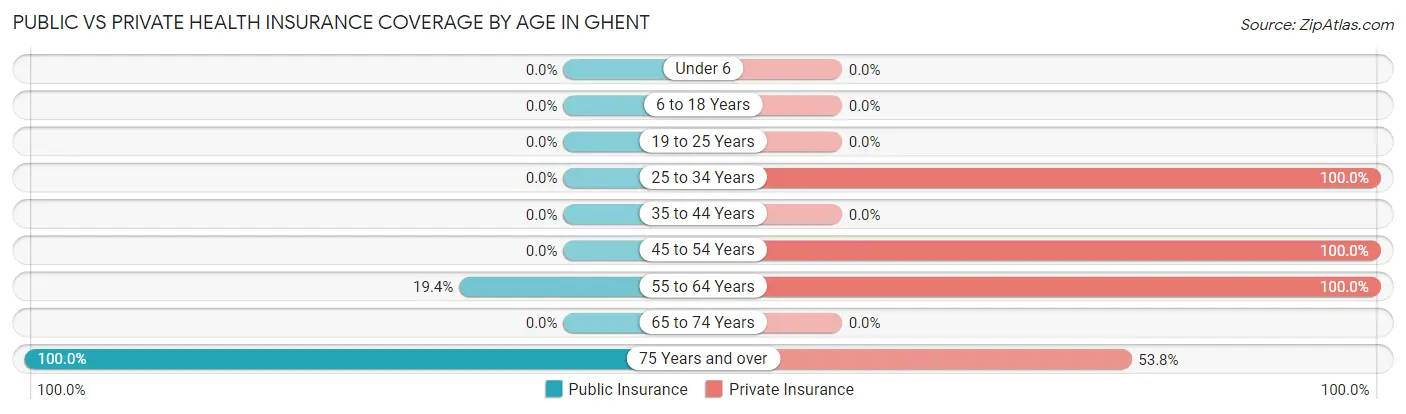
| Age Bracket | Public Insurance | Private Insurance |
| Under 6 | 0 (0.0%) | 0 (0.0%) |
| 6 to 18 Years | 0 (0.0%) | 0 (0.0%) |
| 19 to 25 Years | 0 (0.0%) | 0 (0.0%) |
| 25 to 34 Years | 0 (0.0%) | 76 (100.0%) |
| 35 to 44 Years | 0 (0.0%) | 0 (0.0%) |
| 45 to 54 Years | 0 (0.0%) | 172 (100.0%) |
| 55 to 64 Years | 12 (19.4%) | 62 (100.0%) |
| 65 to 74 Years | 0 (0.0%) | 0 (0.0%) |
| 75 Years and over | 80 (100.0%) | 43 (53.7%) |
| Total | 92 (23.6%) | 353 (90.5%) |
Disability Status by Sex by Age in Ghent
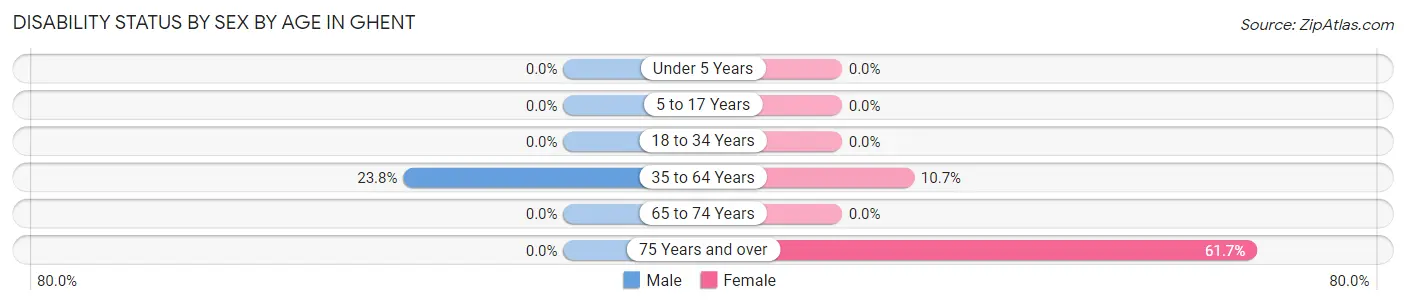
| Age Bracket | Male | Female |
| Under 5 Years | 0 (0.0%) | 0 (0.0%) |
| 5 to 17 Years | 0 (0.0%) | 0 (0.0%) |
| 18 to 34 Years | 0 (0.0%) | 0 (0.0%) |
| 35 to 64 Years | 29 (23.8%) | 12 (10.7%) |
| 65 to 74 Years | 0 (0.0%) | 0 (0.0%) |
| 75 Years and over | 0 (0.0%) | 37 (61.7%) |
Disability Class by Sex by Age in Ghent
Disability Class: Hearing Difficulty
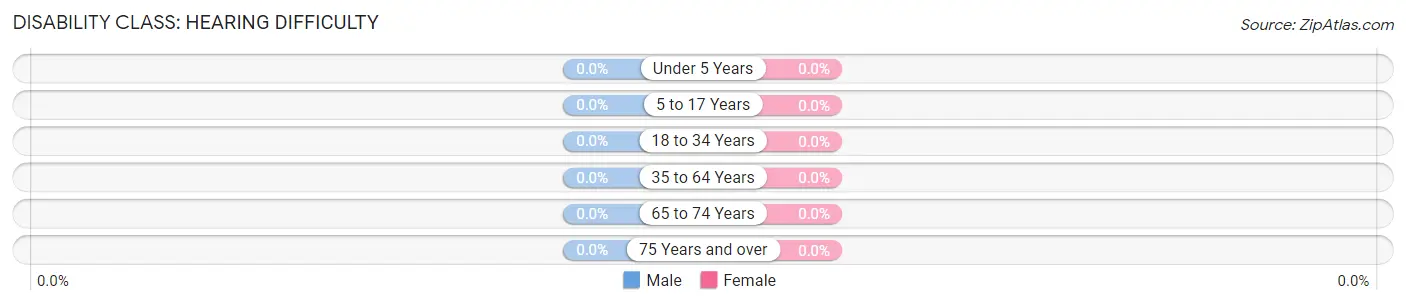
| Age Bracket | Male | Female |
| Under 5 Years | 0 (0.0%) | 0 (0.0%) |
| 5 to 17 Years | 0 (0.0%) | 0 (0.0%) |
| 18 to 34 Years | 0 (0.0%) | 0 (0.0%) |
| 35 to 64 Years | 0 (0.0%) | 0 (0.0%) |
| 65 to 74 Years | 0 (0.0%) | 0 (0.0%) |
| 75 Years and over | 0 (0.0%) | 0 (0.0%) |
Disability Class: Vision Difficulty
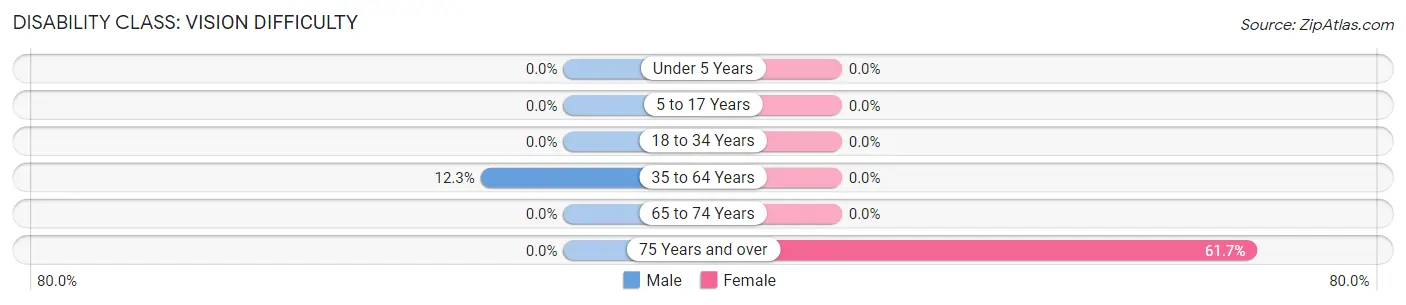
| Age Bracket | Male | Female |
| Under 5 Years | 0 (0.0%) | 0 (0.0%) |
| 5 to 17 Years | 0 (0.0%) | 0 (0.0%) |
| 18 to 34 Years | 0 (0.0%) | 0 (0.0%) |
| 35 to 64 Years | 15 (12.3%) | 0 (0.0%) |
| 65 to 74 Years | 0 (0.0%) | 0 (0.0%) |
| 75 Years and over | 0 (0.0%) | 37 (61.7%) |
Disability Class: Cognitive Difficulty
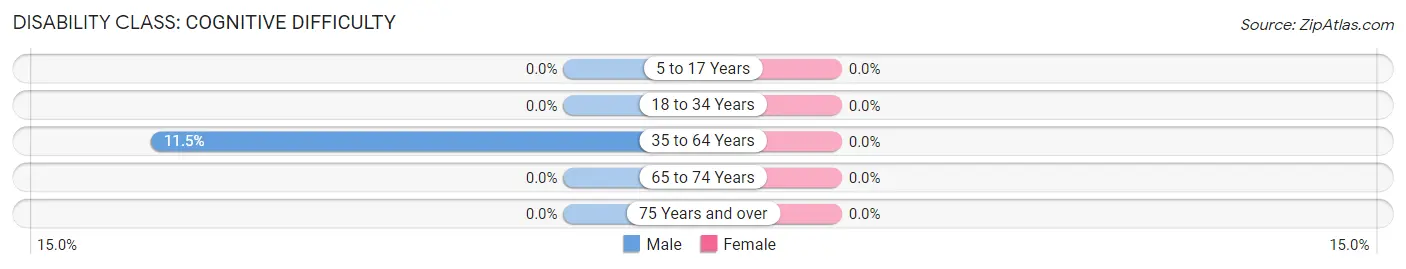
| Age Bracket | Male | Female |
| 5 to 17 Years | 0 (0.0%) | 0 (0.0%) |
| 18 to 34 Years | 0 (0.0%) | 0 (0.0%) |
| 35 to 64 Years | 14 (11.5%) | 0 (0.0%) |
| 65 to 74 Years | 0 (0.0%) | 0 (0.0%) |
| 75 Years and over | 0 (0.0%) | 0 (0.0%) |
Disability Class: Ambulatory Difficulty
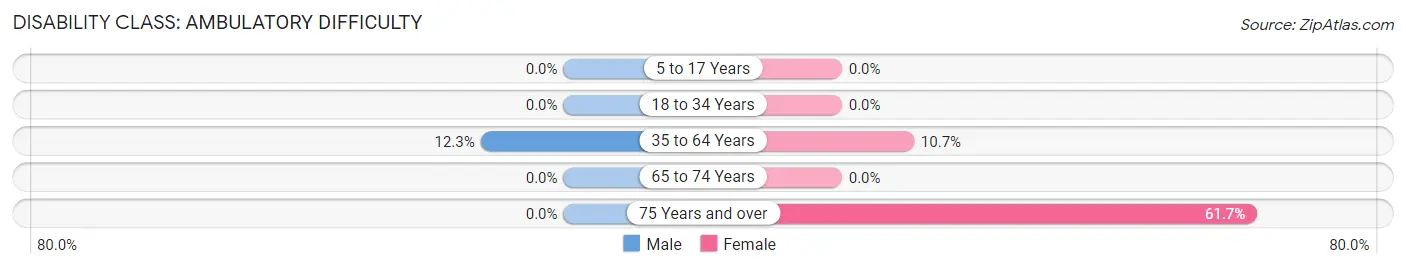
| Age Bracket | Male | Female |
| 5 to 17 Years | 0 (0.0%) | 0 (0.0%) |
| 18 to 34 Years | 0 (0.0%) | 0 (0.0%) |
| 35 to 64 Years | 15 (12.3%) | 12 (10.7%) |
| 65 to 74 Years | 0 (0.0%) | 0 (0.0%) |
| 75 Years and over | 0 (0.0%) | 37 (61.7%) |
Disability Class: Self-Care Difficulty
| Age Bracket | Male | Female |
| 5 to 17 Years | 0 (0.0%) | 0 (0.0%) |
| 18 to 34 Years | 0 (0.0%) | 0 (0.0%) |
| 35 to 64 Years | 0 (0.0%) | 0 (0.0%) |
| 65 to 74 Years | 0 (0.0%) | 0 (0.0%) |
| 75 Years and over | 0 (0.0%) | 0 (0.0%) |
Technology Access in Ghent
Computing Device Access in Ghent
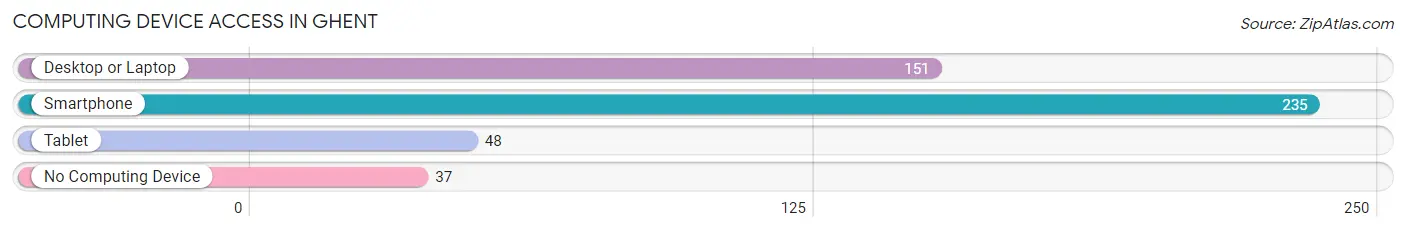
| Device Type | # Households | % Households |
| Desktop or Laptop | 151 | 55.5% |
| Smartphone | 235 | 86.4% |
| Tablet | 48 | 17.6% |
| No Computing Device | 37 | 13.6% |
| Total | 272 | 100.0% |
Internet Access in Ghent
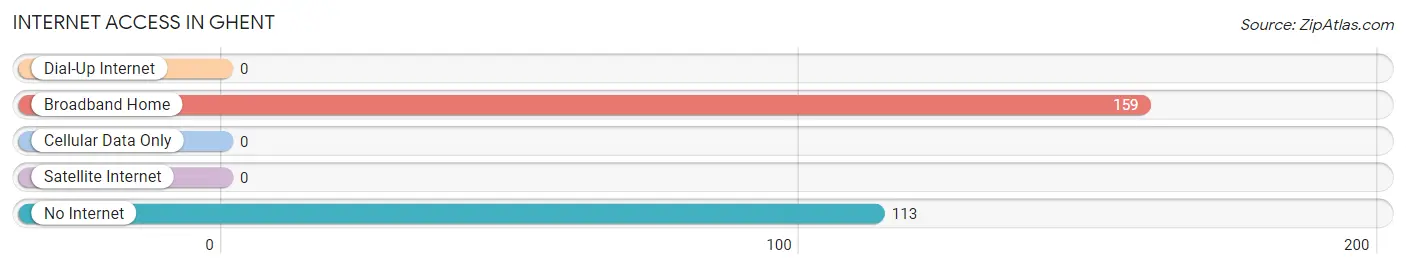
| Internet Type | # Households | % Households |
| Dial-Up Internet | 0 | 0.0% |
| Broadband Home | 159 | 58.5% |
| Cellular Data Only | 0 | 0.0% |
| Satellite Internet | 0 | 0.0% |
| No Internet | 113 | 41.5% |
| Total | 272 | 100.0% |
Ghent Summary
Ghent is a small town located in Mason County, West Virginia. It is situated on the banks of the Ohio River, just south of the city of Point Pleasant. The town was founded in 1817 and has a population of approximately 1,000 people.
Geography
Ghent is located in the Appalachian Mountains of West Virginia. The town is situated on the banks of the Ohio River, just south of the city of Point Pleasant. The town is surrounded by rolling hills and forests, and is home to a variety of wildlife. The town is located in a temperate climate, with hot summers and cold winters.
Economy
Ghent’s economy is largely based on agriculture and tourism. The town is home to several farms, which produce a variety of crops, including corn, soybeans, and hay. The town also has a number of small businesses, including restaurants, shops, and a few small manufacturing plants. Tourism is also an important part of the local economy, as the town is home to several historic sites, including the Ghent Historic District and the Ghent Mansion.
Demographics
As of the 2010 census, Ghent had a population of 1,000 people. The town is predominantly white, with a small African American population. The median household income is $35,000, and the median age is 44. The town has a high rate of poverty, with nearly 30% of the population living below the poverty line.
History
Ghent was founded in 1817 by a group of settlers from Pennsylvania. The town was named after the city of Ghent in Belgium. The town quickly grew, and by the mid-1800s, it was a thriving community. The town was home to several businesses, including a sawmill, a gristmill, and a tannery. The town was also home to a number of churches, including the Ghent Methodist Church, which was founded in 1820.
In the late 1800s, the town began to decline, as the railroad bypassed the town and the local economy began to suffer. The town was hit hard by the Great Depression, and many of the businesses closed. The town was revitalized in the 1950s, when the Ghent Historic District was established. The district includes several historic buildings, including the Ghent Mansion, which was built in 1820.
Today, Ghent is a small, rural town with a population of approximately 1,000 people. The town is home to several historic sites, and is a popular destination for tourists. The town is also home to a number of small businesses, including restaurants, shops, and a few small manufacturing plants.
Common Questions
What is Per Capita Income in Ghent?
Per Capita income in Ghent is $71,502.
What is the Median Family Income in Ghent?
Median Family Income in Ghent is $195,491.
What is the Median Household income in Ghent?
Median Household Income in Ghent is $102,204.
What is Income or Wage Gap in Ghent?
Income or Wage Gap in Ghent is 15.8%.
Women in Ghent earn 84.2 cents for every dollar earned by a man.
What is Inequality or Gini Index in Ghent?
Inequality or Gini Index in Ghent is 0.30.
What is the Total Population of Ghent?
Total Population of Ghent is 390.
What is the Total Male Population of Ghent?
Total Male Population of Ghent is 142.
What is the Total Female Population of Ghent?
Total Female Population of Ghent is 248.
What is the Ratio of Males per 100 Females in Ghent?
There are 57.26 Males per 100 Females in Ghent.
What is the Ratio of Females per 100 Males in Ghent?
There are 174.65 Females per 100 Males in Ghent.
What is the Median Population Age in Ghent?
Median Population Age in Ghent is 48.6 Years.
What is the Average Family Size in Ghent
Average Family Size in Ghent is 1.7 People.
What is the Average Household Size in Ghent
Average Household Size in Ghent is 1.4 People.
How Large is the Labor Force in Ghent?
There are 238 People in the Labor Forcein in Ghent.
What is the Percentage of People in the Labor Force in Ghent?
61.0% of People are in the Labor Force in Ghent.