Washington, WV Map & Demographics
Washington Map
Washington Overview
$41,488
PER CAPITA INCOME
$41,920
AVG HOUSEHOLD INCOME
30.7%
WAGE / INCOME GAP [ % ]
69.3¢/ $1
WAGE / INCOME GAP [ $ ]
0.44
INEQUALITY / GINI INDEX
1,155
TOTAL POPULATION
671
MALE POPULATION
484
FEMALE POPULATION
138.64
MALES / 100 FEMALES
72.13
FEMALES / 100 MALES
56.2
MEDIAN AGE
2.5
AVG FAMILY SIZE
2.0
AVG HOUSEHOLD SIZE
410
LABOR FORCE [ PEOPLE ]
40.8%
PERCENT IN LABOR FORCE
4.4%
UNEMPLOYMENT RATE
Washington Zip Codes
Washington Area Codes
Income in Washington
Income Overview in Washington
| Characteristic | Number | Measure |
| Per Capita Income | 1,155 | $41,488 |
| Median Family Income | 332 | $0 |
| Mean Family Income | 332 | $103,857 |
| Median Household Income | 586 | $41,920 |
| Mean Household Income | 586 | $80,912 |
| Income Deficit | 332 | $0 |
| Wage / Income Gap (%) | 1,155 | 30.70% |
| Wage / Income Gap ($) | 1,155 | 69.30¢ per $1 |
| Gini / Inequality Index | 1,155 | 0.44 |
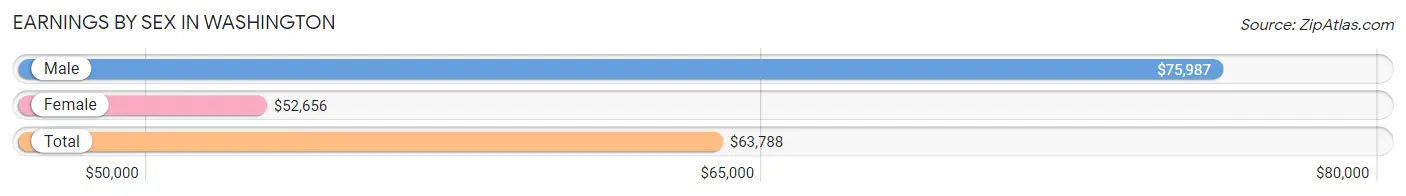
Earnings by Sex in Washington
Average Earnings in Washington are $63,788, $75,987 for men and $52,656 for women, a difference of 30.7%.
| Sex | Number | Average Earnings |
| Male | 249 (54.8%) | $75,987 |
| Female | 205 (45.2%) | $52,656 |
| Total | 454 (100.0%) | $63,788 |
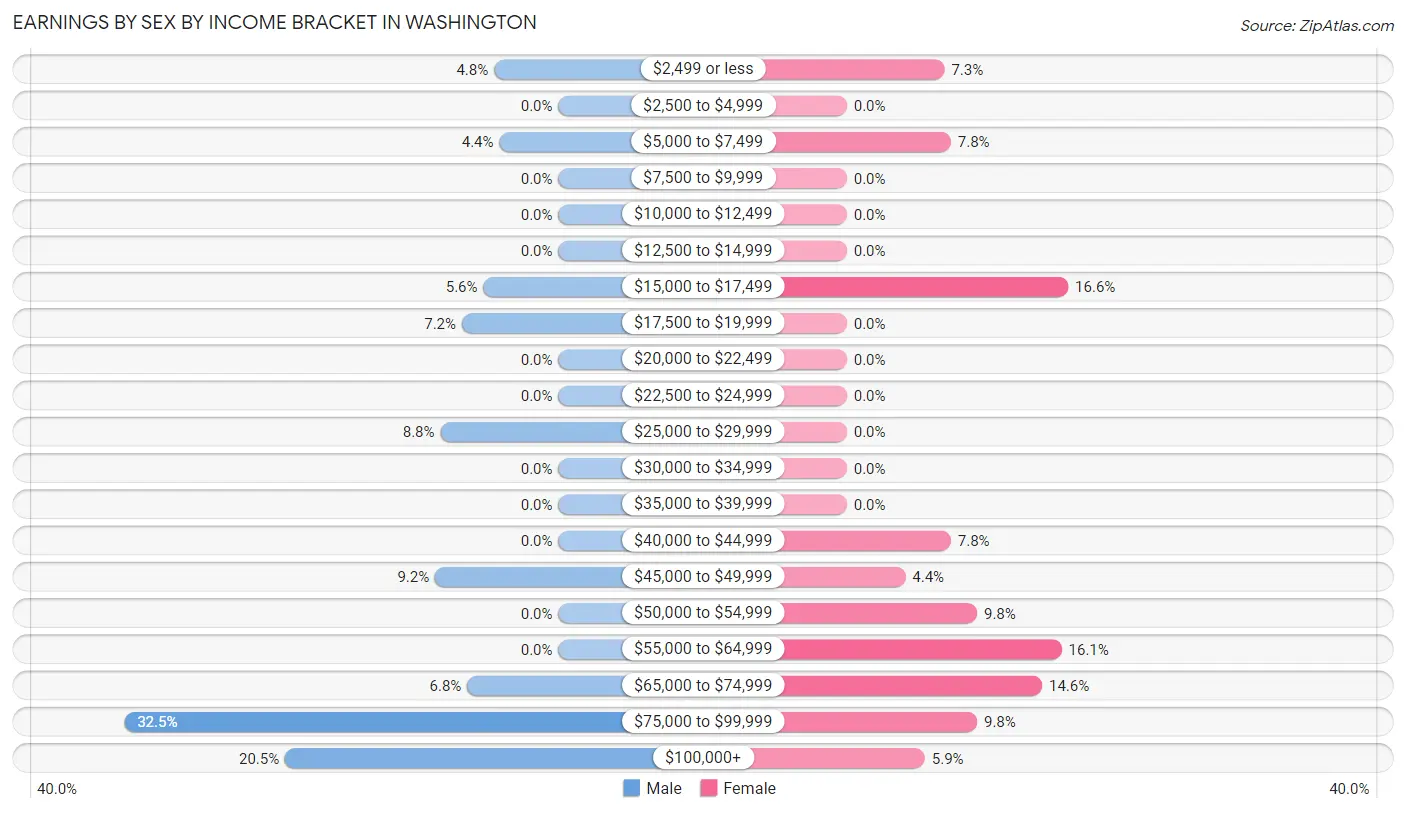
Earnings by Sex by Income Bracket in Washington
The most common earnings brackets in Washington are $75,000 to $99,999 for men (81 | 32.5%) and $15,000 to $17,499 for women (34 | 16.6%).
| Income | Male | Female |
| $2,499 or less | 12 (4.8%) | 15 (7.3%) |
| $2,500 to $4,999 | 0 (0.0%) | 0 (0.0%) |
| $5,000 to $7,499 | 11 (4.4%) | 16 (7.8%) |
| $7,500 to $9,999 | 0 (0.0%) | 0 (0.0%) |
| $10,000 to $12,499 | 0 (0.0%) | 0 (0.0%) |
| $12,500 to $14,999 | 0 (0.0%) | 0 (0.0%) |
| $15,000 to $17,499 | 14 (5.6%) | 34 (16.6%) |
| $17,500 to $19,999 | 18 (7.2%) | 0 (0.0%) |
| $20,000 to $22,499 | 0 (0.0%) | 0 (0.0%) |
| $22,500 to $24,999 | 0 (0.0%) | 0 (0.0%) |
| $25,000 to $29,999 | 22 (8.8%) | 0 (0.0%) |
| $30,000 to $34,999 | 0 (0.0%) | 0 (0.0%) |
| $35,000 to $39,999 | 0 (0.0%) | 0 (0.0%) |
| $40,000 to $44,999 | 0 (0.0%) | 16 (7.8%) |
| $45,000 to $49,999 | 23 (9.2%) | 9 (4.4%) |
| $50,000 to $54,999 | 0 (0.0%) | 20 (9.8%) |
| $55,000 to $64,999 | 0 (0.0%) | 33 (16.1%) |
| $65,000 to $74,999 | 17 (6.8%) | 30 (14.6%) |
| $75,000 to $99,999 | 81 (32.5%) | 20 (9.8%) |
| $100,000+ | 51 (20.5%) | 12 (5.9%) |
| Total | 249 (100.0%) | 205 (100.0%) |
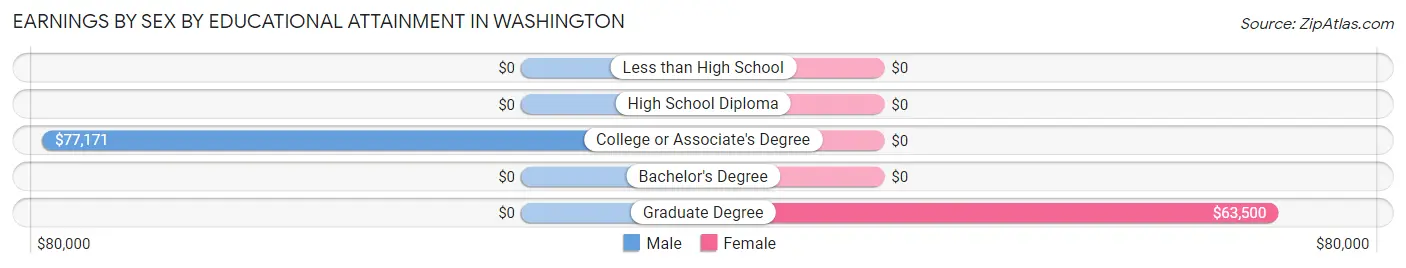
Earnings by Sex by Educational Attainment in Washington
Average earnings in Washington are $82,763 for men and $52,969 for women, a difference of 36.0%. Men with an educational attainment of college or associate's degree enjoy the highest average annual earnings of $77,171, while those with college or associate's degree education earn the least with $77,171. Women with an educational attainment of graduate degree earn the most with the average annual earnings of $63,500, while those with graduate degree education have the smallest earnings of $63,500.
| Educational Attainment | Male Income | Female Income |
| Less than High School | - | - |
| High School Diploma | - | - |
| College or Associate's Degree | $77,171 | $0 |
| Bachelor's Degree | - | - |
| Graduate Degree | - | - |
| Total | $82,763 | $52,969 |
Family Income in Washington
Family Income Brackets in Washington
According to the Washington family income data, there are 111 families falling into the $35,000 to $49,999 income range, which is the most common income bracket and makes up 33.4% of all families.
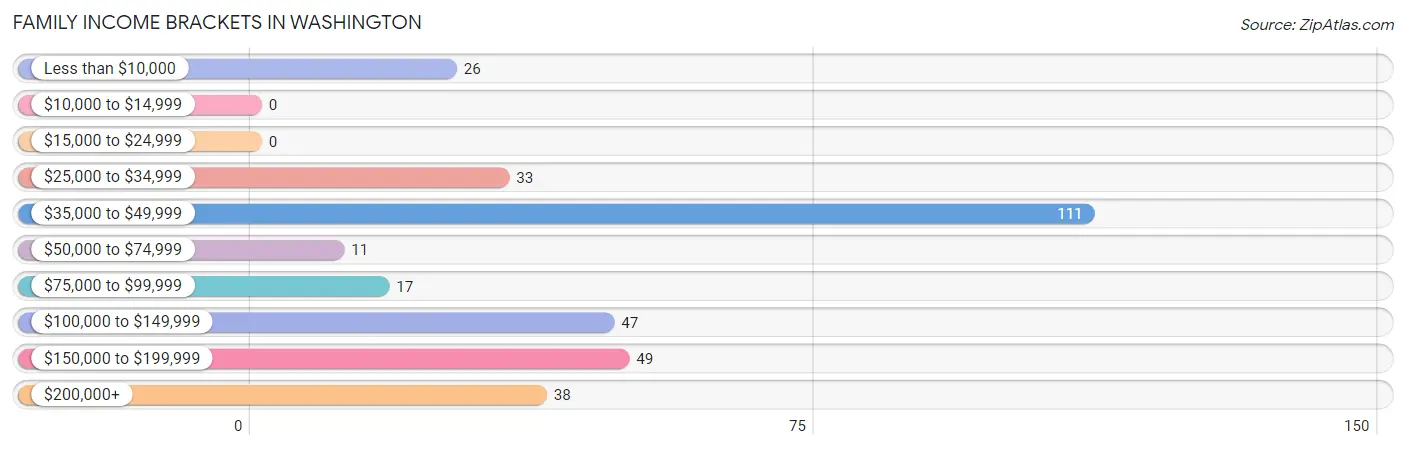
| Income Bracket | # Families | % Families |
| Less than $10,000 | 26 | 7.8% |
| $10,000 to $14,999 | 0 | 0.0% |
| $15,000 to $24,999 | 0 | 0.0% |
| $25,000 to $34,999 | 33 | 9.9% |
| $35,000 to $49,999 | 111 | 33.4% |
| $50,000 to $74,999 | 11 | 3.3% |
| $75,000 to $99,999 | 17 | 5.1% |
| $100,000 to $149,999 | 47 | 14.2% |
| $150,000 to $199,999 | 49 | 14.8% |
| $200,000+ | 38 | 11.4% |
Family Income by Famaliy Size in Washington
4-person families (41 | 12.3%) account for the highest median family income in Washington with $250,001 per family, while 4-person families (41 | 12.3%) have the highest median income of $62,500 per family member.
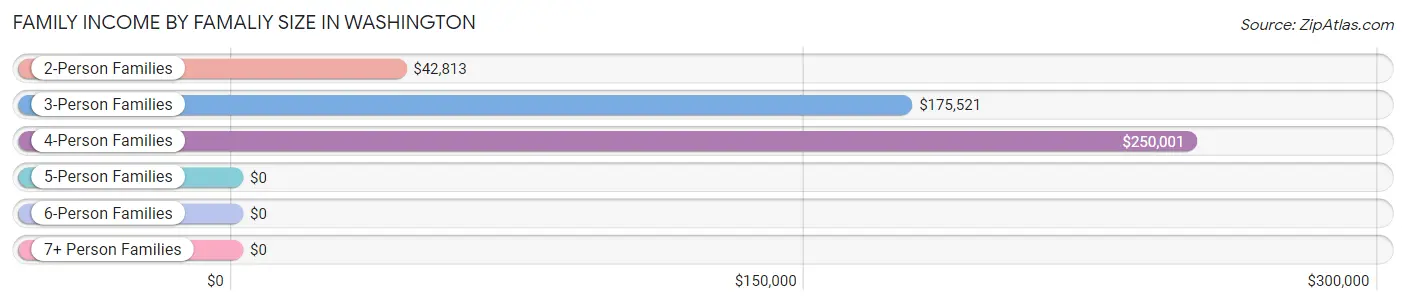
| Income Bracket | # Families | Median Income |
| 2-Person Families | 248 (74.7%) | $42,813 |
| 3-Person Families | 43 (13.0%) | $175,521 |
| 4-Person Families | 41 (12.3%) | $250,001 |
| 5-Person Families | 0 (0.0%) | $0 |
| 6-Person Families | 0 (0.0%) | $0 |
| 7+ Person Families | 0 (0.0%) | $0 |
| Total | 332 (100.0%) | $0 |
Family Income by Number of Earners in Washington
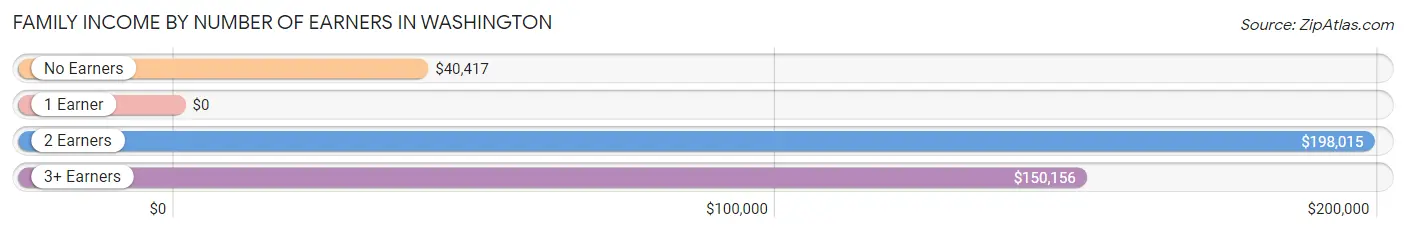
| Number of Earners | # Families | Median Income |
| No Earners | 139 (41.9%) | $40,417 |
| 1 Earner | 85 (25.6%) | $0 |
| 2 Earners | 69 (20.8%) | $198,015 |
| 3+ Earners | 39 (11.7%) | $150,156 |
| Total | 332 (100.0%) | $0 |
Household Income in Washington
Household Income Brackets in Washington
With 240 households falling in the category, the $35,000 to $49,999 income range is the most frequent in Washington, accounting for 41.0% of all households.
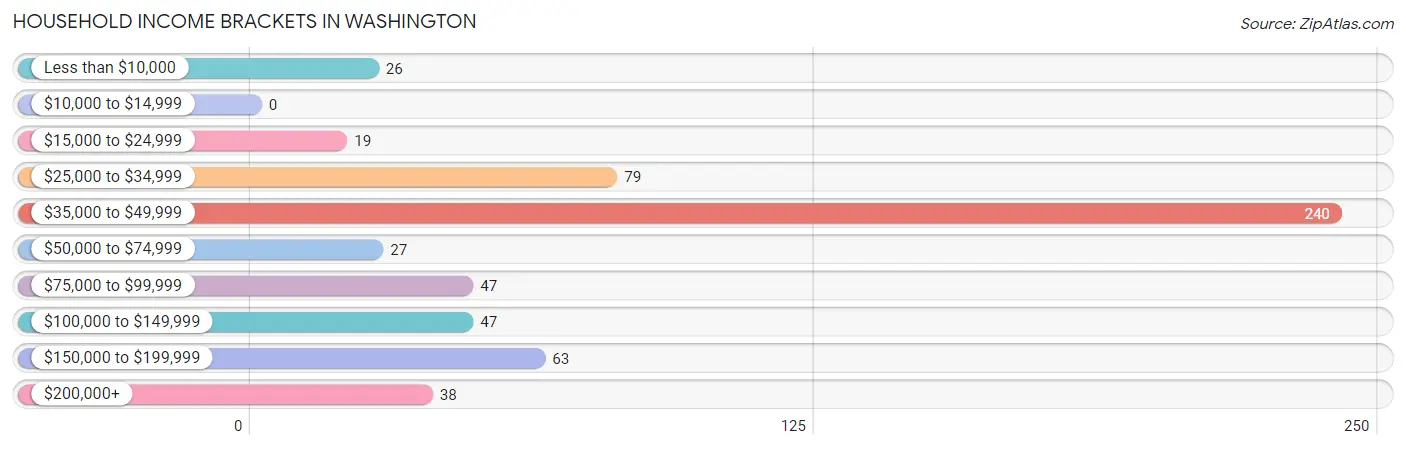
| Income Bracket | # Households | % Households |
| Less than $10,000 | 26 | 4.4% |
| $10,000 to $14,999 | 0 | 0.0% |
| $15,000 to $24,999 | 19 | 3.2% |
| $25,000 to $34,999 | 79 | 13.5% |
| $35,000 to $49,999 | 240 | 41.0% |
| $50,000 to $74,999 | 27 | 4.6% |
| $75,000 to $99,999 | 47 | 8.0% |
| $100,000 to $149,999 | 47 | 8.0% |
| $150,000 to $199,999 | 63 | 10.8% |
| $200,000+ | 38 | 6.5% |
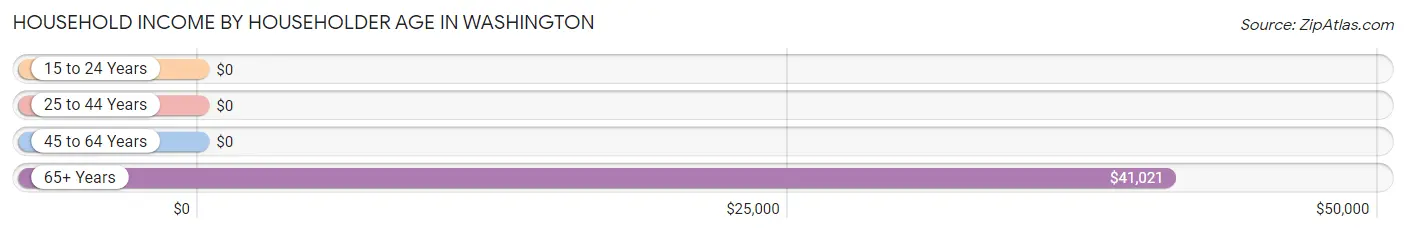
Household Income by Householder Age in Washington
The median household income in Washington is $41,920, with the highest median household income of $41,021 found in the 65+ years age bracket for the primary householder. A total of 271 households (46.3%) fall into this category.
| Income Bracket | # Households | Median Income |
| 15 to 24 Years | 0 (0.0%) | $0 |
| 25 to 44 Years | 93 (15.9%) | $0 |
| 45 to 64 Years | 222 (37.9%) | $0 |
| 65+ Years | 271 (46.3%) | $41,021 |
| Total | 586 (100.0%) | $41,920 |
Poverty in Washington
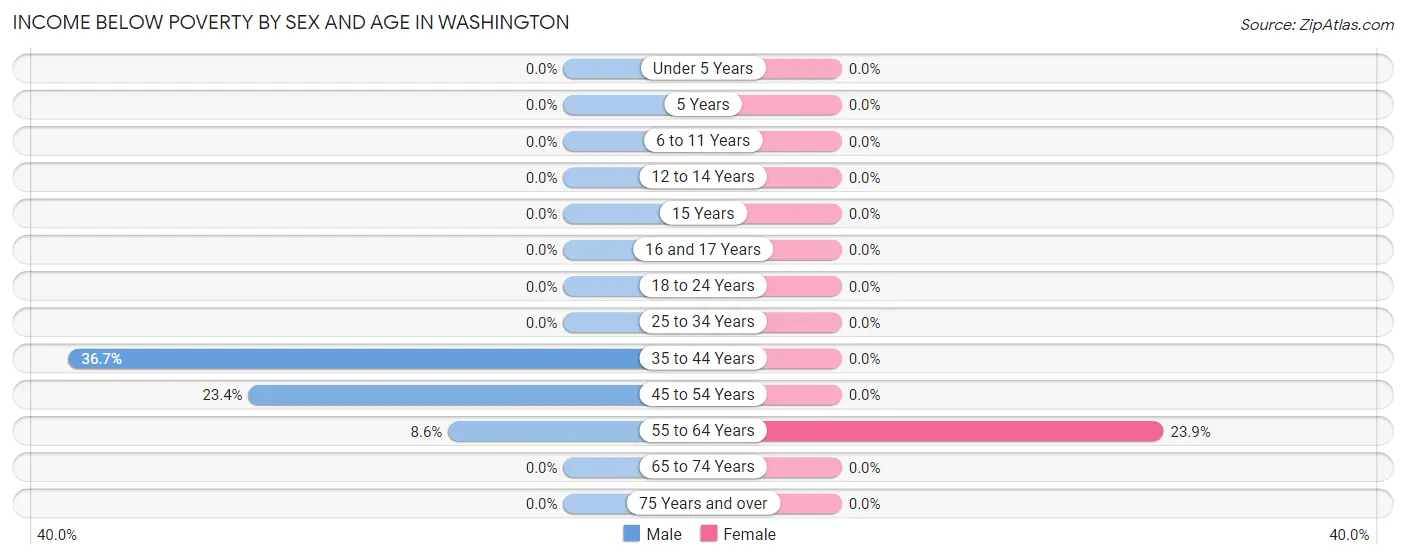
Income Below Poverty by Sex and Age in Washington
With 7.3% poverty level for males and 5.6% for females among the residents of Washington, 35 to 44 year old males and 55 to 64 year old females are the most vulnerable to poverty, with 18 males (36.7%) and 27 females (23.9%) in their respective age groups living below the poverty level.
| Age Bracket | Male | Female |
| Under 5 Years | 0 (0.0%) | 0 (0.0%) |
| 5 Years | 0 (0.0%) | 0 (0.0%) |
| 6 to 11 Years | 0 (0.0%) | 0 (0.0%) |
| 12 to 14 Years | 0 (0.0%) | 0 (0.0%) |
| 15 Years | 0 (0.0%) | 0 (0.0%) |
| 16 and 17 Years | 0 (0.0%) | 0 (0.0%) |
| 18 to 24 Years | 0 (0.0%) | 0 (0.0%) |
| 25 to 34 Years | 0 (0.0%) | 0 (0.0%) |
| 35 to 44 Years | 18 (36.7%) | 0 (0.0%) |
| 45 to 54 Years | 18 (23.4%) | 0 (0.0%) |
| 55 to 64 Years | 13 (8.6%) | 27 (23.9%) |
| 65 to 74 Years | 0 (0.0%) | 0 (0.0%) |
| 75 Years and over | 0 (0.0%) | 0 (0.0%) |
| Total | 49 (7.3%) | 27 (5.6%) |
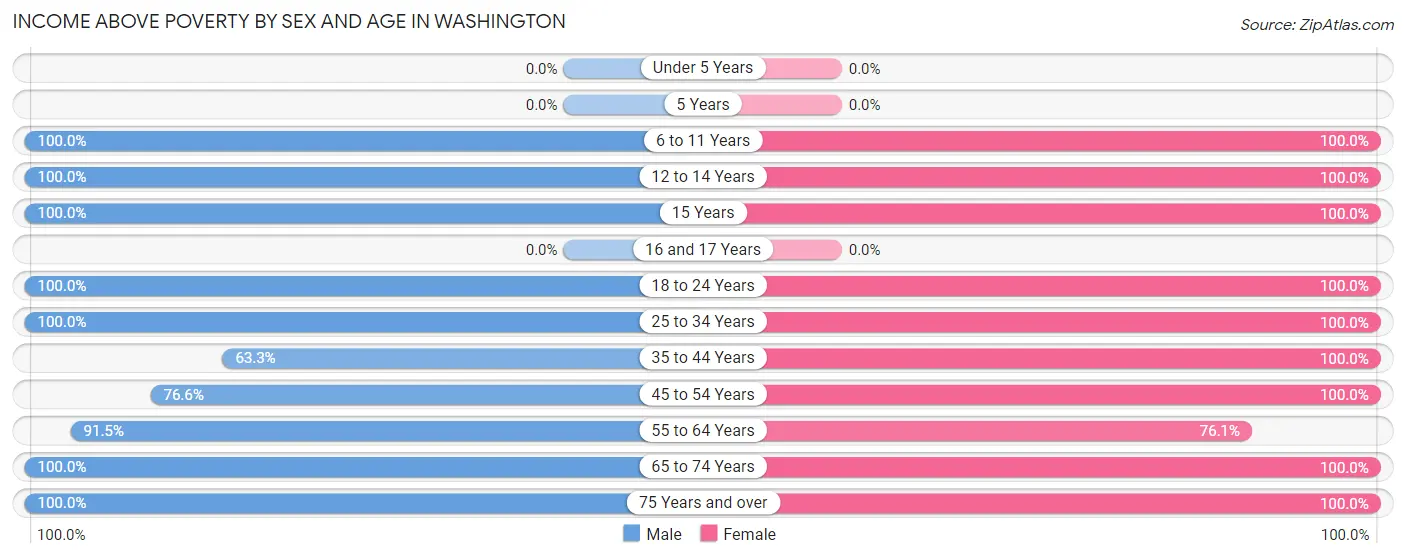
Income Above Poverty by Sex and Age in Washington
According to the poverty statistics in Washington, males aged 6 to 11 years and females aged 6 to 11 years are the age groups that are most secure financially, with 100.0% of males and 100.0% of females in these age groups living above the poverty line.
| Age Bracket | Male | Female |
| Under 5 Years | 0 (0.0%) | 0 (0.0%) |
| 5 Years | 0 (0.0%) | 0 (0.0%) |
| 6 to 11 Years | 38 (100.0%) | 27 (100.0%) |
| 12 to 14 Years | 28 (100.0%) | 22 (100.0%) |
| 15 Years | 21 (100.0%) | 13 (100.0%) |
| 16 and 17 Years | 0 (0.0%) | 0 (0.0%) |
| 18 to 24 Years | 27 (100.0%) | 28 (100.0%) |
| 25 to 34 Years | 44 (100.0%) | 53 (100.0%) |
| 35 to 44 Years | 31 (63.3%) | 32 (100.0%) |
| 45 to 54 Years | 59 (76.6%) | 73 (100.0%) |
| 55 to 64 Years | 139 (91.4%) | 86 (76.1%) |
| 65 to 74 Years | 176 (100.0%) | 56 (100.0%) |
| 75 Years and over | 59 (100.0%) | 67 (100.0%) |
| Total | 622 (92.7%) | 457 (94.4%) |
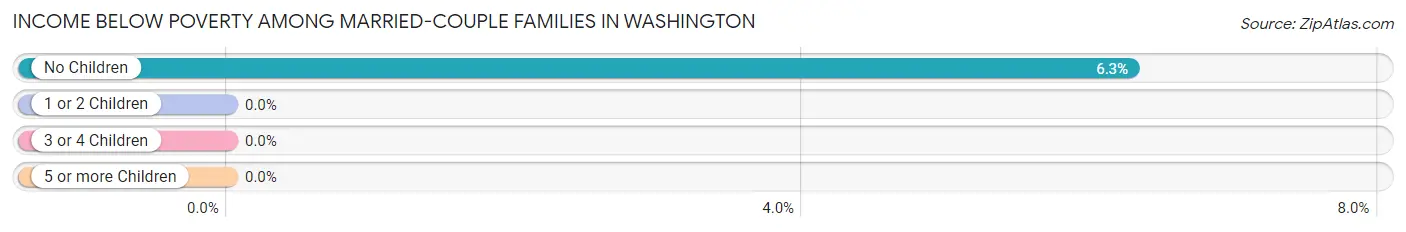
Income Below Poverty Among Married-Couple Families in Washington
The poverty statistics for married-couple families in Washington show that 4.8% or 13 of the total 271 families live below the poverty line. Families with no children have the highest poverty rate of 6.3%, comprising of 13 families. On the other hand, families with 1 or 2 children have the lowest poverty rate of 0.0%, which includes 0 families.
| Children | Above Poverty | Below Poverty |
| No Children | 194 (93.7%) | 13 (6.3%) |
| 1 or 2 Children | 64 (100.0%) | 0 (0.0%) |
| 3 or 4 Children | 0 (0.0%) | 0 (0.0%) |
| 5 or more Children | 0 (0.0%) | 0 (0.0%) |
| Total | 258 (95.2%) | 13 (4.8%) |
Income Below Poverty Among Single-Parent Households in Washington
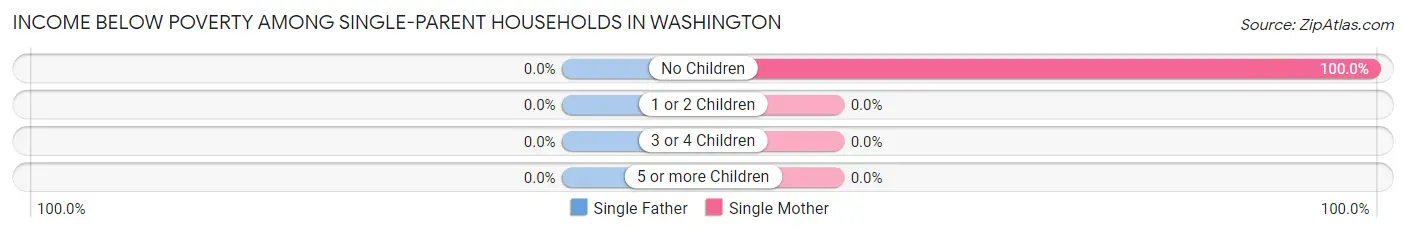
| Children | Single Father | Single Mother |
| No Children | 0 (0.0%) | 13 (100.0%) |
| 1 or 2 Children | 0 (0.0%) | 0 (0.0%) |
| 3 or 4 Children | 0 (0.0%) | 0 (0.0%) |
| 5 or more Children | 0 (0.0%) | 0 (0.0%) |
| Total | 0 (0.0%) | 13 (34.2%) |
Income Below Poverty Among Married-Couple vs Single-Parent Households in Washington
The poverty data for Washington shows that 13 of the married-couple family households (4.8%) and 13 of the single-parent households (21.3%) are living below the poverty level. Within the married-couple family households, those with no children have the highest poverty rate, with 13 households (6.3%) falling below the poverty line. Among the single-parent households, those with no children have the highest poverty rate, with 13 household (100.0%) living below poverty.
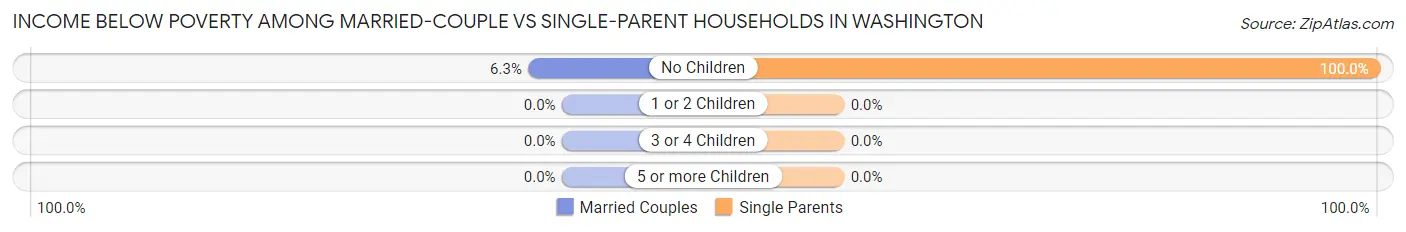
| Children | Married-Couple Families | Single-Parent Households |
| No Children | 13 (6.3%) | 13 (100.0%) |
| 1 or 2 Children | 0 (0.0%) | 0 (0.0%) |
| 3 or 4 Children | 0 (0.0%) | 0 (0.0%) |
| 5 or more Children | 0 (0.0%) | 0 (0.0%) |
| Total | 13 (4.8%) | 13 (21.3%) |
Race in Washington
The most populous races in Washington are White / Caucasian (1,107 | 95.8%), Hispanic or Latino (45 | 3.9%), and Two or more Races (25 | 2.2%).
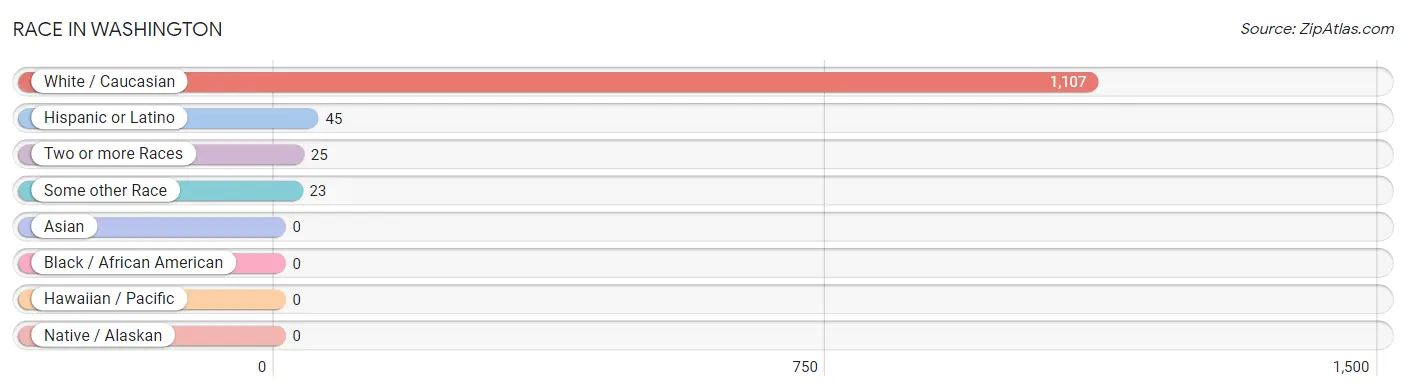
| Race | # Population | % Population |
| Asian | 0 | 0.0% |
| Black / African American | 0 | 0.0% |
| Hawaiian / Pacific | 0 | 0.0% |
| Hispanic or Latino | 45 | 3.9% |
| Native / Alaskan | 0 | 0.0% |
| White / Caucasian | 1,107 | 95.8% |
| Two or more Races | 25 | 2.2% |
| Some other Race | 23 | 2.0% |
| Total | 1,155 | 100.0% |
Ancestry in Washington
The most populous ancestries reported in Washington are German (222 | 19.2%), English (216 | 18.7%), Irish (135 | 11.7%), British (66 | 5.7%), and American (46 | 4.0%), together accounting for 59.3% of all Washington residents.
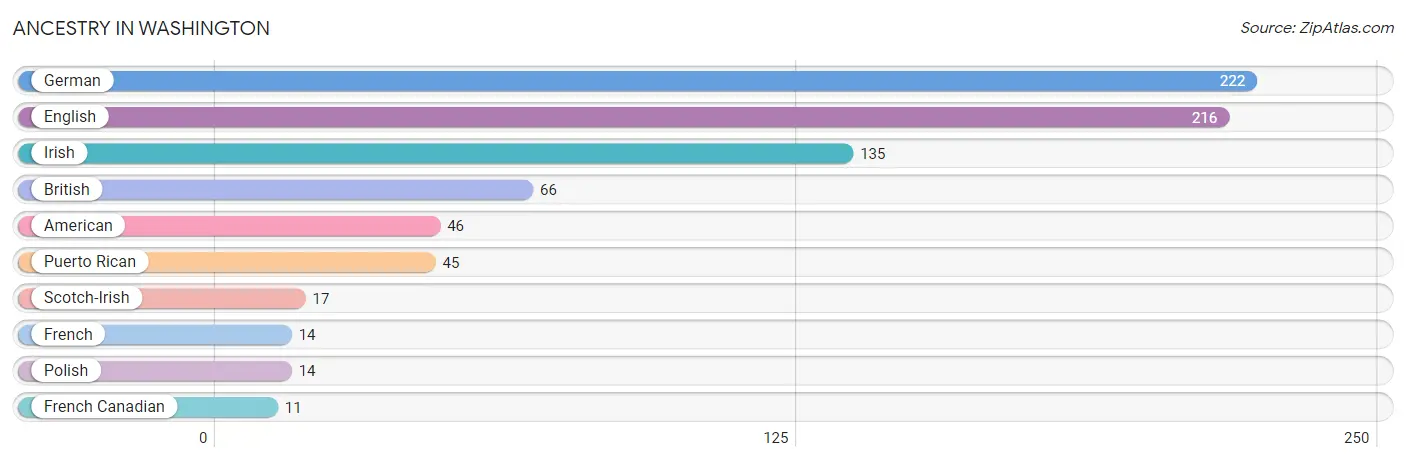
| Ancestry | # Population | % Population |
| American | 46 | 4.0% |
| British | 66 | 5.7% |
| English | 216 | 18.7% |
| French | 14 | 1.2% |
| French Canadian | 11 | 0.9% |
| German | 222 | 19.2% |
| Irish | 135 | 11.7% |
| Polish | 14 | 1.2% |
| Puerto Rican | 45 | 3.9% |
| Scotch-Irish | 17 | 1.5% | View All 10 Rows |
Immigrants in Washington
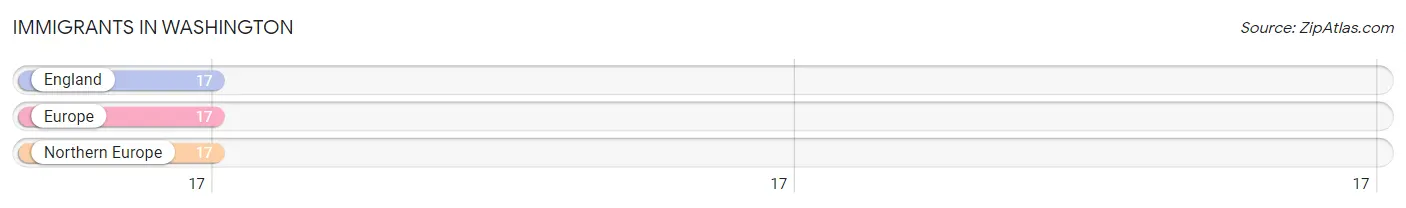
The most numerous immigrant groups reported in Washington came from England (17 | 1.5%), Europe (17 | 1.5%), and Northern Europe (17 | 1.5%), together accounting for 4.4% of all Washington residents.
| Immigration Origin | # Population | % Population |
| England | 17 | 1.5% |
| Europe | 17 | 1.5% |
| Northern Europe | 17 | 1.5% | View All 3 Rows |
Sex and Age in Washington
Sex and Age in Washington
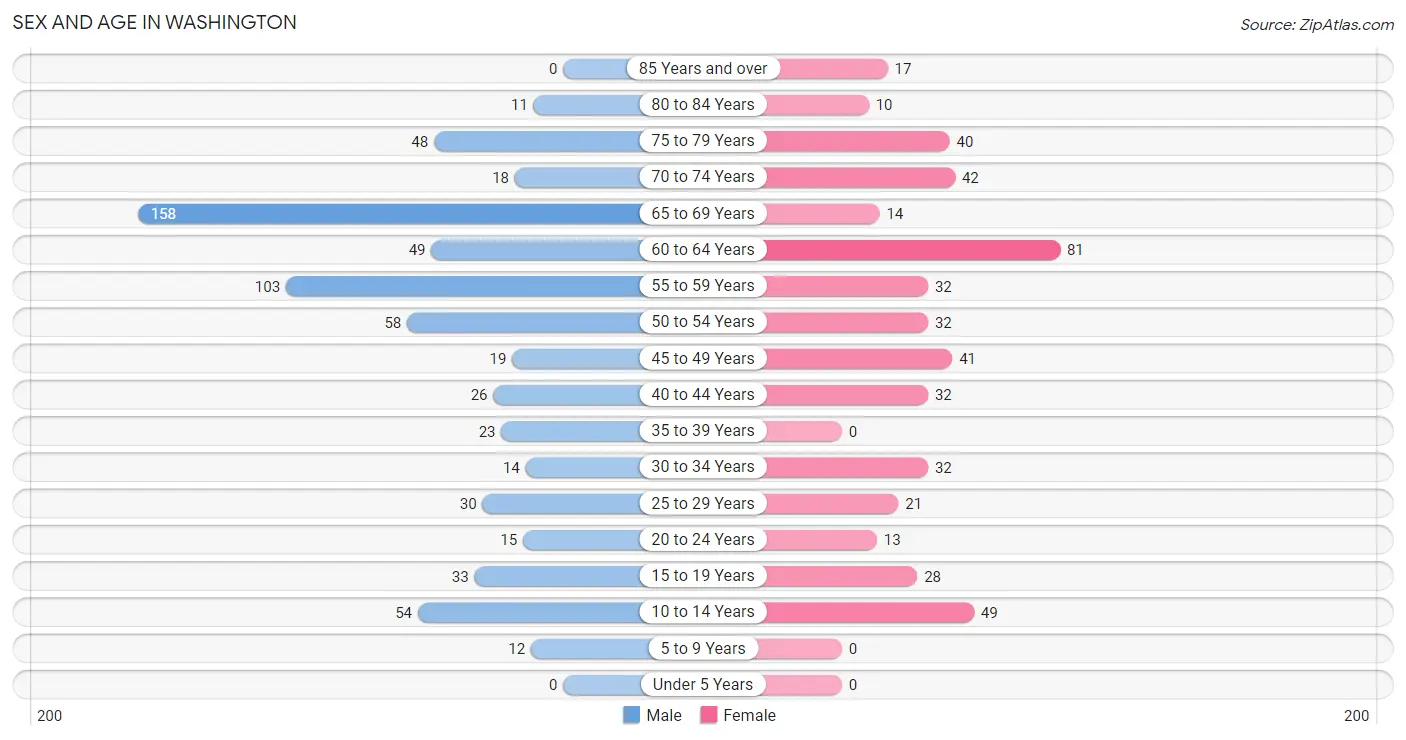
The most populous age groups in Washington are 65 to 69 Years (158 | 23.5%) for men and 60 to 64 Years (81 | 16.7%) for women.
| Age Bracket | Male | Female |
| Under 5 Years | 0 (0.0%) | 0 (0.0%) |
| 5 to 9 Years | 12 (1.8%) | 0 (0.0%) |
| 10 to 14 Years | 54 (8.1%) | 49 (10.1%) |
| 15 to 19 Years | 33 (4.9%) | 28 (5.8%) |
| 20 to 24 Years | 15 (2.2%) | 13 (2.7%) |
| 25 to 29 Years | 30 (4.5%) | 21 (4.3%) |
| 30 to 34 Years | 14 (2.1%) | 32 (6.6%) |
| 35 to 39 Years | 23 (3.4%) | 0 (0.0%) |
| 40 to 44 Years | 26 (3.9%) | 32 (6.6%) |
| 45 to 49 Years | 19 (2.8%) | 41 (8.5%) |
| 50 to 54 Years | 58 (8.6%) | 32 (6.6%) |
| 55 to 59 Years | 103 (15.3%) | 32 (6.6%) |
| 60 to 64 Years | 49 (7.3%) | 81 (16.7%) |
| 65 to 69 Years | 158 (23.5%) | 14 (2.9%) |
| 70 to 74 Years | 18 (2.7%) | 42 (8.7%) |
| 75 to 79 Years | 48 (7.1%) | 40 (8.3%) |
| 80 to 84 Years | 11 (1.6%) | 10 (2.1%) |
| 85 Years and over | 0 (0.0%) | 17 (3.5%) |
| Total | 671 (100.0%) | 484 (100.0%) |
Families and Households in Washington
Median Family Size in Washington
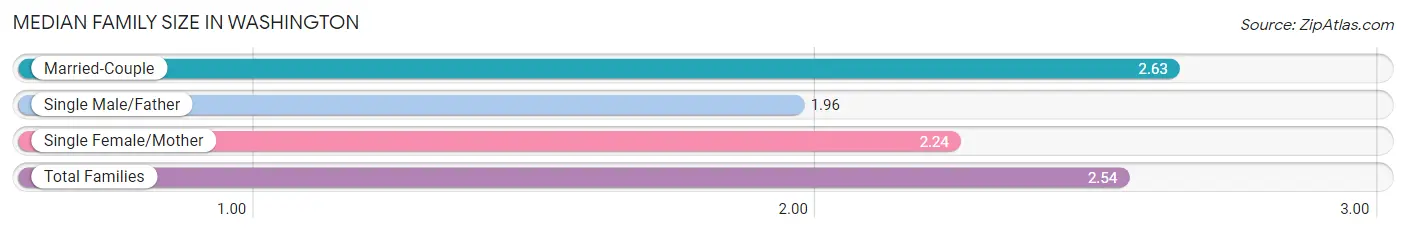
The median family size in Washington is 2.54 persons per family, with married-couple families (271 | 81.6%) accounting for the largest median family size of 2.63 persons per family. On the other hand, single male/father families (23 | 6.9%) represent the smallest median family size with 1.96 persons per family.
| Family Type | # Families | Family Size |
| Married-Couple | 271 (81.6%) | 2.63 |
| Single Male/Father | 23 (6.9%) | 1.96 |
| Single Female/Mother | 38 (11.5%) | 2.24 |
| Total Families | 332 (100.0%) | 2.54 |
Median Household Size in Washington
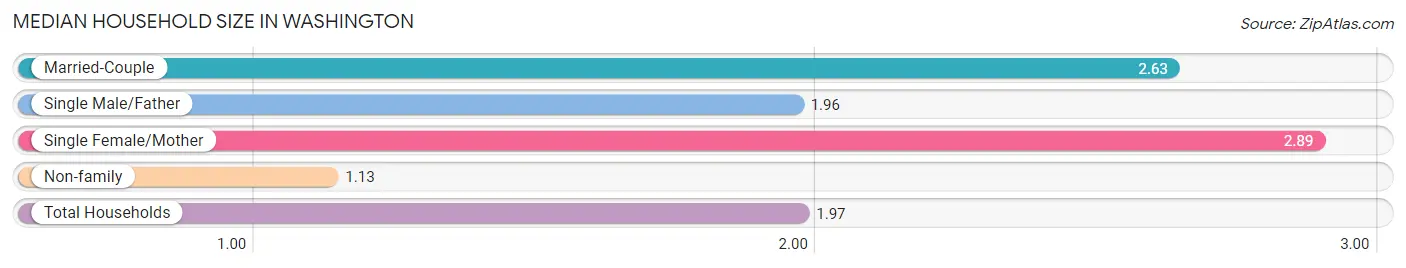
The median household size in Washington is 1.97 persons per household, with single female/mother households (38 | 6.5%) accounting for the largest median household size of 2.89 persons per household. non-family households (254 | 43.3%) represent the smallest median household size with 1.13 persons per household.
| Household Type | # Households | Household Size |
| Married-Couple | 271 (46.3%) | 2.63 |
| Single Male/Father | 23 (3.9%) | 1.96 |
| Single Female/Mother | 38 (6.5%) | 2.89 |
| Non-family | 254 (43.3%) | 1.13 |
| Total Households | 586 (100.0%) | 1.97 |
Household Size by Marriage Status in Washington
Out of a total of 586 households in Washington, 332 (56.7%) are family households, while 254 (43.3%) are nonfamily households. The most numerous type of family households are 2-person households, comprising 223, and the most common type of nonfamily households are 1-person households, comprising 222.
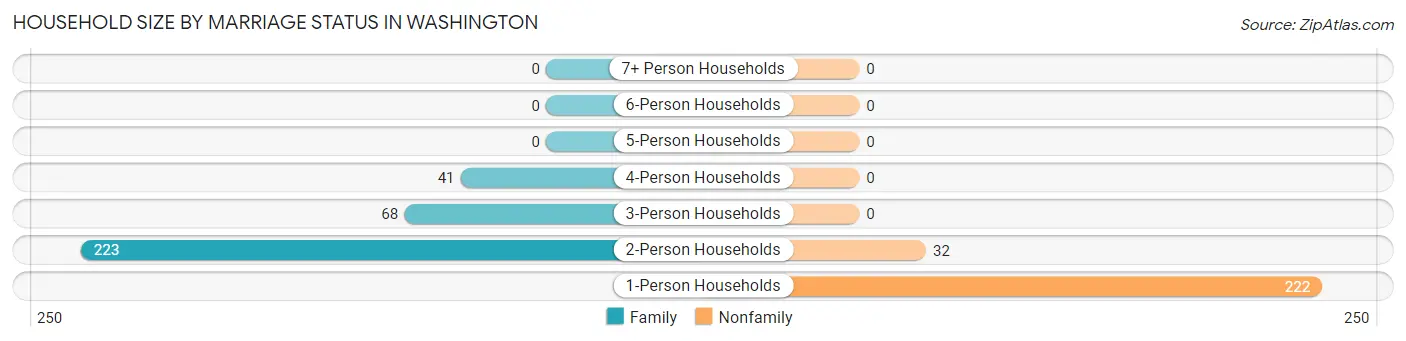
| Household Size | Family Households | Nonfamily Households |
| 1-Person Households | - | 222 (37.9%) |
| 2-Person Households | 223 (38.1%) | 32 (5.5%) |
| 3-Person Households | 68 (11.6%) | 0 (0.0%) |
| 4-Person Households | 41 (7.0%) | 0 (0.0%) |
| 5-Person Households | 0 (0.0%) | 0 (0.0%) |
| 6-Person Households | 0 (0.0%) | 0 (0.0%) |
| 7+ Person Households | 0 (0.0%) | 0 (0.0%) |
| Total | 332 (56.7%) | 254 (43.3%) |
Female Fertility in Washington
Fertility by Age in Washington
| Age Bracket | Women with Births | Births / 1,000 Women |
| 15 to 19 years | 0 (0.0%) | 0.0 |
| 20 to 34 years | 0 (0.0%) | 0.0 |
| 35 to 50 years | 0 (0.0%) | 0.0 |
| Total | 0 (0.0%) | 0.0 |
Fertility by Age by Marriage Status in Washington
| Age Bracket | Married | Unmarried |
| 15 to 19 years | 0 (0.0%) | 0 (0.0%) |
| 20 to 34 years | 0 (0.0%) | 0 (0.0%) |
| 35 to 50 years | 0 (0.0%) | 0 (0.0%) |
| Total | 0 (0.0%) | 0 (0.0%) |
Fertility by Education in Washington
| Educational Attainment | Women with Births | Births / 1,000 Women |
| Less than High School | 0 (0.0%) | 0.0 |
| High School Diploma | 0 (0.0%) | 0.0 |
| College or Associate's Degree | 0 (0.0%) | 0.0 |
| Bachelor's Degree | 0 (0.0%) | 0.0 |
| Graduate Degree | 0 (0.0%) | 0.0 |
| Total | 0 (0.0%) | 0.0 |
Fertility by Education by Marriage Status in Washington
| Educational Attainment | Married | Unmarried |
| Less than High School | 0 (0.0%) | 0 (0.0%) |
| High School Diploma | 0 (0.0%) | 0 (0.0%) |
| College or Associate's Degree | 0 (0.0%) | 0 (0.0%) |
| Bachelor's Degree | 0 (0.0%) | 0 (0.0%) |
| Graduate Degree | 0 (0.0%) | 0 (0.0%) |
| Total | 0 (0.0%) | 0 (0.0%) |
Employment Characteristics in Washington
Employment by Class of Employer in Washington
Among the 392 employed individuals in Washington, private company employees (277 | 70.7%), not-for-profit organizations (54 | 13.8%), and local government employees (48 | 12.2%) make up the most common classes of employment.
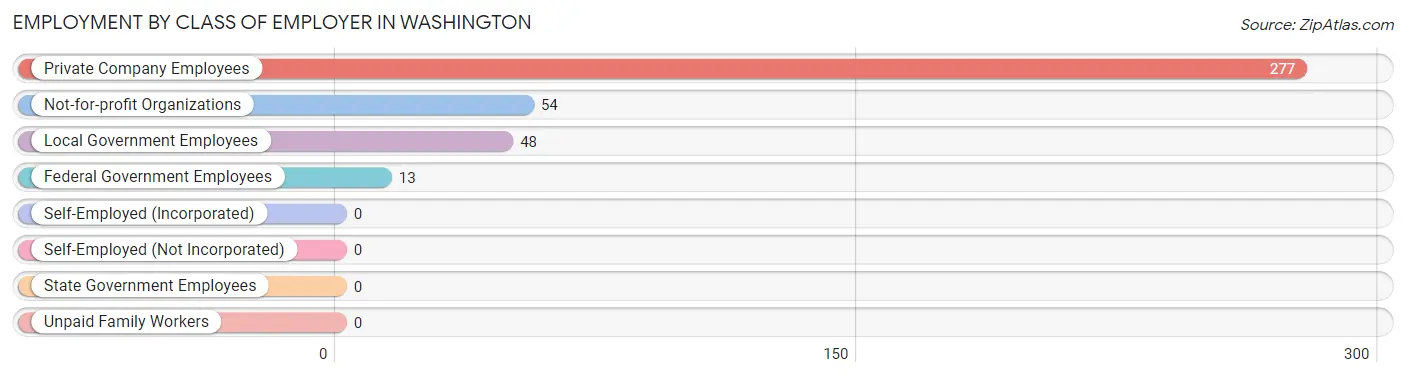
| Employer Class | # Employees | % Employees |
| Private Company Employees | 277 | 70.7% |
| Self-Employed (Incorporated) | 0 | 0.0% |
| Self-Employed (Not Incorporated) | 0 | 0.0% |
| Not-for-profit Organizations | 54 | 13.8% |
| Local Government Employees | 48 | 12.2% |
| State Government Employees | 0 | 0.0% |
| Federal Government Employees | 13 | 3.3% |
| Unpaid Family Workers | 0 | 0.0% |
| Total | 392 | 100.0% |
Employment Status by Age in Washington
According to the labor force statistics for Washington, out of the total population over 16 years of age (1,006), 40.8% or 410 individuals are in the labor force, with 4.4% or 18 of them unemployed. The age group with the highest labor force participation rate is 20 to 24 years, with 100.0% or 28 individuals in the labor force. Within the labor force, the 35 to 44 years age range has the highest percentage of unemployed individuals, with 22.2% or 18 of them being unemployed.
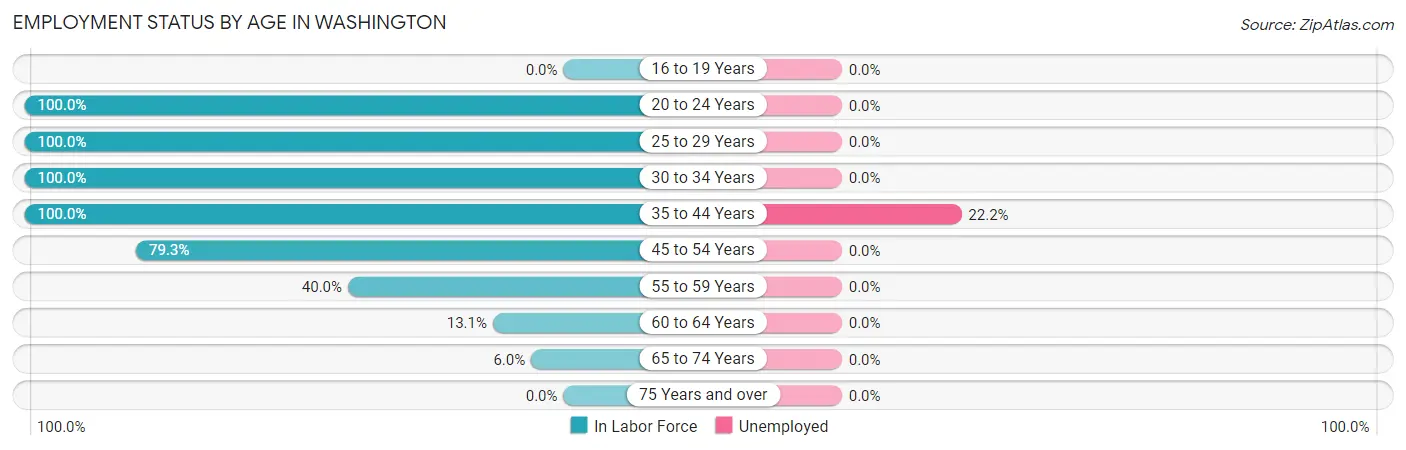
| Age Bracket | In Labor Force | Unemployed |
| 16 to 19 Years | 0 (0.0%) | 0 (0.0%) |
| 20 to 24 Years | 28 (100.0%) | 0 (0.0%) |
| 25 to 29 Years | 51 (100.0%) | 0 (0.0%) |
| 30 to 34 Years | 46 (100.0%) | 0 (0.0%) |
| 35 to 44 Years | 81 (100.0%) | 18 (22.2%) |
| 45 to 54 Years | 119 (79.3%) | 0 (0.0%) |
| 55 to 59 Years | 54 (40.0%) | 0 (0.0%) |
| 60 to 64 Years | 17 (13.1%) | 0 (0.0%) |
| 65 to 74 Years | 14 (6.0%) | 0 (0.0%) |
| 75 Years and over | 0 (0.0%) | 0 (0.0%) |
| Total | 410 (40.8%) | 18 (4.4%) |
Employment Status by Educational Attainment in Washington
According to labor force statistics for Washington, 62.1% of individuals (368) out of the total population between 25 and 64 years of age (593) are in the labor force, with 4.9% or 18 of them being unemployed. The group with the highest labor force participation rate are those with the educational attainment of college / associate degree, with 74.3% or 179 individuals in the labor force. Within the labor force, individuals with less than high school education have the highest percentage of unemployment, with 100.0% or 18 of them being unemployed.
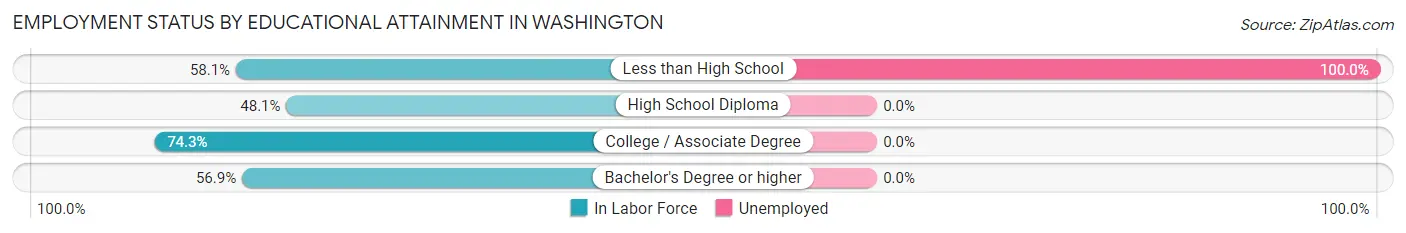
| Educational Attainment | In Labor Force | Unemployed |
| Less than High School | 18 (58.1%) | 31 (100.0%) |
| High School Diploma | 64 (48.1%) | 0 (0.0%) |
| College / Associate Degree | 179 (74.3%) | 0 (0.0%) |
| Bachelor's Degree or higher | 107 (56.9%) | 0 (0.0%) |
| Total | 368 (62.1%) | 29 (4.9%) |
Employment Occupations by Sex in Washington
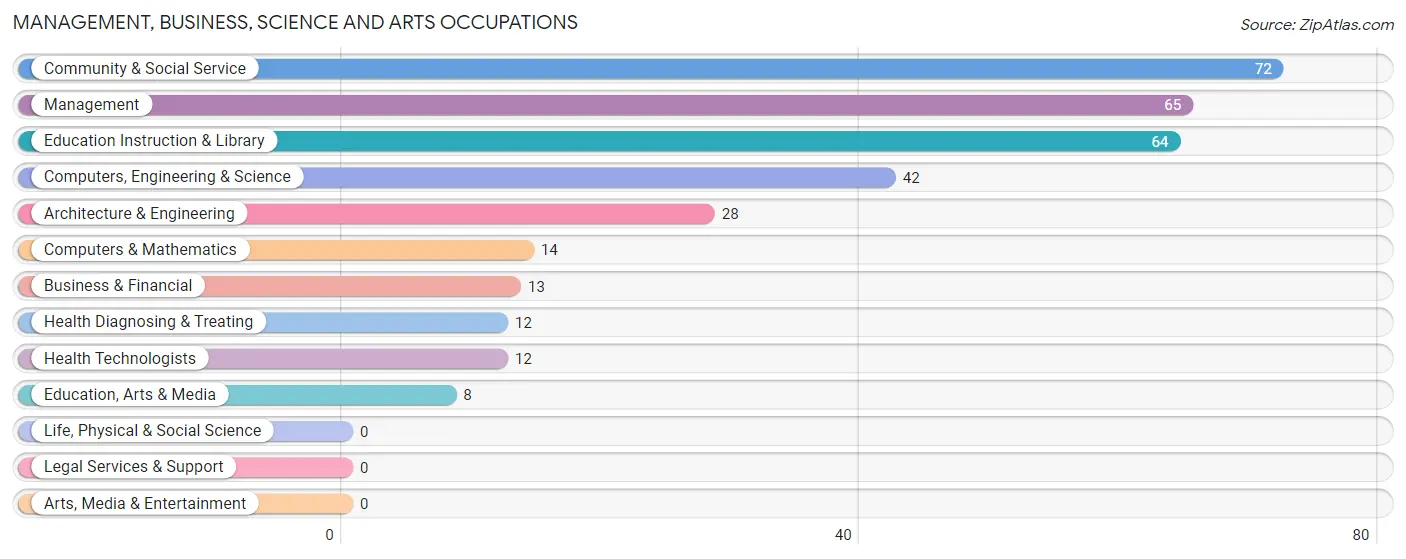
Management, Business, Science and Arts Occupations
The most common Management, Business, Science and Arts occupations in Washington are Community & Social Service (72 | 18.4%), Management (65 | 16.6%), Education Instruction & Library (64 | 16.3%), Computers, Engineering & Science (42 | 10.7%), and Architecture & Engineering (28 | 7.1%).
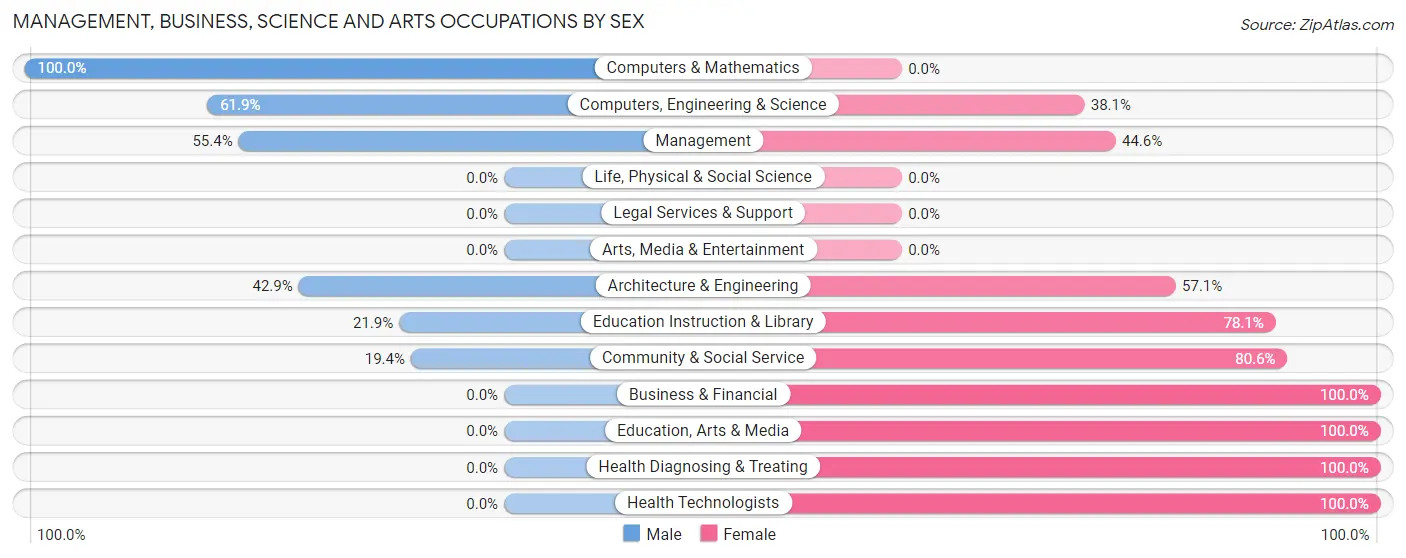
Management, Business, Science and Arts Occupations by Sex
Within the Management, Business, Science and Arts occupations in Washington, the most male-oriented occupations are Computers & Mathematics (100.0%), Computers, Engineering & Science (61.9%), and Management (55.4%), while the most female-oriented occupations are Business & Financial (100.0%), Education, Arts & Media (100.0%), and Health Diagnosing & Treating (100.0%).
| Occupation | Male | Female |
| Management | 36 (55.4%) | 29 (44.6%) |
| Business & Financial | 0 (0.0%) | 13 (100.0%) |
| Computers, Engineering & Science | 26 (61.9%) | 16 (38.1%) |
| Computers & Mathematics | 14 (100.0%) | 0 (0.0%) |
| Architecture & Engineering | 12 (42.9%) | 16 (57.1%) |
| Life, Physical & Social Science | 0 (0.0%) | 0 (0.0%) |
| Community & Social Service | 14 (19.4%) | 58 (80.6%) |
| Education, Arts & Media | 0 (0.0%) | 8 (100.0%) |
| Legal Services & Support | 0 (0.0%) | 0 (0.0%) |
| Education Instruction & Library | 14 (21.9%) | 50 (78.1%) |
| Arts, Media & Entertainment | 0 (0.0%) | 0 (0.0%) |
| Health Diagnosing & Treating | 0 (0.0%) | 12 (100.0%) |
| Health Technologists | 0 (0.0%) | 12 (100.0%) |
| Total (Category) | 76 (37.2%) | 128 (62.7%) |
| Total (Overall) | 220 (56.1%) | 172 (43.9%) |
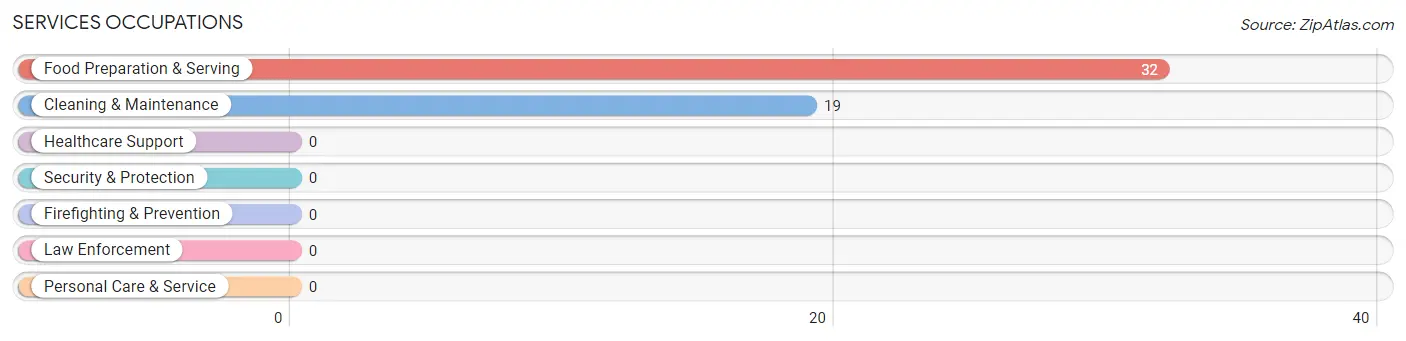
Services Occupations
The most common Services occupations in Washington are Food Preparation & Serving (32 | 8.2%), and Cleaning & Maintenance (19 | 4.9%).
Services Occupations by Sex
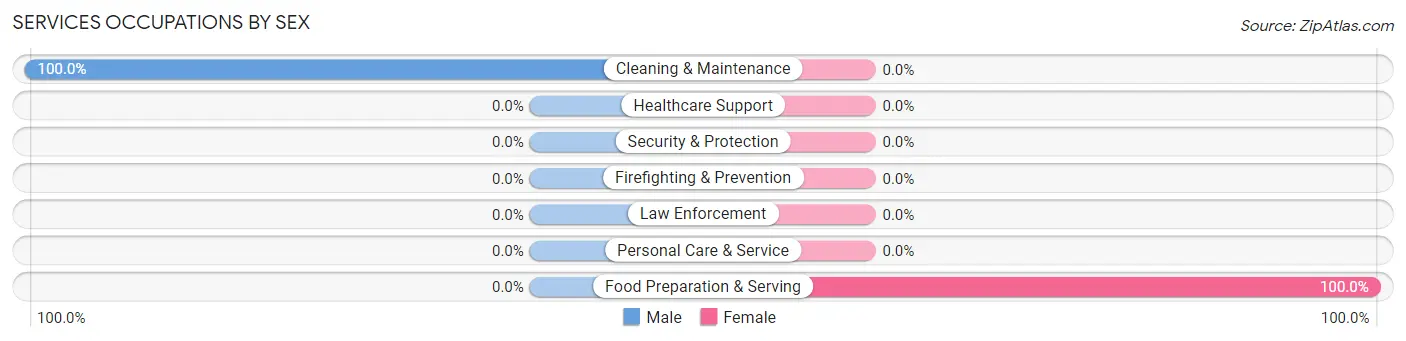
| Occupation | Male | Female |
| Healthcare Support | 0 (0.0%) | 0 (0.0%) |
| Security & Protection | 0 (0.0%) | 0 (0.0%) |
| Firefighting & Prevention | 0 (0.0%) | 0 (0.0%) |
| Law Enforcement | 0 (0.0%) | 0 (0.0%) |
| Food Preparation & Serving | 0 (0.0%) | 32 (100.0%) |
| Cleaning & Maintenance | 19 (100.0%) | 0 (0.0%) |
| Personal Care & Service | 0 (0.0%) | 0 (0.0%) |
| Total (Category) | 19 (37.2%) | 32 (62.7%) |
| Total (Overall) | 220 (56.1%) | 172 (43.9%) |
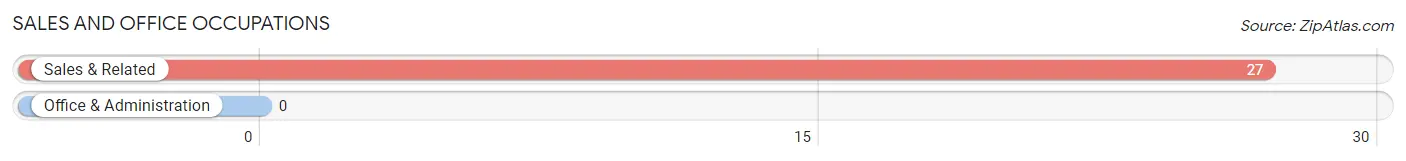
Sales and Office Occupations
The most common Sales and Office occupations in Washington are , and Sales & Related (27 | 6.9%).
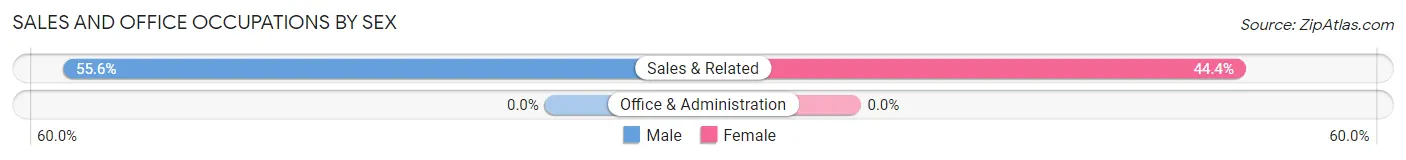
Sales and Office Occupations by Sex
| Occupation | Male | Female |
| Sales & Related | 15 (55.6%) | 12 (44.4%) |
| Office & Administration | 0 (0.0%) | 0 (0.0%) |
| Total (Category) | 15 (55.6%) | 12 (44.4%) |
| Total (Overall) | 220 (56.1%) | 172 (43.9%) |
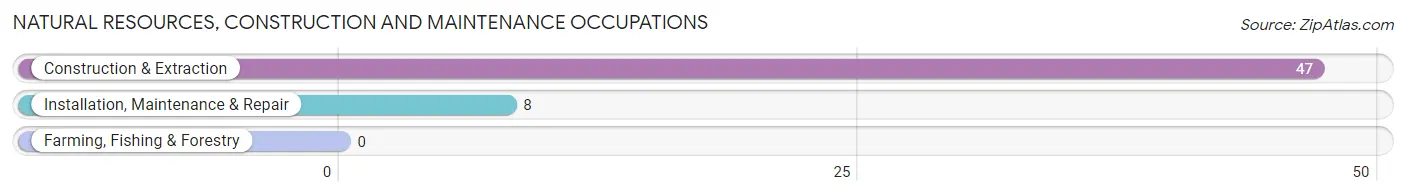
Natural Resources, Construction and Maintenance Occupations
The most common Natural Resources, Construction and Maintenance occupations in Washington are Construction & Extraction (47 | 12.0%), and Installation, Maintenance & Repair (8 | 2.0%).
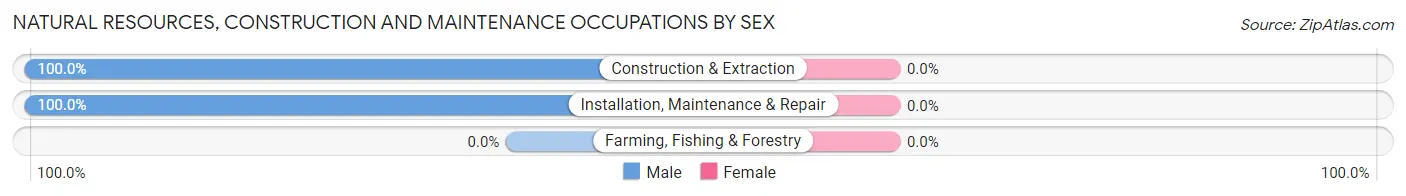
Natural Resources, Construction and Maintenance Occupations by Sex
| Occupation | Male | Female |
| Farming, Fishing & Forestry | 0 (0.0%) | 0 (0.0%) |
| Construction & Extraction | 47 (100.0%) | 0 (0.0%) |
| Installation, Maintenance & Repair | 8 (100.0%) | 0 (0.0%) |
| Total (Category) | 55 (100.0%) | 0 (0.0%) |
| Total (Overall) | 220 (56.1%) | 172 (43.9%) |
Production, Transportation and Moving Occupations
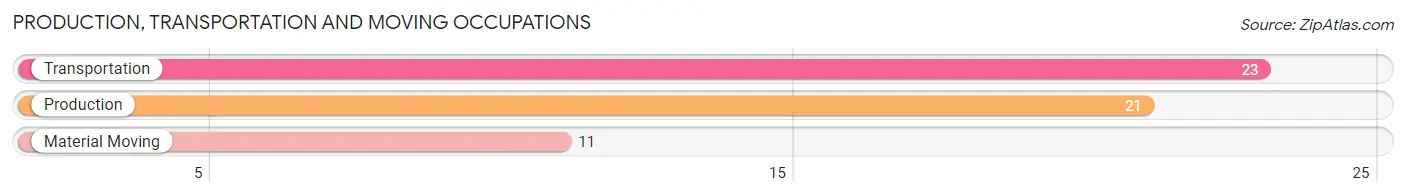
The most common Production, Transportation and Moving occupations in Washington are Transportation (23 | 5.9%), Production (21 | 5.4%), and Material Moving (11 | 2.8%).
Production, Transportation and Moving Occupations by Sex
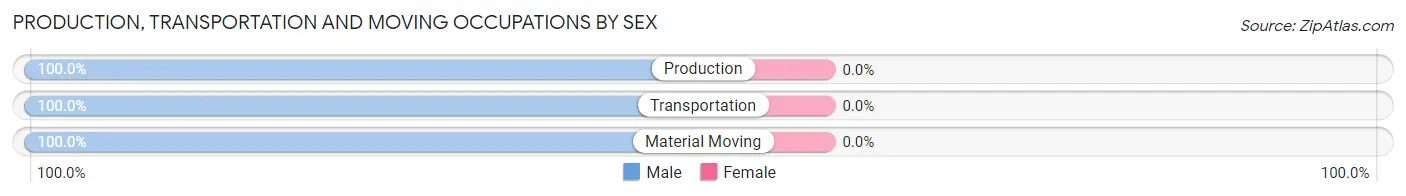
| Occupation | Male | Female |
| Production | 21 (100.0%) | 0 (0.0%) |
| Transportation | 23 (100.0%) | 0 (0.0%) |
| Material Moving | 11 (100.0%) | 0 (0.0%) |
| Total (Category) | 55 (100.0%) | 0 (0.0%) |
| Total (Overall) | 220 (56.1%) | 172 (43.9%) |
Employment Industries by Sex in Washington
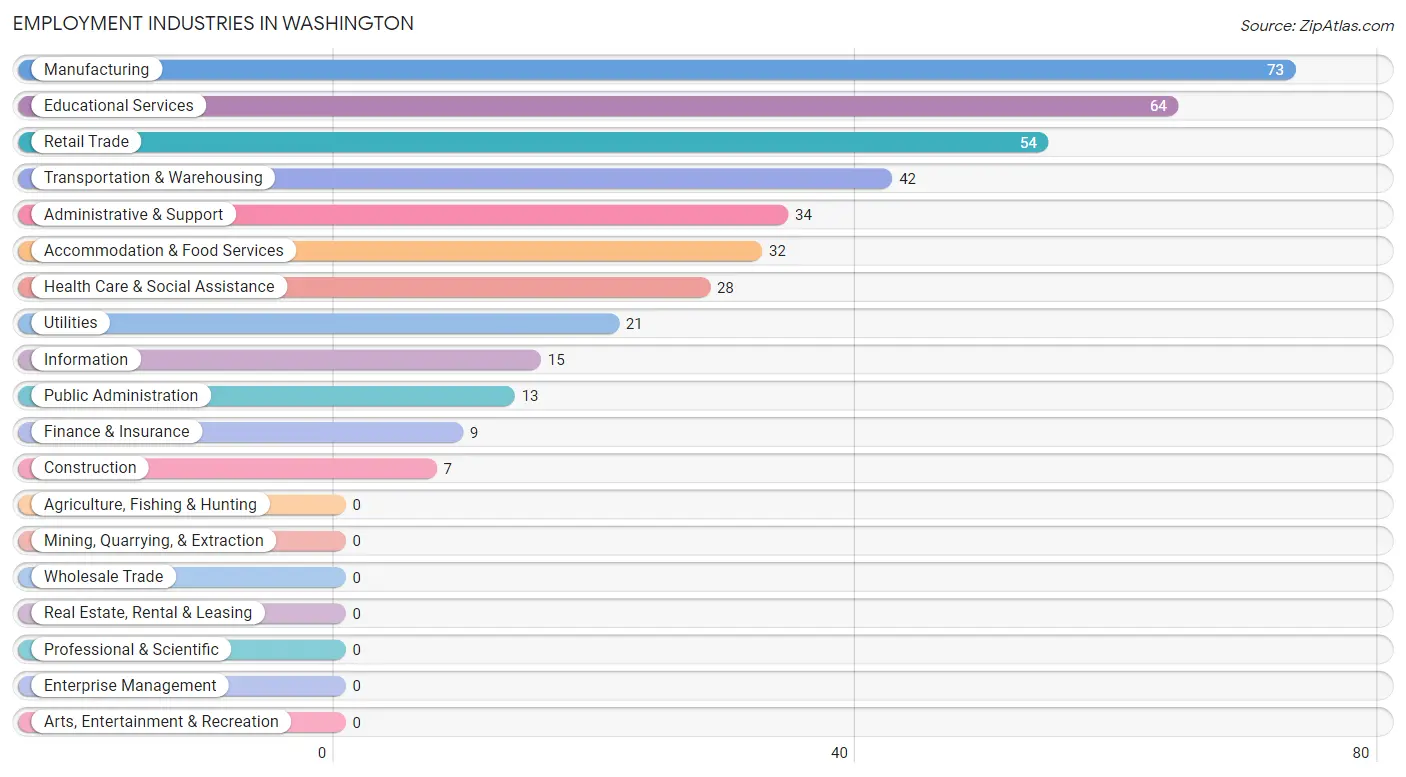
Employment Industries in Washington
The major employment industries in Washington include Manufacturing (73 | 18.6%), Educational Services (64 | 16.3%), Retail Trade (54 | 13.8%), Transportation & Warehousing (42 | 10.7%), and Administrative & Support (34 | 8.7%).
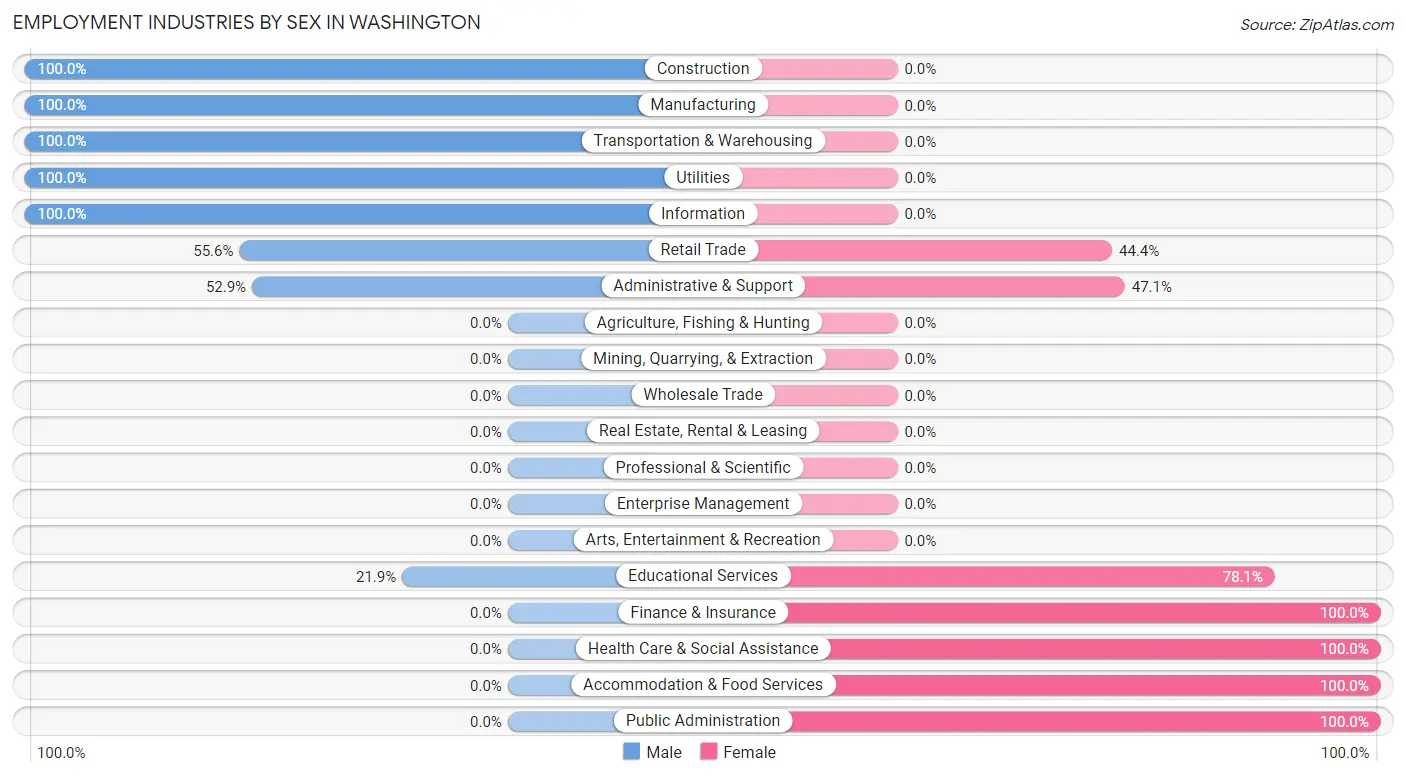
Employment Industries by Sex in Washington
The Washington industries that see more men than women are Construction (100.0%), Manufacturing (100.0%), and Transportation & Warehousing (100.0%), whereas the industries that tend to have a higher number of women are Finance & Insurance (100.0%), Health Care & Social Assistance (100.0%), and Accommodation & Food Services (100.0%).
| Industry | Male | Female |
| Agriculture, Fishing & Hunting | 0 (0.0%) | 0 (0.0%) |
| Mining, Quarrying, & Extraction | 0 (0.0%) | 0 (0.0%) |
| Construction | 7 (100.0%) | 0 (0.0%) |
| Manufacturing | 73 (100.0%) | 0 (0.0%) |
| Wholesale Trade | 0 (0.0%) | 0 (0.0%) |
| Retail Trade | 30 (55.6%) | 24 (44.4%) |
| Transportation & Warehousing | 42 (100.0%) | 0 (0.0%) |
| Utilities | 21 (100.0%) | 0 (0.0%) |
| Information | 15 (100.0%) | 0 (0.0%) |
| Finance & Insurance | 0 (0.0%) | 9 (100.0%) |
| Real Estate, Rental & Leasing | 0 (0.0%) | 0 (0.0%) |
| Professional & Scientific | 0 (0.0%) | 0 (0.0%) |
| Enterprise Management | 0 (0.0%) | 0 (0.0%) |
| Administrative & Support | 18 (52.9%) | 16 (47.1%) |
| Educational Services | 14 (21.9%) | 50 (78.1%) |
| Health Care & Social Assistance | 0 (0.0%) | 28 (100.0%) |
| Arts, Entertainment & Recreation | 0 (0.0%) | 0 (0.0%) |
| Accommodation & Food Services | 0 (0.0%) | 32 (100.0%) |
| Public Administration | 0 (0.0%) | 13 (100.0%) |
| Total | 220 (56.1%) | 172 (43.9%) |
Education in Washington
School Enrollment in Washington
The most common levels of schooling among the 199 students in Washington are middle school (58 | 29.1%), high school (54 | 27.1%), and college / undergraduate (50 | 25.1%).
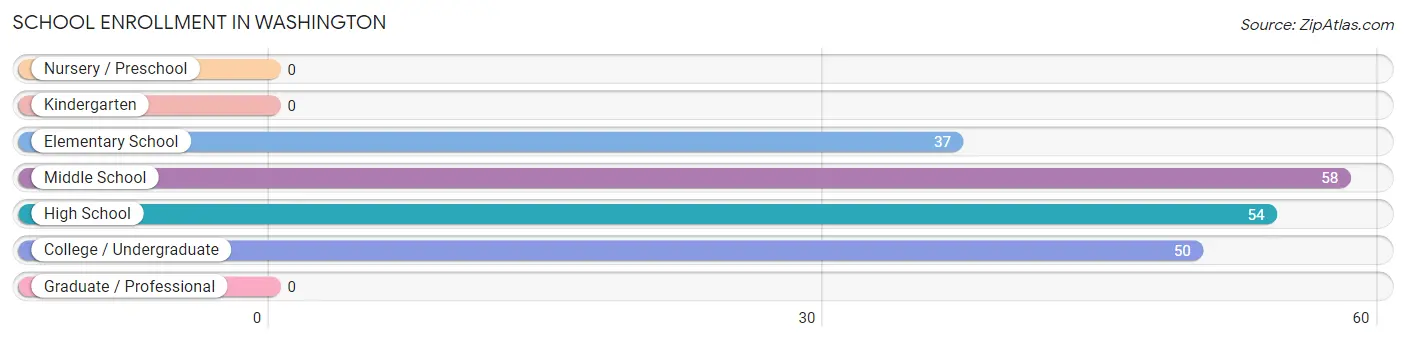
| School Level | # Students | % Students |
| Nursery / Preschool | 0 | 0.0% |
| Kindergarten | 0 | 0.0% |
| Elementary School | 37 | 18.6% |
| Middle School | 58 | 29.1% |
| High School | 54 | 27.1% |
| College / Undergraduate | 50 | 25.1% |
| Graduate / Professional | 0 | 0.0% |
| Total | 199 | 100.0% |
School Enrollment by Age by Funding Source in Washington
Out of a total of 199 students who are enrolled in schools in Washington, 24 (12.1%) attend a private institution, while the remaining 175 (87.9%) are enrolled in public schools. The age group of 10 to 14 year olds has the highest likelihood of being enrolled in private schools, with 23 (22.3% in the age bracket) enrolled. Conversely, the age group of 15 to 17 year olds has the lowest likelihood of being enrolled in a private school, with 34 (100.0% in the age bracket) attending a public institution.
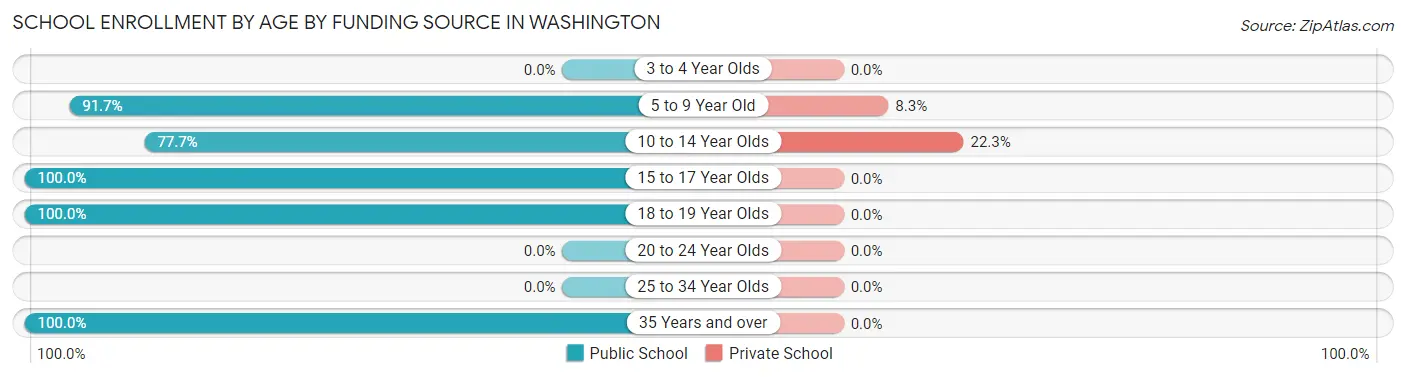
| Age Bracket | Public School | Private School |
| 3 to 4 Year Olds | 0 (0.0%) | 0 (0.0%) |
| 5 to 9 Year Old | 11 (91.7%) | 1 (8.3%) |
| 10 to 14 Year Olds | 80 (77.7%) | 23 (22.3%) |
| 15 to 17 Year Olds | 34 (100.0%) | 0 (0.0%) |
| 18 to 19 Year Olds | 27 (100.0%) | 0 (0.0%) |
| 20 to 24 Year Olds | 0 (0.0%) | 0 (0.0%) |
| 25 to 34 Year Olds | 0 (0.0%) | 0 (0.0%) |
| 35 Years and over | 23 (100.0%) | 0 (0.0%) |
| Total | 175 (87.9%) | 24 (12.1%) |
Educational Attainment by Field of Study in Washington
Education (163 | 48.5%), engineering (70 | 20.8%), business (35 | 10.4%), arts & humanities (27 | 8.0%), and science & technology (12 | 3.6%) are the most common fields of study among 336 individuals in Washington who have obtained a bachelor's degree or higher.
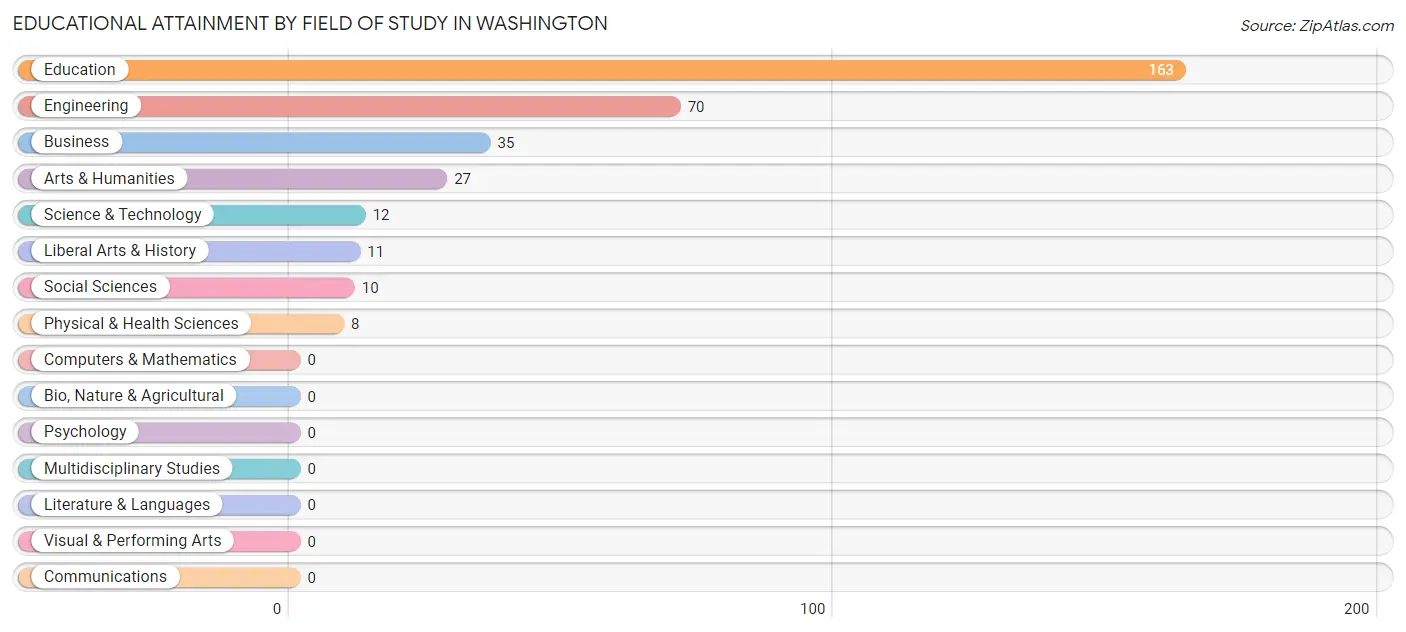
| Field of Study | # Graduates | % Graduates |
| Computers & Mathematics | 0 | 0.0% |
| Bio, Nature & Agricultural | 0 | 0.0% |
| Physical & Health Sciences | 8 | 2.4% |
| Psychology | 0 | 0.0% |
| Social Sciences | 10 | 3.0% |
| Engineering | 70 | 20.8% |
| Multidisciplinary Studies | 0 | 0.0% |
| Science & Technology | 12 | 3.6% |
| Business | 35 | 10.4% |
| Education | 163 | 48.5% |
| Literature & Languages | 0 | 0.0% |
| Liberal Arts & History | 11 | 3.3% |
| Visual & Performing Arts | 0 | 0.0% |
| Communications | 0 | 0.0% |
| Arts & Humanities | 27 | 8.0% |
| Total | 336 | 100.0% |
Transportation & Commute in Washington
Vehicle Availability by Sex in Washington
The most prevalent vehicle ownership categories in Washington are males with 2 vehicles (95, accounting for 43.2%) and females with 2 vehicles (87, making up 55.2%).
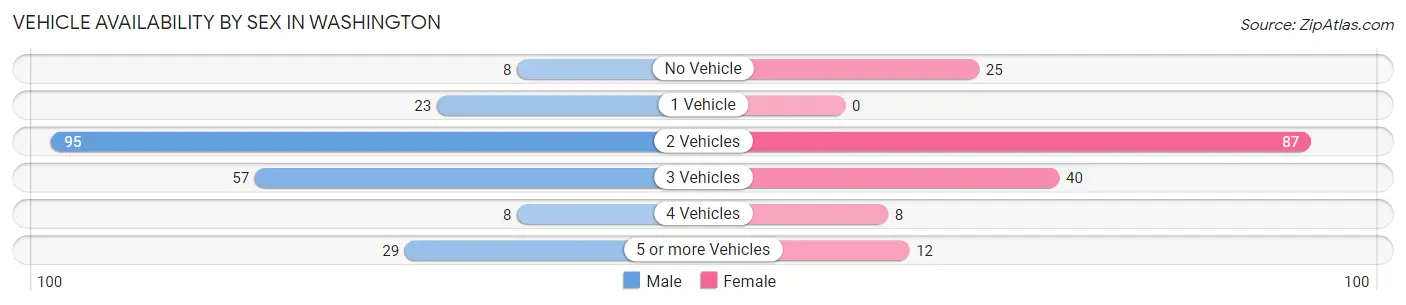
| Vehicles Available | Male | Female |
| No Vehicle | 8 (3.6%) | 25 (14.5%) |
| 1 Vehicle | 23 (10.4%) | 0 (0.0%) |
| 2 Vehicles | 95 (43.2%) | 87 (50.6%) |
| 3 Vehicles | 57 (25.9%) | 40 (23.3%) |
| 4 Vehicles | 8 (3.6%) | 8 (4.6%) |
| 5 or more Vehicles | 29 (13.2%) | 12 (7.0%) |
| Total | 220 (100.0%) | 172 (100.0%) |
Commute Time in Washington
The most frequently occuring commute durations in Washington are 20 to 24 minutes (111 commuters, 31.3%), 10 to 14 minutes (99 commuters, 27.9%), and 15 to 19 minutes (55 commuters, 15.5%).
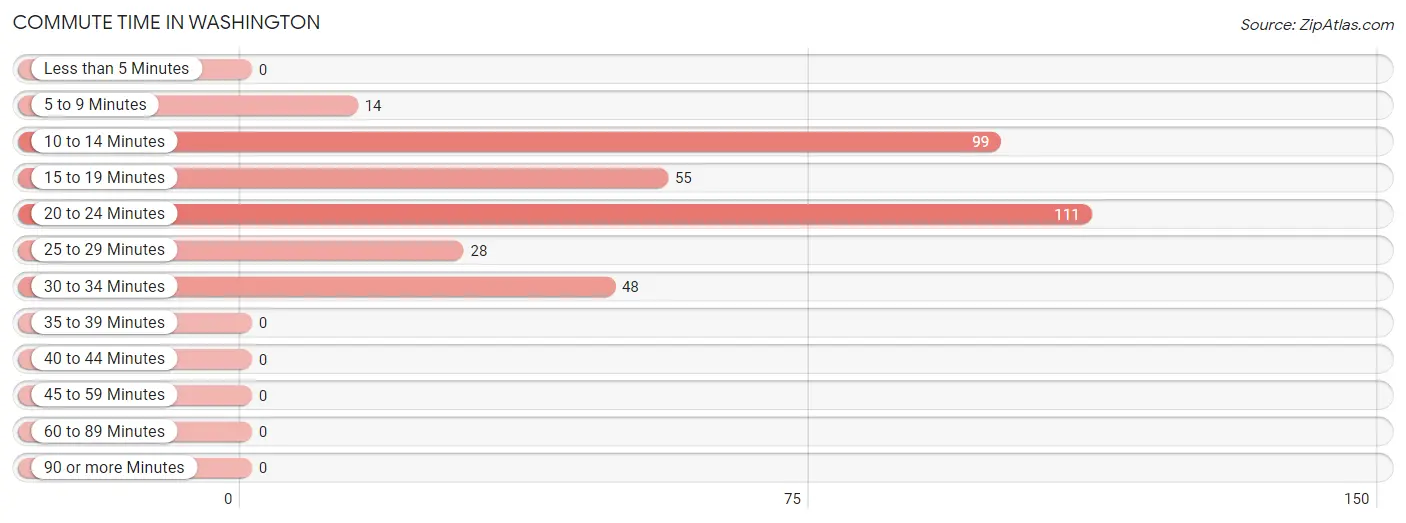
| Commute Time | # Commuters | % Commuters |
| Less than 5 Minutes | 0 | 0.0% |
| 5 to 9 Minutes | 14 | 3.9% |
| 10 to 14 Minutes | 99 | 27.9% |
| 15 to 19 Minutes | 55 | 15.5% |
| 20 to 24 Minutes | 111 | 31.3% |
| 25 to 29 Minutes | 28 | 7.9% |
| 30 to 34 Minutes | 48 | 13.5% |
| 35 to 39 Minutes | 0 | 0.0% |
| 40 to 44 Minutes | 0 | 0.0% |
| 45 to 59 Minutes | 0 | 0.0% |
| 60 to 89 Minutes | 0 | 0.0% |
| 90 or more Minutes | 0 | 0.0% |
Commute Time by Sex in Washington
The most common commute times in Washington are 10 to 14 minutes (54 commuters, 27.6%) for males and 20 to 24 minutes (64 commuters, 40.3%) for females.
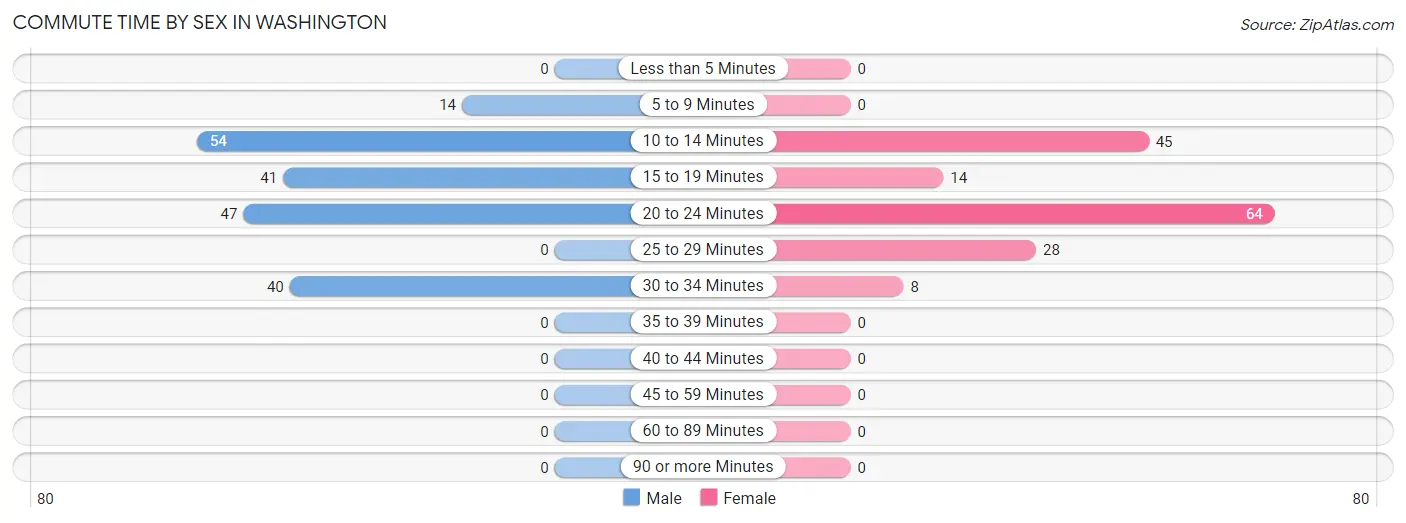
| Commute Time | Male | Female |
| Less than 5 Minutes | 0 (0.0%) | 0 (0.0%) |
| 5 to 9 Minutes | 14 (7.1%) | 0 (0.0%) |
| 10 to 14 Minutes | 54 (27.6%) | 45 (28.3%) |
| 15 to 19 Minutes | 41 (20.9%) | 14 (8.8%) |
| 20 to 24 Minutes | 47 (24.0%) | 64 (40.3%) |
| 25 to 29 Minutes | 0 (0.0%) | 28 (17.6%) |
| 30 to 34 Minutes | 40 (20.4%) | 8 (5.0%) |
| 35 to 39 Minutes | 0 (0.0%) | 0 (0.0%) |
| 40 to 44 Minutes | 0 (0.0%) | 0 (0.0%) |
| 45 to 59 Minutes | 0 (0.0%) | 0 (0.0%) |
| 60 to 89 Minutes | 0 (0.0%) | 0 (0.0%) |
| 90 or more Minutes | 0 (0.0%) | 0 (0.0%) |
Time of Departure to Work by Sex in Washington
The most frequent times of departure to work in Washington are 7:30 AM to 7:59 AM (56, 28.6%) for males and 7:30 AM to 7:59 AM (92, 57.9%) for females.
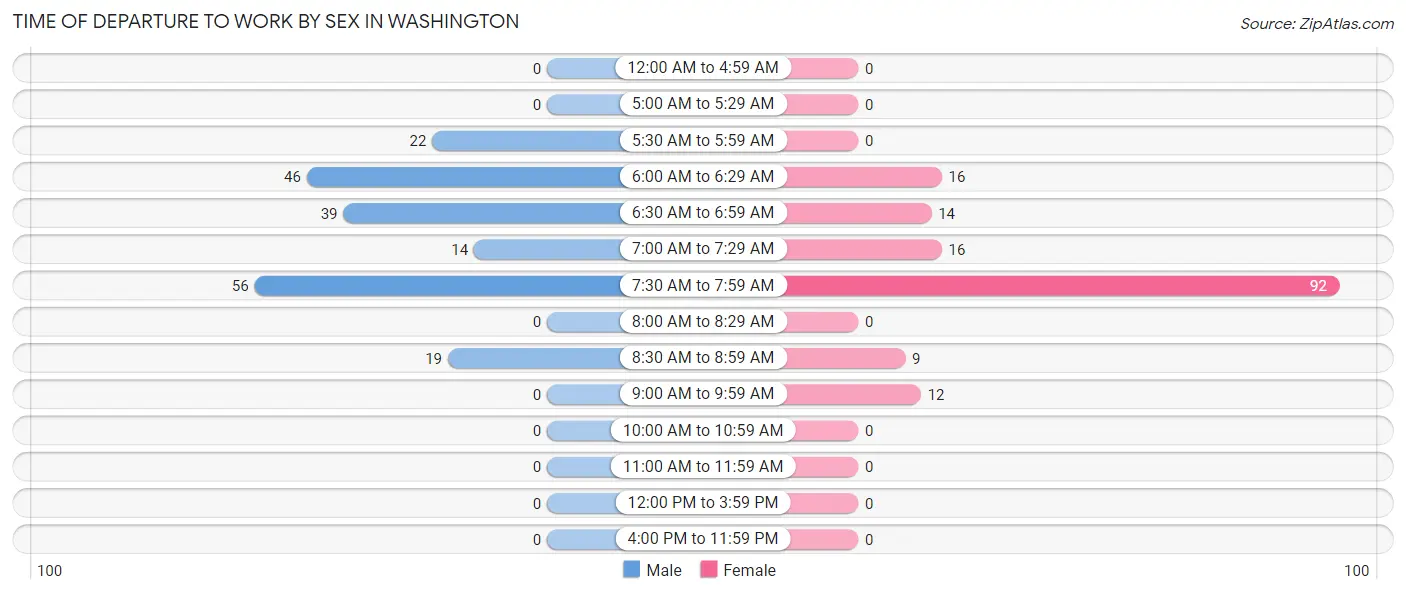
| Time of Departure | Male | Female |
| 12:00 AM to 4:59 AM | 0 (0.0%) | 0 (0.0%) |
| 5:00 AM to 5:29 AM | 0 (0.0%) | 0 (0.0%) |
| 5:30 AM to 5:59 AM | 22 (11.2%) | 0 (0.0%) |
| 6:00 AM to 6:29 AM | 46 (23.5%) | 16 (10.1%) |
| 6:30 AM to 6:59 AM | 39 (19.9%) | 14 (8.8%) |
| 7:00 AM to 7:29 AM | 14 (7.1%) | 16 (10.1%) |
| 7:30 AM to 7:59 AM | 56 (28.6%) | 92 (57.9%) |
| 8:00 AM to 8:29 AM | 0 (0.0%) | 0 (0.0%) |
| 8:30 AM to 8:59 AM | 19 (9.7%) | 9 (5.7%) |
| 9:00 AM to 9:59 AM | 0 (0.0%) | 12 (7.5%) |
| 10:00 AM to 10:59 AM | 0 (0.0%) | 0 (0.0%) |
| 11:00 AM to 11:59 AM | 0 (0.0%) | 0 (0.0%) |
| 12:00 PM to 3:59 PM | 0 (0.0%) | 0 (0.0%) |
| 4:00 PM to 11:59 PM | 0 (0.0%) | 0 (0.0%) |
| Total | 196 (100.0%) | 159 (100.0%) |
Housing Occupancy in Washington
Occupancy by Ownership in Washington
Of the total 586 dwellings in Washington, owner-occupied units account for 362 (61.8%), while renter-occupied units make up 224 (38.2%).
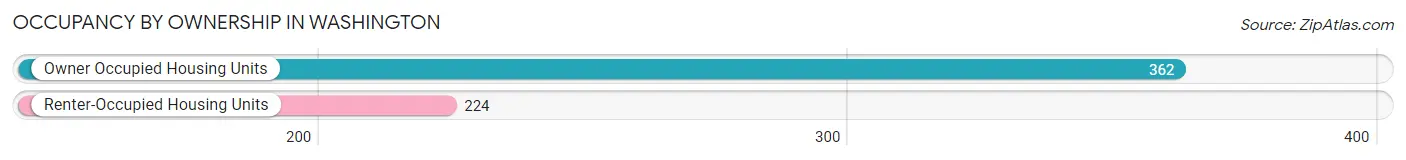
| Occupancy | # Housing Units | % Housing Units |
| Owner Occupied Housing Units | 362 | 61.8% |
| Renter-Occupied Housing Units | 224 | 38.2% |
| Total Occupied Housing Units | 586 | 100.0% |
Occupancy by Household Size in Washington
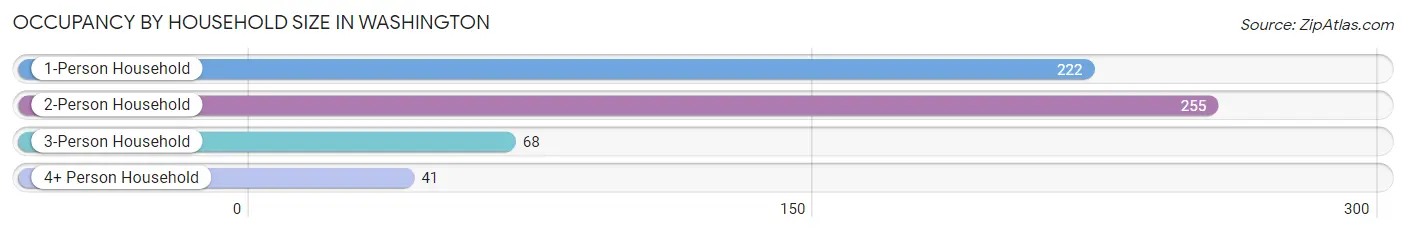
| Household Size | # Housing Units | % Housing Units |
| 1-Person Household | 222 | 37.9% |
| 2-Person Household | 255 | 43.5% |
| 3-Person Household | 68 | 11.6% |
| 4+ Person Household | 41 | 7.0% |
| Total Housing Units | 586 | 100.0% |
Occupancy by Ownership by Household Size in Washington
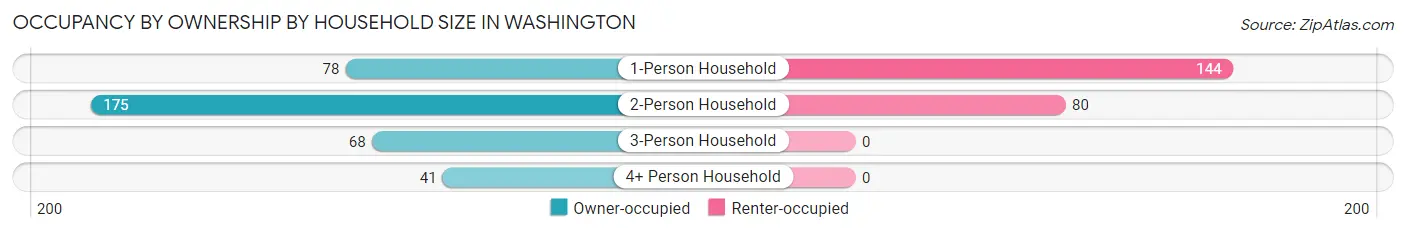
| Household Size | Owner-occupied | Renter-occupied |
| 1-Person Household | 78 (35.1%) | 144 (64.9%) |
| 2-Person Household | 175 (68.6%) | 80 (31.4%) |
| 3-Person Household | 68 (100.0%) | 0 (0.0%) |
| 4+ Person Household | 41 (100.0%) | 0 (0.0%) |
| Total Housing Units | 362 (61.8%) | 224 (38.2%) |
Occupancy by Educational Attainment in Washington
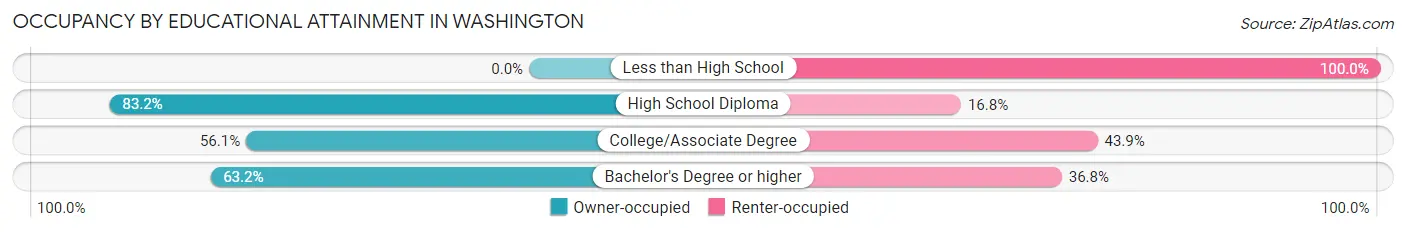
| Household Size | Owner-occupied | Renter-occupied |
| Less than High School | 0 (0.0%) | 13 (100.0%) |
| High School Diploma | 89 (83.2%) | 18 (16.8%) |
| College/Associate Degree | 170 (56.1%) | 133 (43.9%) |
| Bachelor's Degree or higher | 103 (63.2%) | 60 (36.8%) |
Occupancy by Age of Householder in Washington
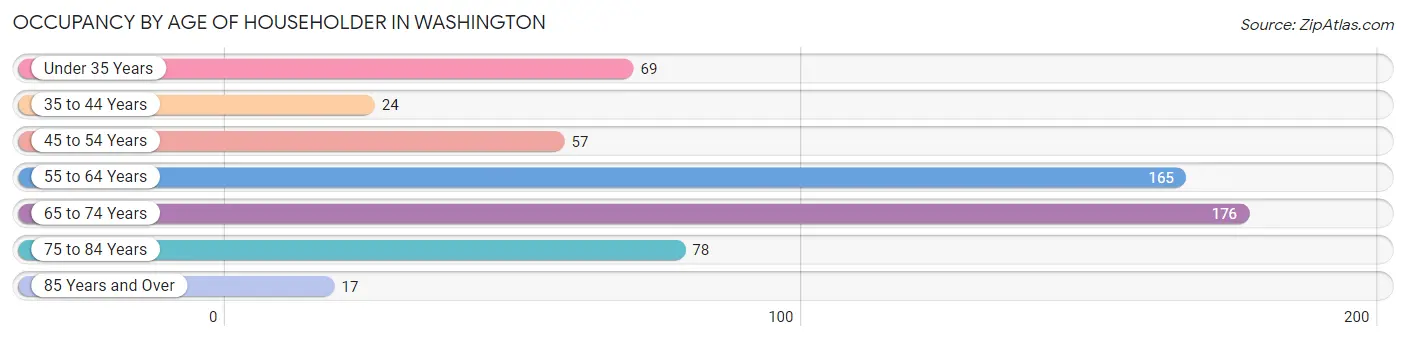
| Age Bracket | # Households | % Households |
| Under 35 Years | 69 | 11.8% |
| 35 to 44 Years | 24 | 4.1% |
| 45 to 54 Years | 57 | 9.7% |
| 55 to 64 Years | 165 | 28.2% |
| 65 to 74 Years | 176 | 30.0% |
| 75 to 84 Years | 78 | 13.3% |
| 85 Years and Over | 17 | 2.9% |
| Total | 586 | 100.0% |
Housing Finances in Washington
Median Income by Occupancy in Washington
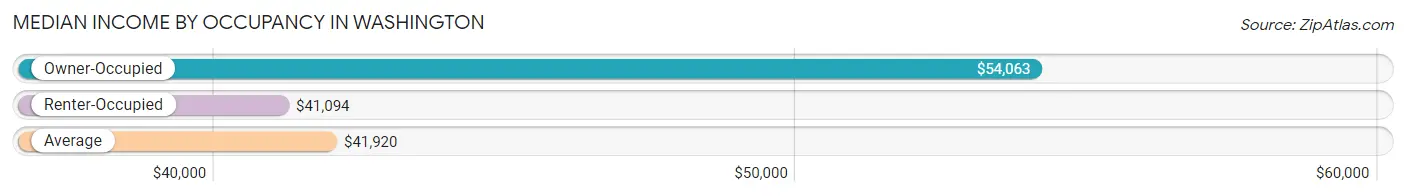
| Occupancy Type | # Households | Median Income |
| Owner-Occupied | 362 (61.8%) | $54,063 |
| Renter-Occupied | 224 (38.2%) | $41,094 |
| Average | 586 (100.0%) | $41,920 |
Occupancy by Householder Income Bracket in Washington
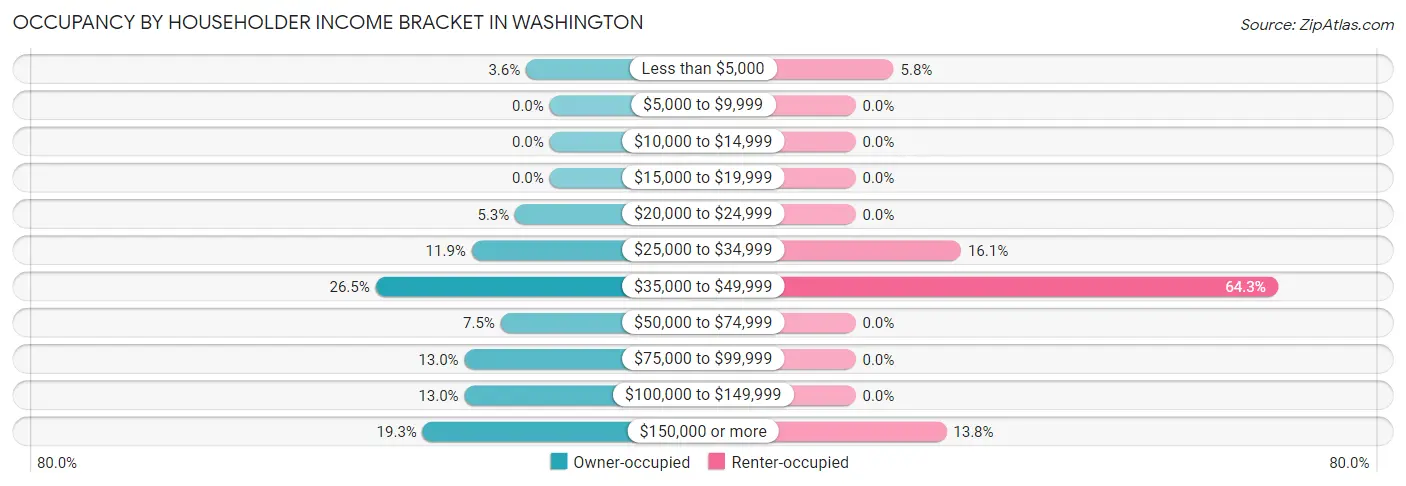
| Income Bracket | Owner-occupied | Renter-occupied |
| Less than $5,000 | 13 (3.6%) | 13 (5.8%) |
| $5,000 to $9,999 | 0 (0.0%) | 0 (0.0%) |
| $10,000 to $14,999 | 0 (0.0%) | 0 (0.0%) |
| $15,000 to $19,999 | 0 (0.0%) | 0 (0.0%) |
| $20,000 to $24,999 | 19 (5.2%) | 0 (0.0%) |
| $25,000 to $34,999 | 43 (11.9%) | 36 (16.1%) |
| $35,000 to $49,999 | 96 (26.5%) | 144 (64.3%) |
| $50,000 to $74,999 | 27 (7.5%) | 0 (0.0%) |
| $75,000 to $99,999 | 47 (13.0%) | 0 (0.0%) |
| $100,000 to $149,999 | 47 (13.0%) | 0 (0.0%) |
| $150,000 or more | 70 (19.3%) | 31 (13.8%) |
| Total | 362 (100.0%) | 224 (100.0%) |
Monthly Housing Cost Tiers in Washington
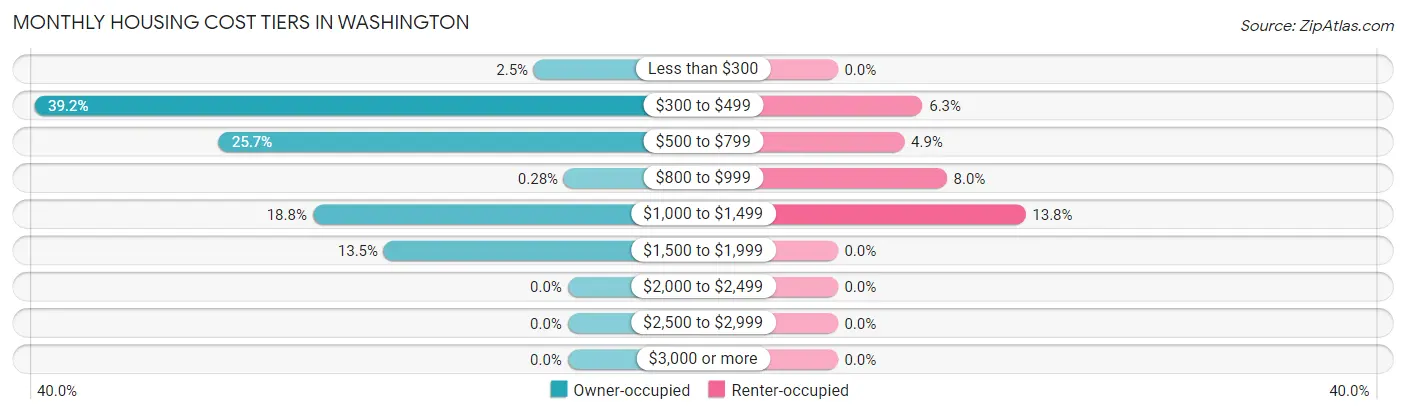
| Monthly Cost | Owner-occupied | Renter-occupied |
| Less than $300 | 9 (2.5%) | 0 (0.0%) |
| $300 to $499 | 142 (39.2%) | 14 (6.2%) |
| $500 to $799 | 93 (25.7%) | 11 (4.9%) |
| $800 to $999 | 1 (0.3%) | 18 (8.0%) |
| $1,000 to $1,499 | 68 (18.8%) | 31 (13.8%) |
| $1,500 to $1,999 | 49 (13.5%) | 0 (0.0%) |
| $2,000 to $2,499 | 0 (0.0%) | 0 (0.0%) |
| $2,500 to $2,999 | 0 (0.0%) | 0 (0.0%) |
| $3,000 or more | 0 (0.0%) | 0 (0.0%) |
| Total | 362 (100.0%) | 224 (100.0%) |
Physical Housing Characteristics in Washington
Housing Structures in Washington
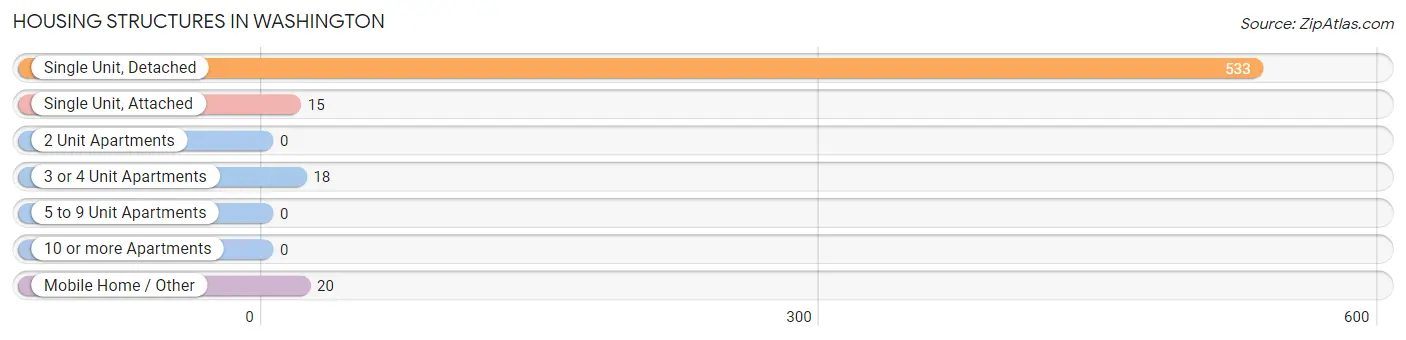
| Structure Type | # Housing Units | % Housing Units |
| Single Unit, Detached | 533 | 91.0% |
| Single Unit, Attached | 15 | 2.6% |
| 2 Unit Apartments | 0 | 0.0% |
| 3 or 4 Unit Apartments | 18 | 3.1% |
| 5 to 9 Unit Apartments | 0 | 0.0% |
| 10 or more Apartments | 0 | 0.0% |
| Mobile Home / Other | 20 | 3.4% |
| Total | 586 | 100.0% |
Housing Structures by Occupancy in Washington
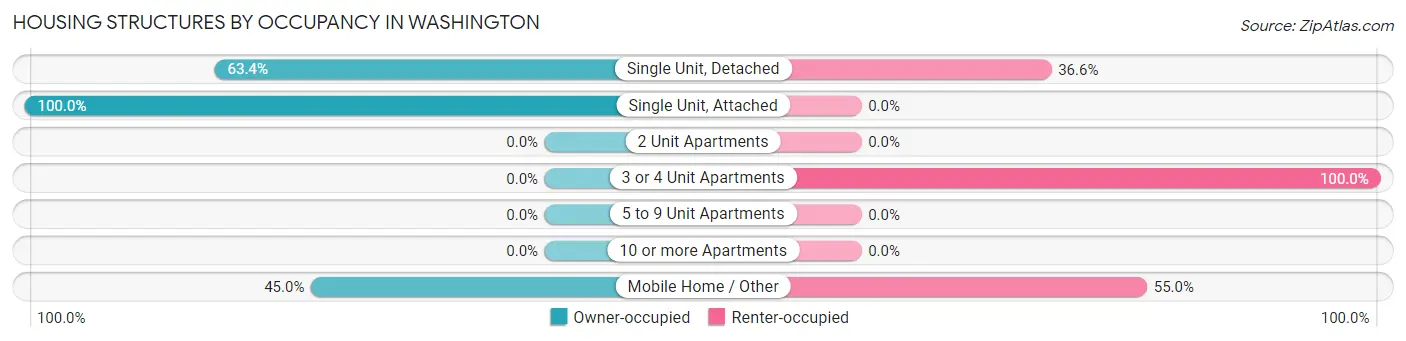
| Structure Type | Owner-occupied | Renter-occupied |
| Single Unit, Detached | 338 (63.4%) | 195 (36.6%) |
| Single Unit, Attached | 15 (100.0%) | 0 (0.0%) |
| 2 Unit Apartments | 0 (0.0%) | 0 (0.0%) |
| 3 or 4 Unit Apartments | 0 (0.0%) | 18 (100.0%) |
| 5 to 9 Unit Apartments | 0 (0.0%) | 0 (0.0%) |
| 10 or more Apartments | 0 (0.0%) | 0 (0.0%) |
| Mobile Home / Other | 9 (45.0%) | 11 (55.0%) |
| Total | 362 (61.8%) | 224 (38.2%) |
Housing Structures by Number of Rooms in Washington
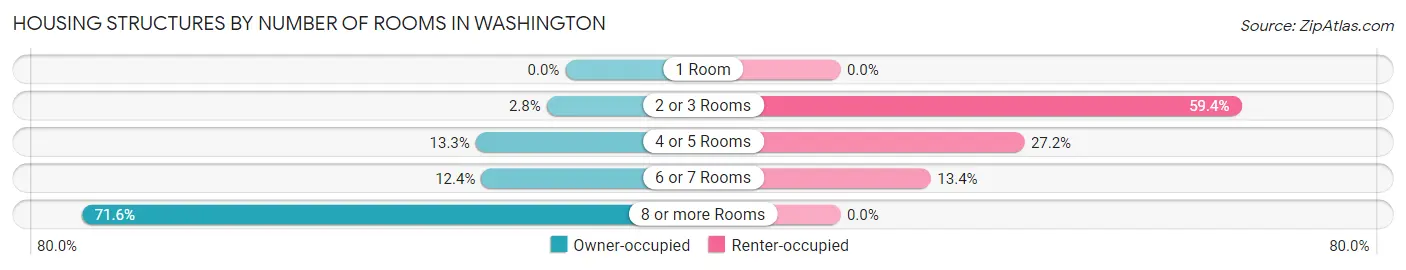
| Number of Rooms | Owner-occupied | Renter-occupied |
| 1 Room | 0 (0.0%) | 0 (0.0%) |
| 2 or 3 Rooms | 10 (2.8%) | 133 (59.4%) |
| 4 or 5 Rooms | 48 (13.3%) | 61 (27.2%) |
| 6 or 7 Rooms | 45 (12.4%) | 30 (13.4%) |
| 8 or more Rooms | 259 (71.6%) | 0 (0.0%) |
| Total | 362 (100.0%) | 224 (100.0%) |
Housing Structure by Heating Type in Washington
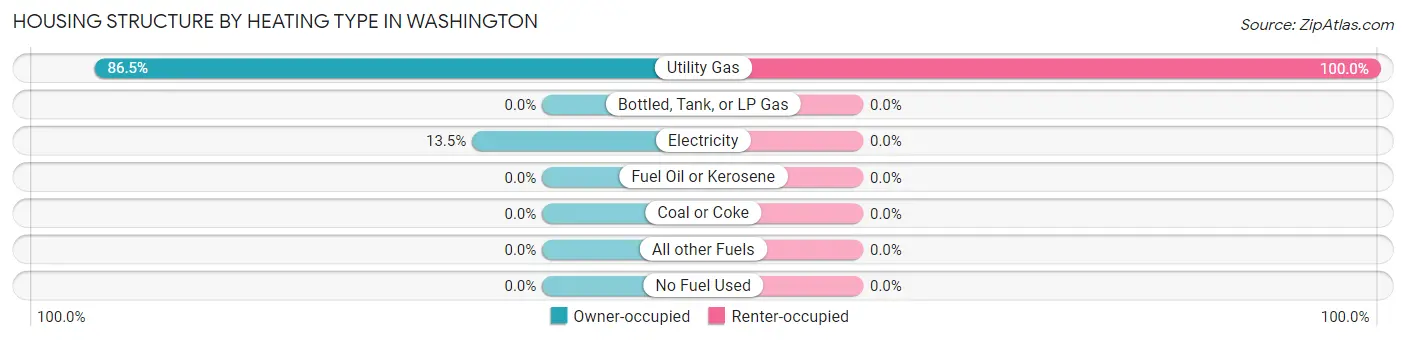
| Heating Type | Owner-occupied | Renter-occupied |
| Utility Gas | 313 (86.5%) | 224 (100.0%) |
| Bottled, Tank, or LP Gas | 0 (0.0%) | 0 (0.0%) |
| Electricity | 49 (13.5%) | 0 (0.0%) |
| Fuel Oil or Kerosene | 0 (0.0%) | 0 (0.0%) |
| Coal or Coke | 0 (0.0%) | 0 (0.0%) |
| All other Fuels | 0 (0.0%) | 0 (0.0%) |
| No Fuel Used | 0 (0.0%) | 0 (0.0%) |
| Total | 362 (100.0%) | 224 (100.0%) |
Household Vehicle Usage in Washington
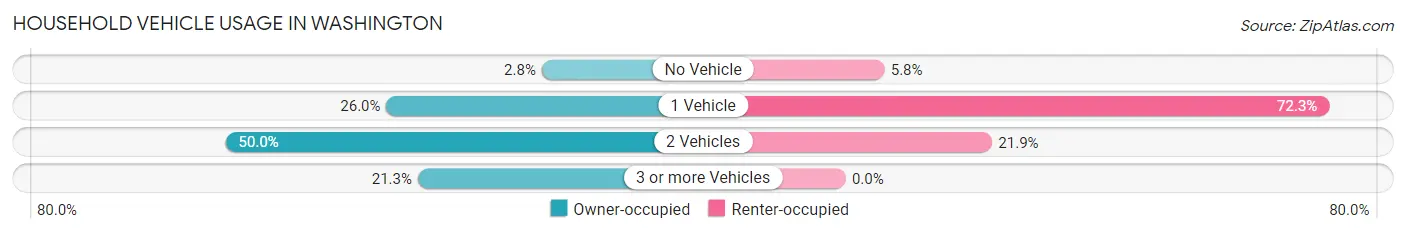
| Vehicles per Household | Owner-occupied | Renter-occupied |
| No Vehicle | 10 (2.8%) | 13 (5.8%) |
| 1 Vehicle | 94 (26.0%) | 162 (72.3%) |
| 2 Vehicles | 181 (50.0%) | 49 (21.9%) |
| 3 or more Vehicles | 77 (21.3%) | 0 (0.0%) |
| Total | 362 (100.0%) | 224 (100.0%) |
Real Estate & Mortgages in Washington
Real Estate and Mortgage Overview in Washington
| Characteristic | Without Mortgage | With Mortgage |
| Housing Units | 208 | 154 |
| Median Property Value | $190,100 | $239,300 |
| Median Household Income | $41,508 | $46 |
| Monthly Housing Costs | $348 | $0 |
| Real Estate Taxes | $1,115 | $0 |
Property Value by Mortgage Status in Washington
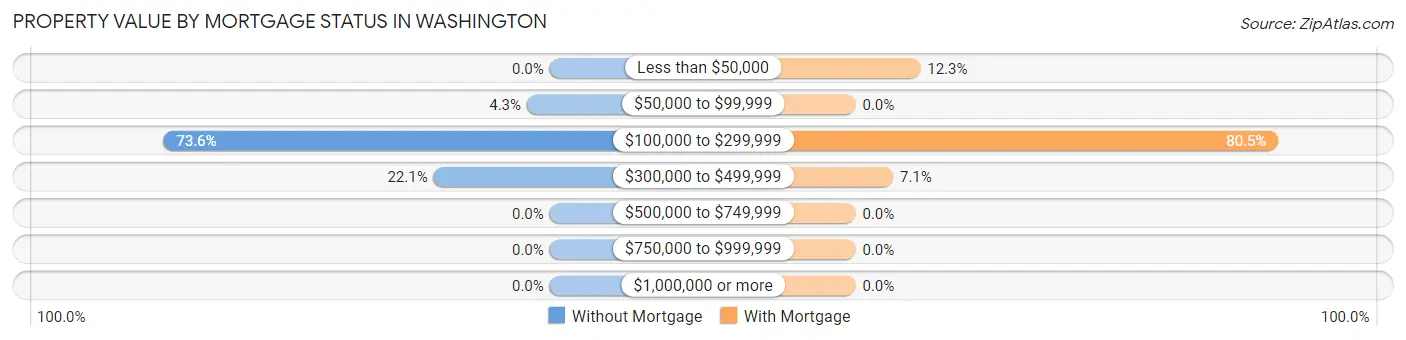
| Property Value | Without Mortgage | With Mortgage |
| Less than $50,000 | 0 (0.0%) | 19 (12.3%) |
| $50,000 to $99,999 | 9 (4.3%) | 0 (0.0%) |
| $100,000 to $299,999 | 153 (73.6%) | 124 (80.5%) |
| $300,000 to $499,999 | 46 (22.1%) | 11 (7.1%) |
| $500,000 to $749,999 | 0 (0.0%) | 0 (0.0%) |
| $750,000 to $999,999 | 0 (0.0%) | 0 (0.0%) |
| $1,000,000 or more | 0 (0.0%) | 0 (0.0%) |
| Total | 208 (100.0%) | 154 (100.0%) |
Household Income by Mortgage Status in Washington
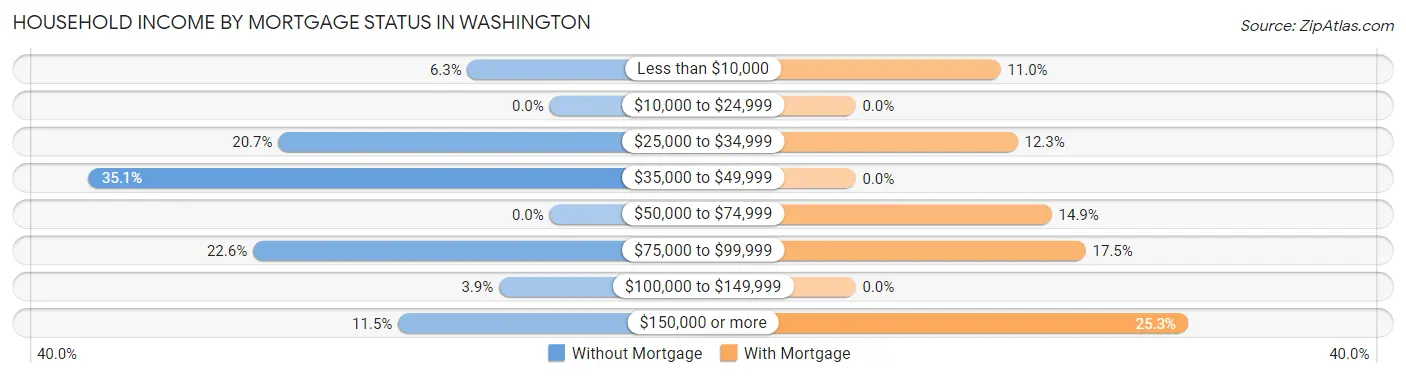
| Household Income | Without Mortgage | With Mortgage |
| Less than $10,000 | 13 (6.2%) | 17 (11.0%) |
| $10,000 to $24,999 | 0 (0.0%) | 0 (0.0%) |
| $25,000 to $34,999 | 43 (20.7%) | 19 (12.3%) |
| $35,000 to $49,999 | 73 (35.1%) | 0 (0.0%) |
| $50,000 to $74,999 | 0 (0.0%) | 23 (14.9%) |
| $75,000 to $99,999 | 47 (22.6%) | 27 (17.5%) |
| $100,000 to $149,999 | 8 (3.8%) | 0 (0.0%) |
| $150,000 or more | 24 (11.5%) | 39 (25.3%) |
| Total | 208 (100.0%) | 154 (100.0%) |
Property Value to Household Income Ratio in Washington
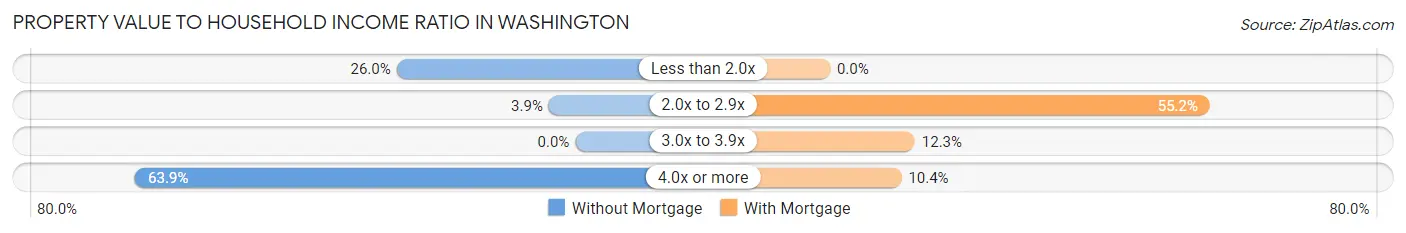
| Value-to-Income Ratio | Without Mortgage | With Mortgage |
| Less than 2.0x | 54 (26.0%) | 0 (0.0%) |
| 2.0x to 2.9x | 8 (3.8%) | 85 (55.2%) |
| 3.0x to 3.9x | 0 (0.0%) | 19 (12.3%) |
| 4.0x or more | 133 (63.9%) | 16 (10.4%) |
| Total | 208 (100.0%) | 154 (100.0%) |
Real Estate Taxes by Mortgage Status in Washington
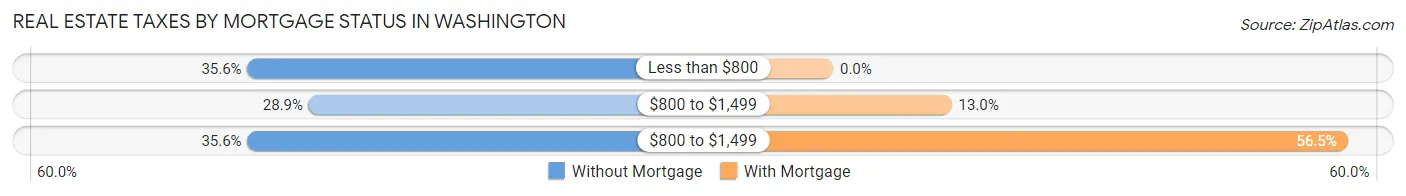
| Property Taxes | Without Mortgage | With Mortgage |
| Less than $800 | 74 (35.6%) | 0 (0.0%) |
| $800 to $1,499 | 60 (28.8%) | 20 (13.0%) |
| $800 to $1,499 | 74 (35.6%) | 87 (56.5%) |
| Total | 208 (100.0%) | 154 (100.0%) |
Health & Disability in Washington
Health Insurance Coverage by Age in Washington
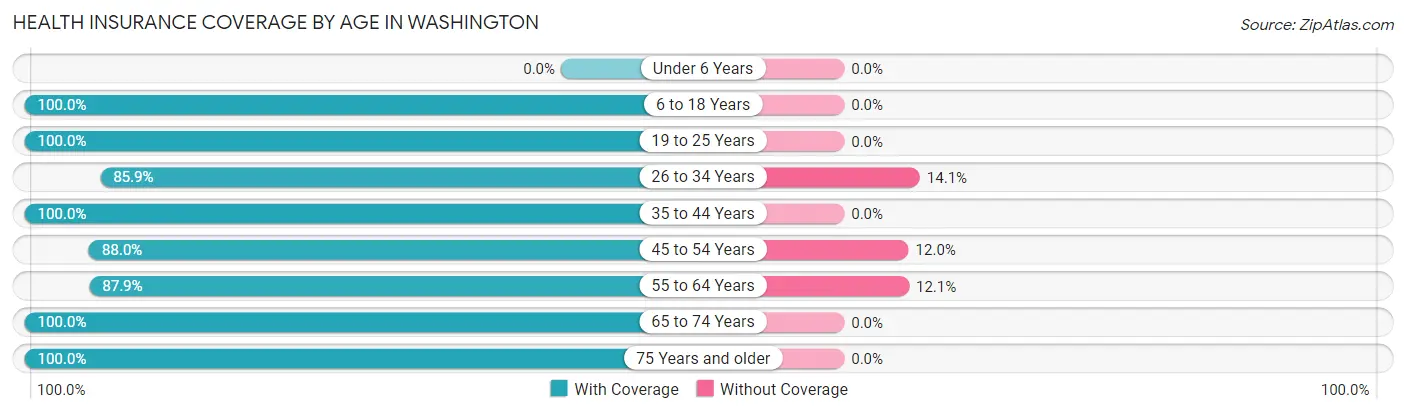
| Age Bracket | With Coverage | Without Coverage |
| Under 6 Years | 0 (0.0%) | 0 (0.0%) |
| 6 to 18 Years | 149 (100.0%) | 0 (0.0%) |
| 19 to 25 Years | 74 (100.0%) | 0 (0.0%) |
| 26 to 34 Years | 67 (85.9%) | 11 (14.1%) |
| 35 to 44 Years | 81 (100.0%) | 0 (0.0%) |
| 45 to 54 Years | 132 (88.0%) | 18 (12.0%) |
| 55 to 64 Years | 233 (87.9%) | 32 (12.1%) |
| 65 to 74 Years | 232 (100.0%) | 0 (0.0%) |
| 75 Years and older | 126 (100.0%) | 0 (0.0%) |
| Total | 1,094 (94.7%) | 61 (5.3%) |
Health Insurance Coverage by Citizenship Status in Washington
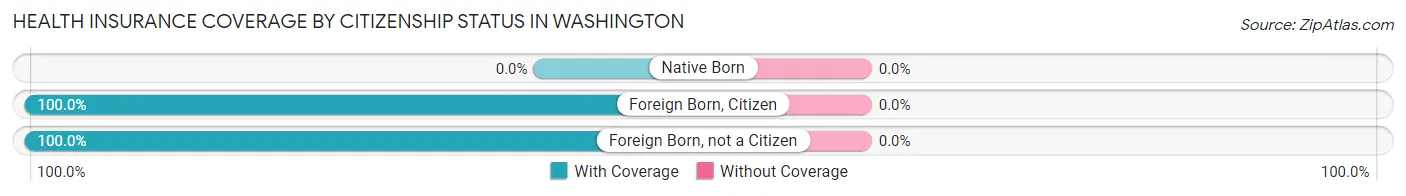
| Citizenship Status | With Coverage | Without Coverage |
| Native Born | 0 (0.0%) | 0 (0.0%) |
| Foreign Born, Citizen | 149 (100.0%) | 0 (0.0%) |
| Foreign Born, not a Citizen | 74 (100.0%) | 0 (0.0%) |
Health Insurance Coverage by Household Income in Washington
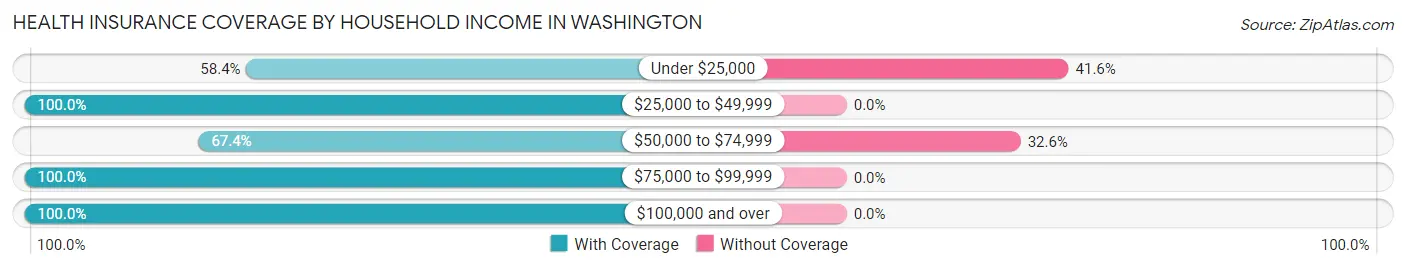
| Household Income | With Coverage | Without Coverage |
| Under $25,000 | 45 (58.4%) | 32 (41.6%) |
| $25,000 to $49,999 | 460 (100.0%) | 0 (0.0%) |
| $50,000 to $74,999 | 60 (67.4%) | 29 (32.6%) |
| $75,000 to $99,999 | 82 (100.0%) | 0 (0.0%) |
| $100,000 and over | 447 (100.0%) | 0 (0.0%) |
Public vs Private Health Insurance Coverage by Age in Washington
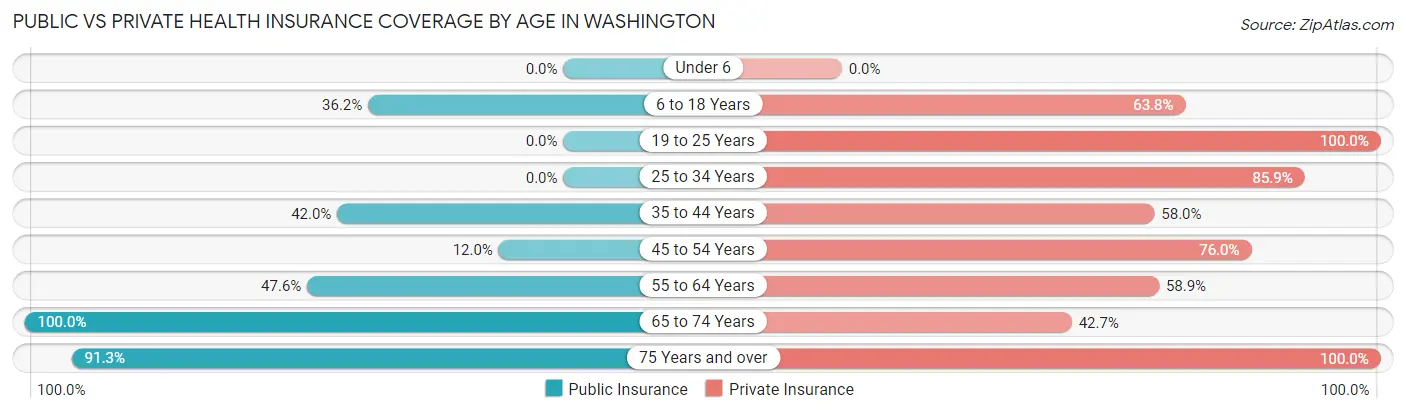
| Age Bracket | Public Insurance | Private Insurance |
| Under 6 | 0 (0.0%) | 0 (0.0%) |
| 6 to 18 Years | 54 (36.2%) | 95 (63.8%) |
| 19 to 25 Years | 0 (0.0%) | 74 (100.0%) |
| 25 to 34 Years | 0 (0.0%) | 67 (85.9%) |
| 35 to 44 Years | 34 (42.0%) | 47 (58.0%) |
| 45 to 54 Years | 18 (12.0%) | 114 (76.0%) |
| 55 to 64 Years | 126 (47.5%) | 156 (58.9%) |
| 65 to 74 Years | 232 (100.0%) | 99 (42.7%) |
| 75 Years and over | 115 (91.3%) | 126 (100.0%) |
| Total | 579 (50.1%) | 778 (67.4%) |
Disability Status by Sex by Age in Washington
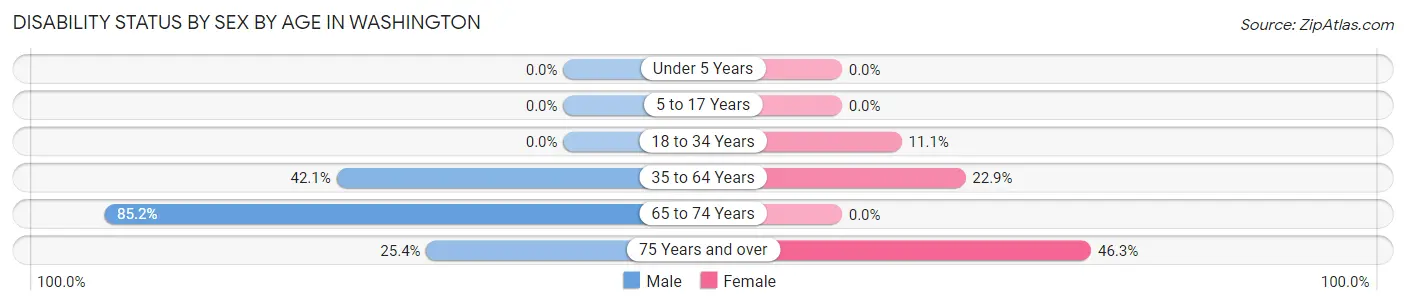
| Age Bracket | Male | Female |
| Under 5 Years | 0 (0.0%) | 0 (0.0%) |
| 5 to 17 Years | 0 (0.0%) | 0 (0.0%) |
| 18 to 34 Years | 0 (0.0%) | 9 (11.1%) |
| 35 to 64 Years | 117 (42.1%) | 50 (22.9%) |
| 65 to 74 Years | 150 (85.2%) | 0 (0.0%) |
| 75 Years and over | 15 (25.4%) | 31 (46.3%) |
Disability Class by Sex by Age in Washington
Disability Class: Hearing Difficulty
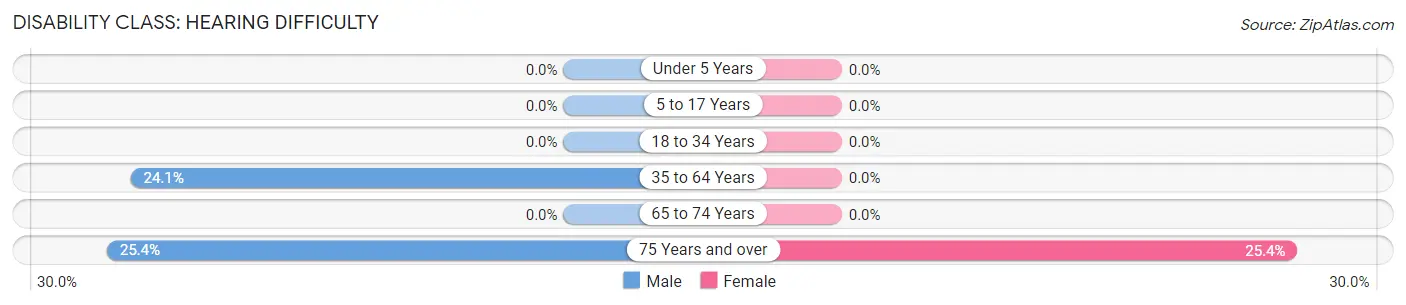
| Age Bracket | Male | Female |
| Under 5 Years | 0 (0.0%) | 0 (0.0%) |
| 5 to 17 Years | 0 (0.0%) | 0 (0.0%) |
| 18 to 34 Years | 0 (0.0%) | 0 (0.0%) |
| 35 to 64 Years | 67 (24.1%) | 0 (0.0%) |
| 65 to 74 Years | 0 (0.0%) | 0 (0.0%) |
| 75 Years and over | 15 (25.4%) | 17 (25.4%) |
Disability Class: Vision Difficulty
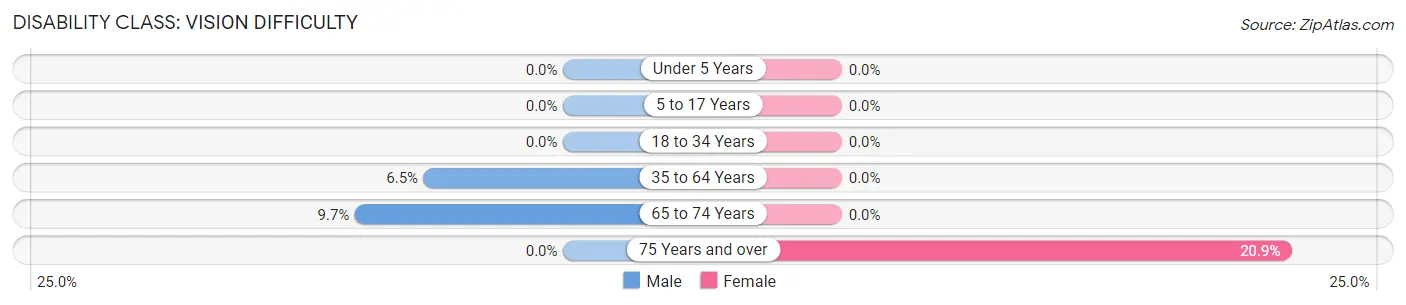
| Age Bracket | Male | Female |
| Under 5 Years | 0 (0.0%) | 0 (0.0%) |
| 5 to 17 Years | 0 (0.0%) | 0 (0.0%) |
| 18 to 34 Years | 0 (0.0%) | 0 (0.0%) |
| 35 to 64 Years | 18 (6.5%) | 0 (0.0%) |
| 65 to 74 Years | 17 (9.7%) | 0 (0.0%) |
| 75 Years and over | 0 (0.0%) | 14 (20.9%) |
Disability Class: Cognitive Difficulty
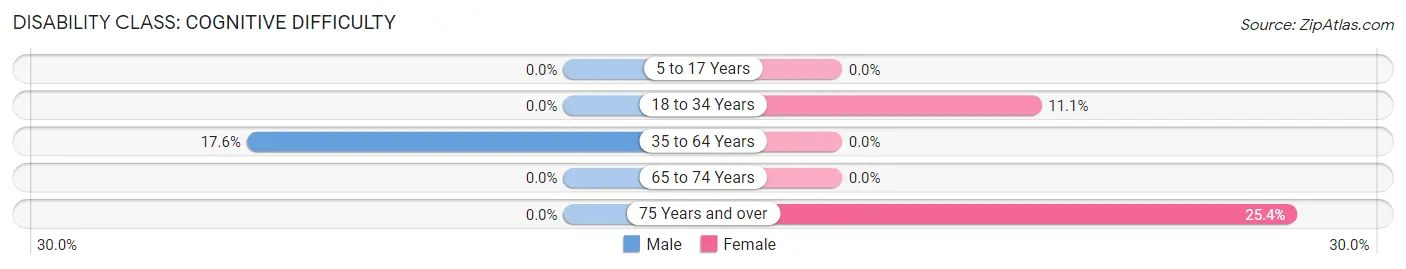
| Age Bracket | Male | Female |
| 5 to 17 Years | 0 (0.0%) | 0 (0.0%) |
| 18 to 34 Years | 0 (0.0%) | 9 (11.1%) |
| 35 to 64 Years | 49 (17.6%) | 0 (0.0%) |
| 65 to 74 Years | 0 (0.0%) | 0 (0.0%) |
| 75 Years and over | 0 (0.0%) | 17 (25.4%) |
Disability Class: Ambulatory Difficulty
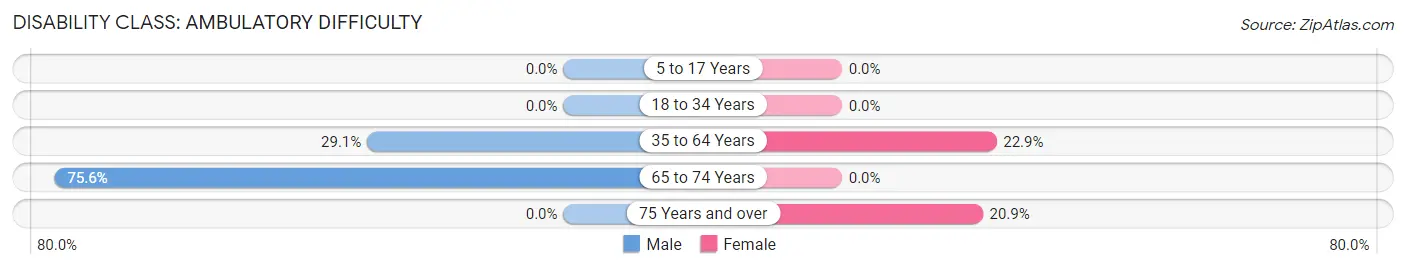
| Age Bracket | Male | Female |
| 5 to 17 Years | 0 (0.0%) | 0 (0.0%) |
| 18 to 34 Years | 0 (0.0%) | 0 (0.0%) |
| 35 to 64 Years | 81 (29.1%) | 50 (22.9%) |
| 65 to 74 Years | 133 (75.6%) | 0 (0.0%) |
| 75 Years and over | 0 (0.0%) | 14 (20.9%) |
Disability Class: Self-Care Difficulty
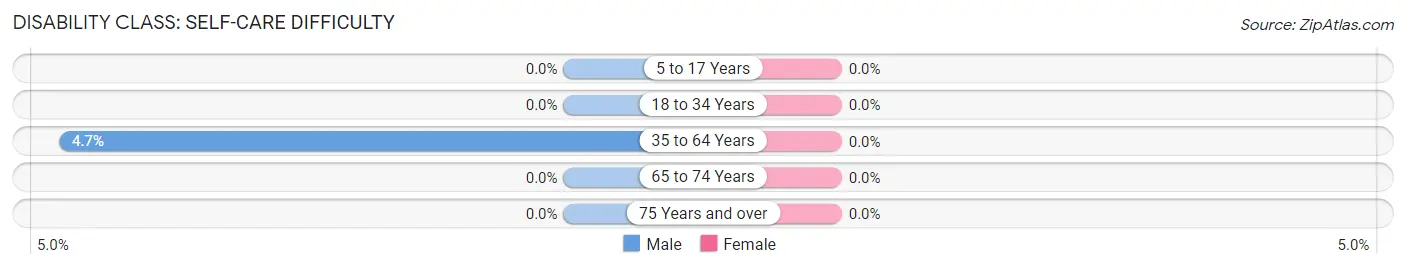
| Age Bracket | Male | Female |
| 5 to 17 Years | 0 (0.0%) | 0 (0.0%) |
| 18 to 34 Years | 0 (0.0%) | 0 (0.0%) |
| 35 to 64 Years | 13 (4.7%) | 0 (0.0%) |
| 65 to 74 Years | 0 (0.0%) | 0 (0.0%) |
| 75 Years and over | 0 (0.0%) | 0 (0.0%) |
Technology Access in Washington
Computing Device Access in Washington
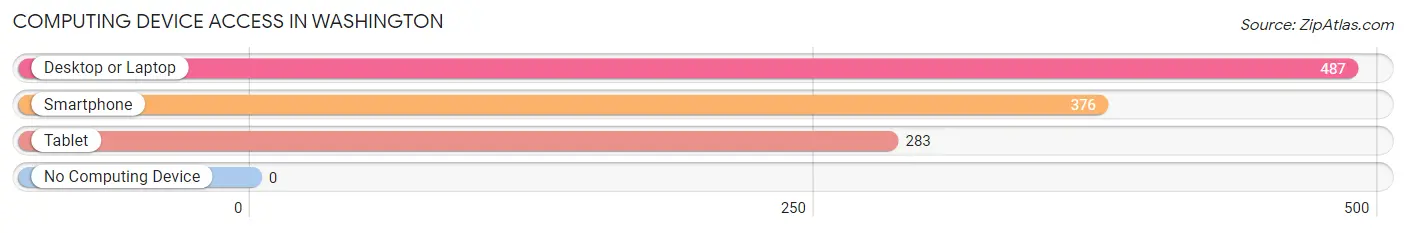
| Device Type | # Households | % Households |
| Desktop or Laptop | 487 | 83.1% |
| Smartphone | 376 | 64.2% |
| Tablet | 283 | 48.3% |
| No Computing Device | 0 | 0.0% |
| Total | 586 | 100.0% |
Internet Access in Washington
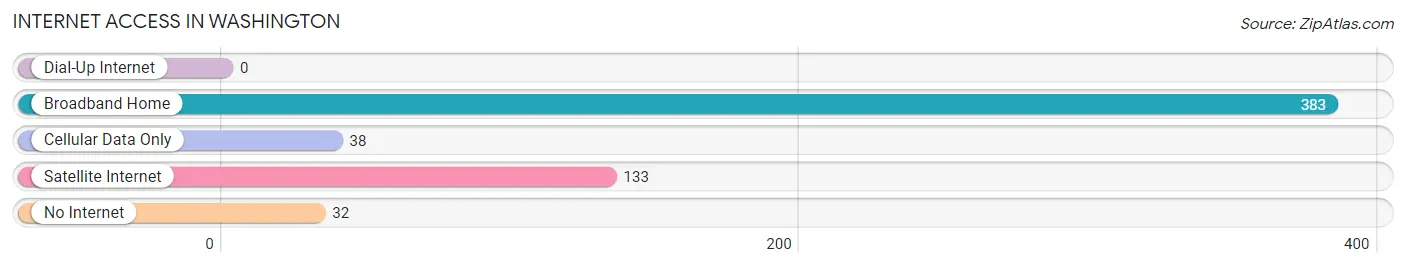
| Internet Type | # Households | % Households |
| Dial-Up Internet | 0 | 0.0% |
| Broadband Home | 383 | 65.4% |
| Cellular Data Only | 38 | 6.5% |
| Satellite Internet | 133 | 22.7% |
| No Internet | 32 | 5.5% |
| Total | 586 | 100.0% |
Washington Summary
Washington, West Virginia is a small town located in the Appalachian Mountains of West Virginia. It is situated in the eastern part of the state, near the border with Virginia. The town was founded in 1790 and is the county seat of Berkeley County. The population of Washington in 2000 was 1,845.
History
Washington was founded in 1790 by a group of settlers from the Shenandoah Valley of Virginia. The town was named after George Washington, the first president of the United States. The town was originally known as “Berkeley Court House”, but the name was changed to Washington in 1810.
The town was an important stop on the Northwestern Turnpike, which connected the Shenandoah Valley to the Ohio River. The turnpike was a major route for settlers heading west and for goods and services traveling east.
The town was also an important stop on the Baltimore and Ohio Railroad, which connected the east coast to the Midwest. The railroad was a major factor in the growth of the town.
Geography
Washington is located in the Appalachian Mountains of West Virginia. The town is situated in the eastern part of the state, near the border with Virginia. The town is located at the confluence of the Potomac and Shenandoah Rivers.
The town is surrounded by rolling hills and mountains. The climate is temperate, with hot summers and cold winters. The average annual temperature is around 50 degrees Fahrenheit.
Economy
The economy of Washington is largely based on agriculture and tourism. The town is home to several farms, which produce a variety of crops, including corn, wheat, and hay.
The town is also home to several tourist attractions, including the Berkeley County Historical Society Museum, the Berkeley County Courthouse, and the Berkeley County Fairgrounds.
Demographics
The population of Washington in 2000 was 1,845. The racial makeup of the town was 97.3% White, 0.9% African American, 0.3% Native American, 0.2% Asian, and 1.3% from other races.
The median household income in 2000 was $30,938. The per capita income was $17,845. The median age was 38.5 years.
Conclusion
Washington, West Virginia is a small town located in the Appalachian Mountains of West Virginia. It was founded in 1790 and is the county seat of Berkeley County. The town was an important stop on the Northwestern Turnpike and the Baltimore and Ohio Railroad. The economy of Washington is largely based on agriculture and tourism. The population of Washington in 2000 was 1,845. The racial makeup of the town was 97.3% White, 0.9% African American, 0.3% Native American, 0.2% Asian, and 1.3% from other races. The median household income in 2000 was $30,938. The per capita income was $17,845. The median age was 38.5 years.
Common Questions
What is Per Capita Income in Washington?
Per Capita income in Washington is $41,488.
What is the Median Household income in Washington?
Median Household Income in Washington is $41,920.
What is Income or Wage Gap in Washington?
Income or Wage Gap in Washington is 30.7%.
Women in Washington earn 69.3 cents for every dollar earned by a man.
What is Inequality or Gini Index in Washington?
Inequality or Gini Index in Washington is 0.44.
What is the Total Population of Washington?
Total Population of Washington is 1,155.
What is the Total Male Population of Washington?
Total Male Population of Washington is 671.
What is the Total Female Population of Washington?
Total Female Population of Washington is 484.
What is the Ratio of Males per 100 Females in Washington?
There are 138.64 Males per 100 Females in Washington.
What is the Ratio of Females per 100 Males in Washington?
There are 72.13 Females per 100 Males in Washington.
What is the Median Population Age in Washington?
Median Population Age in Washington is 56.2 Years.
What is the Average Family Size in Washington
Average Family Size in Washington is 2.5 People.
What is the Average Household Size in Washington
Average Household Size in Washington is 2.0 People.
How Large is the Labor Force in Washington?
There are 410 People in the Labor Forcein in Washington.
What is the Percentage of People in the Labor Force in Washington?
40.8% of People are in the Labor Force in Washington.
What is the Unemployment Rate in Washington?
Unemployment Rate in Washington is 4.4%.