East Dailey, WV Map & Demographics
East Dailey Map
East Dailey Overview
$44,961
PER CAPITA INCOME
49.6%
WAGE / INCOME GAP [ % ]
50.4¢/ $1
WAGE / INCOME GAP [ $ ]
0.32
INEQUALITY / GINI INDEX
428
TOTAL POPULATION
271
MALE POPULATION
157
FEMALE POPULATION
172.61
MALES / 100 FEMALES
57.93
FEMALES / 100 MALES
35.0
MEDIAN AGE
3.9
AVG FAMILY SIZE
3.3
AVG HOUSEHOLD SIZE
269
LABOR FORCE [ PEOPLE ]
85.1%
PERCENT IN LABOR FORCE
Income in East Dailey
Income Overview in East Dailey
| Characteristic | Number | Measure |
| Per Capita Income | 428 | $44,961 |
| Median Family Income | 101 | $0 |
| Mean Family Income | 101 | $137,945 |
| Median Household Income | 131 | $0 |
| Mean Household Income | 131 | $129,653 |
| Income Deficit | 101 | $0 |
| Wage / Income Gap (%) | 428 | 49.60% |
| Wage / Income Gap ($) | 428 | 50.40¢ per $1 |
| Gini / Inequality Index | 428 | 0.32 |
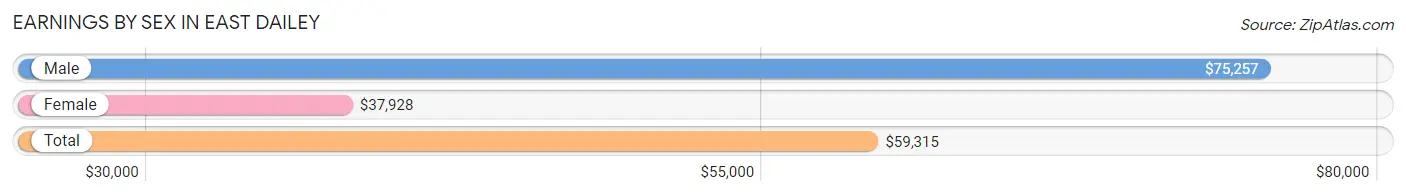
Earnings by Sex in East Dailey
Average Earnings in East Dailey are $59,315, $75,257 for men and $37,928 for women, a difference of 49.6%.
| Sex | Number | Average Earnings |
| Male | 206 (76.6%) | $75,257 |
| Female | 63 (23.4%) | $37,928 |
| Total | 269 (100.0%) | $59,315 |
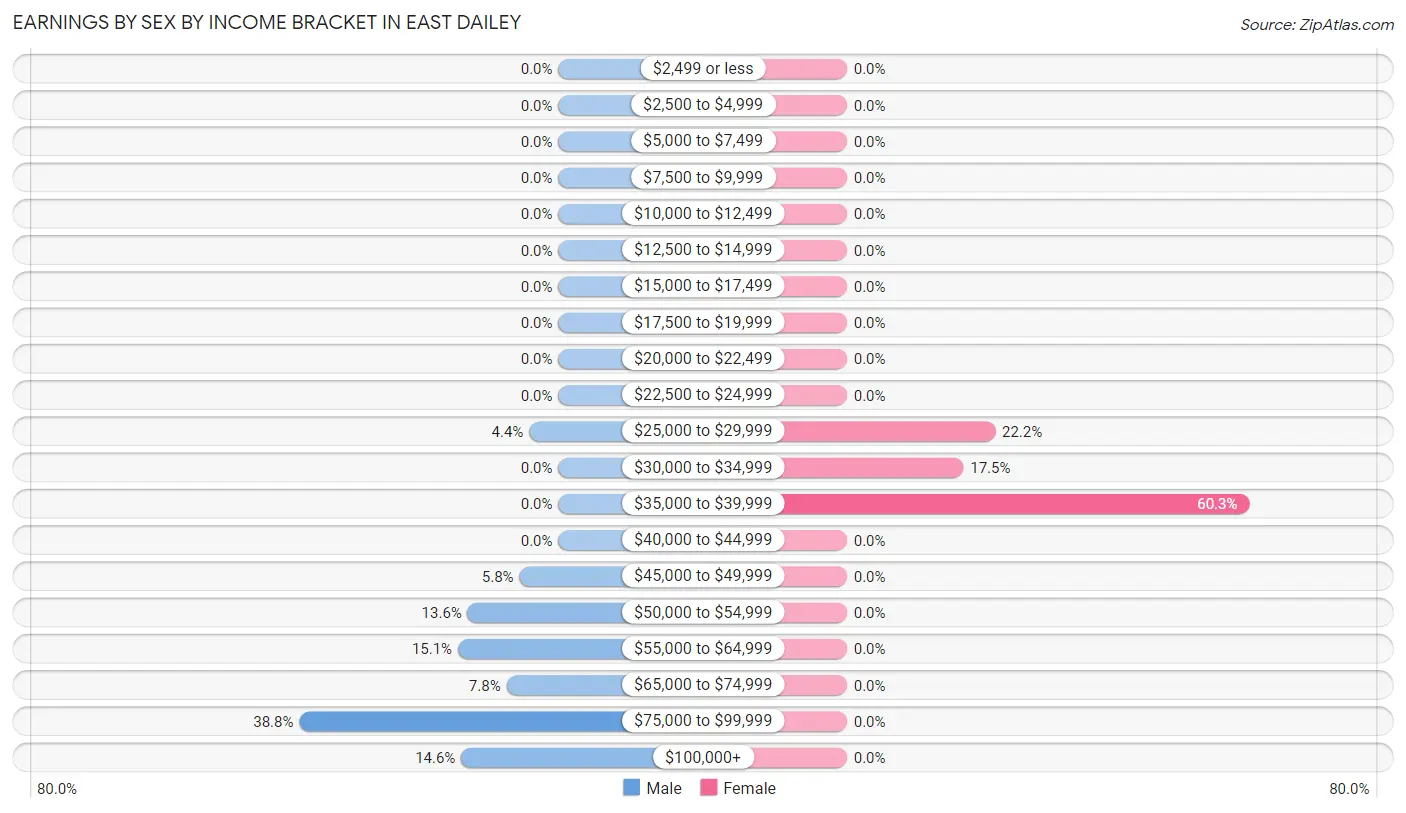
Earnings by Sex by Income Bracket in East Dailey
The most common earnings brackets in East Dailey are $75,000 to $99,999 for men (80 | 38.8%) and $35,000 to $39,999 for women (38 | 60.3%).
| Income | Male | Female |
| $2,499 or less | 0 (0.0%) | 0 (0.0%) |
| $2,500 to $4,999 | 0 (0.0%) | 0 (0.0%) |
| $5,000 to $7,499 | 0 (0.0%) | 0 (0.0%) |
| $7,500 to $9,999 | 0 (0.0%) | 0 (0.0%) |
| $10,000 to $12,499 | 0 (0.0%) | 0 (0.0%) |
| $12,500 to $14,999 | 0 (0.0%) | 0 (0.0%) |
| $15,000 to $17,499 | 0 (0.0%) | 0 (0.0%) |
| $17,500 to $19,999 | 0 (0.0%) | 0 (0.0%) |
| $20,000 to $22,499 | 0 (0.0%) | 0 (0.0%) |
| $22,500 to $24,999 | 0 (0.0%) | 0 (0.0%) |
| $25,000 to $29,999 | 9 (4.4%) | 14 (22.2%) |
| $30,000 to $34,999 | 0 (0.0%) | 11 (17.5%) |
| $35,000 to $39,999 | 0 (0.0%) | 38 (60.3%) |
| $40,000 to $44,999 | 0 (0.0%) | 0 (0.0%) |
| $45,000 to $49,999 | 12 (5.8%) | 0 (0.0%) |
| $50,000 to $54,999 | 28 (13.6%) | 0 (0.0%) |
| $55,000 to $64,999 | 31 (15.0%) | 0 (0.0%) |
| $65,000 to $74,999 | 16 (7.8%) | 0 (0.0%) |
| $75,000 to $99,999 | 80 (38.8%) | 0 (0.0%) |
| $100,000+ | 30 (14.6%) | 0 (0.0%) |
| Total | 206 (100.0%) | 63 (100.0%) |
Earnings by Sex by Educational Attainment in East Dailey
| Educational Attainment | Male Income | Female Income |
| Less than High School | - | - |
| High School Diploma | - | - |
| College or Associate's Degree | - | - |
| Bachelor's Degree | - | - |
| Graduate Degree | - | - |
| Total | $75,257 | $37,928 |
Family Income in East Dailey
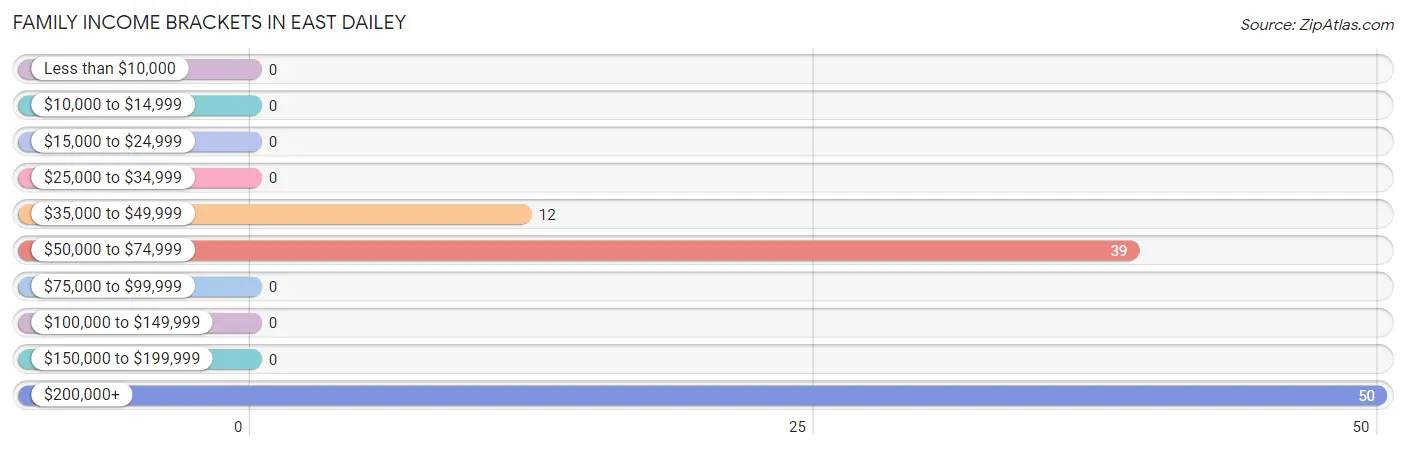
Family Income Brackets in East Dailey
According to the East Dailey family income data, there are 50 families falling into the $200,000+ income range, which is the most common income bracket and makes up 49.5% of all families.
| Income Bracket | # Families | % Families |
| Less than $10,000 | 0 | 0.0% |
| $10,000 to $14,999 | 0 | 0.0% |
| $15,000 to $24,999 | 0 | 0.0% |
| $25,000 to $34,999 | 0 | 0.0% |
| $35,000 to $49,999 | 12 | 11.9% |
| $50,000 to $74,999 | 39 | 38.6% |
| $75,000 to $99,999 | 0 | 0.0% |
| $100,000 to $149,999 | 0 | 0.0% |
| $150,000 to $199,999 | 0 | 0.0% |
| $200,000+ | 50 | 49.5% |
Family Income by Famaliy Size in East Dailey
| Income Bracket | # Families | Median Income |
| 2-Person Families | 0 (0.0%) | $0 |
| 3-Person Families | 50 (49.5%) | $0 |
| 4-Person Families | 40 (39.6%) | $0 |
| 5-Person Families | 11 (10.9%) | $0 |
| 6-Person Families | 0 (0.0%) | $0 |
| 7+ Person Families | 0 (0.0%) | $0 |
| Total | 101 (100.0%) | $0 |
Family Income by Number of Earners in East Dailey
| Number of Earners | # Families | Median Income |
| No Earners | 0 (0.0%) | $0 |
| 1 Earner | 40 (39.6%) | $0 |
| 2 Earners | 11 (10.9%) | $0 |
| 3+ Earners | 50 (49.5%) | $0 |
| Total | 101 (100.0%) | $0 |
Household Income in East Dailey
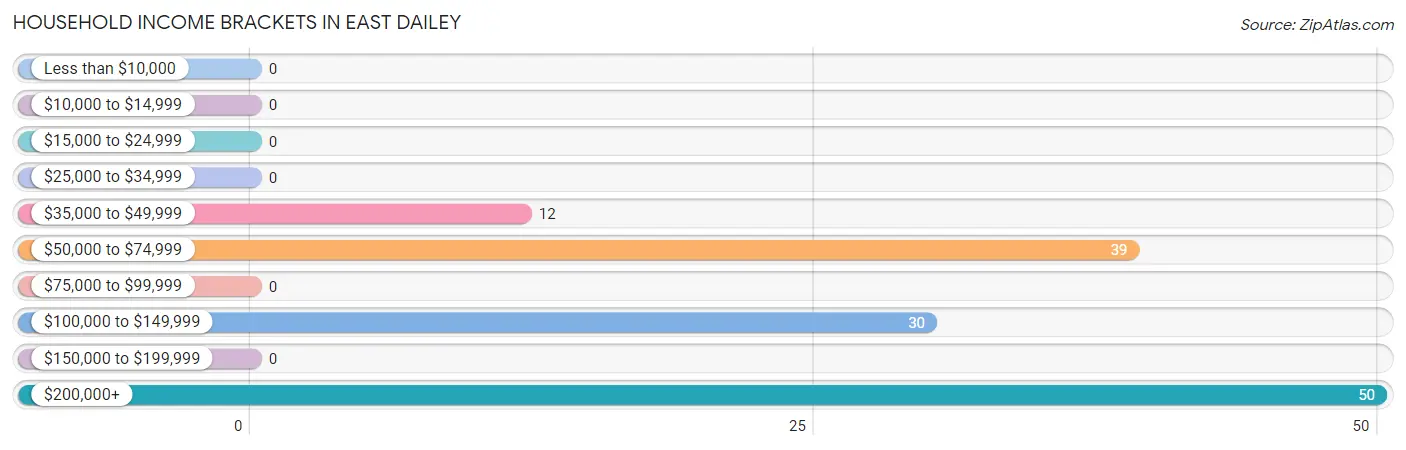
Household Income Brackets in East Dailey
With 50 households falling in the category, the $200,000+ income range is the most frequent in East Dailey, accounting for 38.2% of all households.
| Income Bracket | # Households | % Households |
| Less than $10,000 | 0 | 0.0% |
| $10,000 to $14,999 | 0 | 0.0% |
| $15,000 to $24,999 | 0 | 0.0% |
| $25,000 to $34,999 | 0 | 0.0% |
| $35,000 to $49,999 | 12 | 9.2% |
| $50,000 to $74,999 | 39 | 29.8% |
| $75,000 to $99,999 | 0 | 0.0% |
| $100,000 to $149,999 | 30 | 22.9% |
| $150,000 to $199,999 | 0 | 0.0% |
| $200,000+ | 50 | 38.2% |
Household Income by Householder Age in East Dailey
The median household income in East Dailey is $0, with the highest median household income of $101,250 found in the 45 to 64 years age bracket for the primary householder. A total of 54 households (41.2%) fall into this category.
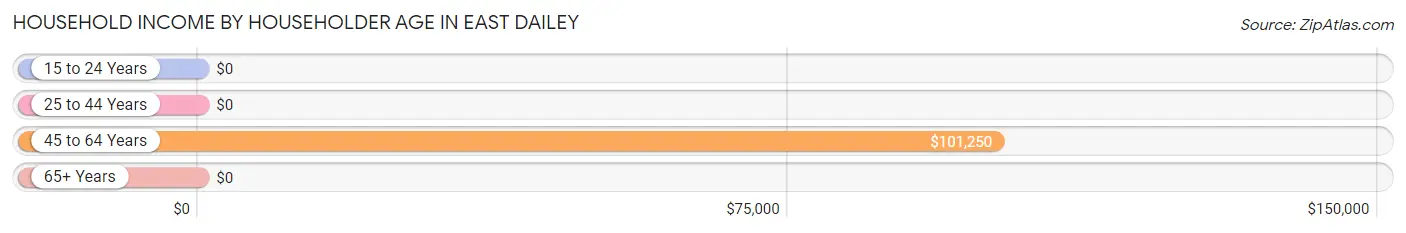
| Income Bracket | # Households | Median Income |
| 15 to 24 Years | 0 (0.0%) | $0 |
| 25 to 44 Years | 39 (29.8%) | $0 |
| 45 to 64 Years | 54 (41.2%) | $101,250 |
| 65+ Years | 38 (29.0%) | $0 |
| Total | 131 (100.0%) | $0 |
Poverty in East Dailey
Income Below Poverty by Sex and Age in East Dailey
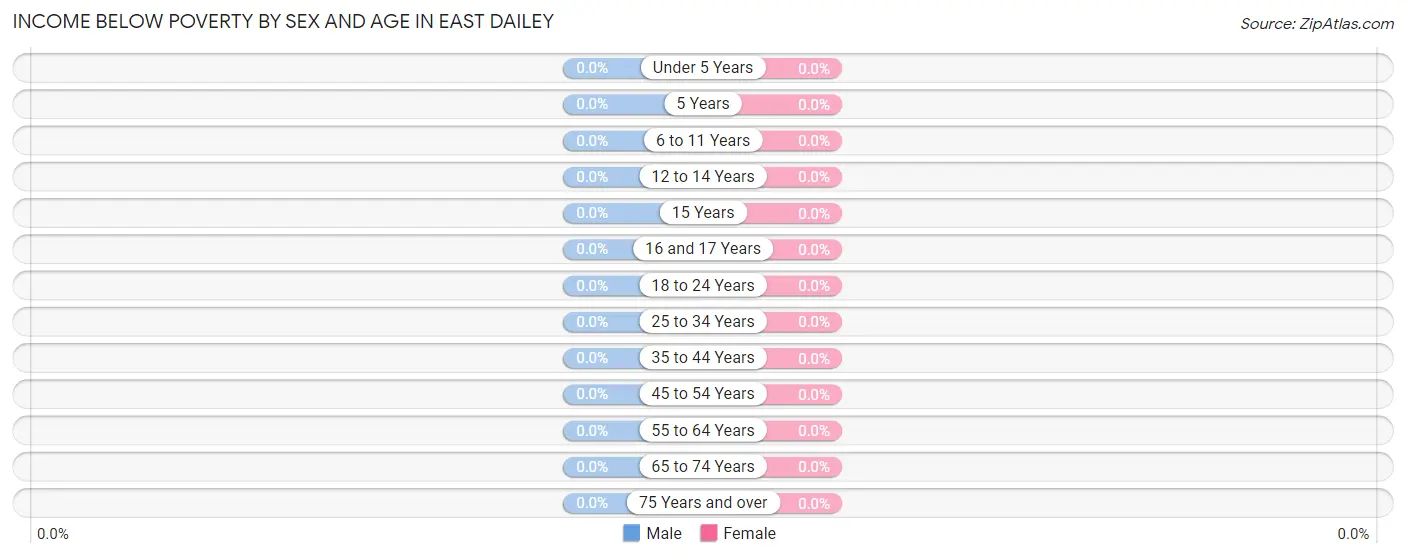
| Age Bracket | Male | Female |
| Under 5 Years | 0 (0.0%) | 0 (0.0%) |
| 5 Years | 0 (0.0%) | 0 (0.0%) |
| 6 to 11 Years | 0 (0.0%) | 0 (0.0%) |
| 12 to 14 Years | 0 (0.0%) | 0 (0.0%) |
| 15 Years | 0 (0.0%) | 0 (0.0%) |
| 16 and 17 Years | 0 (0.0%) | 0 (0.0%) |
| 18 to 24 Years | 0 (0.0%) | 0 (0.0%) |
| 25 to 34 Years | 0 (0.0%) | 0 (0.0%) |
| 35 to 44 Years | 0 (0.0%) | 0 (0.0%) |
| 45 to 54 Years | 0 (0.0%) | 0 (0.0%) |
| 55 to 64 Years | 0 (0.0%) | 0 (0.0%) |
| 65 to 74 Years | 0 (0.0%) | 0 (0.0%) |
| 75 Years and over | 0 (0.0%) | 0 (0.0%) |
| Total | 0 (0.0%) | 0 (0.0%) |
Income Above Poverty by Sex and Age in East Dailey
According to the poverty statistics in East Dailey, males aged under 5 years and females aged under 5 years are the age groups that are most secure financially, with 100.0% of males and 100.0% of females in these age groups living above the poverty line.
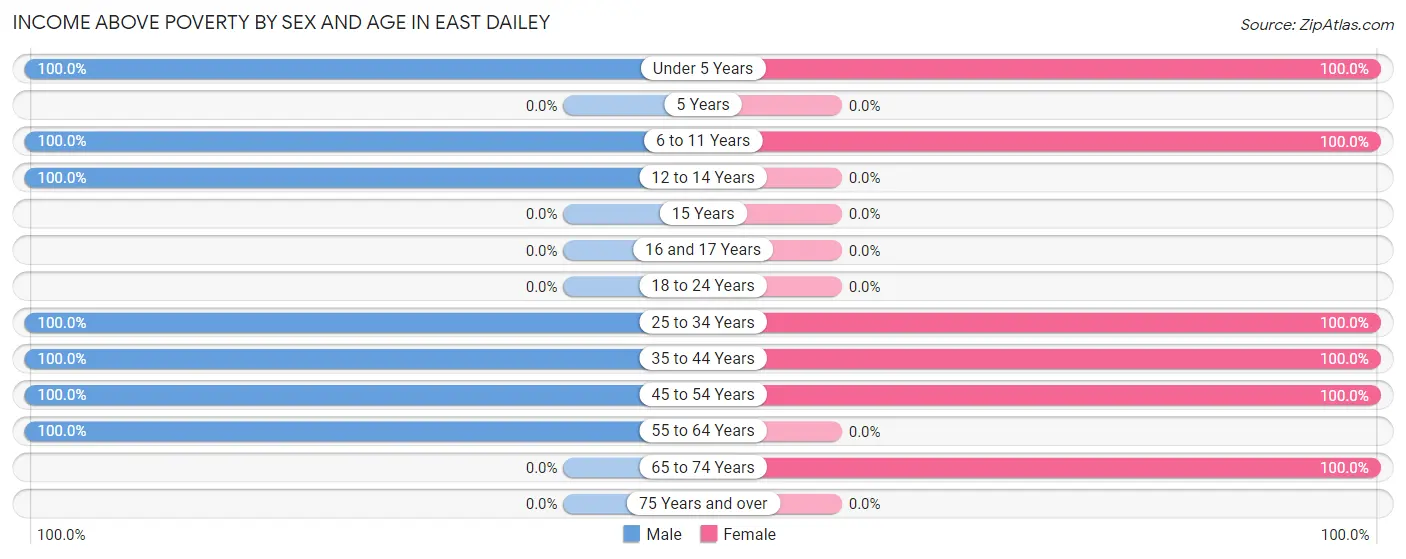
| Age Bracket | Male | Female |
| Under 5 Years | 15 (100.0%) | 10 (100.0%) |
| 5 Years | 0 (0.0%) | 0 (0.0%) |
| 6 to 11 Years | 38 (100.0%) | 37 (100.0%) |
| 12 to 14 Years | 12 (100.0%) | 0 (0.0%) |
| 15 Years | 0 (0.0%) | 0 (0.0%) |
| 16 and 17 Years | 0 (0.0%) | 0 (0.0%) |
| 18 to 24 Years | 0 (0.0%) | 0 (0.0%) |
| 25 to 34 Years | 53 (100.0%) | 48 (100.0%) |
| 35 to 44 Years | 68 (100.0%) | 10 (100.0%) |
| 45 to 54 Years | 55 (100.0%) | 14 (100.0%) |
| 55 to 64 Years | 30 (100.0%) | 0 (0.0%) |
| 65 to 74 Years | 0 (0.0%) | 38 (100.0%) |
| 75 Years and over | 0 (0.0%) | 0 (0.0%) |
| Total | 271 (100.0%) | 157 (100.0%) |
Income Below Poverty Among Married-Couple Families in East Dailey
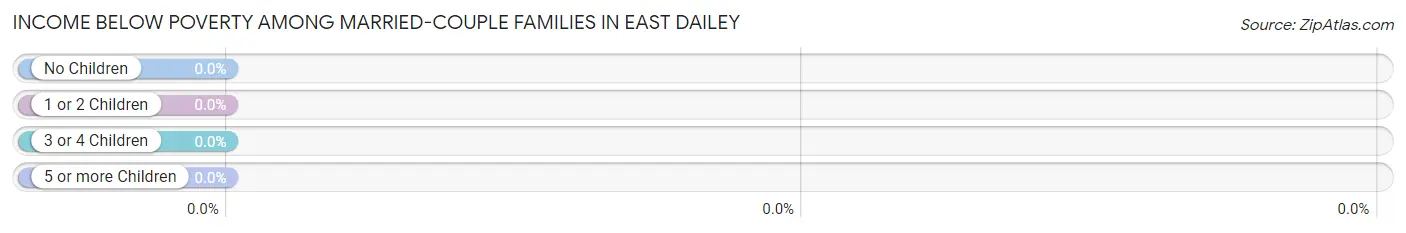
| Children | Above Poverty | Below Poverty |
| No Children | 50 (100.0%) | 0 (0.0%) |
| 1 or 2 Children | 40 (100.0%) | 0 (0.0%) |
| 3 or 4 Children | 11 (100.0%) | 0 (0.0%) |
| 5 or more Children | 0 (0.0%) | 0 (0.0%) |
| Total | 101 (100.0%) | 0 (0.0%) |
Income Below Poverty Among Single-Parent Households in East Dailey
| Children | Single Father | Single Mother |
| No Children | 0 (0.0%) | 0 (0.0%) |
| 1 or 2 Children | 0 (0.0%) | 0 (0.0%) |
| 3 or 4 Children | 0 (0.0%) | 0 (0.0%) |
| 5 or more Children | 0 (0.0%) | 0 (0.0%) |
| Total | 0 (0.0%) | 0 (0.0%) |
Income Below Poverty Among Married-Couple vs Single-Parent Households in East Dailey
| Children | Married-Couple Families | Single-Parent Households |
| No Children | 0 (0.0%) | 0 (0.0%) |
| 1 or 2 Children | 0 (0.0%) | 0 (0.0%) |
| 3 or 4 Children | 0 (0.0%) | 0 (0.0%) |
| 5 or more Children | 0 (0.0%) | 0 (0.0%) |
| Total | 0 (0.0%) | 0 (0.0%) |
Race in East Dailey
The most populous races in East Dailey are , and White / Caucasian (428 | 100.0%).
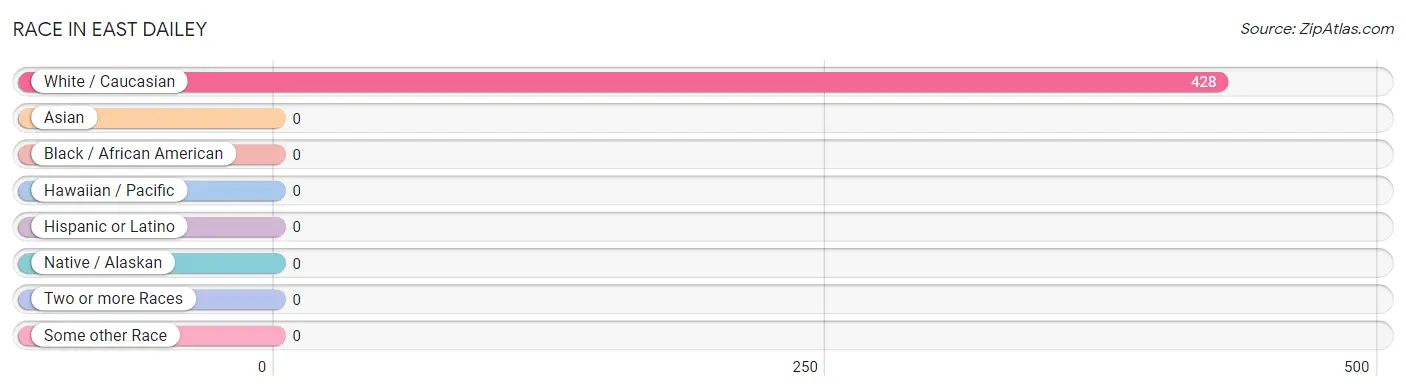
| Race | # Population | % Population |
| Asian | 0 | 0.0% |
| Black / African American | 0 | 0.0% |
| Hawaiian / Pacific | 0 | 0.0% |
| Hispanic or Latino | 0 | 0.0% |
| Native / Alaskan | 0 | 0.0% |
| White / Caucasian | 428 | 100.0% |
| Two or more Races | 0 | 0.0% |
| Some other Race | 0 | 0.0% |
| Total | 428 | 100.0% |
Ancestry in East Dailey
The most populous ancestries reported in East Dailey are Irish (162 | 37.9%), English (64 | 14.9%), American (34 | 7.9%), British (12 | 2.8%), and French (12 | 2.8%), together accounting for 66.3% of all East Dailey residents.
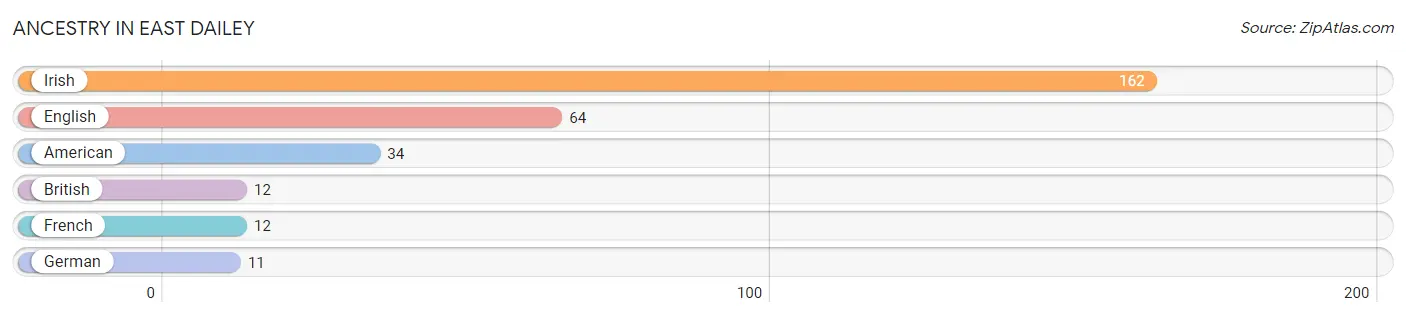
| Ancestry | # Population | % Population |
| American | 34 | 7.9% |
| British | 12 | 2.8% |
| English | 64 | 14.9% |
| French | 12 | 2.8% |
| German | 11 | 2.6% |
| Irish | 162 | 37.9% | View All 6 Rows |
Immigrants in East Dailey

| Immigration Origin | # Population | % Population | View All 0 Rows |
Sex and Age in East Dailey
Sex and Age in East Dailey
The most populous age groups in East Dailey are 35 to 39 Years (68 | 25.1%) for men and 25 to 29 Years (48 | 30.6%) for women.
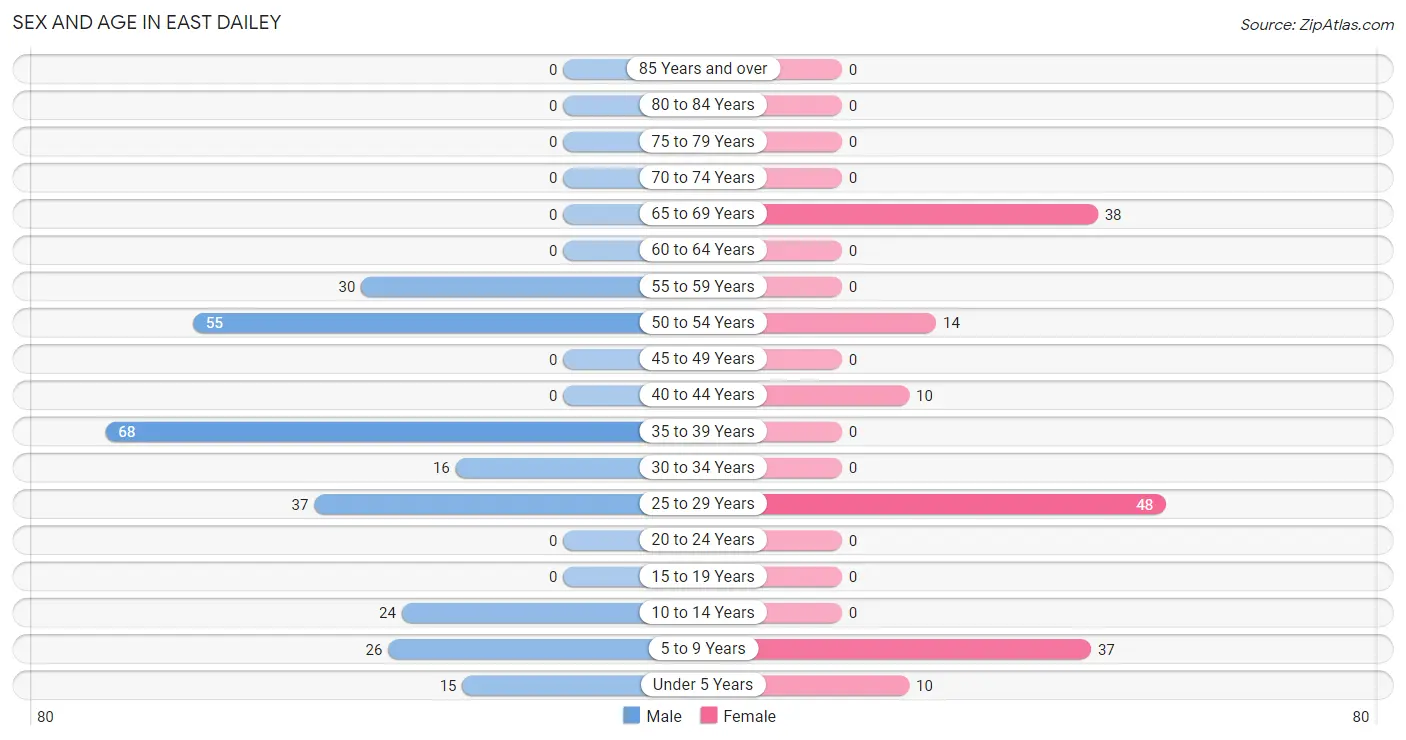
| Age Bracket | Male | Female |
| Under 5 Years | 15 (5.5%) | 10 (6.4%) |
| 5 to 9 Years | 26 (9.6%) | 37 (23.6%) |
| 10 to 14 Years | 24 (8.9%) | 0 (0.0%) |
| 15 to 19 Years | 0 (0.0%) | 0 (0.0%) |
| 20 to 24 Years | 0 (0.0%) | 0 (0.0%) |
| 25 to 29 Years | 37 (13.7%) | 48 (30.6%) |
| 30 to 34 Years | 16 (5.9%) | 0 (0.0%) |
| 35 to 39 Years | 68 (25.1%) | 0 (0.0%) |
| 40 to 44 Years | 0 (0.0%) | 10 (6.4%) |
| 45 to 49 Years | 0 (0.0%) | 0 (0.0%) |
| 50 to 54 Years | 55 (20.3%) | 14 (8.9%) |
| 55 to 59 Years | 30 (11.1%) | 0 (0.0%) |
| 60 to 64 Years | 0 (0.0%) | 0 (0.0%) |
| 65 to 69 Years | 0 (0.0%) | 38 (24.2%) |
| 70 to 74 Years | 0 (0.0%) | 0 (0.0%) |
| 75 to 79 Years | 0 (0.0%) | 0 (0.0%) |
| 80 to 84 Years | 0 (0.0%) | 0 (0.0%) |
| 85 Years and over | 0 (0.0%) | 0 (0.0%) |
| Total | 271 (100.0%) | 157 (100.0%) |
Families and Households in East Dailey
Median Family Size in East Dailey
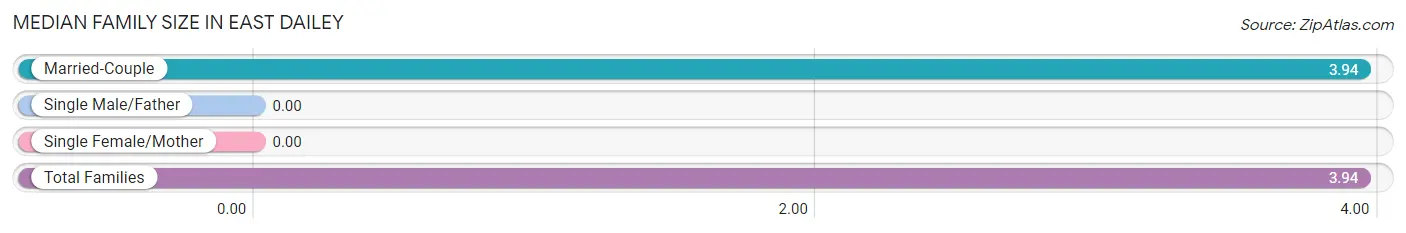
| Family Type | # Families | Family Size |
| Married-Couple | 101 (100.0%) | 3.94 |
| Single Male/Father | 0 (0.0%) | - |
| Single Female/Mother | 0 (0.0%) | - |
| Total Families | 101 (100.0%) | 3.94 |
Median Household Size in East Dailey
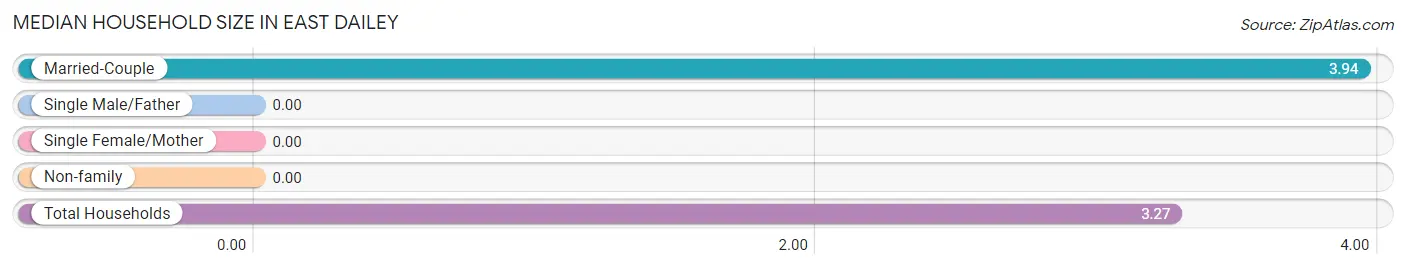
| Household Type | # Households | Household Size |
| Married-Couple | 101 (77.1%) | 3.94 |
| Single Male/Father | 0 (0.0%) | - |
| Single Female/Mother | 0 (0.0%) | - |
| Non-family | 30 (22.9%) | - |
| Total Households | 131 (100.0%) | 3.27 |
Household Size by Marriage Status in East Dailey
Out of a total of 131 households in East Dailey, 101 (77.1%) are family households, while 30 (22.9%) are nonfamily households. The most numerous type of family households are 3-person households, comprising 50, and the most common type of nonfamily households are 1-person households, comprising 30.
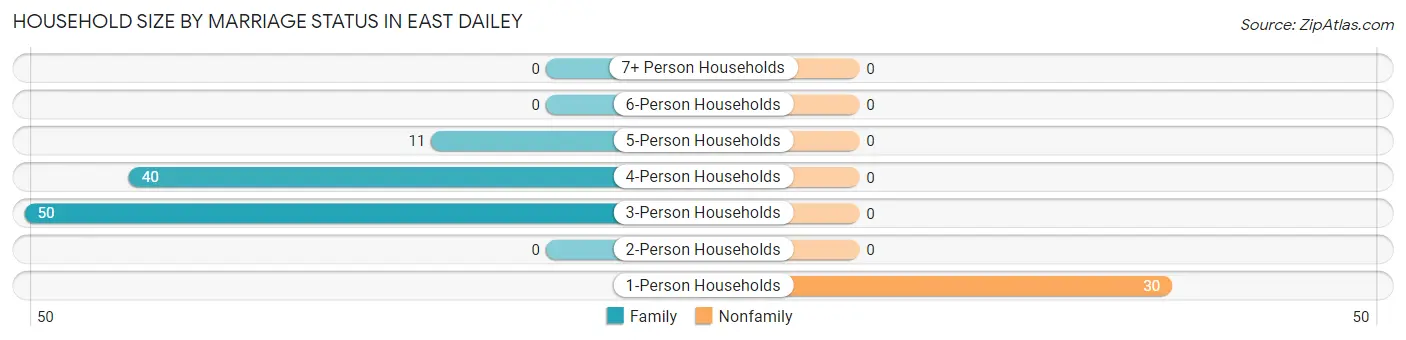
| Household Size | Family Households | Nonfamily Households |
| 1-Person Households | - | 30 (22.9%) |
| 2-Person Households | 0 (0.0%) | 0 (0.0%) |
| 3-Person Households | 50 (38.2%) | 0 (0.0%) |
| 4-Person Households | 40 (30.5%) | 0 (0.0%) |
| 5-Person Households | 11 (8.4%) | 0 (0.0%) |
| 6-Person Households | 0 (0.0%) | 0 (0.0%) |
| 7+ Person Households | 0 (0.0%) | 0 (0.0%) |
| Total | 101 (77.1%) | 30 (22.9%) |
Female Fertility in East Dailey
Fertility by Age in East Dailey
Average fertility rate in East Dailey is 172.0 births per 1,000 women. Women in the age bracket of 35 to 50 years have the highest fertility rate with 1,000.0 births per 1,000 women. Women in the age bracket of 35 to 50 years acount for 100.0% of all women with births.

| Age Bracket | Women with Births | Births / 1,000 Women |
| 15 to 19 years | 0 (0.0%) | 0.0 |
| 20 to 34 years | 0 (0.0%) | 0.0 |
| 35 to 50 years | 10 (100.0%) | 1,000.0 |
| Total | 10 (100.0%) | 172.0 |
Fertility by Age by Marriage Status in East Dailey
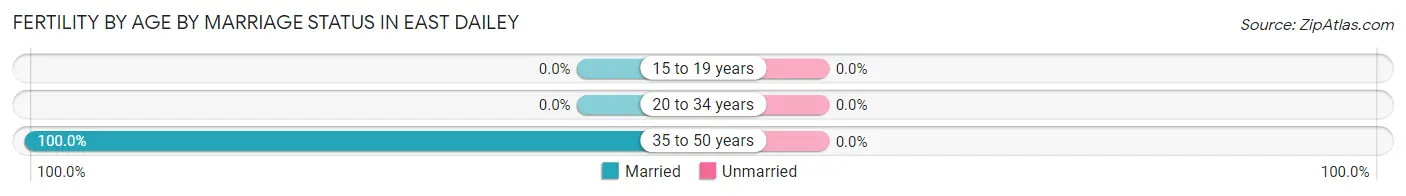
| Age Bracket | Married | Unmarried |
| 15 to 19 years | 0 (0.0%) | 0 (0.0%) |
| 20 to 34 years | 0 (0.0%) | 0 (0.0%) |
| 35 to 50 years | 10 (100.0%) | 0 (0.0%) |
| Total | 10 (100.0%) | 0 (0.0%) |
Fertility by Education in East Dailey
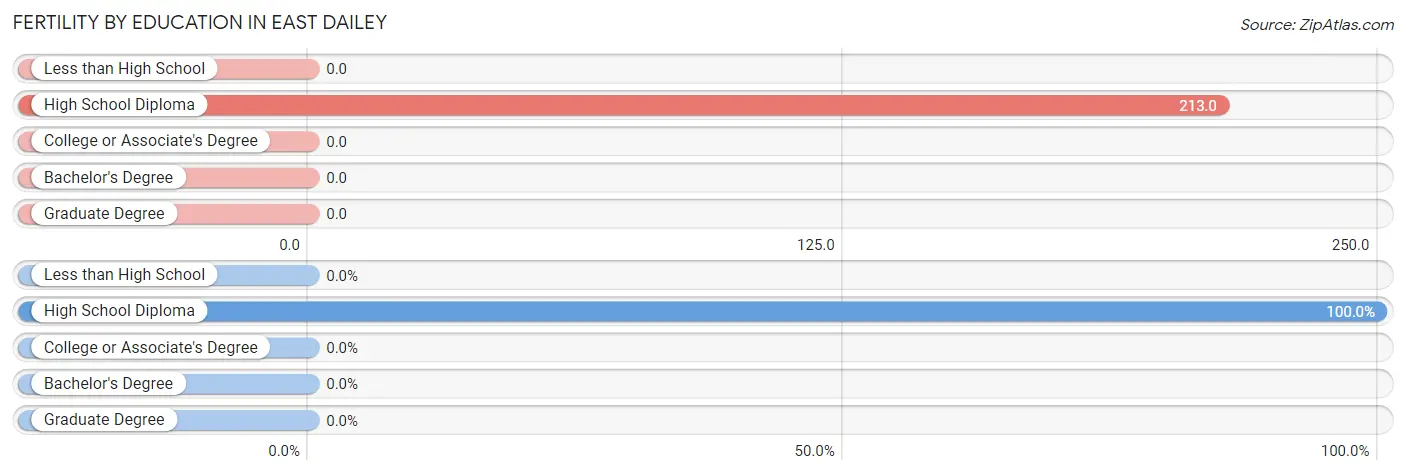
| Educational Attainment | Women with Births | Births / 1,000 Women |
| Less than High School | 0 (0.0%) | 0.0 |
| High School Diploma | 10 (100.0%) | 213.0 |
| College or Associate's Degree | 0 (0.0%) | 0.0 |
| Bachelor's Degree | 0 (0.0%) | 0.0 |
| Graduate Degree | 0 (0.0%) | 0.0 |
| Total | 10 (100.0%) | 172.0 |
Fertility by Education by Marriage Status in East Dailey

| Educational Attainment | Married | Unmarried |
| Less than High School | 0 (0.0%) | 0 (0.0%) |
| High School Diploma | 10 (100.0%) | 0 (0.0%) |
| College or Associate's Degree | 0 (0.0%) | 0 (0.0%) |
| Bachelor's Degree | 0 (0.0%) | 0 (0.0%) |
| Graduate Degree | 0 (0.0%) | 0 (0.0%) |
| Total | 10 (100.0%) | 0 (0.0%) |
Employment Characteristics in East Dailey
Employment by Class of Employer in East Dailey
Among the 269 employed individuals in East Dailey, not-for-profit organizations (110 | 40.9%), state government employees (81 | 30.1%), and private company employees (37 | 13.8%) make up the most common classes of employment.
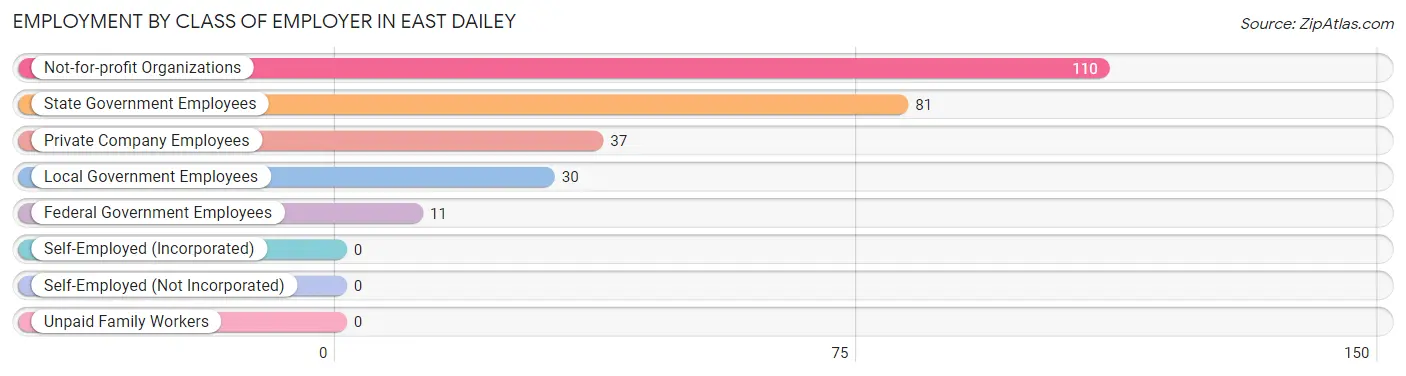
| Employer Class | # Employees | % Employees |
| Private Company Employees | 37 | 13.8% |
| Self-Employed (Incorporated) | 0 | 0.0% |
| Self-Employed (Not Incorporated) | 0 | 0.0% |
| Not-for-profit Organizations | 110 | 40.9% |
| Local Government Employees | 30 | 11.2% |
| State Government Employees | 81 | 30.1% |
| Federal Government Employees | 11 | 4.1% |
| Unpaid Family Workers | 0 | 0.0% |
| Total | 269 | 100.0% |
Employment Status by Age in East Dailey
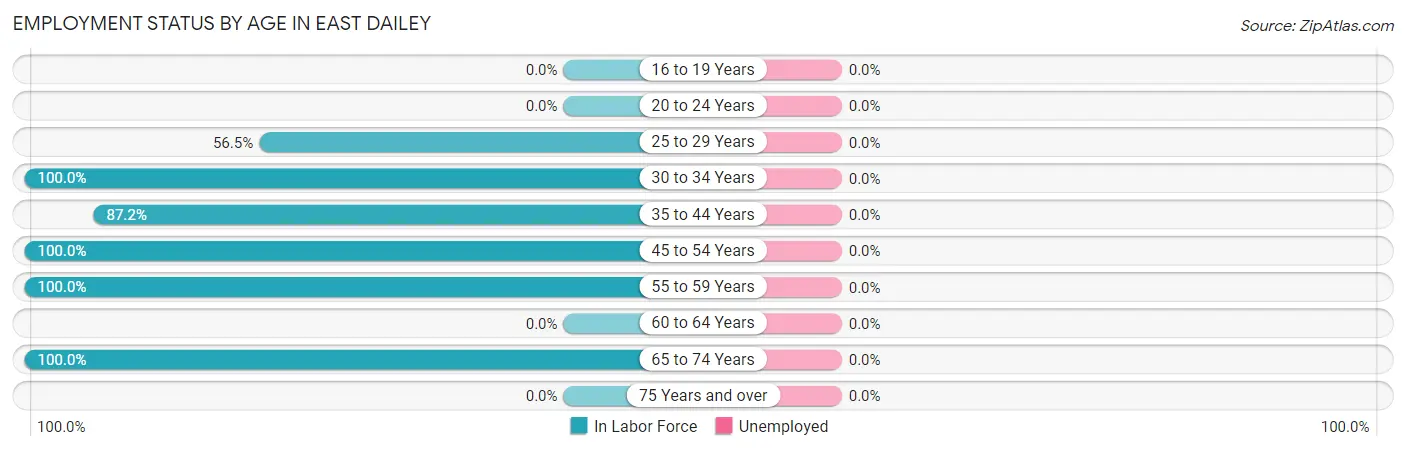
| Age Bracket | In Labor Force | Unemployed |
| 16 to 19 Years | 0 (0.0%) | 0 (0.0%) |
| 20 to 24 Years | 0 (0.0%) | 0 (0.0%) |
| 25 to 29 Years | 48 (56.5%) | 0 (0.0%) |
| 30 to 34 Years | 16 (100.0%) | 0 (0.0%) |
| 35 to 44 Years | 68 (87.2%) | 0 (0.0%) |
| 45 to 54 Years | 69 (100.0%) | 0 (0.0%) |
| 55 to 59 Years | 30 (100.0%) | 0 (0.0%) |
| 60 to 64 Years | 0 (0.0%) | 0 (0.0%) |
| 65 to 74 Years | 38 (100.0%) | 0 (0.0%) |
| 75 Years and over | 0 (0.0%) | 0 (0.0%) |
| Total | 269 (85.1%) | 0 (0.0%) |
Employment Status by Educational Attainment in East Dailey
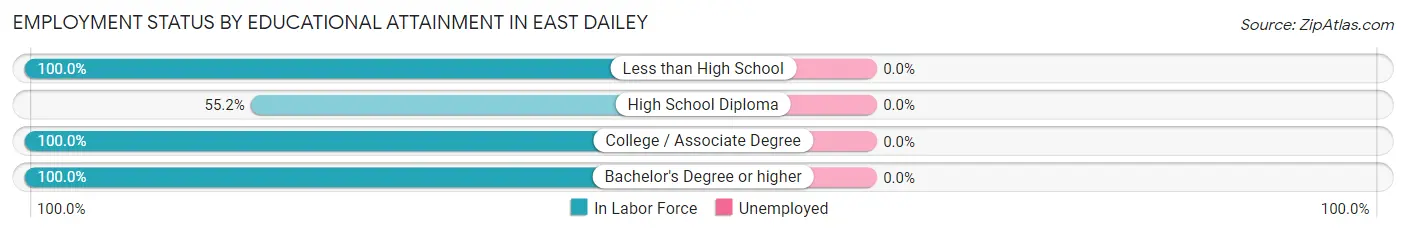
| Educational Attainment | In Labor Force | Unemployed |
| Less than High School | 12 (100.0%) | 0 (0.0%) |
| High School Diploma | 58 (55.2%) | 0 (0.0%) |
| College / Associate Degree | 20 (100.0%) | 0 (0.0%) |
| Bachelor's Degree or higher | 141 (100.0%) | 0 (0.0%) |
| Total | 231 (83.1%) | 0 (0.0%) |
Employment Occupations by Sex in East Dailey
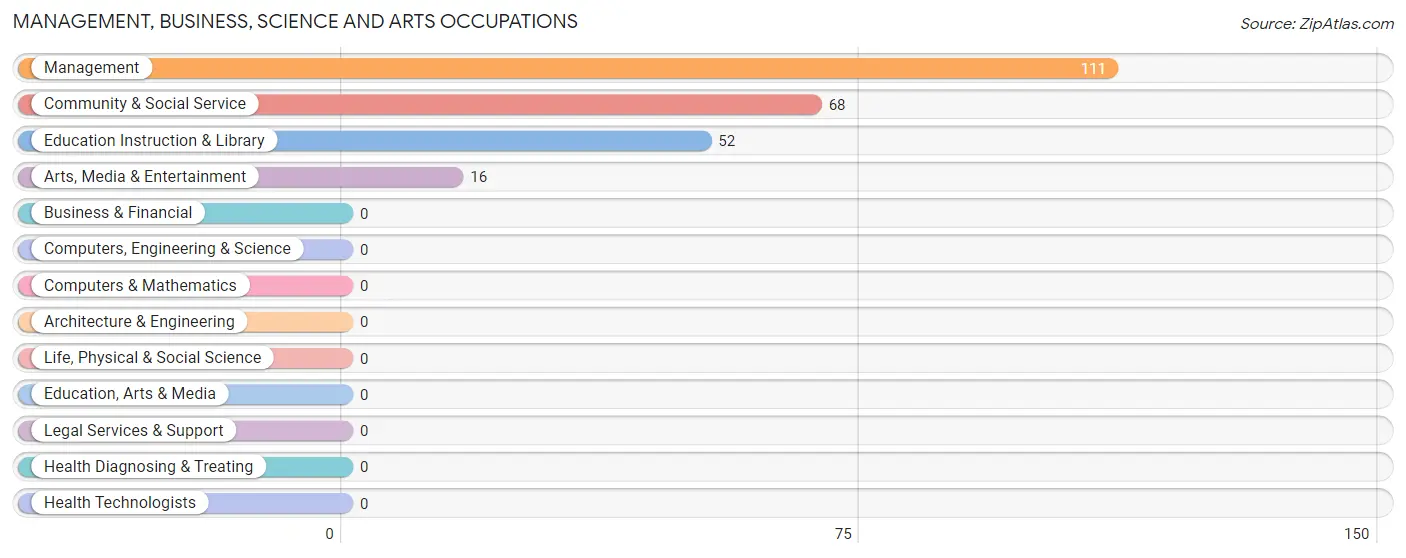
Management, Business, Science and Arts Occupations
The most common Management, Business, Science and Arts occupations in East Dailey are Management (111 | 41.3%), Community & Social Service (68 | 25.3%), Education Instruction & Library (52 | 19.3%), and Arts, Media & Entertainment (16 | 5.9%).
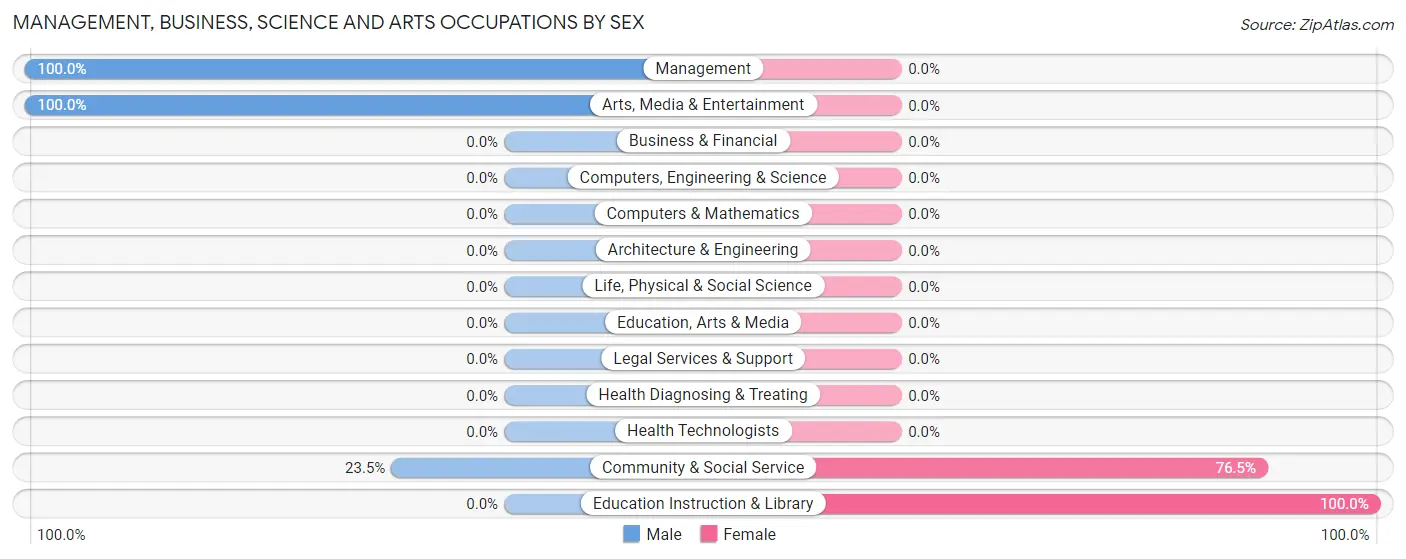
Management, Business, Science and Arts Occupations by Sex
Within the Management, Business, Science and Arts occupations in East Dailey, the most male-oriented occupations are Management (100.0%), Arts, Media & Entertainment (100.0%), and Community & Social Service (23.5%), while the most female-oriented occupations are Education Instruction & Library (100.0%), and Community & Social Service (76.5%).
| Occupation | Male | Female |
| Management | 111 (100.0%) | 0 (0.0%) |
| Business & Financial | 0 (0.0%) | 0 (0.0%) |
| Computers, Engineering & Science | 0 (0.0%) | 0 (0.0%) |
| Computers & Mathematics | 0 (0.0%) | 0 (0.0%) |
| Architecture & Engineering | 0 (0.0%) | 0 (0.0%) |
| Life, Physical & Social Science | 0 (0.0%) | 0 (0.0%) |
| Community & Social Service | 16 (23.5%) | 52 (76.5%) |
| Education, Arts & Media | 0 (0.0%) | 0 (0.0%) |
| Legal Services & Support | 0 (0.0%) | 0 (0.0%) |
| Education Instruction & Library | 0 (0.0%) | 52 (100.0%) |
| Arts, Media & Entertainment | 16 (100.0%) | 0 (0.0%) |
| Health Diagnosing & Treating | 0 (0.0%) | 0 (0.0%) |
| Health Technologists | 0 (0.0%) | 0 (0.0%) |
| Total (Category) | 127 (71.0%) | 52 (29.0%) |
| Total (Overall) | 206 (76.6%) | 63 (23.4%) |
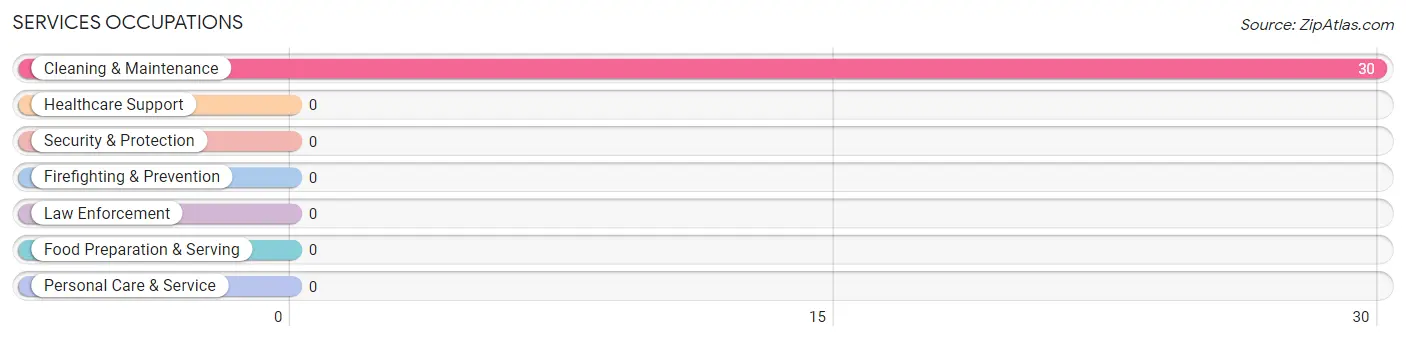
Services Occupations
The most common Services occupations in East Dailey are , and Cleaning & Maintenance (30 | 11.2%).
Services Occupations by Sex
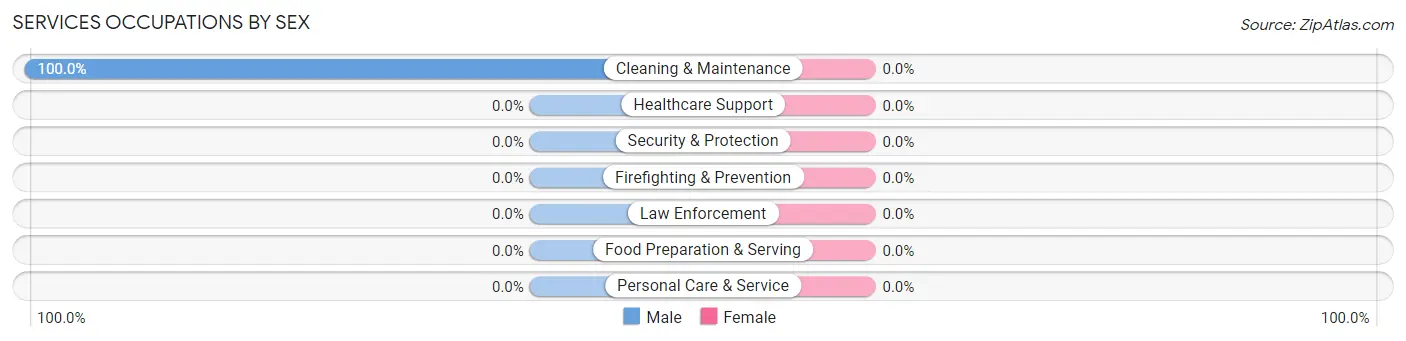
| Occupation | Male | Female |
| Healthcare Support | 0 (0.0%) | 0 (0.0%) |
| Security & Protection | 0 (0.0%) | 0 (0.0%) |
| Firefighting & Prevention | 0 (0.0%) | 0 (0.0%) |
| Law Enforcement | 0 (0.0%) | 0 (0.0%) |
| Food Preparation & Serving | 0 (0.0%) | 0 (0.0%) |
| Cleaning & Maintenance | 30 (100.0%) | 0 (0.0%) |
| Personal Care & Service | 0 (0.0%) | 0 (0.0%) |
| Total (Category) | 30 (100.0%) | 0 (0.0%) |
| Total (Overall) | 206 (76.6%) | 63 (23.4%) |
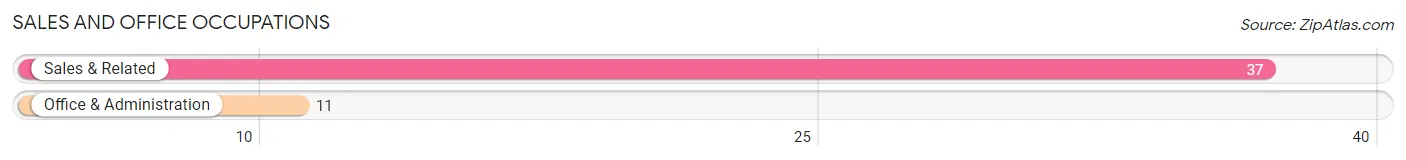
Sales and Office Occupations
The most common Sales and Office occupations in East Dailey are Sales & Related (37 | 13.8%), and Office & Administration (11 | 4.1%).
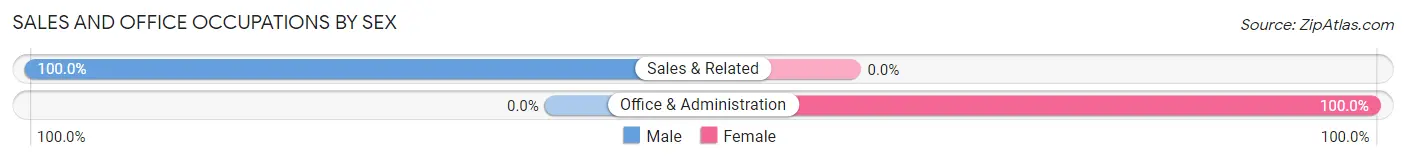
Sales and Office Occupations by Sex
| Occupation | Male | Female |
| Sales & Related | 37 (100.0%) | 0 (0.0%) |
| Office & Administration | 0 (0.0%) | 11 (100.0%) |
| Total (Category) | 37 (77.1%) | 11 (22.9%) |
| Total (Overall) | 206 (76.6%) | 63 (23.4%) |
Natural Resources, Construction and Maintenance Occupations
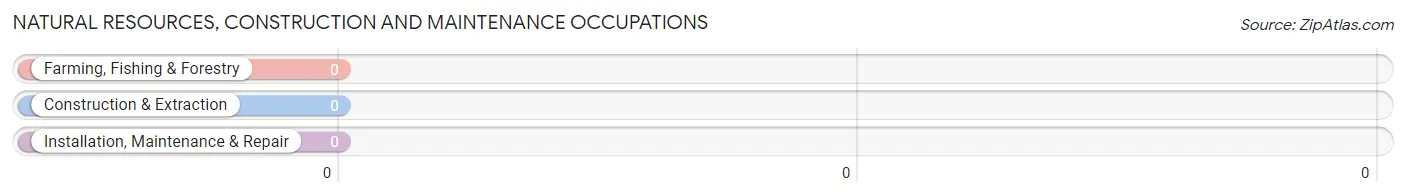
Natural Resources, Construction and Maintenance Occupations by Sex
| Occupation | Male | Female |
| Farming, Fishing & Forestry | 0 (0.0%) | 0 (0.0%) |
| Construction & Extraction | 0 (0.0%) | 0 (0.0%) |
| Installation, Maintenance & Repair | 0 (0.0%) | 0 (0.0%) |
| Total (Category) | 0 (0.0%) | 0 (0.0%) |
| Total (Overall) | 206 (76.6%) | 63 (23.4%) |
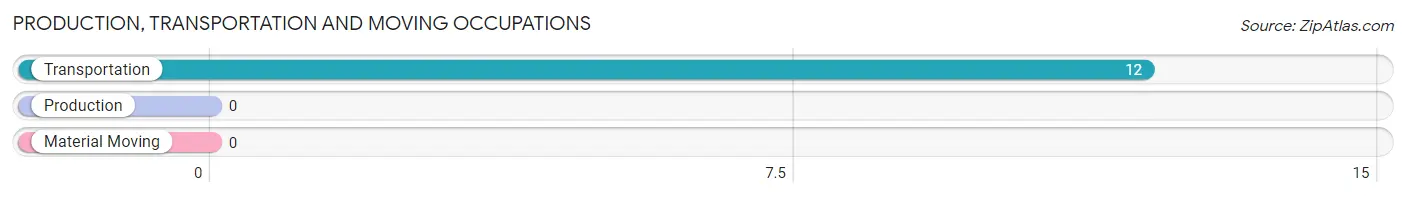
Production, Transportation and Moving Occupations
The most common Production, Transportation and Moving occupations in East Dailey are , and Transportation (12 | 4.5%).
Production, Transportation and Moving Occupations by Sex
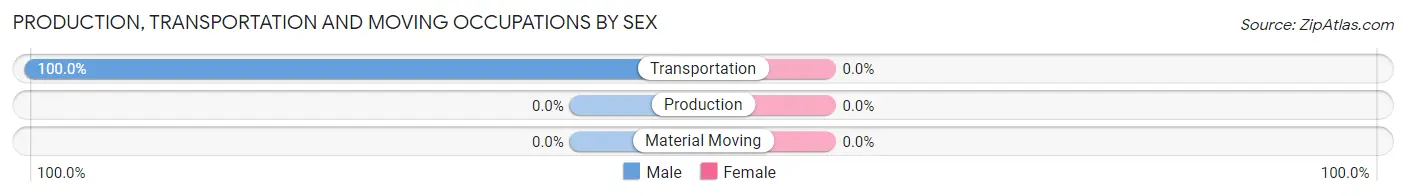
| Occupation | Male | Female |
| Production | 0 (0.0%) | 0 (0.0%) |
| Transportation | 12 (100.0%) | 0 (0.0%) |
| Material Moving | 0 (0.0%) | 0 (0.0%) |
| Total (Category) | 12 (100.0%) | 0 (0.0%) |
| Total (Overall) | 206 (76.6%) | 63 (23.4%) |
Employment Industries by Sex in East Dailey
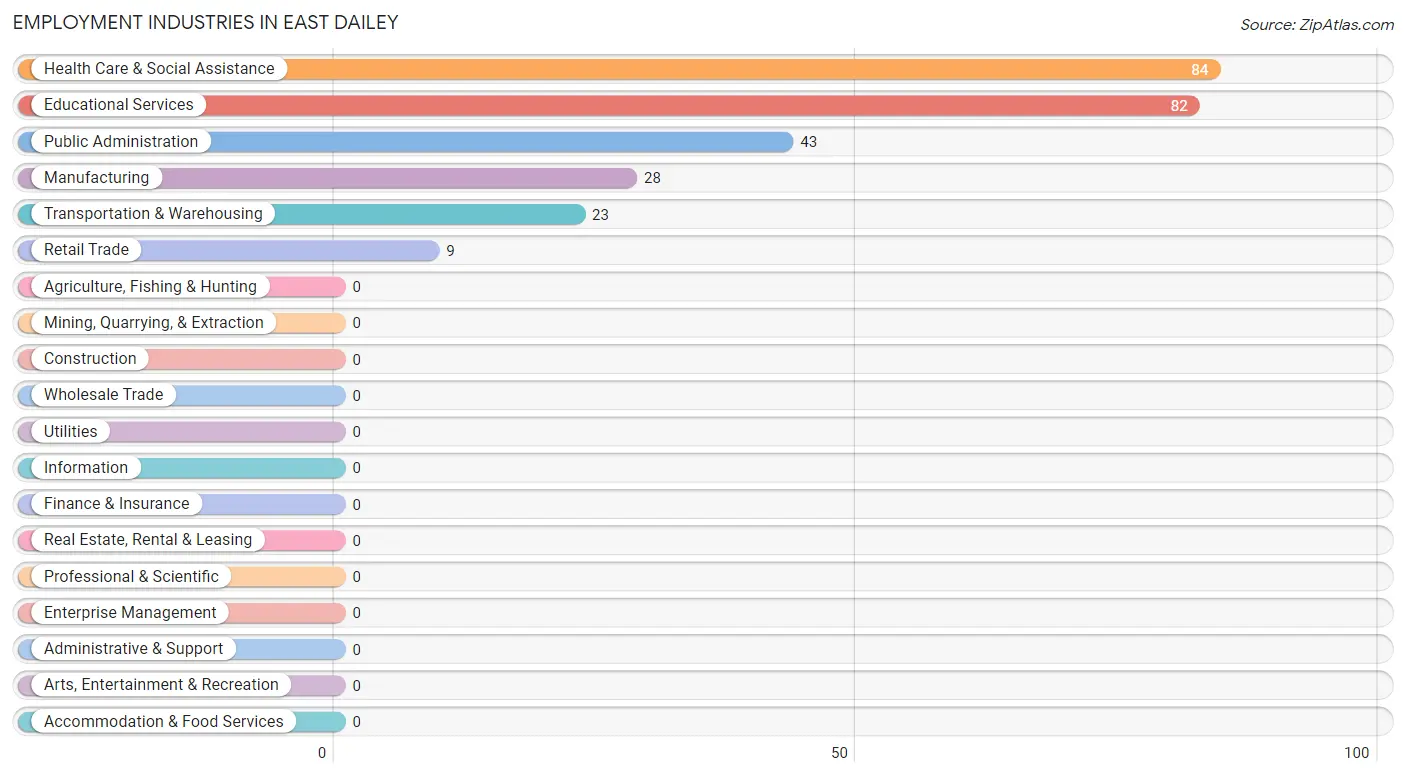
Employment Industries in East Dailey
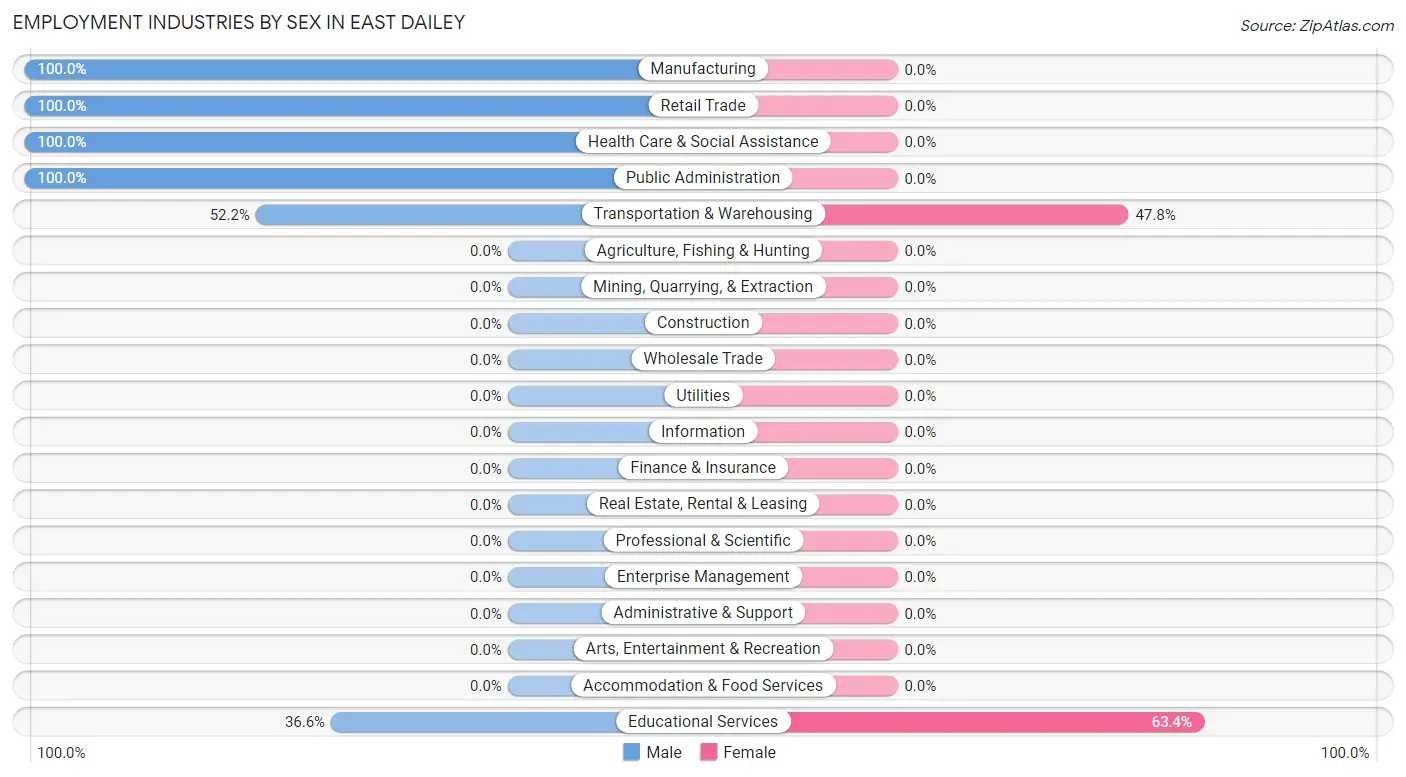
The major employment industries in East Dailey include Health Care & Social Assistance (84 | 31.2%), Educational Services (82 | 30.5%), Public Administration (43 | 16.0%), Manufacturing (28 | 10.4%), and Transportation & Warehousing (23 | 8.6%).
Employment Industries by Sex in East Dailey
The East Dailey industries that see more men than women are Manufacturing (100.0%), Retail Trade (100.0%), and Health Care & Social Assistance (100.0%), whereas the industries that tend to have a higher number of women are Educational Services (63.4%), and Transportation & Warehousing (47.8%).
| Industry | Male | Female |
| Agriculture, Fishing & Hunting | 0 (0.0%) | 0 (0.0%) |
| Mining, Quarrying, & Extraction | 0 (0.0%) | 0 (0.0%) |
| Construction | 0 (0.0%) | 0 (0.0%) |
| Manufacturing | 28 (100.0%) | 0 (0.0%) |
| Wholesale Trade | 0 (0.0%) | 0 (0.0%) |
| Retail Trade | 9 (100.0%) | 0 (0.0%) |
| Transportation & Warehousing | 12 (52.2%) | 11 (47.8%) |
| Utilities | 0 (0.0%) | 0 (0.0%) |
| Information | 0 (0.0%) | 0 (0.0%) |
| Finance & Insurance | 0 (0.0%) | 0 (0.0%) |
| Real Estate, Rental & Leasing | 0 (0.0%) | 0 (0.0%) |
| Professional & Scientific | 0 (0.0%) | 0 (0.0%) |
| Enterprise Management | 0 (0.0%) | 0 (0.0%) |
| Administrative & Support | 0 (0.0%) | 0 (0.0%) |
| Educational Services | 30 (36.6%) | 52 (63.4%) |
| Health Care & Social Assistance | 84 (100.0%) | 0 (0.0%) |
| Arts, Entertainment & Recreation | 0 (0.0%) | 0 (0.0%) |
| Accommodation & Food Services | 0 (0.0%) | 0 (0.0%) |
| Public Administration | 43 (100.0%) | 0 (0.0%) |
| Total | 206 (76.6%) | 63 (23.4%) |
Education in East Dailey
School Enrollment in East Dailey
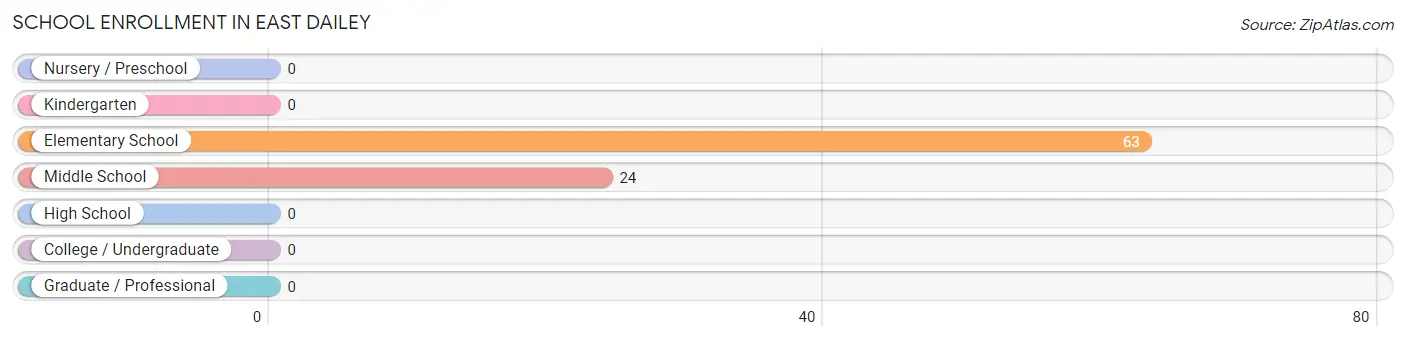
The most common levels of schooling among the 87 students in East Dailey are elementary school (63 | 72.4%), and middle school (24 | 27.6%).
| School Level | # Students | % Students |
| Nursery / Preschool | 0 | 0.0% |
| Kindergarten | 0 | 0.0% |
| Elementary School | 63 | 72.4% |
| Middle School | 24 | 27.6% |
| High School | 0 | 0.0% |
| College / Undergraduate | 0 | 0.0% |
| Graduate / Professional | 0 | 0.0% |
| Total | 87 | 100.0% |
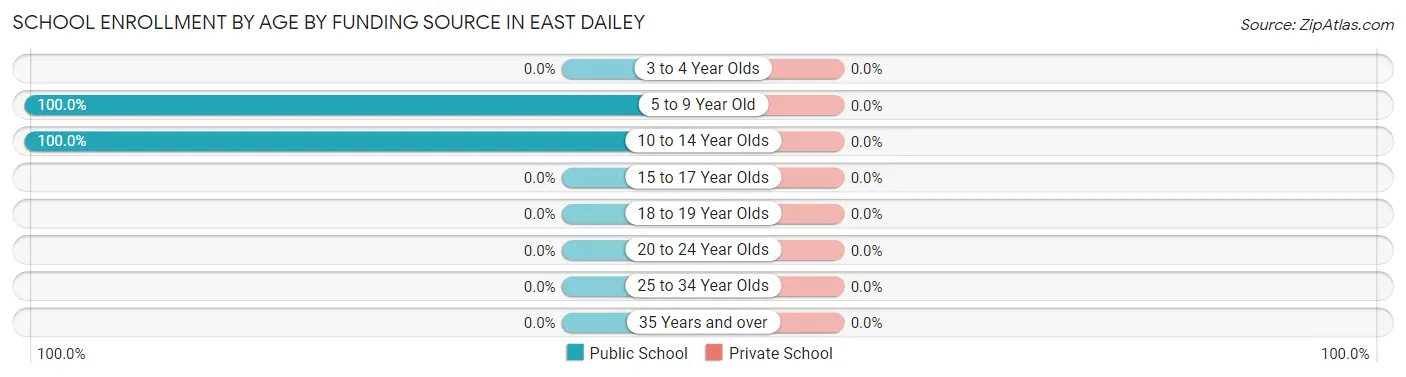
School Enrollment by Age by Funding Source in East Dailey
| Age Bracket | Public School | Private School |
| 3 to 4 Year Olds | 0 (0.0%) | 0 (0.0%) |
| 5 to 9 Year Old | 63 (100.0%) | 0 (0.0%) |
| 10 to 14 Year Olds | 24 (100.0%) | 0 (0.0%) |
| 15 to 17 Year Olds | 0 (0.0%) | 0 (0.0%) |
| 18 to 19 Year Olds | 0 (0.0%) | 0 (0.0%) |
| 20 to 24 Year Olds | 0 (0.0%) | 0 (0.0%) |
| 25 to 34 Year Olds | 0 (0.0%) | 0 (0.0%) |
| 35 Years and over | 0 (0.0%) | 0 (0.0%) |
| Total | 87 (100.0%) | 0 (0.0%) |
Educational Attainment by Field of Study in East Dailey
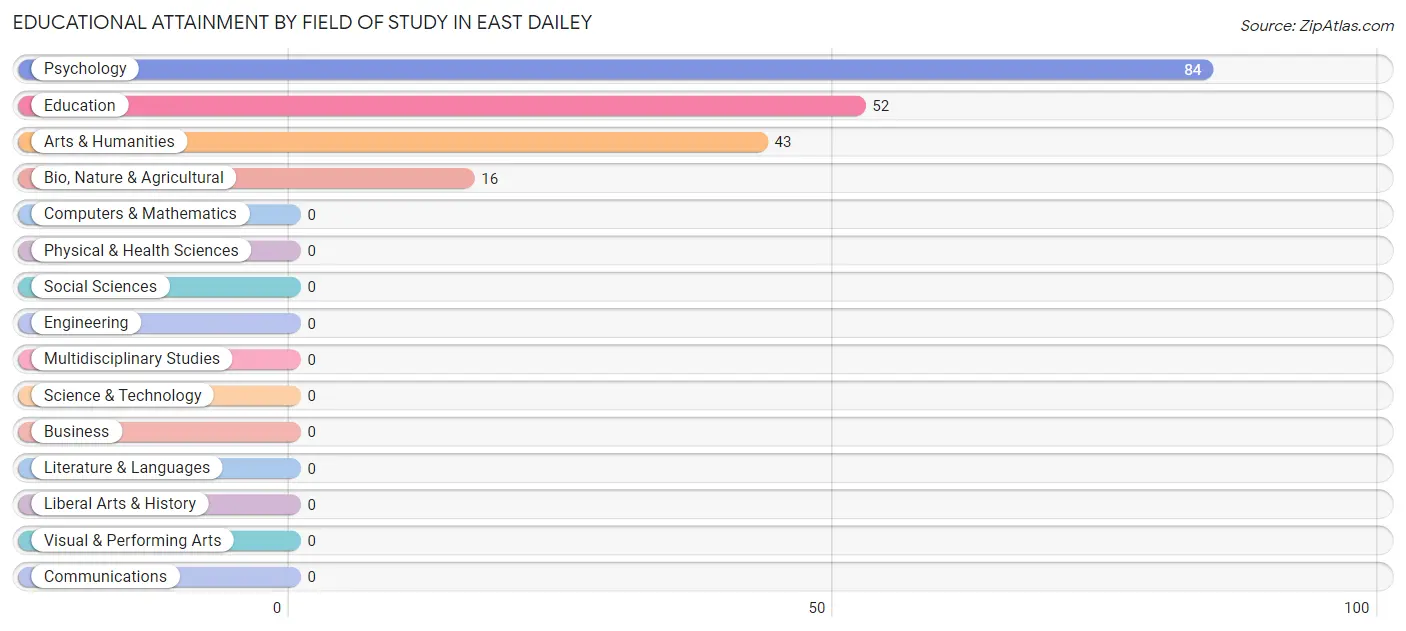
Psychology (84 | 43.1%), education (52 | 26.7%), arts & humanities (43 | 22.1%), and bio, nature & agricultural (16 | 8.2%) are the most common fields of study among 195 individuals in East Dailey who have obtained a bachelor's degree or higher.
| Field of Study | # Graduates | % Graduates |
| Computers & Mathematics | 0 | 0.0% |
| Bio, Nature & Agricultural | 16 | 8.2% |
| Physical & Health Sciences | 0 | 0.0% |
| Psychology | 84 | 43.1% |
| Social Sciences | 0 | 0.0% |
| Engineering | 0 | 0.0% |
| Multidisciplinary Studies | 0 | 0.0% |
| Science & Technology | 0 | 0.0% |
| Business | 0 | 0.0% |
| Education | 52 | 26.7% |
| Literature & Languages | 0 | 0.0% |
| Liberal Arts & History | 0 | 0.0% |
| Visual & Performing Arts | 0 | 0.0% |
| Communications | 0 | 0.0% |
| Arts & Humanities | 43 | 22.1% |
| Total | 195 | 100.0% |
Transportation & Commute in East Dailey
Vehicle Availability by Sex in East Dailey
The most prevalent vehicle ownership categories in East Dailey are males with 3 vehicles (127, accounting for 61.7%) and females with 3 vehicles (52, making up 201.6%).
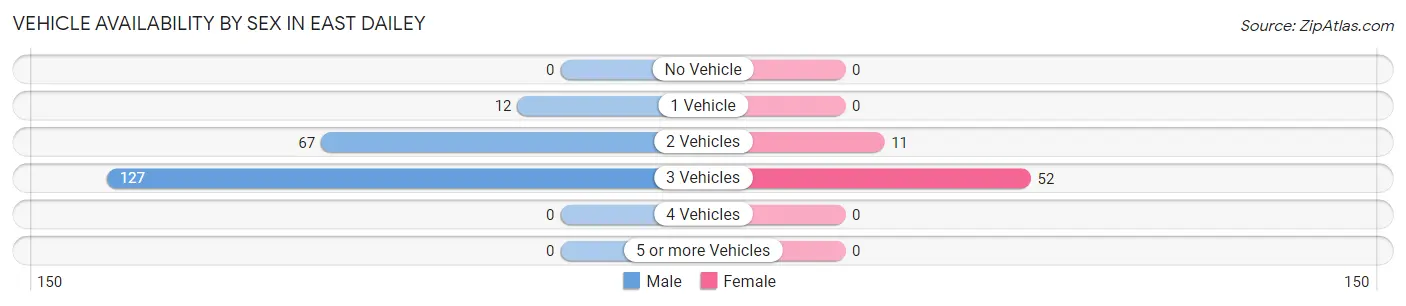
| Vehicles Available | Male | Female |
| No Vehicle | 0 (0.0%) | 0 (0.0%) |
| 1 Vehicle | 12 (5.8%) | 0 (0.0%) |
| 2 Vehicles | 67 (32.5%) | 11 (17.5%) |
| 3 Vehicles | 127 (61.7%) | 52 (82.5%) |
| 4 Vehicles | 0 (0.0%) | 0 (0.0%) |
| 5 or more Vehicles | 0 (0.0%) | 0 (0.0%) |
| Total | 206 (100.0%) | 63 (100.0%) |
Commute Time in East Dailey
The most frequently occuring commute durations in East Dailey are 15 to 19 minutes (196 commuters, 72.9%), 10 to 14 minutes (52 commuters, 19.3%), and 5 to 9 minutes (12 commuters, 4.5%).
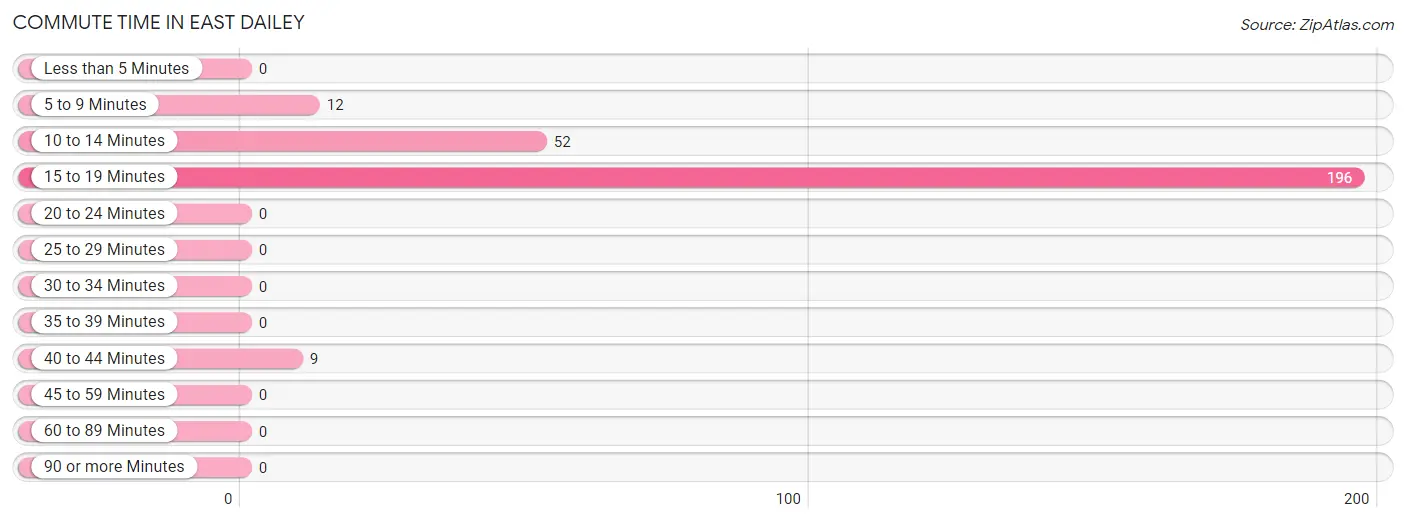
| Commute Time | # Commuters | % Commuters |
| Less than 5 Minutes | 0 | 0.0% |
| 5 to 9 Minutes | 12 | 4.5% |
| 10 to 14 Minutes | 52 | 19.3% |
| 15 to 19 Minutes | 196 | 72.9% |
| 20 to 24 Minutes | 0 | 0.0% |
| 25 to 29 Minutes | 0 | 0.0% |
| 30 to 34 Minutes | 0 | 0.0% |
| 35 to 39 Minutes | 0 | 0.0% |
| 40 to 44 Minutes | 9 | 3.4% |
| 45 to 59 Minutes | 0 | 0.0% |
| 60 to 89 Minutes | 0 | 0.0% |
| 90 or more Minutes | 0 | 0.0% |
Commute Time by Sex in East Dailey
The most common commute times in East Dailey are 15 to 19 minutes (185 commuters, 89.8%) for males and 10 to 14 minutes (52 commuters, 82.5%) for females.
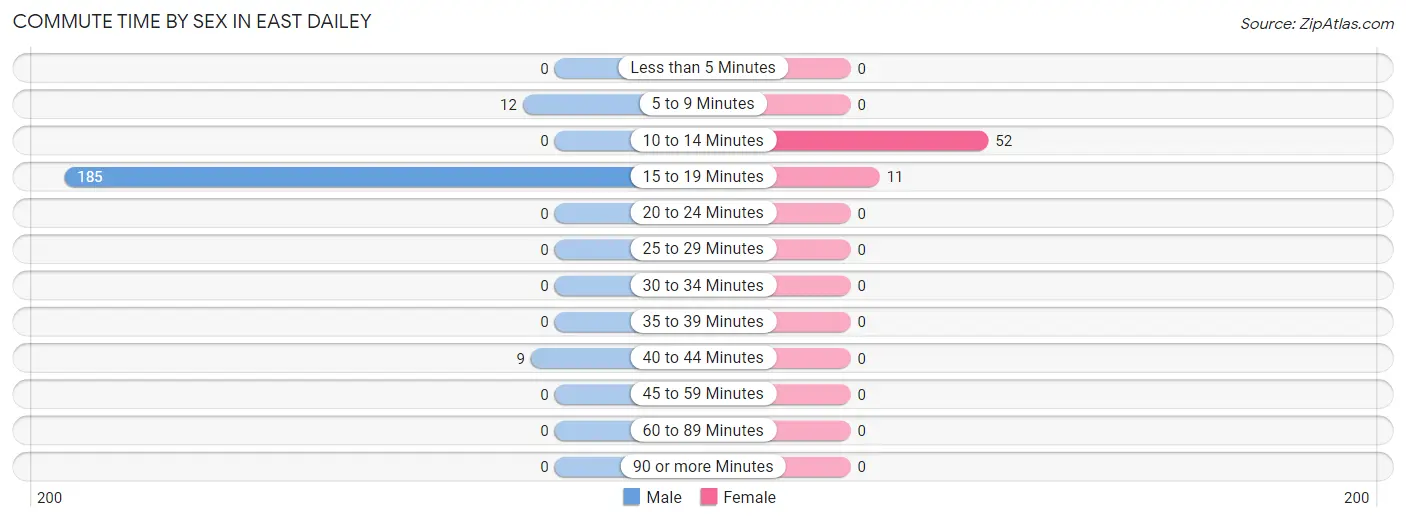
| Commute Time | Male | Female |
| Less than 5 Minutes | 0 (0.0%) | 0 (0.0%) |
| 5 to 9 Minutes | 12 (5.8%) | 0 (0.0%) |
| 10 to 14 Minutes | 0 (0.0%) | 52 (82.5%) |
| 15 to 19 Minutes | 185 (89.8%) | 11 (17.5%) |
| 20 to 24 Minutes | 0 (0.0%) | 0 (0.0%) |
| 25 to 29 Minutes | 0 (0.0%) | 0 (0.0%) |
| 30 to 34 Minutes | 0 (0.0%) | 0 (0.0%) |
| 35 to 39 Minutes | 0 (0.0%) | 0 (0.0%) |
| 40 to 44 Minutes | 9 (4.4%) | 0 (0.0%) |
| 45 to 59 Minutes | 0 (0.0%) | 0 (0.0%) |
| 60 to 89 Minutes | 0 (0.0%) | 0 (0.0%) |
| 90 or more Minutes | 0 (0.0%) | 0 (0.0%) |
Time of Departure to Work by Sex in East Dailey
The most frequent times of departure to work in East Dailey are 7:00 AM to 7:29 AM (84, 40.8%) for males and 6:30 AM to 6:59 AM (63, 100.0%) for females.
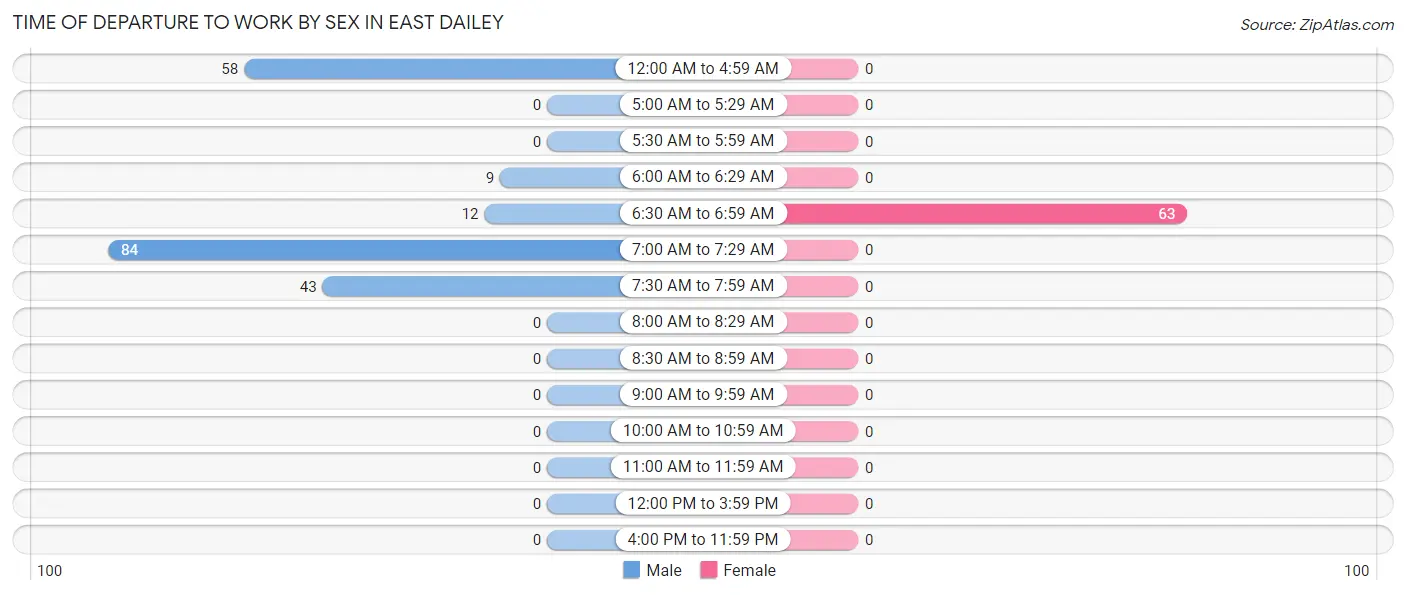
| Time of Departure | Male | Female |
| 12:00 AM to 4:59 AM | 58 (28.2%) | 0 (0.0%) |
| 5:00 AM to 5:29 AM | 0 (0.0%) | 0 (0.0%) |
| 5:30 AM to 5:59 AM | 0 (0.0%) | 0 (0.0%) |
| 6:00 AM to 6:29 AM | 9 (4.4%) | 0 (0.0%) |
| 6:30 AM to 6:59 AM | 12 (5.8%) | 63 (100.0%) |
| 7:00 AM to 7:29 AM | 84 (40.8%) | 0 (0.0%) |
| 7:30 AM to 7:59 AM | 43 (20.9%) | 0 (0.0%) |
| 8:00 AM to 8:29 AM | 0 (0.0%) | 0 (0.0%) |
| 8:30 AM to 8:59 AM | 0 (0.0%) | 0 (0.0%) |
| 9:00 AM to 9:59 AM | 0 (0.0%) | 0 (0.0%) |
| 10:00 AM to 10:59 AM | 0 (0.0%) | 0 (0.0%) |
| 11:00 AM to 11:59 AM | 0 (0.0%) | 0 (0.0%) |
| 12:00 PM to 3:59 PM | 0 (0.0%) | 0 (0.0%) |
| 4:00 PM to 11:59 PM | 0 (0.0%) | 0 (0.0%) |
| Total | 206 (100.0%) | 63 (100.0%) |
Housing Occupancy in East Dailey
Occupancy by Ownership in East Dailey
Of the total 131 dwellings in East Dailey, owner-occupied units account for 103 (78.6%), while renter-occupied units make up 28 (21.4%).
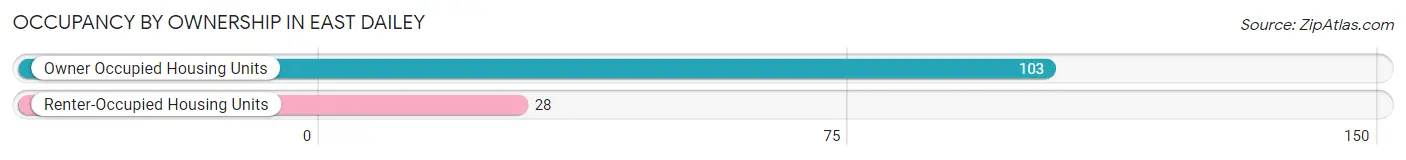
| Occupancy | # Housing Units | % Housing Units |
| Owner Occupied Housing Units | 103 | 78.6% |
| Renter-Occupied Housing Units | 28 | 21.4% |
| Total Occupied Housing Units | 131 | 100.0% |
Occupancy by Household Size in East Dailey
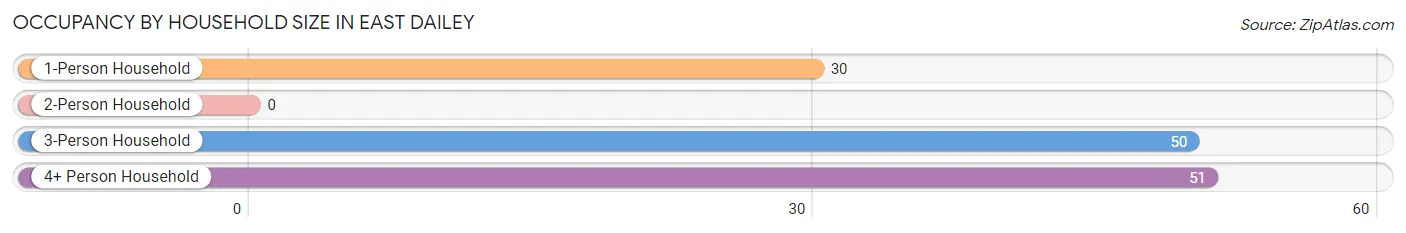
| Household Size | # Housing Units | % Housing Units |
| 1-Person Household | 30 | 22.9% |
| 2-Person Household | 0 | 0.0% |
| 3-Person Household | 50 | 38.2% |
| 4+ Person Household | 51 | 38.9% |
| Total Housing Units | 131 | 100.0% |
Occupancy by Ownership by Household Size in East Dailey
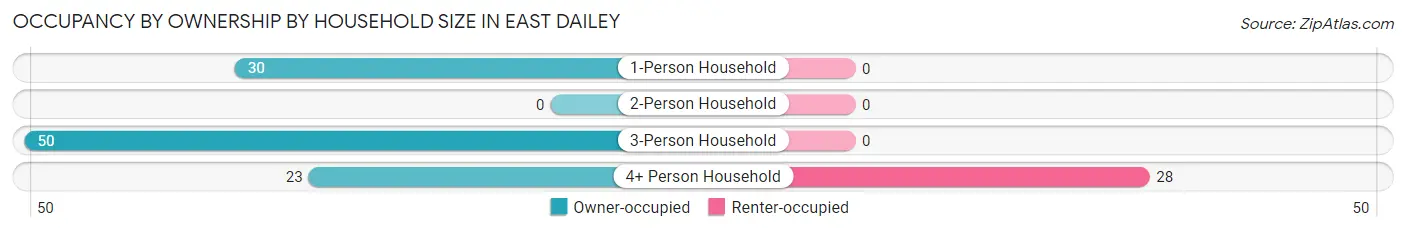
| Household Size | Owner-occupied | Renter-occupied |
| 1-Person Household | 30 (100.0%) | 0 (0.0%) |
| 2-Person Household | 0 (0.0%) | 0 (0.0%) |
| 3-Person Household | 50 (100.0%) | 0 (0.0%) |
| 4+ Person Household | 23 (45.1%) | 28 (54.9%) |
| Total Housing Units | 103 (78.6%) | 28 (21.4%) |
Occupancy by Educational Attainment in East Dailey
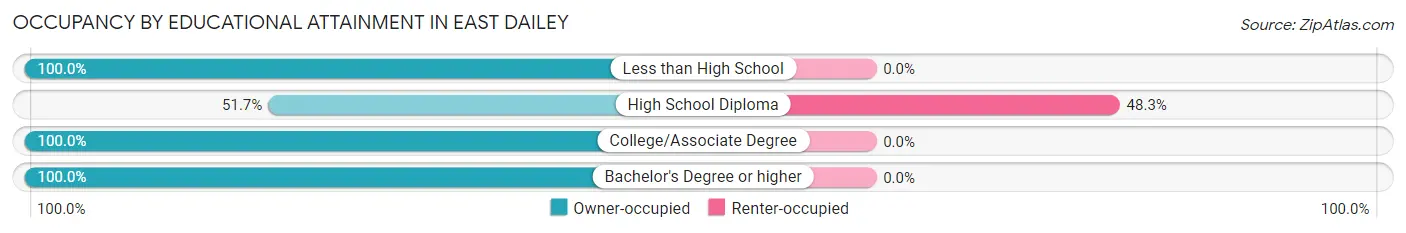
| Household Size | Owner-occupied | Renter-occupied |
| Less than High School | 12 (100.0%) | 0 (0.0%) |
| High School Diploma | 30 (51.7%) | 28 (48.3%) |
| College/Associate Degree | 11 (100.0%) | 0 (0.0%) |
| Bachelor's Degree or higher | 50 (100.0%) | 0 (0.0%) |
Occupancy by Age of Householder in East Dailey
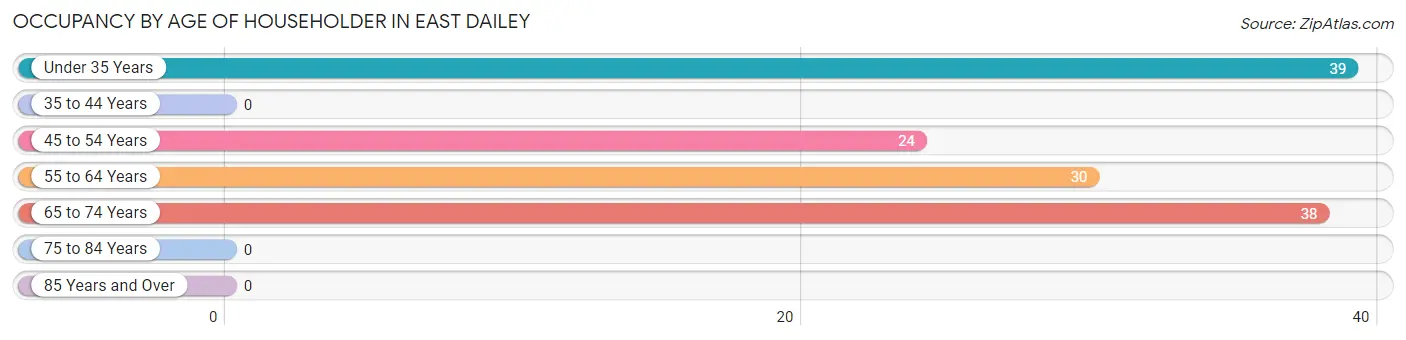
| Age Bracket | # Households | % Households |
| Under 35 Years | 39 | 29.8% |
| 35 to 44 Years | 0 | 0.0% |
| 45 to 54 Years | 24 | 18.3% |
| 55 to 64 Years | 30 | 22.9% |
| 65 to 74 Years | 38 | 29.0% |
| 75 to 84 Years | 0 | 0.0% |
| 85 Years and Over | 0 | 0.0% |
| Total | 131 | 100.0% |
Housing Finances in East Dailey
Median Income by Occupancy in East Dailey
| Occupancy Type | # Households | Median Income |
| Owner-Occupied | 103 (78.6%) | $0 |
| Renter-Occupied | 28 (21.4%) | $0 |
| Average | 131 (100.0%) | $0 |
Occupancy by Householder Income Bracket in East Dailey
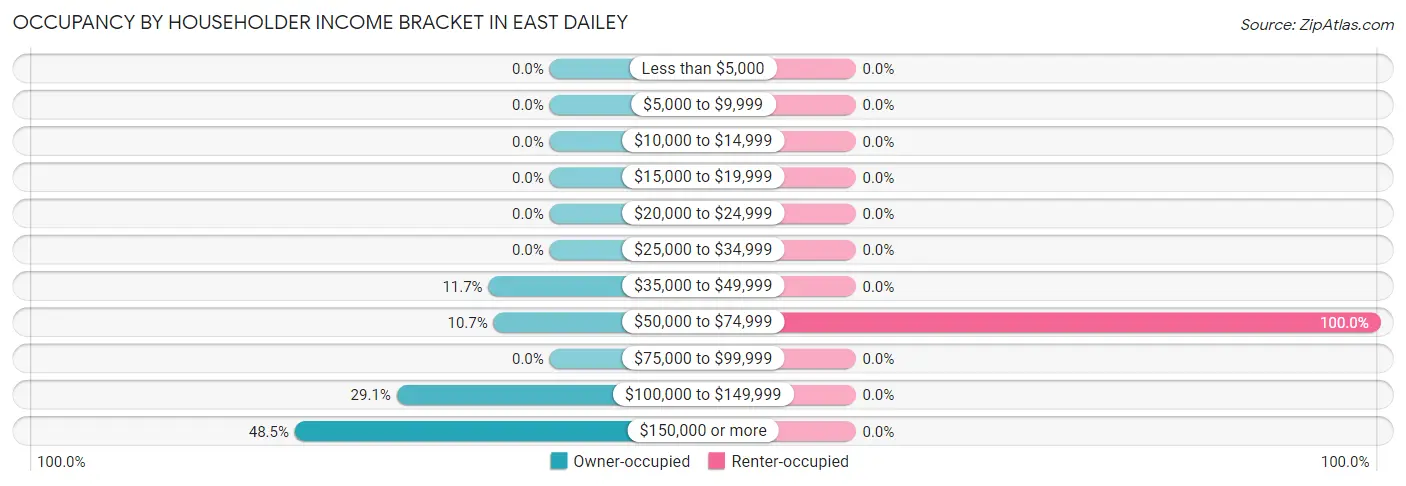
| Income Bracket | Owner-occupied | Renter-occupied |
| Less than $5,000 | 0 (0.0%) | 0 (0.0%) |
| $5,000 to $9,999 | 0 (0.0%) | 0 (0.0%) |
| $10,000 to $14,999 | 0 (0.0%) | 0 (0.0%) |
| $15,000 to $19,999 | 0 (0.0%) | 0 (0.0%) |
| $20,000 to $24,999 | 0 (0.0%) | 0 (0.0%) |
| $25,000 to $34,999 | 0 (0.0%) | 0 (0.0%) |
| $35,000 to $49,999 | 12 (11.7%) | 0 (0.0%) |
| $50,000 to $74,999 | 11 (10.7%) | 28 (100.0%) |
| $75,000 to $99,999 | 0 (0.0%) | 0 (0.0%) |
| $100,000 to $149,999 | 30 (29.1%) | 0 (0.0%) |
| $150,000 or more | 50 (48.5%) | 0 (0.0%) |
| Total | 103 (100.0%) | 28 (100.0%) |
Monthly Housing Cost Tiers in East Dailey
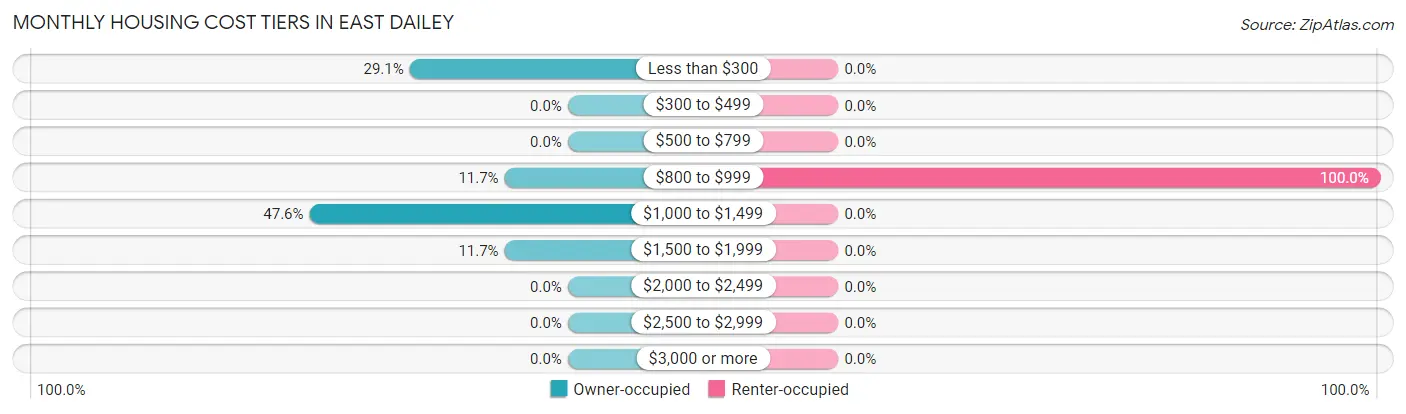
| Monthly Cost | Owner-occupied | Renter-occupied |
| Less than $300 | 30 (29.1%) | 0 (0.0%) |
| $300 to $499 | 0 (0.0%) | 0 (0.0%) |
| $500 to $799 | 0 (0.0%) | 0 (0.0%) |
| $800 to $999 | 12 (11.7%) | 28 (100.0%) |
| $1,000 to $1,499 | 49 (47.6%) | 0 (0.0%) |
| $1,500 to $1,999 | 12 (11.7%) | 0 (0.0%) |
| $2,000 to $2,499 | 0 (0.0%) | 0 (0.0%) |
| $2,500 to $2,999 | 0 (0.0%) | 0 (0.0%) |
| $3,000 or more | 0 (0.0%) | 0 (0.0%) |
| Total | 103 (100.0%) | 28 (100.0%) |
Physical Housing Characteristics in East Dailey
Housing Structures in East Dailey
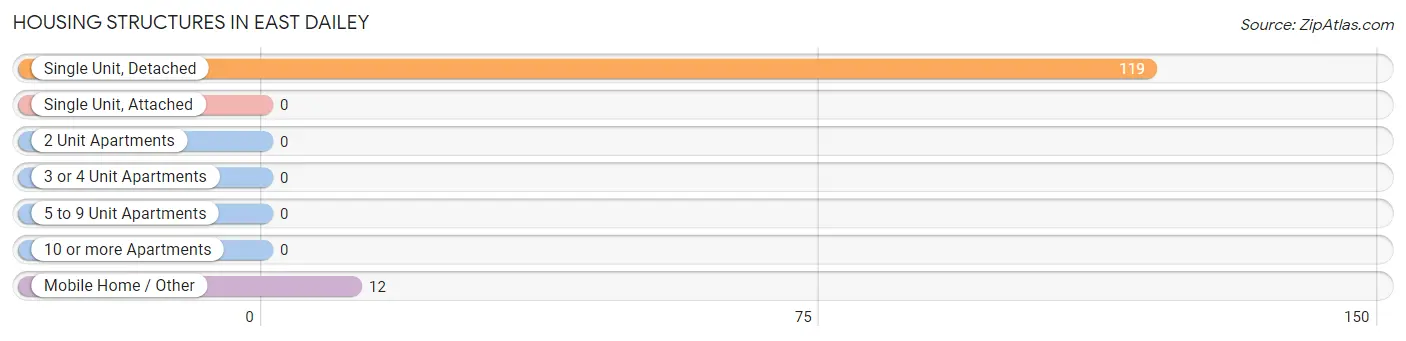
| Structure Type | # Housing Units | % Housing Units |
| Single Unit, Detached | 119 | 90.8% |
| Single Unit, Attached | 0 | 0.0% |
| 2 Unit Apartments | 0 | 0.0% |
| 3 or 4 Unit Apartments | 0 | 0.0% |
| 5 to 9 Unit Apartments | 0 | 0.0% |
| 10 or more Apartments | 0 | 0.0% |
| Mobile Home / Other | 12 | 9.2% |
| Total | 131 | 100.0% |
Housing Structures by Occupancy in East Dailey
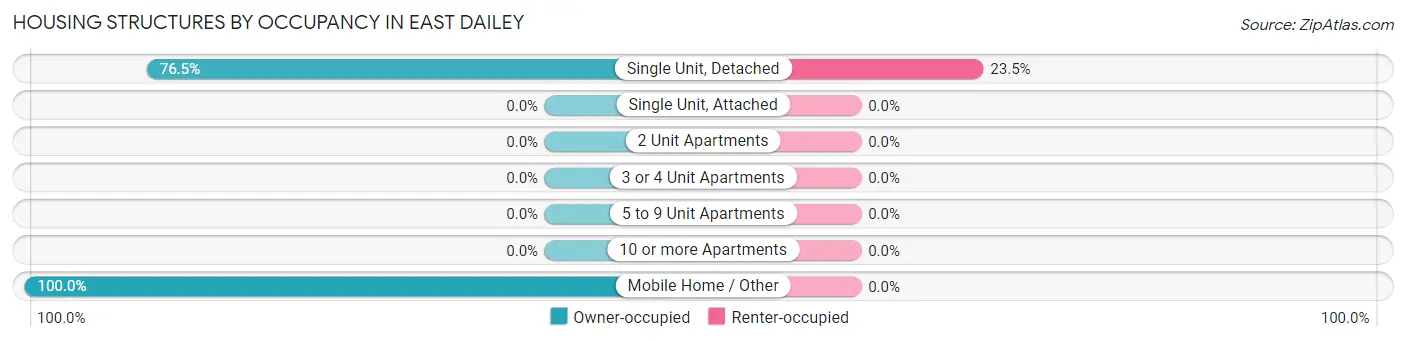
| Structure Type | Owner-occupied | Renter-occupied |
| Single Unit, Detached | 91 (76.5%) | 28 (23.5%) |
| Single Unit, Attached | 0 (0.0%) | 0 (0.0%) |
| 2 Unit Apartments | 0 (0.0%) | 0 (0.0%) |
| 3 or 4 Unit Apartments | 0 (0.0%) | 0 (0.0%) |
| 5 to 9 Unit Apartments | 0 (0.0%) | 0 (0.0%) |
| 10 or more Apartments | 0 (0.0%) | 0 (0.0%) |
| Mobile Home / Other | 12 (100.0%) | 0 (0.0%) |
| Total | 103 (78.6%) | 28 (21.4%) |
Housing Structures by Number of Rooms in East Dailey
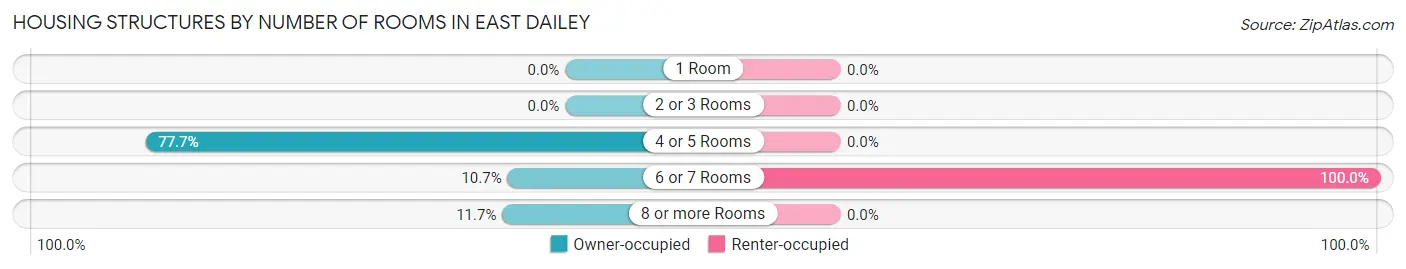
| Number of Rooms | Owner-occupied | Renter-occupied |
| 1 Room | 0 (0.0%) | 0 (0.0%) |
| 2 or 3 Rooms | 0 (0.0%) | 0 (0.0%) |
| 4 or 5 Rooms | 80 (77.7%) | 0 (0.0%) |
| 6 or 7 Rooms | 11 (10.7%) | 28 (100.0%) |
| 8 or more Rooms | 12 (11.7%) | 0 (0.0%) |
| Total | 103 (100.0%) | 28 (100.0%) |
Housing Structure by Heating Type in East Dailey
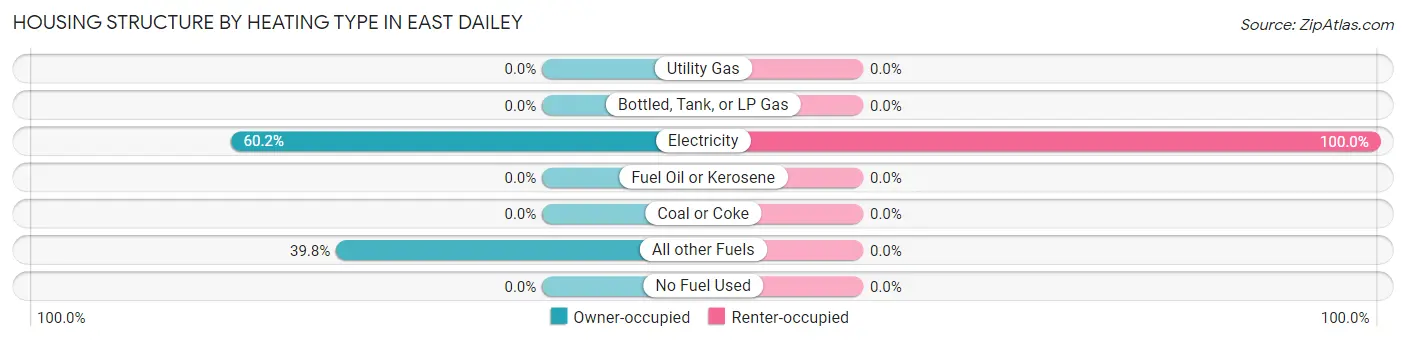
| Heating Type | Owner-occupied | Renter-occupied |
| Utility Gas | 0 (0.0%) | 0 (0.0%) |
| Bottled, Tank, or LP Gas | 0 (0.0%) | 0 (0.0%) |
| Electricity | 62 (60.2%) | 28 (100.0%) |
| Fuel Oil or Kerosene | 0 (0.0%) | 0 (0.0%) |
| Coal or Coke | 0 (0.0%) | 0 (0.0%) |
| All other Fuels | 41 (39.8%) | 0 (0.0%) |
| No Fuel Used | 0 (0.0%) | 0 (0.0%) |
| Total | 103 (100.0%) | 28 (100.0%) |
Household Vehicle Usage in East Dailey
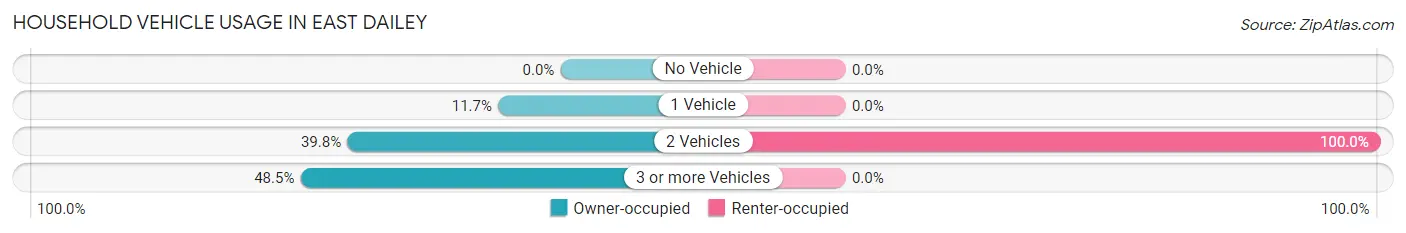
| Vehicles per Household | Owner-occupied | Renter-occupied |
| No Vehicle | 0 (0.0%) | 0 (0.0%) |
| 1 Vehicle | 12 (11.7%) | 0 (0.0%) |
| 2 Vehicles | 41 (39.8%) | 28 (100.0%) |
| 3 or more Vehicles | 50 (48.5%) | 0 (0.0%) |
| Total | 103 (100.0%) | 28 (100.0%) |
Real Estate & Mortgages in East Dailey
Real Estate and Mortgage Overview in East Dailey
| Characteristic | Without Mortgage | With Mortgage |
| Housing Units | 30 | 73 |
| Median Property Value | - | - |
| Median Household Income | - | - |
| Monthly Housing Costs | - | - |
| Real Estate Taxes | - | - |
Property Value by Mortgage Status in East Dailey
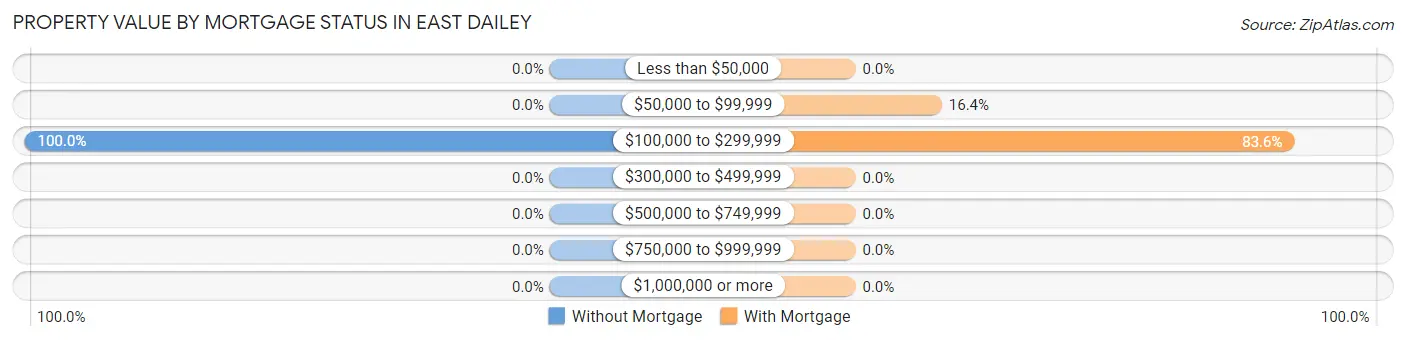
| Property Value | Without Mortgage | With Mortgage |
| Less than $50,000 | 0 (0.0%) | 0 (0.0%) |
| $50,000 to $99,999 | 0 (0.0%) | 12 (16.4%) |
| $100,000 to $299,999 | 30 (100.0%) | 61 (83.6%) |
| $300,000 to $499,999 | 0 (0.0%) | 0 (0.0%) |
| $500,000 to $749,999 | 0 (0.0%) | 0 (0.0%) |
| $750,000 to $999,999 | 0 (0.0%) | 0 (0.0%) |
| $1,000,000 or more | 0 (0.0%) | 0 (0.0%) |
| Total | 30 (100.0%) | 73 (100.0%) |
Household Income by Mortgage Status in East Dailey
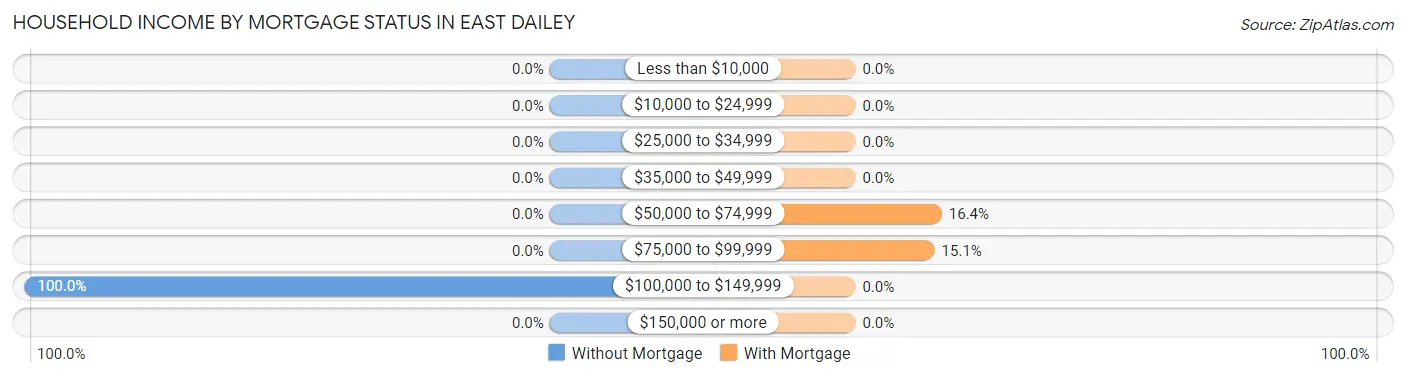
| Household Income | Without Mortgage | With Mortgage |
| Less than $10,000 | 0 (0.0%) | 0 (0.0%) |
| $10,000 to $24,999 | 0 (0.0%) | 0 (0.0%) |
| $25,000 to $34,999 | 0 (0.0%) | 0 (0.0%) |
| $35,000 to $49,999 | 0 (0.0%) | 0 (0.0%) |
| $50,000 to $74,999 | 0 (0.0%) | 12 (16.4%) |
| $75,000 to $99,999 | 0 (0.0%) | 11 (15.1%) |
| $100,000 to $149,999 | 30 (100.0%) | 0 (0.0%) |
| $150,000 or more | 0 (0.0%) | 0 (0.0%) |
| Total | 30 (100.0%) | 73 (100.0%) |
Property Value to Household Income Ratio in East Dailey
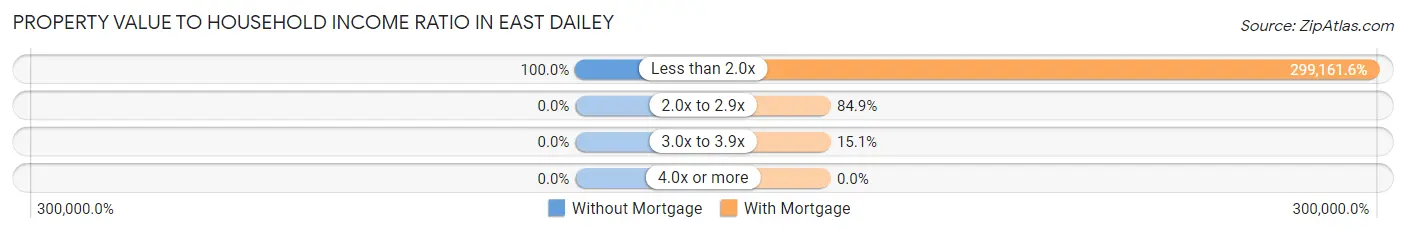
| Value-to-Income Ratio | Without Mortgage | With Mortgage |
| Less than 2.0x | 30 (100.0%) | 218,388 (299,161.6%) |
| 2.0x to 2.9x | 0 (0.0%) | 62 (84.9%) |
| 3.0x to 3.9x | 0 (0.0%) | 11 (15.1%) |
| 4.0x or more | 0 (0.0%) | 0 (0.0%) |
| Total | 30 (100.0%) | 73 (100.0%) |
Real Estate Taxes by Mortgage Status in East Dailey

| Property Taxes | Without Mortgage | With Mortgage |
| Less than $800 | 30 (100.0%) | 0 (0.0%) |
| $800 to $1,499 | 0 (0.0%) | 62 (84.9%) |
| $800 to $1,499 | 0 (0.0%) | 11 (15.1%) |
| Total | 30 (100.0%) | 73 (100.0%) |
Health & Disability in East Dailey
Health Insurance Coverage by Age in East Dailey
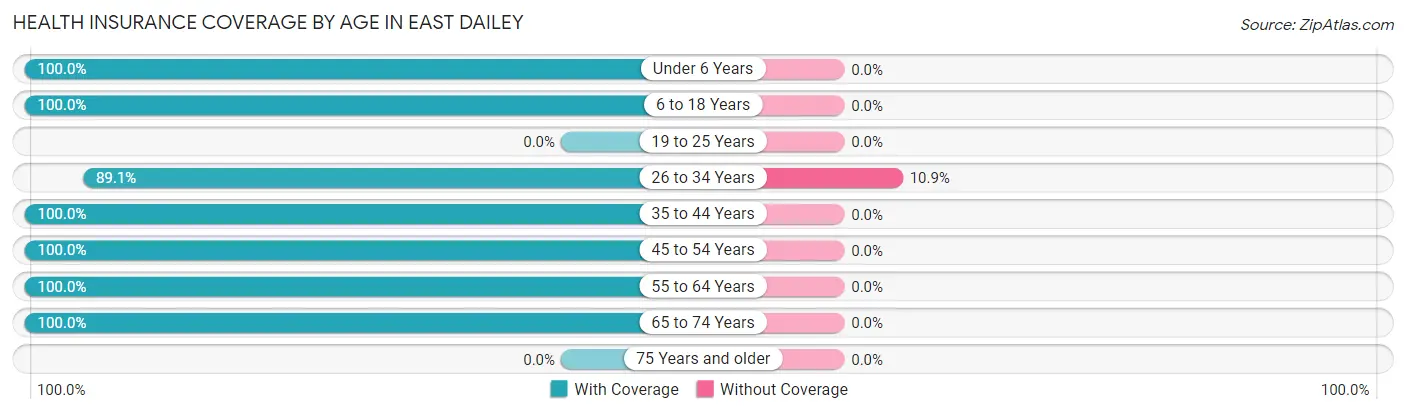
| Age Bracket | With Coverage | Without Coverage |
| Under 6 Years | 25 (100.0%) | 0 (0.0%) |
| 6 to 18 Years | 87 (100.0%) | 0 (0.0%) |
| 19 to 25 Years | 0 (0.0%) | 0 (0.0%) |
| 26 to 34 Years | 90 (89.1%) | 11 (10.9%) |
| 35 to 44 Years | 78 (100.0%) | 0 (0.0%) |
| 45 to 54 Years | 69 (100.0%) | 0 (0.0%) |
| 55 to 64 Years | 30 (100.0%) | 0 (0.0%) |
| 65 to 74 Years | 38 (100.0%) | 0 (0.0%) |
| 75 Years and older | 0 (0.0%) | 0 (0.0%) |
| Total | 417 (97.4%) | 11 (2.6%) |
Health Insurance Coverage by Citizenship Status in East Dailey
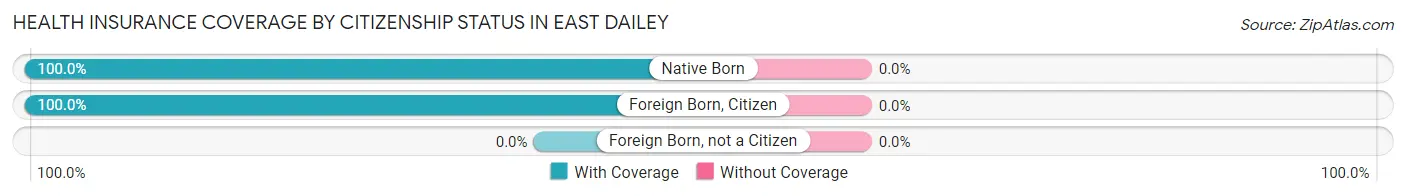
| Citizenship Status | With Coverage | Without Coverage |
| Native Born | 25 (100.0%) | 0 (0.0%) |
| Foreign Born, Citizen | 87 (100.0%) | 0 (0.0%) |
| Foreign Born, not a Citizen | 0 (0.0%) | 0 (0.0%) |
Health Insurance Coverage by Household Income in East Dailey
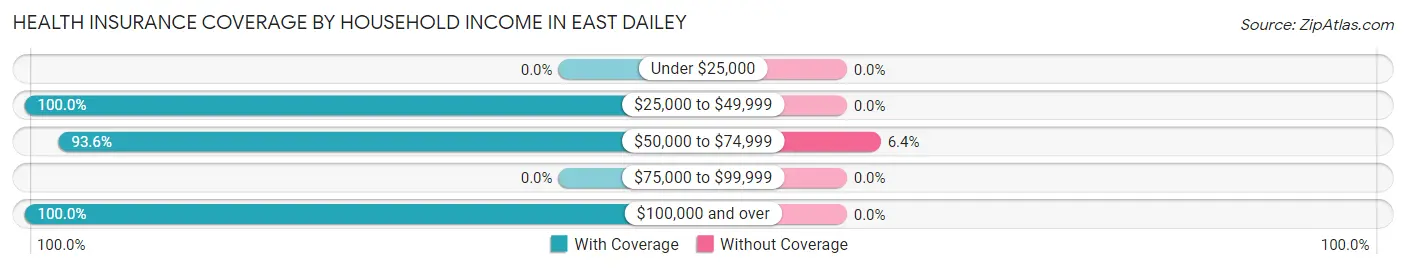
| Household Income | With Coverage | Without Coverage |
| Under $25,000 | 0 (0.0%) | 0 (0.0%) |
| $25,000 to $49,999 | 46 (100.0%) | 0 (0.0%) |
| $50,000 to $74,999 | 162 (93.6%) | 11 (6.4%) |
| $75,000 to $99,999 | 0 (0.0%) | 0 (0.0%) |
| $100,000 and over | 209 (100.0%) | 0 (0.0%) |
Public vs Private Health Insurance Coverage by Age in East Dailey
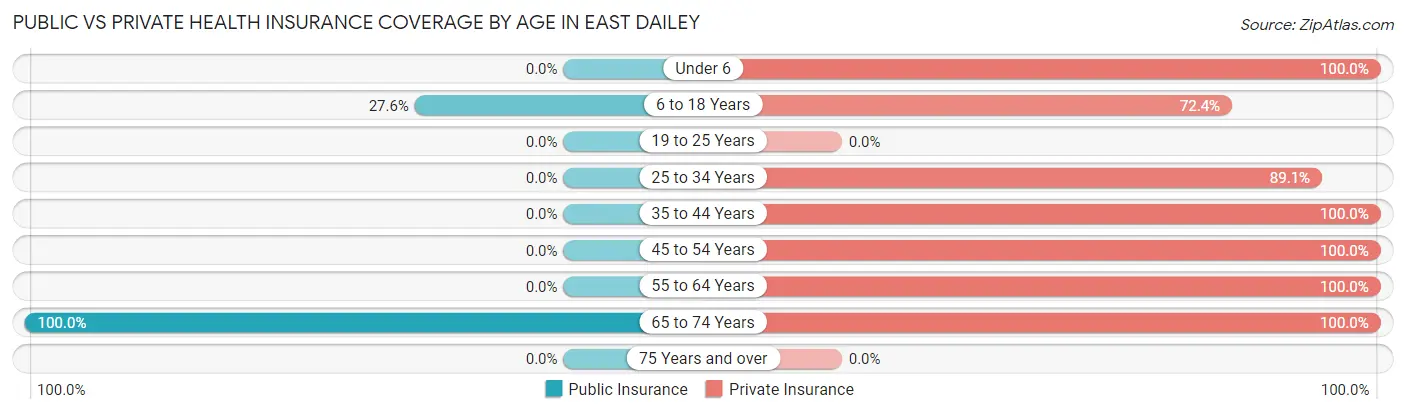
| Age Bracket | Public Insurance | Private Insurance |
| Under 6 | 0 (0.0%) | 25 (100.0%) |
| 6 to 18 Years | 24 (27.6%) | 63 (72.4%) |
| 19 to 25 Years | 0 (0.0%) | 0 (0.0%) |
| 25 to 34 Years | 0 (0.0%) | 90 (89.1%) |
| 35 to 44 Years | 0 (0.0%) | 78 (100.0%) |
| 45 to 54 Years | 0 (0.0%) | 69 (100.0%) |
| 55 to 64 Years | 0 (0.0%) | 30 (100.0%) |
| 65 to 74 Years | 38 (100.0%) | 38 (100.0%) |
| 75 Years and over | 0 (0.0%) | 0 (0.0%) |
| Total | 62 (14.5%) | 393 (91.8%) |
Disability Status by Sex by Age in East Dailey
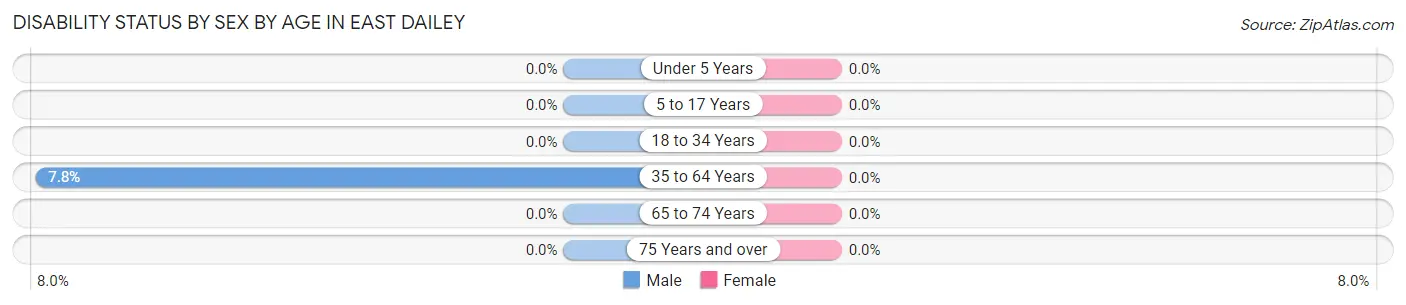
| Age Bracket | Male | Female |
| Under 5 Years | 0 (0.0%) | 0 (0.0%) |
| 5 to 17 Years | 0 (0.0%) | 0 (0.0%) |
| 18 to 34 Years | 0 (0.0%) | 0 (0.0%) |
| 35 to 64 Years | 12 (7.8%) | 0 (0.0%) |
| 65 to 74 Years | 0 (0.0%) | 0 (0.0%) |
| 75 Years and over | 0 (0.0%) | 0 (0.0%) |
Disability Class by Sex by Age in East Dailey
Disability Class: Hearing Difficulty
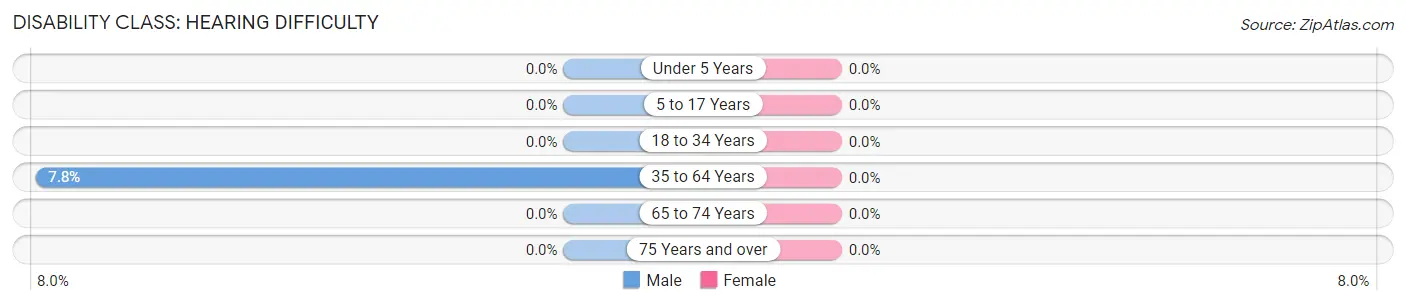
| Age Bracket | Male | Female |
| Under 5 Years | 0 (0.0%) | 0 (0.0%) |
| 5 to 17 Years | 0 (0.0%) | 0 (0.0%) |
| 18 to 34 Years | 0 (0.0%) | 0 (0.0%) |
| 35 to 64 Years | 12 (7.8%) | 0 (0.0%) |
| 65 to 74 Years | 0 (0.0%) | 0 (0.0%) |
| 75 Years and over | 0 (0.0%) | 0 (0.0%) |
Disability Class: Vision Difficulty
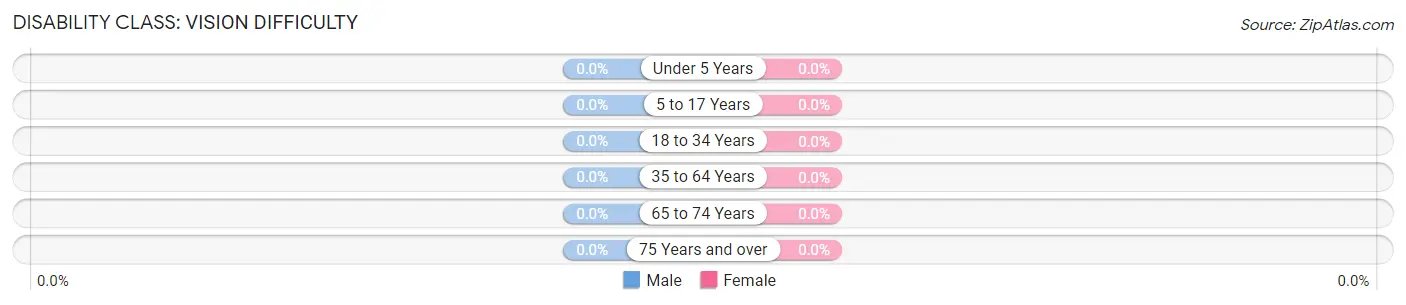
| Age Bracket | Male | Female |
| Under 5 Years | 0 (0.0%) | 0 (0.0%) |
| 5 to 17 Years | 0 (0.0%) | 0 (0.0%) |
| 18 to 34 Years | 0 (0.0%) | 0 (0.0%) |
| 35 to 64 Years | 0 (0.0%) | 0 (0.0%) |
| 65 to 74 Years | 0 (0.0%) | 0 (0.0%) |
| 75 Years and over | 0 (0.0%) | 0 (0.0%) |
Disability Class: Cognitive Difficulty

| Age Bracket | Male | Female |
| 5 to 17 Years | 0 (0.0%) | 0 (0.0%) |
| 18 to 34 Years | 0 (0.0%) | 0 (0.0%) |
| 35 to 64 Years | 0 (0.0%) | 0 (0.0%) |
| 65 to 74 Years | 0 (0.0%) | 0 (0.0%) |
| 75 Years and over | 0 (0.0%) | 0 (0.0%) |
Disability Class: Ambulatory Difficulty
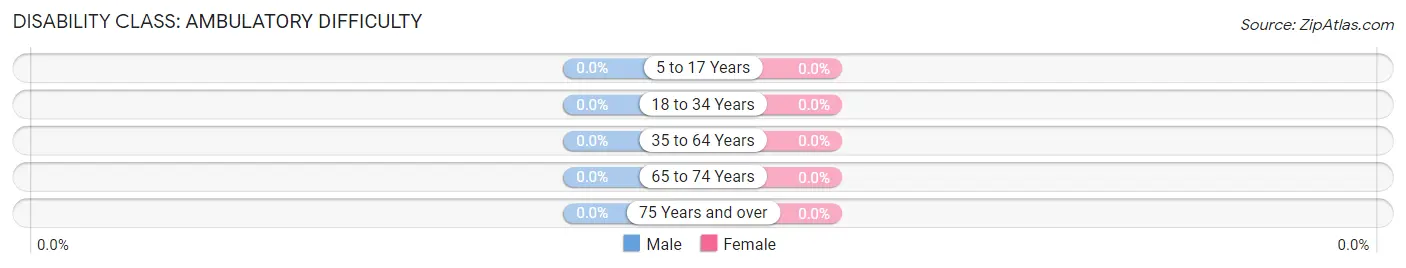
| Age Bracket | Male | Female |
| 5 to 17 Years | 0 (0.0%) | 0 (0.0%) |
| 18 to 34 Years | 0 (0.0%) | 0 (0.0%) |
| 35 to 64 Years | 0 (0.0%) | 0 (0.0%) |
| 65 to 74 Years | 0 (0.0%) | 0 (0.0%) |
| 75 Years and over | 0 (0.0%) | 0 (0.0%) |
Disability Class: Self-Care Difficulty
| Age Bracket | Male | Female |
| 5 to 17 Years | 0 (0.0%) | 0 (0.0%) |
| 18 to 34 Years | 0 (0.0%) | 0 (0.0%) |
| 35 to 64 Years | 0 (0.0%) | 0 (0.0%) |
| 65 to 74 Years | 0 (0.0%) | 0 (0.0%) |
| 75 Years and over | 0 (0.0%) | 0 (0.0%) |
Technology Access in East Dailey
Computing Device Access in East Dailey
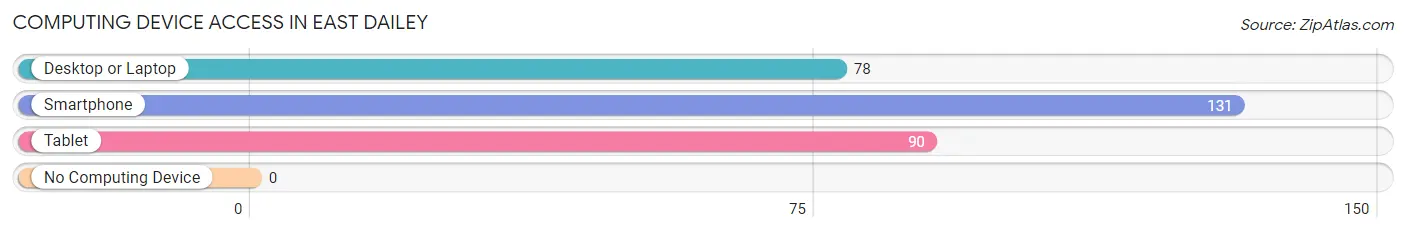
| Device Type | # Households | % Households |
| Desktop or Laptop | 78 | 59.5% |
| Smartphone | 131 | 100.0% |
| Tablet | 90 | 68.7% |
| No Computing Device | 0 | 0.0% |
| Total | 131 | 100.0% |
Internet Access in East Dailey
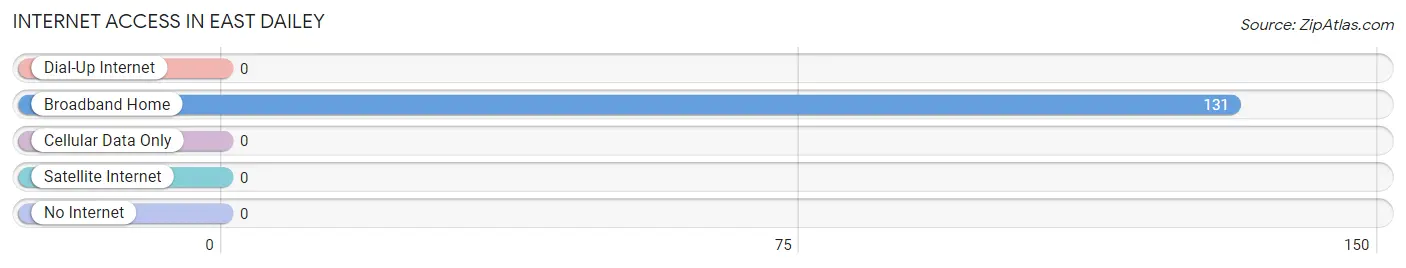
| Internet Type | # Households | % Households |
| Dial-Up Internet | 0 | 0.0% |
| Broadband Home | 131 | 100.0% |
| Cellular Data Only | 0 | 0.0% |
| Satellite Internet | 0 | 0.0% |
| No Internet | 0 | 0.0% |
| Total | 131 | 100.0% |
East Dailey Summary
East Dailey is a small town located in the eastern part of West Virginia, United States. It is situated in the Appalachian Mountains and is part of the Monongahela National Forest. The town has a population of approximately 1,000 people and is located in Randolph County.
History
East Dailey was founded in 1820 by a group of settlers from Pennsylvania. The town was originally called “Dailey’s Crossroads” after the family who owned the land. The town was renamed East Dailey in 1872 when the railroad came through the area. The town was a major stop on the Baltimore and Ohio Railroad and was a popular destination for travelers.
The town was also home to a number of coal mines, which provided employment for many of the town’s residents. The coal industry was a major part of the town’s economy until the mid-20th century when the mines began to close.
Geography
East Dailey is located in the Appalachian Mountains and is part of the Monongahela National Forest. The town is situated at an elevation of 1,800 feet and is surrounded by mountains and forests. The town is located near the Cheat River and is close to the towns of Elkins and Beverly.
The climate in East Dailey is humid continental, with hot summers and cold winters. The average annual temperature is around 50 degrees Fahrenheit. The town receives an average of 40 inches of precipitation per year.
Economy
The economy of East Dailey is largely based on tourism and agriculture. The town is home to a number of small businesses, including restaurants, shops, and lodging. The town is also home to a number of farms, which produce a variety of crops, including corn, soybeans, and hay.
The town is also home to a number of outdoor recreation activities, including hiking, camping, fishing, and hunting. The town is also home to a number of festivals and events throughout the year, including the East Dailey Fall Festival and the East Dailey Christmas Parade.
Demographics
As of the 2010 census, the population of East Dailey was 1,000 people. The racial makeup of the town was 97.2% White, 0.7% African American, 0.2% Native American, 0.2% Asian, and 1.7% from other races. The median household income was $30,000 and the median age was 42 years.
East Dailey is a small town with a rich history and a strong sense of community. The town is home to a number of small businesses and farms, and is a popular destination for outdoor recreation. The town is also home to a number of festivals and events throughout the year, making it a great place to visit and explore.
Common Questions
What is Per Capita Income in East Dailey?
Per Capita income in East Dailey is $44,961.
What is Income or Wage Gap in East Dailey?
Income or Wage Gap in East Dailey is 49.6%.
Women in East Dailey earn 50.4 cents for every dollar earned by a man.
What is Inequality or Gini Index in East Dailey?
Inequality or Gini Index in East Dailey is 0.32.
What is the Total Population of East Dailey?
Total Population of East Dailey is 428.
What is the Total Male Population of East Dailey?
Total Male Population of East Dailey is 271.
What is the Total Female Population of East Dailey?
Total Female Population of East Dailey is 157.
What is the Ratio of Males per 100 Females in East Dailey?
There are 172.61 Males per 100 Females in East Dailey.
What is the Ratio of Females per 100 Males in East Dailey?
There are 57.93 Females per 100 Males in East Dailey.
What is the Median Population Age in East Dailey?
Median Population Age in East Dailey is 35.0 Years.
What is the Average Family Size in East Dailey
Average Family Size in East Dailey is 3.9 People.
What is the Average Household Size in East Dailey
Average Household Size in East Dailey is 3.3 People.
How Large is the Labor Force in East Dailey?
There are 269 People in the Labor Forcein in East Dailey.
What is the Percentage of People in the Labor Force in East Dailey?
85.1% of People are in the Labor Force in East Dailey.