Middlebourne, WV Map & Demographics
Middlebourne Map
Middlebourne Overview
$35,087
PER CAPITA INCOME
$83,846
AVG FAMILY INCOME
$62,000
AVG HOUSEHOLD INCOME
57.9%
WAGE / INCOME GAP [ % ]
42.1¢/ $1
WAGE / INCOME GAP [ $ ]
0.49
INEQUALITY / GINI INDEX
830
TOTAL POPULATION
450
MALE POPULATION
380
FEMALE POPULATION
118.42
MALES / 100 FEMALES
84.44
FEMALES / 100 MALES
47.0
MEDIAN AGE
3.8
AVG FAMILY SIZE
2.6
AVG HOUSEHOLD SIZE
288
LABOR FORCE [ PEOPLE ]
42.1%
PERCENT IN LABOR FORCE
3.8%
UNEMPLOYMENT RATE
Middlebourne Zip Codes
Middlebourne Area Codes
Income in Middlebourne
Income Overview in Middlebourne
Per Capita Income in Middlebourne is $35,087, while median incomes of families and households are $83,846 and $62,000 respectively.
| Characteristic | Number | Measure |
| Per Capita Income | 830 | $35,087 |
| Median Family Income | 170 | $83,846 |
| Mean Family Income | 170 | $105,266 |
| Median Household Income | 314 | $62,000 |
| Mean Household Income | 314 | $82,555 |
| Income Deficit | 170 | $0 |
| Wage / Income Gap (%) | 830 | 57.90% |
| Wage / Income Gap ($) | 830 | 42.10¢ per $1 |
| Gini / Inequality Index | 830 | 0.49 |
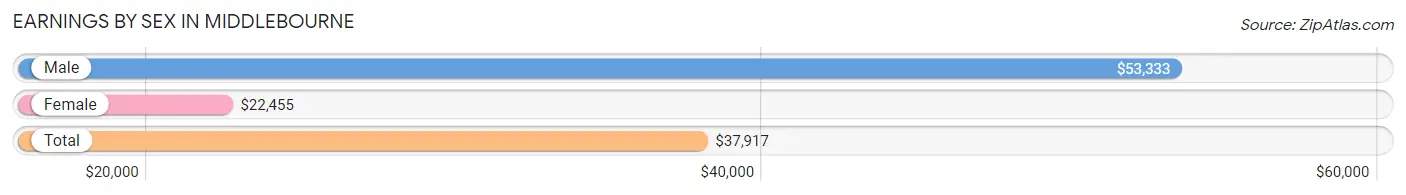
Earnings by Sex in Middlebourne
Average Earnings in Middlebourne are $37,917, $53,333 for men and $22,455 for women, a difference of 57.9%.
| Sex | Number | Average Earnings |
| Male | 216 (67.7%) | $53,333 |
| Female | 103 (32.3%) | $22,455 |
| Total | 319 (100.0%) | $37,917 |
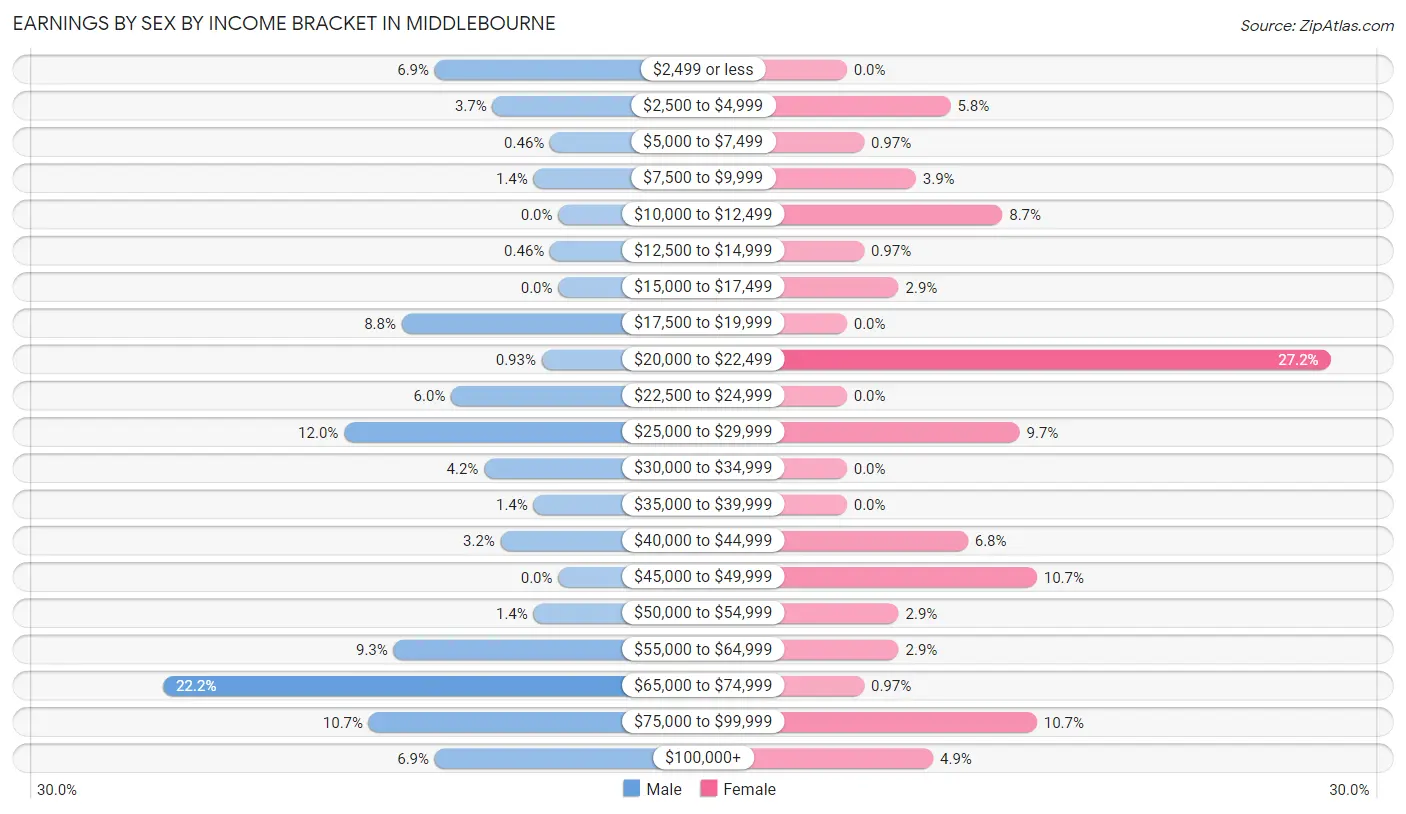
Earnings by Sex by Income Bracket in Middlebourne
The most common earnings brackets in Middlebourne are $65,000 to $74,999 for men (48 | 22.2%) and $20,000 to $22,499 for women (28 | 27.2%).
| Income | Male | Female |
| $2,499 or less | 15 (6.9%) | 0 (0.0%) |
| $2,500 to $4,999 | 8 (3.7%) | 6 (5.8%) |
| $5,000 to $7,499 | 1 (0.5%) | 1 (1.0%) |
| $7,500 to $9,999 | 3 (1.4%) | 4 (3.9%) |
| $10,000 to $12,499 | 0 (0.0%) | 9 (8.7%) |
| $12,500 to $14,999 | 1 (0.5%) | 1 (1.0%) |
| $15,000 to $17,499 | 0 (0.0%) | 3 (2.9%) |
| $17,500 to $19,999 | 19 (8.8%) | 0 (0.0%) |
| $20,000 to $22,499 | 2 (0.9%) | 28 (27.2%) |
| $22,500 to $24,999 | 13 (6.0%) | 0 (0.0%) |
| $25,000 to $29,999 | 26 (12.0%) | 10 (9.7%) |
| $30,000 to $34,999 | 9 (4.2%) | 0 (0.0%) |
| $35,000 to $39,999 | 3 (1.4%) | 0 (0.0%) |
| $40,000 to $44,999 | 7 (3.2%) | 7 (6.8%) |
| $45,000 to $49,999 | 0 (0.0%) | 11 (10.7%) |
| $50,000 to $54,999 | 3 (1.4%) | 3 (2.9%) |
| $55,000 to $64,999 | 20 (9.3%) | 3 (2.9%) |
| $65,000 to $74,999 | 48 (22.2%) | 1 (1.0%) |
| $75,000 to $99,999 | 23 (10.6%) | 11 (10.7%) |
| $100,000+ | 15 (6.9%) | 5 (4.9%) |
| Total | 216 (100.0%) | 103 (100.0%) |
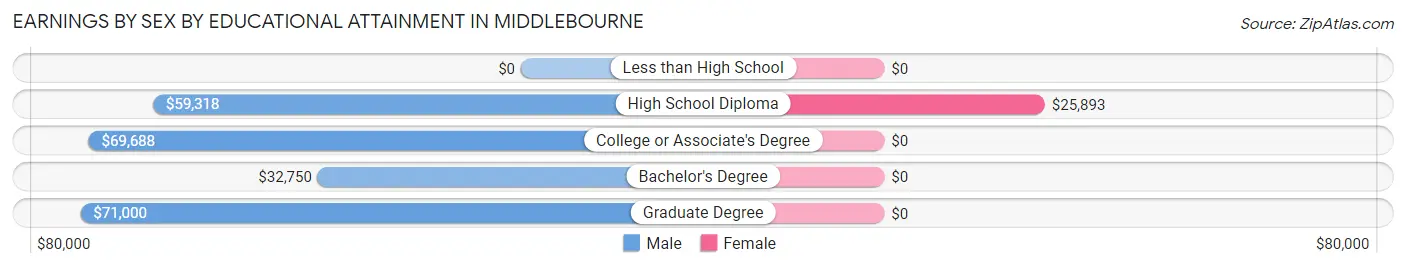
Earnings by Sex by Educational Attainment in Middlebourne
Average earnings in Middlebourne are $67,083 for men and $25,250 for women, a difference of 62.4%. Men with an educational attainment of graduate degree enjoy the highest average annual earnings of $71,000, while those with bachelor's degree education earn the least with $32,750. Women with an educational attainment of high school diploma earn the most with the average annual earnings of $25,893, while those with high school diploma education have the smallest earnings of $25,893.
| Educational Attainment | Male Income | Female Income |
| Less than High School | - | - |
| High School Diploma | $59,318 | $25,893 |
| College or Associate's Degree | $69,688 | $0 |
| Bachelor's Degree | $32,750 | $0 |
| Graduate Degree | $71,000 | $0 |
| Total | $67,083 | $25,250 |
Family Income in Middlebourne
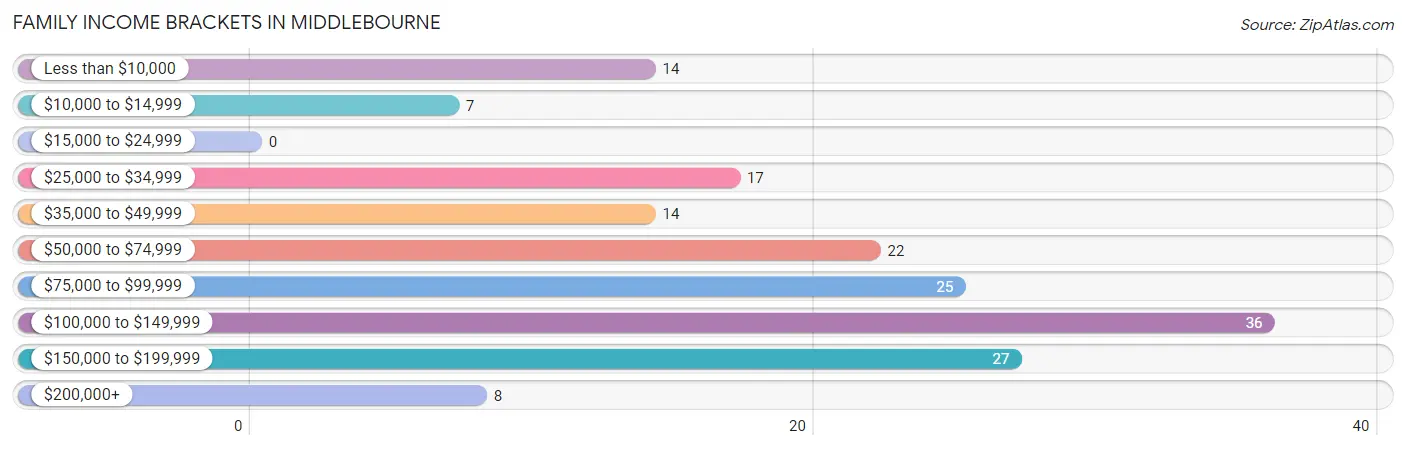
Family Income Brackets in Middlebourne
According to the Middlebourne family income data, there are 36 families falling into the $100,000 to $149,999 income range, which is the most common income bracket and makes up 21.2% of all families.
| Income Bracket | # Families | % Families |
| Less than $10,000 | 14 | 8.2% |
| $10,000 to $14,999 | 7 | 4.1% |
| $15,000 to $24,999 | 0 | 0.0% |
| $25,000 to $34,999 | 17 | 10.0% |
| $35,000 to $49,999 | 14 | 8.2% |
| $50,000 to $74,999 | 22 | 12.9% |
| $75,000 to $99,999 | 25 | 14.7% |
| $100,000 to $149,999 | 36 | 21.2% |
| $150,000 to $199,999 | 27 | 15.9% |
| $200,000+ | 8 | 4.7% |
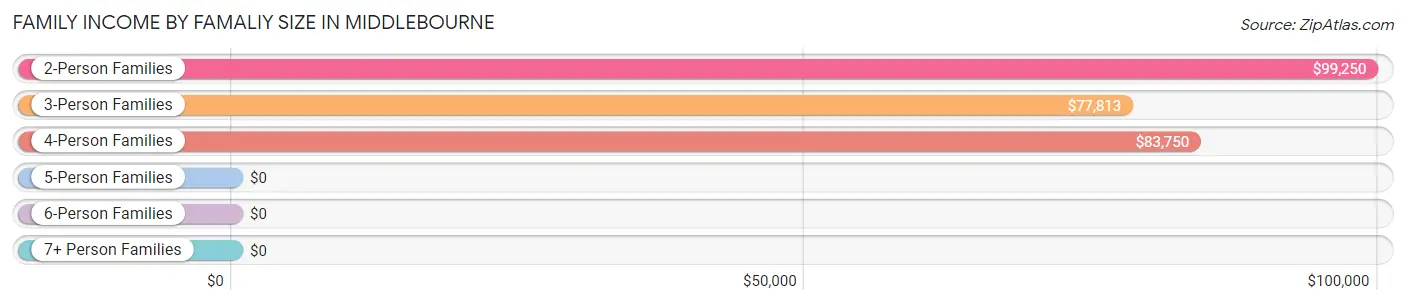
Family Income by Famaliy Size in Middlebourne
2-person families (117 | 68.8%) account for the highest median family income in Middlebourne with $99,250 per family, while 2-person families (117 | 68.8%) have the highest median income of $49,625 per family member.
| Income Bracket | # Families | Median Income |
| 2-Person Families | 117 (68.8%) | $99,250 |
| 3-Person Families | 29 (17.1%) | $77,813 |
| 4-Person Families | 20 (11.8%) | $83,750 |
| 5-Person Families | 4 (2.4%) | $0 |
| 6-Person Families | 0 (0.0%) | $0 |
| 7+ Person Families | 0 (0.0%) | $0 |
| Total | 170 (100.0%) | $83,846 |
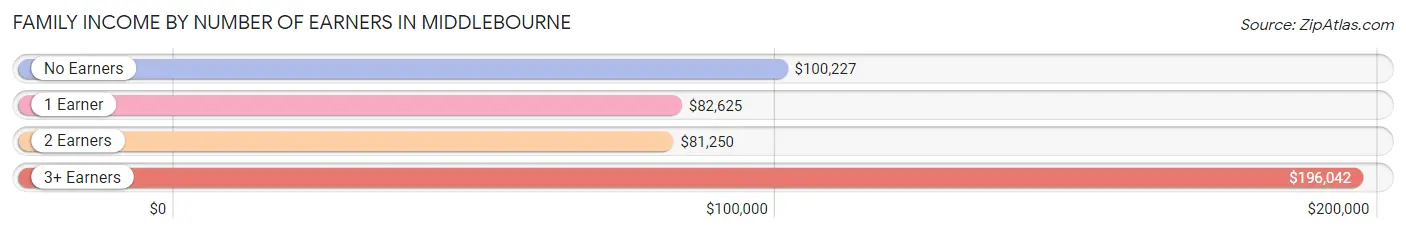
Family Income by Number of Earners in Middlebourne
The median family income in Middlebourne is $83,846, with families comprising 3+ earners (11) having the highest median family income of $196,042, while families with 2 earners (44) have the lowest median family income of $81,250, accounting for 6.5% and 25.9% of families, respectively.
| Number of Earners | # Families | Median Income |
| No Earners | 64 (37.7%) | $100,227 |
| 1 Earner | 51 (30.0%) | $82,625 |
| 2 Earners | 44 (25.9%) | $81,250 |
| 3+ Earners | 11 (6.5%) | $196,042 |
| Total | 170 (100.0%) | $83,846 |
Household Income in Middlebourne
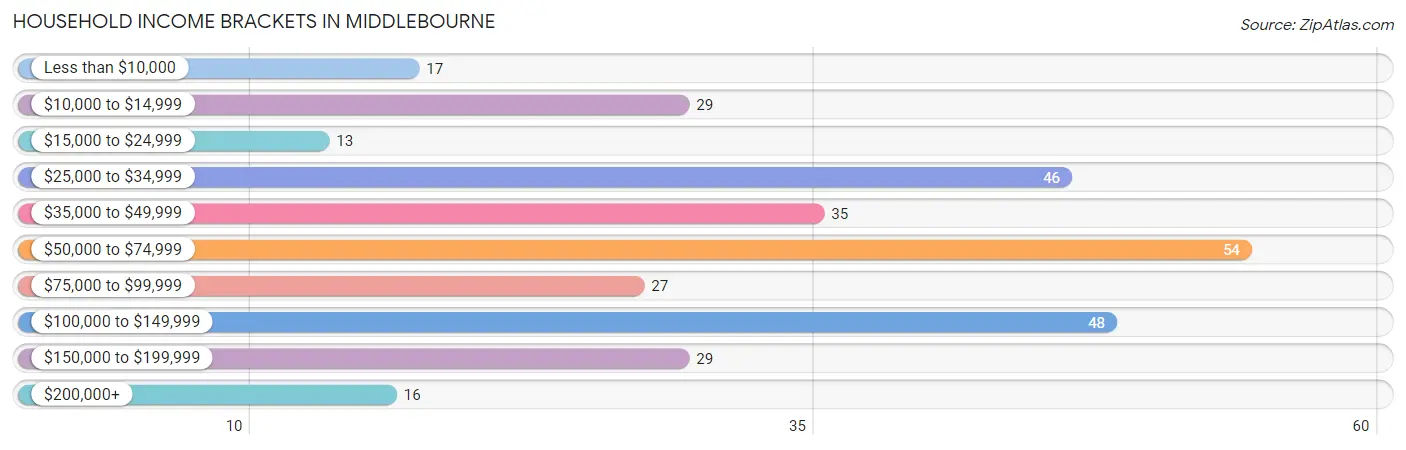
Household Income Brackets in Middlebourne
With 54 households falling in the category, the $50,000 to $74,999 income range is the most frequent in Middlebourne, accounting for 17.2% of all households. In contrast, only 13 households (4.1%) fall into the $15,000 to $24,999 income bracket, making it the least populous group.
| Income Bracket | # Households | % Households |
| Less than $10,000 | 17 | 5.4% |
| $10,000 to $14,999 | 29 | 9.2% |
| $15,000 to $24,999 | 13 | 4.1% |
| $25,000 to $34,999 | 46 | 14.6% |
| $35,000 to $49,999 | 35 | 11.1% |
| $50,000 to $74,999 | 54 | 17.2% |
| $75,000 to $99,999 | 27 | 8.6% |
| $100,000 to $149,999 | 48 | 15.3% |
| $150,000 to $199,999 | 29 | 9.2% |
| $200,000+ | 16 | 5.1% |
Household Income by Householder Age in Middlebourne
The median household income in Middlebourne is $62,000, with the highest median household income of $82,692 found in the 45 to 64 years age bracket for the primary householder. A total of 126 households (40.1%) fall into this category. Meanwhile, the 15 to 24 years age bracket for the primary householder has the lowest median household income of $0, with 6 households (1.9%) in this group.
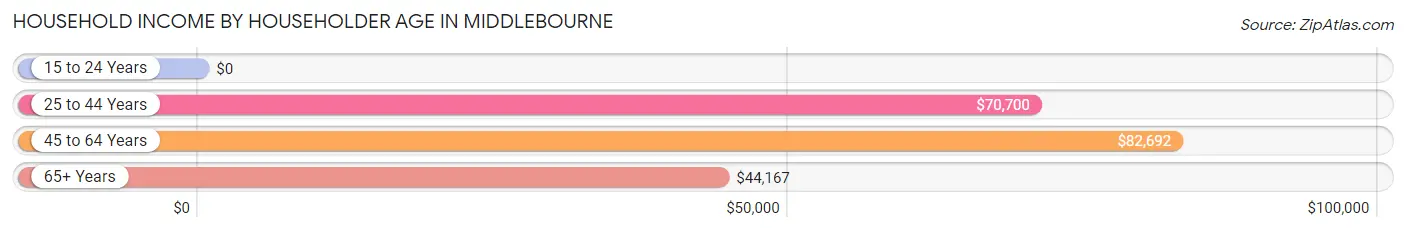
| Income Bracket | # Households | Median Income |
| 15 to 24 Years | 6 (1.9%) | $0 |
| 25 to 44 Years | 60 (19.1%) | $70,700 |
| 45 to 64 Years | 126 (40.1%) | $82,692 |
| 65+ Years | 122 (38.9%) | $44,167 |
| Total | 314 (100.0%) | $62,000 |
Poverty in Middlebourne
Income Below Poverty by Sex and Age in Middlebourne
With 10.1% poverty level for males and 21.2% for females among the residents of Middlebourne, 5 year old males and 5 year old females are the most vulnerable to poverty, with 9 males (100.0%) and 7 females (100.0%) in their respective age groups living below the poverty level.
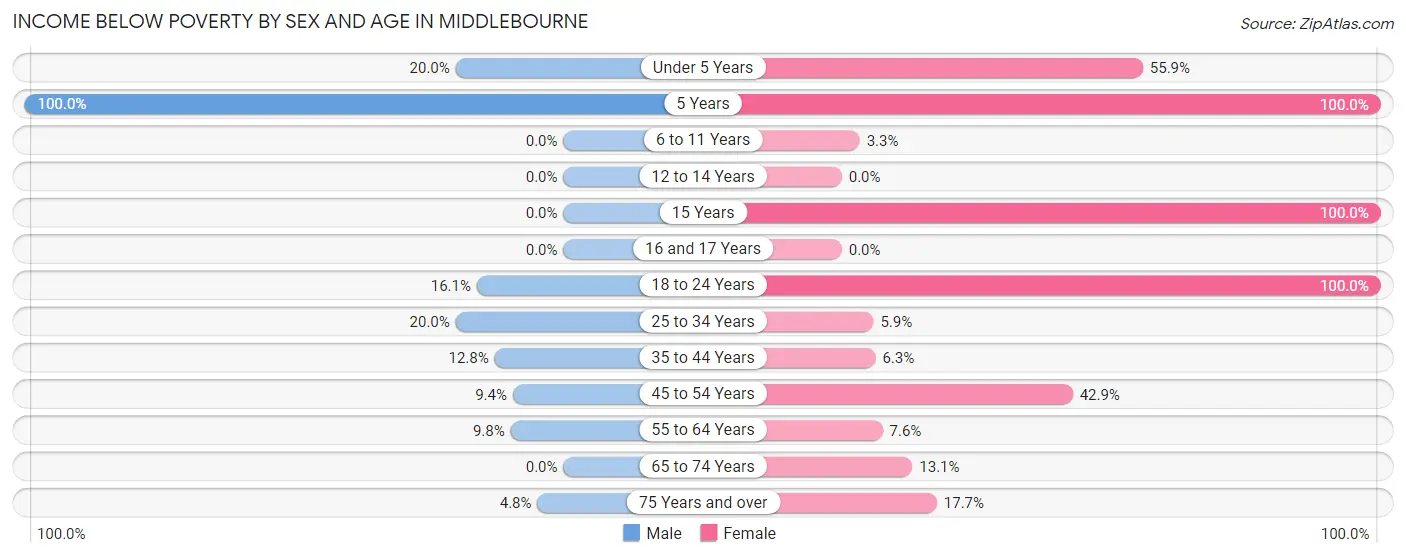
| Age Bracket | Male | Female |
| Under 5 Years | 1 (20.0%) | 19 (55.9%) |
| 5 Years | 9 (100.0%) | 7 (100.0%) |
| 6 to 11 Years | 0 (0.0%) | 1 (3.3%) |
| 12 to 14 Years | 0 (0.0%) | 0 (0.0%) |
| 15 Years | 0 (0.0%) | 3 (100.0%) |
| 16 and 17 Years | 0 (0.0%) | 0 (0.0%) |
| 18 to 24 Years | 9 (16.1%) | 15 (100.0%) |
| 25 to 34 Years | 5 (20.0%) | 2 (5.9%) |
| 35 to 44 Years | 6 (12.8%) | 1 (6.2%) |
| 45 to 54 Years | 6 (9.4%) | 12 (42.9%) |
| 55 to 64 Years | 5 (9.8%) | 5 (7.6%) |
| 65 to 74 Years | 0 (0.0%) | 11 (13.1%) |
| 75 Years and over | 4 (4.8%) | 3 (17.6%) |
| Total | 45 (10.1%) | 79 (21.2%) |
Income Above Poverty by Sex and Age in Middlebourne
According to the poverty statistics in Middlebourne, males aged 6 to 11 years and females aged 12 to 14 years are the age groups that are most secure financially, with 100.0% of males and 100.0% of females in these age groups living above the poverty line.
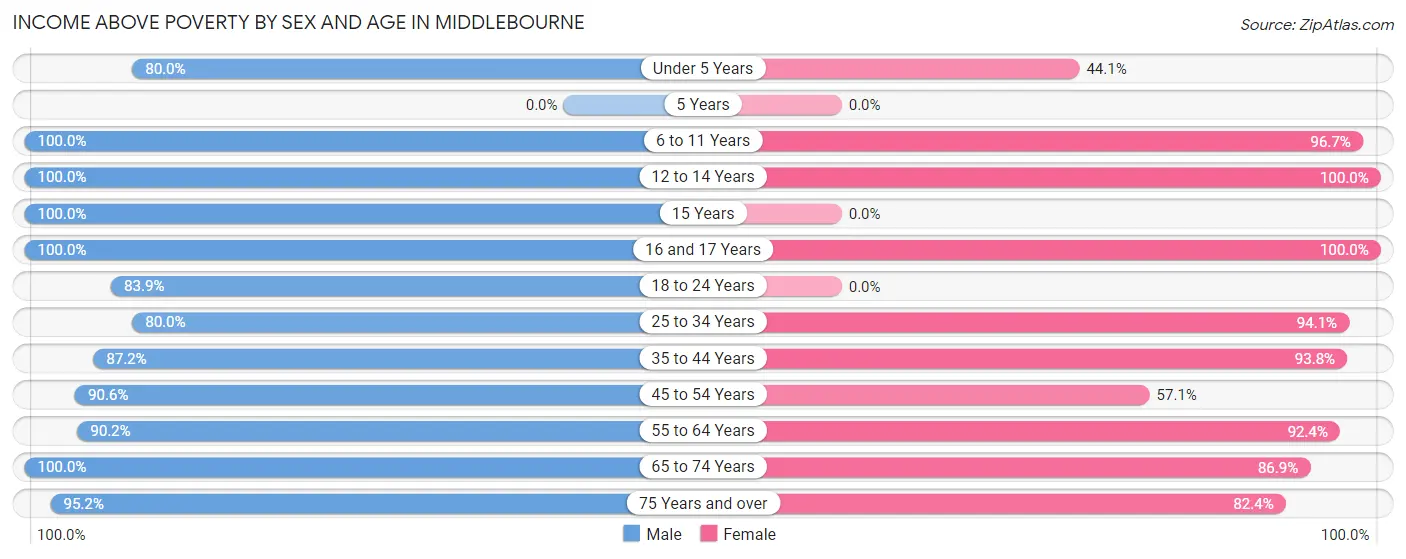
| Age Bracket | Male | Female |
| Under 5 Years | 4 (80.0%) | 15 (44.1%) |
| 5 Years | 0 (0.0%) | 0 (0.0%) |
| 6 to 11 Years | 1 (100.0%) | 29 (96.7%) |
| 12 to 14 Years | 14 (100.0%) | 4 (100.0%) |
| 15 Years | 39 (100.0%) | 0 (0.0%) |
| 16 and 17 Years | 12 (100.0%) | 34 (100.0%) |
| 18 to 24 Years | 47 (83.9%) | 0 (0.0%) |
| 25 to 34 Years | 20 (80.0%) | 32 (94.1%) |
| 35 to 44 Years | 41 (87.2%) | 15 (93.8%) |
| 45 to 54 Years | 58 (90.6%) | 16 (57.1%) |
| 55 to 64 Years | 46 (90.2%) | 61 (92.4%) |
| 65 to 74 Years | 39 (100.0%) | 73 (86.9%) |
| 75 Years and over | 79 (95.2%) | 14 (82.4%) |
| Total | 400 (89.9%) | 293 (78.8%) |
Income Below Poverty Among Married-Couple Families in Middlebourne
The poverty statistics for married-couple families in Middlebourne show that 4.5% or 5 of the total 112 families live below the poverty line. Families with no children have the highest poverty rate of 4.6%, comprising of 4 families. On the other hand, families with 3 or 4 children have the lowest poverty rate of 0.0%, which includes 0 families.
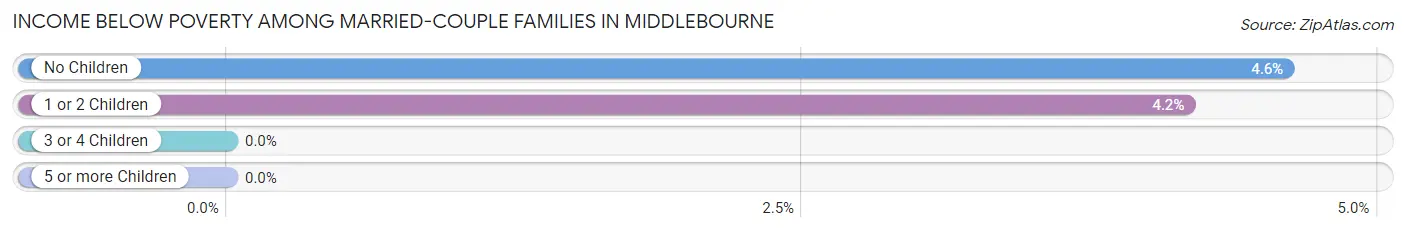
| Children | Above Poverty | Below Poverty |
| No Children | 83 (95.4%) | 4 (4.6%) |
| 1 or 2 Children | 23 (95.8%) | 1 (4.2%) |
| 3 or 4 Children | 1 (100.0%) | 0 (0.0%) |
| 5 or more Children | 0 (0.0%) | 0 (0.0%) |
| Total | 107 (95.5%) | 5 (4.5%) |
Income Below Poverty Among Single-Parent Households in Middlebourne
According to the poverty data in Middlebourne, 25.0% or 7 single-father households and 30.0% or 9 single-mother households are living below the poverty line. Among single-father households, those with 1 or 2 children have the highest poverty rate, with 5 households (100.0%) experiencing poverty. Likewise, among single-mother households, those with 1 or 2 children have the highest poverty rate, with 9 households (100.0%) falling below the poverty line.
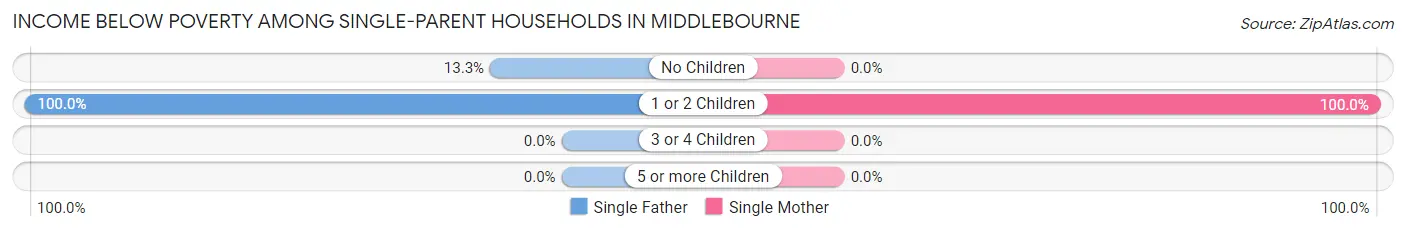
| Children | Single Father | Single Mother |
| No Children | 2 (13.3%) | 0 (0.0%) |
| 1 or 2 Children | 5 (100.0%) | 9 (100.0%) |
| 3 or 4 Children | 0 (0.0%) | 0 (0.0%) |
| 5 or more Children | 0 (0.0%) | 0 (0.0%) |
| Total | 7 (25.0%) | 9 (30.0%) |
Income Below Poverty Among Married-Couple vs Single-Parent Households in Middlebourne
The poverty data for Middlebourne shows that 5 of the married-couple family households (4.5%) and 16 of the single-parent households (27.6%) are living below the poverty level. Within the married-couple family households, those with no children have the highest poverty rate, with 4 households (4.6%) falling below the poverty line. Among the single-parent households, those with 1 or 2 children have the highest poverty rate, with 14 household (100.0%) living below poverty.
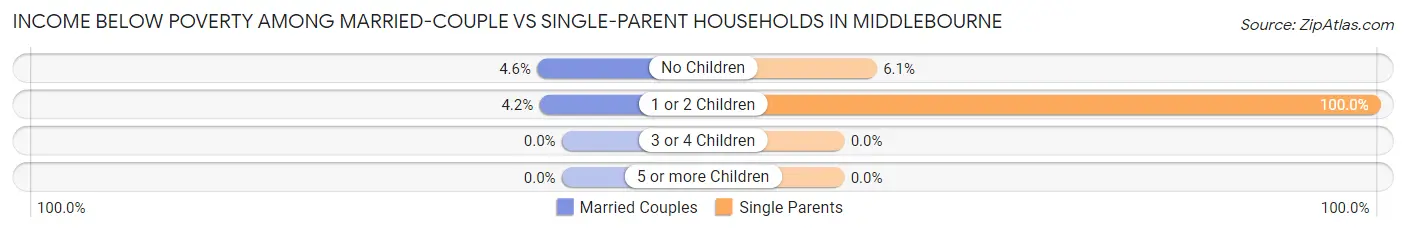
| Children | Married-Couple Families | Single-Parent Households |
| No Children | 4 (4.6%) | 2 (6.1%) |
| 1 or 2 Children | 1 (4.2%) | 14 (100.0%) |
| 3 or 4 Children | 0 (0.0%) | 0 (0.0%) |
| 5 or more Children | 0 (0.0%) | 0 (0.0%) |
| Total | 5 (4.5%) | 16 (27.6%) |
Race in Middlebourne
The most populous races in Middlebourne are White / Caucasian (794 | 95.7%), Two or more Races (35 | 4.2%), and Hispanic or Latino (16 | 1.9%).
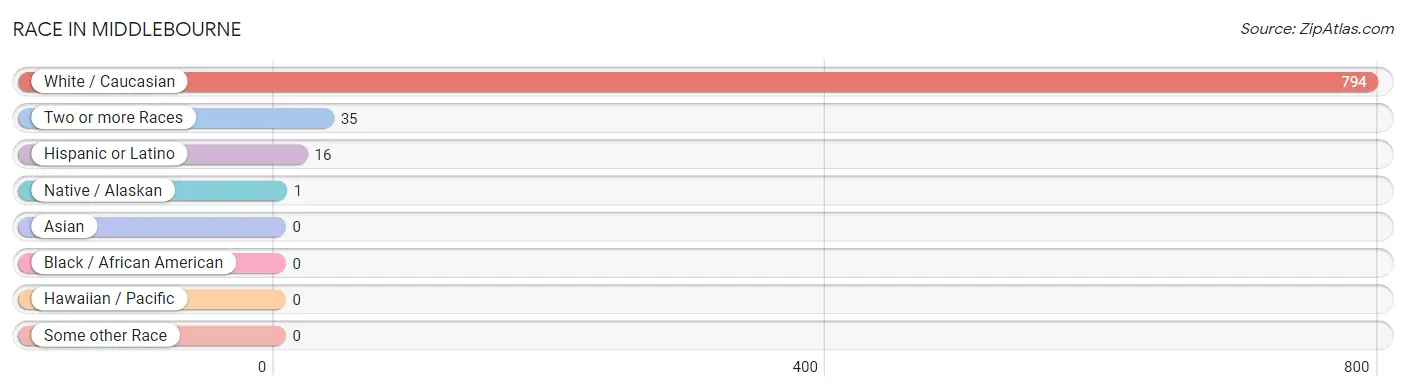
| Race | # Population | % Population |
| Asian | 0 | 0.0% |
| Black / African American | 0 | 0.0% |
| Hawaiian / Pacific | 0 | 0.0% |
| Hispanic or Latino | 16 | 1.9% |
| Native / Alaskan | 1 | 0.1% |
| White / Caucasian | 794 | 95.7% |
| Two or more Races | 35 | 4.2% |
| Some other Race | 0 | 0.0% |
| Total | 830 | 100.0% |
Ancestry in Middlebourne
The most populous ancestries reported in Middlebourne are German (175 | 21.1%), Irish (157 | 18.9%), English (123 | 14.8%), American (87 | 10.5%), and Slovene (59 | 7.1%), together accounting for 72.4% of all Middlebourne residents.
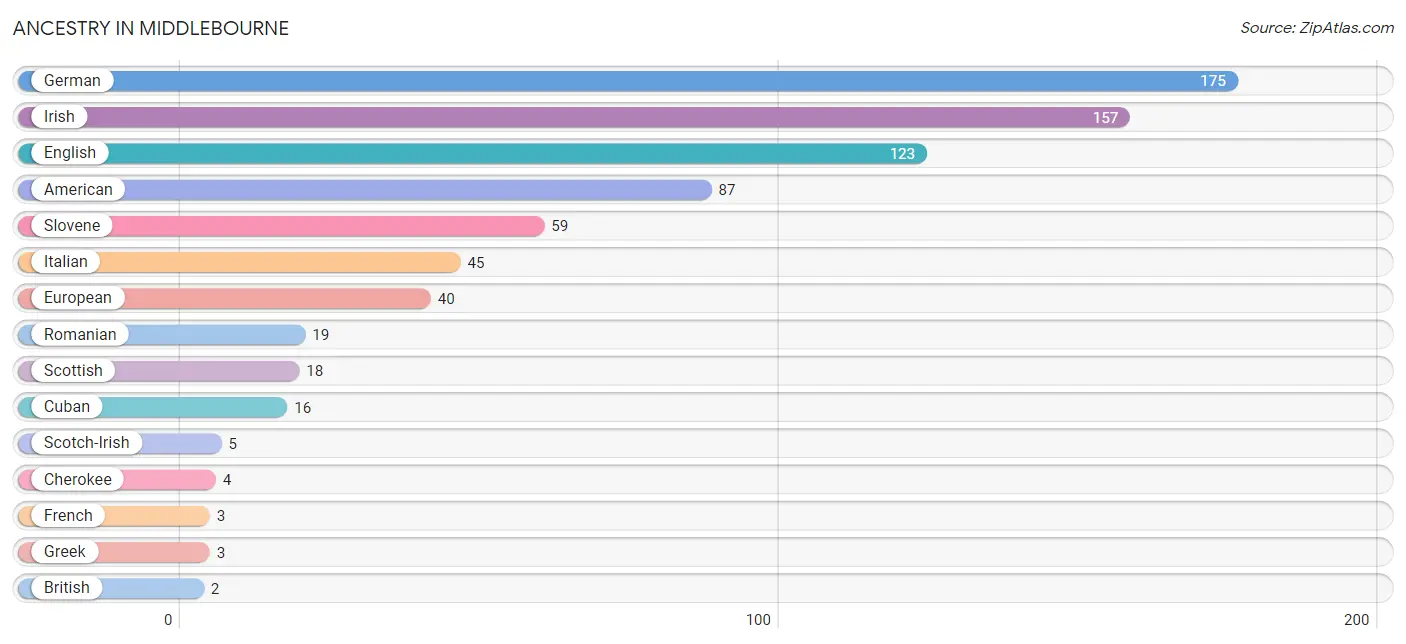
| Ancestry | # Population | % Population |
| American | 87 | 10.5% |
| British | 2 | 0.2% |
| Cherokee | 4 | 0.5% |
| Choctaw | 1 | 0.1% |
| Cuban | 16 | 1.9% |
| Dutch | 1 | 0.1% |
| English | 123 | 14.8% |
| European | 40 | 4.8% |
| French | 3 | 0.4% |
| German | 175 | 21.1% |
| Greek | 3 | 0.4% |
| Irish | 157 | 18.9% |
| Italian | 45 | 5.4% |
| Polish | 2 | 0.2% |
| Romanian | 19 | 2.3% |
| Scandinavian | 2 | 0.2% |
| Scotch-Irish | 5 | 0.6% |
| Scottish | 18 | 2.2% |
| Slovene | 59 | 7.1% | View All 19 Rows |
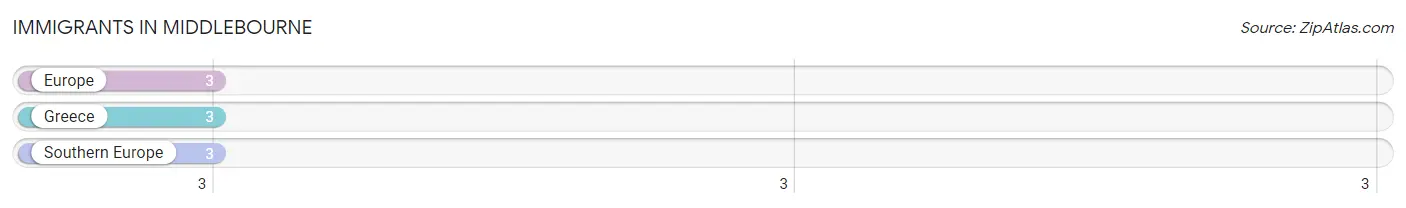
Immigrants in Middlebourne
The most numerous immigrant groups reported in Middlebourne came from Europe (3 | 0.4%), Greece (3 | 0.4%), and Southern Europe (3 | 0.4%), together accounting for 1.1% of all Middlebourne residents.
| Immigration Origin | # Population | % Population |
| Europe | 3 | 0.4% |
| Greece | 3 | 0.4% |
| Southern Europe | 3 | 0.4% | View All 3 Rows |
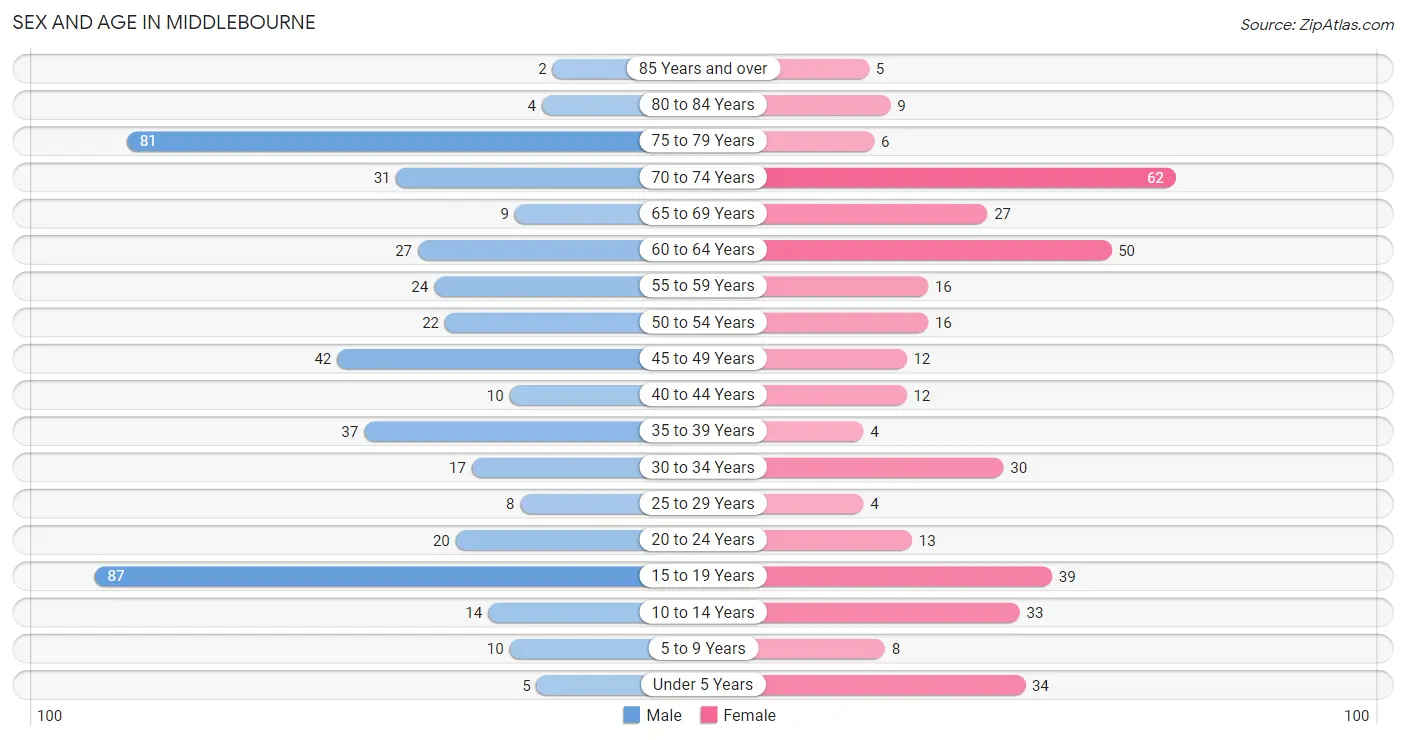
Sex and Age in Middlebourne
Sex and Age in Middlebourne
The most populous age groups in Middlebourne are 15 to 19 Years (87 | 19.3%) for men and 70 to 74 Years (62 | 16.3%) for women.
| Age Bracket | Male | Female |
| Under 5 Years | 5 (1.1%) | 34 (8.9%) |
| 5 to 9 Years | 10 (2.2%) | 8 (2.1%) |
| 10 to 14 Years | 14 (3.1%) | 33 (8.7%) |
| 15 to 19 Years | 87 (19.3%) | 39 (10.3%) |
| 20 to 24 Years | 20 (4.4%) | 13 (3.4%) |
| 25 to 29 Years | 8 (1.8%) | 4 (1.1%) |
| 30 to 34 Years | 17 (3.8%) | 30 (7.9%) |
| 35 to 39 Years | 37 (8.2%) | 4 (1.1%) |
| 40 to 44 Years | 10 (2.2%) | 12 (3.2%) |
| 45 to 49 Years | 42 (9.3%) | 12 (3.2%) |
| 50 to 54 Years | 22 (4.9%) | 16 (4.2%) |
| 55 to 59 Years | 24 (5.3%) | 16 (4.2%) |
| 60 to 64 Years | 27 (6.0%) | 50 (13.2%) |
| 65 to 69 Years | 9 (2.0%) | 27 (7.1%) |
| 70 to 74 Years | 31 (6.9%) | 62 (16.3%) |
| 75 to 79 Years | 81 (18.0%) | 6 (1.6%) |
| 80 to 84 Years | 4 (0.9%) | 9 (2.4%) |
| 85 Years and over | 2 (0.4%) | 5 (1.3%) |
| Total | 450 (100.0%) | 380 (100.0%) |
Families and Households in Middlebourne
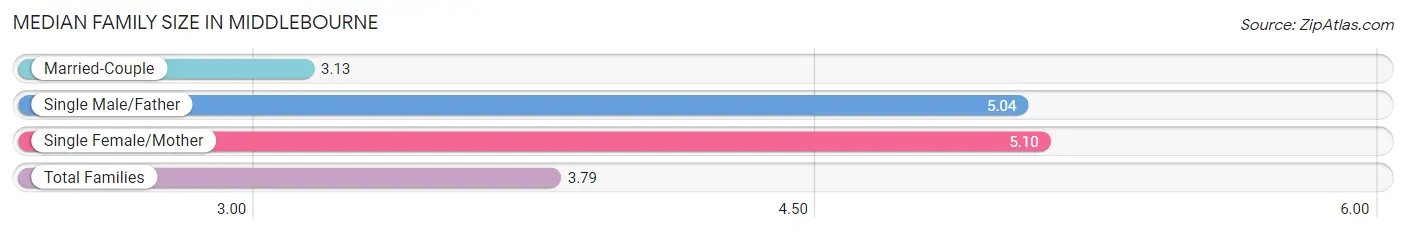
Median Family Size in Middlebourne
The median family size in Middlebourne is 3.79 persons per family, with single female/mother families (30 | 17.6%) accounting for the largest median family size of 5.1 persons per family. On the other hand, married-couple families (112 | 65.9%) represent the smallest median family size with 3.13 persons per family.
| Family Type | # Families | Family Size |
| Married-Couple | 112 (65.9%) | 3.13 |
| Single Male/Father | 28 (16.5%) | 5.04 |
| Single Female/Mother | 30 (17.6%) | 5.10 |
| Total Families | 170 (100.0%) | 3.79 |
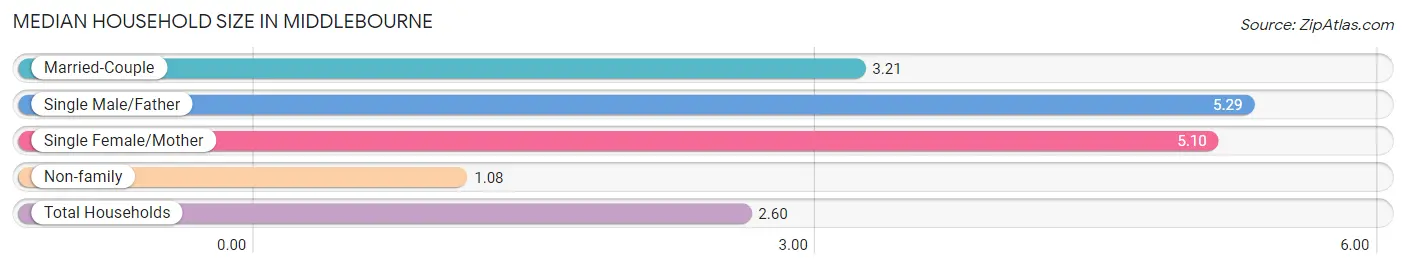
Median Household Size in Middlebourne
The median household size in Middlebourne is 2.60 persons per household, with single male/father households (28 | 8.9%) accounting for the largest median household size of 5.29 persons per household. non-family households (144 | 45.9%) represent the smallest median household size with 1.08 persons per household.
| Household Type | # Households | Household Size |
| Married-Couple | 112 (35.7%) | 3.21 |
| Single Male/Father | 28 (8.9%) | 5.29 |
| Single Female/Mother | 30 (9.6%) | 5.10 |
| Non-family | 144 (45.9%) | 1.08 |
| Total Households | 314 (100.0%) | 2.60 |
Household Size by Marriage Status in Middlebourne
Out of a total of 314 households in Middlebourne, 170 (54.1%) are family households, while 144 (45.9%) are nonfamily households. The most numerous type of family households are 2-person households, comprising 117, and the most common type of nonfamily households are 1-person households, comprising 127.
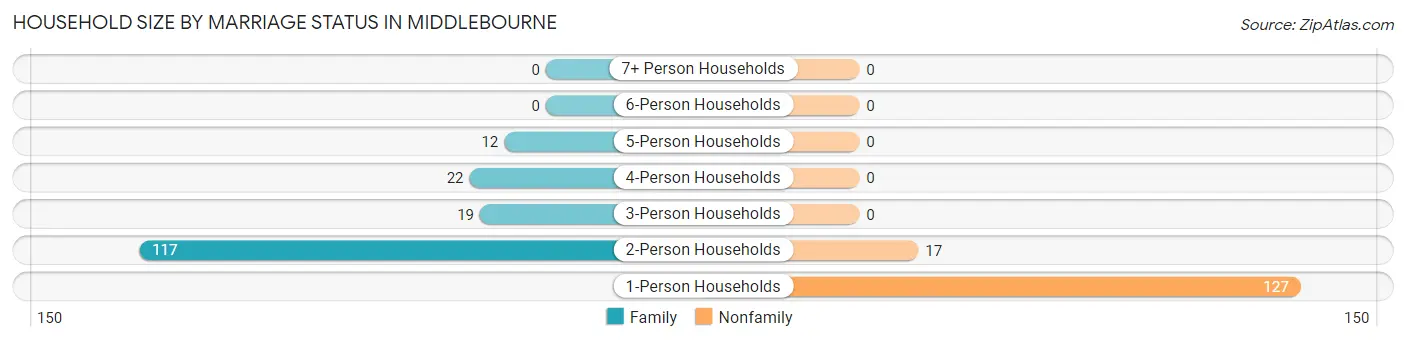
| Household Size | Family Households | Nonfamily Households |
| 1-Person Households | - | 127 (40.5%) |
| 2-Person Households | 117 (37.3%) | 17 (5.4%) |
| 3-Person Households | 19 (6.0%) | 0 (0.0%) |
| 4-Person Households | 22 (7.0%) | 0 (0.0%) |
| 5-Person Households | 12 (3.8%) | 0 (0.0%) |
| 6-Person Households | 0 (0.0%) | 0 (0.0%) |
| 7+ Person Households | 0 (0.0%) | 0 (0.0%) |
| Total | 170 (54.1%) | 144 (45.9%) |
Female Fertility in Middlebourne
Fertility by Age in Middlebourne
| Age Bracket | Women with Births | Births / 1,000 Women |
| 15 to 19 years | 0 (0.0%) | 0.0 |
| 20 to 34 years | 0 (0.0%) | 0.0 |
| 35 to 50 years | 0 (0.0%) | 0.0 |
| Total | 0 (0.0%) | 0.0 |
Fertility by Age by Marriage Status in Middlebourne
| Age Bracket | Married | Unmarried |
| 15 to 19 years | 0 (0.0%) | 0 (0.0%) |
| 20 to 34 years | 0 (0.0%) | 0 (0.0%) |
| 35 to 50 years | 0 (0.0%) | 0 (0.0%) |
| Total | 0 (0.0%) | 0 (0.0%) |
Fertility by Education in Middlebourne
| Educational Attainment | Women with Births | Births / 1,000 Women |
| Less than High School | 0 (0.0%) | 0.0 |
| High School Diploma | 0 (0.0%) | 0.0 |
| College or Associate's Degree | 0 (0.0%) | 0.0 |
| Bachelor's Degree | 0 (0.0%) | 0.0 |
| Graduate Degree | 0 (0.0%) | 0.0 |
| Total | 0 (0.0%) | 0.0 |
Fertility by Education by Marriage Status in Middlebourne
| Educational Attainment | Married | Unmarried |
| Less than High School | 0 (0.0%) | 0 (0.0%) |
| High School Diploma | 0 (0.0%) | 0 (0.0%) |
| College or Associate's Degree | 0 (0.0%) | 0 (0.0%) |
| Bachelor's Degree | 0 (0.0%) | 0 (0.0%) |
| Graduate Degree | 0 (0.0%) | 0 (0.0%) |
| Total | 0 (0.0%) | 0 (0.0%) |
Employment Characteristics in Middlebourne
Employment by Class of Employer in Middlebourne
Among the 277 employed individuals in Middlebourne, private company employees (181 | 65.3%), local government employees (63 | 22.7%), and state government employees (11 | 4.0%) make up the most common classes of employment.
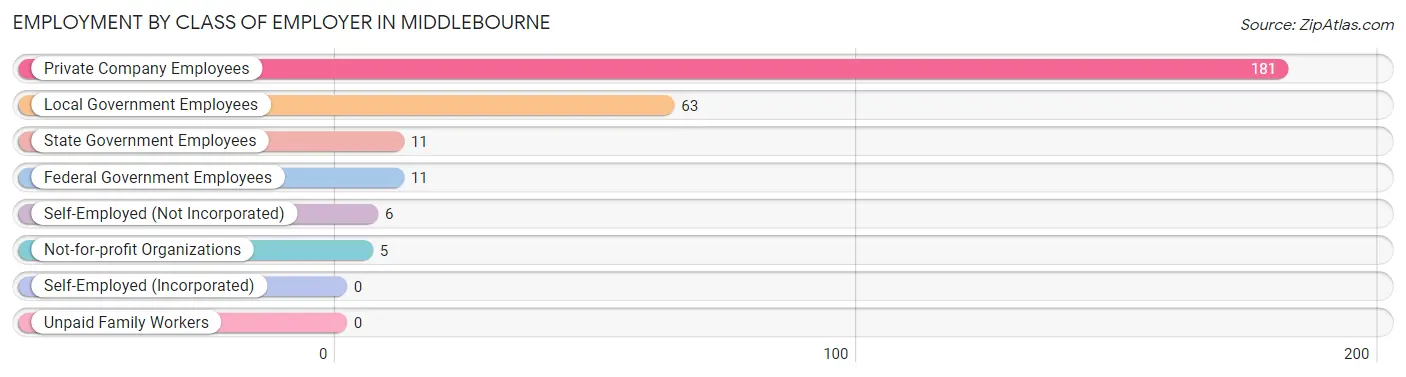
| Employer Class | # Employees | % Employees |
| Private Company Employees | 181 | 65.3% |
| Self-Employed (Incorporated) | 0 | 0.0% |
| Self-Employed (Not Incorporated) | 6 | 2.2% |
| Not-for-profit Organizations | 5 | 1.8% |
| Local Government Employees | 63 | 22.7% |
| State Government Employees | 11 | 4.0% |
| Federal Government Employees | 11 | 4.0% |
| Unpaid Family Workers | 0 | 0.0% |
| Total | 277 | 100.0% |
Employment Status by Age in Middlebourne
According to the labor force statistics for Middlebourne, out of the total population over 16 years of age (684), 42.1% or 288 individuals are in the labor force, with 3.8% or 11 of them unemployed. The age group with the highest labor force participation rate is 35 to 44 years, with 90.5% or 57 individuals in the labor force. Within the labor force, the 35 to 44 years age range has the highest percentage of unemployed individuals, with 15.8% or 9 of them being unemployed.
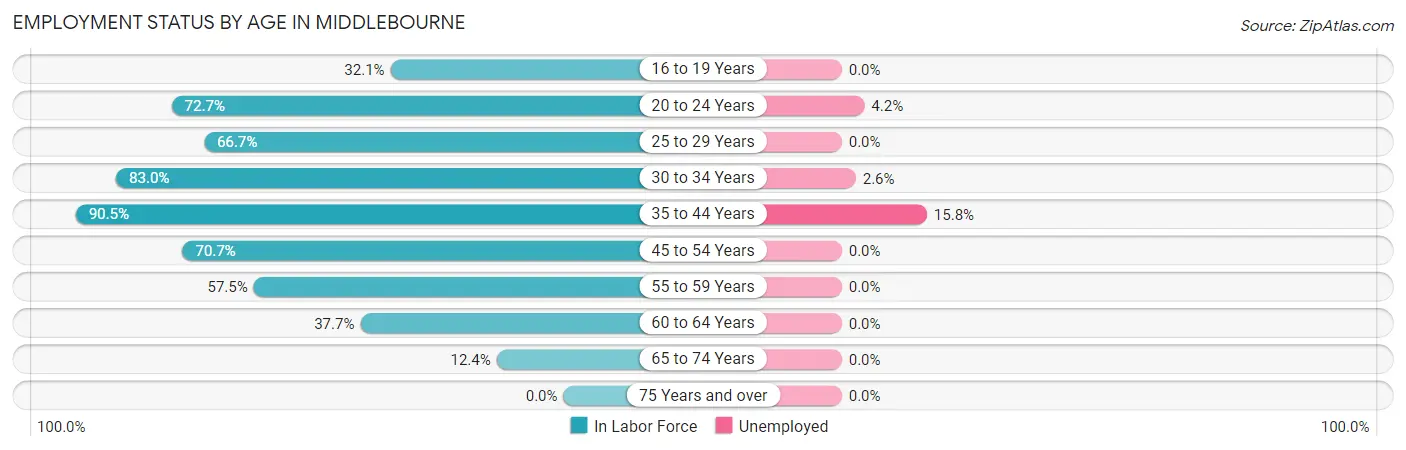
| Age Bracket | In Labor Force | Unemployed |
| 16 to 19 Years | 27 (32.1%) | 0 (0.0%) |
| 20 to 24 Years | 24 (72.7%) | 1 (4.2%) |
| 25 to 29 Years | 8 (66.7%) | 0 (0.0%) |
| 30 to 34 Years | 39 (83.0%) | 1 (2.6%) |
| 35 to 44 Years | 57 (90.5%) | 9 (15.8%) |
| 45 to 54 Years | 65 (70.7%) | 0 (0.0%) |
| 55 to 59 Years | 23 (57.5%) | 0 (0.0%) |
| 60 to 64 Years | 29 (37.7%) | 0 (0.0%) |
| 65 to 74 Years | 16 (12.4%) | 0 (0.0%) |
| 75 Years and over | 0 (0.0%) | 0 (0.0%) |
| Total | 288 (42.1%) | 11 (3.8%) |
Employment Status by Educational Attainment in Middlebourne
According to labor force statistics for Middlebourne, 66.8% of individuals (221) out of the total population between 25 and 64 years of age (331) are in the labor force, with 4.5% or 10 of them being unemployed. The group with the highest labor force participation rate are those with the educational attainment of bachelor's degree or higher, with 95.5% or 64 individuals in the labor force. Within the labor force, individuals with high school diploma education have the highest percentage of unemployment, with 9.0% or 6 of them being unemployed.
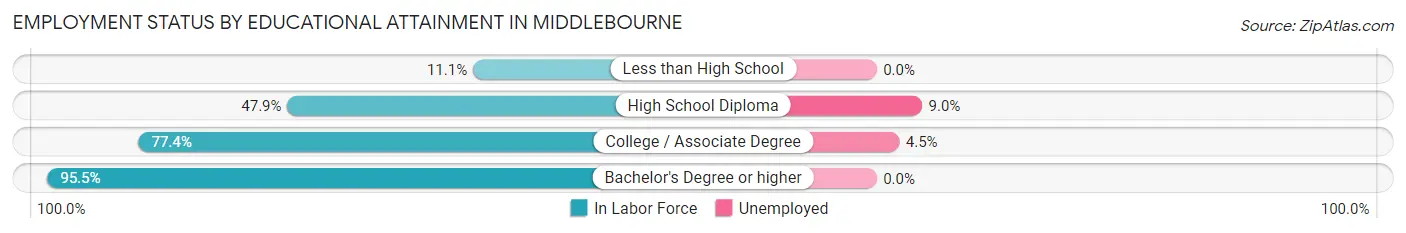
| Educational Attainment | In Labor Force | Unemployed |
| Less than High School | 1 (11.1%) | 0 (0.0%) |
| High School Diploma | 67 (47.9%) | 13 (9.0%) |
| College / Associate Degree | 89 (77.4%) | 5 (4.5%) |
| Bachelor's Degree or higher | 64 (95.5%) | 0 (0.0%) |
| Total | 221 (66.8%) | 15 (4.5%) |
Employment Occupations by Sex in Middlebourne
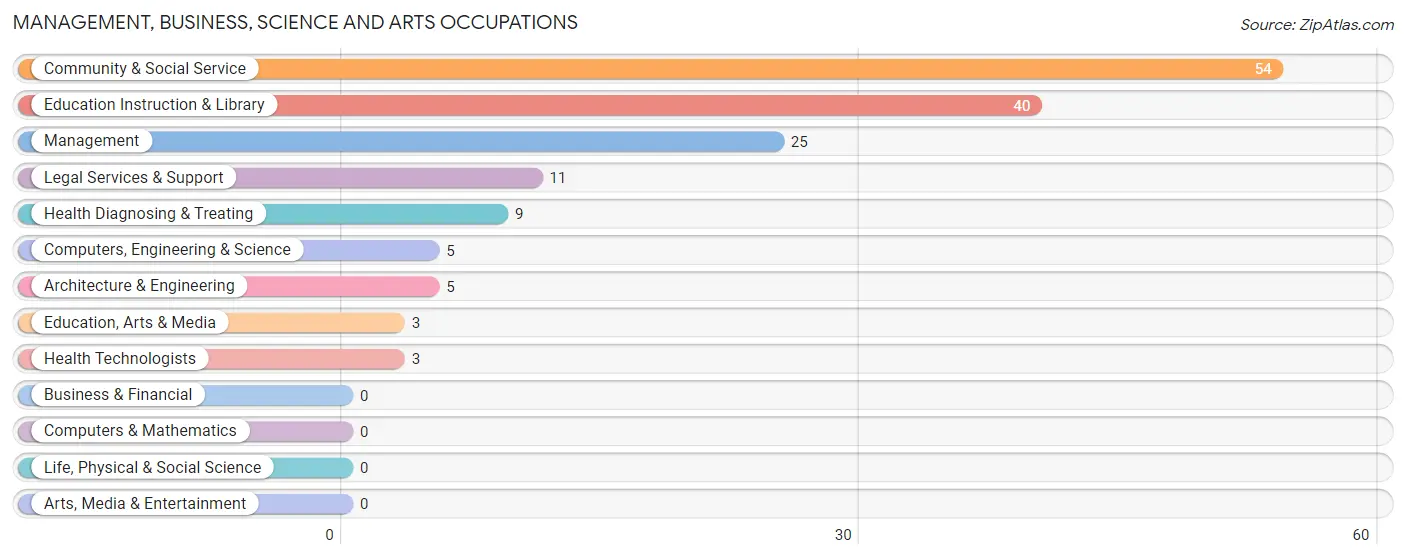
Management, Business, Science and Arts Occupations
The most common Management, Business, Science and Arts occupations in Middlebourne are Community & Social Service (54 | 19.5%), Education Instruction & Library (40 | 14.4%), Management (25 | 9.0%), Legal Services & Support (11 | 4.0%), and Health Diagnosing & Treating (9 | 3.3%).
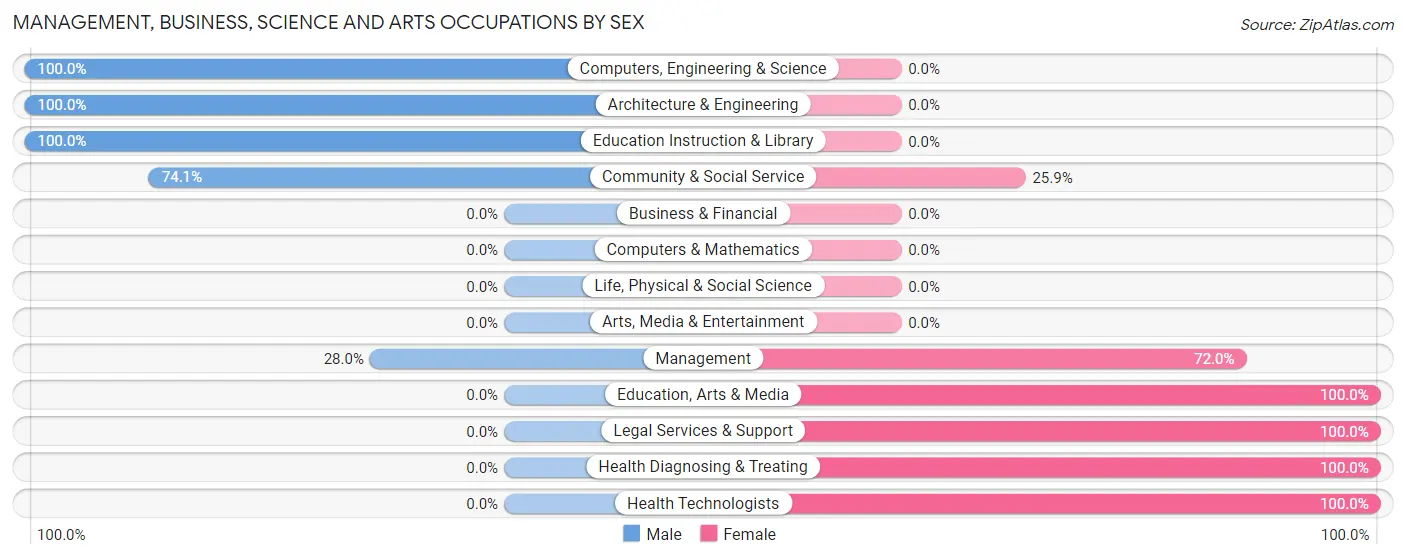
Management, Business, Science and Arts Occupations by Sex
Within the Management, Business, Science and Arts occupations in Middlebourne, the most male-oriented occupations are Computers, Engineering & Science (100.0%), Architecture & Engineering (100.0%), and Education Instruction & Library (100.0%), while the most female-oriented occupations are Education, Arts & Media (100.0%), Legal Services & Support (100.0%), and Health Diagnosing & Treating (100.0%).
| Occupation | Male | Female |
| Management | 7 (28.0%) | 18 (72.0%) |
| Business & Financial | 0 (0.0%) | 0 (0.0%) |
| Computers, Engineering & Science | 5 (100.0%) | 0 (0.0%) |
| Computers & Mathematics | 0 (0.0%) | 0 (0.0%) |
| Architecture & Engineering | 5 (100.0%) | 0 (0.0%) |
| Life, Physical & Social Science | 0 (0.0%) | 0 (0.0%) |
| Community & Social Service | 40 (74.1%) | 14 (25.9%) |
| Education, Arts & Media | 0 (0.0%) | 3 (100.0%) |
| Legal Services & Support | 0 (0.0%) | 11 (100.0%) |
| Education Instruction & Library | 40 (100.0%) | 0 (0.0%) |
| Arts, Media & Entertainment | 0 (0.0%) | 0 (0.0%) |
| Health Diagnosing & Treating | 0 (0.0%) | 9 (100.0%) |
| Health Technologists | 0 (0.0%) | 3 (100.0%) |
| Total (Category) | 52 (55.9%) | 41 (44.1%) |
| Total (Overall) | 188 (67.9%) | 89 (32.1%) |
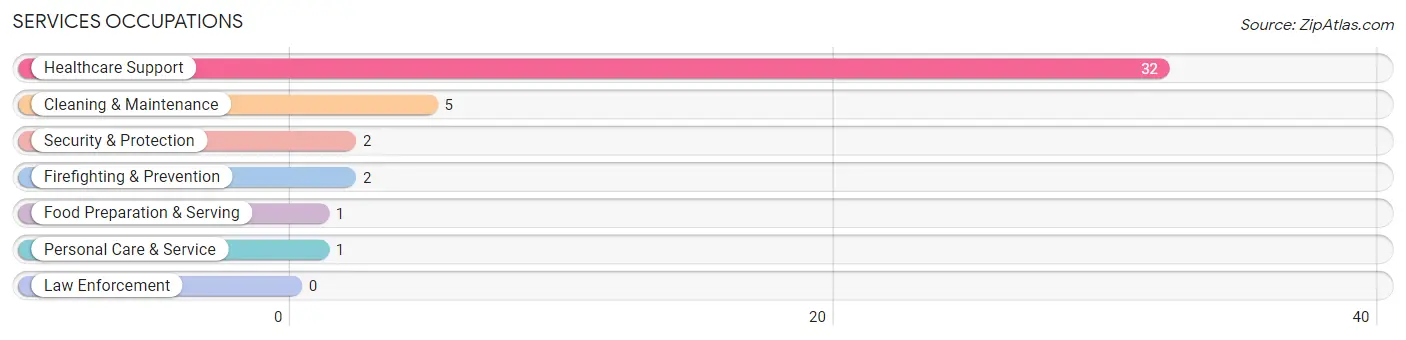
Services Occupations
The most common Services occupations in Middlebourne are Healthcare Support (32 | 11.6%), Cleaning & Maintenance (5 | 1.8%), Security & Protection (2 | 0.7%), Firefighting & Prevention (2 | 0.7%), and Food Preparation & Serving (1 | 0.4%).
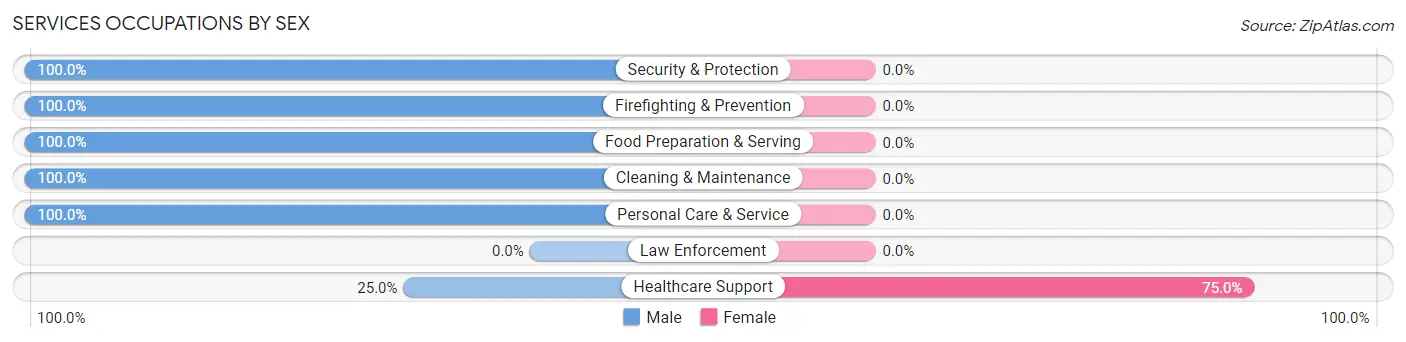
Services Occupations by Sex
| Occupation | Male | Female |
| Healthcare Support | 8 (25.0%) | 24 (75.0%) |
| Security & Protection | 2 (100.0%) | 0 (0.0%) |
| Firefighting & Prevention | 2 (100.0%) | 0 (0.0%) |
| Law Enforcement | 0 (0.0%) | 0 (0.0%) |
| Food Preparation & Serving | 1 (100.0%) | 0 (0.0%) |
| Cleaning & Maintenance | 5 (100.0%) | 0 (0.0%) |
| Personal Care & Service | 1 (100.0%) | 0 (0.0%) |
| Total (Category) | 17 (41.5%) | 24 (58.5%) |
| Total (Overall) | 188 (67.9%) | 89 (32.1%) |
Sales and Office Occupations
The most common Sales and Office occupations in Middlebourne are Sales & Related (28 | 10.1%), and Office & Administration (13 | 4.7%).
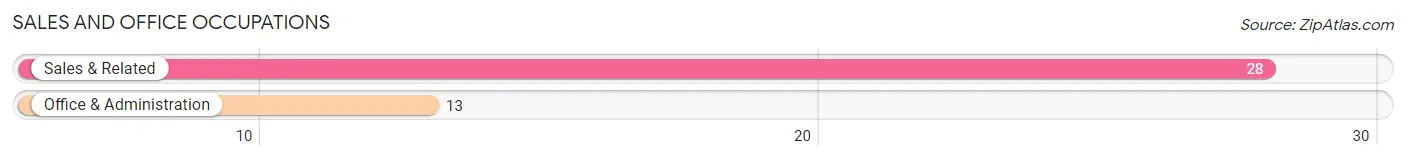
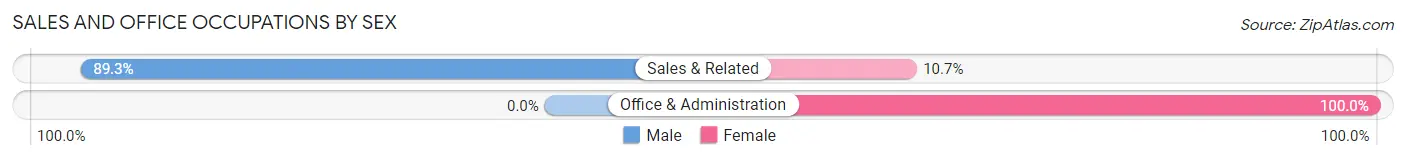
Sales and Office Occupations by Sex
| Occupation | Male | Female |
| Sales & Related | 25 (89.3%) | 3 (10.7%) |
| Office & Administration | 0 (0.0%) | 13 (100.0%) |
| Total (Category) | 25 (61.0%) | 16 (39.0%) |
| Total (Overall) | 188 (67.9%) | 89 (32.1%) |
Natural Resources, Construction and Maintenance Occupations
The most common Natural Resources, Construction and Maintenance occupations in Middlebourne are Construction & Extraction (49 | 17.7%), and Installation, Maintenance & Repair (2 | 0.7%).
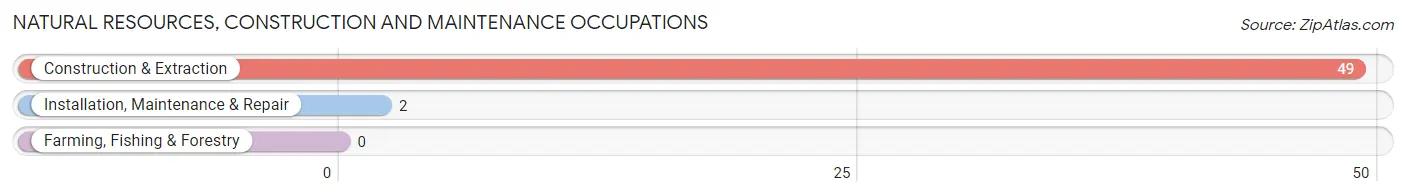
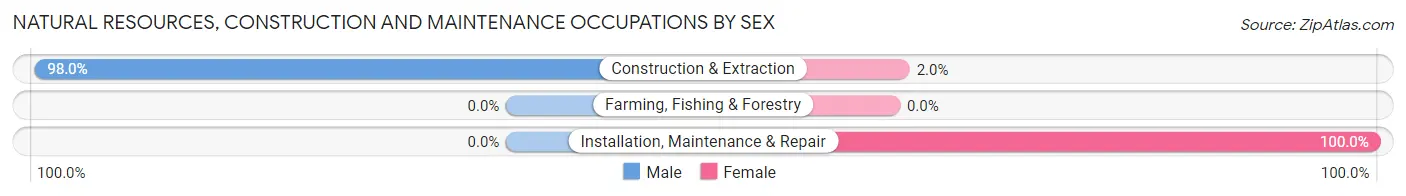
Natural Resources, Construction and Maintenance Occupations by Sex
| Occupation | Male | Female |
| Farming, Fishing & Forestry | 0 (0.0%) | 0 (0.0%) |
| Construction & Extraction | 48 (98.0%) | 1 (2.0%) |
| Installation, Maintenance & Repair | 0 (0.0%) | 2 (100.0%) |
| Total (Category) | 48 (94.1%) | 3 (5.9%) |
| Total (Overall) | 188 (67.9%) | 89 (32.1%) |
Production, Transportation and Moving Occupations
The most common Production, Transportation and Moving occupations in Middlebourne are Production (37 | 13.4%), and Transportation (14 | 5.1%).
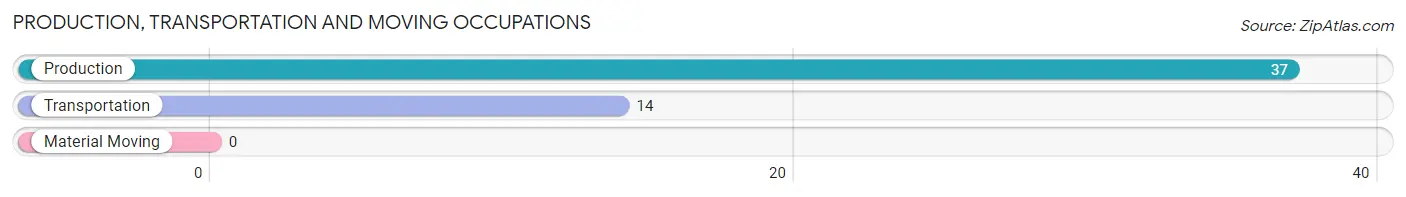
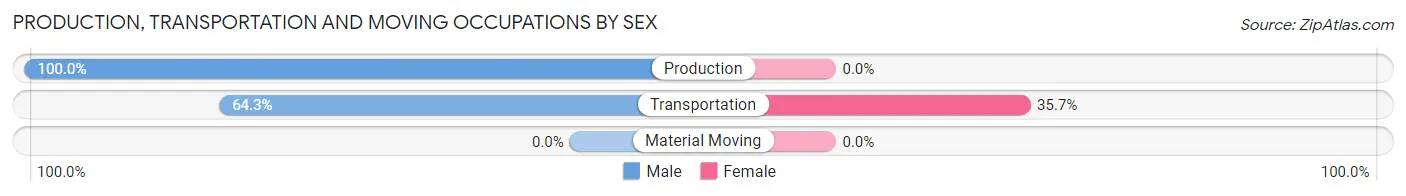
Production, Transportation and Moving Occupations by Sex
| Occupation | Male | Female |
| Production | 37 (100.0%) | 0 (0.0%) |
| Transportation | 9 (64.3%) | 5 (35.7%) |
| Material Moving | 0 (0.0%) | 0 (0.0%) |
| Total (Category) | 46 (90.2%) | 5 (9.8%) |
| Total (Overall) | 188 (67.9%) | 89 (32.1%) |
Employment Industries by Sex in Middlebourne
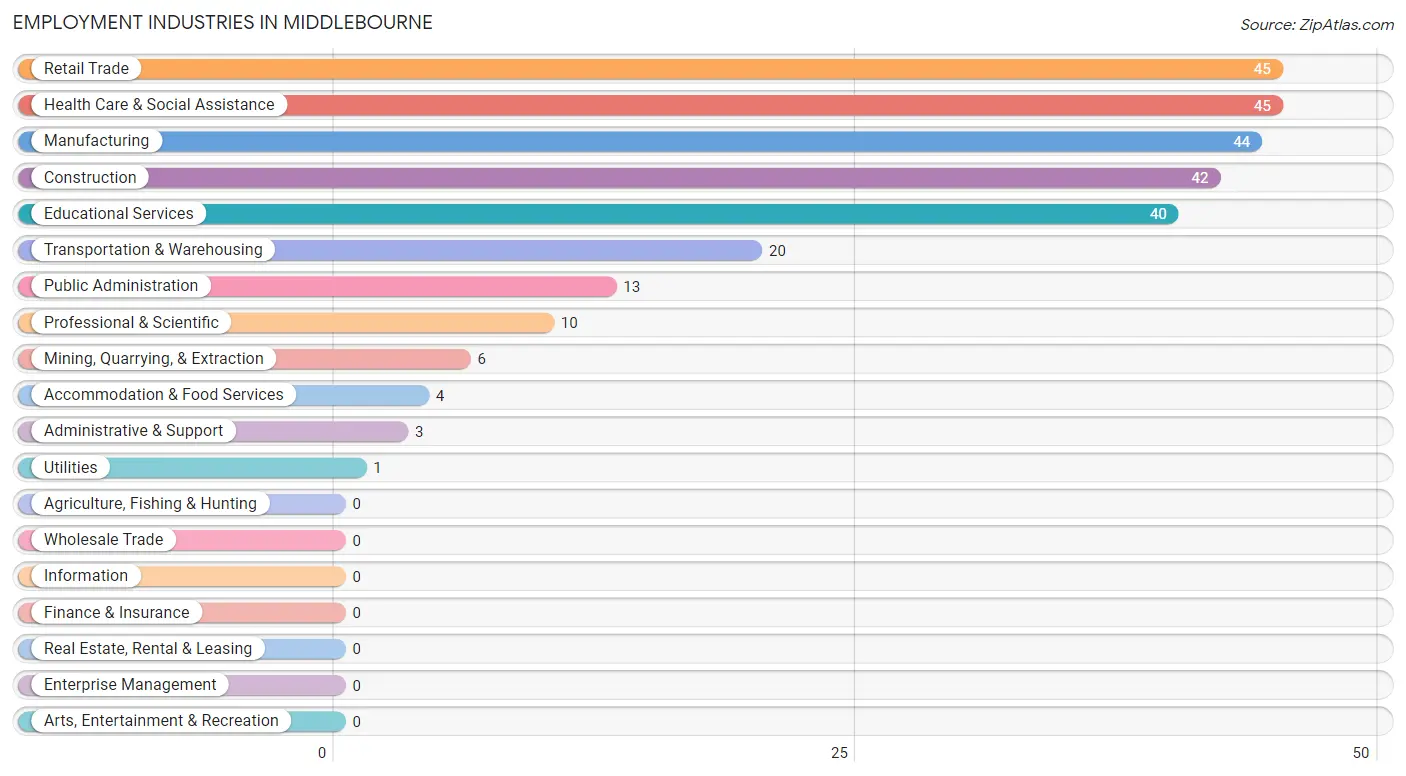
Employment Industries in Middlebourne
The major employment industries in Middlebourne include Retail Trade (45 | 16.3%), Health Care & Social Assistance (45 | 16.3%), Manufacturing (44 | 15.9%), Construction (42 | 15.2%), and Educational Services (40 | 14.4%).
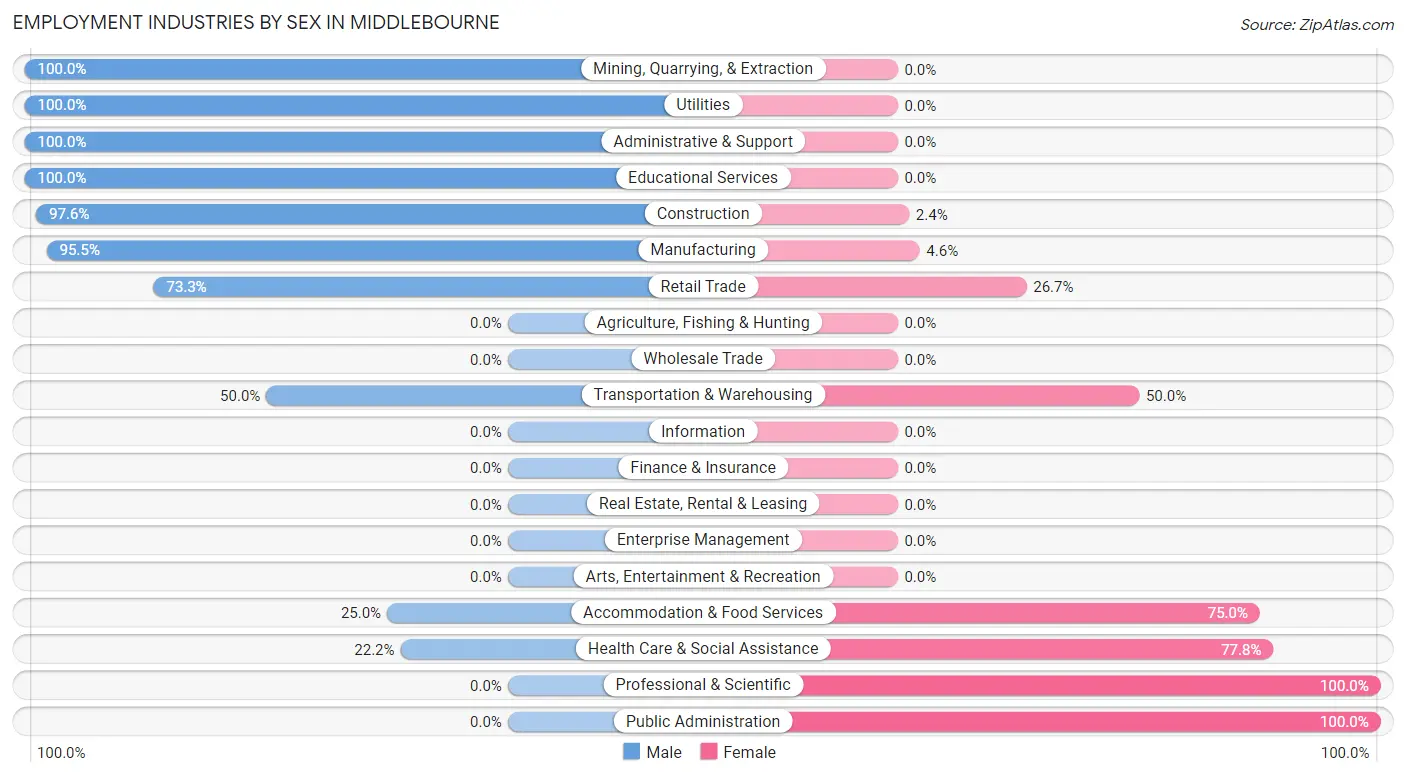
Employment Industries by Sex in Middlebourne
The Middlebourne industries that see more men than women are Mining, Quarrying, & Extraction (100.0%), Utilities (100.0%), and Administrative & Support (100.0%), whereas the industries that tend to have a higher number of women are Professional & Scientific (100.0%), Public Administration (100.0%), and Health Care & Social Assistance (77.8%).
| Industry | Male | Female |
| Agriculture, Fishing & Hunting | 0 (0.0%) | 0 (0.0%) |
| Mining, Quarrying, & Extraction | 6 (100.0%) | 0 (0.0%) |
| Construction | 41 (97.6%) | 1 (2.4%) |
| Manufacturing | 42 (95.5%) | 2 (4.5%) |
| Wholesale Trade | 0 (0.0%) | 0 (0.0%) |
| Retail Trade | 33 (73.3%) | 12 (26.7%) |
| Transportation & Warehousing | 10 (50.0%) | 10 (50.0%) |
| Utilities | 1 (100.0%) | 0 (0.0%) |
| Information | 0 (0.0%) | 0 (0.0%) |
| Finance & Insurance | 0 (0.0%) | 0 (0.0%) |
| Real Estate, Rental & Leasing | 0 (0.0%) | 0 (0.0%) |
| Professional & Scientific | 0 (0.0%) | 10 (100.0%) |
| Enterprise Management | 0 (0.0%) | 0 (0.0%) |
| Administrative & Support | 3 (100.0%) | 0 (0.0%) |
| Educational Services | 40 (100.0%) | 0 (0.0%) |
| Health Care & Social Assistance | 10 (22.2%) | 35 (77.8%) |
| Arts, Entertainment & Recreation | 0 (0.0%) | 0 (0.0%) |
| Accommodation & Food Services | 1 (25.0%) | 3 (75.0%) |
| Public Administration | 0 (0.0%) | 13 (100.0%) |
| Total | 188 (67.9%) | 89 (32.1%) |
Education in Middlebourne
School Enrollment in Middlebourne
The most common levels of schooling among the 189 students in Middlebourne are high school (107 | 56.6%), middle school (47 | 24.9%), and graduate / professional (19 | 10.1%).
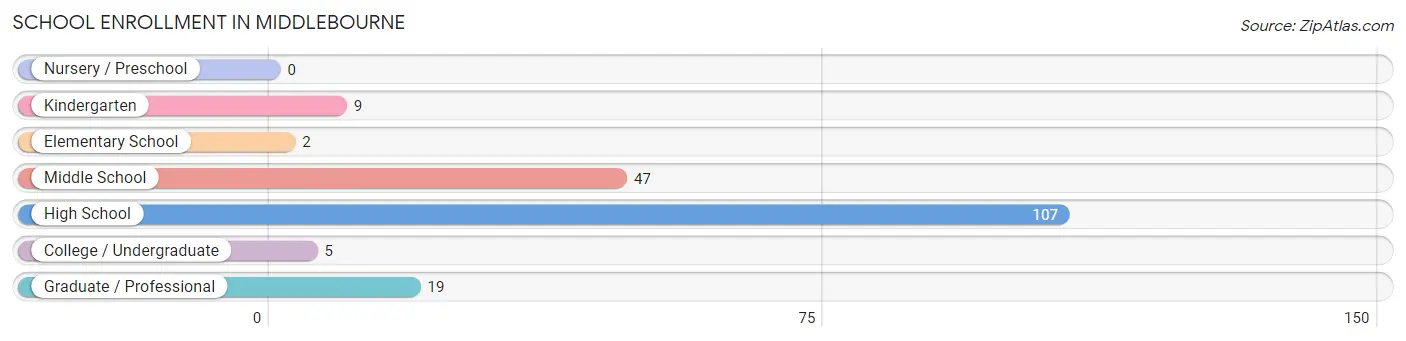
| School Level | # Students | % Students |
| Nursery / Preschool | 0 | 0.0% |
| Kindergarten | 9 | 4.8% |
| Elementary School | 2 | 1.1% |
| Middle School | 47 | 24.9% |
| High School | 107 | 56.6% |
| College / Undergraduate | 5 | 2.6% |
| Graduate / Professional | 19 | 10.1% |
| Total | 189 | 100.0% |
School Enrollment by Age by Funding Source in Middlebourne
Out of a total of 189 students who are enrolled in schools in Middlebourne, 21 (11.1%) attend a private institution, while the remaining 168 (88.9%) are enrolled in public schools. The age group of 25 to 34 year olds has the highest likelihood of being enrolled in private schools, with 19 (100.0% in the age bracket) enrolled. Conversely, the age group of 5 to 9 year old has the lowest likelihood of being enrolled in a private school, with 11 (100.0% in the age bracket) attending a public institution.
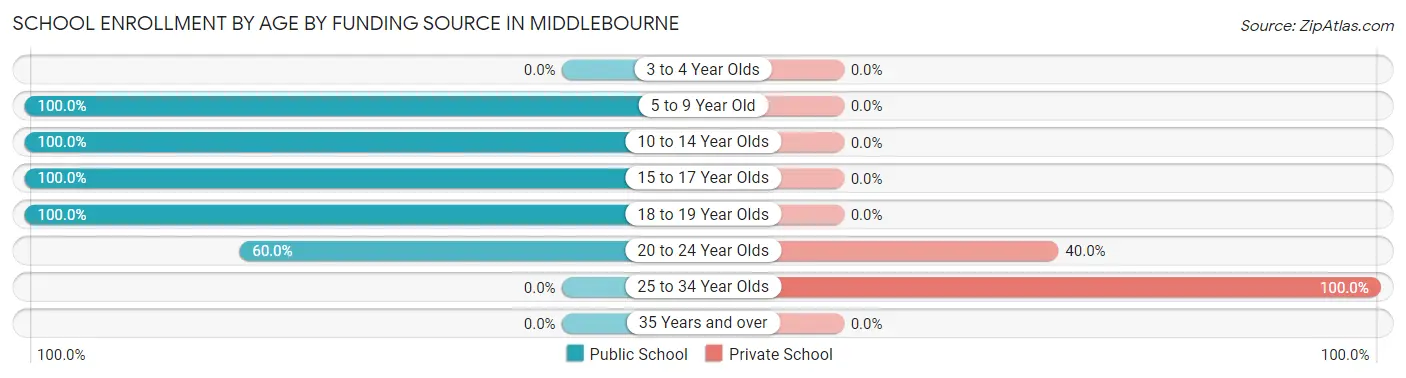
| Age Bracket | Public School | Private School |
| 3 to 4 Year Olds | 0 (0.0%) | 0 (0.0%) |
| 5 to 9 Year Old | 11 (100.0%) | 0 (0.0%) |
| 10 to 14 Year Olds | 47 (100.0%) | 0 (0.0%) |
| 15 to 17 Year Olds | 88 (100.0%) | 0 (0.0%) |
| 18 to 19 Year Olds | 19 (100.0%) | 0 (0.0%) |
| 20 to 24 Year Olds | 3 (60.0%) | 2 (40.0%) |
| 25 to 34 Year Olds | 0 (0.0%) | 19 (100.0%) |
| 35 Years and over | 0 (0.0%) | 0 (0.0%) |
| Total | 168 (88.9%) | 21 (11.1%) |
Educational Attainment by Field of Study in Middlebourne
Education (92 | 38.7%), science & technology (68 | 28.6%), visual & performing arts (28 | 11.8%), engineering (16 | 6.7%), and computers & mathematics (8 | 3.4%) are the most common fields of study among 238 individuals in Middlebourne who have obtained a bachelor's degree or higher.
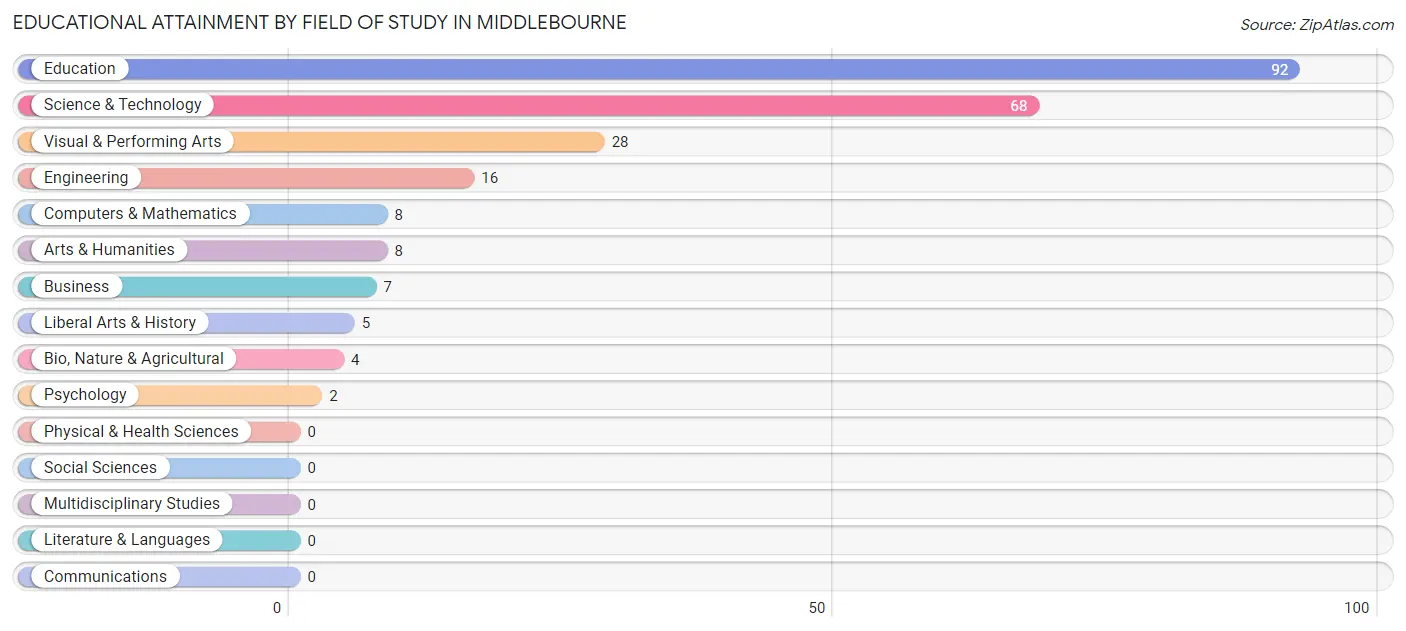
| Field of Study | # Graduates | % Graduates |
| Computers & Mathematics | 8 | 3.4% |
| Bio, Nature & Agricultural | 4 | 1.7% |
| Physical & Health Sciences | 0 | 0.0% |
| Psychology | 2 | 0.8% |
| Social Sciences | 0 | 0.0% |
| Engineering | 16 | 6.7% |
| Multidisciplinary Studies | 0 | 0.0% |
| Science & Technology | 68 | 28.6% |
| Business | 7 | 2.9% |
| Education | 92 | 38.7% |
| Literature & Languages | 0 | 0.0% |
| Liberal Arts & History | 5 | 2.1% |
| Visual & Performing Arts | 28 | 11.8% |
| Communications | 0 | 0.0% |
| Arts & Humanities | 8 | 3.4% |
| Total | 238 | 100.0% |
Transportation & Commute in Middlebourne
Vehicle Availability by Sex in Middlebourne
The most prevalent vehicle ownership categories in Middlebourne are males with 2 vehicles (58, accounting for 30.8%) and females with 2 vehicles (22, making up 65.2%).
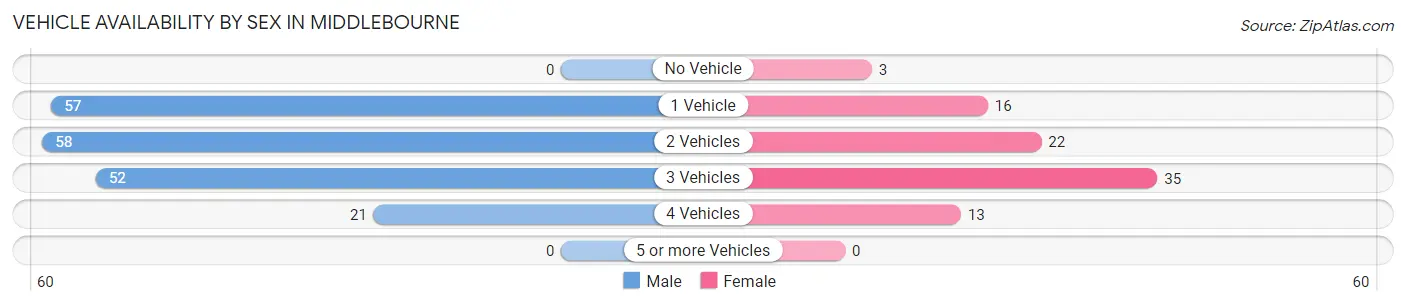
| Vehicles Available | Male | Female |
| No Vehicle | 0 (0.0%) | 3 (3.4%) |
| 1 Vehicle | 57 (30.3%) | 16 (18.0%) |
| 2 Vehicles | 58 (30.8%) | 22 (24.7%) |
| 3 Vehicles | 52 (27.7%) | 35 (39.3%) |
| 4 Vehicles | 21 (11.2%) | 13 (14.6%) |
| 5 or more Vehicles | 0 (0.0%) | 0 (0.0%) |
| Total | 188 (100.0%) | 89 (100.0%) |
Commute Time in Middlebourne
The most frequently occuring commute durations in Middlebourne are 5 to 9 minutes (73 commuters, 26.7%), 30 to 34 minutes (67 commuters, 24.5%), and 15 to 19 minutes (36 commuters, 13.2%).
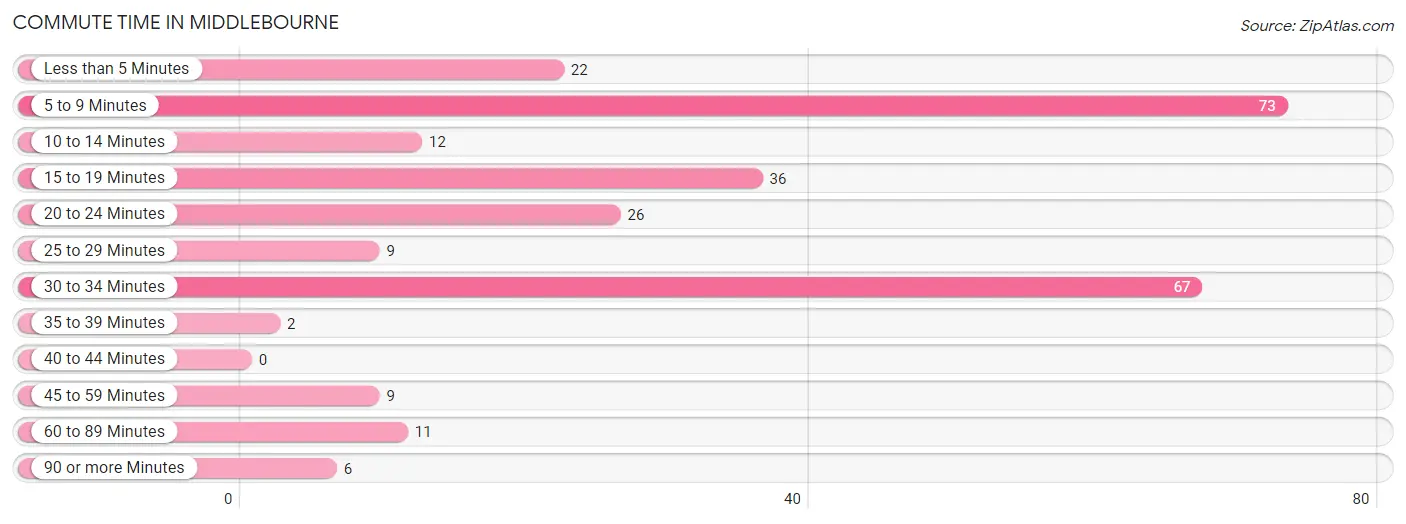
| Commute Time | # Commuters | % Commuters |
| Less than 5 Minutes | 22 | 8.1% |
| 5 to 9 Minutes | 73 | 26.7% |
| 10 to 14 Minutes | 12 | 4.4% |
| 15 to 19 Minutes | 36 | 13.2% |
| 20 to 24 Minutes | 26 | 9.5% |
| 25 to 29 Minutes | 9 | 3.3% |
| 30 to 34 Minutes | 67 | 24.5% |
| 35 to 39 Minutes | 2 | 0.7% |
| 40 to 44 Minutes | 0 | 0.0% |
| 45 to 59 Minutes | 9 | 3.3% |
| 60 to 89 Minutes | 11 | 4.0% |
| 90 or more Minutes | 6 | 2.2% |
Commute Time by Sex in Middlebourne
The most common commute times in Middlebourne are 5 to 9 minutes (43 commuters, 23.4%) for males and 5 to 9 minutes (30 commuters, 33.7%) for females.
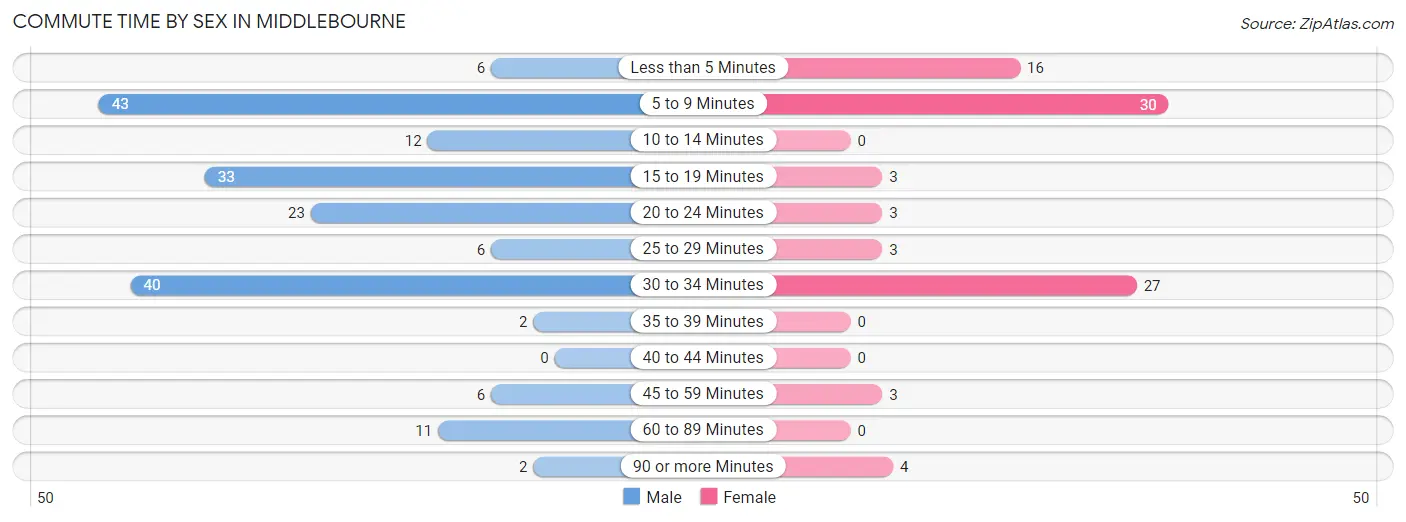
| Commute Time | Male | Female |
| Less than 5 Minutes | 6 (3.3%) | 16 (18.0%) |
| 5 to 9 Minutes | 43 (23.4%) | 30 (33.7%) |
| 10 to 14 Minutes | 12 (6.5%) | 0 (0.0%) |
| 15 to 19 Minutes | 33 (17.9%) | 3 (3.4%) |
| 20 to 24 Minutes | 23 (12.5%) | 3 (3.4%) |
| 25 to 29 Minutes | 6 (3.3%) | 3 (3.4%) |
| 30 to 34 Minutes | 40 (21.7%) | 27 (30.3%) |
| 35 to 39 Minutes | 2 (1.1%) | 0 (0.0%) |
| 40 to 44 Minutes | 0 (0.0%) | 0 (0.0%) |
| 45 to 59 Minutes | 6 (3.3%) | 3 (3.4%) |
| 60 to 89 Minutes | 11 (6.0%) | 0 (0.0%) |
| 90 or more Minutes | 2 (1.1%) | 4 (4.5%) |
Time of Departure to Work by Sex in Middlebourne
The most frequent times of departure to work in Middlebourne are 6:30 AM to 6:59 AM (41, 22.3%) for males and 5:00 AM to 5:29 AM (19, 21.3%) for females.
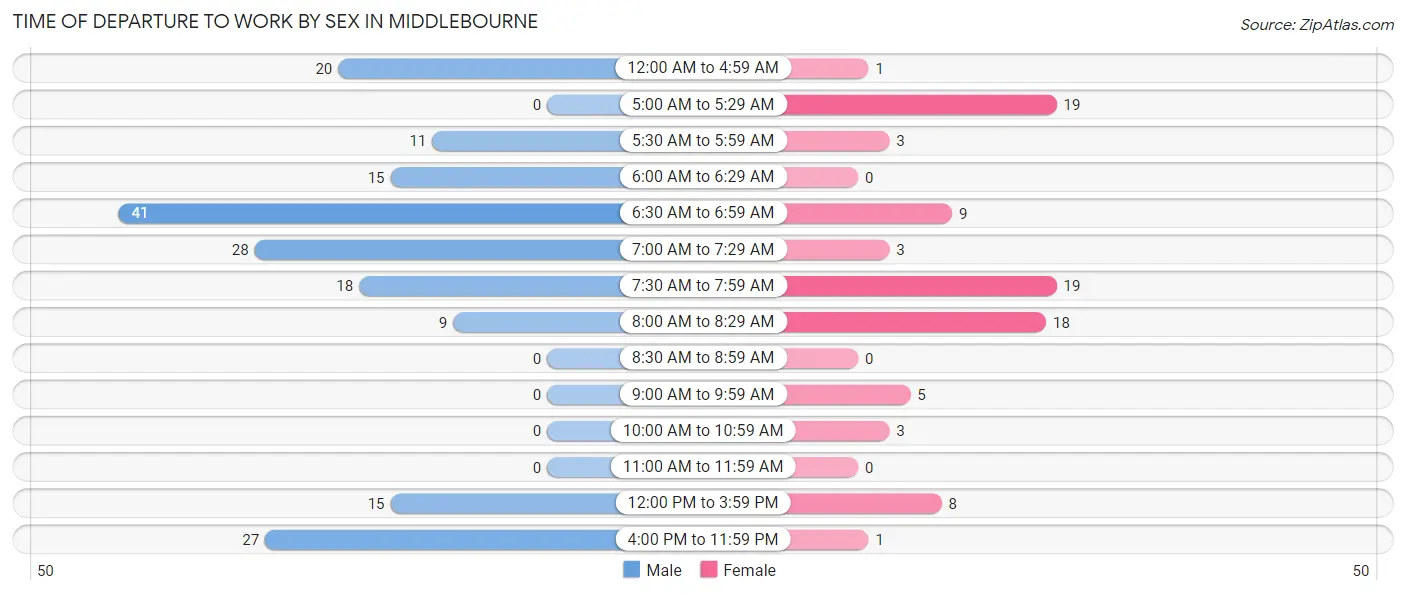
| Time of Departure | Male | Female |
| 12:00 AM to 4:59 AM | 20 (10.9%) | 1 (1.1%) |
| 5:00 AM to 5:29 AM | 0 (0.0%) | 19 (21.3%) |
| 5:30 AM to 5:59 AM | 11 (6.0%) | 3 (3.4%) |
| 6:00 AM to 6:29 AM | 15 (8.2%) | 0 (0.0%) |
| 6:30 AM to 6:59 AM | 41 (22.3%) | 9 (10.1%) |
| 7:00 AM to 7:29 AM | 28 (15.2%) | 3 (3.4%) |
| 7:30 AM to 7:59 AM | 18 (9.8%) | 19 (21.3%) |
| 8:00 AM to 8:29 AM | 9 (4.9%) | 18 (20.2%) |
| 8:30 AM to 8:59 AM | 0 (0.0%) | 0 (0.0%) |
| 9:00 AM to 9:59 AM | 0 (0.0%) | 5 (5.6%) |
| 10:00 AM to 10:59 AM | 0 (0.0%) | 3 (3.4%) |
| 11:00 AM to 11:59 AM | 0 (0.0%) | 0 (0.0%) |
| 12:00 PM to 3:59 PM | 15 (8.2%) | 8 (9.0%) |
| 4:00 PM to 11:59 PM | 27 (14.7%) | 1 (1.1%) |
| Total | 184 (100.0%) | 89 (100.0%) |
Housing Occupancy in Middlebourne
Occupancy by Ownership in Middlebourne
Of the total 314 dwellings in Middlebourne, owner-occupied units account for 231 (73.6%), while renter-occupied units make up 83 (26.4%).
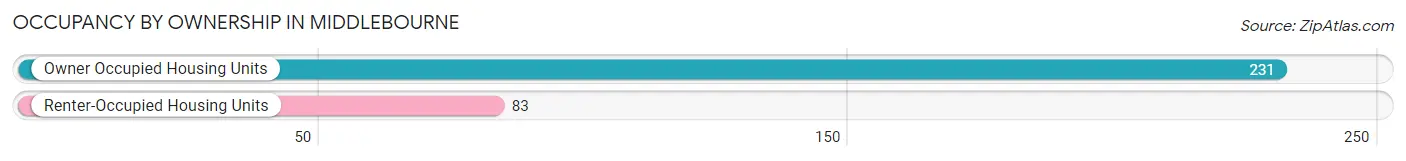
| Occupancy | # Housing Units | % Housing Units |
| Owner Occupied Housing Units | 231 | 73.6% |
| Renter-Occupied Housing Units | 83 | 26.4% |
| Total Occupied Housing Units | 314 | 100.0% |
Occupancy by Household Size in Middlebourne
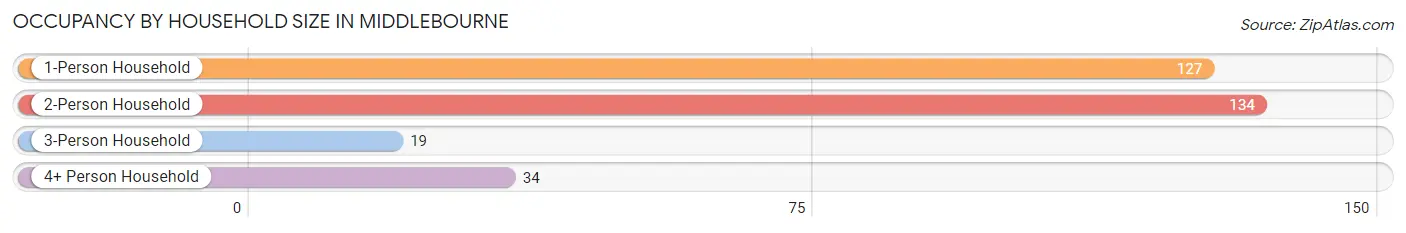
| Household Size | # Housing Units | % Housing Units |
| 1-Person Household | 127 | 40.5% |
| 2-Person Household | 134 | 42.7% |
| 3-Person Household | 19 | 6.0% |
| 4+ Person Household | 34 | 10.8% |
| Total Housing Units | 314 | 100.0% |
Occupancy by Ownership by Household Size in Middlebourne
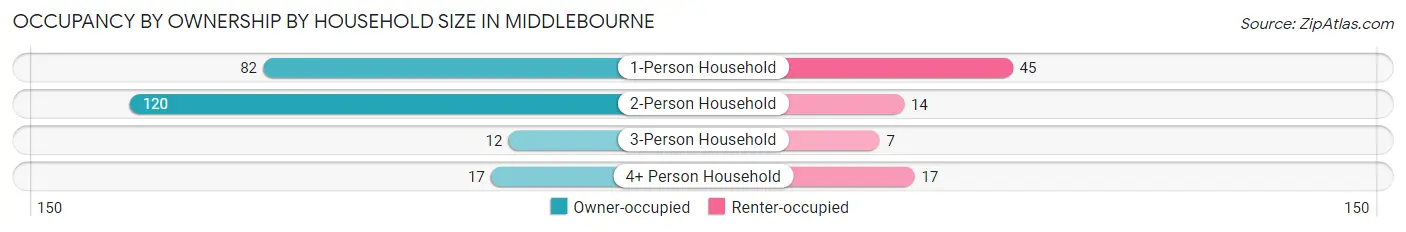
| Household Size | Owner-occupied | Renter-occupied |
| 1-Person Household | 82 (64.6%) | 45 (35.4%) |
| 2-Person Household | 120 (89.5%) | 14 (10.4%) |
| 3-Person Household | 12 (63.2%) | 7 (36.8%) |
| 4+ Person Household | 17 (50.0%) | 17 (50.0%) |
| Total Housing Units | 231 (73.6%) | 83 (26.4%) |
Occupancy by Educational Attainment in Middlebourne
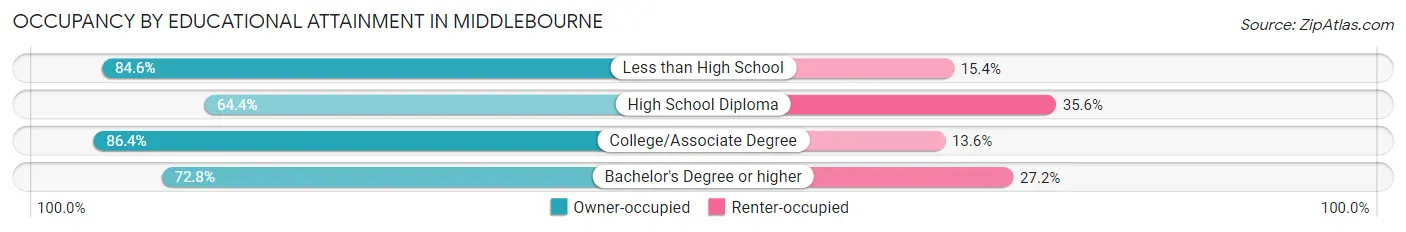
| Household Size | Owner-occupied | Renter-occupied |
| Less than High School | 11 (84.6%) | 2 (15.4%) |
| High School Diploma | 85 (64.4%) | 47 (35.6%) |
| College/Associate Degree | 76 (86.4%) | 12 (13.6%) |
| Bachelor's Degree or higher | 59 (72.8%) | 22 (27.2%) |
Occupancy by Age of Householder in Middlebourne
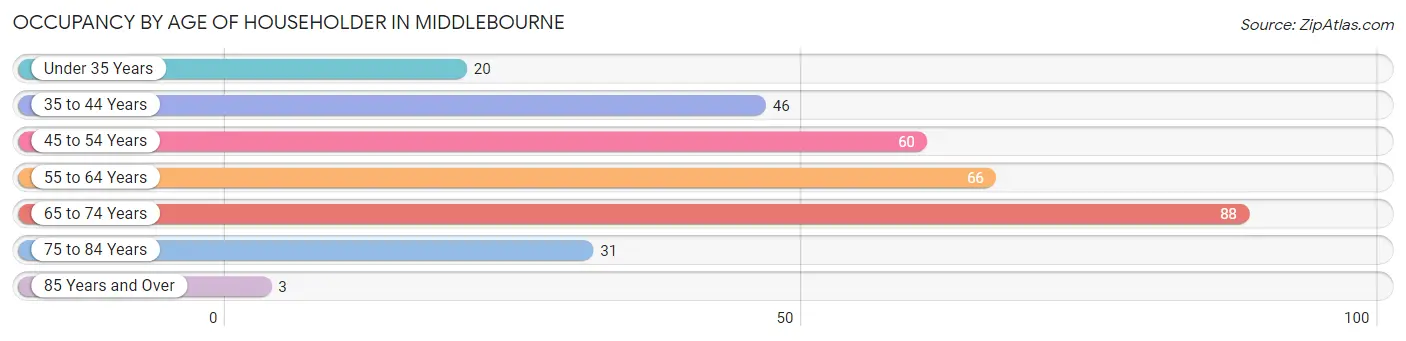
| Age Bracket | # Households | % Households |
| Under 35 Years | 20 | 6.4% |
| 35 to 44 Years | 46 | 14.6% |
| 45 to 54 Years | 60 | 19.1% |
| 55 to 64 Years | 66 | 21.0% |
| 65 to 74 Years | 88 | 28.0% |
| 75 to 84 Years | 31 | 9.9% |
| 85 Years and Over | 3 | 1.0% |
| Total | 314 | 100.0% |
Housing Finances in Middlebourne
Median Income by Occupancy in Middlebourne
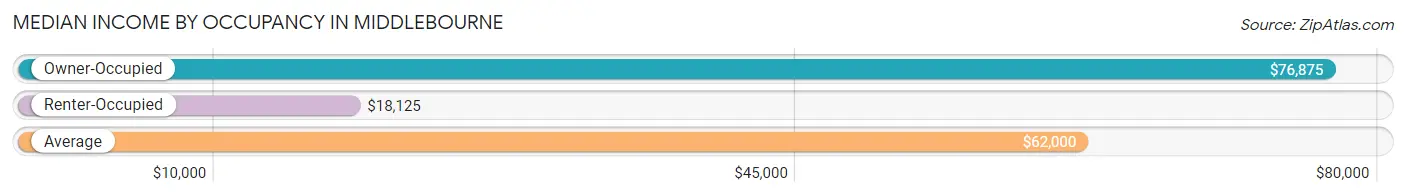
| Occupancy Type | # Households | Median Income |
| Owner-Occupied | 231 (73.6%) | $76,875 |
| Renter-Occupied | 83 (26.4%) | $18,125 |
| Average | 314 (100.0%) | $62,000 |
Occupancy by Householder Income Bracket in Middlebourne
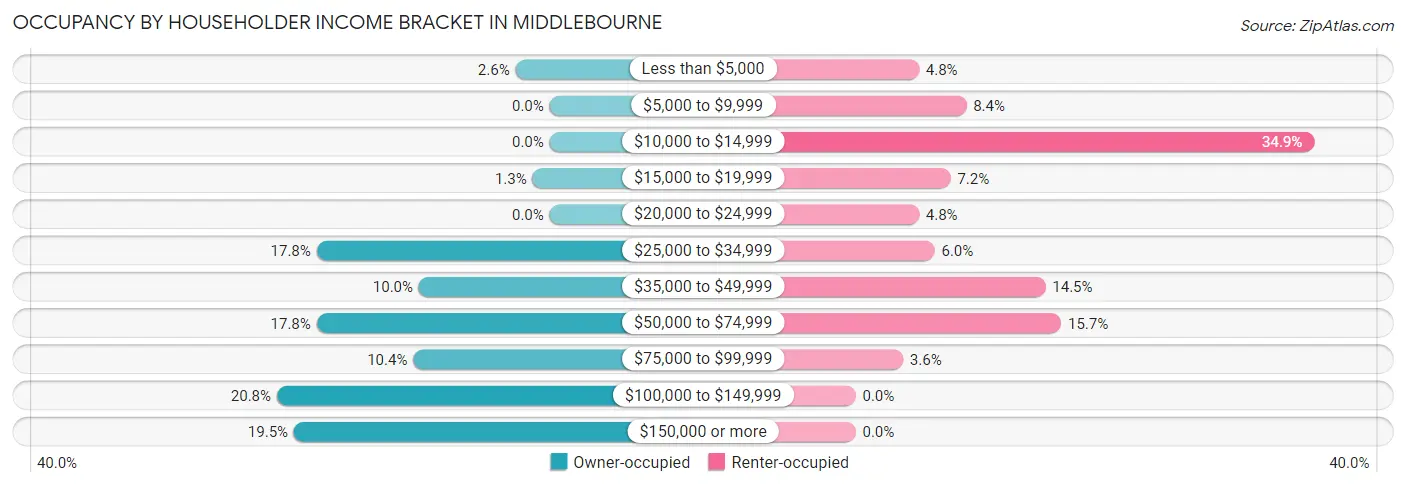
| Income Bracket | Owner-occupied | Renter-occupied |
| Less than $5,000 | 6 (2.6%) | 4 (4.8%) |
| $5,000 to $9,999 | 0 (0.0%) | 7 (8.4%) |
| $10,000 to $14,999 | 0 (0.0%) | 29 (34.9%) |
| $15,000 to $19,999 | 3 (1.3%) | 6 (7.2%) |
| $20,000 to $24,999 | 0 (0.0%) | 4 (4.8%) |
| $25,000 to $34,999 | 41 (17.7%) | 5 (6.0%) |
| $35,000 to $49,999 | 23 (10.0%) | 12 (14.5%) |
| $50,000 to $74,999 | 41 (17.7%) | 13 (15.7%) |
| $75,000 to $99,999 | 24 (10.4%) | 3 (3.6%) |
| $100,000 to $149,999 | 48 (20.8%) | 0 (0.0%) |
| $150,000 or more | 45 (19.5%) | 0 (0.0%) |
| Total | 231 (100.0%) | 83 (100.0%) |
Monthly Housing Cost Tiers in Middlebourne
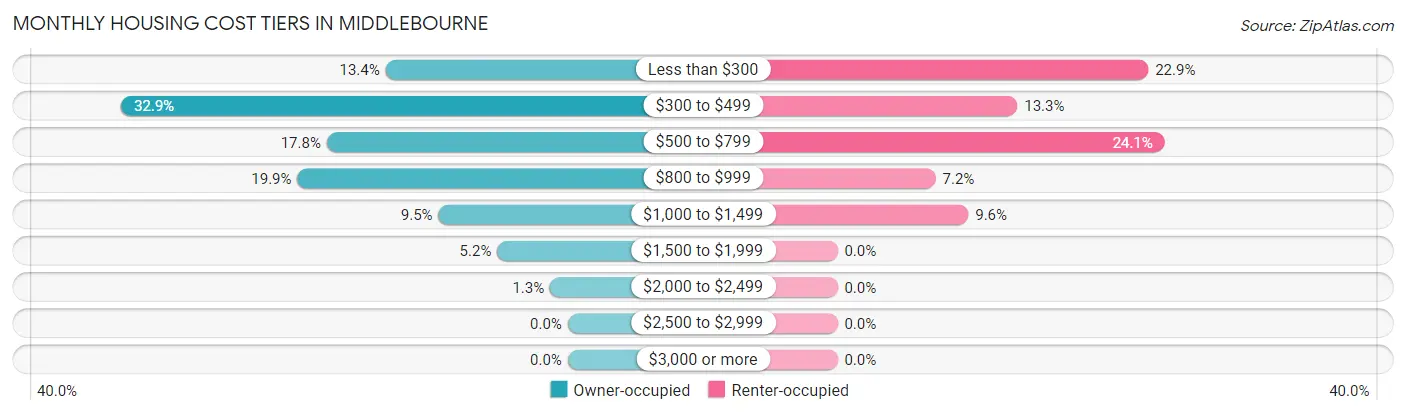
| Monthly Cost | Owner-occupied | Renter-occupied |
| Less than $300 | 31 (13.4%) | 19 (22.9%) |
| $300 to $499 | 76 (32.9%) | 11 (13.3%) |
| $500 to $799 | 41 (17.7%) | 20 (24.1%) |
| $800 to $999 | 46 (19.9%) | 6 (7.2%) |
| $1,000 to $1,499 | 22 (9.5%) | 8 (9.6%) |
| $1,500 to $1,999 | 12 (5.2%) | 0 (0.0%) |
| $2,000 to $2,499 | 3 (1.3%) | 0 (0.0%) |
| $2,500 to $2,999 | 0 (0.0%) | 0 (0.0%) |
| $3,000 or more | 0 (0.0%) | 0 (0.0%) |
| Total | 231 (100.0%) | 83 (100.0%) |
Physical Housing Characteristics in Middlebourne
Housing Structures in Middlebourne
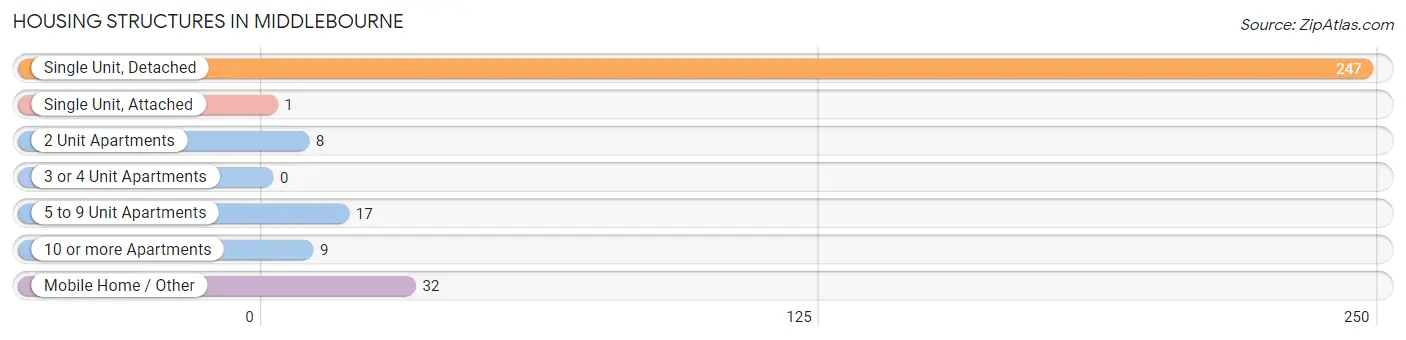
| Structure Type | # Housing Units | % Housing Units |
| Single Unit, Detached | 247 | 78.7% |
| Single Unit, Attached | 1 | 0.3% |
| 2 Unit Apartments | 8 | 2.5% |
| 3 or 4 Unit Apartments | 0 | 0.0% |
| 5 to 9 Unit Apartments | 17 | 5.4% |
| 10 or more Apartments | 9 | 2.9% |
| Mobile Home / Other | 32 | 10.2% |
| Total | 314 | 100.0% |
Housing Structures by Occupancy in Middlebourne
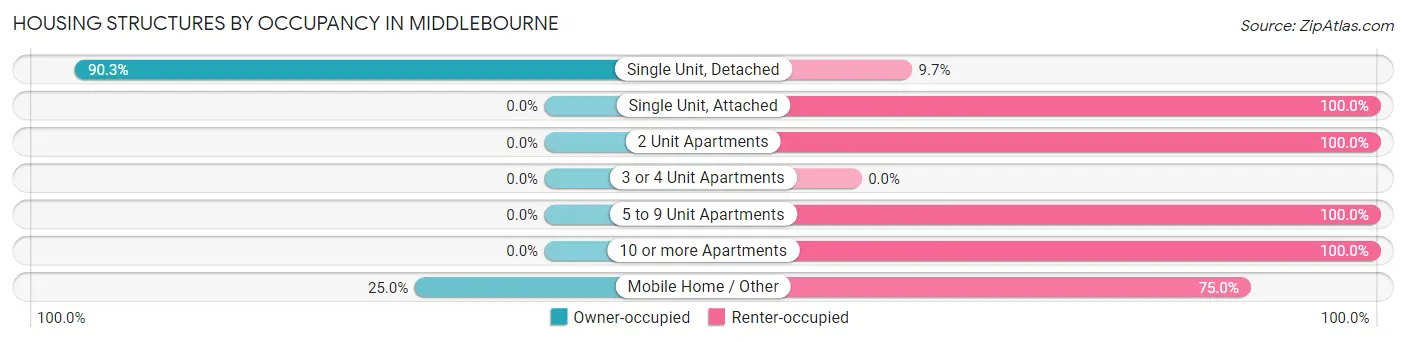
| Structure Type | Owner-occupied | Renter-occupied |
| Single Unit, Detached | 223 (90.3%) | 24 (9.7%) |
| Single Unit, Attached | 0 (0.0%) | 1 (100.0%) |
| 2 Unit Apartments | 0 (0.0%) | 8 (100.0%) |
| 3 or 4 Unit Apartments | 0 (0.0%) | 0 (0.0%) |
| 5 to 9 Unit Apartments | 0 (0.0%) | 17 (100.0%) |
| 10 or more Apartments | 0 (0.0%) | 9 (100.0%) |
| Mobile Home / Other | 8 (25.0%) | 24 (75.0%) |
| Total | 231 (73.6%) | 83 (26.4%) |
Housing Structures by Number of Rooms in Middlebourne
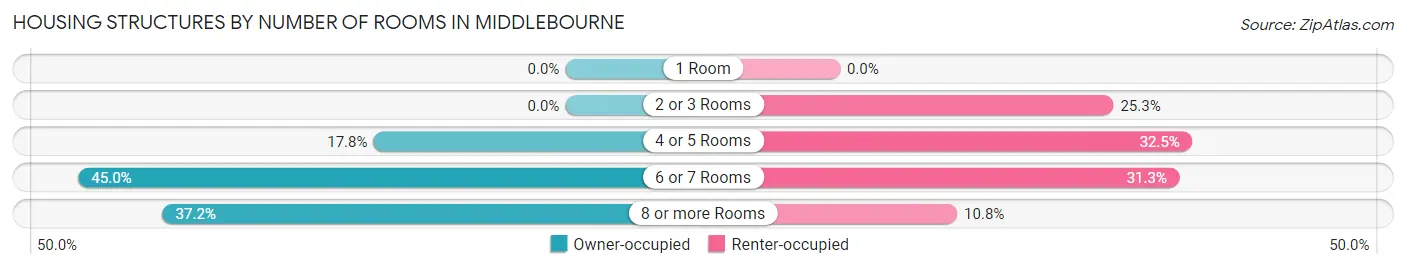
| Number of Rooms | Owner-occupied | Renter-occupied |
| 1 Room | 0 (0.0%) | 0 (0.0%) |
| 2 or 3 Rooms | 0 (0.0%) | 21 (25.3%) |
| 4 or 5 Rooms | 41 (17.7%) | 27 (32.5%) |
| 6 or 7 Rooms | 104 (45.0%) | 26 (31.3%) |
| 8 or more Rooms | 86 (37.2%) | 9 (10.8%) |
| Total | 231 (100.0%) | 83 (100.0%) |
Housing Structure by Heating Type in Middlebourne
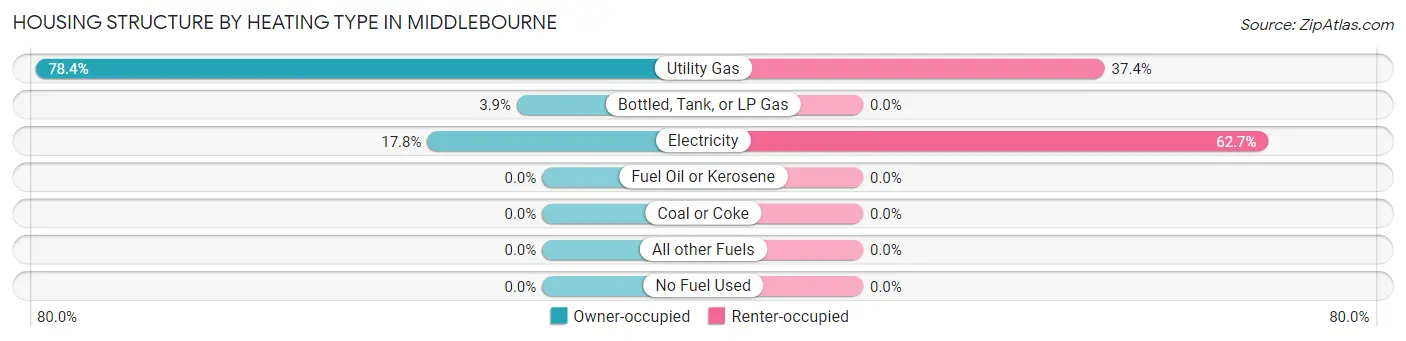
| Heating Type | Owner-occupied | Renter-occupied |
| Utility Gas | 181 (78.3%) | 31 (37.3%) |
| Bottled, Tank, or LP Gas | 9 (3.9%) | 0 (0.0%) |
| Electricity | 41 (17.7%) | 52 (62.6%) |
| Fuel Oil or Kerosene | 0 (0.0%) | 0 (0.0%) |
| Coal or Coke | 0 (0.0%) | 0 (0.0%) |
| All other Fuels | 0 (0.0%) | 0 (0.0%) |
| No Fuel Used | 0 (0.0%) | 0 (0.0%) |
| Total | 231 (100.0%) | 83 (100.0%) |
Household Vehicle Usage in Middlebourne
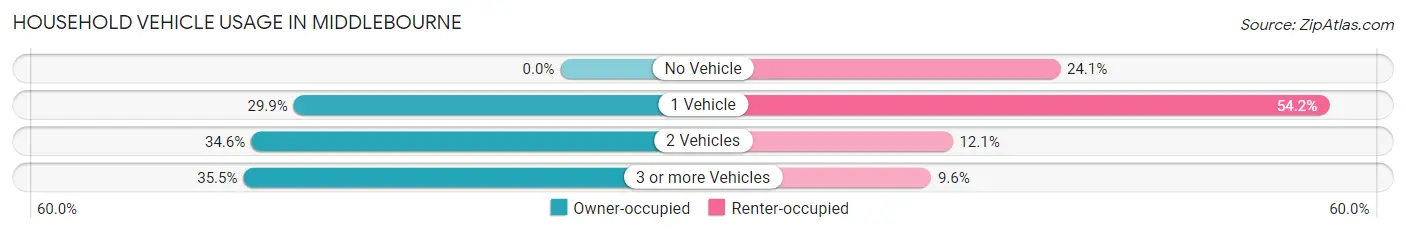
| Vehicles per Household | Owner-occupied | Renter-occupied |
| No Vehicle | 0 (0.0%) | 20 (24.1%) |
| 1 Vehicle | 69 (29.9%) | 45 (54.2%) |
| 2 Vehicles | 80 (34.6%) | 10 (12.0%) |
| 3 or more Vehicles | 82 (35.5%) | 8 (9.6%) |
| Total | 231 (100.0%) | 83 (100.0%) |
Real Estate & Mortgages in Middlebourne
Real Estate and Mortgage Overview in Middlebourne
| Characteristic | Without Mortgage | With Mortgage |
| Housing Units | 139 | 92 |
| Median Property Value | $96,900 | $117,600 |
| Median Household Income | $58,438 | $26 |
| Monthly Housing Costs | $401 | $0 |
| Real Estate Taxes | $579 | $0 |
Property Value by Mortgage Status in Middlebourne
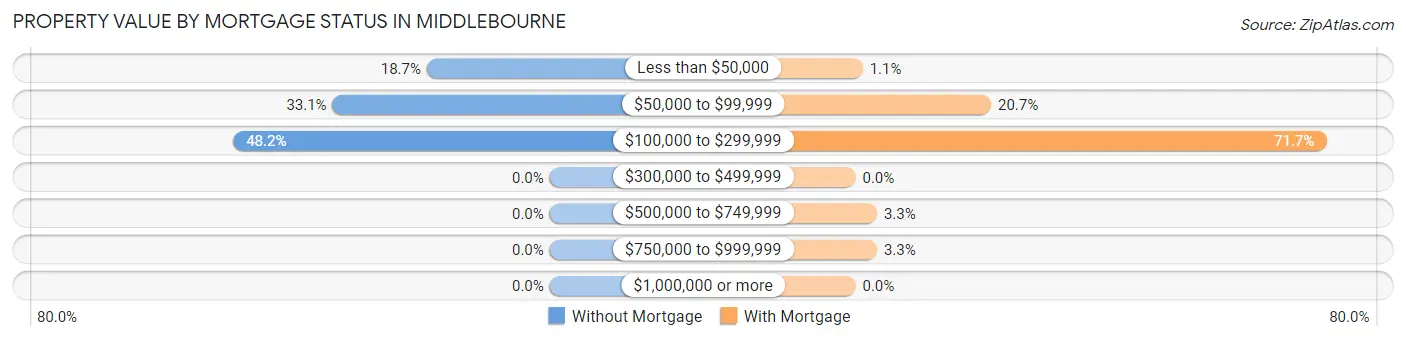
| Property Value | Without Mortgage | With Mortgage |
| Less than $50,000 | 26 (18.7%) | 1 (1.1%) |
| $50,000 to $99,999 | 46 (33.1%) | 19 (20.6%) |
| $100,000 to $299,999 | 67 (48.2%) | 66 (71.7%) |
| $300,000 to $499,999 | 0 (0.0%) | 0 (0.0%) |
| $500,000 to $749,999 | 0 (0.0%) | 3 (3.3%) |
| $750,000 to $999,999 | 0 (0.0%) | 3 (3.3%) |
| $1,000,000 or more | 0 (0.0%) | 0 (0.0%) |
| Total | 139 (100.0%) | 92 (100.0%) |
Household Income by Mortgage Status in Middlebourne
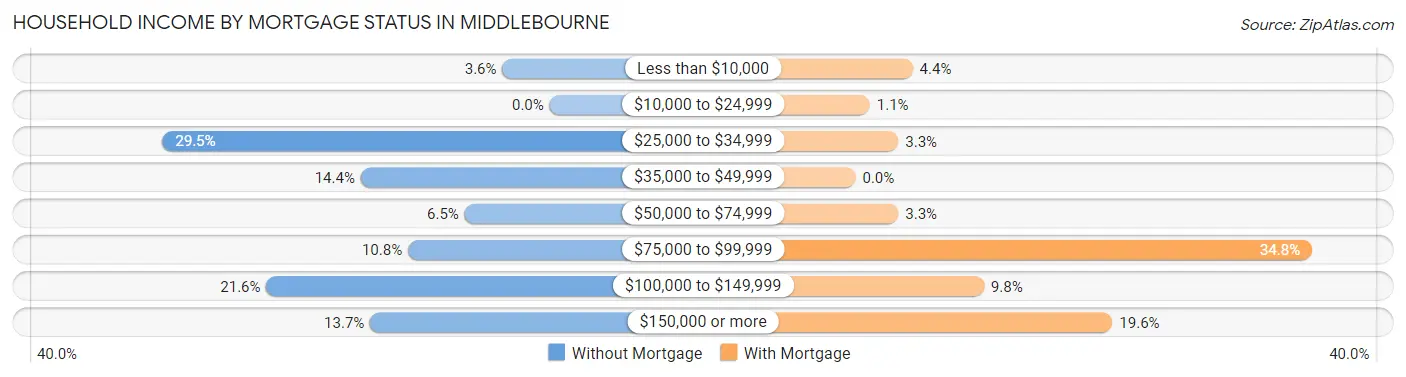
| Household Income | Without Mortgage | With Mortgage |
| Less than $10,000 | 5 (3.6%) | 4 (4.3%) |
| $10,000 to $24,999 | 0 (0.0%) | 1 (1.1%) |
| $25,000 to $34,999 | 41 (29.5%) | 3 (3.3%) |
| $35,000 to $49,999 | 20 (14.4%) | 0 (0.0%) |
| $50,000 to $74,999 | 9 (6.5%) | 3 (3.3%) |
| $75,000 to $99,999 | 15 (10.8%) | 32 (34.8%) |
| $100,000 to $149,999 | 30 (21.6%) | 9 (9.8%) |
| $150,000 or more | 19 (13.7%) | 18 (19.6%) |
| Total | 139 (100.0%) | 92 (100.0%) |
Property Value to Household Income Ratio in Middlebourne
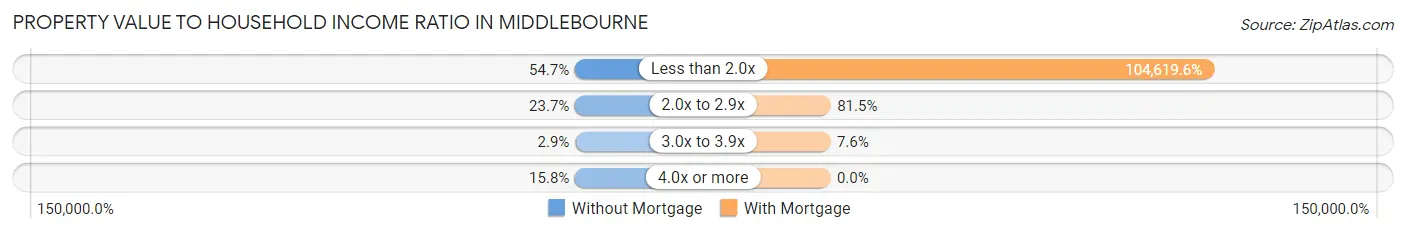
| Value-to-Income Ratio | Without Mortgage | With Mortgage |
| Less than 2.0x | 76 (54.7%) | 96,250 (104,619.6%) |
| 2.0x to 2.9x | 33 (23.7%) | 75 (81.5%) |
| 3.0x to 3.9x | 4 (2.9%) | 7 (7.6%) |
| 4.0x or more | 22 (15.8%) | 0 (0.0%) |
| Total | 139 (100.0%) | 92 (100.0%) |
Real Estate Taxes by Mortgage Status in Middlebourne
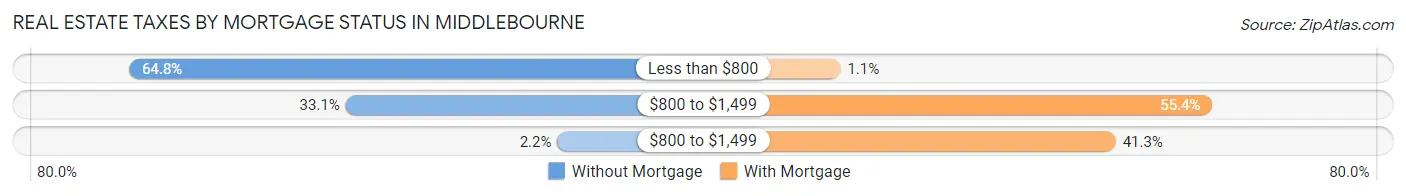
| Property Taxes | Without Mortgage | With Mortgage |
| Less than $800 | 90 (64.7%) | 1 (1.1%) |
| $800 to $1,499 | 46 (33.1%) | 51 (55.4%) |
| $800 to $1,499 | 3 (2.2%) | 38 (41.3%) |
| Total | 139 (100.0%) | 92 (100.0%) |
Health & Disability in Middlebourne
Health Insurance Coverage by Age in Middlebourne
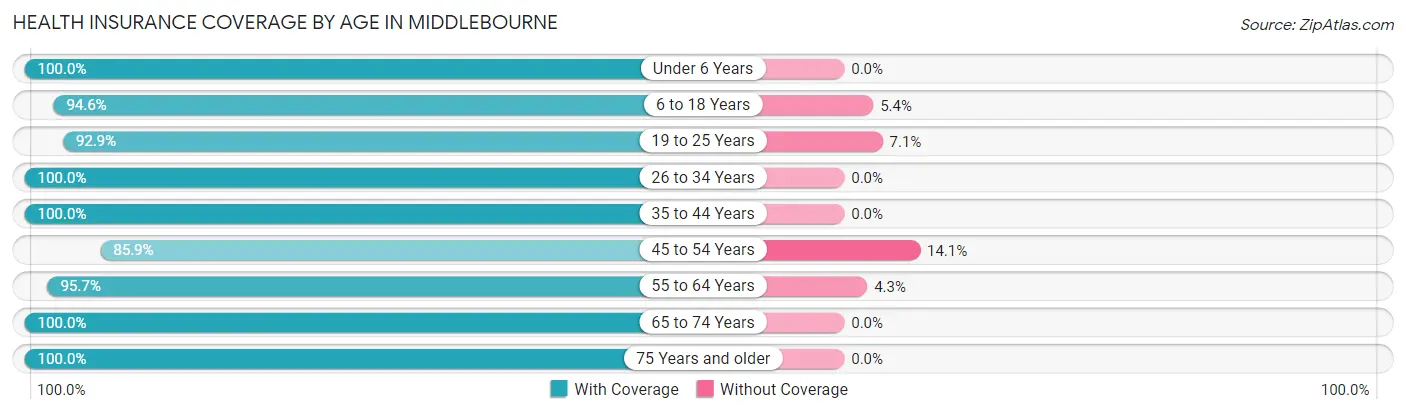
| Age Bracket | With Coverage | Without Coverage |
| Under 6 Years | 55 (100.0%) | 0 (0.0%) |
| 6 to 18 Years | 158 (94.6%) | 9 (5.4%) |
| 19 to 25 Years | 39 (92.9%) | 3 (7.1%) |
| 26 to 34 Years | 58 (100.0%) | 0 (0.0%) |
| 35 to 44 Years | 63 (100.0%) | 0 (0.0%) |
| 45 to 54 Years | 79 (85.9%) | 13 (14.1%) |
| 55 to 64 Years | 112 (95.7%) | 5 (4.3%) |
| 65 to 74 Years | 123 (100.0%) | 0 (0.0%) |
| 75 Years and older | 100 (100.0%) | 0 (0.0%) |
| Total | 787 (96.3%) | 30 (3.7%) |
Health Insurance Coverage by Citizenship Status in Middlebourne
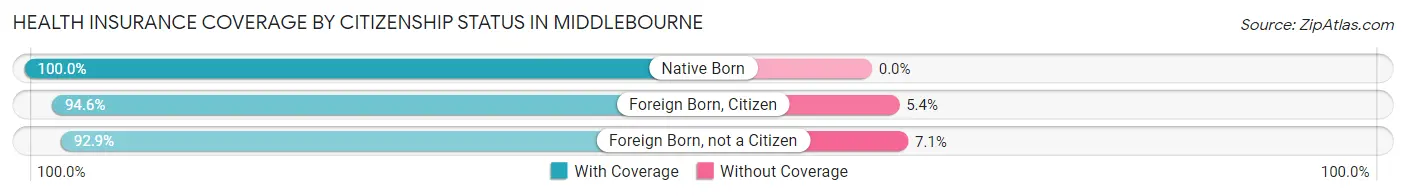
| Citizenship Status | With Coverage | Without Coverage |
| Native Born | 55 (100.0%) | 0 (0.0%) |
| Foreign Born, Citizen | 158 (94.6%) | 9 (5.4%) |
| Foreign Born, not a Citizen | 39 (92.9%) | 3 (7.1%) |
Health Insurance Coverage by Household Income in Middlebourne
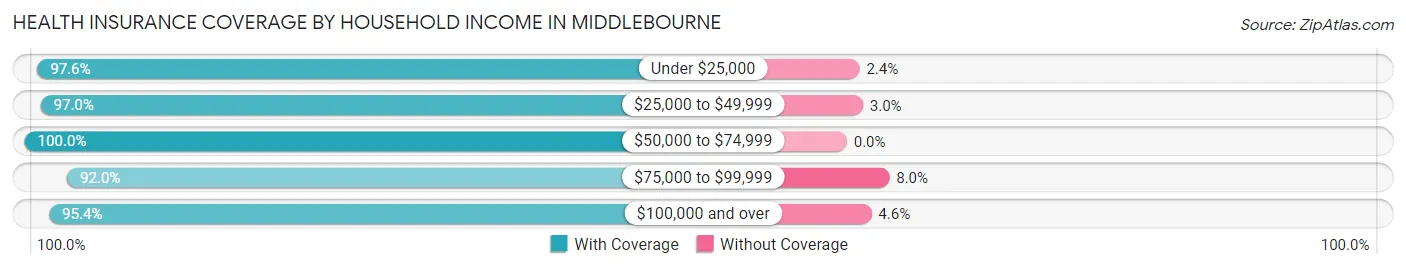
| Household Income | With Coverage | Without Coverage |
| Under $25,000 | 123 (97.6%) | 3 (2.4%) |
| $25,000 to $49,999 | 161 (97.0%) | 5 (3.0%) |
| $50,000 to $74,999 | 130 (100.0%) | 0 (0.0%) |
| $75,000 to $99,999 | 104 (92.0%) | 9 (8.0%) |
| $100,000 and over | 269 (95.4%) | 13 (4.6%) |
Public vs Private Health Insurance Coverage by Age in Middlebourne
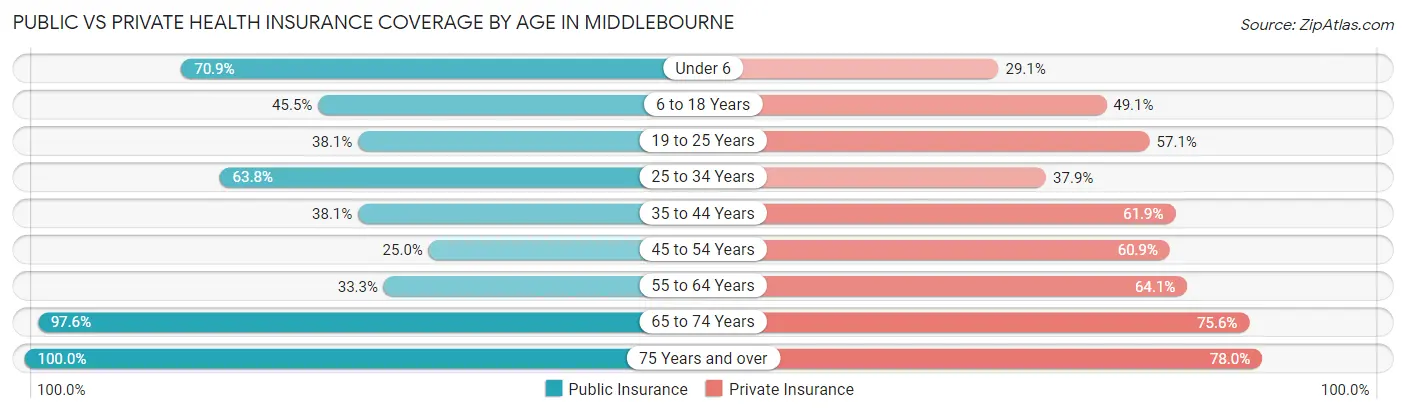
| Age Bracket | Public Insurance | Private Insurance |
| Under 6 | 39 (70.9%) | 16 (29.1%) |
| 6 to 18 Years | 76 (45.5%) | 82 (49.1%) |
| 19 to 25 Years | 16 (38.1%) | 24 (57.1%) |
| 25 to 34 Years | 37 (63.8%) | 22 (37.9%) |
| 35 to 44 Years | 24 (38.1%) | 39 (61.9%) |
| 45 to 54 Years | 23 (25.0%) | 56 (60.9%) |
| 55 to 64 Years | 39 (33.3%) | 75 (64.1%) |
| 65 to 74 Years | 120 (97.6%) | 93 (75.6%) |
| 75 Years and over | 100 (100.0%) | 78 (78.0%) |
| Total | 474 (58.0%) | 485 (59.4%) |
Disability Status by Sex by Age in Middlebourne
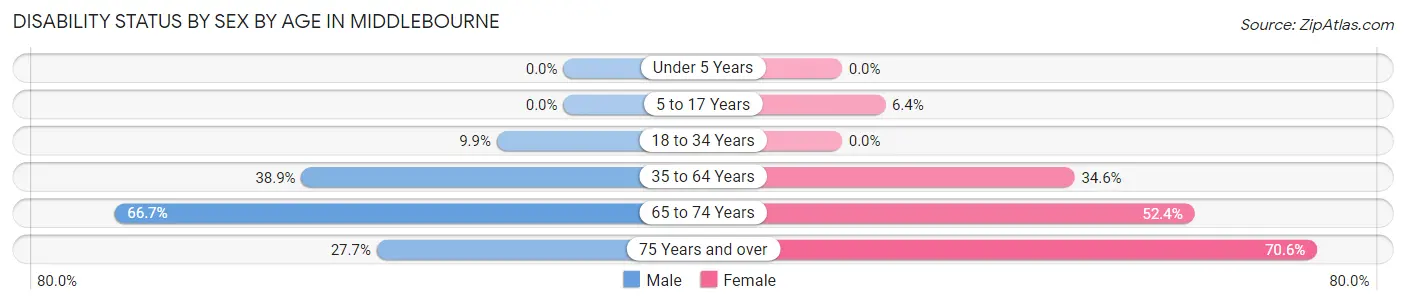
| Age Bracket | Male | Female |
| Under 5 Years | 0 (0.0%) | 0 (0.0%) |
| 5 to 17 Years | 0 (0.0%) | 5 (6.4%) |
| 18 to 34 Years | 8 (9.9%) | 0 (0.0%) |
| 35 to 64 Years | 63 (38.9%) | 38 (34.5%) |
| 65 to 74 Years | 26 (66.7%) | 44 (52.4%) |
| 75 Years and over | 23 (27.7%) | 12 (70.6%) |
Disability Class by Sex by Age in Middlebourne
Disability Class: Hearing Difficulty
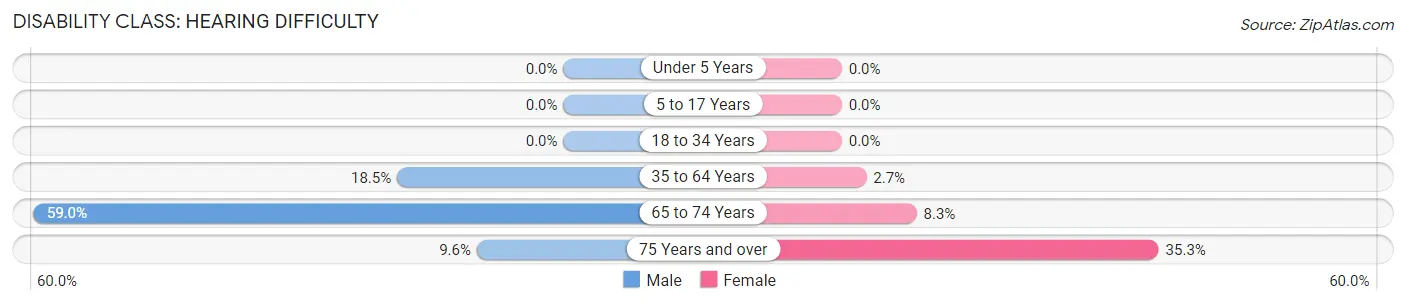
| Age Bracket | Male | Female |
| Under 5 Years | 0 (0.0%) | 0 (0.0%) |
| 5 to 17 Years | 0 (0.0%) | 0 (0.0%) |
| 18 to 34 Years | 0 (0.0%) | 0 (0.0%) |
| 35 to 64 Years | 30 (18.5%) | 3 (2.7%) |
| 65 to 74 Years | 23 (59.0%) | 7 (8.3%) |
| 75 Years and over | 8 (9.6%) | 6 (35.3%) |
Disability Class: Vision Difficulty
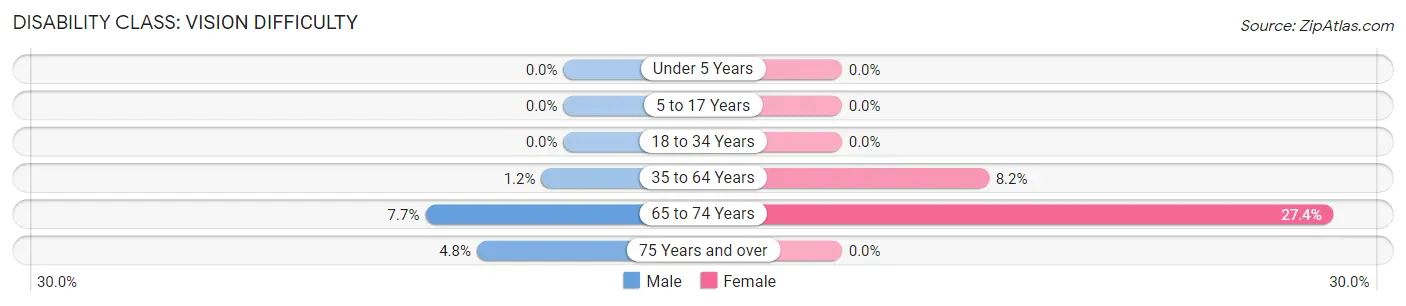
| Age Bracket | Male | Female |
| Under 5 Years | 0 (0.0%) | 0 (0.0%) |
| 5 to 17 Years | 0 (0.0%) | 0 (0.0%) |
| 18 to 34 Years | 0 (0.0%) | 0 (0.0%) |
| 35 to 64 Years | 2 (1.2%) | 9 (8.2%) |
| 65 to 74 Years | 3 (7.7%) | 23 (27.4%) |
| 75 Years and over | 4 (4.8%) | 0 (0.0%) |
Disability Class: Cognitive Difficulty
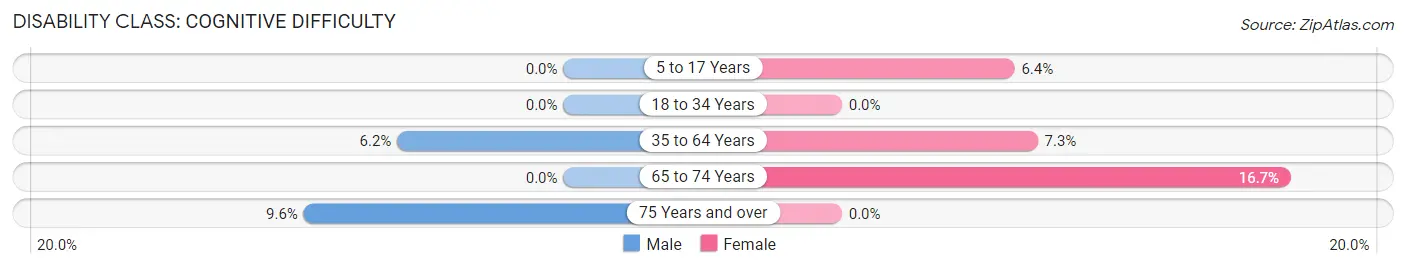
| Age Bracket | Male | Female |
| 5 to 17 Years | 0 (0.0%) | 5 (6.4%) |
| 18 to 34 Years | 0 (0.0%) | 0 (0.0%) |
| 35 to 64 Years | 10 (6.2%) | 8 (7.3%) |
| 65 to 74 Years | 0 (0.0%) | 14 (16.7%) |
| 75 Years and over | 8 (9.6%) | 0 (0.0%) |
Disability Class: Ambulatory Difficulty

| Age Bracket | Male | Female |
| 5 to 17 Years | 0 (0.0%) | 0 (0.0%) |
| 18 to 34 Years | 0 (0.0%) | 0 (0.0%) |
| 35 to 64 Years | 33 (20.4%) | 30 (27.3%) |
| 65 to 74 Years | 0 (0.0%) | 17 (20.2%) |
| 75 Years and over | 11 (13.3%) | 12 (70.6%) |
Disability Class: Self-Care Difficulty
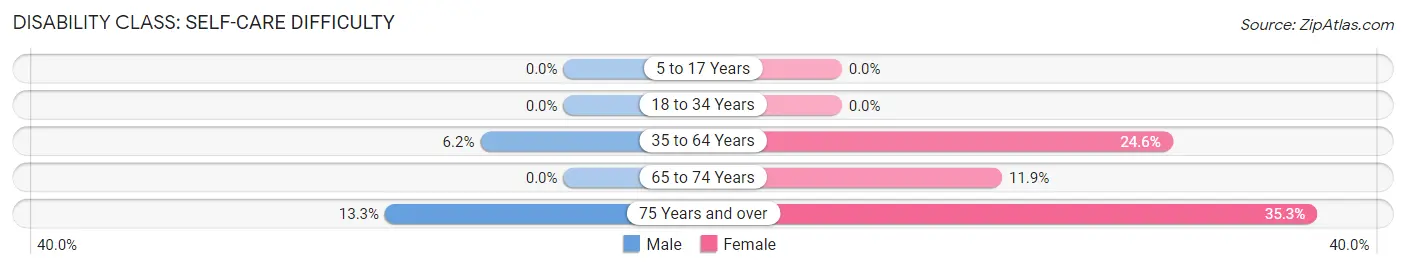
| Age Bracket | Male | Female |
| 5 to 17 Years | 0 (0.0%) | 0 (0.0%) |
| 18 to 34 Years | 0 (0.0%) | 0 (0.0%) |
| 35 to 64 Years | 10 (6.2%) | 27 (24.5%) |
| 65 to 74 Years | 0 (0.0%) | 10 (11.9%) |
| 75 Years and over | 11 (13.3%) | 6 (35.3%) |
Technology Access in Middlebourne
Computing Device Access in Middlebourne
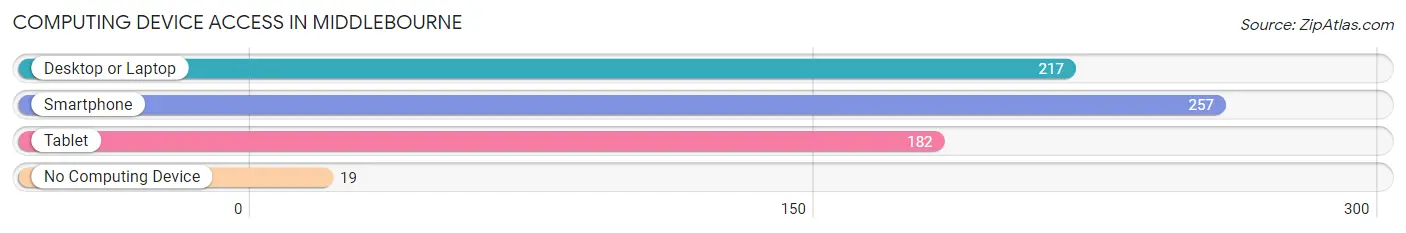
| Device Type | # Households | % Households |
| Desktop or Laptop | 217 | 69.1% |
| Smartphone | 257 | 81.9% |
| Tablet | 182 | 58.0% |
| No Computing Device | 19 | 6.0% |
| Total | 314 | 100.0% |
Internet Access in Middlebourne
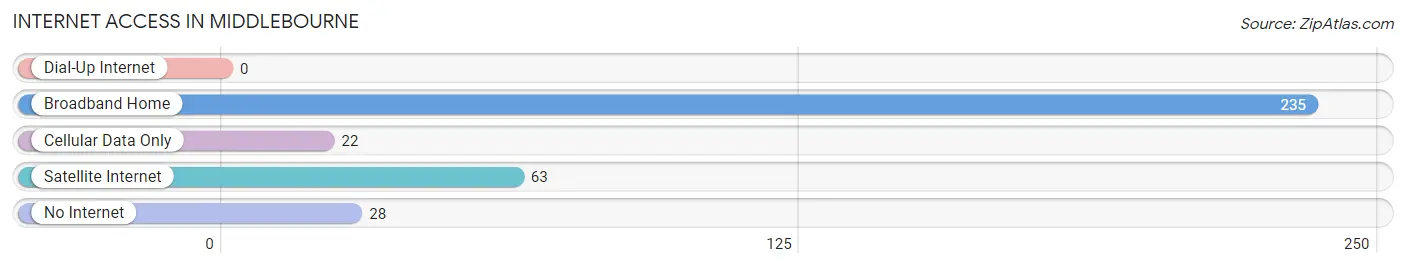
| Internet Type | # Households | % Households |
| Dial-Up Internet | 0 | 0.0% |
| Broadband Home | 235 | 74.8% |
| Cellular Data Only | 22 | 7.0% |
| Satellite Internet | 63 | 20.1% |
| No Internet | 28 | 8.9% |
| Total | 314 | 100.0% |
Middlebourne Summary
Introduction
Middlebourne is a small town located in Tyler County, West Virginia. It is situated on the Middle Island Creek, a tributary of the Ohio River. The town was founded in 1817 and has a population of approximately 1,000 people. Middlebourne is known for its rural charm and is a popular destination for outdoor recreation.
History
Middlebourne was founded in 1817 by a group of settlers from Pennsylvania. The town was named after the Middle Island Creek, which runs through the area. The creek was named by early settlers who thought the island in the middle of the creek resembled an island in the middle of the ocean.
The town was originally a farming community, but in the late 19th century, the oil and gas industry began to take off in the area. This led to an influx of new residents and businesses, and the town began to grow.
In the early 20th century, Middlebourne was a popular destination for tourists. The town was known for its scenic beauty and outdoor recreation opportunities. In the 1950s, the town was home to a popular amusement park, which drew visitors from all over the region.
Geography
Middlebourne is located in Tyler County, West Virginia. It is situated on the Middle Island Creek, a tributary of the Ohio River. The town is surrounded by rolling hills and forests, and is located near the Ohio-West Virginia border.
The climate in Middlebourne is humid continental, with hot summers and cold winters. The average temperature in the summer is around 75 degrees Fahrenheit, and in the winter it is around 35 degrees Fahrenheit.
Economy
The economy of Middlebourne is largely based on agriculture and tourism. The town is home to several farms, which produce a variety of crops, including corn, soybeans, and hay. The town is also home to several wineries, which produce a variety of wines.
Tourism is also an important part of the economy. The town is home to several outdoor recreation opportunities, including fishing, hunting, and camping. The town is also home to several historic sites, including the Middlebourne Historic District, which is listed on the National Register of Historic Places.
Demographics
As of the 2010 census, the population of Middlebourne was 1,000 people. The racial makeup of the town was 97.2% White, 0.7% African American, 0.2% Native American, 0.2% Asian, 0.2% from other races, and 1.7% from two or more races. Hispanic or Latino of any race were 0.7% of the population.
The median income for a household in Middlebourne was $30,000, and the median income for a family was $35,000. The per capita income for the town was $15,000. About 15.7% of families and 18.2% of the population were below the poverty line, including 25.0% of those under age 18 and 10.0% of those age 65 or over.
Conclusion
Middlebourne is a small town located in Tyler County, West Virginia. It was founded in 1817 and has a population of approximately 1,000 people. The town is known for its rural charm and is a popular destination for outdoor recreation. The economy of Middlebourne is largely based on agriculture and tourism, and the town is home to several farms, wineries, and historic sites. The population of Middlebourne is predominantly white, with a median income of $30,000 for a household and $35,000 for a family.
Common Questions
What is Per Capita Income in Middlebourne?
Per Capita income in Middlebourne is $35,087.
What is the Median Family Income in Middlebourne?
Median Family Income in Middlebourne is $83,846.
What is the Median Household income in Middlebourne?
Median Household Income in Middlebourne is $62,000.
What is Income or Wage Gap in Middlebourne?
Income or Wage Gap in Middlebourne is 57.9%.
Women in Middlebourne earn 42.1 cents for every dollar earned by a man.
What is Inequality or Gini Index in Middlebourne?
Inequality or Gini Index in Middlebourne is 0.49.
What is the Total Population of Middlebourne?
Total Population of Middlebourne is 830.
What is the Total Male Population of Middlebourne?
Total Male Population of Middlebourne is 450.
What is the Total Female Population of Middlebourne?
Total Female Population of Middlebourne is 380.
What is the Ratio of Males per 100 Females in Middlebourne?
There are 118.42 Males per 100 Females in Middlebourne.
What is the Ratio of Females per 100 Males in Middlebourne?
There are 84.44 Females per 100 Males in Middlebourne.
What is the Median Population Age in Middlebourne?
Median Population Age in Middlebourne is 47.0 Years.
What is the Average Family Size in Middlebourne
Average Family Size in Middlebourne is 3.8 People.
What is the Average Household Size in Middlebourne
Average Household Size in Middlebourne is 2.6 People.
How Large is the Labor Force in Middlebourne?
There are 288 People in the Labor Forcein in Middlebourne.
What is the Percentage of People in the Labor Force in Middlebourne?
42.1% of People are in the Labor Force in Middlebourne.
What is the Unemployment Rate in Middlebourne?
Unemployment Rate in Middlebourne is 3.8%.