West Union, WV Map & Demographics
West Union Map
West Union Overview
$46,579
PER CAPITA INCOME
$123,333
AVG FAMILY INCOME
$88,833
AVG HOUSEHOLD INCOME
31.9%
WAGE / INCOME GAP [ % ]
68.1¢/ $1
WAGE / INCOME GAP [ $ ]
0.45
INEQUALITY / GINI INDEX
832
TOTAL POPULATION
441
MALE POPULATION
391
FEMALE POPULATION
112.79
MALES / 100 FEMALES
88.66
FEMALES / 100 MALES
49.9
MEDIAN AGE
3.0
AVG FAMILY SIZE
2.6
AVG HOUSEHOLD SIZE
500
LABOR FORCE [ PEOPLE ]
67.0%
PERCENT IN LABOR FORCE
0.4%
UNEMPLOYMENT RATE
West Union Zip Codes
West Union Area Codes
Income in West Union
Income Overview in West Union
Per Capita Income in West Union is $46,579, while median incomes of families and households are $123,333 and $88,833 respectively.
| Characteristic | Number | Measure |
| Per Capita Income | 832 | $46,579 |
| Median Family Income | 238 | $123,333 |
| Mean Family Income | 238 | $130,319 |
| Median Household Income | 314 | $88,833 |
| Mean Household Income | 314 | $115,080 |
| Income Deficit | 238 | $0 |
| Wage / Income Gap (%) | 832 | 31.91% |
| Wage / Income Gap ($) | 832 | 68.09¢ per $1 |
| Gini / Inequality Index | 832 | 0.45 |
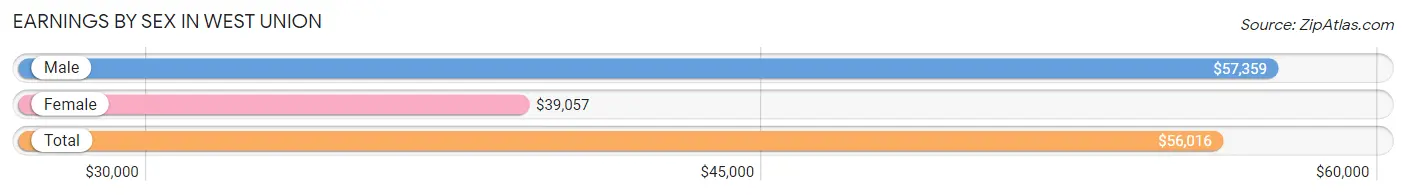
Earnings by Sex in West Union
Average Earnings in West Union are $56,016, $57,359 for men and $39,057 for women, a difference of 31.9%.
| Sex | Number | Average Earnings |
| Male | 289 (56.1%) | $57,359 |
| Female | 226 (43.9%) | $39,057 |
| Total | 515 (100.0%) | $56,016 |
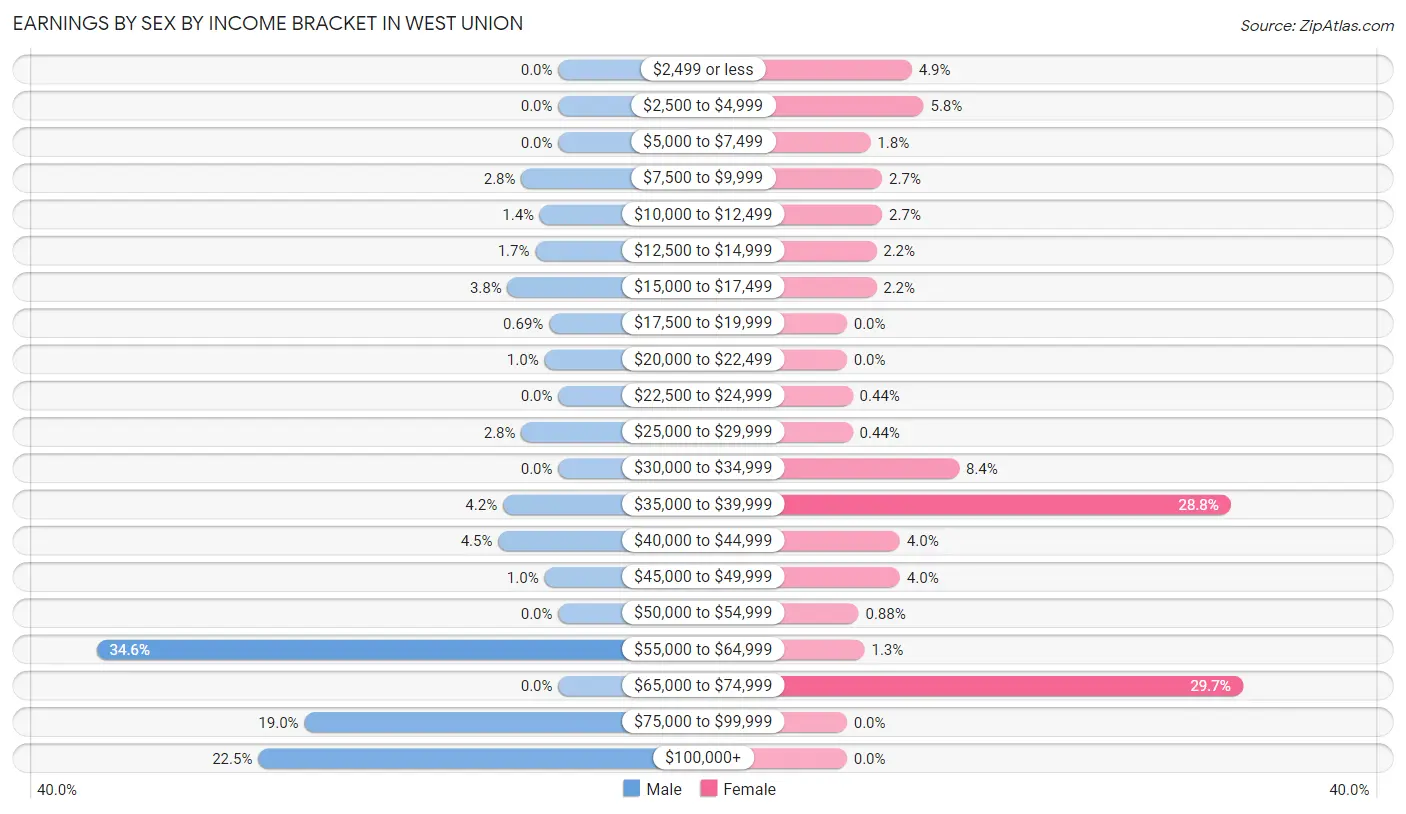
Earnings by Sex by Income Bracket in West Union
The most common earnings brackets in West Union are $55,000 to $64,999 for men (100 | 34.6%) and $65,000 to $74,999 for women (67 | 29.6%).
| Income | Male | Female |
| $2,499 or less | 0 (0.0%) | 11 (4.9%) |
| $2,500 to $4,999 | 0 (0.0%) | 13 (5.8%) |
| $5,000 to $7,499 | 0 (0.0%) | 4 (1.8%) |
| $7,500 to $9,999 | 8 (2.8%) | 6 (2.6%) |
| $10,000 to $12,499 | 4 (1.4%) | 6 (2.6%) |
| $12,500 to $14,999 | 5 (1.7%) | 5 (2.2%) |
| $15,000 to $17,499 | 11 (3.8%) | 5 (2.2%) |
| $17,500 to $19,999 | 2 (0.7%) | 0 (0.0%) |
| $20,000 to $22,499 | 3 (1.0%) | 0 (0.0%) |
| $22,500 to $24,999 | 0 (0.0%) | 1 (0.4%) |
| $25,000 to $29,999 | 8 (2.8%) | 1 (0.4%) |
| $30,000 to $34,999 | 0 (0.0%) | 19 (8.4%) |
| $35,000 to $39,999 | 12 (4.2%) | 65 (28.8%) |
| $40,000 to $44,999 | 13 (4.5%) | 9 (4.0%) |
| $45,000 to $49,999 | 3 (1.0%) | 9 (4.0%) |
| $50,000 to $54,999 | 0 (0.0%) | 2 (0.9%) |
| $55,000 to $64,999 | 100 (34.6%) | 3 (1.3%) |
| $65,000 to $74,999 | 0 (0.0%) | 67 (29.6%) |
| $75,000 to $99,999 | 55 (19.0%) | 0 (0.0%) |
| $100,000+ | 65 (22.5%) | 0 (0.0%) |
| Total | 289 (100.0%) | 226 (100.0%) |
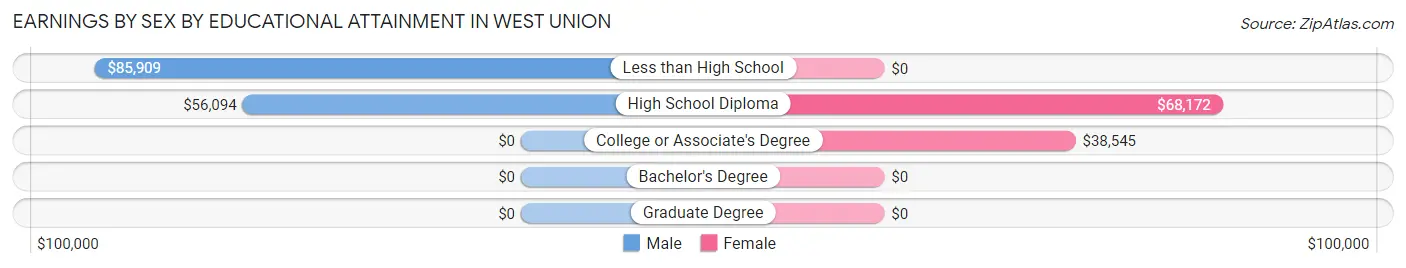
Earnings by Sex by Educational Attainment in West Union
Average earnings in West Union are $85,038 for men and $38,975 for women, a difference of 54.2%. Men with an educational attainment of less than high school enjoy the highest average annual earnings of $85,909, while those with high school diploma education earn the least with $56,094. Women with an educational attainment of high school diploma earn the most with the average annual earnings of $68,172, while those with college or associate's degree education have the smallest earnings of $38,545.
| Educational Attainment | Male Income | Female Income |
| Less than High School | $85,909 | $0 |
| High School Diploma | $56,094 | $68,172 |
| College or Associate's Degree | - | - |
| Bachelor's Degree | - | - |
| Graduate Degree | - | - |
| Total | $85,038 | $38,975 |
Family Income in West Union
Family Income Brackets in West Union
According to the West Union family income data, there are 68 families falling into the $200,000+ income range, which is the most common income bracket and makes up 28.6% of all families. Conversely, the $15,000 to $24,999 income bracket is the least frequent group with only 1 families (0.4%) belonging to this category.
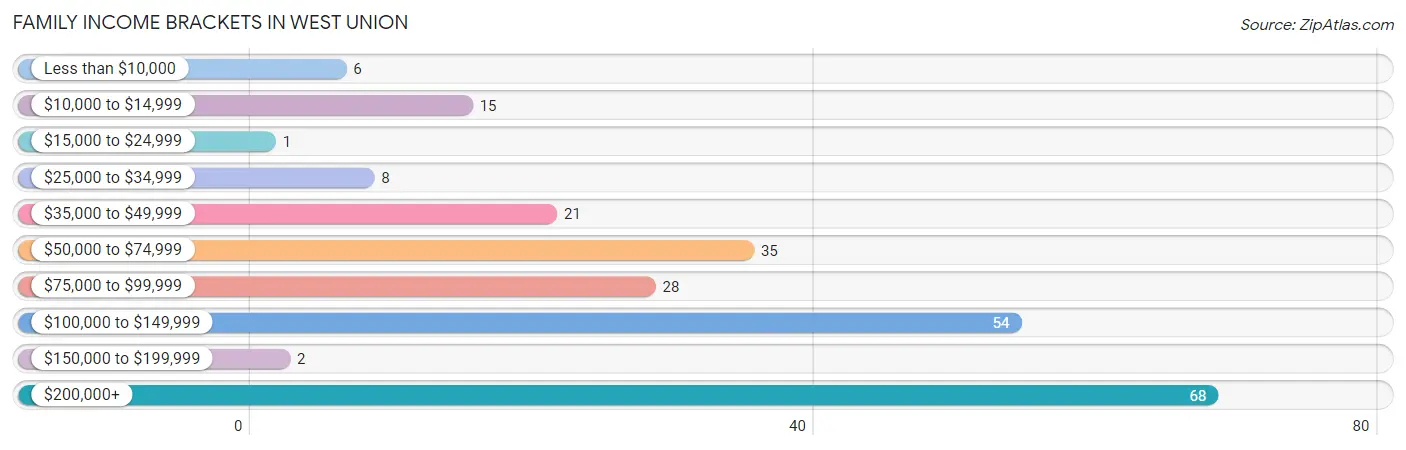
| Income Bracket | # Families | % Families |
| Less than $10,000 | 6 | 2.5% |
| $10,000 to $14,999 | 15 | 6.3% |
| $15,000 to $24,999 | 1 | 0.4% |
| $25,000 to $34,999 | 8 | 3.4% |
| $35,000 to $49,999 | 21 | 8.8% |
| $50,000 to $74,999 | 35 | 14.7% |
| $75,000 to $99,999 | 28 | 11.8% |
| $100,000 to $149,999 | 54 | 22.7% |
| $150,000 to $199,999 | 2 | 0.8% |
| $200,000+ | 68 | 28.6% |
Family Income by Famaliy Size in West Union
3-person families (93 | 39.1%) account for the highest median family income in West Union with $245,594 per family, while 3-person families (93 | 39.1%) have the highest median income of $81,865 per family member.
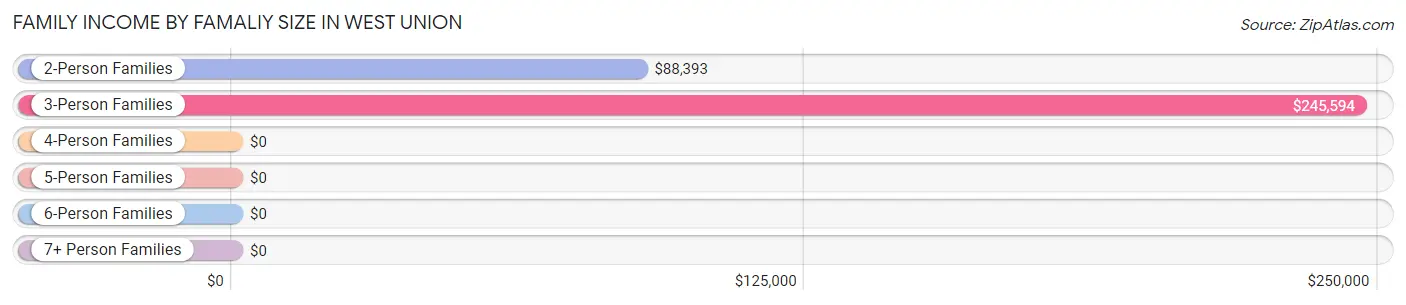
| Income Bracket | # Families | Median Income |
| 2-Person Families | 125 (52.5%) | $88,393 |
| 3-Person Families | 93 (39.1%) | $245,594 |
| 4-Person Families | 14 (5.9%) | $0 |
| 5-Person Families | 6 (2.5%) | $0 |
| 6-Person Families | 0 (0.0%) | $0 |
| 7+ Person Families | 0 (0.0%) | $0 |
| Total | 238 (100.0%) | $123,333 |
Family Income by Number of Earners in West Union
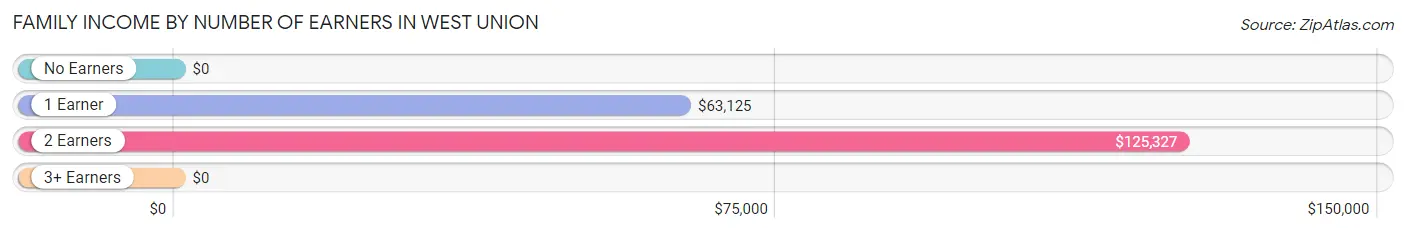
| Number of Earners | # Families | Median Income |
| No Earners | 29 (12.2%) | $0 |
| 1 Earner | 67 (28.1%) | $63,125 |
| 2 Earners | 81 (34.0%) | $125,327 |
| 3+ Earners | 61 (25.6%) | $0 |
| Total | 238 (100.0%) | $123,333 |
Household Income in West Union
Household Income Brackets in West Union
With 71 households falling in the category, the $200,000+ income range is the most frequent in West Union, accounting for 22.6% of all households. In contrast, only 5 households (1.6%) fall into the $150,000 to $199,999 income bracket, making it the least populous group.
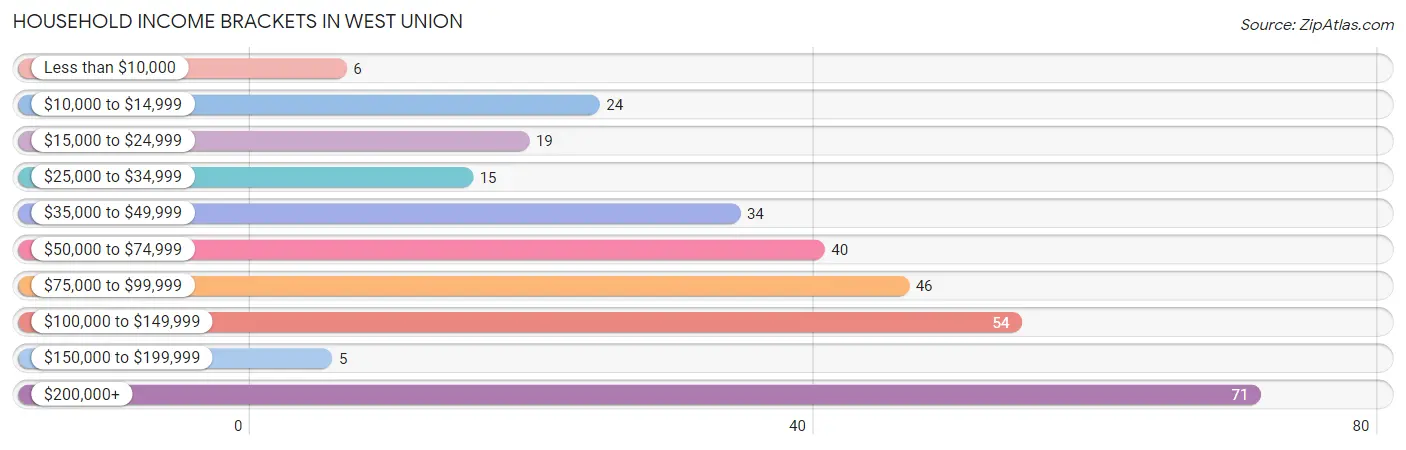
| Income Bracket | # Households | % Households |
| Less than $10,000 | 6 | 1.9% |
| $10,000 to $14,999 | 24 | 7.6% |
| $15,000 to $24,999 | 19 | 6.1% |
| $25,000 to $34,999 | 15 | 4.8% |
| $35,000 to $49,999 | 34 | 10.8% |
| $50,000 to $74,999 | 40 | 12.7% |
| $75,000 to $99,999 | 46 | 14.6% |
| $100,000 to $149,999 | 54 | 17.2% |
| $150,000 to $199,999 | 5 | 1.6% |
| $200,000+ | 71 | 22.6% |
Household Income by Householder Age in West Union
The median household income in West Union is $88,833, with the highest median household income of $125,341 found in the 25 to 44 years age bracket for the primary householder. A total of 73 households (23.3%) fall into this category. Meanwhile, the 15 to 24 years age bracket for the primary householder has the lowest median household income of $0, with 2 households (0.6%) in this group.
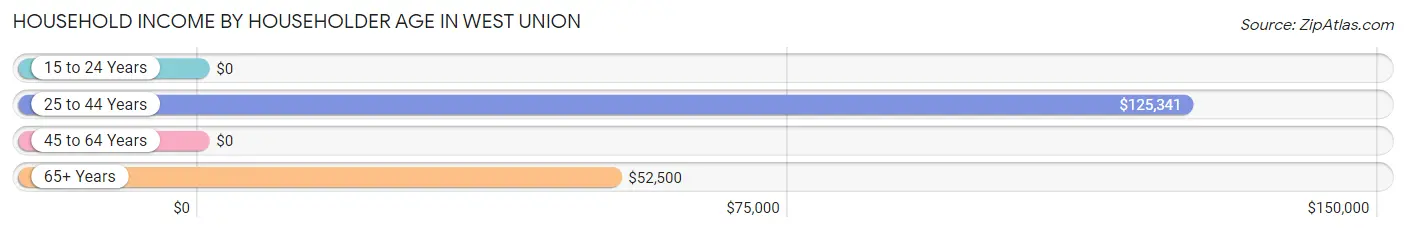
| Income Bracket | # Households | Median Income |
| 15 to 24 Years | 2 (0.6%) | $0 |
| 25 to 44 Years | 73 (23.3%) | $125,341 |
| 45 to 64 Years | 129 (41.1%) | $0 |
| 65+ Years | 110 (35.0%) | $52,500 |
| Total | 314 (100.0%) | $88,833 |
Poverty in West Union
Income Below Poverty by Sex and Age in West Union
With 8.8% poverty level for males and 15.6% for females among the residents of West Union, 12 to 14 year old males and 45 to 54 year old females are the most vulnerable to poverty, with 6 males (50.0%) and 13 females (46.4%) in their respective age groups living below the poverty level.
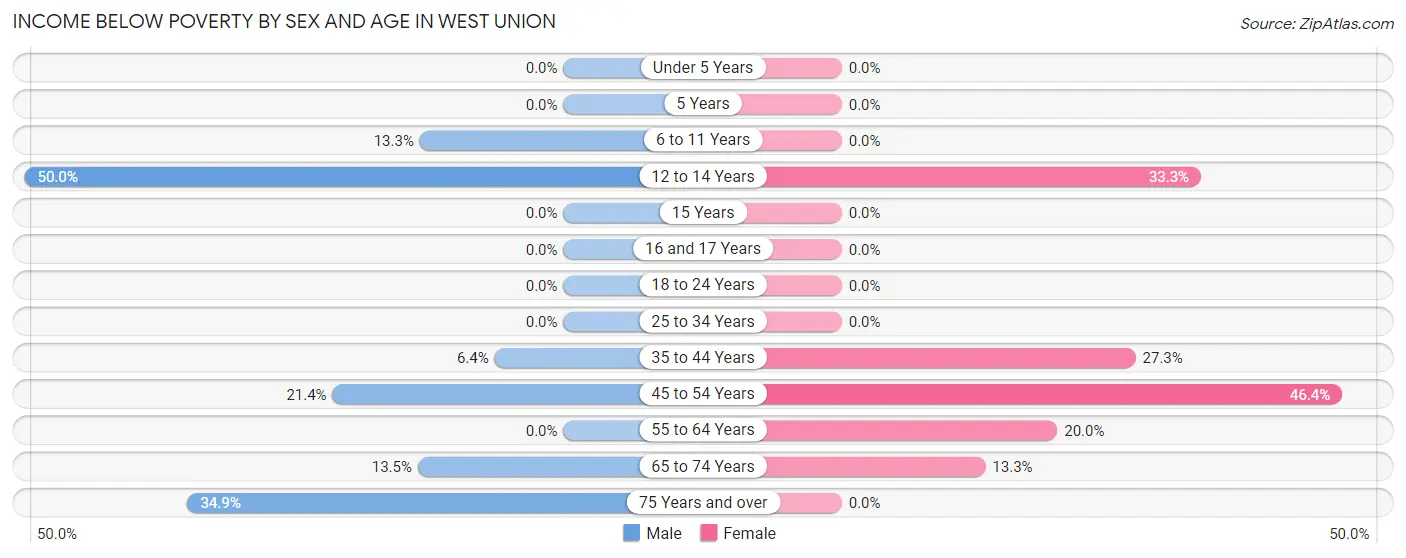
| Age Bracket | Male | Female |
| Under 5 Years | 0 (0.0%) | 0 (0.0%) |
| 5 Years | 0 (0.0%) | 0 (0.0%) |
| 6 to 11 Years | 4 (13.3%) | 0 (0.0%) |
| 12 to 14 Years | 6 (50.0%) | 4 (33.3%) |
| 15 Years | 0 (0.0%) | 0 (0.0%) |
| 16 and 17 Years | 0 (0.0%) | 0 (0.0%) |
| 18 to 24 Years | 0 (0.0%) | 0 (0.0%) |
| 25 to 34 Years | 0 (0.0%) | 0 (0.0%) |
| 35 to 44 Years | 3 (6.4%) | 15 (27.3%) |
| 45 to 54 Years | 6 (21.4%) | 13 (46.4%) |
| 55 to 64 Years | 0 (0.0%) | 25 (20.0%) |
| 65 to 74 Years | 5 (13.5%) | 4 (13.3%) |
| 75 Years and over | 15 (34.9%) | 0 (0.0%) |
| Total | 39 (8.8%) | 61 (15.6%) |
Income Above Poverty by Sex and Age in West Union
According to the poverty statistics in West Union, males aged 5 years and females aged under 5 years are the age groups that are most secure financially, with 100.0% of males and 100.0% of females in these age groups living above the poverty line.
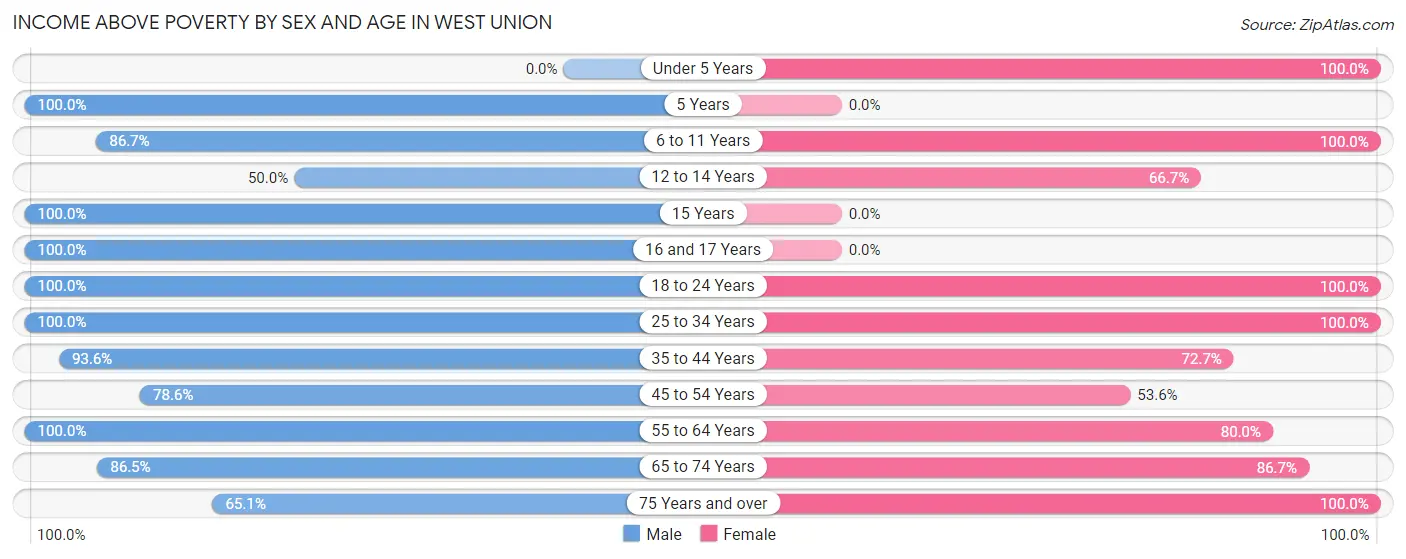
| Age Bracket | Male | Female |
| Under 5 Years | 0 (0.0%) | 13 (100.0%) |
| 5 Years | 2 (100.0%) | 0 (0.0%) |
| 6 to 11 Years | 26 (86.7%) | 16 (100.0%) |
| 12 to 14 Years | 6 (50.0%) | 8 (66.7%) |
| 15 Years | 1 (100.0%) | 0 (0.0%) |
| 16 and 17 Years | 7 (100.0%) | 0 (0.0%) |
| 18 to 24 Years | 92 (100.0%) | 6 (100.0%) |
| 25 to 34 Years | 49 (100.0%) | 47 (100.0%) |
| 35 to 44 Years | 44 (93.6%) | 40 (72.7%) |
| 45 to 54 Years | 22 (78.6%) | 15 (53.6%) |
| 55 to 64 Years | 93 (100.0%) | 100 (80.0%) |
| 65 to 74 Years | 32 (86.5%) | 26 (86.7%) |
| 75 Years and over | 28 (65.1%) | 59 (100.0%) |
| Total | 402 (91.2%) | 330 (84.4%) |
Income Below Poverty Among Married-Couple Families in West Union
The poverty statistics for married-couple families in West Union show that 8.3% or 18 of the total 216 families live below the poverty line. Families with 1 or 2 children have the highest poverty rate of 31.2%, comprising of 5 families. On the other hand, families with 3 or 4 children have the lowest poverty rate of 0.0%, which includes 0 families.
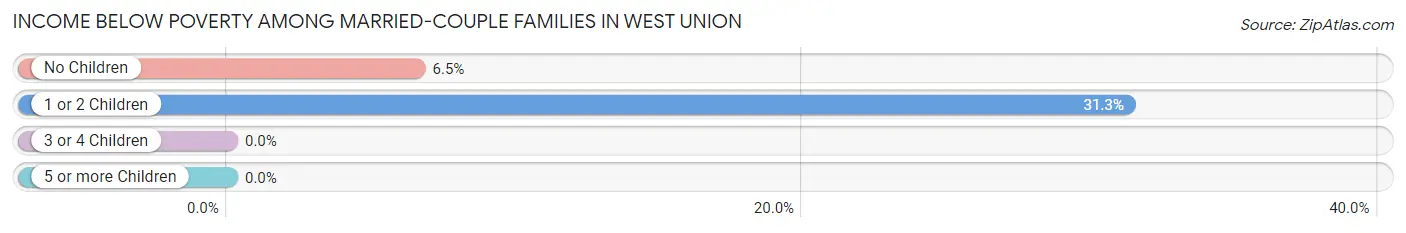
| Children | Above Poverty | Below Poverty |
| No Children | 186 (93.5%) | 13 (6.5%) |
| 1 or 2 Children | 11 (68.8%) | 5 (31.2%) |
| 3 or 4 Children | 1 (100.0%) | 0 (0.0%) |
| 5 or more Children | 0 (0.0%) | 0 (0.0%) |
| Total | 198 (91.7%) | 18 (8.3%) |
Income Below Poverty Among Single-Parent Households in West Union
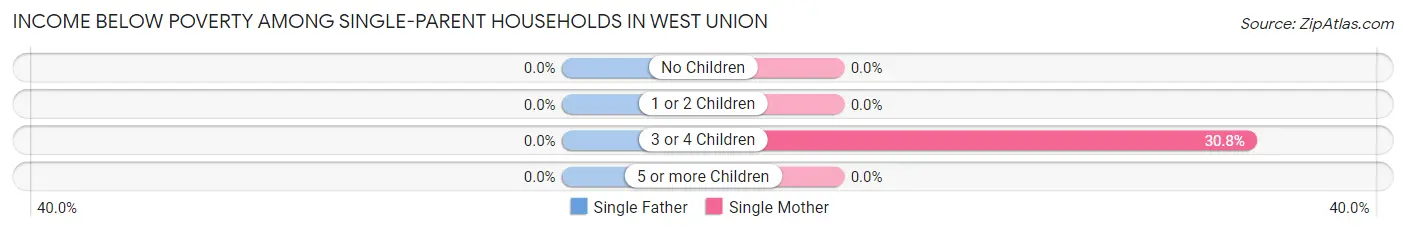
| Children | Single Father | Single Mother |
| No Children | 0 (0.0%) | 0 (0.0%) |
| 1 or 2 Children | 0 (0.0%) | 0 (0.0%) |
| 3 or 4 Children | 0 (0.0%) | 4 (30.8%) |
| 5 or more Children | 0 (0.0%) | 0 (0.0%) |
| Total | 0 (0.0%) | 4 (21.0%) |
Income Below Poverty Among Married-Couple vs Single-Parent Households in West Union
The poverty data for West Union shows that 18 of the married-couple family households (8.3%) and 4 of the single-parent households (18.2%) are living below the poverty level. Within the married-couple family households, those with 1 or 2 children have the highest poverty rate, with 5 households (31.2%) falling below the poverty line. Among the single-parent households, those with 3 or 4 children have the highest poverty rate, with 4 household (30.8%) living below poverty.
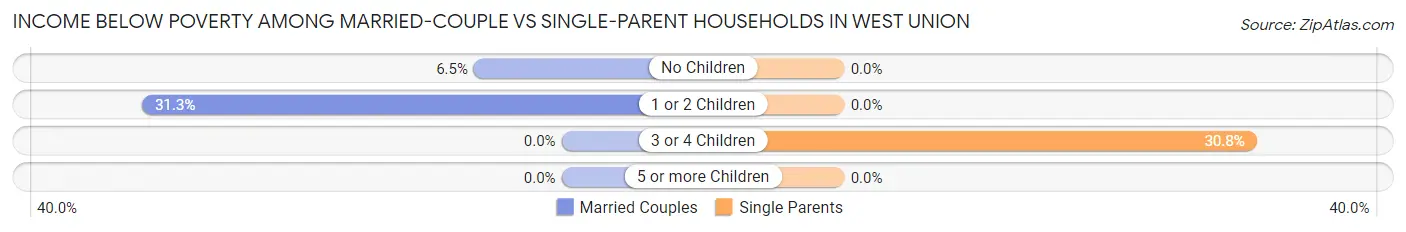
| Children | Married-Couple Families | Single-Parent Households |
| No Children | 13 (6.5%) | 0 (0.0%) |
| 1 or 2 Children | 5 (31.2%) | 0 (0.0%) |
| 3 or 4 Children | 0 (0.0%) | 4 (30.8%) |
| 5 or more Children | 0 (0.0%) | 0 (0.0%) |
| Total | 18 (8.3%) | 4 (18.2%) |
Race in West Union
The most populous races in West Union are White / Caucasian (811 | 97.5%), Two or more Races (15 | 1.8%), and Black / African American (6 | 0.7%).
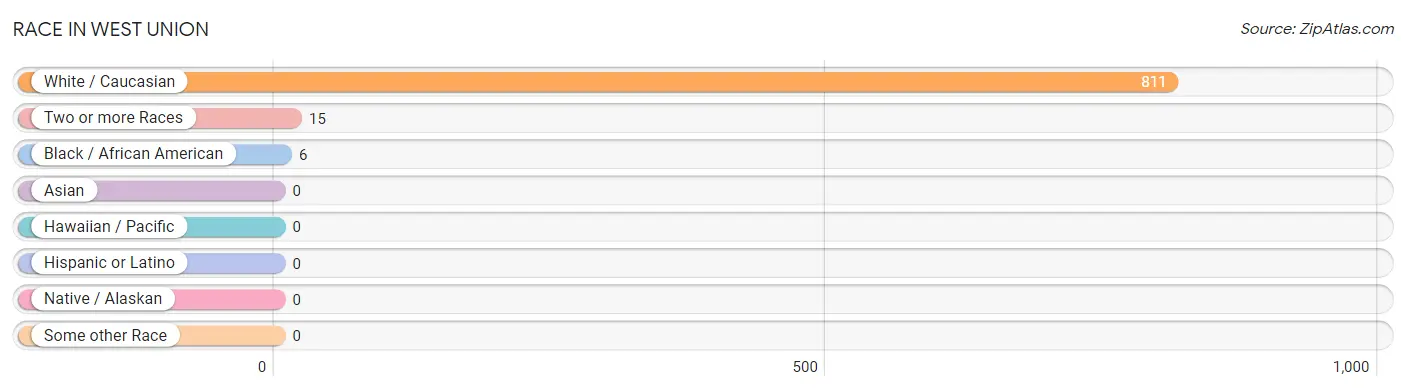
| Race | # Population | % Population |
| Asian | 0 | 0.0% |
| Black / African American | 6 | 0.7% |
| Hawaiian / Pacific | 0 | 0.0% |
| Hispanic or Latino | 0 | 0.0% |
| Native / Alaskan | 0 | 0.0% |
| White / Caucasian | 811 | 97.5% |
| Two or more Races | 15 | 1.8% |
| Some other Race | 0 | 0.0% |
| Total | 832 | 100.0% |
Ancestry in West Union
The most populous ancestries reported in West Union are German (103 | 12.4%), English (97 | 11.7%), American (80 | 9.6%), European (58 | 7.0%), and Scottish (47 | 5.7%), together accounting for 46.3% of all West Union residents.
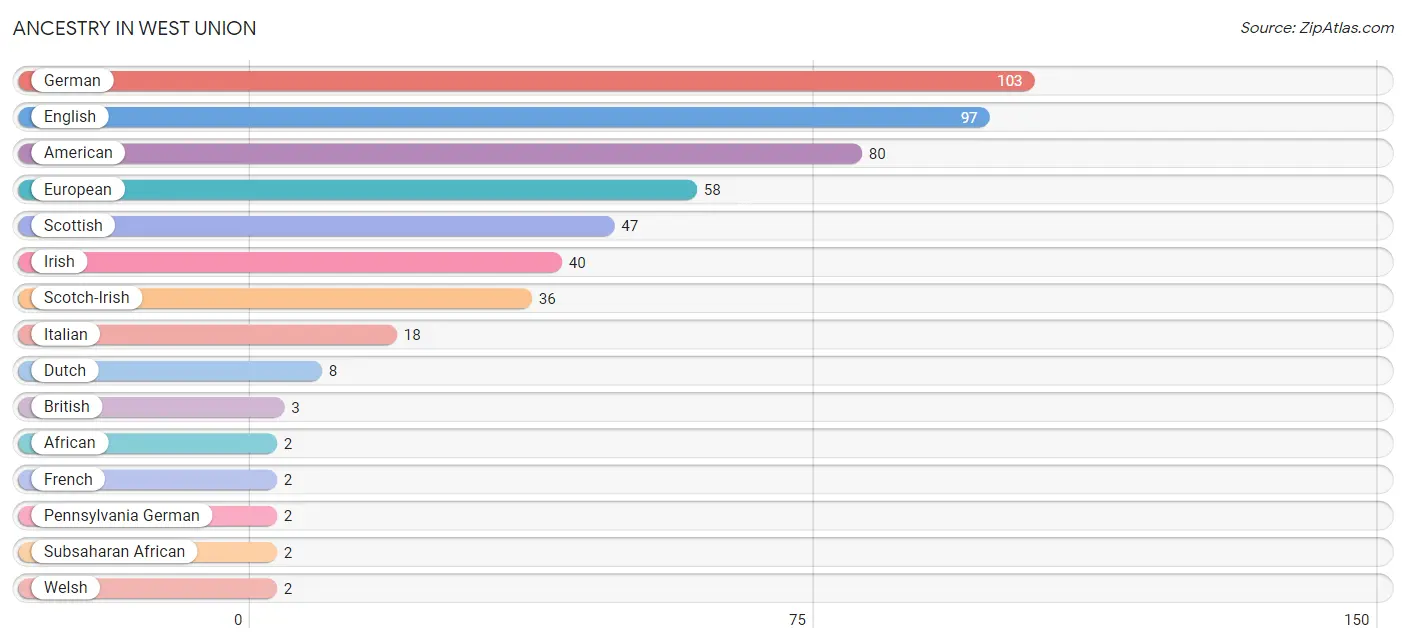
| Ancestry | # Population | % Population |
| African | 2 | 0.2% |
| American | 80 | 9.6% |
| British | 3 | 0.4% |
| Dutch | 8 | 1.0% |
| English | 97 | 11.7% |
| European | 58 | 7.0% |
| French | 2 | 0.2% |
| German | 103 | 12.4% |
| Irish | 40 | 4.8% |
| Italian | 18 | 2.2% |
| Pennsylvania German | 2 | 0.2% |
| Polish | 1 | 0.1% |
| Scotch-Irish | 36 | 4.3% |
| Scottish | 47 | 5.7% |
| Subsaharan African | 2 | 0.2% |
| Welsh | 2 | 0.2% | View All 16 Rows |
Immigrants in West Union
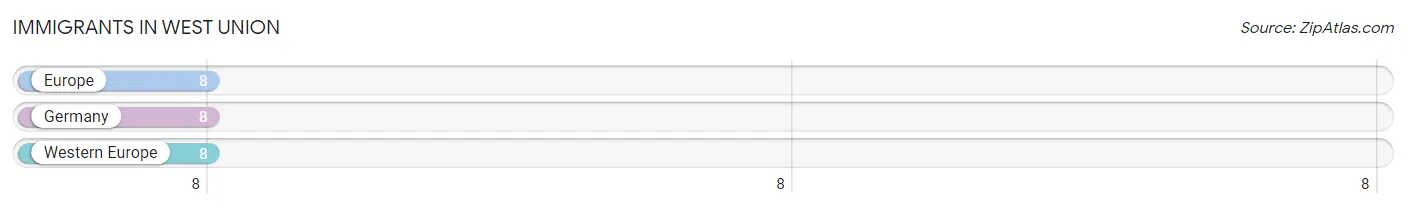
The most numerous immigrant groups reported in West Union came from Europe (8 | 1.0%), Germany (8 | 1.0%), and Western Europe (8 | 1.0%), together accounting for 2.9% of all West Union residents.
| Immigration Origin | # Population | % Population |
| Europe | 8 | 1.0% |
| Germany | 8 | 1.0% |
| Western Europe | 8 | 1.0% | View All 3 Rows |
Sex and Age in West Union
Sex and Age in West Union
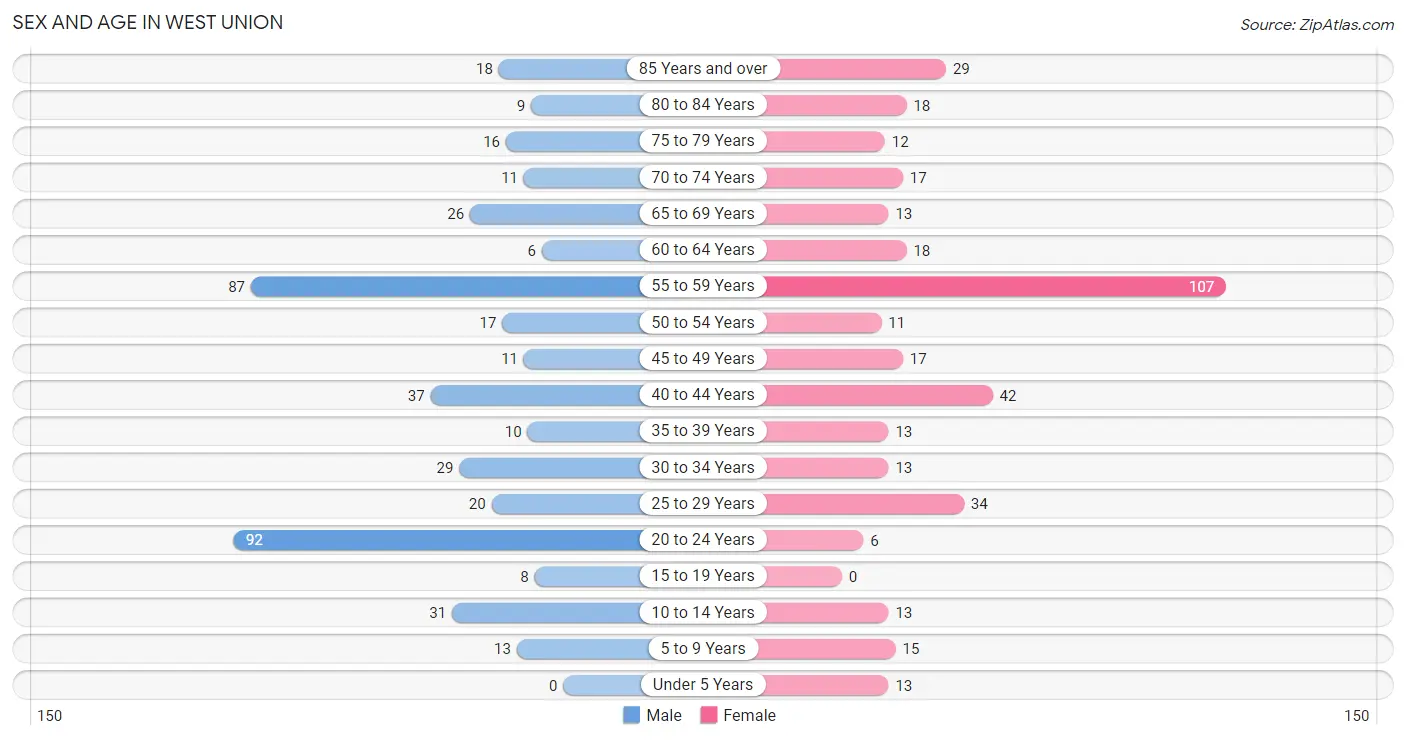
The most populous age groups in West Union are 20 to 24 Years (92 | 20.9%) for men and 55 to 59 Years (107 | 27.4%) for women.
| Age Bracket | Male | Female |
| Under 5 Years | 0 (0.0%) | 13 (3.3%) |
| 5 to 9 Years | 13 (2.9%) | 15 (3.8%) |
| 10 to 14 Years | 31 (7.0%) | 13 (3.3%) |
| 15 to 19 Years | 8 (1.8%) | 0 (0.0%) |
| 20 to 24 Years | 92 (20.9%) | 6 (1.5%) |
| 25 to 29 Years | 20 (4.5%) | 34 (8.7%) |
| 30 to 34 Years | 29 (6.6%) | 13 (3.3%) |
| 35 to 39 Years | 10 (2.3%) | 13 (3.3%) |
| 40 to 44 Years | 37 (8.4%) | 42 (10.7%) |
| 45 to 49 Years | 11 (2.5%) | 17 (4.3%) |
| 50 to 54 Years | 17 (3.8%) | 11 (2.8%) |
| 55 to 59 Years | 87 (19.7%) | 107 (27.4%) |
| 60 to 64 Years | 6 (1.4%) | 18 (4.6%) |
| 65 to 69 Years | 26 (5.9%) | 13 (3.3%) |
| 70 to 74 Years | 11 (2.5%) | 17 (4.3%) |
| 75 to 79 Years | 16 (3.6%) | 12 (3.1%) |
| 80 to 84 Years | 9 (2.0%) | 18 (4.6%) |
| 85 Years and over | 18 (4.1%) | 29 (7.4%) |
| Total | 441 (100.0%) | 391 (100.0%) |
Families and Households in West Union
Median Family Size in West Union
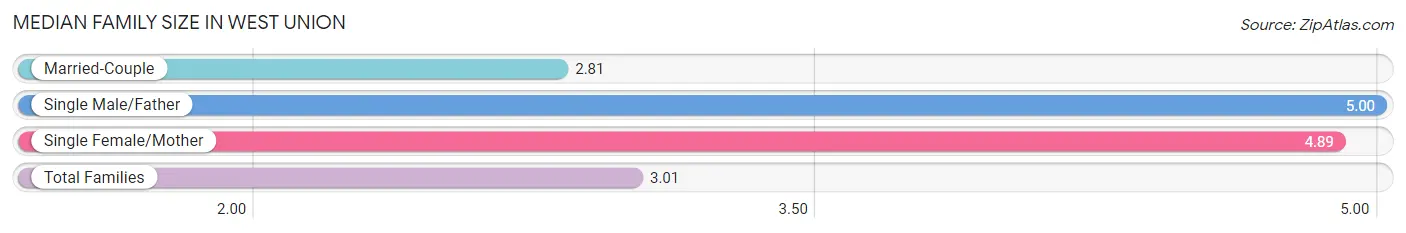
The median family size in West Union is 3.01 persons per family, with single male/father families (3 | 1.3%) accounting for the largest median family size of 5 persons per family. On the other hand, married-couple families (216 | 90.8%) represent the smallest median family size with 2.81 persons per family.
| Family Type | # Families | Family Size |
| Married-Couple | 216 (90.8%) | 2.81 |
| Single Male/Father | 3 (1.3%) | 5.00 |
| Single Female/Mother | 19 (8.0%) | 4.89 |
| Total Families | 238 (100.0%) | 3.01 |
Median Household Size in West Union
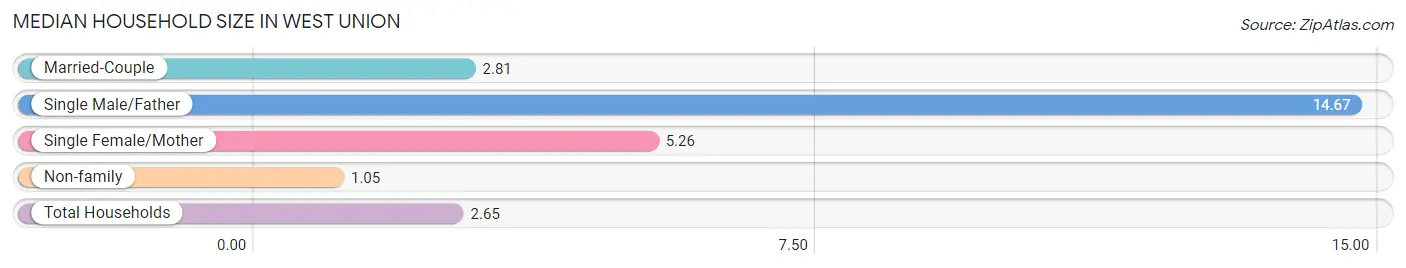
The median household size in West Union is 2.65 persons per household, with single male/father households (3 | 1.0%) accounting for the largest median household size of 14.67 persons per household. non-family households (76 | 24.2%) represent the smallest median household size with 1.05 persons per household.
| Household Type | # Households | Household Size |
| Married-Couple | 216 (68.8%) | 2.81 |
| Single Male/Father | 3 (1.0%) | 14.67 |
| Single Female/Mother | 19 (6.0%) | 5.26 |
| Non-family | 76 (24.2%) | 1.05 |
| Total Households | 314 (100.0%) | 2.65 |
Household Size by Marriage Status in West Union
Out of a total of 314 households in West Union, 238 (75.8%) are family households, while 76 (24.2%) are nonfamily households. The most numerous type of family households are 2-person households, comprising 122, and the most common type of nonfamily households are 1-person households, comprising 73.
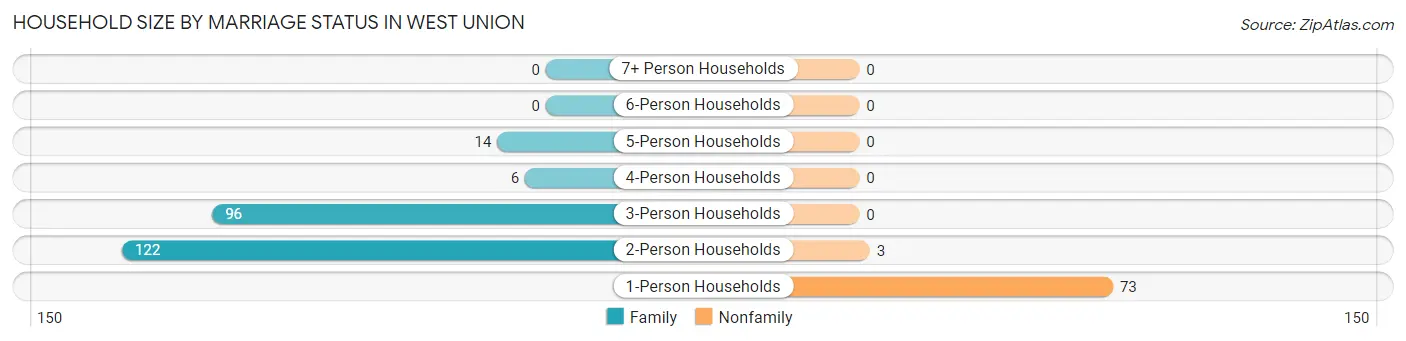
| Household Size | Family Households | Nonfamily Households |
| 1-Person Households | - | 73 (23.3%) |
| 2-Person Households | 122 (38.9%) | 3 (1.0%) |
| 3-Person Households | 96 (30.6%) | 0 (0.0%) |
| 4-Person Households | 6 (1.9%) | 0 (0.0%) |
| 5-Person Households | 14 (4.5%) | 0 (0.0%) |
| 6-Person Households | 0 (0.0%) | 0 (0.0%) |
| 7+ Person Households | 0 (0.0%) | 0 (0.0%) |
| Total | 238 (75.8%) | 76 (24.2%) |
Female Fertility in West Union
Fertility by Age in West Union
Average fertility rate in West Union is 288.0 births per 1,000 women. Women in the age bracket of 20 to 34 years have the highest fertility rate with 547.0 births per 1,000 women. Women in the age bracket of 20 to 34 years acount for 80.6% of all women with births.

| Age Bracket | Women with Births | Births / 1,000 Women |
| 15 to 19 years | 0 (0.0%) | 0.0 |
| 20 to 34 years | 29 (80.6%) | 547.0 |
| 35 to 50 years | 7 (19.4%) | 97.0 |
| Total | 36 (100.0%) | 288.0 |
Fertility by Age by Marriage Status in West Union
19.4% of women with births (36) in West Union are married. The highest percentage of unmarried women with births falls into 20 to 34 years age bracket with 100.0% of them unmarried at the time of birth, while the lowest percentage of unmarried women with births belong to 35 to 50 years age bracket with 0.0% of them unmarried.
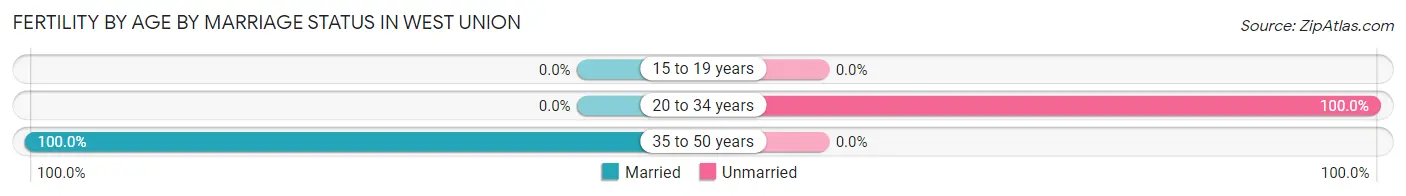
| Age Bracket | Married | Unmarried |
| 15 to 19 years | 0 (0.0%) | 0 (0.0%) |
| 20 to 34 years | 0 (0.0%) | 29 (100.0%) |
| 35 to 50 years | 7 (100.0%) | 0 (0.0%) |
| Total | 7 (19.4%) | 29 (80.6%) |
Fertility by Education in West Union
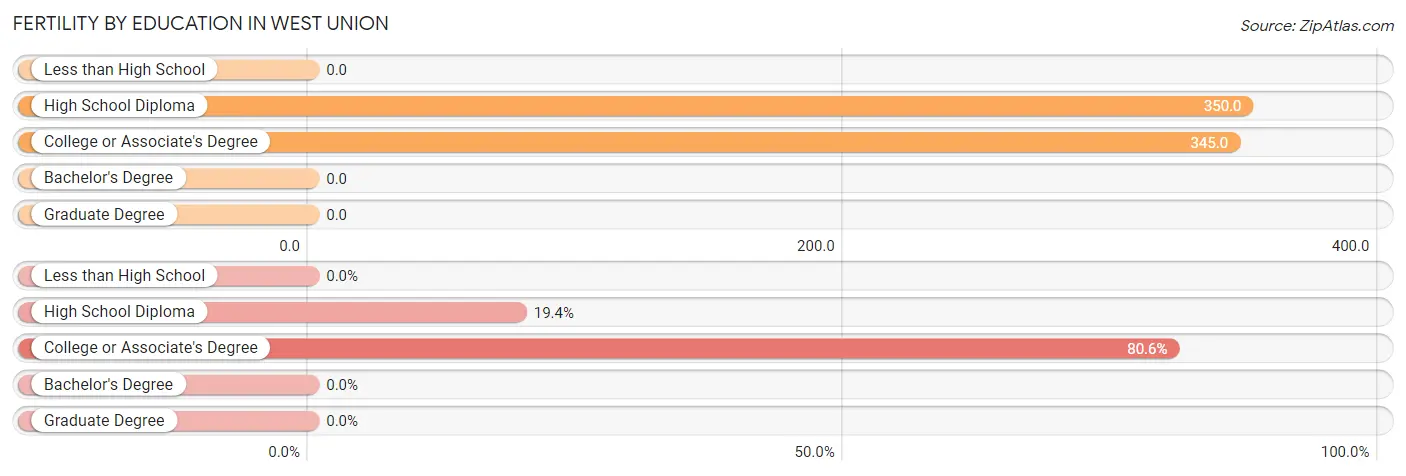
| Educational Attainment | Women with Births | Births / 1,000 Women |
| Less than High School | 0 (0.0%) | 0.0 |
| High School Diploma | 7 (19.4%) | 350.0 |
| College or Associate's Degree | 29 (80.6%) | 345.0 |
| Bachelor's Degree | 0 (0.0%) | 0.0 |
| Graduate Degree | 0 (0.0%) | 0.0 |
| Total | 36 (100.0%) | 288.0 |
Fertility by Education by Marriage Status in West Union
80.6% of women with births in West Union are unmarried. Women with the educational attainment of high school diploma are most likely to be married with 100.0% of them married at childbirth, while women with the educational attainment of college or associate's degree are least likely to be married with 100.0% of them unmarried at childbirth.
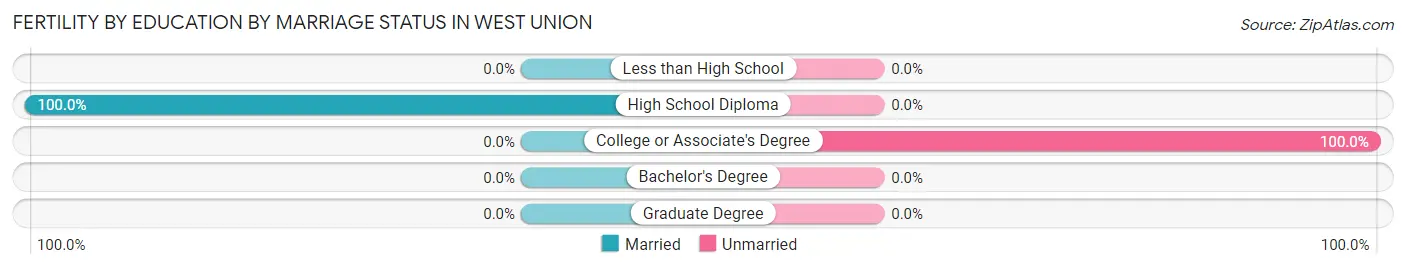
| Educational Attainment | Married | Unmarried |
| Less than High School | 0 (0.0%) | 0 (0.0%) |
| High School Diploma | 7 (100.0%) | 0 (0.0%) |
| College or Associate's Degree | 0 (0.0%) | 29 (100.0%) |
| Bachelor's Degree | 0 (0.0%) | 0 (0.0%) |
| Graduate Degree | 0 (0.0%) | 0 (0.0%) |
| Total | 7 (19.4%) | 29 (80.6%) |
Employment Characteristics in West Union
Employment by Class of Employer in West Union
Among the 487 employed individuals in West Union, private company employees (388 | 79.7%), local government employees (46 | 9.5%), and not-for-profit organizations (30 | 6.2%) make up the most common classes of employment.
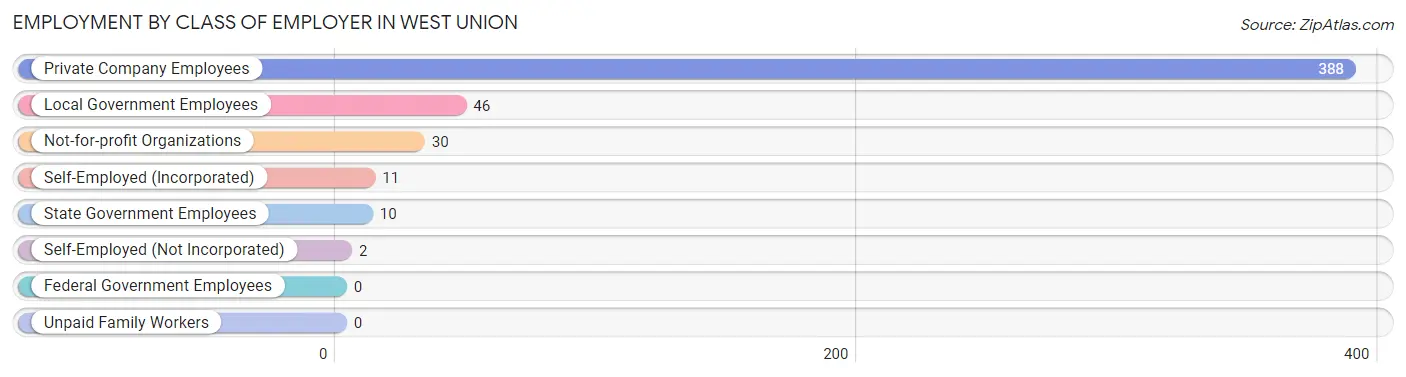
| Employer Class | # Employees | % Employees |
| Private Company Employees | 388 | 79.7% |
| Self-Employed (Incorporated) | 11 | 2.3% |
| Self-Employed (Not Incorporated) | 2 | 0.4% |
| Not-for-profit Organizations | 30 | 6.2% |
| Local Government Employees | 46 | 9.5% |
| State Government Employees | 10 | 2.1% |
| Federal Government Employees | 0 | 0.0% |
| Unpaid Family Workers | 0 | 0.0% |
| Total | 487 | 100.0% |
Employment Status by Age in West Union
According to the labor force statistics for West Union, out of the total population over 16 years of age (746), 67.0% or 500 individuals are in the labor force, with 0.4% or 2 of them unemployed. The age group with the highest labor force participation rate is 25 to 29 years, with 100.0% or 54 individuals in the labor force. Within the labor force, the 35 to 44 years age range has the highest percentage of unemployed individuals, with 2.2% or 2 of them being unemployed.
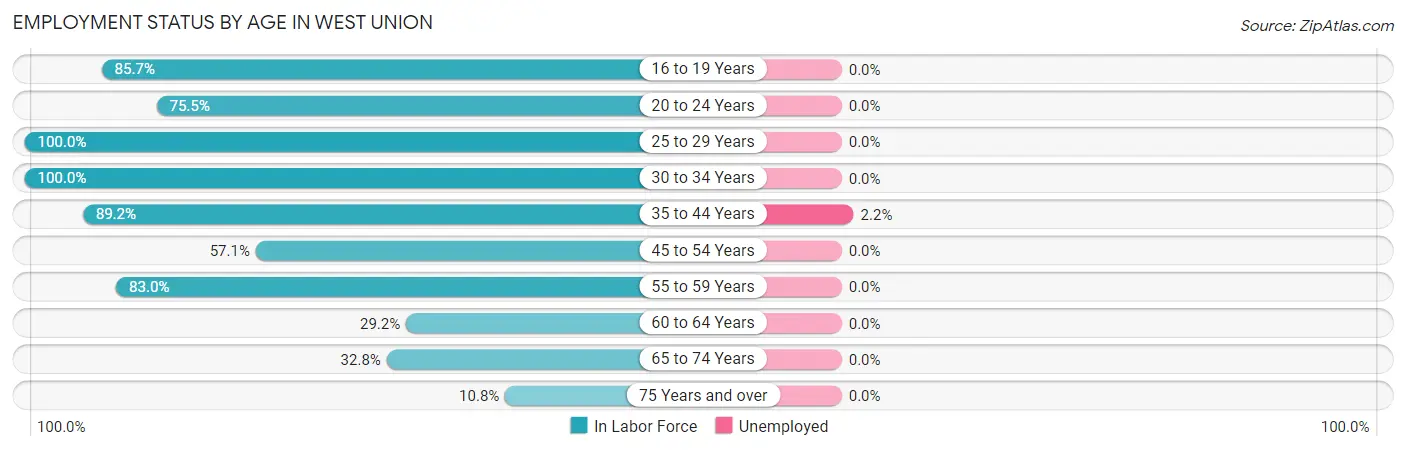
| Age Bracket | In Labor Force | Unemployed |
| 16 to 19 Years | 6 (85.7%) | 0 (0.0%) |
| 20 to 24 Years | 74 (75.5%) | 0 (0.0%) |
| 25 to 29 Years | 54 (100.0%) | 0 (0.0%) |
| 30 to 34 Years | 42 (100.0%) | 0 (0.0%) |
| 35 to 44 Years | 91 (89.2%) | 2 (2.2%) |
| 45 to 54 Years | 32 (57.1%) | 0 (0.0%) |
| 55 to 59 Years | 161 (83.0%) | 0 (0.0%) |
| 60 to 64 Years | 7 (29.2%) | 0 (0.0%) |
| 65 to 74 Years | 22 (32.8%) | 0 (0.0%) |
| 75 Years and over | 11 (10.8%) | 0 (0.0%) |
| Total | 500 (67.0%) | 2 (0.4%) |
Employment Status by Educational Attainment in West Union
According to labor force statistics for West Union, 82.0% of individuals (387) out of the total population between 25 and 64 years of age (472) are in the labor force, with 0.5% or 2 of them being unemployed. The group with the highest labor force participation rate are those with the educational attainment of bachelor's degree or higher, with 97.5% or 77 individuals in the labor force. Within the labor force, individuals with high school diploma education have the highest percentage of unemployment, with 1.4% or 2 of them being unemployed.
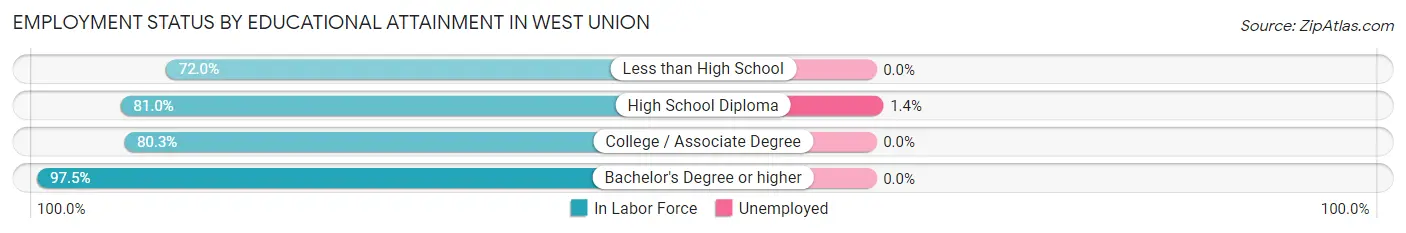
| Educational Attainment | In Labor Force | Unemployed |
| Less than High School | 59 (72.0%) | 0 (0.0%) |
| High School Diploma | 145 (81.0%) | 3 (1.4%) |
| College / Associate Degree | 106 (80.3%) | 0 (0.0%) |
| Bachelor's Degree or higher | 77 (97.5%) | 0 (0.0%) |
| Total | 387 (82.0%) | 2 (0.5%) |
Employment Occupations by Sex in West Union
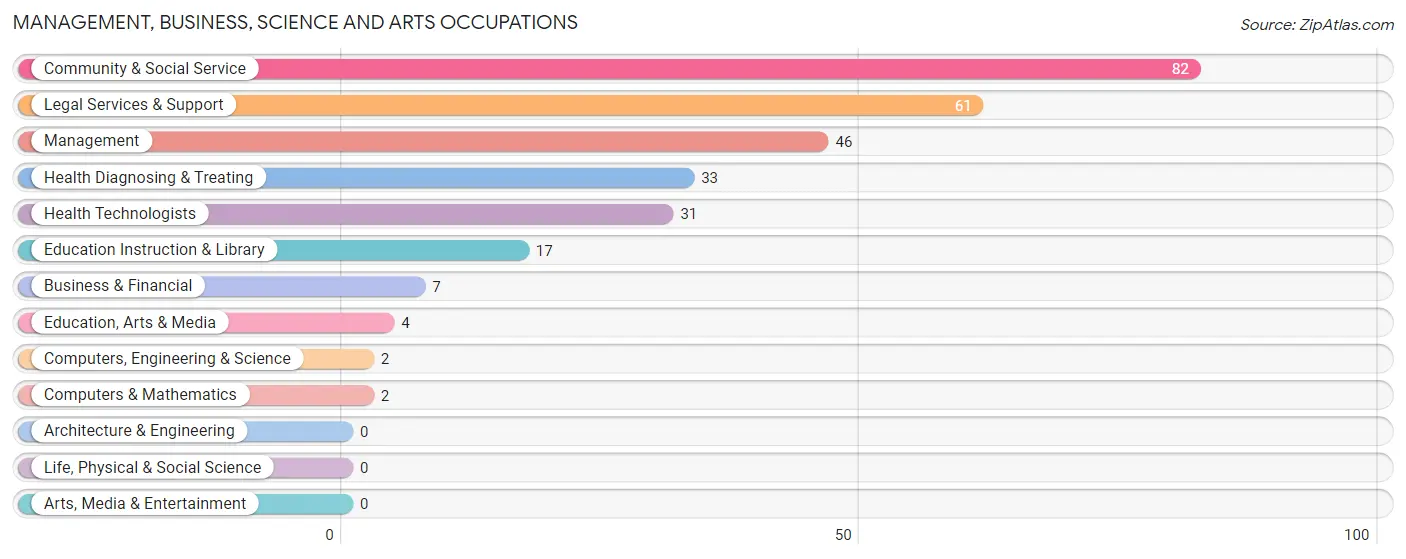
Management, Business, Science and Arts Occupations
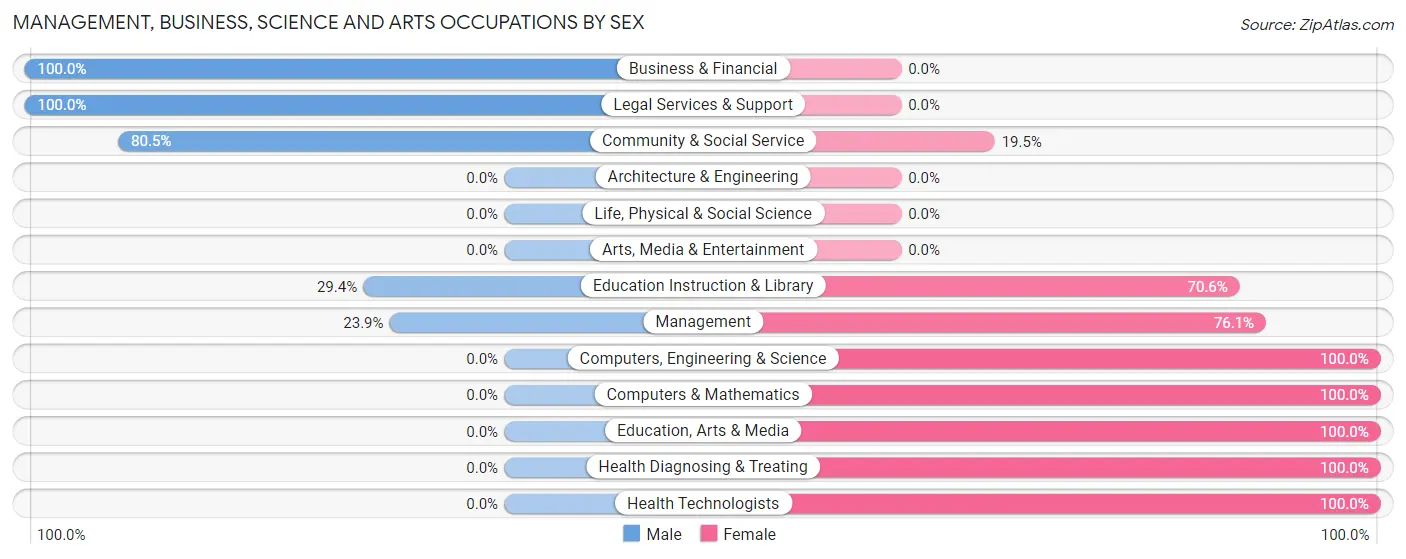
The most common Management, Business, Science and Arts occupations in West Union are Community & Social Service (82 | 16.5%), Legal Services & Support (61 | 12.2%), Management (46 | 9.2%), Health Diagnosing & Treating (33 | 6.6%), and Health Technologists (31 | 6.2%).
Management, Business, Science and Arts Occupations by Sex
Within the Management, Business, Science and Arts occupations in West Union, the most male-oriented occupations are Business & Financial (100.0%), Legal Services & Support (100.0%), and Community & Social Service (80.5%), while the most female-oriented occupations are Computers, Engineering & Science (100.0%), Computers & Mathematics (100.0%), and Education, Arts & Media (100.0%).
| Occupation | Male | Female |
| Management | 11 (23.9%) | 35 (76.1%) |
| Business & Financial | 7 (100.0%) | 0 (0.0%) |
| Computers, Engineering & Science | 0 (0.0%) | 2 (100.0%) |
| Computers & Mathematics | 0 (0.0%) | 2 (100.0%) |
| Architecture & Engineering | 0 (0.0%) | 0 (0.0%) |
| Life, Physical & Social Science | 0 (0.0%) | 0 (0.0%) |
| Community & Social Service | 66 (80.5%) | 16 (19.5%) |
| Education, Arts & Media | 0 (0.0%) | 4 (100.0%) |
| Legal Services & Support | 61 (100.0%) | 0 (0.0%) |
| Education Instruction & Library | 5 (29.4%) | 12 (70.6%) |
| Arts, Media & Entertainment | 0 (0.0%) | 0 (0.0%) |
| Health Diagnosing & Treating | 0 (0.0%) | 33 (100.0%) |
| Health Technologists | 0 (0.0%) | 31 (100.0%) |
| Total (Category) | 84 (49.4%) | 86 (50.6%) |
| Total (Overall) | 285 (57.2%) | 213 (42.8%) |
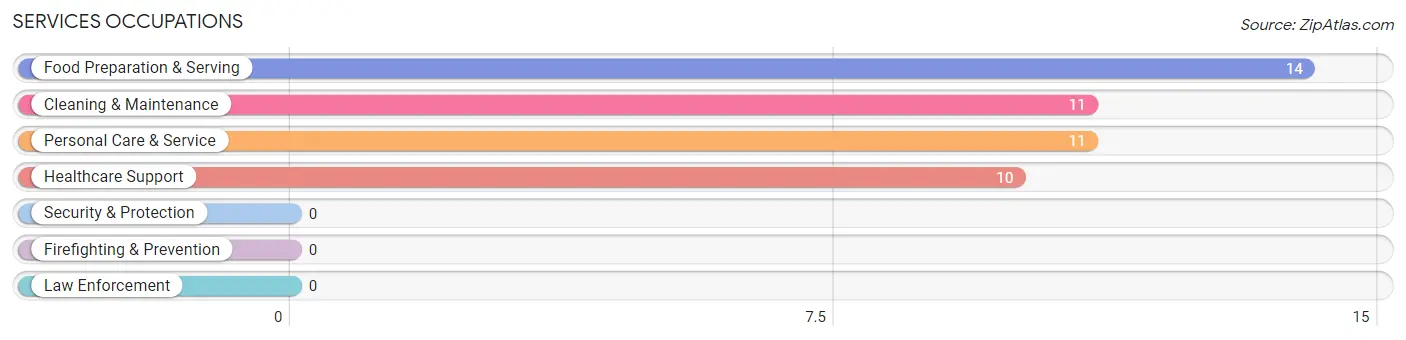
Services Occupations
The most common Services occupations in West Union are Food Preparation & Serving (14 | 2.8%), Cleaning & Maintenance (11 | 2.2%), Personal Care & Service (11 | 2.2%), and Healthcare Support (10 | 2.0%).
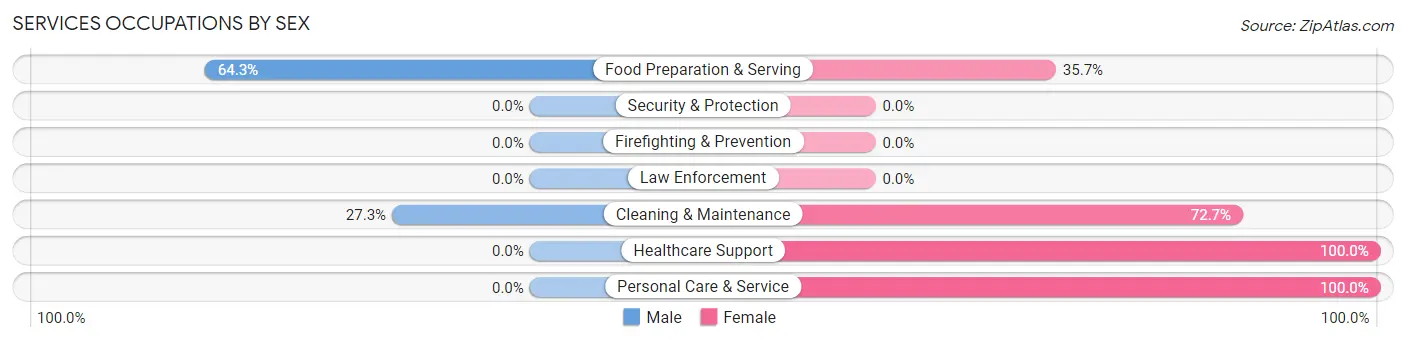
Services Occupations by Sex
Within the Services occupations in West Union, the most male-oriented occupations are Food Preparation & Serving (64.3%), and Cleaning & Maintenance (27.3%), while the most female-oriented occupations are Healthcare Support (100.0%), Personal Care & Service (100.0%), and Cleaning & Maintenance (72.7%).
| Occupation | Male | Female |
| Healthcare Support | 0 (0.0%) | 10 (100.0%) |
| Security & Protection | 0 (0.0%) | 0 (0.0%) |
| Firefighting & Prevention | 0 (0.0%) | 0 (0.0%) |
| Law Enforcement | 0 (0.0%) | 0 (0.0%) |
| Food Preparation & Serving | 9 (64.3%) | 5 (35.7%) |
| Cleaning & Maintenance | 3 (27.3%) | 8 (72.7%) |
| Personal Care & Service | 0 (0.0%) | 11 (100.0%) |
| Total (Category) | 12 (26.1%) | 34 (73.9%) |
| Total (Overall) | 285 (57.2%) | 213 (42.8%) |
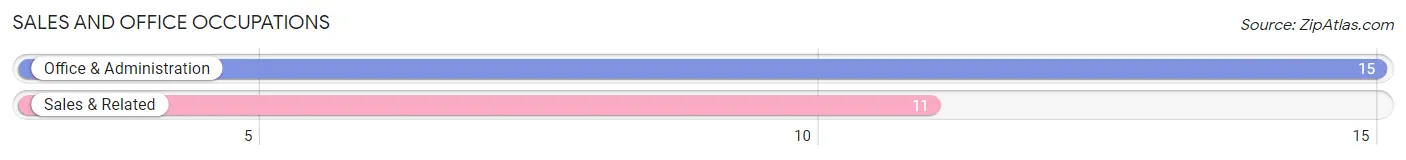
Sales and Office Occupations
The most common Sales and Office occupations in West Union are Office & Administration (15 | 3.0%), and Sales & Related (11 | 2.2%).
Sales and Office Occupations by Sex
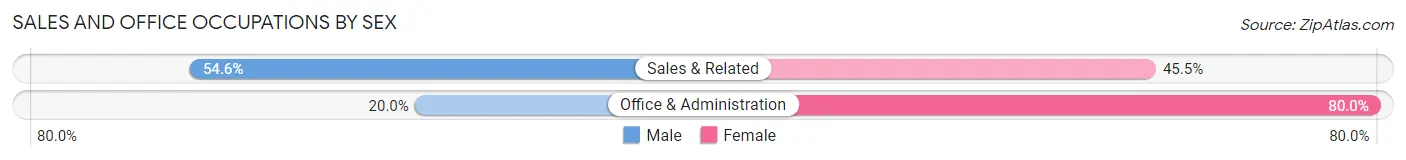
| Occupation | Male | Female |
| Sales & Related | 6 (54.5%) | 5 (45.5%) |
| Office & Administration | 3 (20.0%) | 12 (80.0%) |
| Total (Category) | 9 (34.6%) | 17 (65.4%) |
| Total (Overall) | 285 (57.2%) | 213 (42.8%) |
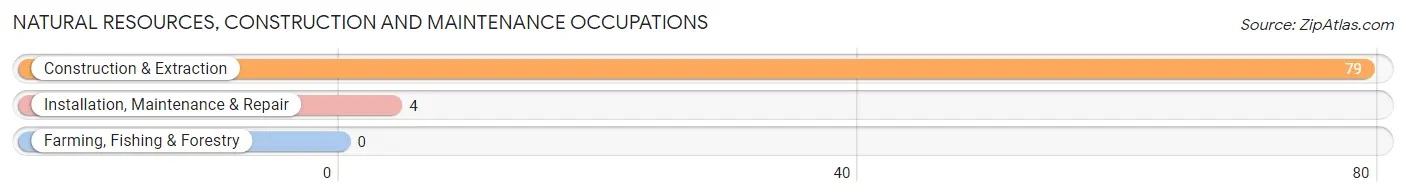
Natural Resources, Construction and Maintenance Occupations
The most common Natural Resources, Construction and Maintenance occupations in West Union are Construction & Extraction (79 | 15.9%), and Installation, Maintenance & Repair (4 | 0.8%).
Natural Resources, Construction and Maintenance Occupations by Sex
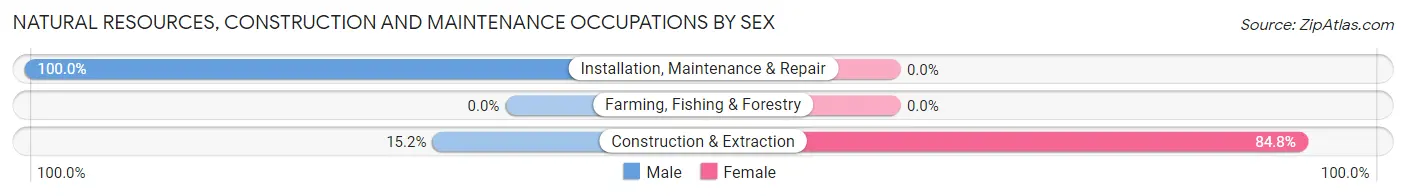
| Occupation | Male | Female |
| Farming, Fishing & Forestry | 0 (0.0%) | 0 (0.0%) |
| Construction & Extraction | 12 (15.2%) | 67 (84.8%) |
| Installation, Maintenance & Repair | 4 (100.0%) | 0 (0.0%) |
| Total (Category) | 16 (19.3%) | 67 (80.7%) |
| Total (Overall) | 285 (57.2%) | 213 (42.8%) |
Production, Transportation and Moving Occupations
The most common Production, Transportation and Moving occupations in West Union are Production (104 | 20.9%), Transportation (42 | 8.4%), and Material Moving (27 | 5.4%).
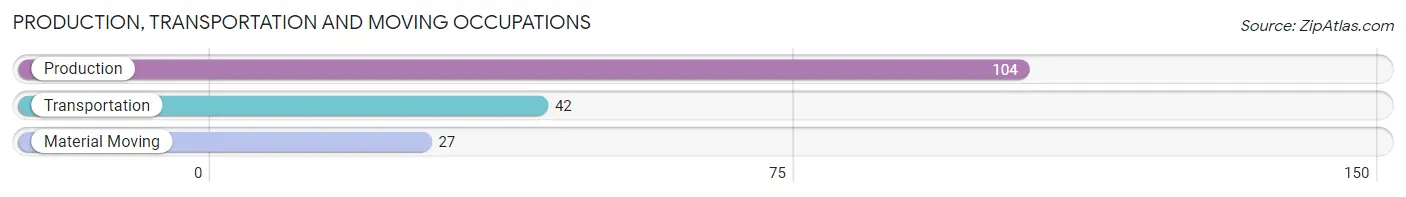
Production, Transportation and Moving Occupations by Sex
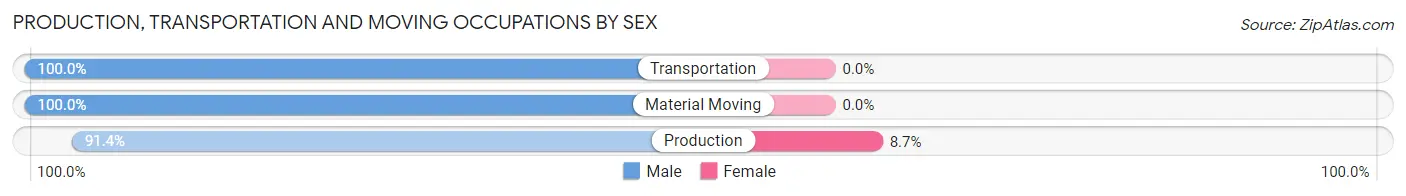
| Occupation | Male | Female |
| Production | 95 (91.3%) | 9 (8.6%) |
| Transportation | 42 (100.0%) | 0 (0.0%) |
| Material Moving | 27 (100.0%) | 0 (0.0%) |
| Total (Category) | 164 (94.8%) | 9 (5.2%) |
| Total (Overall) | 285 (57.2%) | 213 (42.8%) |
Employment Industries by Sex in West Union
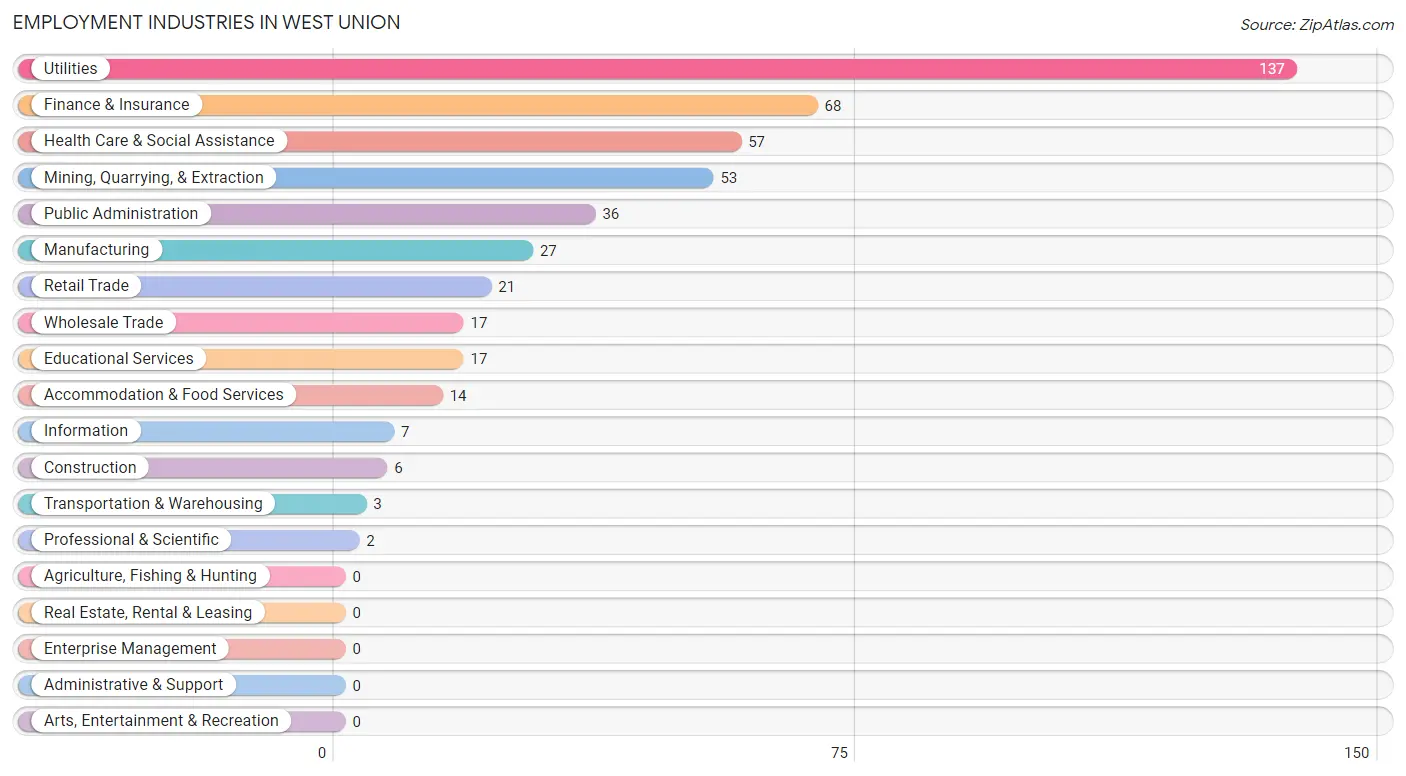
Employment Industries in West Union
The major employment industries in West Union include Utilities (137 | 27.5%), Finance & Insurance (68 | 13.7%), Health Care & Social Assistance (57 | 11.5%), Mining, Quarrying, & Extraction (53 | 10.6%), and Public Administration (36 | 7.2%).
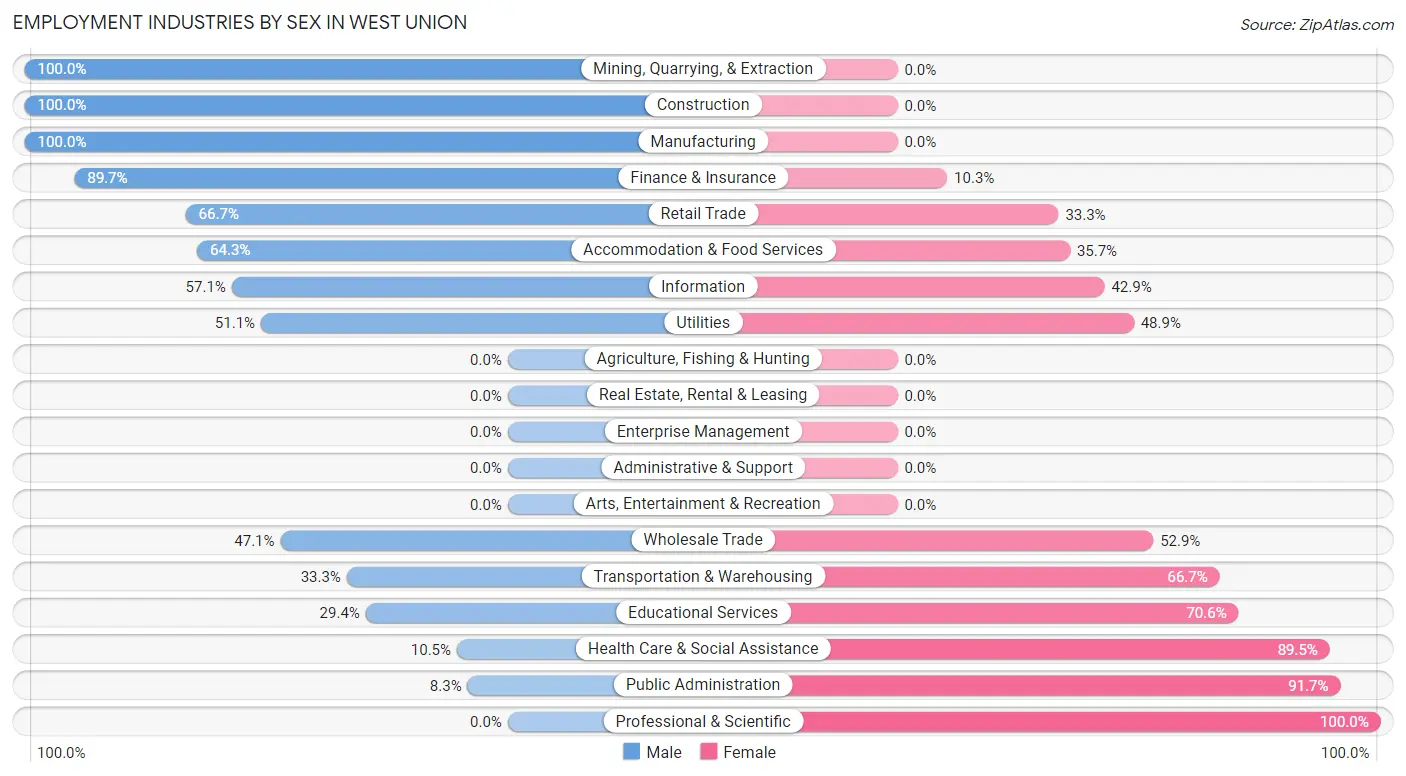
Employment Industries by Sex in West Union
The West Union industries that see more men than women are Mining, Quarrying, & Extraction (100.0%), Construction (100.0%), and Manufacturing (100.0%), whereas the industries that tend to have a higher number of women are Professional & Scientific (100.0%), Public Administration (91.7%), and Health Care & Social Assistance (89.5%).
| Industry | Male | Female |
| Agriculture, Fishing & Hunting | 0 (0.0%) | 0 (0.0%) |
| Mining, Quarrying, & Extraction | 53 (100.0%) | 0 (0.0%) |
| Construction | 6 (100.0%) | 0 (0.0%) |
| Manufacturing | 27 (100.0%) | 0 (0.0%) |
| Wholesale Trade | 8 (47.1%) | 9 (52.9%) |
| Retail Trade | 14 (66.7%) | 7 (33.3%) |
| Transportation & Warehousing | 1 (33.3%) | 2 (66.7%) |
| Utilities | 70 (51.1%) | 67 (48.9%) |
| Information | 4 (57.1%) | 3 (42.9%) |
| Finance & Insurance | 61 (89.7%) | 7 (10.3%) |
| Real Estate, Rental & Leasing | 0 (0.0%) | 0 (0.0%) |
| Professional & Scientific | 0 (0.0%) | 2 (100.0%) |
| Enterprise Management | 0 (0.0%) | 0 (0.0%) |
| Administrative & Support | 0 (0.0%) | 0 (0.0%) |
| Educational Services | 5 (29.4%) | 12 (70.6%) |
| Health Care & Social Assistance | 6 (10.5%) | 51 (89.5%) |
| Arts, Entertainment & Recreation | 0 (0.0%) | 0 (0.0%) |
| Accommodation & Food Services | 9 (64.3%) | 5 (35.7%) |
| Public Administration | 3 (8.3%) | 33 (91.7%) |
| Total | 285 (57.2%) | 213 (42.8%) |
Education in West Union
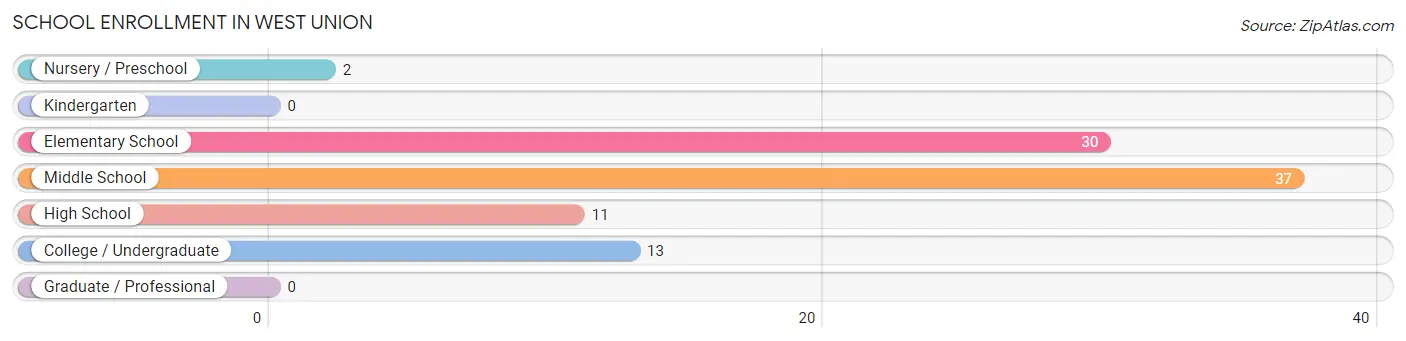
School Enrollment in West Union
The most common levels of schooling among the 93 students in West Union are middle school (37 | 39.8%), elementary school (30 | 32.3%), and college / undergraduate (13 | 14.0%).
| School Level | # Students | % Students |
| Nursery / Preschool | 2 | 2.1% |
| Kindergarten | 0 | 0.0% |
| Elementary School | 30 | 32.3% |
| Middle School | 37 | 39.8% |
| High School | 11 | 11.8% |
| College / Undergraduate | 13 | 14.0% |
| Graduate / Professional | 0 | 0.0% |
| Total | 93 | 100.0% |
School Enrollment by Age by Funding Source in West Union
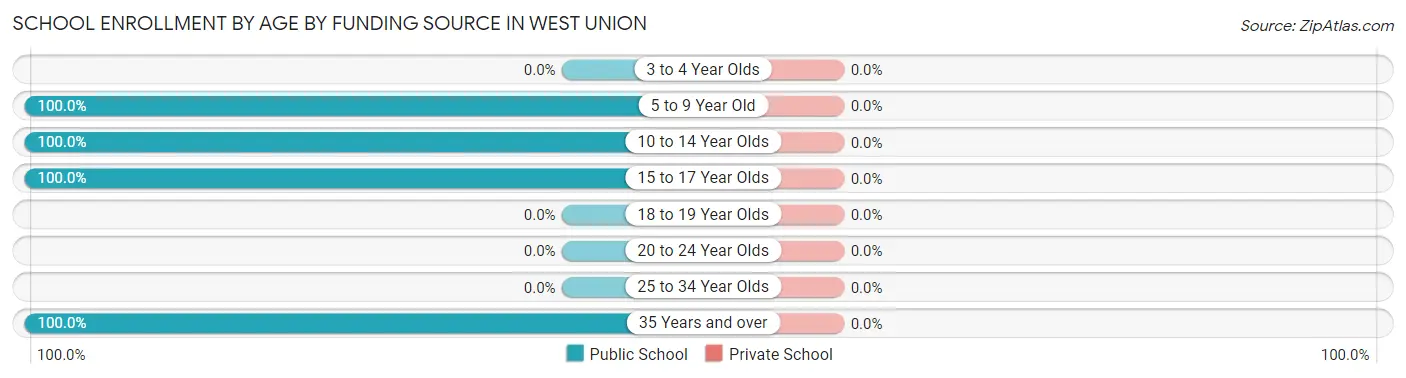
| Age Bracket | Public School | Private School |
| 3 to 4 Year Olds | 0 (0.0%) | 0 (0.0%) |
| 5 to 9 Year Old | 28 (100.0%) | 0 (0.0%) |
| 10 to 14 Year Olds | 44 (100.0%) | 0 (0.0%) |
| 15 to 17 Year Olds | 8 (100.0%) | 0 (0.0%) |
| 18 to 19 Year Olds | 0 (0.0%) | 0 (0.0%) |
| 20 to 24 Year Olds | 0 (0.0%) | 0 (0.0%) |
| 25 to 34 Year Olds | 0 (0.0%) | 0 (0.0%) |
| 35 Years and over | 13 (100.0%) | 0 (0.0%) |
| Total | 93 (100.0%) | 0 (0.0%) |
Educational Attainment by Field of Study in West Union
Social sciences (61 | 37.2%), liberal arts & history (61 | 37.2%), education (22 | 13.4%), bio, nature & agricultural (6 | 3.7%), and science & technology (6 | 3.7%) are the most common fields of study among 164 individuals in West Union who have obtained a bachelor's degree or higher.
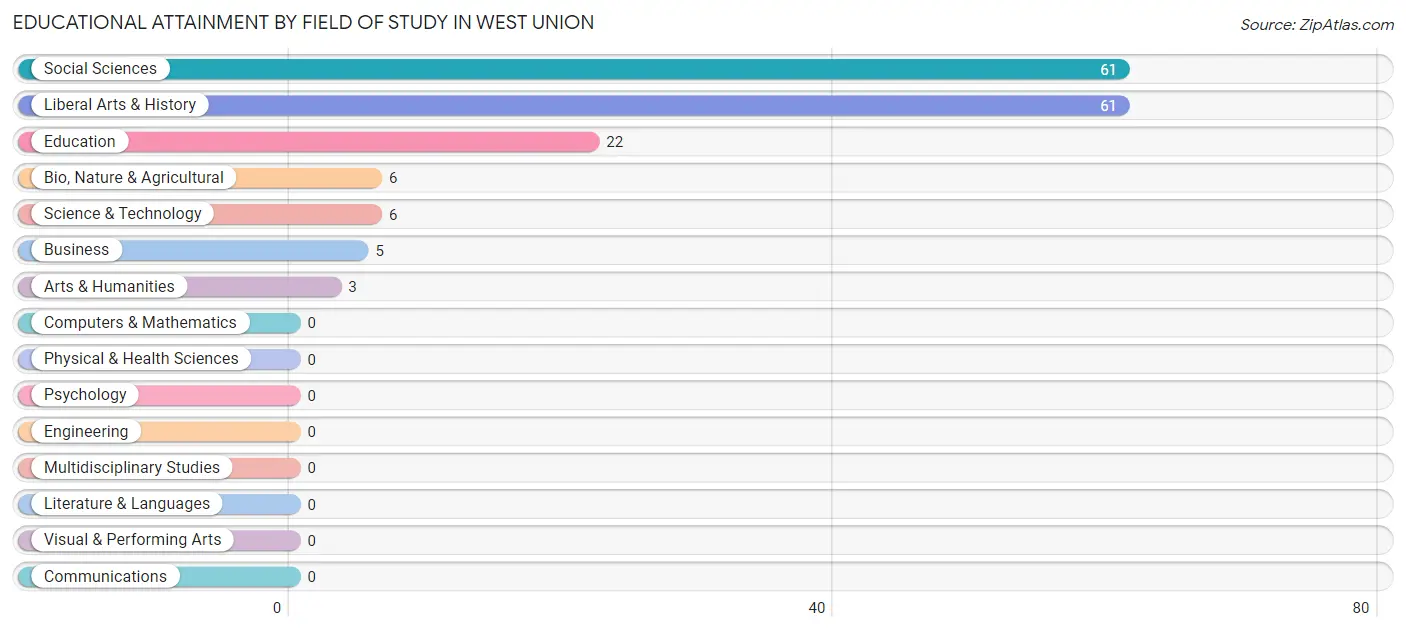
| Field of Study | # Graduates | % Graduates |
| Computers & Mathematics | 0 | 0.0% |
| Bio, Nature & Agricultural | 6 | 3.7% |
| Physical & Health Sciences | 0 | 0.0% |
| Psychology | 0 | 0.0% |
| Social Sciences | 61 | 37.2% |
| Engineering | 0 | 0.0% |
| Multidisciplinary Studies | 0 | 0.0% |
| Science & Technology | 6 | 3.7% |
| Business | 5 | 3.0% |
| Education | 22 | 13.4% |
| Literature & Languages | 0 | 0.0% |
| Liberal Arts & History | 61 | 37.2% |
| Visual & Performing Arts | 0 | 0.0% |
| Communications | 0 | 0.0% |
| Arts & Humanities | 3 | 1.8% |
| Total | 164 | 100.0% |
Transportation & Commute in West Union
Vehicle Availability by Sex in West Union
The most prevalent vehicle ownership categories in West Union are males with 5 or more vehicles (131, accounting for 46.8%) and females with 5 or more vehicles (67, making up 63.3%).
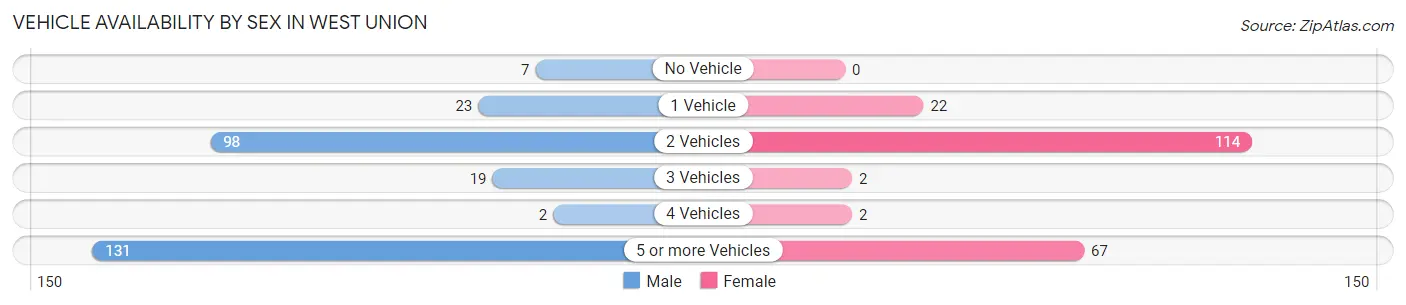
| Vehicles Available | Male | Female |
| No Vehicle | 7 (2.5%) | 0 (0.0%) |
| 1 Vehicle | 23 (8.2%) | 22 (10.6%) |
| 2 Vehicles | 98 (35.0%) | 114 (55.1%) |
| 3 Vehicles | 19 (6.8%) | 2 (1.0%) |
| 4 Vehicles | 2 (0.7%) | 2 (1.0%) |
| 5 or more Vehicles | 131 (46.8%) | 67 (32.4%) |
| Total | 280 (100.0%) | 207 (100.0%) |
Commute Time in West Union
The most frequently occuring commute durations in West Union are 30 to 34 minutes (77 commuters, 18.5%), 35 to 39 minutes (74 commuters, 17.8%), and 5 to 9 minutes (65 commuters, 15.7%).
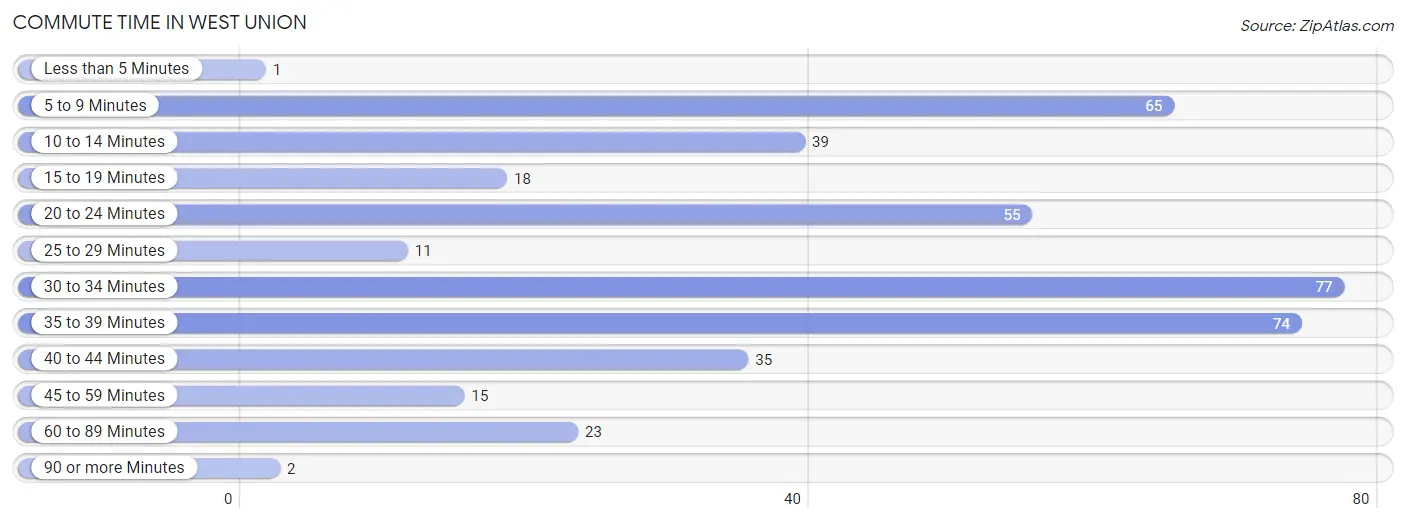
| Commute Time | # Commuters | % Commuters |
| Less than 5 Minutes | 1 | 0.2% |
| 5 to 9 Minutes | 65 | 15.7% |
| 10 to 14 Minutes | 39 | 9.4% |
| 15 to 19 Minutes | 18 | 4.3% |
| 20 to 24 Minutes | 55 | 13.3% |
| 25 to 29 Minutes | 11 | 2.6% |
| 30 to 34 Minutes | 77 | 18.5% |
| 35 to 39 Minutes | 74 | 17.8% |
| 40 to 44 Minutes | 35 | 8.4% |
| 45 to 59 Minutes | 15 | 3.6% |
| 60 to 89 Minutes | 23 | 5.5% |
| 90 or more Minutes | 2 | 0.5% |
Commute Time by Sex in West Union
The most common commute times in West Union are 35 to 39 minutes (70 commuters, 32.0%) for males and 30 to 34 minutes (73 commuters, 37.2%) for females.
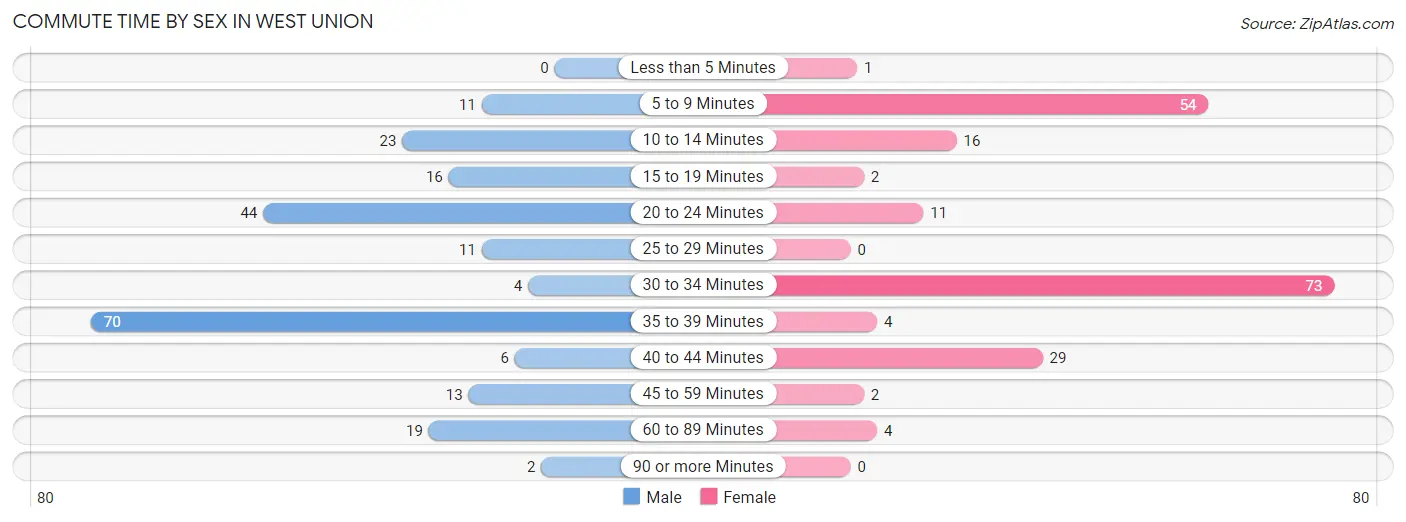
| Commute Time | Male | Female |
| Less than 5 Minutes | 0 (0.0%) | 1 (0.5%) |
| 5 to 9 Minutes | 11 (5.0%) | 54 (27.6%) |
| 10 to 14 Minutes | 23 (10.5%) | 16 (8.2%) |
| 15 to 19 Minutes | 16 (7.3%) | 2 (1.0%) |
| 20 to 24 Minutes | 44 (20.1%) | 11 (5.6%) |
| 25 to 29 Minutes | 11 (5.0%) | 0 (0.0%) |
| 30 to 34 Minutes | 4 (1.8%) | 73 (37.2%) |
| 35 to 39 Minutes | 70 (32.0%) | 4 (2.0%) |
| 40 to 44 Minutes | 6 (2.7%) | 29 (14.8%) |
| 45 to 59 Minutes | 13 (5.9%) | 2 (1.0%) |
| 60 to 89 Minutes | 19 (8.7%) | 4 (2.0%) |
| 90 or more Minutes | 2 (0.9%) | 0 (0.0%) |
Time of Departure to Work by Sex in West Union
The most frequent times of departure to work in West Union are 6:30 AM to 6:59 AM (97, 44.3%) for males and 6:30 AM to 6:59 AM (100, 51.0%) for females.
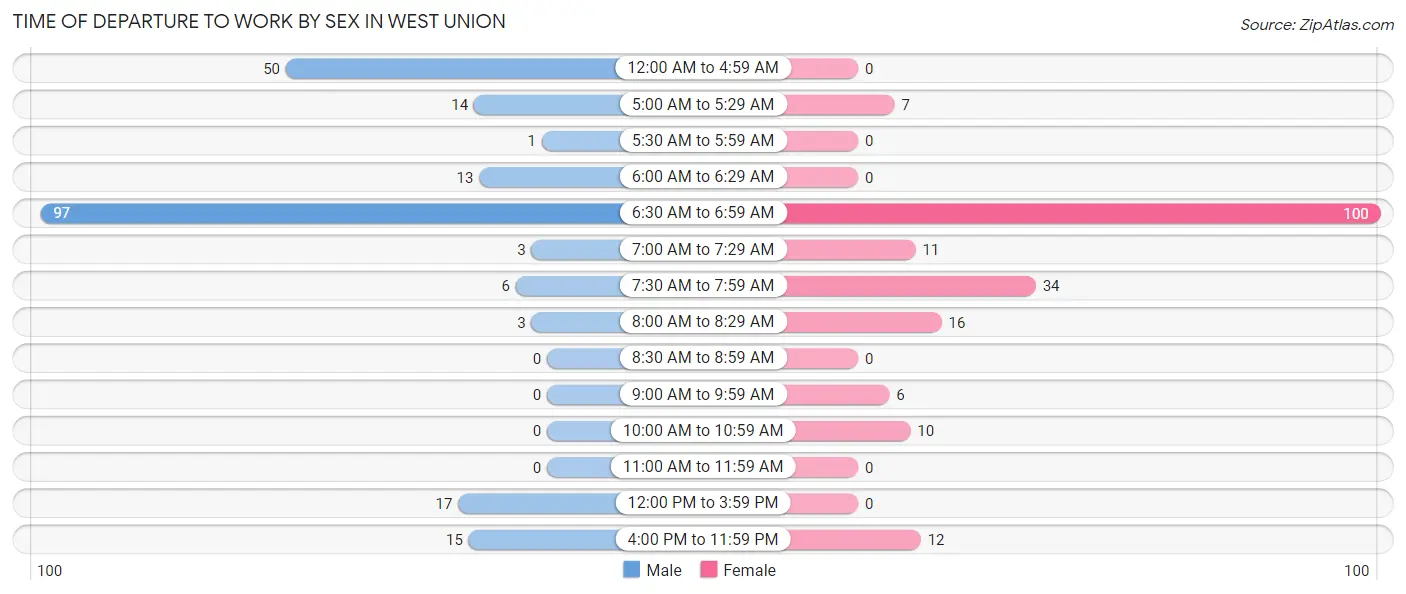
| Time of Departure | Male | Female |
| 12:00 AM to 4:59 AM | 50 (22.8%) | 0 (0.0%) |
| 5:00 AM to 5:29 AM | 14 (6.4%) | 7 (3.6%) |
| 5:30 AM to 5:59 AM | 1 (0.5%) | 0 (0.0%) |
| 6:00 AM to 6:29 AM | 13 (5.9%) | 0 (0.0%) |
| 6:30 AM to 6:59 AM | 97 (44.3%) | 100 (51.0%) |
| 7:00 AM to 7:29 AM | 3 (1.4%) | 11 (5.6%) |
| 7:30 AM to 7:59 AM | 6 (2.7%) | 34 (17.3%) |
| 8:00 AM to 8:29 AM | 3 (1.4%) | 16 (8.2%) |
| 8:30 AM to 8:59 AM | 0 (0.0%) | 0 (0.0%) |
| 9:00 AM to 9:59 AM | 0 (0.0%) | 6 (3.1%) |
| 10:00 AM to 10:59 AM | 0 (0.0%) | 10 (5.1%) |
| 11:00 AM to 11:59 AM | 0 (0.0%) | 0 (0.0%) |
| 12:00 PM to 3:59 PM | 17 (7.8%) | 0 (0.0%) |
| 4:00 PM to 11:59 PM | 15 (6.9%) | 12 (6.1%) |
| Total | 219 (100.0%) | 196 (100.0%) |
Housing Occupancy in West Union
Occupancy by Ownership in West Union
Of the total 314 dwellings in West Union, owner-occupied units account for 268 (85.4%), while renter-occupied units make up 46 (14.6%).
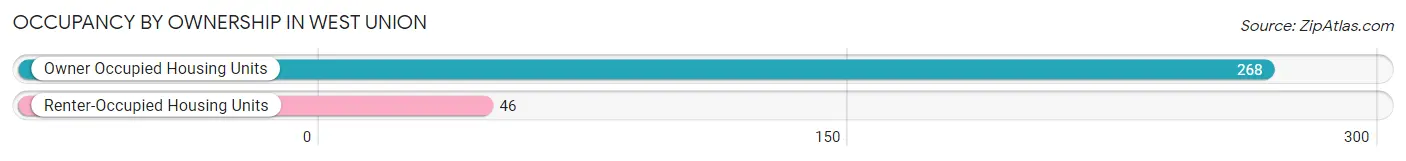
| Occupancy | # Housing Units | % Housing Units |
| Owner Occupied Housing Units | 268 | 85.4% |
| Renter-Occupied Housing Units | 46 | 14.6% |
| Total Occupied Housing Units | 314 | 100.0% |
Occupancy by Household Size in West Union
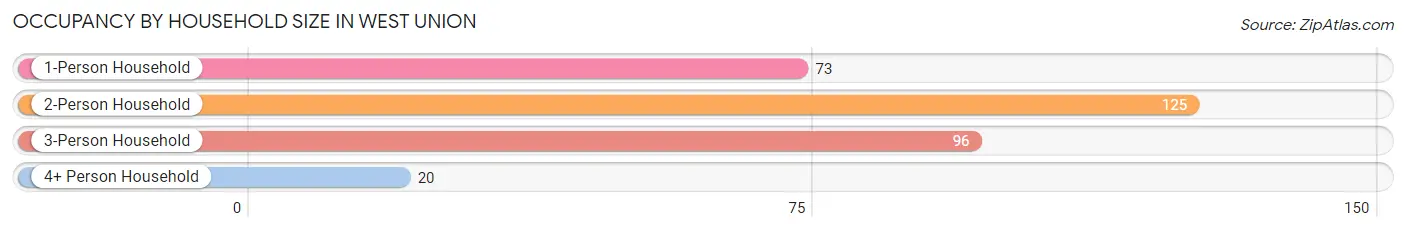
| Household Size | # Housing Units | % Housing Units |
| 1-Person Household | 73 | 23.3% |
| 2-Person Household | 125 | 39.8% |
| 3-Person Household | 96 | 30.6% |
| 4+ Person Household | 20 | 6.4% |
| Total Housing Units | 314 | 100.0% |
Occupancy by Ownership by Household Size in West Union
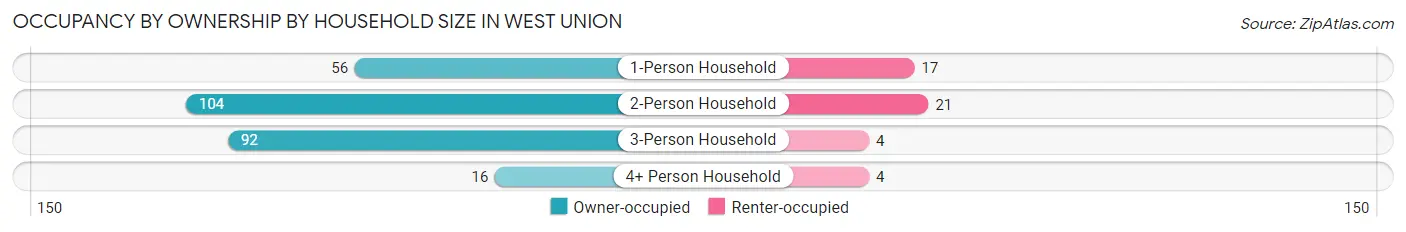
| Household Size | Owner-occupied | Renter-occupied |
| 1-Person Household | 56 (76.7%) | 17 (23.3%) |
| 2-Person Household | 104 (83.2%) | 21 (16.8%) |
| 3-Person Household | 92 (95.8%) | 4 (4.2%) |
| 4+ Person Household | 16 (80.0%) | 4 (20.0%) |
| Total Housing Units | 268 (85.4%) | 46 (14.6%) |
Occupancy by Educational Attainment in West Union
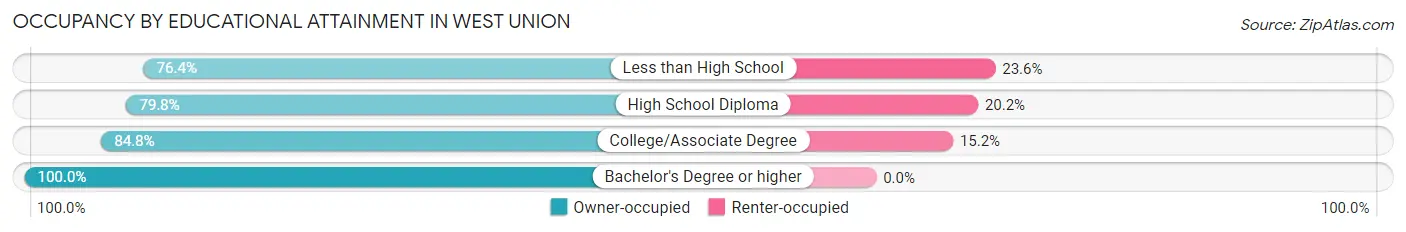
| Household Size | Owner-occupied | Renter-occupied |
| Less than High School | 55 (76.4%) | 17 (23.6%) |
| High School Diploma | 87 (79.8%) | 22 (20.2%) |
| College/Associate Degree | 39 (84.8%) | 7 (15.2%) |
| Bachelor's Degree or higher | 87 (100.0%) | 0 (0.0%) |
Occupancy by Age of Householder in West Union
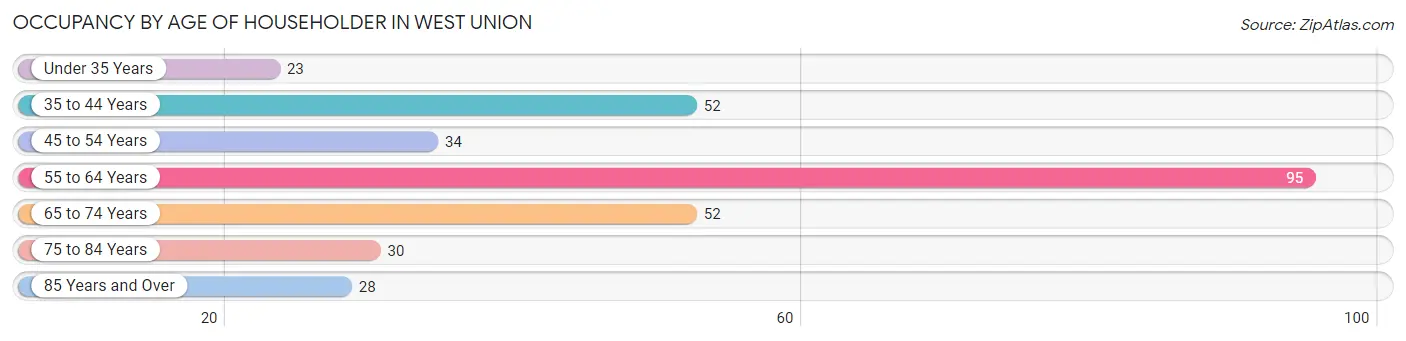
| Age Bracket | # Households | % Households |
| Under 35 Years | 23 | 7.3% |
| 35 to 44 Years | 52 | 16.6% |
| 45 to 54 Years | 34 | 10.8% |
| 55 to 64 Years | 95 | 30.2% |
| 65 to 74 Years | 52 | 16.6% |
| 75 to 84 Years | 30 | 9.6% |
| 85 Years and Over | 28 | 8.9% |
| Total | 314 | 100.0% |
Housing Finances in West Union
Median Income by Occupancy in West Union
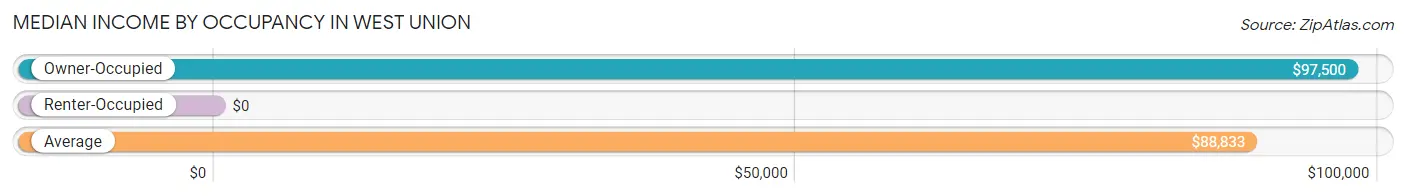
| Occupancy Type | # Households | Median Income |
| Owner-Occupied | 268 (85.4%) | $97,500 |
| Renter-Occupied | 46 (14.6%) | $0 |
| Average | 314 (100.0%) | $88,833 |
Occupancy by Householder Income Bracket in West Union
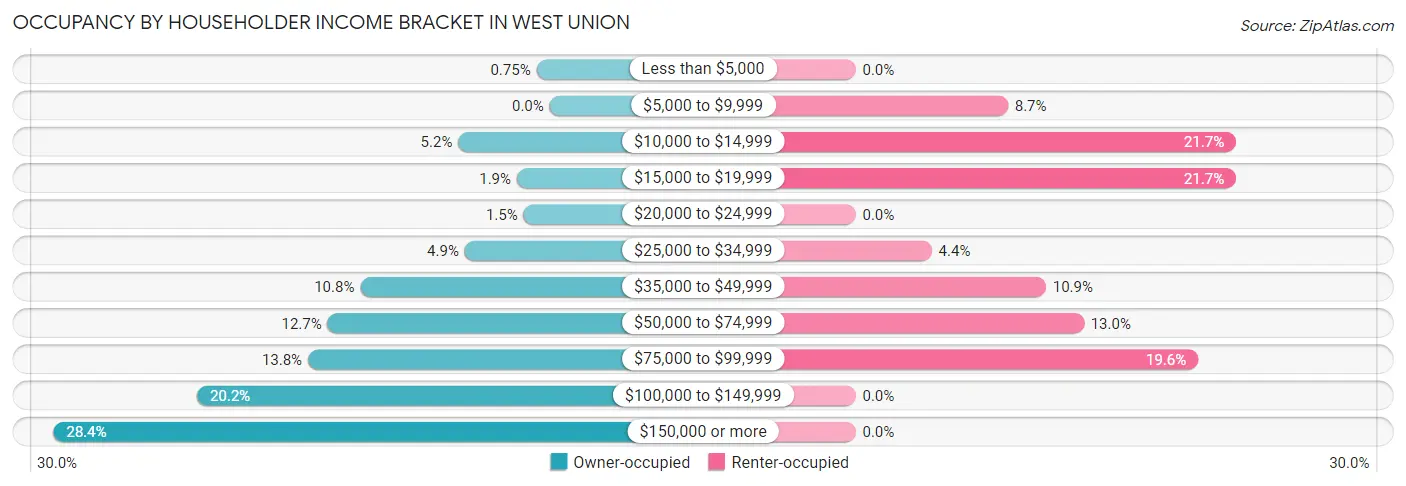
| Income Bracket | Owner-occupied | Renter-occupied |
| Less than $5,000 | 2 (0.7%) | 0 (0.0%) |
| $5,000 to $9,999 | 0 (0.0%) | 4 (8.7%) |
| $10,000 to $14,999 | 14 (5.2%) | 10 (21.7%) |
| $15,000 to $19,999 | 5 (1.9%) | 10 (21.7%) |
| $20,000 to $24,999 | 4 (1.5%) | 0 (0.0%) |
| $25,000 to $34,999 | 13 (4.9%) | 2 (4.3%) |
| $35,000 to $49,999 | 29 (10.8%) | 5 (10.9%) |
| $50,000 to $74,999 | 34 (12.7%) | 6 (13.0%) |
| $75,000 to $99,999 | 37 (13.8%) | 9 (19.6%) |
| $100,000 to $149,999 | 54 (20.2%) | 0 (0.0%) |
| $150,000 or more | 76 (28.4%) | 0 (0.0%) |
| Total | 268 (100.0%) | 46 (100.0%) |
Monthly Housing Cost Tiers in West Union
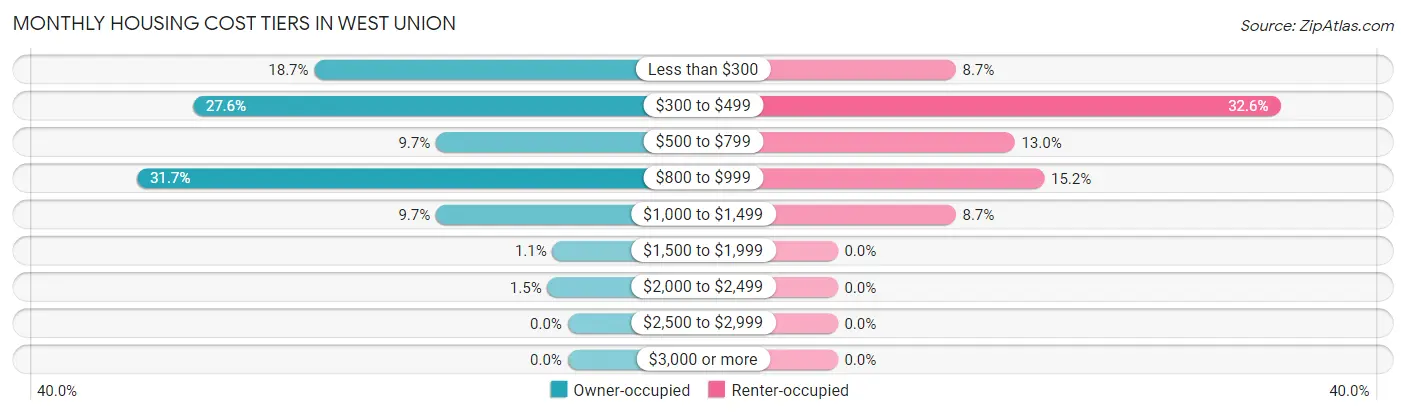
| Monthly Cost | Owner-occupied | Renter-occupied |
| Less than $300 | 50 (18.7%) | 4 (8.7%) |
| $300 to $499 | 74 (27.6%) | 15 (32.6%) |
| $500 to $799 | 26 (9.7%) | 6 (13.0%) |
| $800 to $999 | 85 (31.7%) | 7 (15.2%) |
| $1,000 to $1,499 | 26 (9.7%) | 4 (8.7%) |
| $1,500 to $1,999 | 3 (1.1%) | 0 (0.0%) |
| $2,000 to $2,499 | 4 (1.5%) | 0 (0.0%) |
| $2,500 to $2,999 | 0 (0.0%) | 0 (0.0%) |
| $3,000 or more | 0 (0.0%) | 0 (0.0%) |
| Total | 268 (100.0%) | 46 (100.0%) |
Physical Housing Characteristics in West Union
Housing Structures in West Union
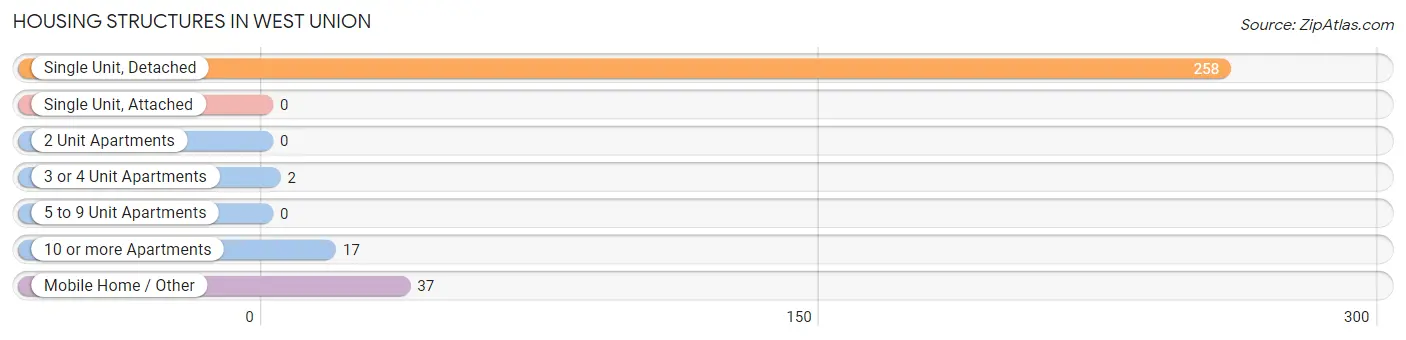
| Structure Type | # Housing Units | % Housing Units |
| Single Unit, Detached | 258 | 82.2% |
| Single Unit, Attached | 0 | 0.0% |
| 2 Unit Apartments | 0 | 0.0% |
| 3 or 4 Unit Apartments | 2 | 0.6% |
| 5 to 9 Unit Apartments | 0 | 0.0% |
| 10 or more Apartments | 17 | 5.4% |
| Mobile Home / Other | 37 | 11.8% |
| Total | 314 | 100.0% |
Housing Structures by Occupancy in West Union
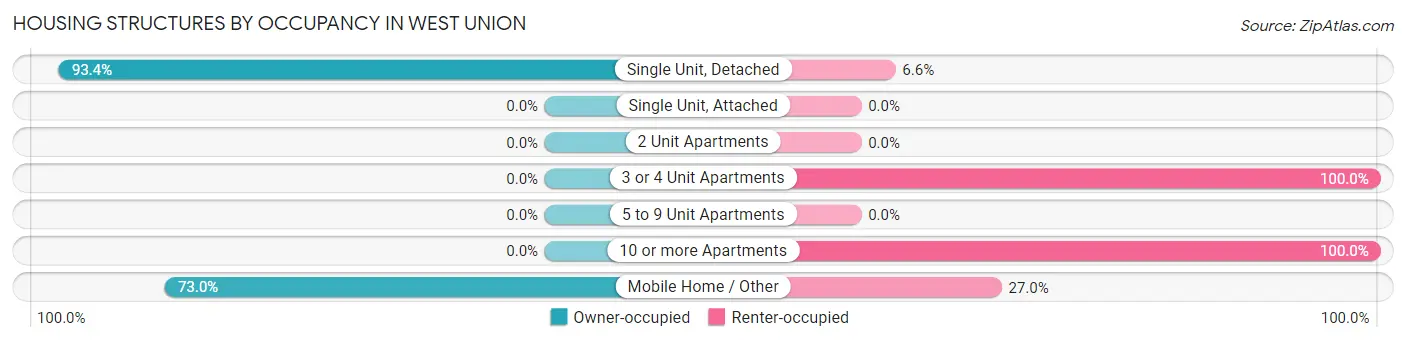
| Structure Type | Owner-occupied | Renter-occupied |
| Single Unit, Detached | 241 (93.4%) | 17 (6.6%) |
| Single Unit, Attached | 0 (0.0%) | 0 (0.0%) |
| 2 Unit Apartments | 0 (0.0%) | 0 (0.0%) |
| 3 or 4 Unit Apartments | 0 (0.0%) | 2 (100.0%) |
| 5 to 9 Unit Apartments | 0 (0.0%) | 0 (0.0%) |
| 10 or more Apartments | 0 (0.0%) | 17 (100.0%) |
| Mobile Home / Other | 27 (73.0%) | 10 (27.0%) |
| Total | 268 (85.4%) | 46 (14.6%) |
Housing Structures by Number of Rooms in West Union
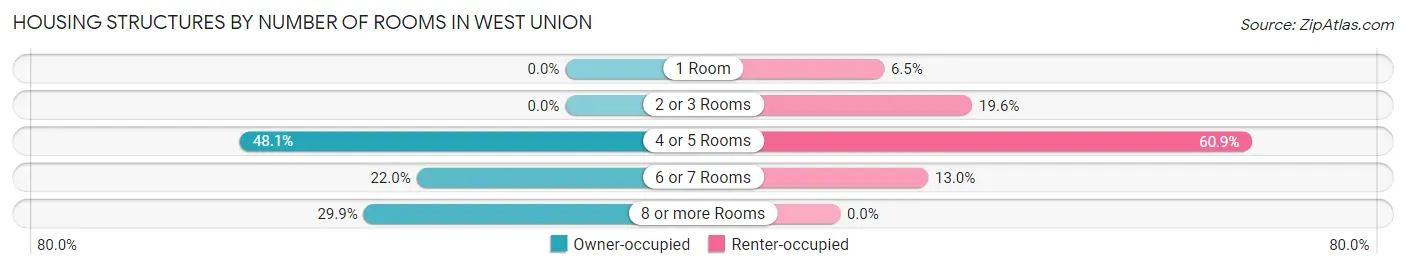
| Number of Rooms | Owner-occupied | Renter-occupied |
| 1 Room | 0 (0.0%) | 3 (6.5%) |
| 2 or 3 Rooms | 0 (0.0%) | 9 (19.6%) |
| 4 or 5 Rooms | 129 (48.1%) | 28 (60.9%) |
| 6 or 7 Rooms | 59 (22.0%) | 6 (13.0%) |
| 8 or more Rooms | 80 (29.8%) | 0 (0.0%) |
| Total | 268 (100.0%) | 46 (100.0%) |
Housing Structure by Heating Type in West Union
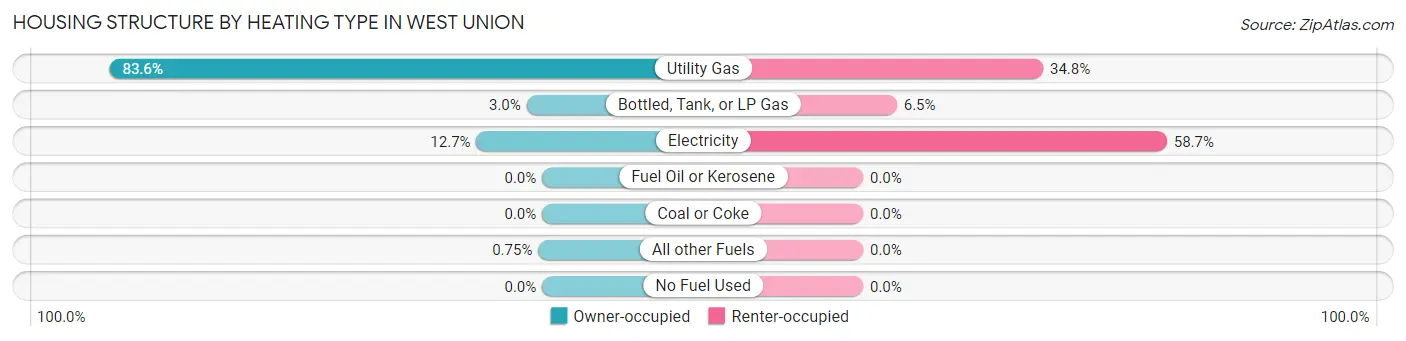
| Heating Type | Owner-occupied | Renter-occupied |
| Utility Gas | 224 (83.6%) | 16 (34.8%) |
| Bottled, Tank, or LP Gas | 8 (3.0%) | 3 (6.5%) |
| Electricity | 34 (12.7%) | 27 (58.7%) |
| Fuel Oil or Kerosene | 0 (0.0%) | 0 (0.0%) |
| Coal or Coke | 0 (0.0%) | 0 (0.0%) |
| All other Fuels | 2 (0.7%) | 0 (0.0%) |
| No Fuel Used | 0 (0.0%) | 0 (0.0%) |
| Total | 268 (100.0%) | 46 (100.0%) |
Household Vehicle Usage in West Union
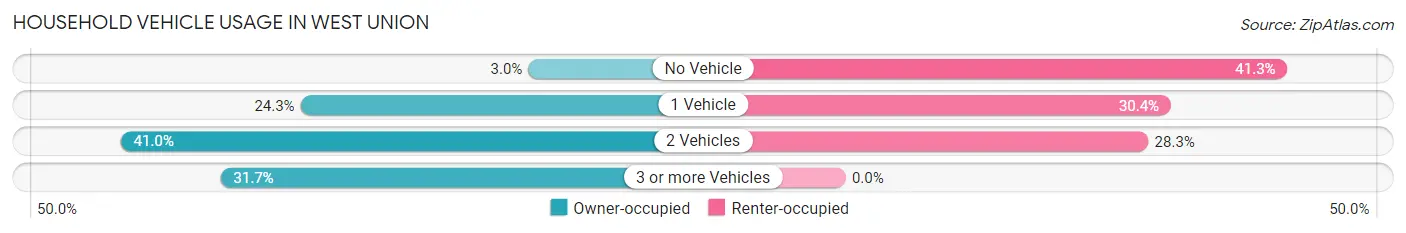
| Vehicles per Household | Owner-occupied | Renter-occupied |
| No Vehicle | 8 (3.0%) | 19 (41.3%) |
| 1 Vehicle | 65 (24.2%) | 14 (30.4%) |
| 2 Vehicles | 110 (41.0%) | 13 (28.3%) |
| 3 or more Vehicles | 85 (31.7%) | 0 (0.0%) |
| Total | 268 (100.0%) | 46 (100.0%) |
Real Estate & Mortgages in West Union
Real Estate and Mortgage Overview in West Union
| Characteristic | Without Mortgage | With Mortgage |
| Housing Units | 136 | 132 |
| Median Property Value | $54,600 | $157,500 |
| Median Household Income | $66,071 | $61 |
| Monthly Housing Costs | $404 | $0 |
| Real Estate Taxes | $367 | $4 |
Property Value by Mortgage Status in West Union
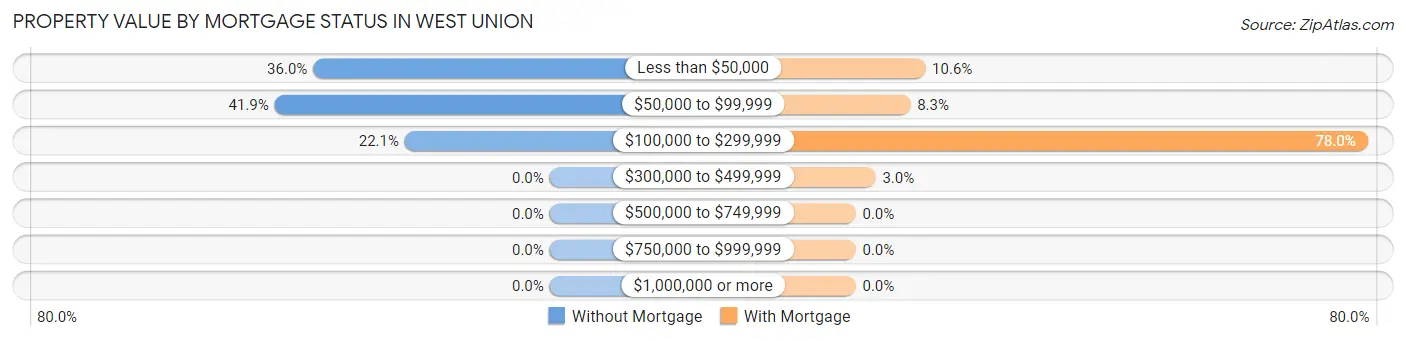
| Property Value | Without Mortgage | With Mortgage |
| Less than $50,000 | 49 (36.0%) | 14 (10.6%) |
| $50,000 to $99,999 | 57 (41.9%) | 11 (8.3%) |
| $100,000 to $299,999 | 30 (22.1%) | 103 (78.0%) |
| $300,000 to $499,999 | 0 (0.0%) | 4 (3.0%) |
| $500,000 to $749,999 | 0 (0.0%) | 0 (0.0%) |
| $750,000 to $999,999 | 0 (0.0%) | 0 (0.0%) |
| $1,000,000 or more | 0 (0.0%) | 0 (0.0%) |
| Total | 136 (100.0%) | 132 (100.0%) |
Household Income by Mortgage Status in West Union
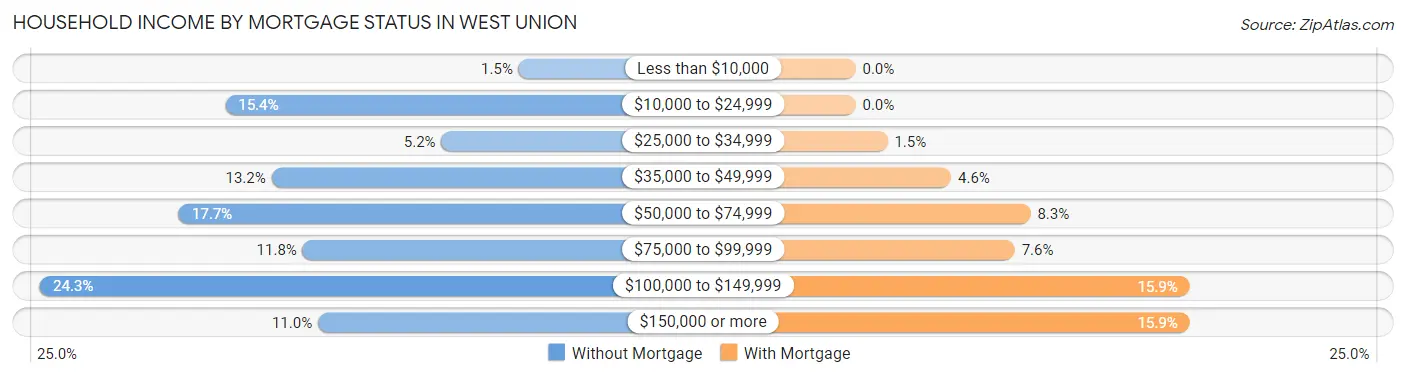
| Household Income | Without Mortgage | With Mortgage |
| Less than $10,000 | 2 (1.5%) | 0 (0.0%) |
| $10,000 to $24,999 | 21 (15.4%) | 0 (0.0%) |
| $25,000 to $34,999 | 7 (5.1%) | 2 (1.5%) |
| $35,000 to $49,999 | 18 (13.2%) | 6 (4.5%) |
| $50,000 to $74,999 | 24 (17.6%) | 11 (8.3%) |
| $75,000 to $99,999 | 16 (11.8%) | 10 (7.6%) |
| $100,000 to $149,999 | 33 (24.3%) | 21 (15.9%) |
| $150,000 or more | 15 (11.0%) | 21 (15.9%) |
| Total | 136 (100.0%) | 132 (100.0%) |
Property Value to Household Income Ratio in West Union
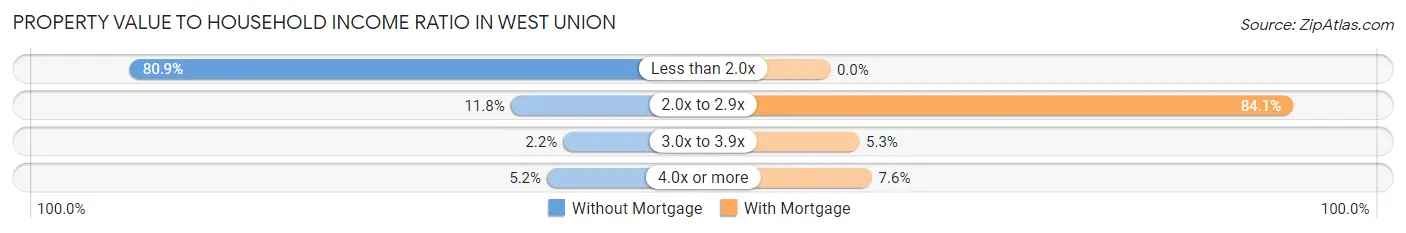
| Value-to-Income Ratio | Without Mortgage | With Mortgage |
| Less than 2.0x | 110 (80.9%) | 0 (0.0%) |
| 2.0x to 2.9x | 16 (11.8%) | 111 (84.1%) |
| 3.0x to 3.9x | 3 (2.2%) | 7 (5.3%) |
| 4.0x or more | 7 (5.1%) | 10 (7.6%) |
| Total | 136 (100.0%) | 132 (100.0%) |
Real Estate Taxes by Mortgage Status in West Union
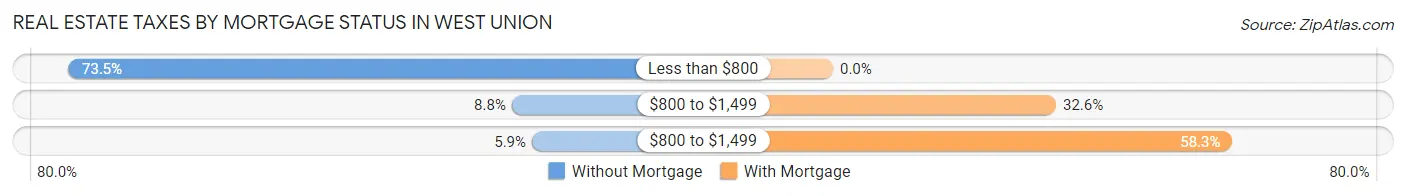
| Property Taxes | Without Mortgage | With Mortgage |
| Less than $800 | 100 (73.5%) | 0 (0.0%) |
| $800 to $1,499 | 12 (8.8%) | 43 (32.6%) |
| $800 to $1,499 | 8 (5.9%) | 77 (58.3%) |
| Total | 136 (100.0%) | 132 (100.0%) |
Health & Disability in West Union
Health Insurance Coverage by Age in West Union
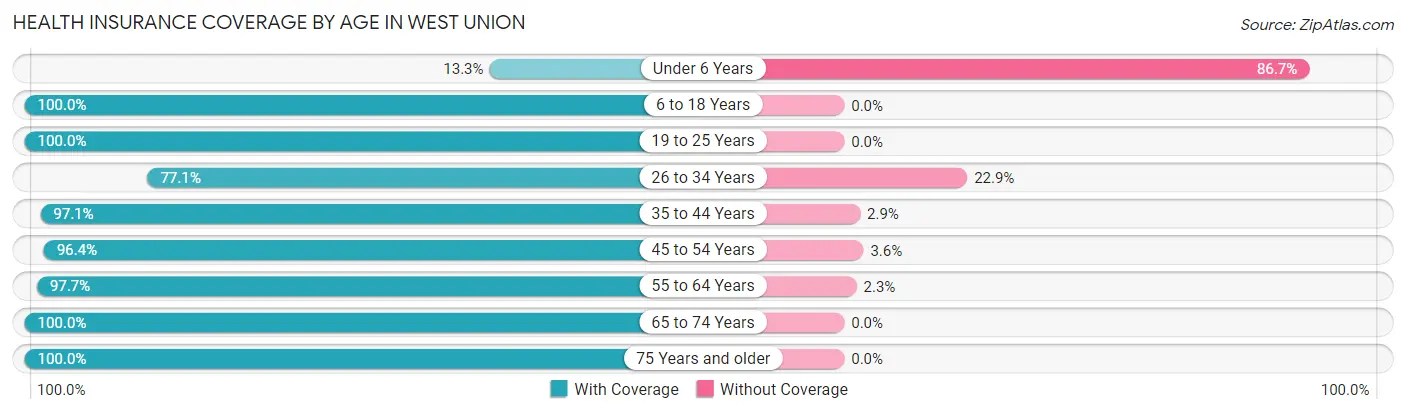
| Age Bracket | With Coverage | Without Coverage |
| Under 6 Years | 2 (13.3%) | 13 (86.7%) |
| 6 to 18 Years | 78 (100.0%) | 0 (0.0%) |
| 19 to 25 Years | 98 (100.0%) | 0 (0.0%) |
| 26 to 34 Years | 74 (77.1%) | 22 (22.9%) |
| 35 to 44 Years | 99 (97.1%) | 3 (2.9%) |
| 45 to 54 Years | 54 (96.4%) | 2 (3.6%) |
| 55 to 64 Years | 213 (97.7%) | 5 (2.3%) |
| 65 to 74 Years | 67 (100.0%) | 0 (0.0%) |
| 75 Years and older | 102 (100.0%) | 0 (0.0%) |
| Total | 787 (94.6%) | 45 (5.4%) |
Health Insurance Coverage by Citizenship Status in West Union
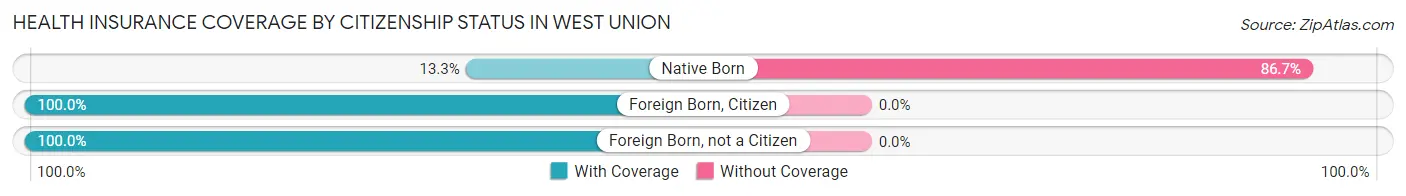
| Citizenship Status | With Coverage | Without Coverage |
| Native Born | 2 (13.3%) | 13 (86.7%) |
| Foreign Born, Citizen | 78 (100.0%) | 0 (0.0%) |
| Foreign Born, not a Citizen | 98 (100.0%) | 0 (0.0%) |
Health Insurance Coverage by Household Income in West Union
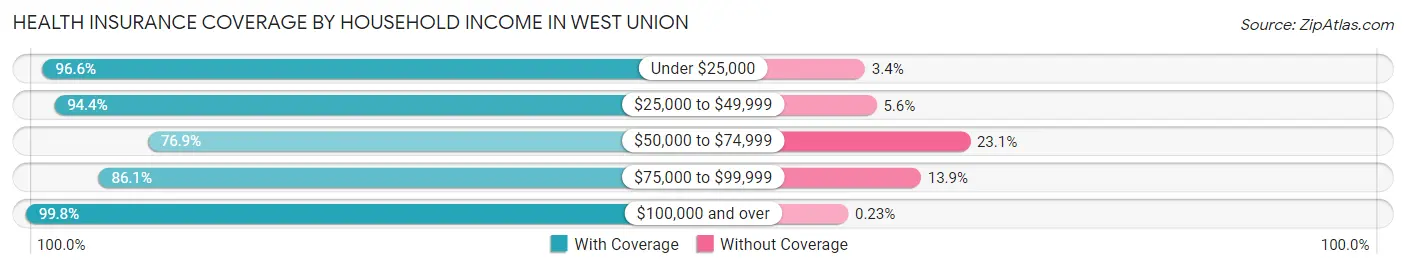
| Household Income | With Coverage | Without Coverage |
| Under $25,000 | 114 (96.6%) | 4 (3.4%) |
| $25,000 to $49,999 | 85 (94.4%) | 5 (5.6%) |
| $50,000 to $74,999 | 70 (76.9%) | 21 (23.1%) |
| $75,000 to $99,999 | 87 (86.1%) | 14 (13.9%) |
| $100,000 and over | 431 (99.8%) | 1 (0.2%) |
Public vs Private Health Insurance Coverage by Age in West Union
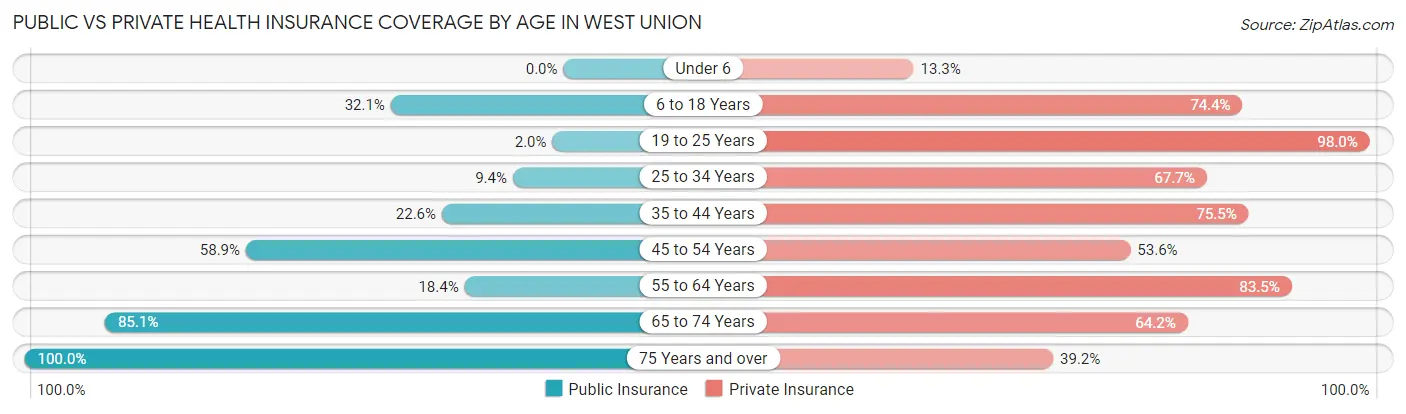
| Age Bracket | Public Insurance | Private Insurance |
| Under 6 | 0 (0.0%) | 2 (13.3%) |
| 6 to 18 Years | 25 (32.1%) | 58 (74.4%) |
| 19 to 25 Years | 2 (2.0%) | 96 (98.0%) |
| 25 to 34 Years | 9 (9.4%) | 65 (67.7%) |
| 35 to 44 Years | 23 (22.6%) | 77 (75.5%) |
| 45 to 54 Years | 33 (58.9%) | 30 (53.6%) |
| 55 to 64 Years | 40 (18.3%) | 182 (83.5%) |
| 65 to 74 Years | 57 (85.1%) | 43 (64.2%) |
| 75 Years and over | 102 (100.0%) | 40 (39.2%) |
| Total | 291 (35.0%) | 593 (71.3%) |
Disability Status by Sex by Age in West Union
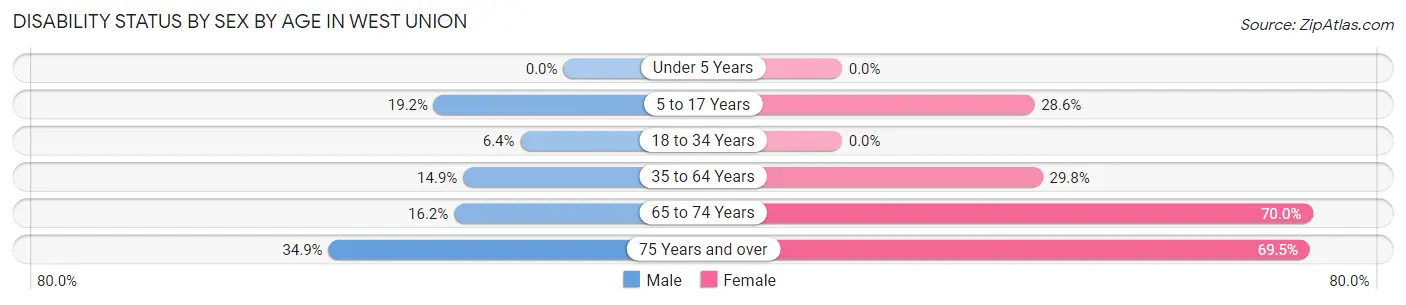
| Age Bracket | Male | Female |
| Under 5 Years | 0 (0.0%) | 0 (0.0%) |
| 5 to 17 Years | 10 (19.2%) | 8 (28.6%) |
| 18 to 34 Years | 9 (6.4%) | 0 (0.0%) |
| 35 to 64 Years | 25 (14.9%) | 62 (29.8%) |
| 65 to 74 Years | 6 (16.2%) | 21 (70.0%) |
| 75 Years and over | 15 (34.9%) | 41 (69.5%) |
Disability Class by Sex by Age in West Union
Disability Class: Hearing Difficulty
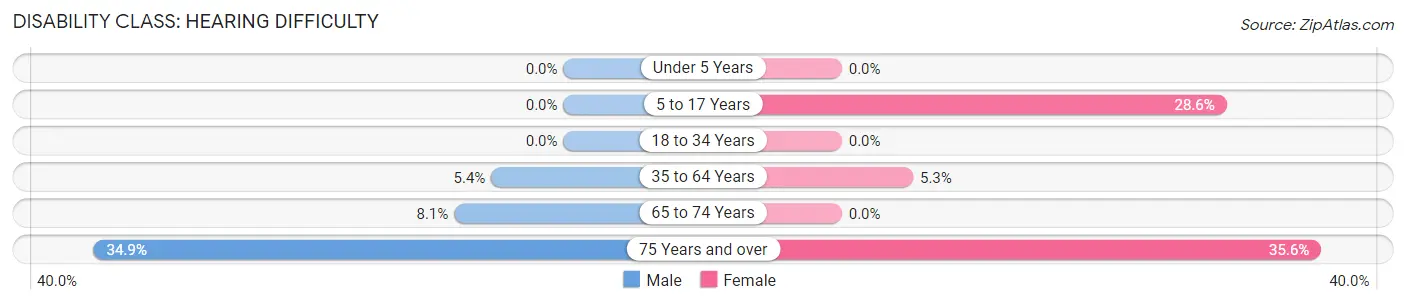
| Age Bracket | Male | Female |
| Under 5 Years | 0 (0.0%) | 0 (0.0%) |
| 5 to 17 Years | 0 (0.0%) | 8 (28.6%) |
| 18 to 34 Years | 0 (0.0%) | 0 (0.0%) |
| 35 to 64 Years | 9 (5.4%) | 11 (5.3%) |
| 65 to 74 Years | 3 (8.1%) | 0 (0.0%) |
| 75 Years and over | 15 (34.9%) | 21 (35.6%) |
Disability Class: Vision Difficulty
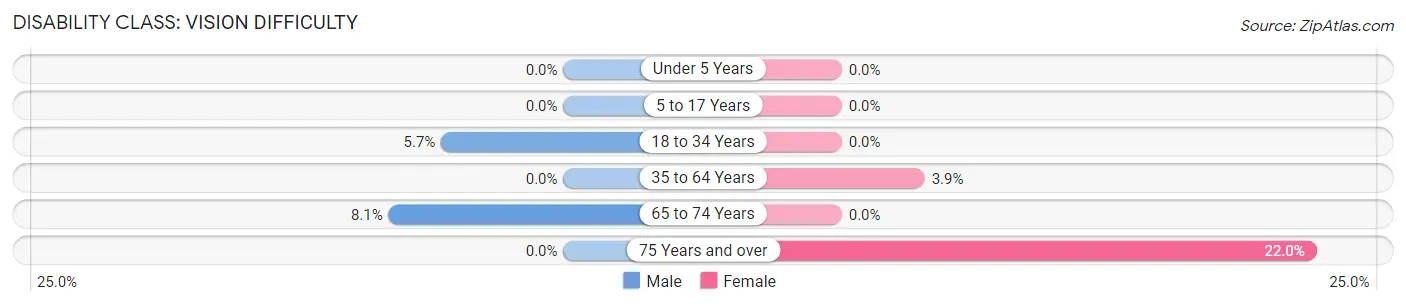
| Age Bracket | Male | Female |
| Under 5 Years | 0 (0.0%) | 0 (0.0%) |
| 5 to 17 Years | 0 (0.0%) | 0 (0.0%) |
| 18 to 34 Years | 8 (5.7%) | 0 (0.0%) |
| 35 to 64 Years | 0 (0.0%) | 8 (3.8%) |
| 65 to 74 Years | 3 (8.1%) | 0 (0.0%) |
| 75 Years and over | 0 (0.0%) | 13 (22.0%) |
Disability Class: Cognitive Difficulty
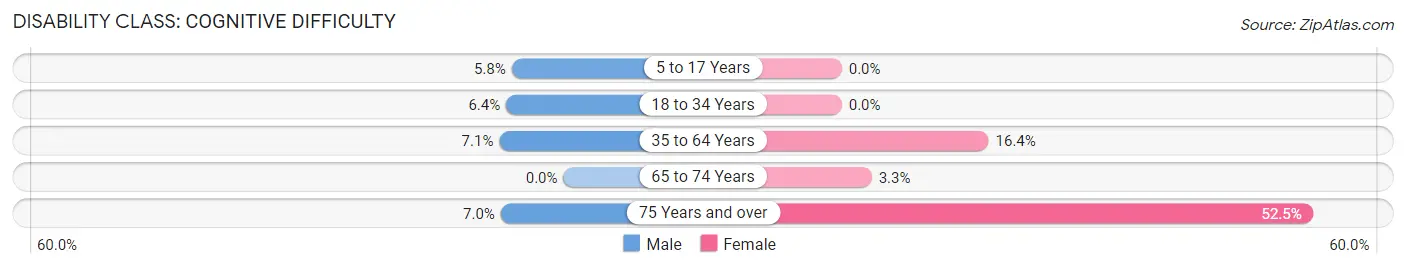
| Age Bracket | Male | Female |
| 5 to 17 Years | 3 (5.8%) | 0 (0.0%) |
| 18 to 34 Years | 9 (6.4%) | 0 (0.0%) |
| 35 to 64 Years | 12 (7.1%) | 34 (16.4%) |
| 65 to 74 Years | 0 (0.0%) | 1 (3.3%) |
| 75 Years and over | 3 (7.0%) | 31 (52.5%) |
Disability Class: Ambulatory Difficulty
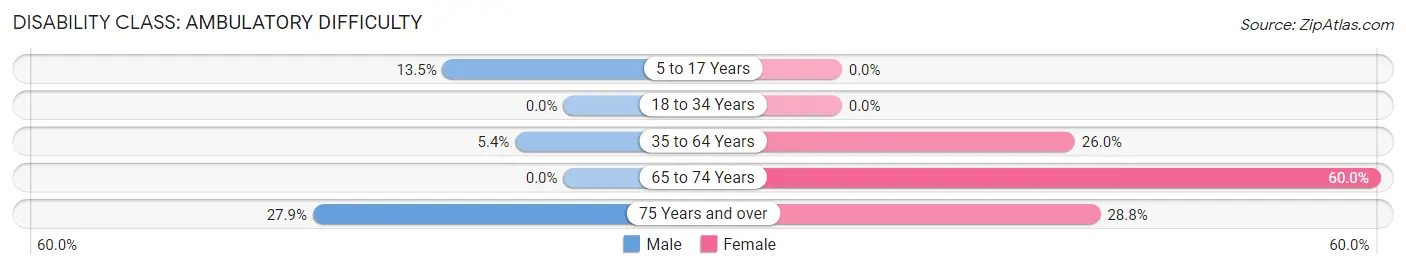
| Age Bracket | Male | Female |
| 5 to 17 Years | 7 (13.5%) | 0 (0.0%) |
| 18 to 34 Years | 0 (0.0%) | 0 (0.0%) |
| 35 to 64 Years | 9 (5.4%) | 54 (26.0%) |
| 65 to 74 Years | 0 (0.0%) | 18 (60.0%) |
| 75 Years and over | 12 (27.9%) | 17 (28.8%) |
Disability Class: Self-Care Difficulty
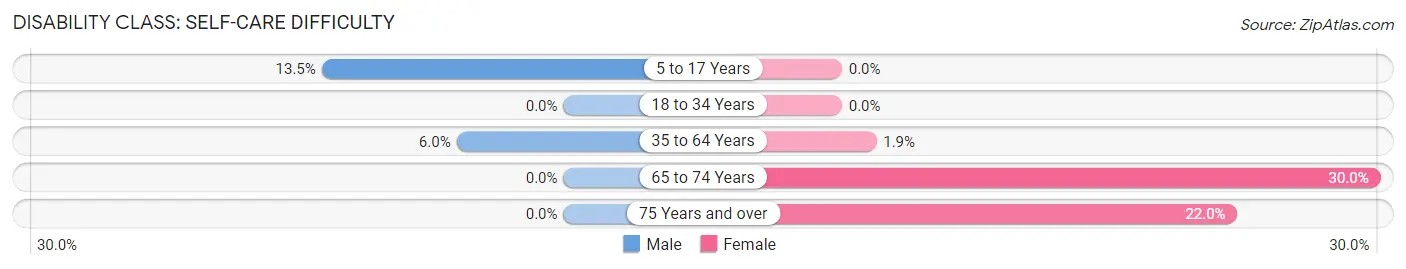
| Age Bracket | Male | Female |
| 5 to 17 Years | 7 (13.5%) | 0 (0.0%) |
| 18 to 34 Years | 0 (0.0%) | 0 (0.0%) |
| 35 to 64 Years | 10 (5.9%) | 4 (1.9%) |
| 65 to 74 Years | 0 (0.0%) | 9 (30.0%) |
| 75 Years and over | 0 (0.0%) | 13 (22.0%) |
Technology Access in West Union
Computing Device Access in West Union
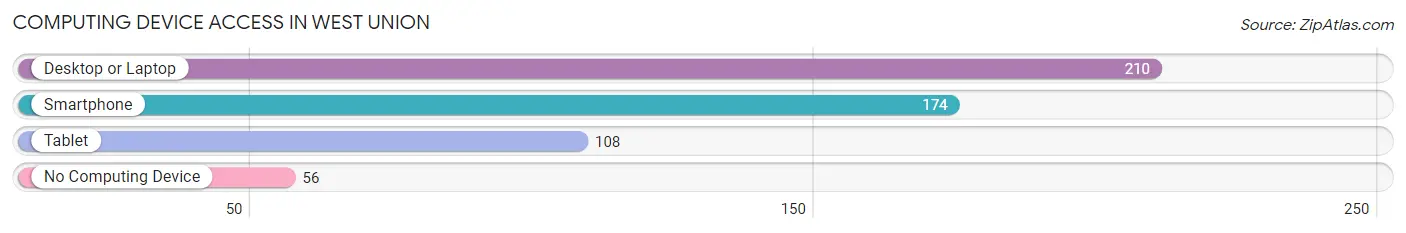
| Device Type | # Households | % Households |
| Desktop or Laptop | 210 | 66.9% |
| Smartphone | 174 | 55.4% |
| Tablet | 108 | 34.4% |
| No Computing Device | 56 | 17.8% |
| Total | 314 | 100.0% |
Internet Access in West Union
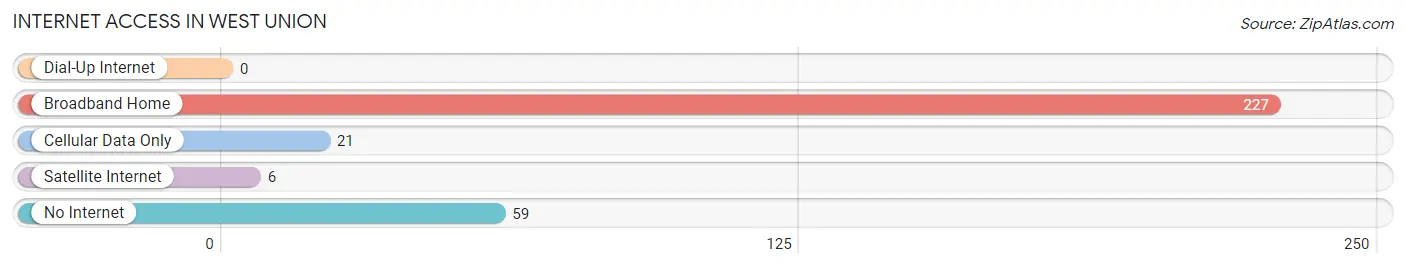
| Internet Type | # Households | % Households |
| Dial-Up Internet | 0 | 0.0% |
| Broadband Home | 227 | 72.3% |
| Cellular Data Only | 21 | 6.7% |
| Satellite Internet | 6 | 1.9% |
| No Internet | 59 | 18.8% |
| Total | 314 | 100.0% |
West Union Summary
West Union is a small town located in Doddridge County, West Virginia. It is situated in the Appalachian Mountains and is the county seat of Doddridge County. The town has a population of 1,717 people as of the 2010 census.
Geography
West Union is located in the Appalachian Mountains of West Virginia. It is situated in the northern part of the state, near the border with Pennsylvania. The town is located at the confluence of the West Fork River and the Little Kanawha River. The town is surrounded by rolling hills and forests, and is located at an elevation of 1,068 feet.
Climate
West Union has a humid continental climate, with hot summers and cold winters. The average annual temperature is 54°F, with an average high of 75°F in the summer and an average low of 33°F in the winter. The average annual precipitation is 42 inches, with an average of 4 inches of snowfall per year.
Demographics
As of the 2010 census, West Union had a population of 1,717 people. The racial makeup of the town was 97.2% White, 0.9% African American, 0.2% Native American, 0.2% Asian, 0.1% Pacific Islander, 0.2% from other races, and 1.2% from two or more races. Hispanic or Latino of any race were 0.7% of the population.
Economy
West Union’s economy is largely based on agriculture and tourism. The town is home to several small businesses, including a grocery store, a hardware store, and a few restaurants. The town is also home to a number of small manufacturing companies, including a furniture factory and a plastics factory.
The town is also home to a number of tourist attractions, including the West Fork River Trail, the West Union Historic District, and the West Union Opera House. The town is also home to a number of festivals and events, including the West Union Fall Festival and the West Union Christmas Parade.
History
West Union was founded in 1817 by a group of settlers from Pennsylvania. The town was named after the nearby West Fork River. The town was incorporated in 1832 and became the county seat of Doddridge County in 1845.
The town was an important stop on the Northwestern Turnpike, which connected the Ohio River to the Potomac River. The turnpike was an important transportation route for settlers and goods, and helped to spur the growth of the town.
The town was also an important stop on the Underground Railroad, and was home to several prominent abolitionists. The town was also home to several Civil War battles, including the Battle of West Union in 1863.
West Union has continued to grow and develop over the years, and today is a thriving small town with a strong sense of community. The town is home to a number of historic buildings and sites, and is a popular tourist destination.
Common Questions
What is Per Capita Income in West Union?
Per Capita income in West Union is $46,579.
What is the Median Family Income in West Union?
Median Family Income in West Union is $123,333.
What is the Median Household income in West Union?
Median Household Income in West Union is $88,833.
What is Income or Wage Gap in West Union?
Income or Wage Gap in West Union is 31.9%.
Women in West Union earn 68.1 cents for every dollar earned by a man.
What is Inequality or Gini Index in West Union?
Inequality or Gini Index in West Union is 0.45.
What is the Total Population of West Union?
Total Population of West Union is 832.
What is the Total Male Population of West Union?
Total Male Population of West Union is 441.
What is the Total Female Population of West Union?
Total Female Population of West Union is 391.
What is the Ratio of Males per 100 Females in West Union?
There are 112.79 Males per 100 Females in West Union.
What is the Ratio of Females per 100 Males in West Union?
There are 88.66 Females per 100 Males in West Union.
What is the Median Population Age in West Union?
Median Population Age in West Union is 49.9 Years.
What is the Average Family Size in West Union
Average Family Size in West Union is 3.0 People.
What is the Average Household Size in West Union
Average Household Size in West Union is 2.6 People.
How Large is the Labor Force in West Union?
There are 500 People in the Labor Forcein in West Union.
What is the Percentage of People in the Labor Force in West Union?
67.0% of People are in the Labor Force in West Union.
What is the Unemployment Rate in West Union?
Unemployment Rate in West Union is 0.4%.