Winfield, WV Map & Demographics
Winfield Map
Winfield Overview
$41,257
PER CAPITA INCOME
$118,190
AVG FAMILY INCOME
$101,500
AVG HOUSEHOLD INCOME
14.1%
WAGE / INCOME GAP [ % ]
85.9¢/ $1
WAGE / INCOME GAP [ $ ]
0.44
INEQUALITY / GINI INDEX
2,975
TOTAL POPULATION
1,543
MALE POPULATION
1,432
FEMALE POPULATION
107.75
MALES / 100 FEMALES
92.81
FEMALES / 100 MALES
41.1
MEDIAN AGE
3.5
AVG FAMILY SIZE
3.0
AVG HOUSEHOLD SIZE
1,469
LABOR FORCE [ PEOPLE ]
65.6%
PERCENT IN LABOR FORCE
2.9%
UNEMPLOYMENT RATE
Winfield Zip Codes
Winfield Area Codes
Income in Winfield
Income Overview in Winfield
Per Capita Income in Winfield is $41,257, while median incomes of families and households are $118,190 and $101,500 respectively.
| Characteristic | Number | Measure |
| Per Capita Income | 2,975 | $41,257 |
| Median Family Income | 756 | $118,190 |
| Mean Family Income | 756 | $126,071 |
| Median Household Income | 1,008 | $101,500 |
| Mean Household Income | 1,008 | $116,275 |
| Income Deficit | 756 | $0 |
| Wage / Income Gap (%) | 2,975 | 14.10% |
| Wage / Income Gap ($) | 2,975 | 85.90¢ per $1 |
| Gini / Inequality Index | 2,975 | 0.44 |
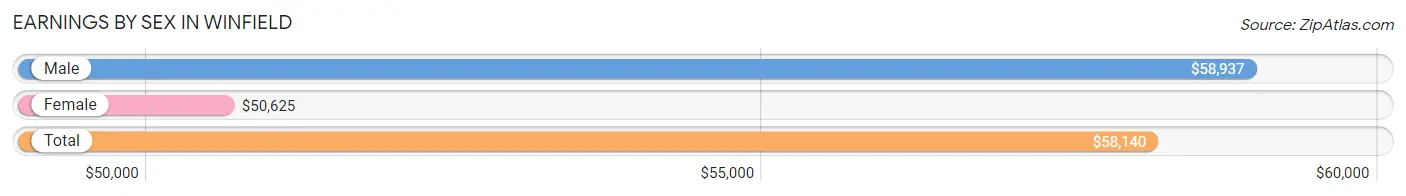
Earnings by Sex in Winfield
Average Earnings in Winfield are $58,140, $58,937 for men and $50,625 for women, a difference of 14.1%.
| Sex | Number | Average Earnings |
| Male | 821 (53.5%) | $58,937 |
| Female | 713 (46.5%) | $50,625 |
| Total | 1,534 (100.0%) | $58,140 |
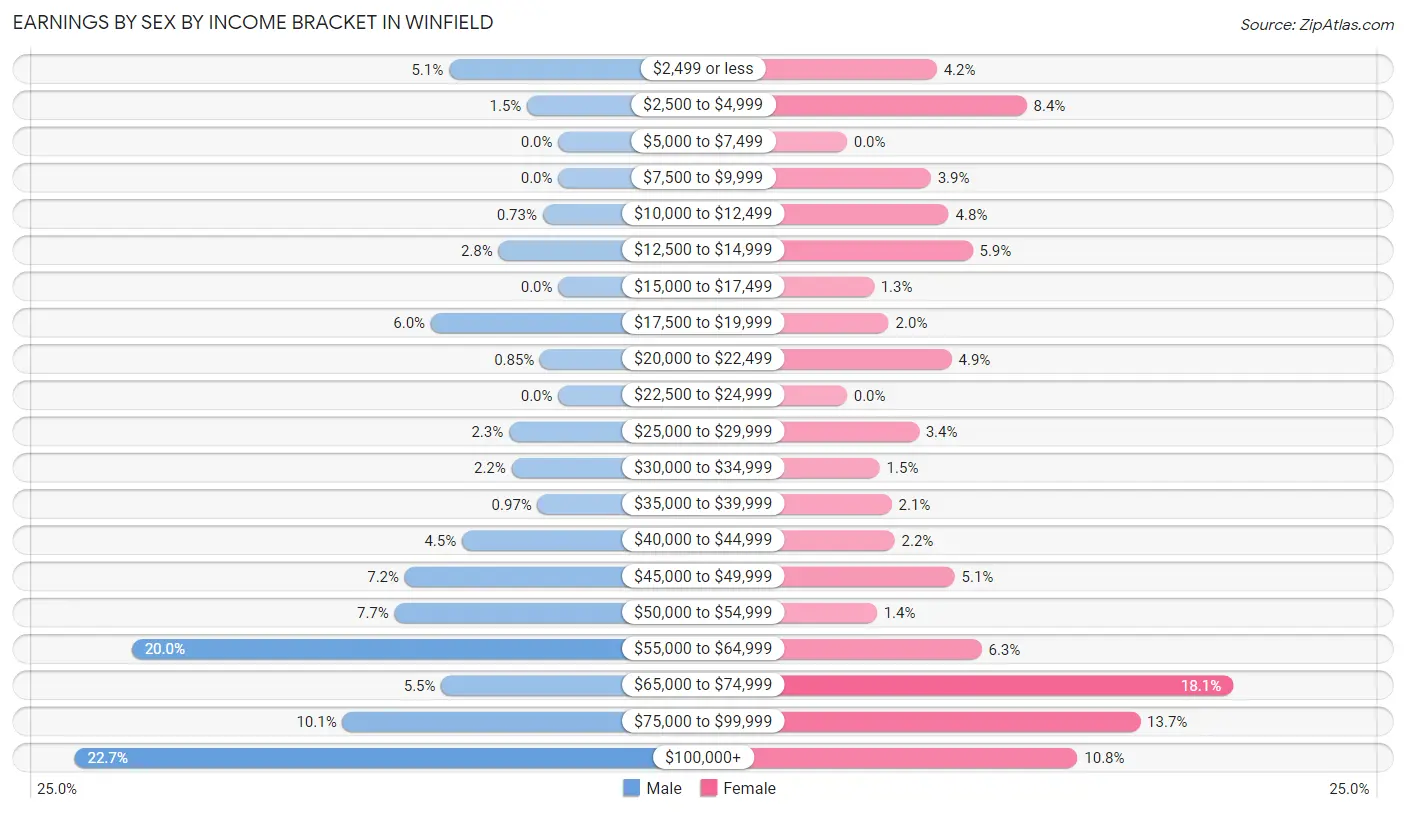
Earnings by Sex by Income Bracket in Winfield
The most common earnings brackets in Winfield are $100,000+ for men (186 | 22.7%) and $65,000 to $74,999 for women (129 | 18.1%).
| Income | Male | Female |
| $2,499 or less | 42 (5.1%) | 30 (4.2%) |
| $2,500 to $4,999 | 12 (1.5%) | 60 (8.4%) |
| $5,000 to $7,499 | 0 (0.0%) | 0 (0.0%) |
| $7,500 to $9,999 | 0 (0.0%) | 28 (3.9%) |
| $10,000 to $12,499 | 6 (0.7%) | 34 (4.8%) |
| $12,500 to $14,999 | 23 (2.8%) | 42 (5.9%) |
| $15,000 to $17,499 | 0 (0.0%) | 9 (1.3%) |
| $17,500 to $19,999 | 49 (6.0%) | 14 (2.0%) |
| $20,000 to $22,499 | 7 (0.9%) | 35 (4.9%) |
| $22,500 to $24,999 | 0 (0.0%) | 0 (0.0%) |
| $25,000 to $29,999 | 19 (2.3%) | 24 (3.4%) |
| $30,000 to $34,999 | 18 (2.2%) | 11 (1.5%) |
| $35,000 to $39,999 | 8 (1.0%) | 15 (2.1%) |
| $40,000 to $44,999 | 37 (4.5%) | 16 (2.2%) |
| $45,000 to $49,999 | 59 (7.2%) | 36 (5.1%) |
| $50,000 to $54,999 | 63 (7.7%) | 10 (1.4%) |
| $55,000 to $64,999 | 164 (20.0%) | 45 (6.3%) |
| $65,000 to $74,999 | 45 (5.5%) | 129 (18.1%) |
| $75,000 to $99,999 | 83 (10.1%) | 98 (13.7%) |
| $100,000+ | 186 (22.7%) | 77 (10.8%) |
| Total | 821 (100.0%) | 713 (100.0%) |
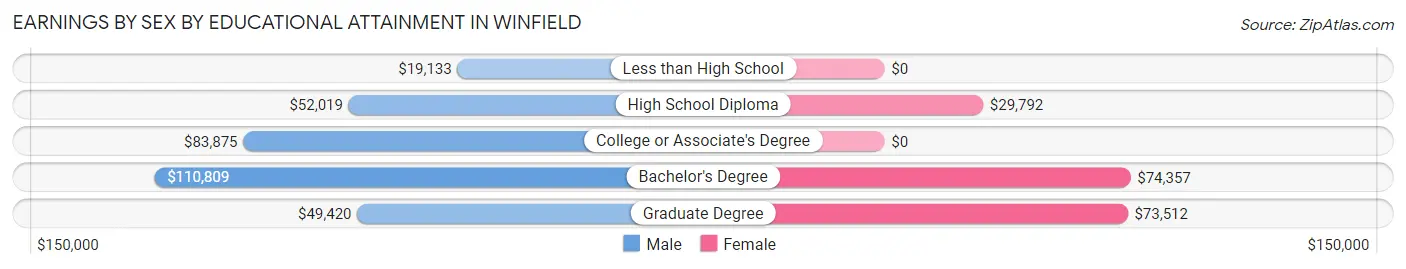
Earnings by Sex by Educational Attainment in Winfield
Average earnings in Winfield are $60,952 for men and $63,529 for women, a difference of 4.1%. Men with an educational attainment of bachelor's degree enjoy the highest average annual earnings of $110,809, while those with less than high school education earn the least with $19,133. Women with an educational attainment of bachelor's degree earn the most with the average annual earnings of $74,357, while those with high school diploma education have the smallest earnings of $29,792.
| Educational Attainment | Male Income | Female Income |
| Less than High School | $19,133 | $0 |
| High School Diploma | $52,019 | $29,792 |
| College or Associate's Degree | $83,875 | $0 |
| Bachelor's Degree | $110,809 | $74,357 |
| Graduate Degree | $49,420 | $73,512 |
| Total | $60,952 | $63,529 |
Family Income in Winfield
Family Income Brackets in Winfield
According to the Winfield family income data, there are 215 families falling into the $100,000 to $149,999 income range, which is the most common income bracket and makes up 28.4% of all families. Conversely, the $10,000 to $14,999 income bracket is the least frequent group with only 9 families (1.2%) belonging to this category.
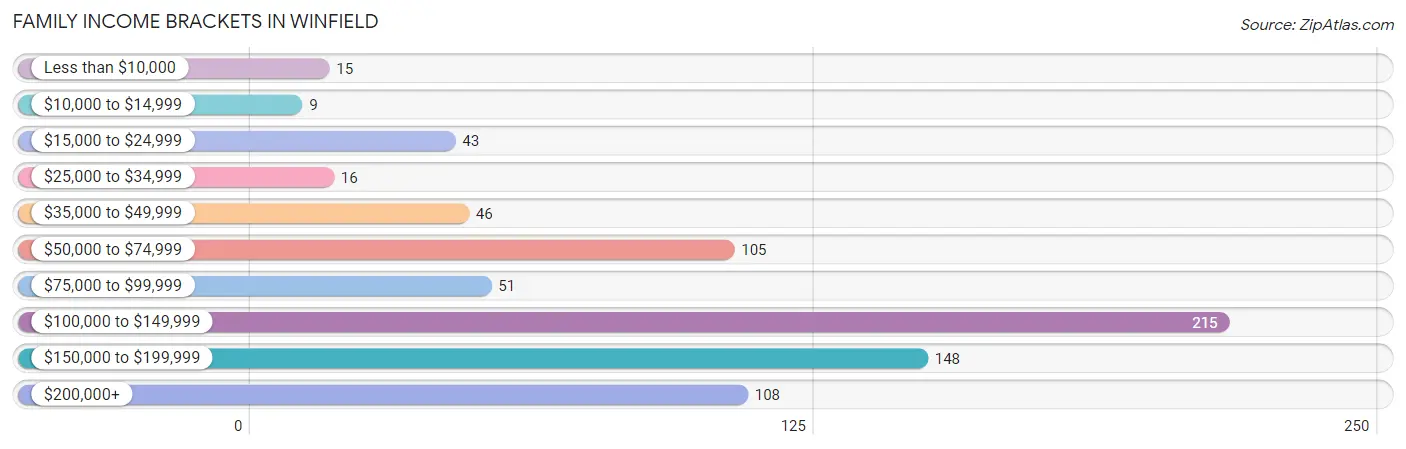
| Income Bracket | # Families | % Families |
| Less than $10,000 | 15 | 2.0% |
| $10,000 to $14,999 | 9 | 1.2% |
| $15,000 to $24,999 | 43 | 5.7% |
| $25,000 to $34,999 | 16 | 2.1% |
| $35,000 to $49,999 | 46 | 6.1% |
| $50,000 to $74,999 | 105 | 13.9% |
| $75,000 to $99,999 | 51 | 6.7% |
| $100,000 to $149,999 | 215 | 28.4% |
| $150,000 to $199,999 | 148 | 19.6% |
| $200,000+ | 108 | 14.3% |
Family Income by Famaliy Size in Winfield
4-person families (160 | 21.2%) account for the highest median family income in Winfield with $156,250 per family, while 2-person families (353 | 46.7%) have the highest median income of $54,910 per family member.
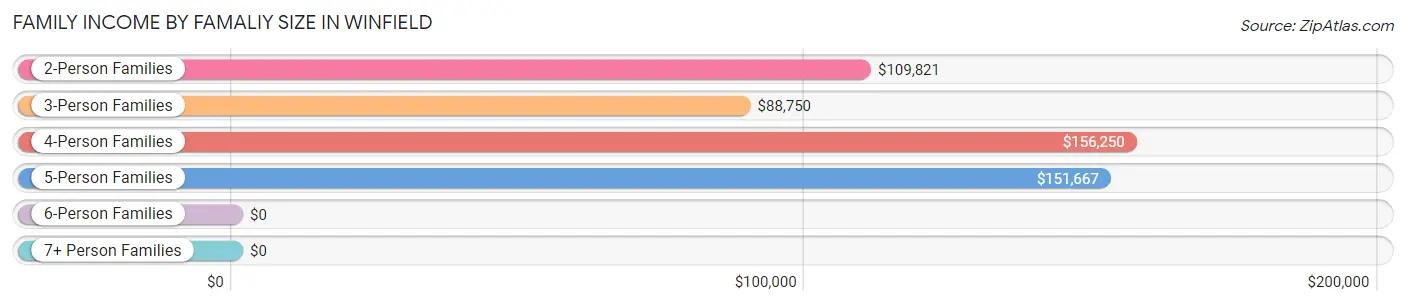
| Income Bracket | # Families | Median Income |
| 2-Person Families | 353 (46.7%) | $109,821 |
| 3-Person Families | 107 (14.1%) | $88,750 |
| 4-Person Families | 160 (21.2%) | $156,250 |
| 5-Person Families | 92 (12.2%) | $151,667 |
| 6-Person Families | 20 (2.6%) | $0 |
| 7+ Person Families | 24 (3.2%) | $0 |
| Total | 756 (100.0%) | $118,190 |
Family Income by Number of Earners in Winfield
The median family income in Winfield is $118,190, with families comprising 3+ earners (114) having the highest median family income of $191,250, while families with 1 earner (171) have the lowest median family income of $56,750, accounting for 15.1% and 22.6% of families, respectively.
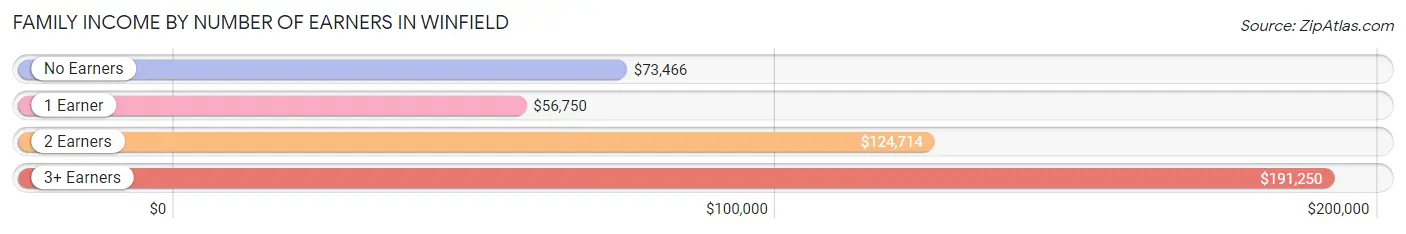
| Number of Earners | # Families | Median Income |
| No Earners | 123 (16.3%) | $73,466 |
| 1 Earner | 171 (22.6%) | $56,750 |
| 2 Earners | 348 (46.0%) | $124,714 |
| 3+ Earners | 114 (15.1%) | $191,250 |
| Total | 756 (100.0%) | $118,190 |
Household Income in Winfield
Household Income Brackets in Winfield
With 227 households falling in the category, the $100,000 to $149,999 income range is the most frequent in Winfield, accounting for 22.5% of all households. In contrast, only 9 households (0.9%) fall into the $10,000 to $14,999 income bracket, making it the least populous group.
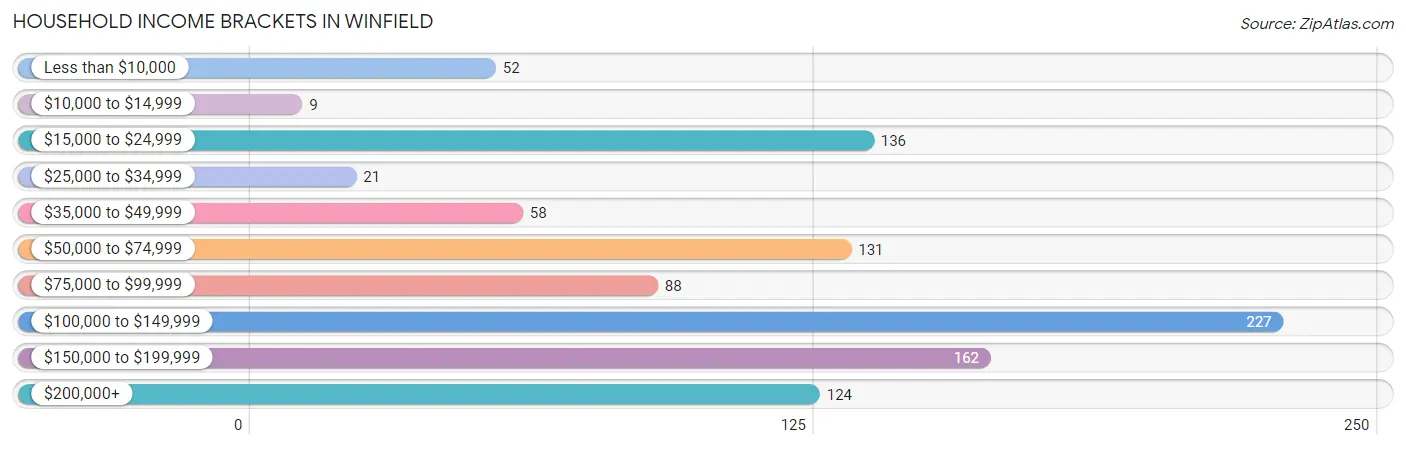
| Income Bracket | # Households | % Households |
| Less than $10,000 | 52 | 5.2% |
| $10,000 to $14,999 | 9 | 0.9% |
| $15,000 to $24,999 | 136 | 13.5% |
| $25,000 to $34,999 | 21 | 2.1% |
| $35,000 to $49,999 | 58 | 5.8% |
| $50,000 to $74,999 | 131 | 13.0% |
| $75,000 to $99,999 | 88 | 8.7% |
| $100,000 to $149,999 | 227 | 22.5% |
| $150,000 to $199,999 | 162 | 16.1% |
| $200,000+ | 124 | 12.3% |
Household Income by Householder Age in Winfield
The median household income in Winfield is $101,500, with the highest median household income of $119,271 found in the 25 to 44 years age bracket for the primary householder. A total of 295 households (29.3%) fall into this category. Meanwhile, the 15 to 24 years age bracket for the primary householder has the lowest median household income of $0, with 3 households (0.3%) in this group.
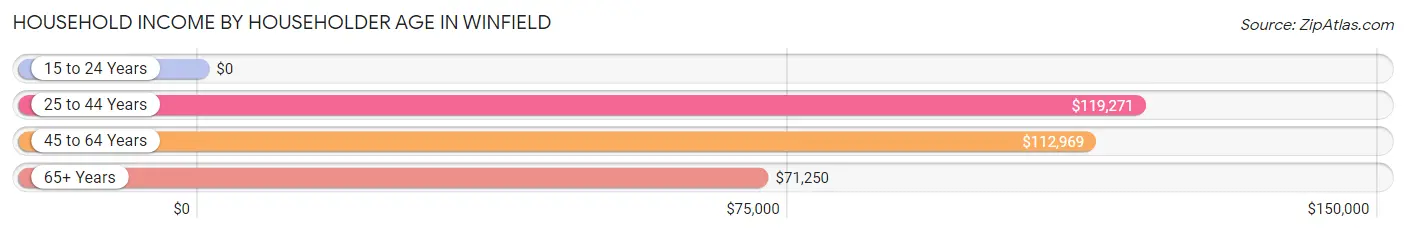
| Income Bracket | # Households | Median Income |
| 15 to 24 Years | 3 (0.3%) | $0 |
| 25 to 44 Years | 295 (29.3%) | $119,271 |
| 45 to 64 Years | 539 (53.5%) | $112,969 |
| 65+ Years | 171 (17.0%) | $71,250 |
| Total | 1,008 (100.0%) | $101,500 |
Poverty in Winfield
Income Below Poverty by Sex and Age in Winfield
With 20.2% poverty level for males and 11.8% for females among the residents of Winfield, under 5 year old males and under 5 year old females are the most vulnerable to poverty, with 93 males (76.2%) and 30 females (47.6%) in their respective age groups living below the poverty level.
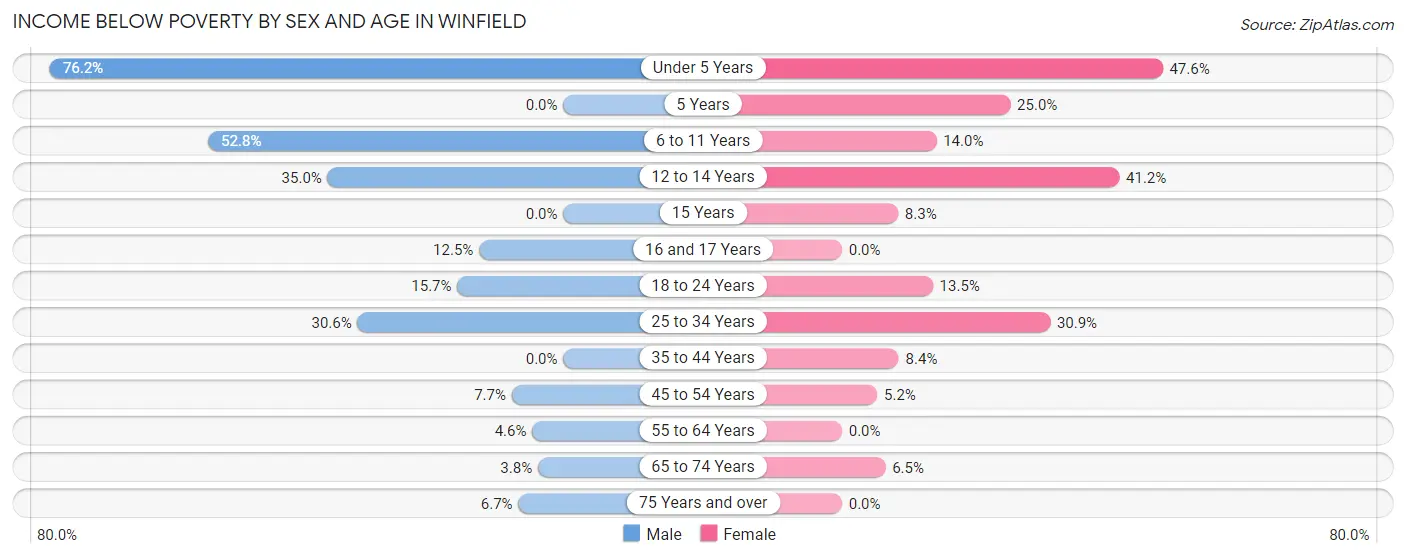
| Age Bracket | Male | Female |
| Under 5 Years | 93 (76.2%) | 30 (47.6%) |
| 5 Years | 0 (0.0%) | 3 (25.0%) |
| 6 to 11 Years | 96 (52.7%) | 15 (14.0%) |
| 12 to 14 Years | 14 (35.0%) | 21 (41.2%) |
| 15 Years | 0 (0.0%) | 3 (8.3%) |
| 16 and 17 Years | 3 (12.5%) | 0 (0.0%) |
| 18 to 24 Years | 17 (15.7%) | 17 (13.5%) |
| 25 to 34 Years | 55 (30.6%) | 51 (30.9%) |
| 35 to 44 Years | 0 (0.0%) | 13 (8.4%) |
| 45 to 54 Years | 13 (7.6%) | 11 (5.2%) |
| 55 to 64 Years | 13 (4.6%) | 0 (0.0%) |
| 65 to 74 Years | 4 (3.8%) | 4 (6.5%) |
| 75 Years and over | 3 (6.7%) | 0 (0.0%) |
| Total | 311 (20.2%) | 168 (11.8%) |
Income Above Poverty by Sex and Age in Winfield
According to the poverty statistics in Winfield, males aged 15 years and females aged 16 and 17 years are the age groups that are most secure financially, with 100.0% of males and 100.0% of females in these age groups living above the poverty line.
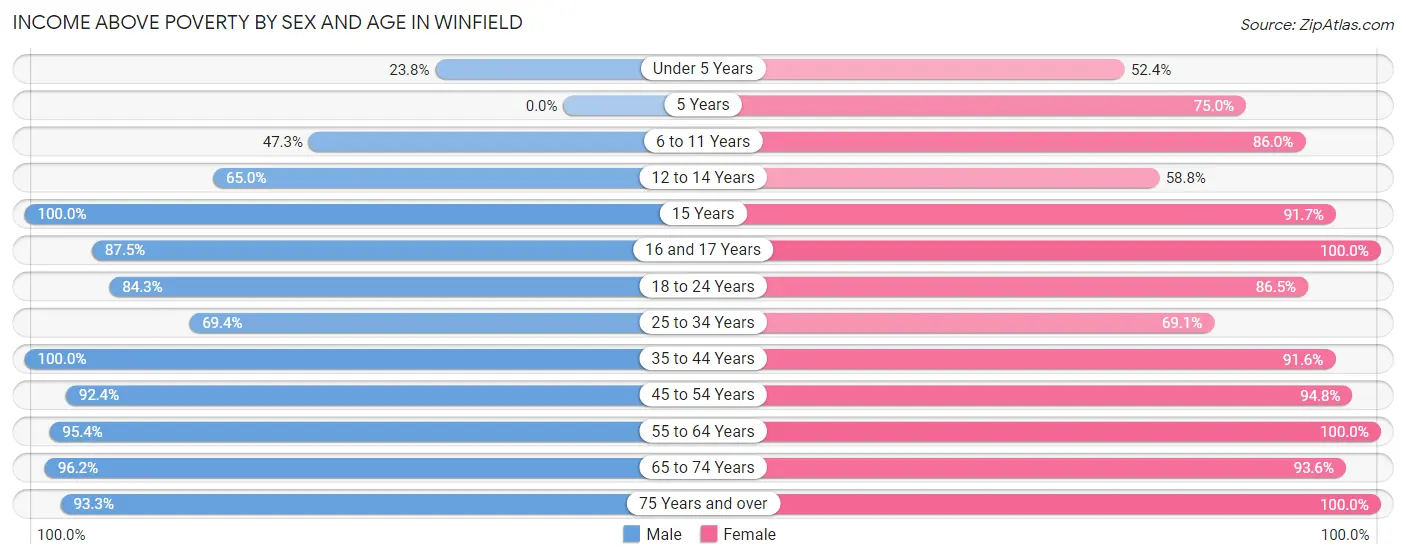
| Age Bracket | Male | Female |
| Under 5 Years | 29 (23.8%) | 33 (52.4%) |
| 5 Years | 0 (0.0%) | 9 (75.0%) |
| 6 to 11 Years | 86 (47.2%) | 92 (86.0%) |
| 12 to 14 Years | 26 (65.0%) | 30 (58.8%) |
| 15 Years | 119 (100.0%) | 33 (91.7%) |
| 16 and 17 Years | 21 (87.5%) | 10 (100.0%) |
| 18 to 24 Years | 91 (84.3%) | 109 (86.5%) |
| 25 to 34 Years | 125 (69.4%) | 114 (69.1%) |
| 35 to 44 Years | 165 (100.0%) | 141 (91.6%) |
| 45 to 54 Years | 157 (92.3%) | 199 (94.8%) |
| 55 to 64 Years | 269 (95.4%) | 309 (100.0%) |
| 65 to 74 Years | 102 (96.2%) | 58 (93.5%) |
| 75 Years and over | 42 (93.3%) | 123 (100.0%) |
| Total | 1,232 (79.8%) | 1,260 (88.2%) |
Income Below Poverty Among Married-Couple Families in Winfield
The poverty statistics for married-couple families in Winfield show that 4.6% or 31 of the total 669 families live below the poverty line. Families with 5 or more children have the highest poverty rate of 100.0%, comprising of 24 families. On the other hand, families with no children have the lowest poverty rate of 0.0%, which includes 0 families.
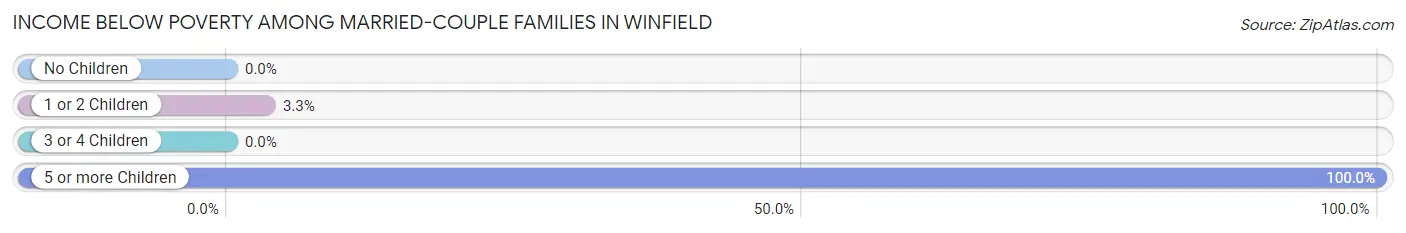
| Children | Above Poverty | Below Poverty |
| No Children | 387 (100.0%) | 0 (0.0%) |
| 1 or 2 Children | 205 (96.7%) | 7 (3.3%) |
| 3 or 4 Children | 46 (100.0%) | 0 (0.0%) |
| 5 or more Children | 0 (0.0%) | 24 (100.0%) |
| Total | 638 (95.4%) | 31 (4.6%) |
Income Below Poverty Among Single-Parent Households in Winfield
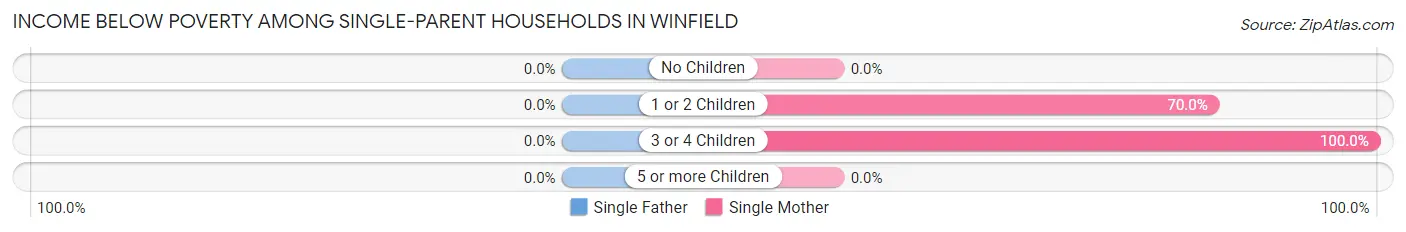
| Children | Single Father | Single Mother |
| No Children | 0 (0.0%) | 0 (0.0%) |
| 1 or 2 Children | 0 (0.0%) | 28 (70.0%) |
| 3 or 4 Children | 0 (0.0%) | 13 (100.0%) |
| 5 or more Children | 0 (0.0%) | 0 (0.0%) |
| Total | 0 (0.0%) | 41 (64.1%) |
Income Below Poverty Among Married-Couple vs Single-Parent Households in Winfield
The poverty data for Winfield shows that 31 of the married-couple family households (4.6%) and 41 of the single-parent households (47.1%) are living below the poverty level. Within the married-couple family households, those with 5 or more children have the highest poverty rate, with 24 households (100.0%) falling below the poverty line. Among the single-parent households, those with 3 or 4 children have the highest poverty rate, with 13 household (100.0%) living below poverty.
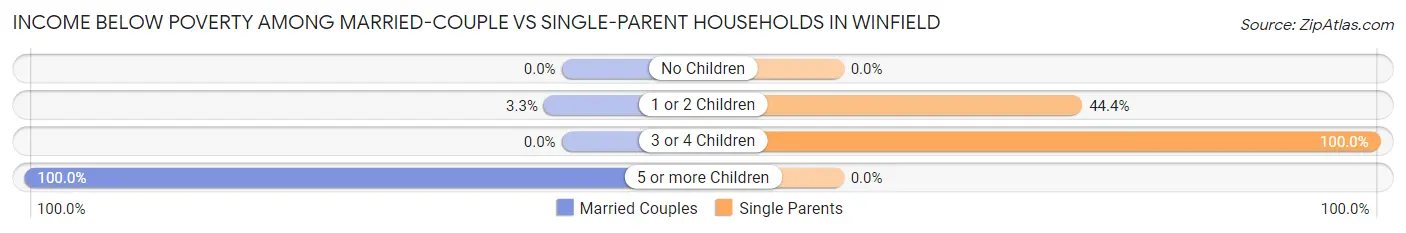
| Children | Married-Couple Families | Single-Parent Households |
| No Children | 0 (0.0%) | 0 (0.0%) |
| 1 or 2 Children | 7 (3.3%) | 28 (44.4%) |
| 3 or 4 Children | 0 (0.0%) | 13 (100.0%) |
| 5 or more Children | 24 (100.0%) | 0 (0.0%) |
| Total | 31 (4.6%) | 41 (47.1%) |
Race in Winfield
The most populous races in Winfield are White / Caucasian (2,758 | 92.7%), Two or more Races (107 | 3.6%), and Asian (66 | 2.2%).
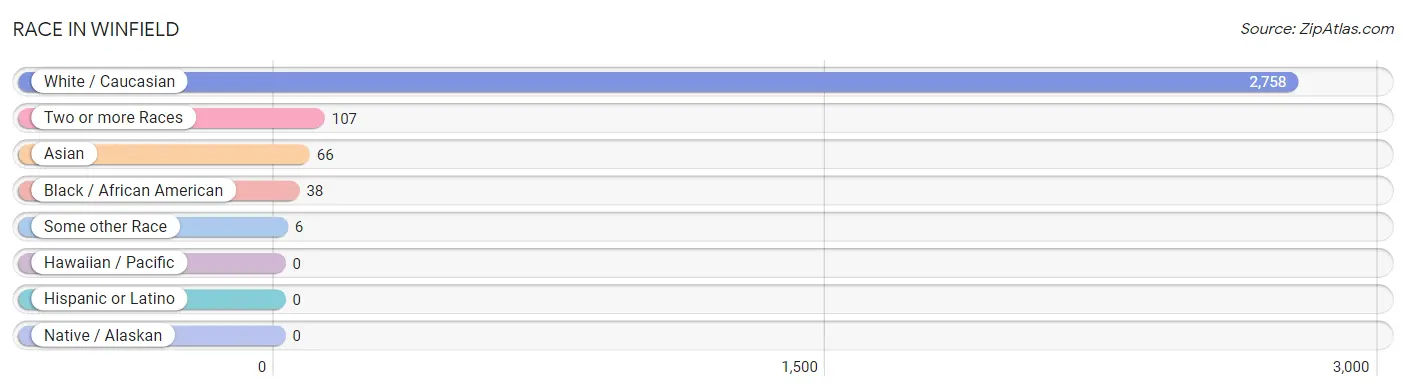
| Race | # Population | % Population |
| Asian | 66 | 2.2% |
| Black / African American | 38 | 1.3% |
| Hawaiian / Pacific | 0 | 0.0% |
| Hispanic or Latino | 0 | 0.0% |
| Native / Alaskan | 0 | 0.0% |
| White / Caucasian | 2,758 | 92.7% |
| Two or more Races | 107 | 3.6% |
| Some other Race | 6 | 0.2% |
| Total | 2,975 | 100.0% |
Ancestry in Winfield
The most populous ancestries reported in Winfield are German (405 | 13.6%), English (380 | 12.8%), American (277 | 9.3%), Irish (255 | 8.6%), and European (69 | 2.3%), together accounting for 46.6% of all Winfield residents.
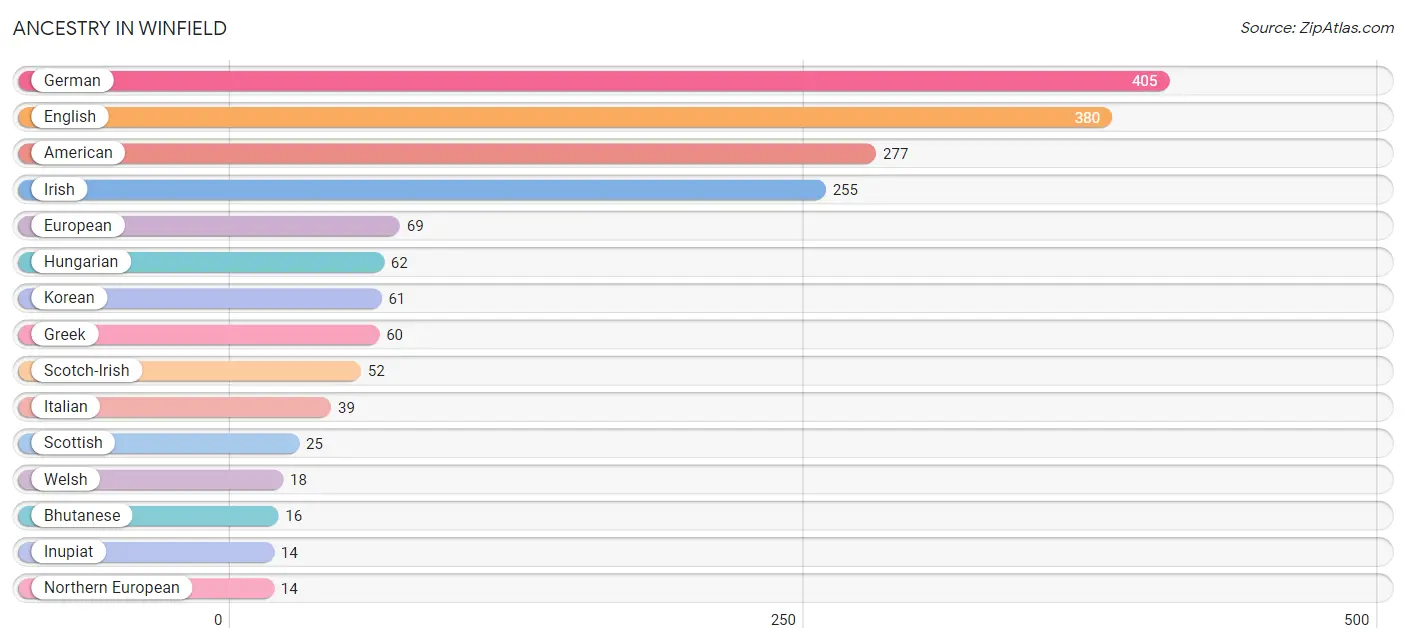
| Ancestry | # Population | % Population |
| American | 277 | 9.3% |
| Arab | 9 | 0.3% |
| Bhutanese | 16 | 0.5% |
| Danish | 4 | 0.1% |
| Dutch | 12 | 0.4% |
| Eastern European | 4 | 0.1% |
| English | 380 | 12.8% |
| European | 69 | 2.3% |
| French | 7 | 0.2% |
| German | 405 | 13.6% |
| Greek | 60 | 2.0% |
| Hungarian | 62 | 2.1% |
| Inupiat | 14 | 0.5% |
| Irish | 255 | 8.6% |
| Italian | 39 | 1.3% |
| Korean | 61 | 2.1% |
| Lebanese | 9 | 0.3% |
| Northern European | 14 | 0.5% |
| Norwegian | 14 | 0.5% |
| Russian | 12 | 0.4% |
| Scandinavian | 11 | 0.4% |
| Scotch-Irish | 52 | 1.8% |
| Scottish | 25 | 0.8% |
| Welsh | 18 | 0.6% |
| West Indian | 13 | 0.4% | View All 25 Rows |
Immigrants in Winfield
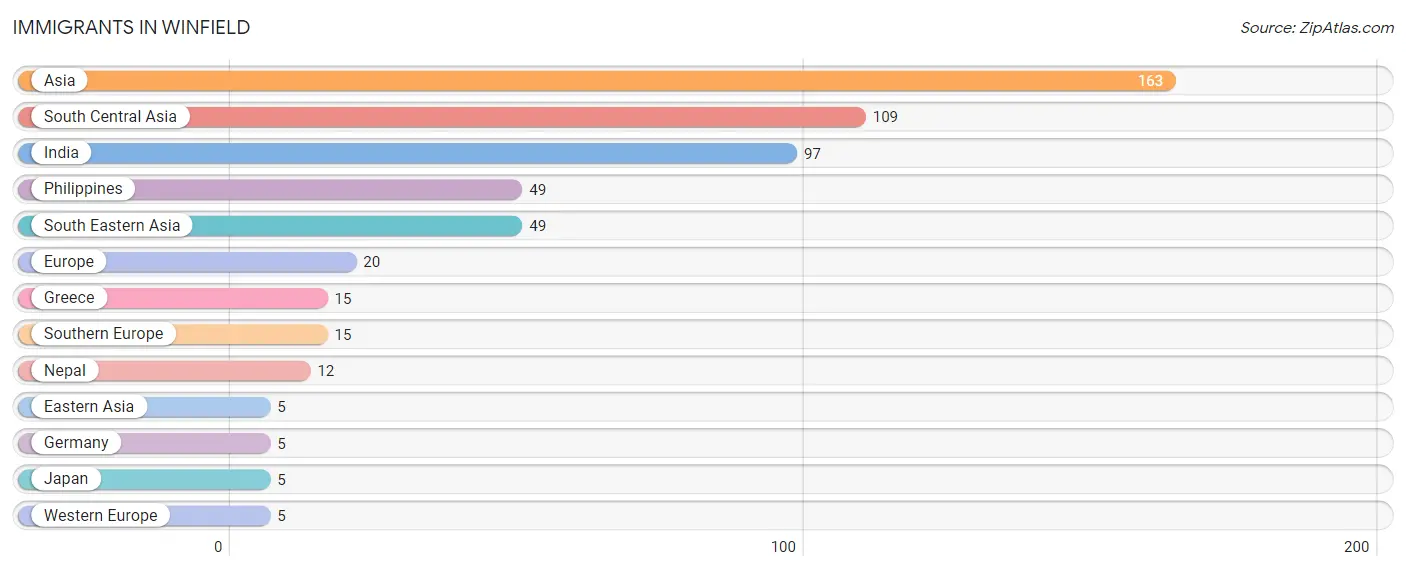
The most numerous immigrant groups reported in Winfield came from Asia (163 | 5.5%), South Central Asia (109 | 3.7%), India (97 | 3.3%), Philippines (49 | 1.7%), and South Eastern Asia (49 | 1.7%), together accounting for 15.7% of all Winfield residents.
| Immigration Origin | # Population | % Population |
| Asia | 163 | 5.5% |
| Eastern Asia | 5 | 0.2% |
| Europe | 20 | 0.7% |
| Germany | 5 | 0.2% |
| Greece | 15 | 0.5% |
| India | 97 | 3.3% |
| Japan | 5 | 0.2% |
| Nepal | 12 | 0.4% |
| Philippines | 49 | 1.7% |
| South Central Asia | 109 | 3.7% |
| South Eastern Asia | 49 | 1.7% |
| Southern Europe | 15 | 0.5% |
| Western Europe | 5 | 0.2% | View All 13 Rows |
Sex and Age in Winfield
Sex and Age in Winfield
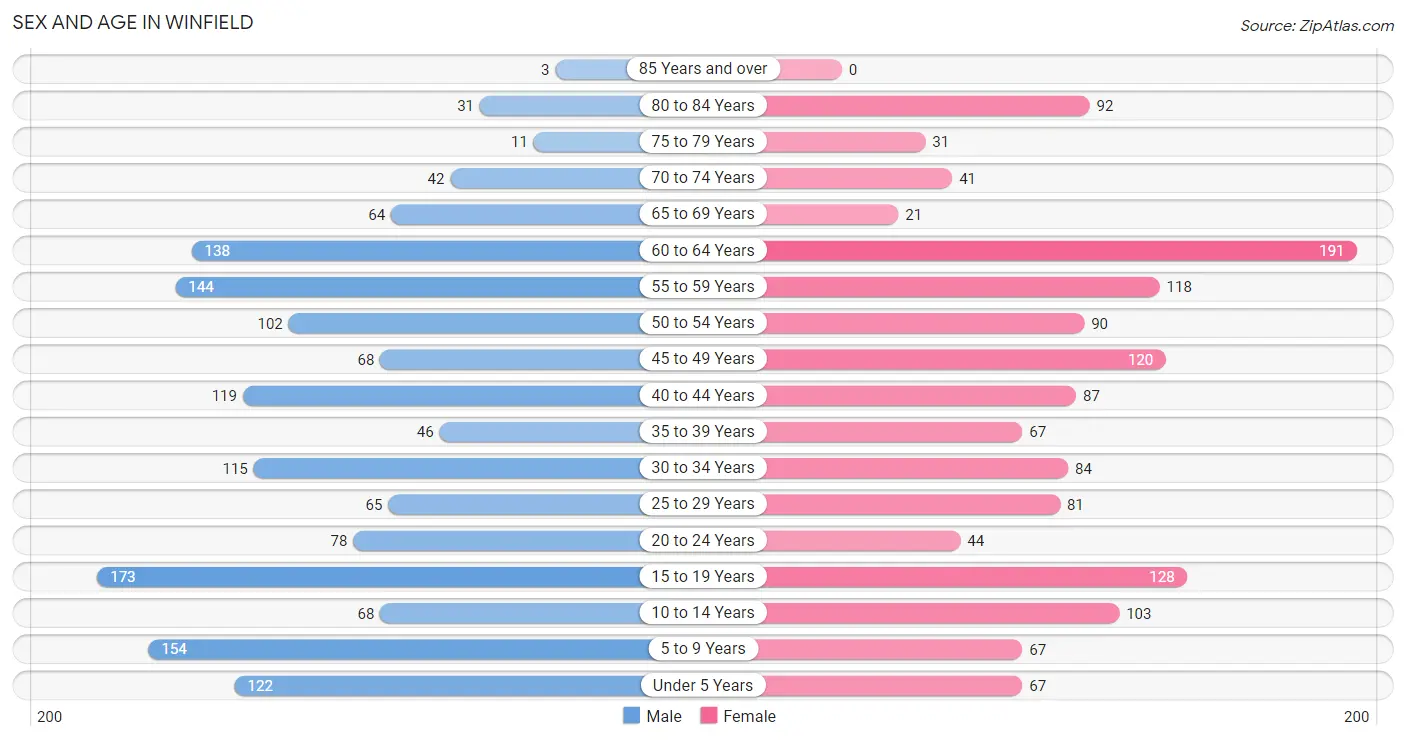
The most populous age groups in Winfield are 15 to 19 Years (173 | 11.2%) for men and 60 to 64 Years (191 | 13.3%) for women.
| Age Bracket | Male | Female |
| Under 5 Years | 122 (7.9%) | 67 (4.7%) |
| 5 to 9 Years | 154 (10.0%) | 67 (4.7%) |
| 10 to 14 Years | 68 (4.4%) | 103 (7.2%) |
| 15 to 19 Years | 173 (11.2%) | 128 (8.9%) |
| 20 to 24 Years | 78 (5.1%) | 44 (3.1%) |
| 25 to 29 Years | 65 (4.2%) | 81 (5.7%) |
| 30 to 34 Years | 115 (7.4%) | 84 (5.9%) |
| 35 to 39 Years | 46 (3.0%) | 67 (4.7%) |
| 40 to 44 Years | 119 (7.7%) | 87 (6.1%) |
| 45 to 49 Years | 68 (4.4%) | 120 (8.4%) |
| 50 to 54 Years | 102 (6.6%) | 90 (6.3%) |
| 55 to 59 Years | 144 (9.3%) | 118 (8.2%) |
| 60 to 64 Years | 138 (8.9%) | 191 (13.3%) |
| 65 to 69 Years | 64 (4.2%) | 21 (1.5%) |
| 70 to 74 Years | 42 (2.7%) | 41 (2.9%) |
| 75 to 79 Years | 11 (0.7%) | 31 (2.2%) |
| 80 to 84 Years | 31 (2.0%) | 92 (6.4%) |
| 85 Years and over | 3 (0.2%) | 0 (0.0%) |
| Total | 1,543 (100.0%) | 1,432 (100.0%) |
Families and Households in Winfield
Median Family Size in Winfield
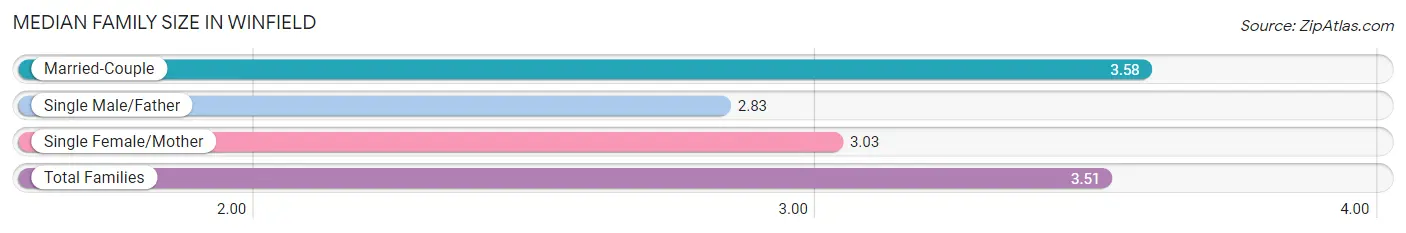
The median family size in Winfield is 3.51 persons per family, with married-couple families (669 | 88.5%) accounting for the largest median family size of 3.58 persons per family. On the other hand, single male/father families (23 | 3.0%) represent the smallest median family size with 2.83 persons per family.
| Family Type | # Families | Family Size |
| Married-Couple | 669 (88.5%) | 3.58 |
| Single Male/Father | 23 (3.0%) | 2.83 |
| Single Female/Mother | 64 (8.5%) | 3.03 |
| Total Families | 756 (100.0%) | 3.51 |
Median Household Size in Winfield
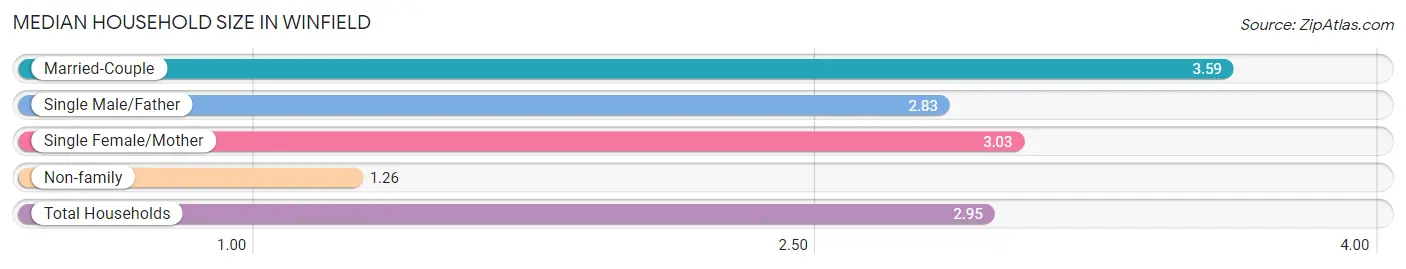
The median household size in Winfield is 2.95 persons per household, with married-couple households (669 | 66.4%) accounting for the largest median household size of 3.59 persons per household. non-family households (252 | 25.0%) represent the smallest median household size with 1.26 persons per household.
| Household Type | # Households | Household Size |
| Married-Couple | 669 (66.4%) | 3.59 |
| Single Male/Father | 23 (2.3%) | 2.83 |
| Single Female/Mother | 64 (6.4%) | 3.03 |
| Non-family | 252 (25.0%) | 1.26 |
| Total Households | 1,008 (100.0%) | 2.95 |
Household Size by Marriage Status in Winfield
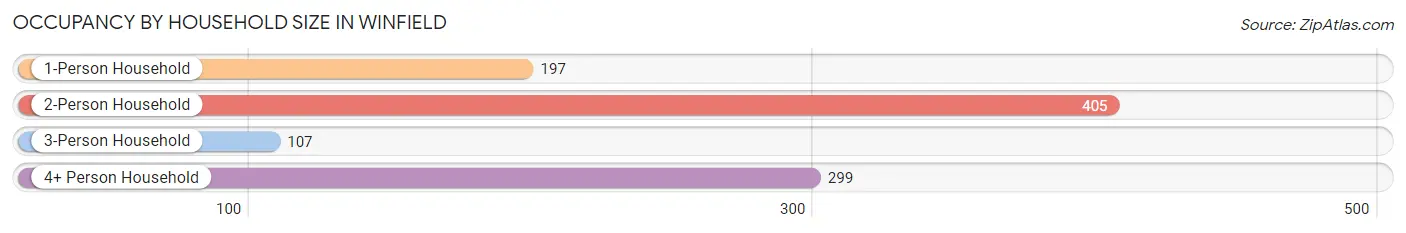
Out of a total of 1,008 households in Winfield, 756 (75.0%) are family households, while 252 (25.0%) are nonfamily households. The most numerous type of family households are 2-person households, comprising 353, and the most common type of nonfamily households are 1-person households, comprising 197.
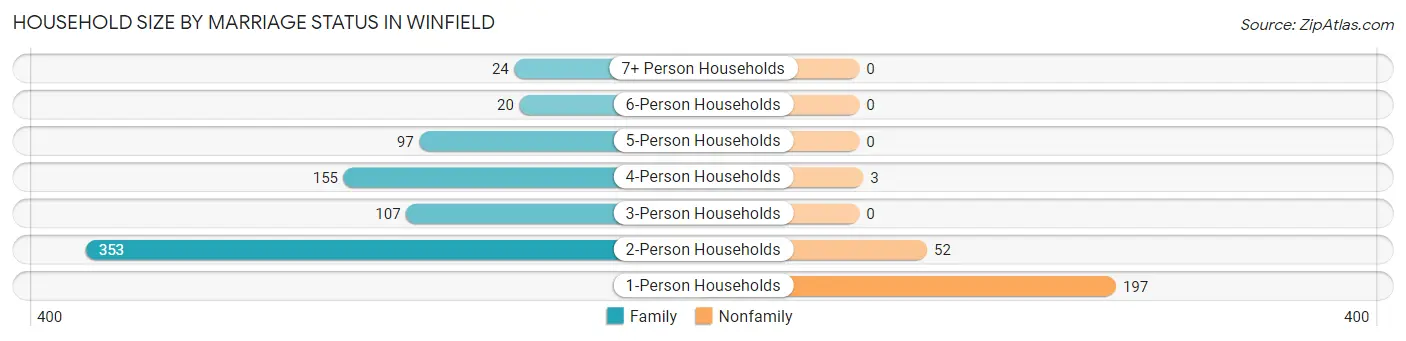
| Household Size | Family Households | Nonfamily Households |
| 1-Person Households | - | 197 (19.5%) |
| 2-Person Households | 353 (35.0%) | 52 (5.2%) |
| 3-Person Households | 107 (10.6%) | 0 (0.0%) |
| 4-Person Households | 155 (15.4%) | 3 (0.3%) |
| 5-Person Households | 97 (9.6%) | 0 (0.0%) |
| 6-Person Households | 20 (2.0%) | 0 (0.0%) |
| 7+ Person Households | 24 (2.4%) | 0 (0.0%) |
| Total | 756 (75.0%) | 252 (25.0%) |
Female Fertility in Winfield
Fertility by Age in Winfield
Average fertility rate in Winfield is 95.0 births per 1,000 women. Women in the age bracket of 35 to 50 years have the highest fertility rate with 202.0 births per 1,000 women. Women in the age bracket of 35 to 50 years acount for 100.0% of all women with births.
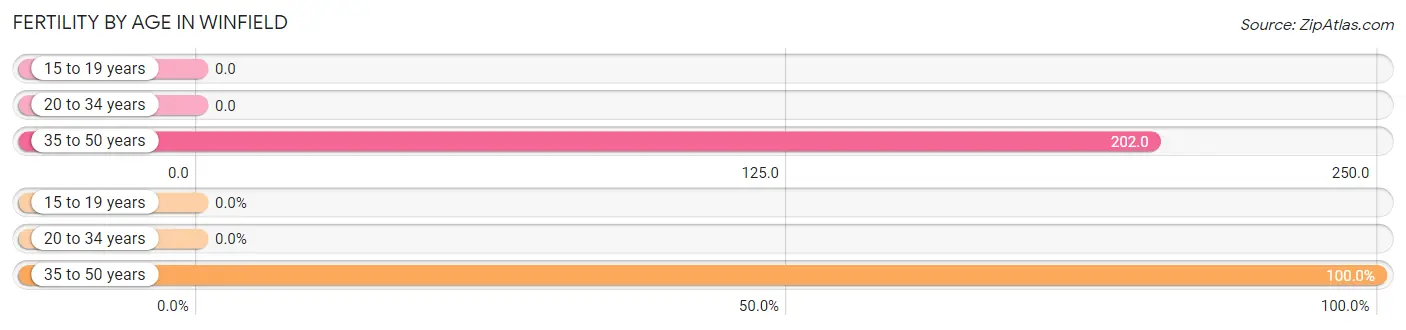
| Age Bracket | Women with Births | Births / 1,000 Women |
| 15 to 19 years | 0 (0.0%) | 0.0 |
| 20 to 34 years | 0 (0.0%) | 0.0 |
| 35 to 50 years | 60 (100.0%) | 202.0 |
| Total | 60 (100.0%) | 95.0 |
Fertility by Age by Marriage Status in Winfield
81.7% of women with births (60) in Winfield are married. The highest percentage of unmarried women with births falls into 35 to 50 years age bracket with 18.3% of them unmarried at the time of birth, while the lowest percentage of unmarried women with births belong to 35 to 50 years age bracket with 18.3% of them unmarried.
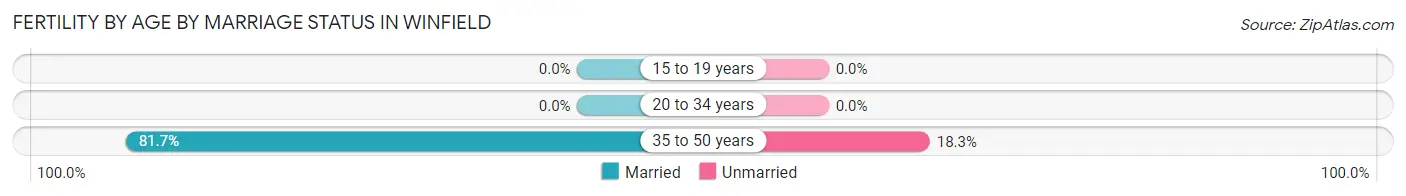
| Age Bracket | Married | Unmarried |
| 15 to 19 years | 0 (0.0%) | 0 (0.0%) |
| 20 to 34 years | 0 (0.0%) | 0 (0.0%) |
| 35 to 50 years | 49 (81.7%) | 11 (18.3%) |
| Total | 49 (81.7%) | 11 (18.3%) |
Fertility by Education in Winfield
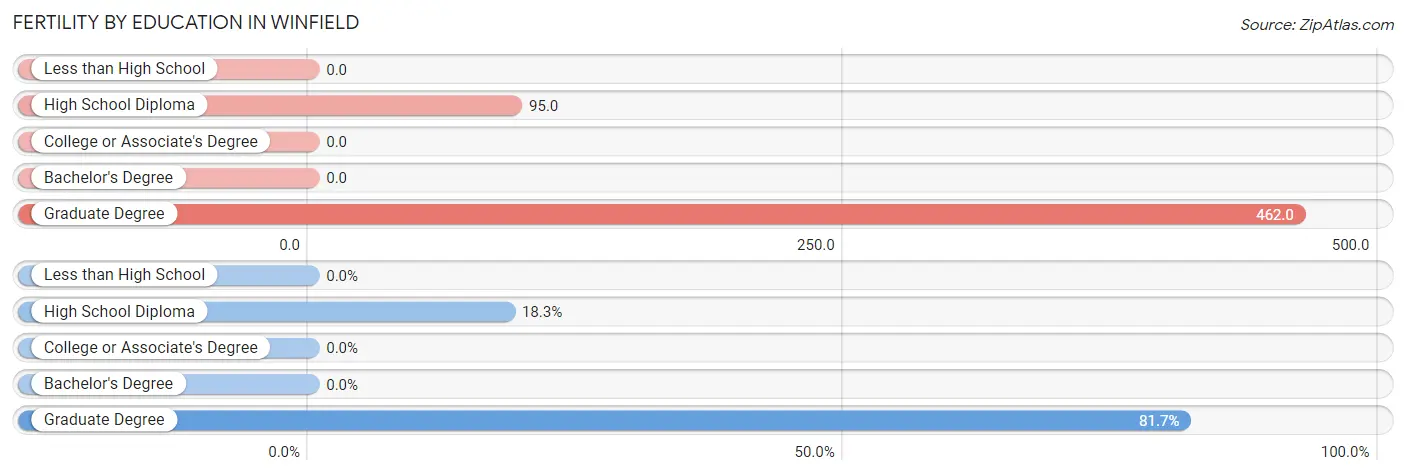
| Educational Attainment | Women with Births | Births / 1,000 Women |
| Less than High School | 0 (0.0%) | 0.0 |
| High School Diploma | 11 (18.3%) | 95.0 |
| College or Associate's Degree | 0 (0.0%) | 0.0 |
| Bachelor's Degree | 0 (0.0%) | 0.0 |
| Graduate Degree | 49 (81.7%) | 462.0 |
| Total | 60 (100.0%) | 95.0 |
Fertility by Education by Marriage Status in Winfield
18.3% of women with births in Winfield are unmarried. Women with the educational attainment of graduate degree are most likely to be married with 100.0% of them married at childbirth, while women with the educational attainment of high school diploma are least likely to be married with 100.0% of them unmarried at childbirth.
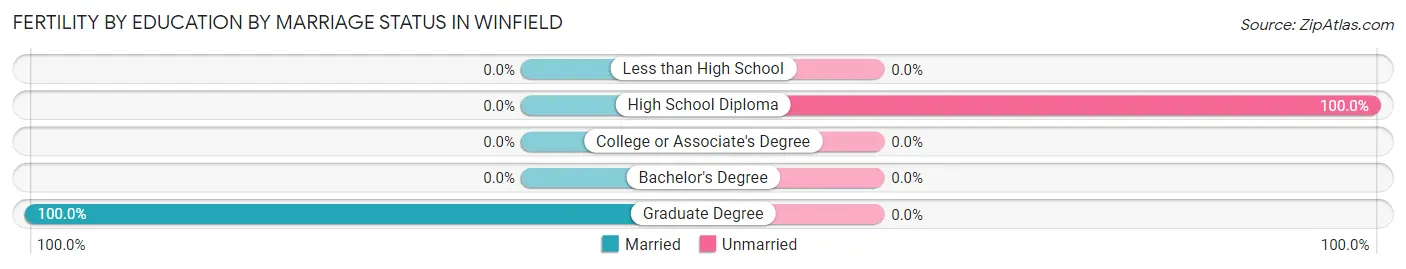
| Educational Attainment | Married | Unmarried |
| Less than High School | 0 (0.0%) | 0 (0.0%) |
| High School Diploma | 0 (0.0%) | 11 (100.0%) |
| College or Associate's Degree | 0 (0.0%) | 0 (0.0%) |
| Bachelor's Degree | 0 (0.0%) | 0 (0.0%) |
| Graduate Degree | 49 (100.0%) | 0 (0.0%) |
| Total | 49 (81.7%) | 11 (18.3%) |
Employment Characteristics in Winfield
Employment by Class of Employer in Winfield
Among the 1,361 employed individuals in Winfield, private company employees (842 | 61.9%), local government employees (141 | 10.4%), and not-for-profit organizations (130 | 9.6%) make up the most common classes of employment.
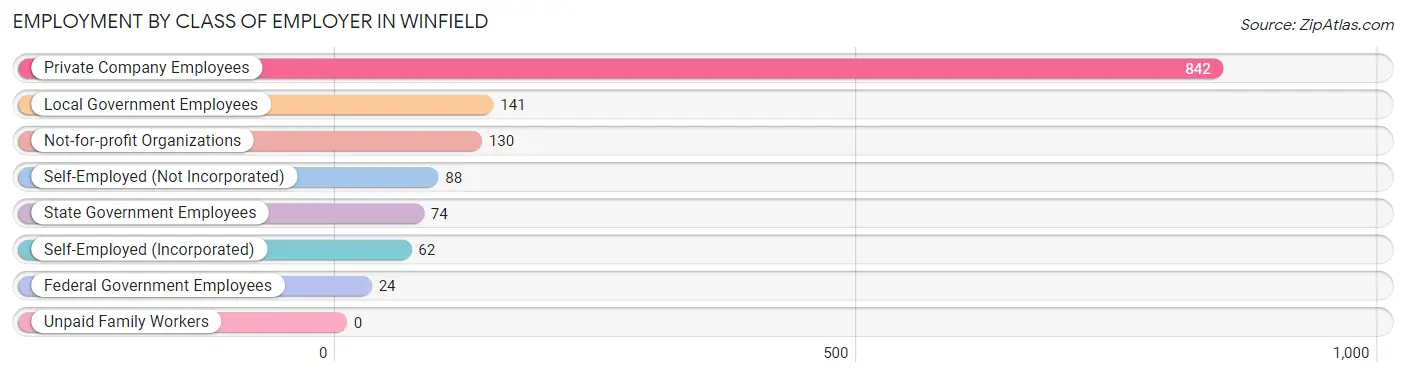
| Employer Class | # Employees | % Employees |
| Private Company Employees | 842 | 61.9% |
| Self-Employed (Incorporated) | 62 | 4.6% |
| Self-Employed (Not Incorporated) | 88 | 6.5% |
| Not-for-profit Organizations | 130 | 9.6% |
| Local Government Employees | 141 | 10.4% |
| State Government Employees | 74 | 5.4% |
| Federal Government Employees | 24 | 1.8% |
| Unpaid Family Workers | 0 | 0.0% |
| Total | 1,361 | 100.0% |
Employment Status by Age in Winfield
According to the labor force statistics for Winfield, out of the total population over 16 years of age (2,239), 65.6% or 1,469 individuals are in the labor force, with 2.9% or 43 of them unemployed. The age group with the highest labor force participation rate is 25 to 29 years, with 92.5% or 135 individuals in the labor force. Within the labor force, the 65 to 74 years age range has the highest percentage of unemployed individuals, with 41.7% or 5 of them being unemployed.
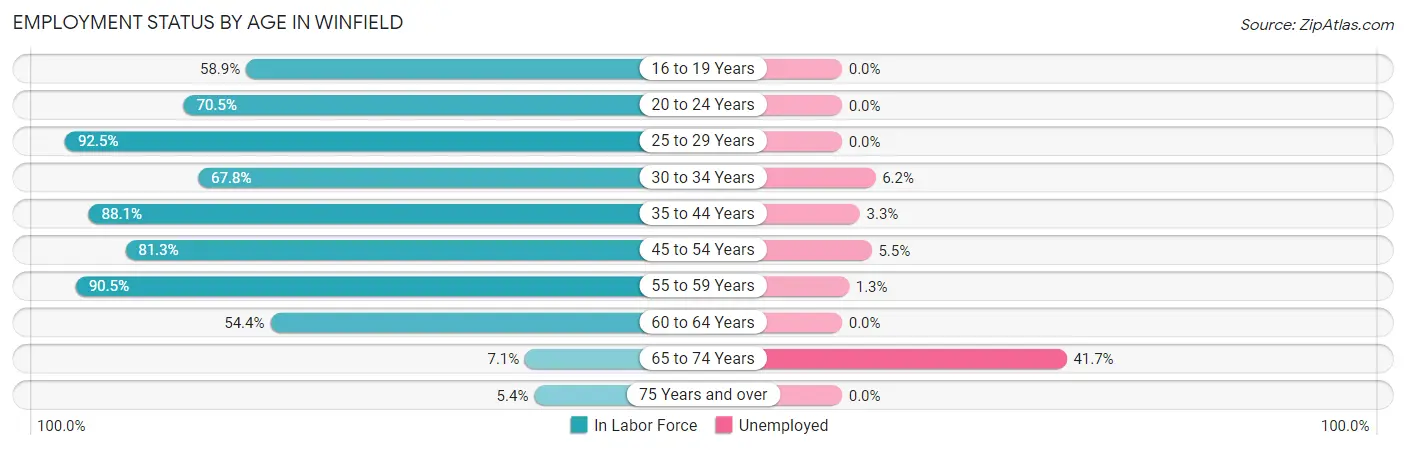
| Age Bracket | In Labor Force | Unemployed |
| 16 to 19 Years | 86 (58.9%) | 0 (0.0%) |
| 20 to 24 Years | 86 (70.5%) | 0 (0.0%) |
| 25 to 29 Years | 135 (92.5%) | 0 (0.0%) |
| 30 to 34 Years | 135 (67.8%) | 8 (6.2%) |
| 35 to 44 Years | 281 (88.1%) | 9 (3.3%) |
| 45 to 54 Years | 309 (81.3%) | 17 (5.5%) |
| 55 to 59 Years | 237 (90.5%) | 3 (1.3%) |
| 60 to 64 Years | 179 (54.4%) | 0 (0.0%) |
| 65 to 74 Years | 12 (7.1%) | 5 (41.7%) |
| 75 Years and over | 9 (5.4%) | 0 (0.0%) |
| Total | 1,469 (65.6%) | 43 (2.9%) |
Employment Status by Educational Attainment in Winfield
According to labor force statistics for Winfield, 78.0% of individuals (1,275) out of the total population between 25 and 64 years of age (1,635) are in the labor force, with 2.9% or 37 of them being unemployed. The group with the highest labor force participation rate are those with the educational attainment of bachelor's degree or higher, with 90.7% or 596 individuals in the labor force. Within the labor force, individuals with bachelor's degree or higher education have the highest percentage of unemployment, with 3.7% or 22 of them being unemployed.
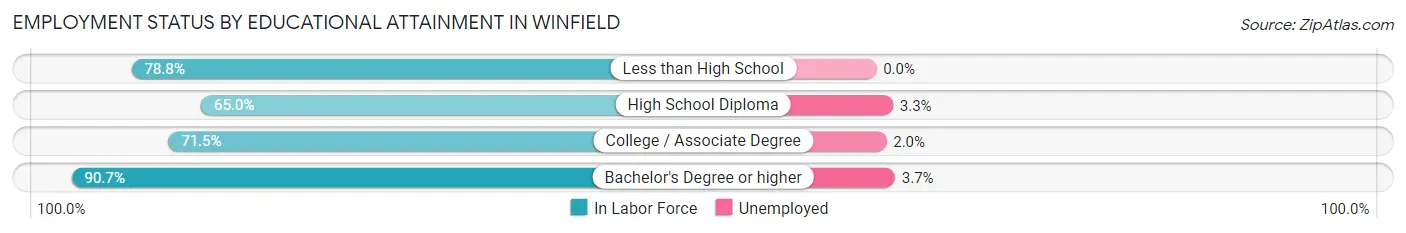
| Educational Attainment | In Labor Force | Unemployed |
| Less than High School | 89 (78.8%) | 0 (0.0%) |
| High School Diploma | 275 (65.0%) | 14 (3.3%) |
| College / Associate Degree | 316 (71.5%) | 9 (2.0%) |
| Bachelor's Degree or higher | 596 (90.7%) | 24 (3.7%) |
| Total | 1,275 (78.0%) | 47 (2.9%) |
Employment Occupations by Sex in Winfield
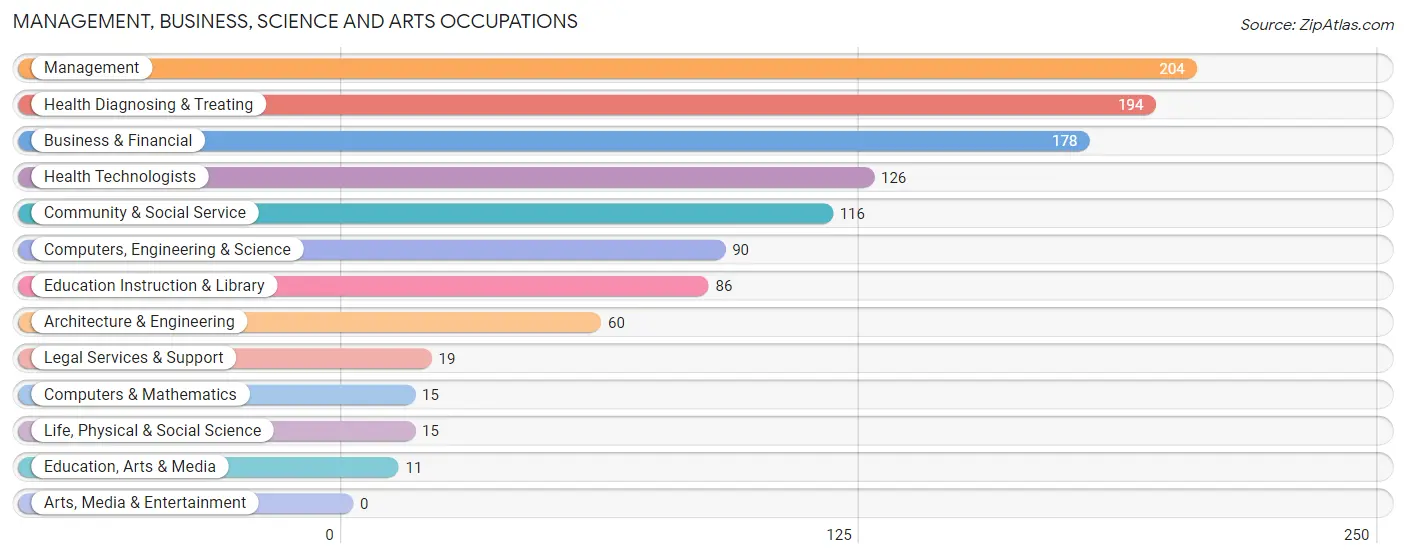
Management, Business, Science and Arts Occupations
The most common Management, Business, Science and Arts occupations in Winfield are Management (204 | 14.4%), Health Diagnosing & Treating (194 | 13.7%), Business & Financial (178 | 12.6%), Health Technologists (126 | 8.9%), and Community & Social Service (116 | 8.2%).
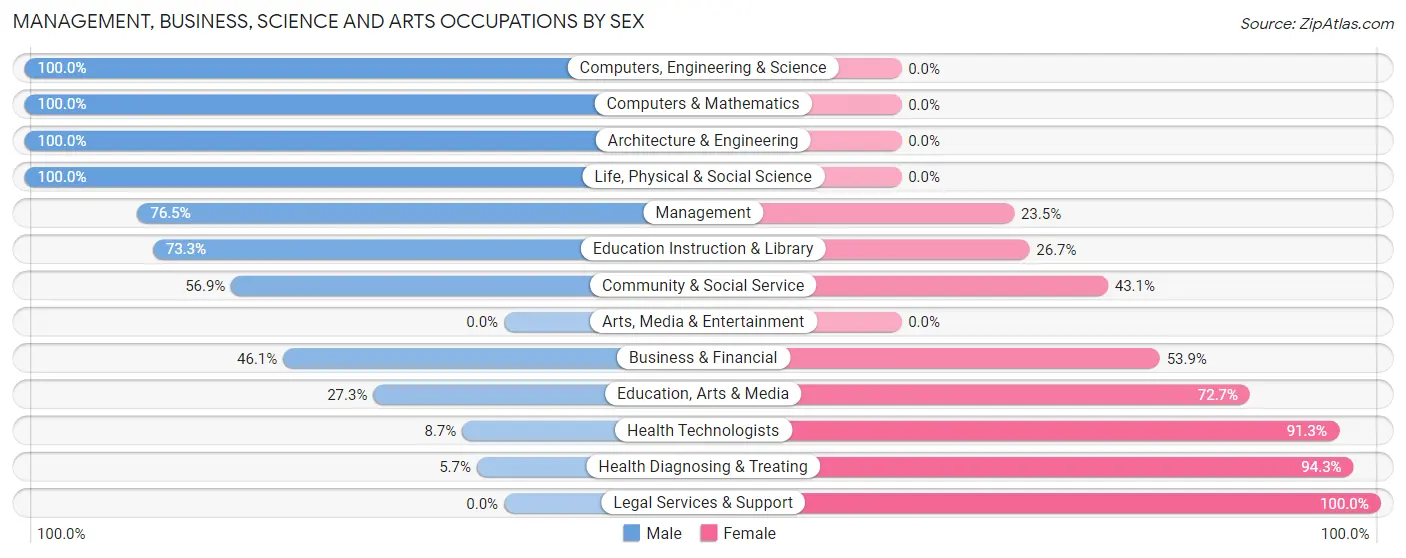
Management, Business, Science and Arts Occupations by Sex
Within the Management, Business, Science and Arts occupations in Winfield, the most male-oriented occupations are Computers, Engineering & Science (100.0%), Computers & Mathematics (100.0%), and Architecture & Engineering (100.0%), while the most female-oriented occupations are Legal Services & Support (100.0%), Health Diagnosing & Treating (94.3%), and Health Technologists (91.3%).
| Occupation | Male | Female |
| Management | 156 (76.5%) | 48 (23.5%) |
| Business & Financial | 82 (46.1%) | 96 (53.9%) |
| Computers, Engineering & Science | 90 (100.0%) | 0 (0.0%) |
| Computers & Mathematics | 15 (100.0%) | 0 (0.0%) |
| Architecture & Engineering | 60 (100.0%) | 0 (0.0%) |
| Life, Physical & Social Science | 15 (100.0%) | 0 (0.0%) |
| Community & Social Service | 66 (56.9%) | 50 (43.1%) |
| Education, Arts & Media | 3 (27.3%) | 8 (72.7%) |
| Legal Services & Support | 0 (0.0%) | 19 (100.0%) |
| Education Instruction & Library | 63 (73.3%) | 23 (26.7%) |
| Arts, Media & Entertainment | 0 (0.0%) | 0 (0.0%) |
| Health Diagnosing & Treating | 11 (5.7%) | 183 (94.3%) |
| Health Technologists | 11 (8.7%) | 115 (91.3%) |
| Total (Category) | 405 (51.8%) | 377 (48.2%) |
| Total (Overall) | 781 (55.2%) | 634 (44.8%) |
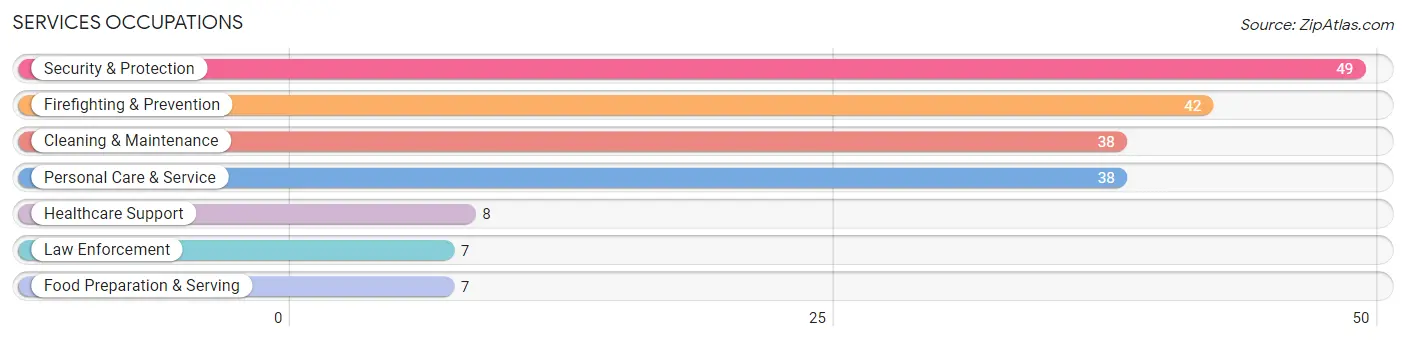
Services Occupations
The most common Services occupations in Winfield are Security & Protection (49 | 3.5%), Firefighting & Prevention (42 | 3.0%), Cleaning & Maintenance (38 | 2.7%), Personal Care & Service (38 | 2.7%), and Healthcare Support (8 | 0.6%).
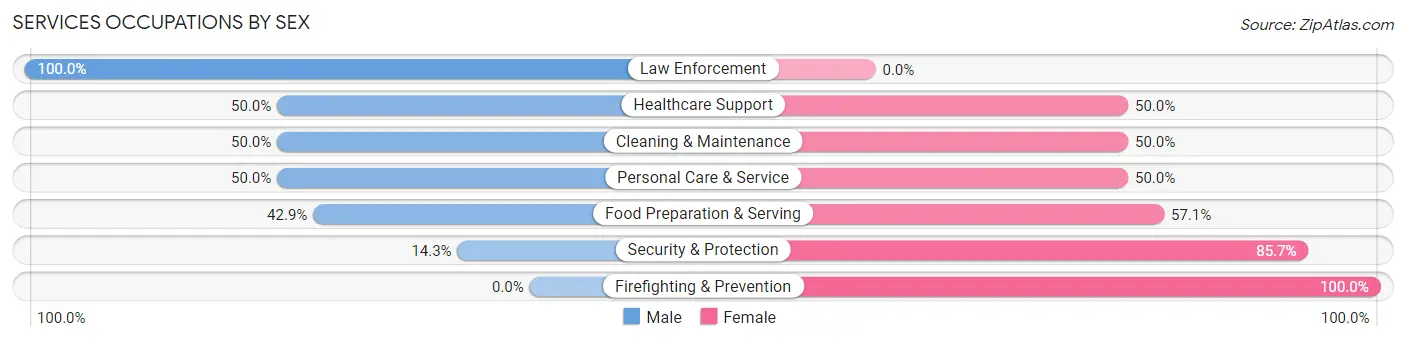
Services Occupations by Sex
Within the Services occupations in Winfield, the most male-oriented occupations are Law Enforcement (100.0%), Healthcare Support (50.0%), and Cleaning & Maintenance (50.0%), while the most female-oriented occupations are Firefighting & Prevention (100.0%), Security & Protection (85.7%), and Food Preparation & Serving (57.1%).
| Occupation | Male | Female |
| Healthcare Support | 4 (50.0%) | 4 (50.0%) |
| Security & Protection | 7 (14.3%) | 42 (85.7%) |
| Firefighting & Prevention | 0 (0.0%) | 42 (100.0%) |
| Law Enforcement | 7 (100.0%) | 0 (0.0%) |
| Food Preparation & Serving | 3 (42.9%) | 4 (57.1%) |
| Cleaning & Maintenance | 19 (50.0%) | 19 (50.0%) |
| Personal Care & Service | 19 (50.0%) | 19 (50.0%) |
| Total (Category) | 52 (37.1%) | 88 (62.9%) |
| Total (Overall) | 781 (55.2%) | 634 (44.8%) |
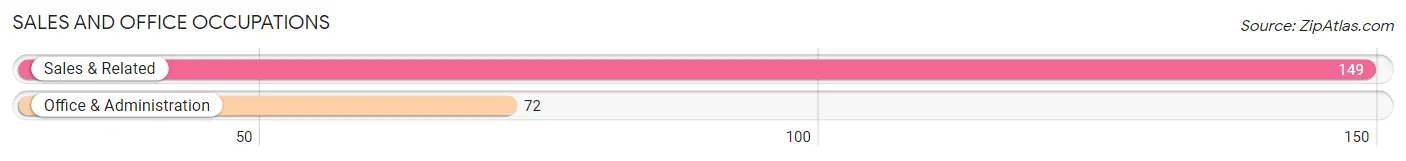
Sales and Office Occupations
The most common Sales and Office occupations in Winfield are Sales & Related (149 | 10.5%), and Office & Administration (72 | 5.1%).
Sales and Office Occupations by Sex
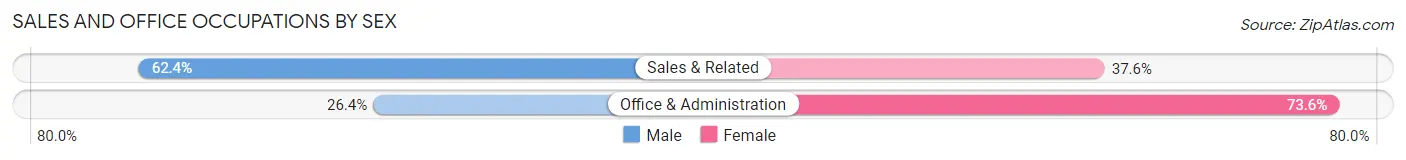
| Occupation | Male | Female |
| Sales & Related | 93 (62.4%) | 56 (37.6%) |
| Office & Administration | 19 (26.4%) | 53 (73.6%) |
| Total (Category) | 112 (50.7%) | 109 (49.3%) |
| Total (Overall) | 781 (55.2%) | 634 (44.8%) |
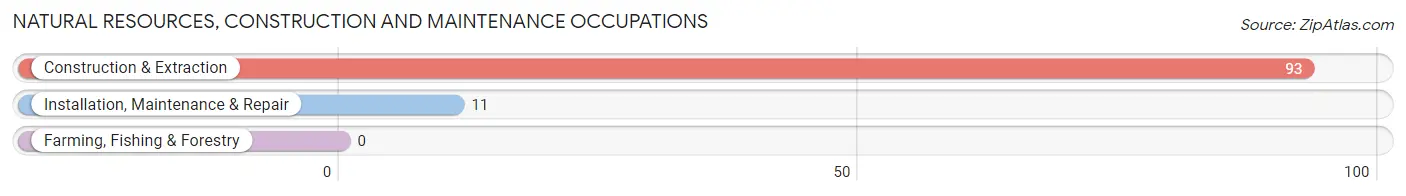
Natural Resources, Construction and Maintenance Occupations
The most common Natural Resources, Construction and Maintenance occupations in Winfield are Construction & Extraction (93 | 6.6%), and Installation, Maintenance & Repair (11 | 0.8%).
Natural Resources, Construction and Maintenance Occupations by Sex
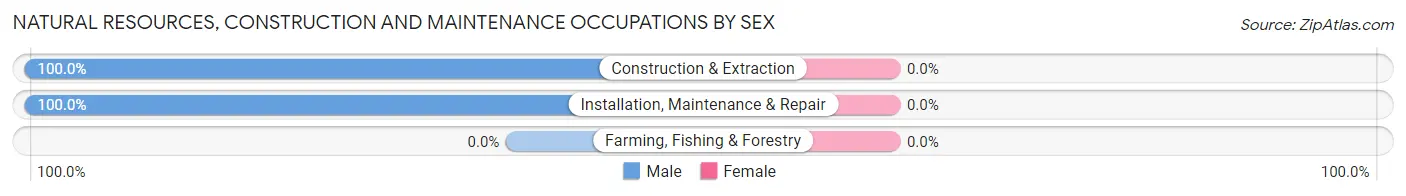
| Occupation | Male | Female |
| Farming, Fishing & Forestry | 0 (0.0%) | 0 (0.0%) |
| Construction & Extraction | 93 (100.0%) | 0 (0.0%) |
| Installation, Maintenance & Repair | 11 (100.0%) | 0 (0.0%) |
| Total (Category) | 104 (100.0%) | 0 (0.0%) |
| Total (Overall) | 781 (55.2%) | 634 (44.8%) |
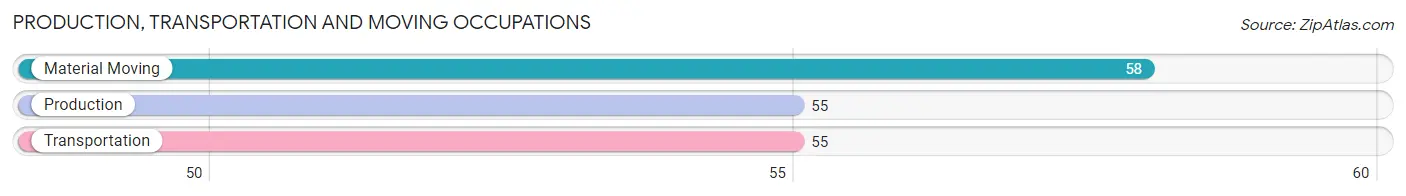
Production, Transportation and Moving Occupations
The most common Production, Transportation and Moving occupations in Winfield are Material Moving (58 | 4.1%), Production (55 | 3.9%), and Transportation (55 | 3.9%).
Production, Transportation and Moving Occupations by Sex
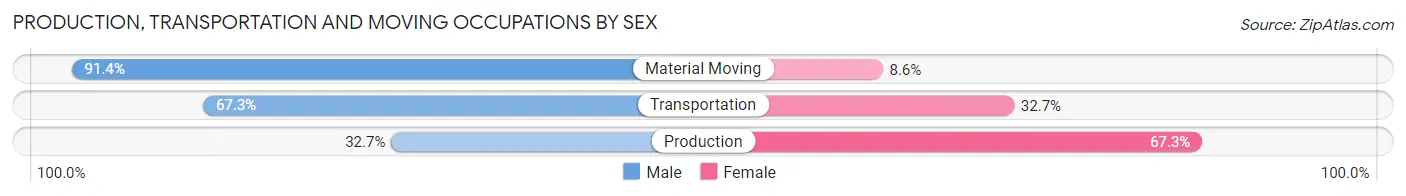
| Occupation | Male | Female |
| Production | 18 (32.7%) | 37 (67.3%) |
| Transportation | 37 (67.3%) | 18 (32.7%) |
| Material Moving | 53 (91.4%) | 5 (8.6%) |
| Total (Category) | 108 (64.3%) | 60 (35.7%) |
| Total (Overall) | 781 (55.2%) | 634 (44.8%) |
Employment Industries by Sex in Winfield
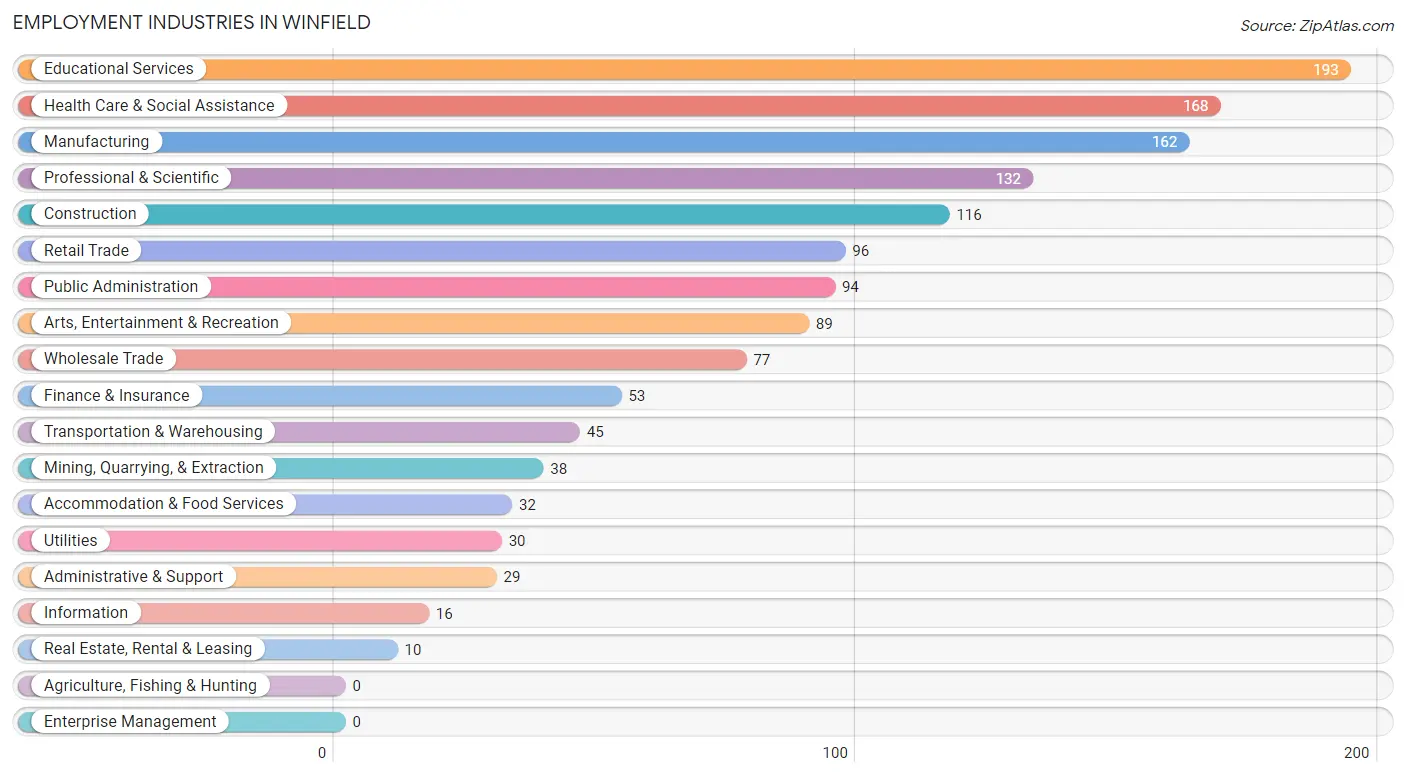
Employment Industries in Winfield
The major employment industries in Winfield include Educational Services (193 | 13.6%), Health Care & Social Assistance (168 | 11.9%), Manufacturing (162 | 11.5%), Professional & Scientific (132 | 9.3%), and Construction (116 | 8.2%).
Employment Industries by Sex in Winfield
The Winfield industries that see more men than women are Mining, Quarrying, & Extraction (100.0%), Construction (100.0%), and Wholesale Trade (100.0%), whereas the industries that tend to have a higher number of women are Health Care & Social Assistance (83.9%), Public Administration (74.5%), and Finance & Insurance (66.0%).
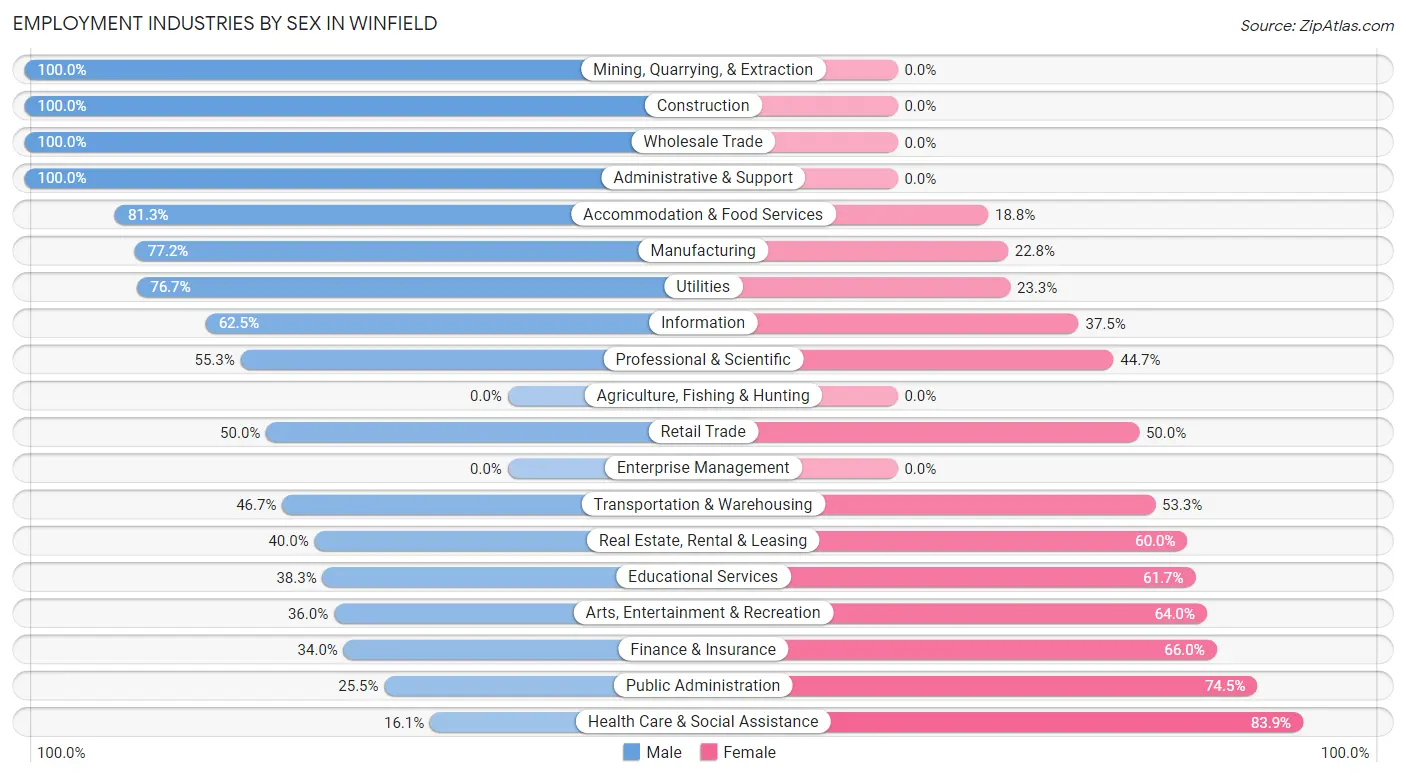
| Industry | Male | Female |
| Agriculture, Fishing & Hunting | 0 (0.0%) | 0 (0.0%) |
| Mining, Quarrying, & Extraction | 38 (100.0%) | 0 (0.0%) |
| Construction | 116 (100.0%) | 0 (0.0%) |
| Manufacturing | 125 (77.2%) | 37 (22.8%) |
| Wholesale Trade | 77 (100.0%) | 0 (0.0%) |
| Retail Trade | 48 (50.0%) | 48 (50.0%) |
| Transportation & Warehousing | 21 (46.7%) | 24 (53.3%) |
| Utilities | 23 (76.7%) | 7 (23.3%) |
| Information | 10 (62.5%) | 6 (37.5%) |
| Finance & Insurance | 18 (34.0%) | 35 (66.0%) |
| Real Estate, Rental & Leasing | 4 (40.0%) | 6 (60.0%) |
| Professional & Scientific | 73 (55.3%) | 59 (44.7%) |
| Enterprise Management | 0 (0.0%) | 0 (0.0%) |
| Administrative & Support | 29 (100.0%) | 0 (0.0%) |
| Educational Services | 74 (38.3%) | 119 (61.7%) |
| Health Care & Social Assistance | 27 (16.1%) | 141 (83.9%) |
| Arts, Entertainment & Recreation | 32 (36.0%) | 57 (64.0%) |
| Accommodation & Food Services | 26 (81.2%) | 6 (18.8%) |
| Public Administration | 24 (25.5%) | 70 (74.5%) |
| Total | 781 (55.2%) | 634 (44.8%) |
Education in Winfield
School Enrollment in Winfield
The most common levels of schooling among the 780 students in Winfield are high school (240 | 30.8%), elementary school (191 | 24.5%), and college / undergraduate (123 | 15.8%).
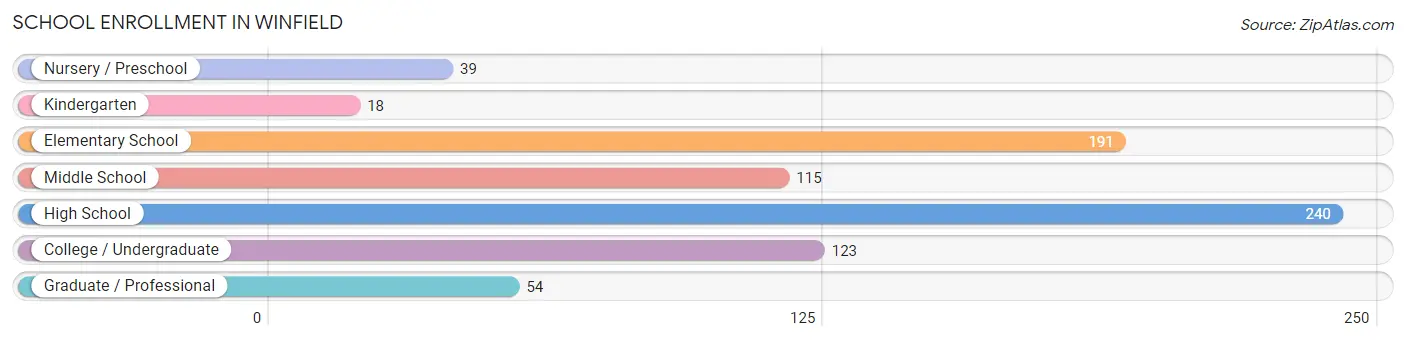
| School Level | # Students | % Students |
| Nursery / Preschool | 39 | 5.0% |
| Kindergarten | 18 | 2.3% |
| Elementary School | 191 | 24.5% |
| Middle School | 115 | 14.7% |
| High School | 240 | 30.8% |
| College / Undergraduate | 123 | 15.8% |
| Graduate / Professional | 54 | 6.9% |
| Total | 780 | 100.0% |
School Enrollment by Age by Funding Source in Winfield
Out of a total of 780 students who are enrolled in schools in Winfield, 44 (5.6%) attend a private institution, while the remaining 736 (94.4%) are enrolled in public schools. The age group of 25 to 34 year olds has the highest likelihood of being enrolled in private schools, with 28 (80.0% in the age bracket) enrolled. Conversely, the age group of 3 to 4 year olds has the lowest likelihood of being enrolled in a private school, with 8 (100.0% in the age bracket) attending a public institution.
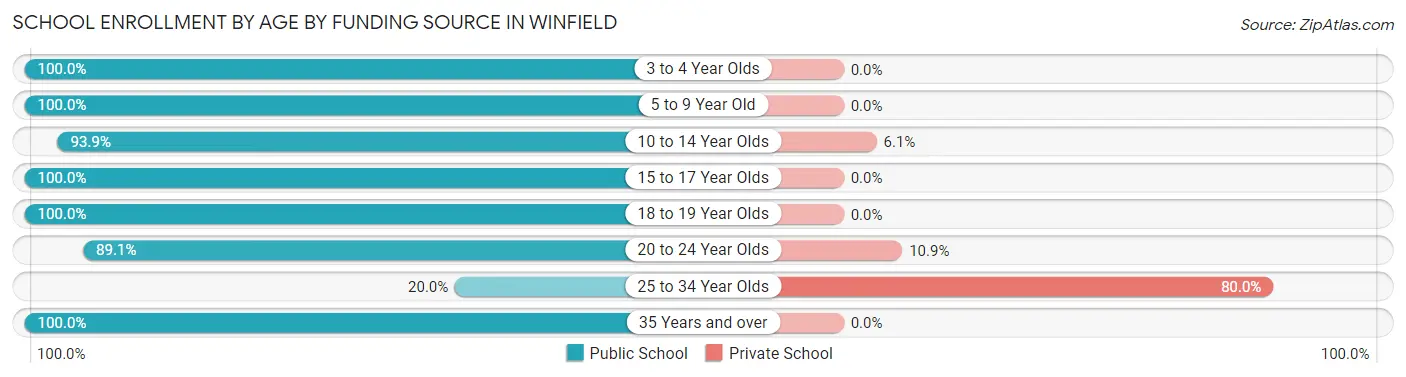
| Age Bracket | Public School | Private School |
| 3 to 4 Year Olds | 8 (100.0%) | 0 (0.0%) |
| 5 to 9 Year Old | 218 (100.0%) | 0 (0.0%) |
| 10 to 14 Year Olds | 153 (93.9%) | 10 (6.1%) |
| 15 to 17 Year Olds | 183 (100.0%) | 0 (0.0%) |
| 18 to 19 Year Olds | 100 (100.0%) | 0 (0.0%) |
| 20 to 24 Year Olds | 49 (89.1%) | 6 (10.9%) |
| 25 to 34 Year Olds | 7 (20.0%) | 28 (80.0%) |
| 35 Years and over | 18 (100.0%) | 0 (0.0%) |
| Total | 736 (94.4%) | 44 (5.6%) |
Educational Attainment by Field of Study in Winfield
Business (226 | 29.4%), science & technology (181 | 23.5%), education (107 | 13.9%), arts & humanities (59 | 7.7%), and computers & mathematics (44 | 5.7%) are the most common fields of study among 769 individuals in Winfield who have obtained a bachelor's degree or higher.
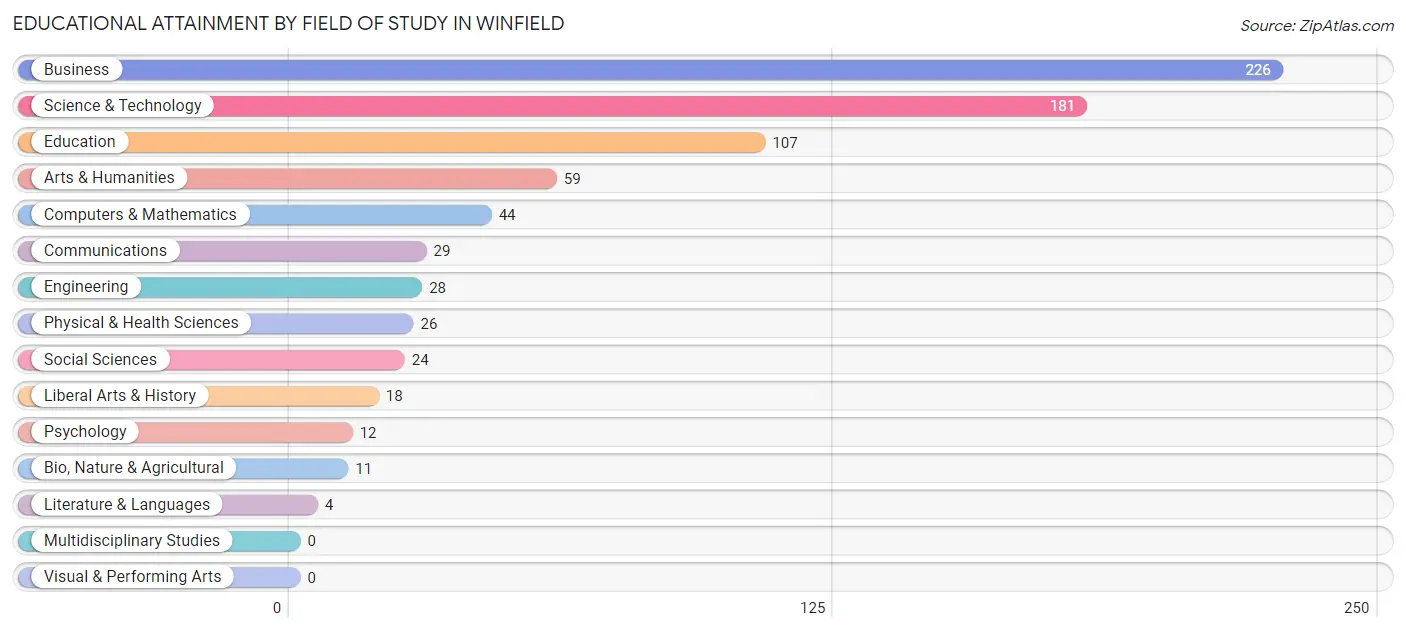
| Field of Study | # Graduates | % Graduates |
| Computers & Mathematics | 44 | 5.7% |
| Bio, Nature & Agricultural | 11 | 1.4% |
| Physical & Health Sciences | 26 | 3.4% |
| Psychology | 12 | 1.6% |
| Social Sciences | 24 | 3.1% |
| Engineering | 28 | 3.6% |
| Multidisciplinary Studies | 0 | 0.0% |
| Science & Technology | 181 | 23.5% |
| Business | 226 | 29.4% |
| Education | 107 | 13.9% |
| Literature & Languages | 4 | 0.5% |
| Liberal Arts & History | 18 | 2.3% |
| Visual & Performing Arts | 0 | 0.0% |
| Communications | 29 | 3.8% |
| Arts & Humanities | 59 | 7.7% |
| Total | 769 | 100.0% |
Transportation & Commute in Winfield
Vehicle Availability by Sex in Winfield
The most prevalent vehicle ownership categories in Winfield are males with 2 vehicles (291, accounting for 39.1%) and females with 2 vehicles (286, making up 47.2%).
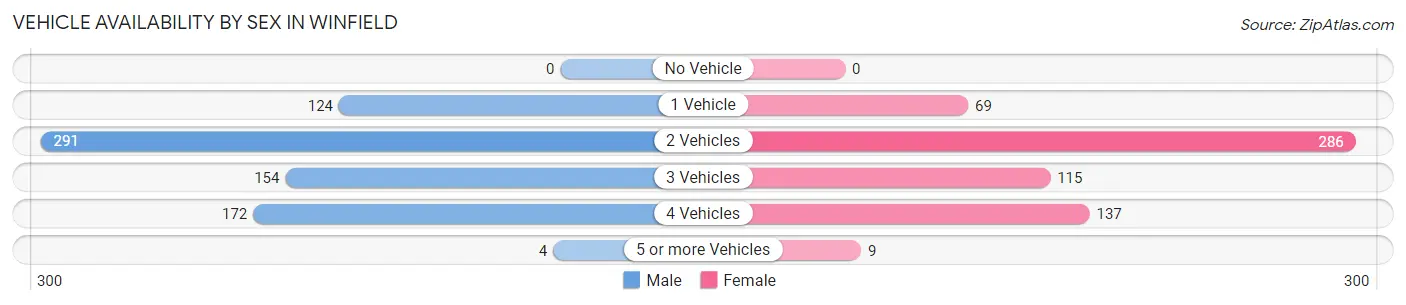
| Vehicles Available | Male | Female |
| No Vehicle | 0 (0.0%) | 0 (0.0%) |
| 1 Vehicle | 124 (16.6%) | 69 (11.2%) |
| 2 Vehicles | 291 (39.1%) | 286 (46.4%) |
| 3 Vehicles | 154 (20.7%) | 115 (18.7%) |
| 4 Vehicles | 172 (23.1%) | 137 (22.2%) |
| 5 or more Vehicles | 4 (0.5%) | 9 (1.5%) |
| Total | 745 (100.0%) | 616 (100.0%) |
Commute Time in Winfield
The most frequently occuring commute durations in Winfield are 30 to 34 minutes (342 commuters, 28.0%), 15 to 19 minutes (249 commuters, 20.4%), and 20 to 24 minutes (127 commuters, 10.4%).
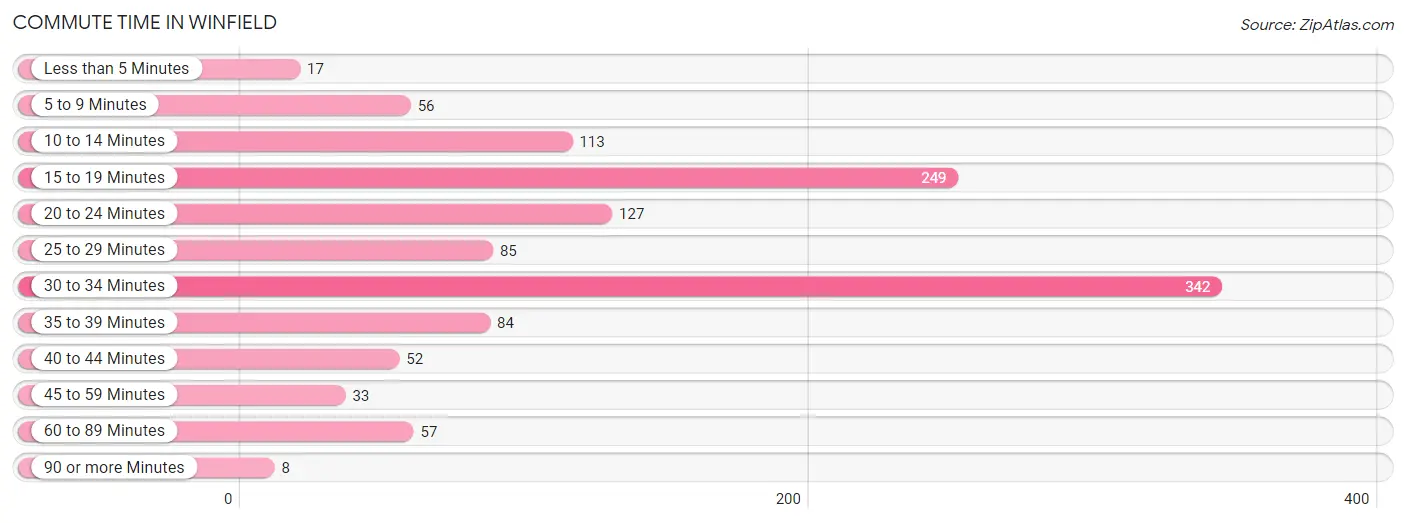
| Commute Time | # Commuters | % Commuters |
| Less than 5 Minutes | 17 | 1.4% |
| 5 to 9 Minutes | 56 | 4.6% |
| 10 to 14 Minutes | 113 | 9.2% |
| 15 to 19 Minutes | 249 | 20.4% |
| 20 to 24 Minutes | 127 | 10.4% |
| 25 to 29 Minutes | 85 | 7.0% |
| 30 to 34 Minutes | 342 | 28.0% |
| 35 to 39 Minutes | 84 | 6.9% |
| 40 to 44 Minutes | 52 | 4.3% |
| 45 to 59 Minutes | 33 | 2.7% |
| 60 to 89 Minutes | 57 | 4.7% |
| 90 or more Minutes | 8 | 0.6% |
Commute Time by Sex in Winfield
The most common commute times in Winfield are 30 to 34 minutes (202 commuters, 30.1%) for males and 30 to 34 minutes (140 commuters, 25.4%) for females.
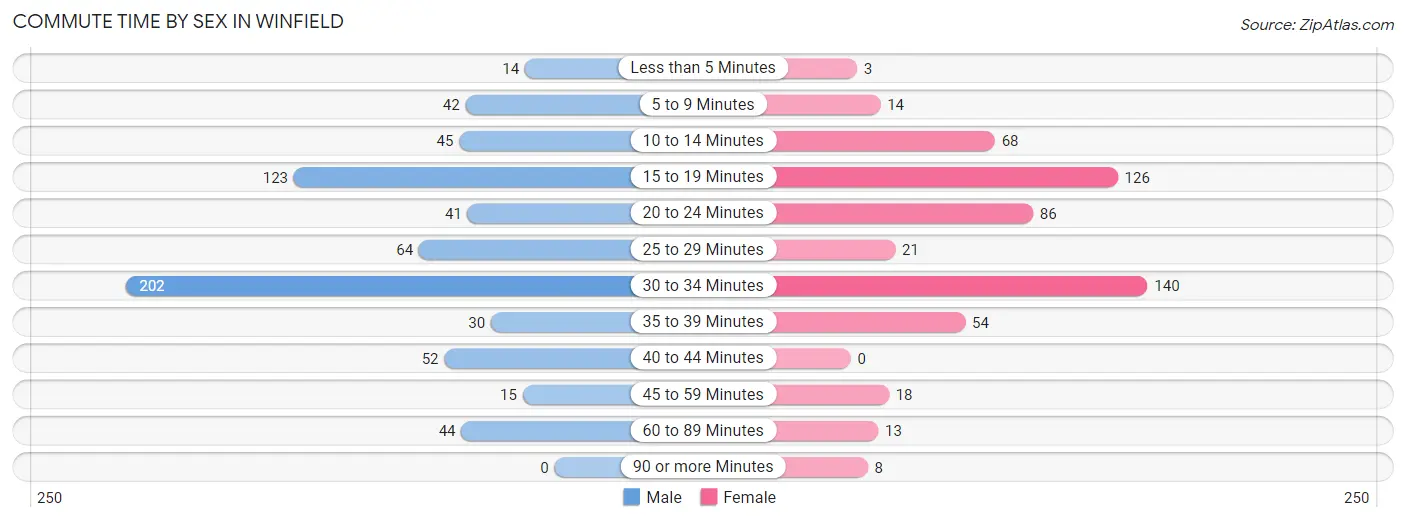
| Commute Time | Male | Female |
| Less than 5 Minutes | 14 (2.1%) | 3 (0.5%) |
| 5 to 9 Minutes | 42 (6.2%) | 14 (2.5%) |
| 10 to 14 Minutes | 45 (6.7%) | 68 (12.3%) |
| 15 to 19 Minutes | 123 (18.3%) | 126 (22.9%) |
| 20 to 24 Minutes | 41 (6.1%) | 86 (15.6%) |
| 25 to 29 Minutes | 64 (9.5%) | 21 (3.8%) |
| 30 to 34 Minutes | 202 (30.1%) | 140 (25.4%) |
| 35 to 39 Minutes | 30 (4.5%) | 54 (9.8%) |
| 40 to 44 Minutes | 52 (7.7%) | 0 (0.0%) |
| 45 to 59 Minutes | 15 (2.2%) | 18 (3.3%) |
| 60 to 89 Minutes | 44 (6.6%) | 13 (2.4%) |
| 90 or more Minutes | 0 (0.0%) | 8 (1.5%) |
Time of Departure to Work by Sex in Winfield
The most frequent times of departure to work in Winfield are 7:00 AM to 7:29 AM (154, 22.9%) for males and 7:30 AM to 7:59 AM (143, 26.0%) for females.
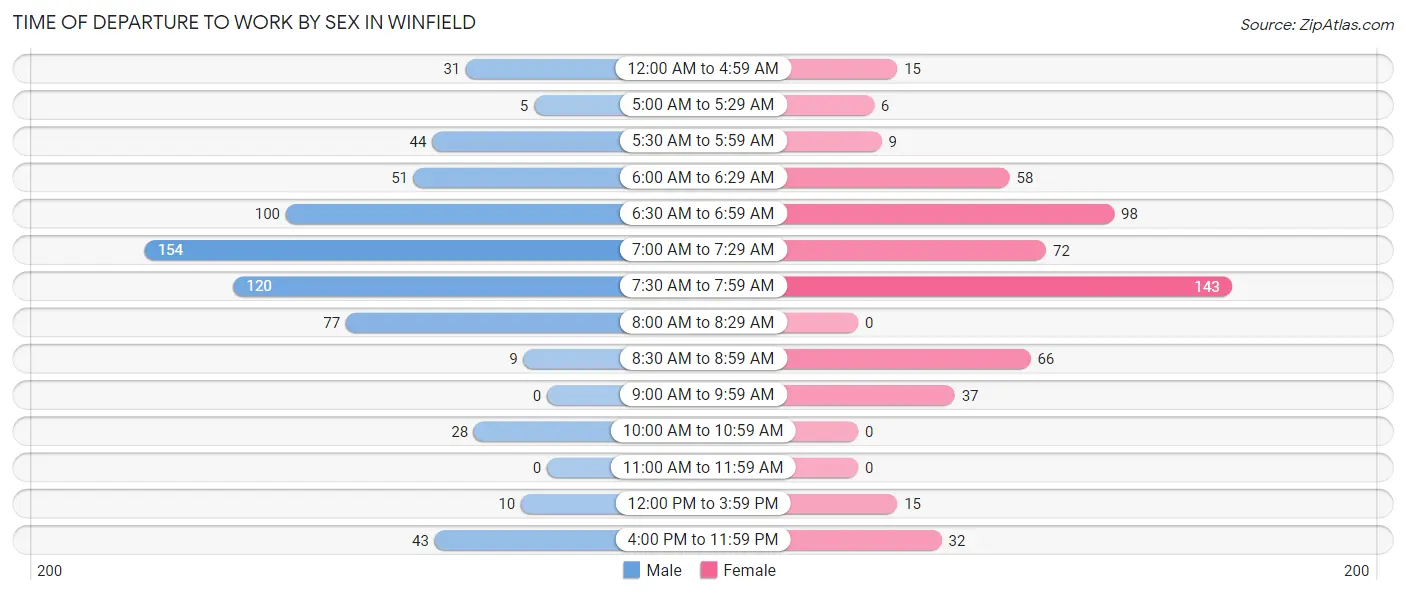
| Time of Departure | Male | Female |
| 12:00 AM to 4:59 AM | 31 (4.6%) | 15 (2.7%) |
| 5:00 AM to 5:29 AM | 5 (0.7%) | 6 (1.1%) |
| 5:30 AM to 5:59 AM | 44 (6.6%) | 9 (1.6%) |
| 6:00 AM to 6:29 AM | 51 (7.6%) | 58 (10.5%) |
| 6:30 AM to 6:59 AM | 100 (14.9%) | 98 (17.8%) |
| 7:00 AM to 7:29 AM | 154 (22.9%) | 72 (13.1%) |
| 7:30 AM to 7:59 AM | 120 (17.9%) | 143 (26.0%) |
| 8:00 AM to 8:29 AM | 77 (11.5%) | 0 (0.0%) |
| 8:30 AM to 8:59 AM | 9 (1.3%) | 66 (12.0%) |
| 9:00 AM to 9:59 AM | 0 (0.0%) | 37 (6.7%) |
| 10:00 AM to 10:59 AM | 28 (4.2%) | 0 (0.0%) |
| 11:00 AM to 11:59 AM | 0 (0.0%) | 0 (0.0%) |
| 12:00 PM to 3:59 PM | 10 (1.5%) | 15 (2.7%) |
| 4:00 PM to 11:59 PM | 43 (6.4%) | 32 (5.8%) |
| Total | 672 (100.0%) | 551 (100.0%) |
Housing Occupancy in Winfield
Occupancy by Ownership in Winfield
Of the total 1,008 dwellings in Winfield, owner-occupied units account for 789 (78.3%), while renter-occupied units make up 219 (21.7%).
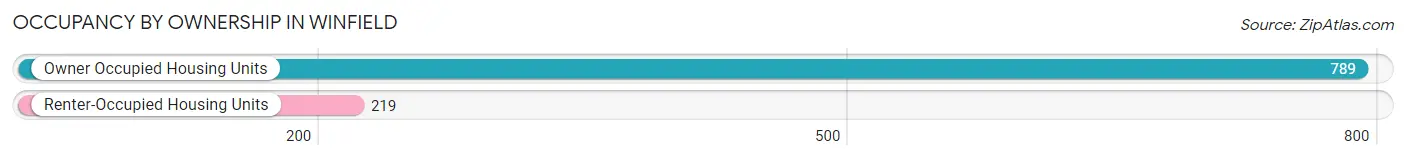
| Occupancy | # Housing Units | % Housing Units |
| Owner Occupied Housing Units | 789 | 78.3% |
| Renter-Occupied Housing Units | 219 | 21.7% |
| Total Occupied Housing Units | 1,008 | 100.0% |
Occupancy by Household Size in Winfield
| Household Size | # Housing Units | % Housing Units |
| 1-Person Household | 197 | 19.5% |
| 2-Person Household | 405 | 40.2% |
| 3-Person Household | 107 | 10.6% |
| 4+ Person Household | 299 | 29.7% |
| Total Housing Units | 1,008 | 100.0% |
Occupancy by Ownership by Household Size in Winfield
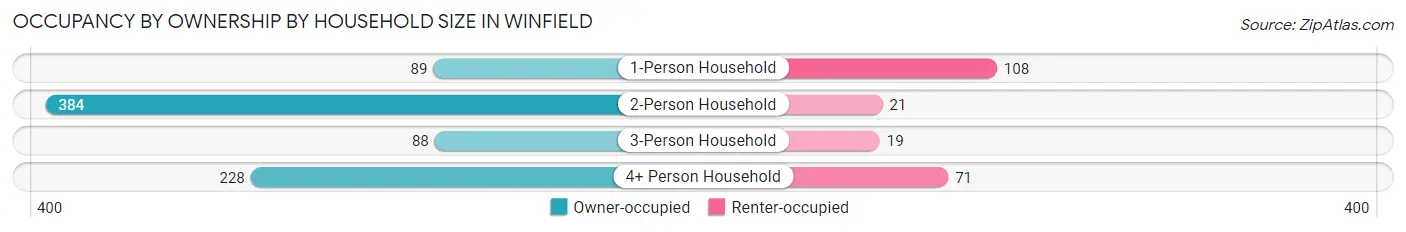
| Household Size | Owner-occupied | Renter-occupied |
| 1-Person Household | 89 (45.2%) | 108 (54.8%) |
| 2-Person Household | 384 (94.8%) | 21 (5.2%) |
| 3-Person Household | 88 (82.2%) | 19 (17.8%) |
| 4+ Person Household | 228 (76.2%) | 71 (23.7%) |
| Total Housing Units | 789 (78.3%) | 219 (21.7%) |
Occupancy by Educational Attainment in Winfield
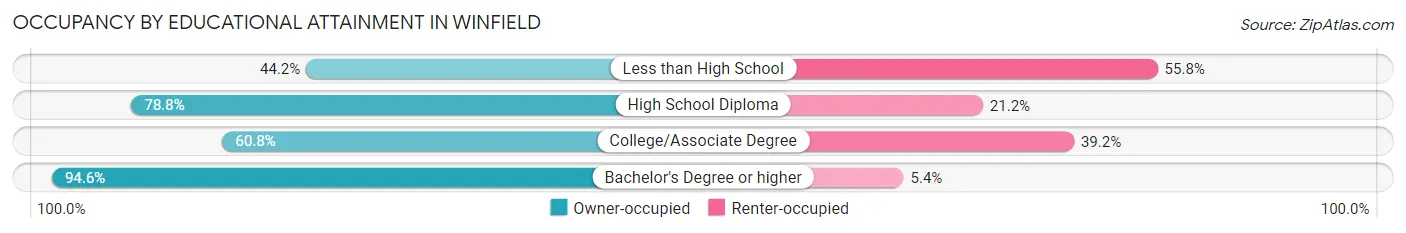
| Household Size | Owner-occupied | Renter-occupied |
| Less than High School | 19 (44.2%) | 24 (55.8%) |
| High School Diploma | 149 (78.8%) | 40 (21.2%) |
| College/Associate Degree | 203 (60.8%) | 131 (39.2%) |
| Bachelor's Degree or higher | 418 (94.6%) | 24 (5.4%) |
Occupancy by Age of Householder in Winfield
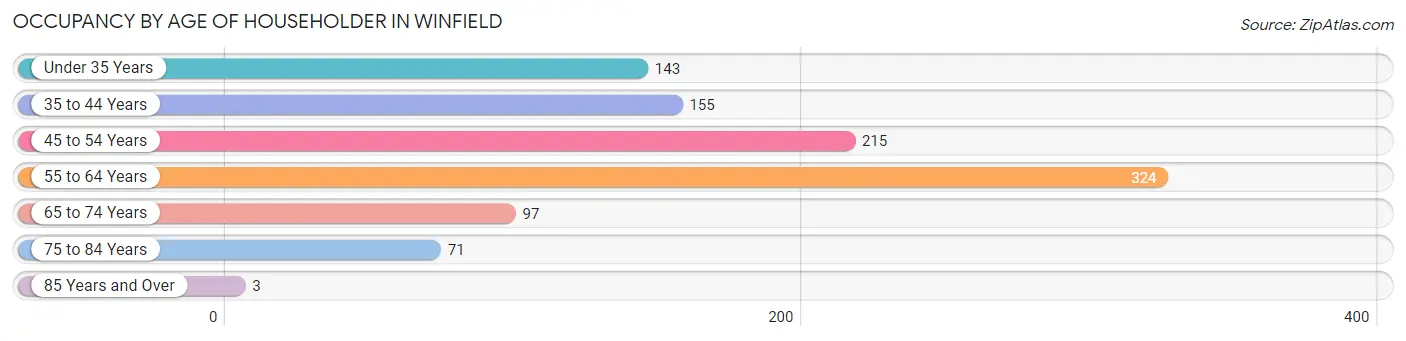
| Age Bracket | # Households | % Households |
| Under 35 Years | 143 | 14.2% |
| 35 to 44 Years | 155 | 15.4% |
| 45 to 54 Years | 215 | 21.3% |
| 55 to 64 Years | 324 | 32.1% |
| 65 to 74 Years | 97 | 9.6% |
| 75 to 84 Years | 71 | 7.0% |
| 85 Years and Over | 3 | 0.3% |
| Total | 1,008 | 100.0% |
Housing Finances in Winfield
Median Income by Occupancy in Winfield
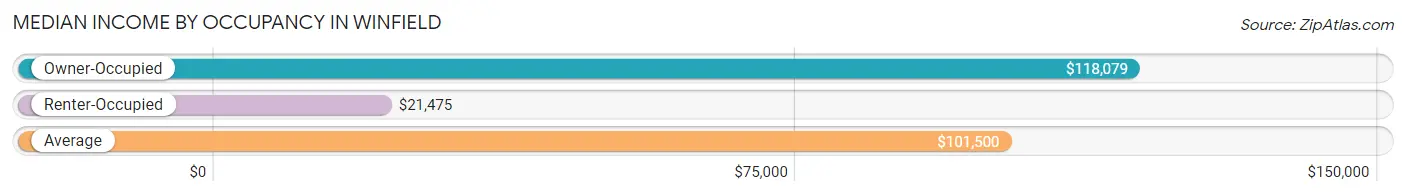
| Occupancy Type | # Households | Median Income |
| Owner-Occupied | 789 (78.3%) | $118,079 |
| Renter-Occupied | 219 (21.7%) | $21,475 |
| Average | 1,008 (100.0%) | $101,500 |
Occupancy by Householder Income Bracket in Winfield
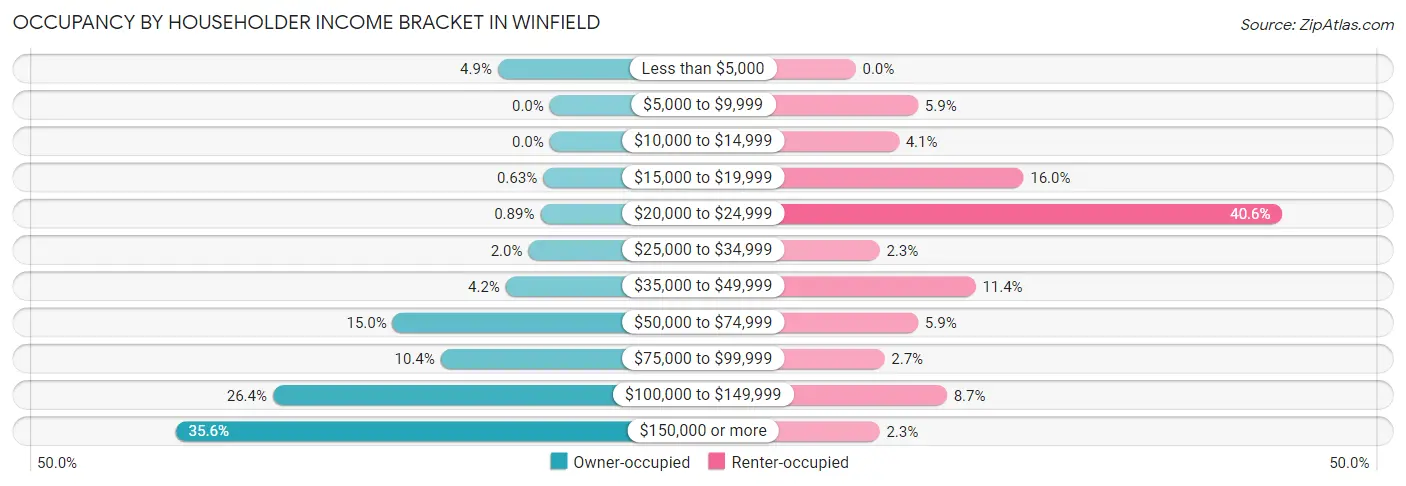
| Income Bracket | Owner-occupied | Renter-occupied |
| Less than $5,000 | 39 (4.9%) | 0 (0.0%) |
| $5,000 to $9,999 | 0 (0.0%) | 13 (5.9%) |
| $10,000 to $14,999 | 0 (0.0%) | 9 (4.1%) |
| $15,000 to $19,999 | 5 (0.6%) | 35 (16.0%) |
| $20,000 to $24,999 | 7 (0.9%) | 89 (40.6%) |
| $25,000 to $34,999 | 16 (2.0%) | 5 (2.3%) |
| $35,000 to $49,999 | 33 (4.2%) | 25 (11.4%) |
| $50,000 to $74,999 | 118 (15.0%) | 13 (5.9%) |
| $75,000 to $99,999 | 82 (10.4%) | 6 (2.7%) |
| $100,000 to $149,999 | 208 (26.4%) | 19 (8.7%) |
| $150,000 or more | 281 (35.6%) | 5 (2.3%) |
| Total | 789 (100.0%) | 219 (100.0%) |
Monthly Housing Cost Tiers in Winfield
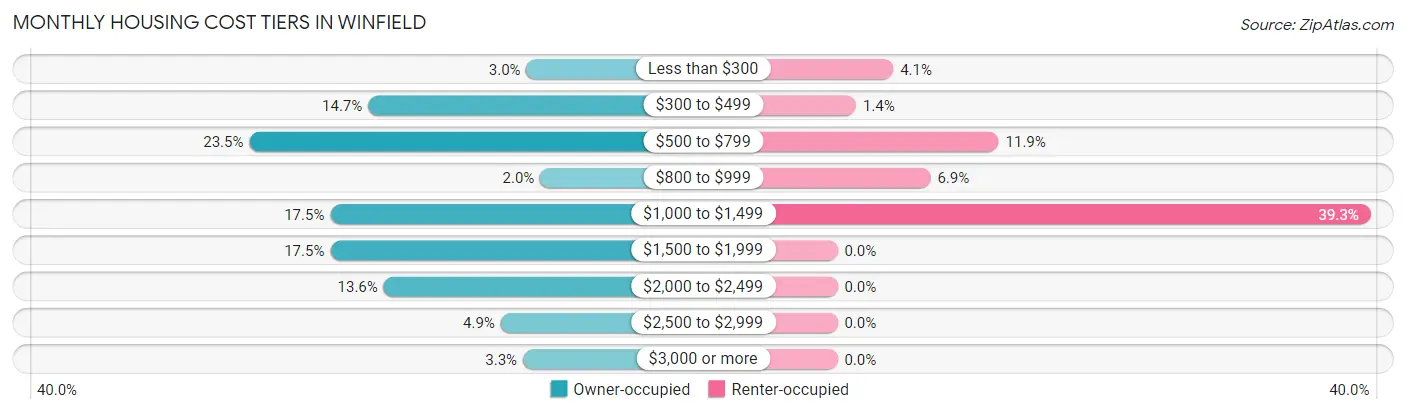
| Monthly Cost | Owner-occupied | Renter-occupied |
| Less than $300 | 24 (3.0%) | 9 (4.1%) |
| $300 to $499 | 116 (14.7%) | 3 (1.4%) |
| $500 to $799 | 185 (23.4%) | 26 (11.9%) |
| $800 to $999 | 16 (2.0%) | 15 (6.9%) |
| $1,000 to $1,499 | 138 (17.5%) | 86 (39.3%) |
| $1,500 to $1,999 | 138 (17.5%) | 0 (0.0%) |
| $2,000 to $2,499 | 107 (13.6%) | 0 (0.0%) |
| $2,500 to $2,999 | 39 (4.9%) | 0 (0.0%) |
| $3,000 or more | 26 (3.3%) | 0 (0.0%) |
| Total | 789 (100.0%) | 219 (100.0%) |
Physical Housing Characteristics in Winfield
Housing Structures in Winfield
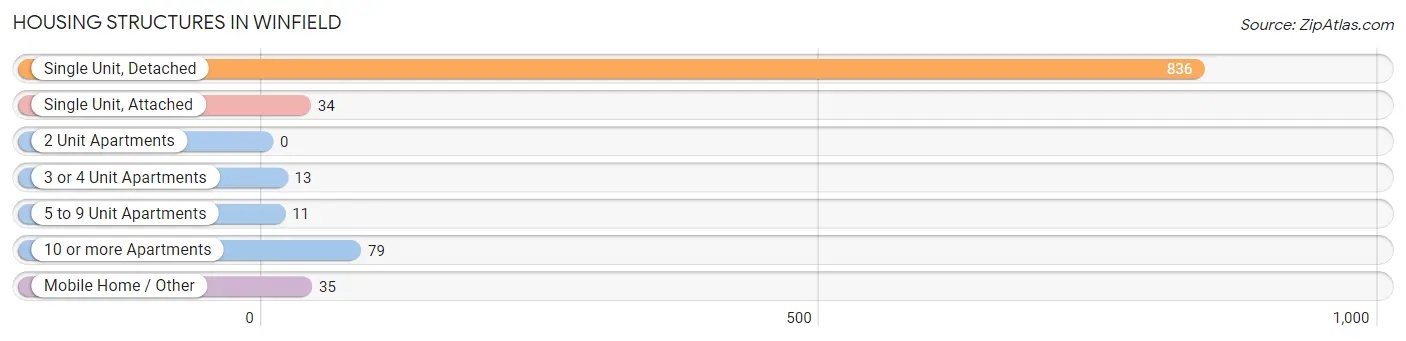
| Structure Type | # Housing Units | % Housing Units |
| Single Unit, Detached | 836 | 82.9% |
| Single Unit, Attached | 34 | 3.4% |
| 2 Unit Apartments | 0 | 0.0% |
| 3 or 4 Unit Apartments | 13 | 1.3% |
| 5 to 9 Unit Apartments | 11 | 1.1% |
| 10 or more Apartments | 79 | 7.8% |
| Mobile Home / Other | 35 | 3.5% |
| Total | 1,008 | 100.0% |
Housing Structures by Occupancy in Winfield
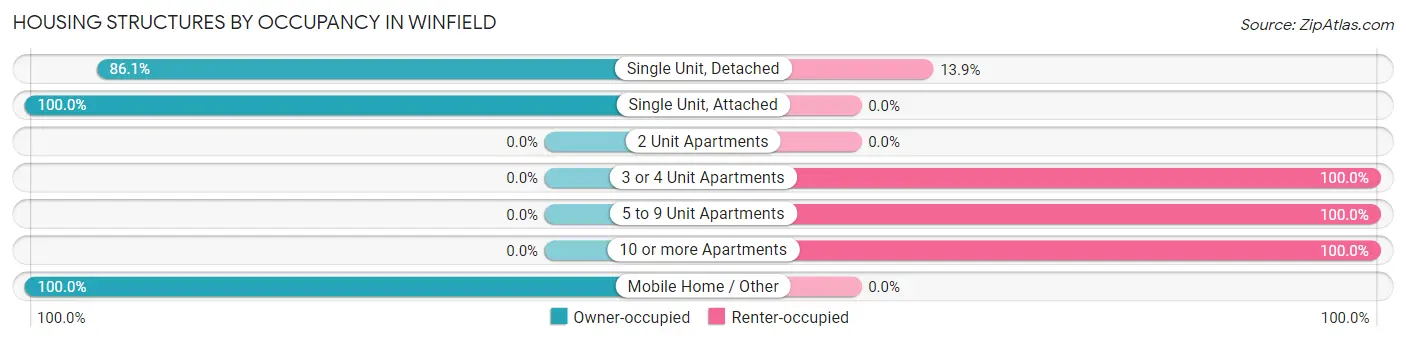
| Structure Type | Owner-occupied | Renter-occupied |
| Single Unit, Detached | 720 (86.1%) | 116 (13.9%) |
| Single Unit, Attached | 34 (100.0%) | 0 (0.0%) |
| 2 Unit Apartments | 0 (0.0%) | 0 (0.0%) |
| 3 or 4 Unit Apartments | 0 (0.0%) | 13 (100.0%) |
| 5 to 9 Unit Apartments | 0 (0.0%) | 11 (100.0%) |
| 10 or more Apartments | 0 (0.0%) | 79 (100.0%) |
| Mobile Home / Other | 35 (100.0%) | 0 (0.0%) |
| Total | 789 (78.3%) | 219 (21.7%) |
Housing Structures by Number of Rooms in Winfield
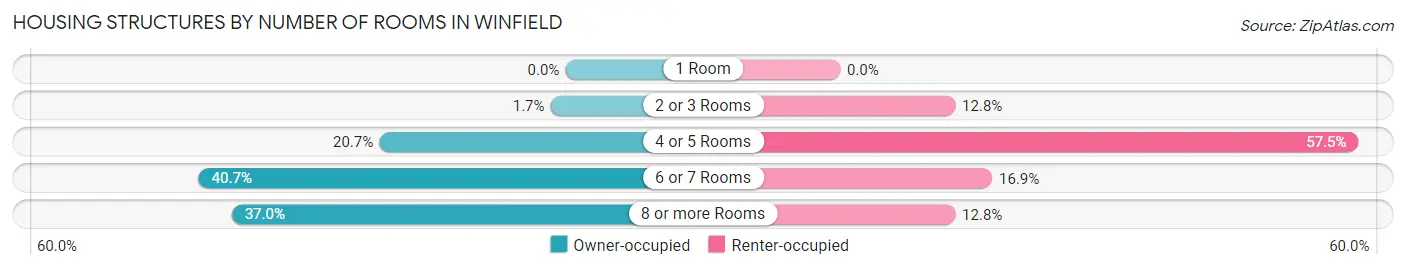
| Number of Rooms | Owner-occupied | Renter-occupied |
| 1 Room | 0 (0.0%) | 0 (0.0%) |
| 2 or 3 Rooms | 13 (1.7%) | 28 (12.8%) |
| 4 or 5 Rooms | 163 (20.7%) | 126 (57.5%) |
| 6 or 7 Rooms | 321 (40.7%) | 37 (16.9%) |
| 8 or more Rooms | 292 (37.0%) | 28 (12.8%) |
| Total | 789 (100.0%) | 219 (100.0%) |
Housing Structure by Heating Type in Winfield
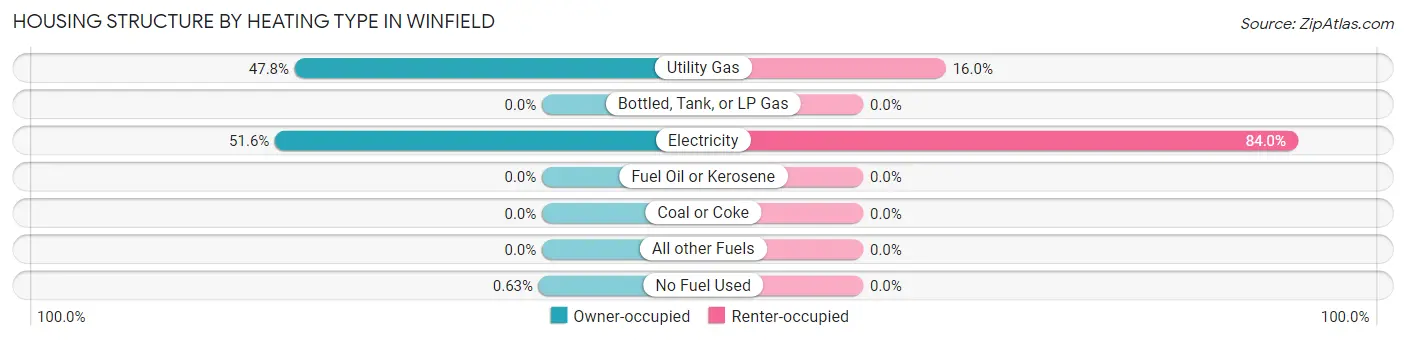
| Heating Type | Owner-occupied | Renter-occupied |
| Utility Gas | 377 (47.8%) | 35 (16.0%) |
| Bottled, Tank, or LP Gas | 0 (0.0%) | 0 (0.0%) |
| Electricity | 407 (51.6%) | 184 (84.0%) |
| Fuel Oil or Kerosene | 0 (0.0%) | 0 (0.0%) |
| Coal or Coke | 0 (0.0%) | 0 (0.0%) |
| All other Fuels | 0 (0.0%) | 0 (0.0%) |
| No Fuel Used | 5 (0.6%) | 0 (0.0%) |
| Total | 789 (100.0%) | 219 (100.0%) |
Household Vehicle Usage in Winfield
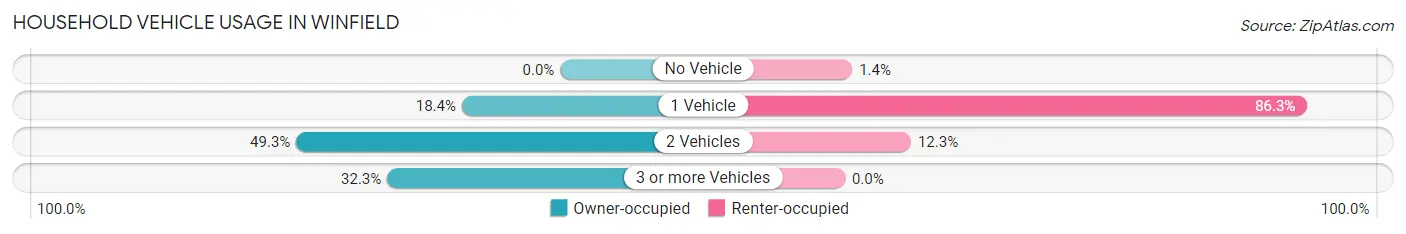
| Vehicles per Household | Owner-occupied | Renter-occupied |
| No Vehicle | 0 (0.0%) | 3 (1.4%) |
| 1 Vehicle | 145 (18.4%) | 189 (86.3%) |
| 2 Vehicles | 389 (49.3%) | 27 (12.3%) |
| 3 or more Vehicles | 255 (32.3%) | 0 (0.0%) |
| Total | 789 (100.0%) | 219 (100.0%) |
Real Estate & Mortgages in Winfield
Real Estate and Mortgage Overview in Winfield
| Characteristic | Without Mortgage | With Mortgage |
| Housing Units | 334 | 455 |
| Median Property Value | $196,100 | $251,400 |
| Median Household Income | $91,500 | $211 |
| Monthly Housing Costs | $525 | $26 |
| Real Estate Taxes | $1,443 | $12 |
Property Value by Mortgage Status in Winfield
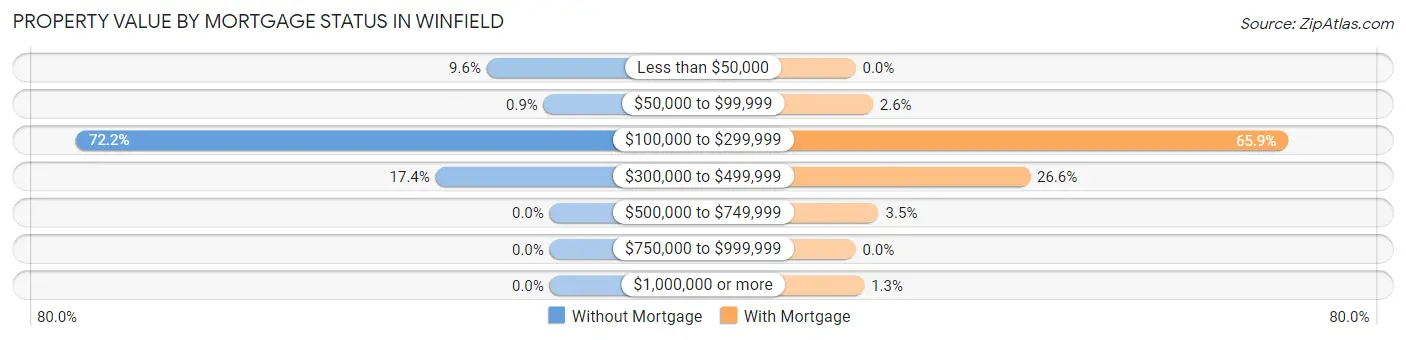
| Property Value | Without Mortgage | With Mortgage |
| Less than $50,000 | 32 (9.6%) | 0 (0.0%) |
| $50,000 to $99,999 | 3 (0.9%) | 12 (2.6%) |
| $100,000 to $299,999 | 241 (72.2%) | 300 (65.9%) |
| $300,000 to $499,999 | 58 (17.4%) | 121 (26.6%) |
| $500,000 to $749,999 | 0 (0.0%) | 16 (3.5%) |
| $750,000 to $999,999 | 0 (0.0%) | 0 (0.0%) |
| $1,000,000 or more | 0 (0.0%) | 6 (1.3%) |
| Total | 334 (100.0%) | 455 (100.0%) |
Household Income by Mortgage Status in Winfield
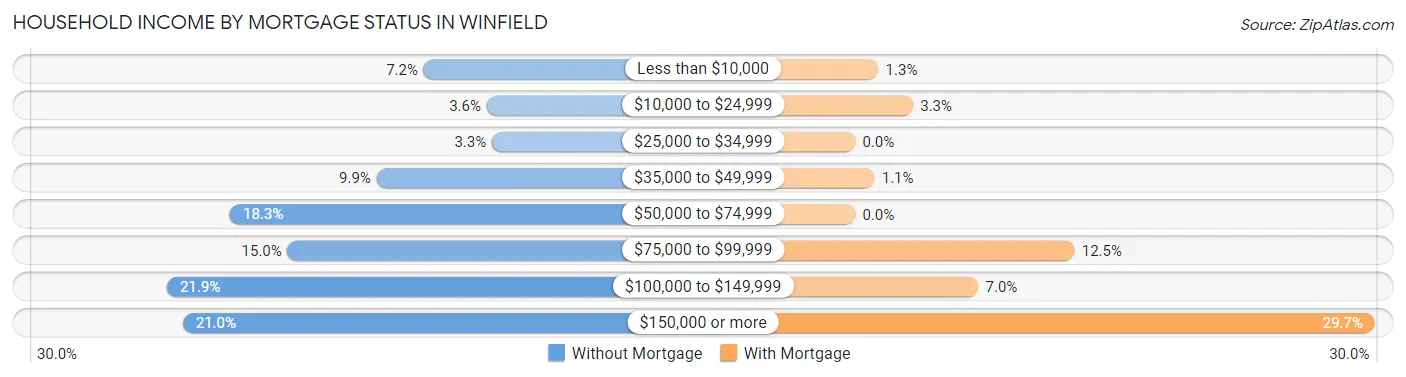
| Household Income | Without Mortgage | With Mortgage |
| Less than $10,000 | 24 (7.2%) | 6 (1.3%) |
| $10,000 to $24,999 | 12 (3.6%) | 15 (3.3%) |
| $25,000 to $34,999 | 11 (3.3%) | 0 (0.0%) |
| $35,000 to $49,999 | 33 (9.9%) | 5 (1.1%) |
| $50,000 to $74,999 | 61 (18.3%) | 0 (0.0%) |
| $75,000 to $99,999 | 50 (15.0%) | 57 (12.5%) |
| $100,000 to $149,999 | 73 (21.9%) | 32 (7.0%) |
| $150,000 or more | 70 (21.0%) | 135 (29.7%) |
| Total | 334 (100.0%) | 455 (100.0%) |
Property Value to Household Income Ratio in Winfield
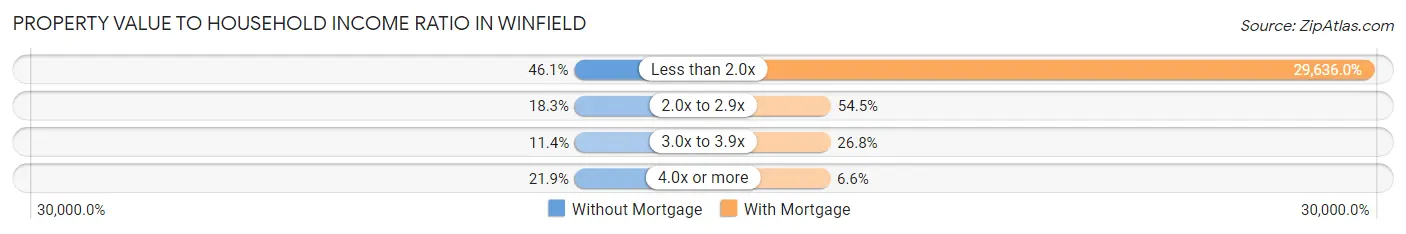
| Value-to-Income Ratio | Without Mortgage | With Mortgage |
| Less than 2.0x | 154 (46.1%) | 134,844 (29,636.0%) |
| 2.0x to 2.9x | 61 (18.3%) | 248 (54.5%) |
| 3.0x to 3.9x | 38 (11.4%) | 122 (26.8%) |
| 4.0x or more | 73 (21.9%) | 30 (6.6%) |
| Total | 334 (100.0%) | 455 (100.0%) |
Real Estate Taxes by Mortgage Status in Winfield
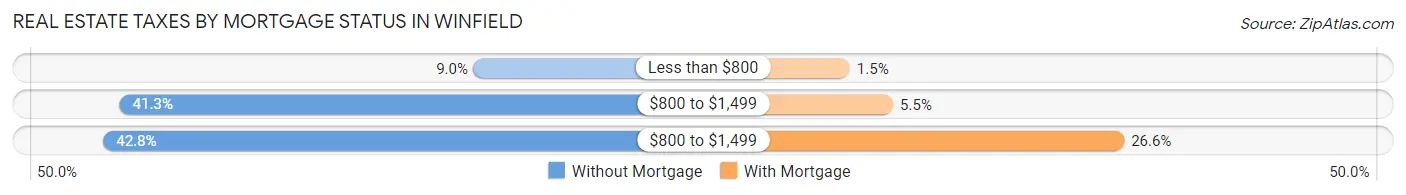
| Property Taxes | Without Mortgage | With Mortgage |
| Less than $800 | 30 (9.0%) | 7 (1.5%) |
| $800 to $1,499 | 138 (41.3%) | 25 (5.5%) |
| $800 to $1,499 | 143 (42.8%) | 121 (26.6%) |
| Total | 334 (100.0%) | 455 (100.0%) |
Health & Disability in Winfield
Health Insurance Coverage by Age in Winfield
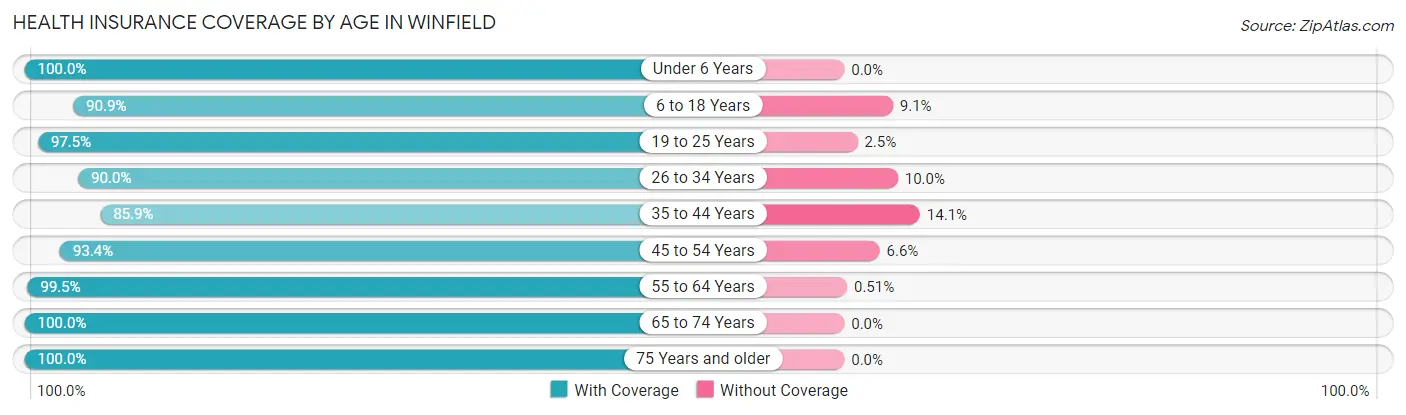
| Age Bracket | With Coverage | Without Coverage |
| Under 6 Years | 201 (100.0%) | 0 (0.0%) |
| 6 to 18 Years | 572 (90.9%) | 57 (9.1%) |
| 19 to 25 Years | 198 (97.5%) | 5 (2.5%) |
| 26 to 34 Years | 280 (90.0%) | 31 (10.0%) |
| 35 to 44 Years | 268 (85.9%) | 44 (14.1%) |
| 45 to 54 Years | 355 (93.4%) | 25 (6.6%) |
| 55 to 64 Years | 588 (99.5%) | 3 (0.5%) |
| 65 to 74 Years | 168 (100.0%) | 0 (0.0%) |
| 75 Years and older | 168 (100.0%) | 0 (0.0%) |
| Total | 2,798 (94.4%) | 165 (5.6%) |
Health Insurance Coverage by Citizenship Status in Winfield
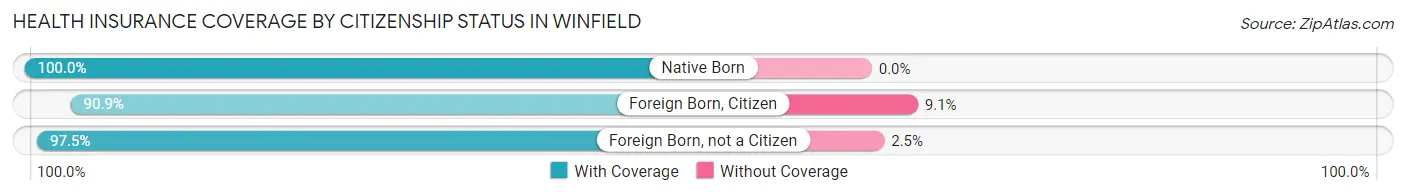
| Citizenship Status | With Coverage | Without Coverage |
| Native Born | 201 (100.0%) | 0 (0.0%) |
| Foreign Born, Citizen | 572 (90.9%) | 57 (9.1%) |
| Foreign Born, not a Citizen | 198 (97.5%) | 5 (2.5%) |
Health Insurance Coverage by Household Income in Winfield
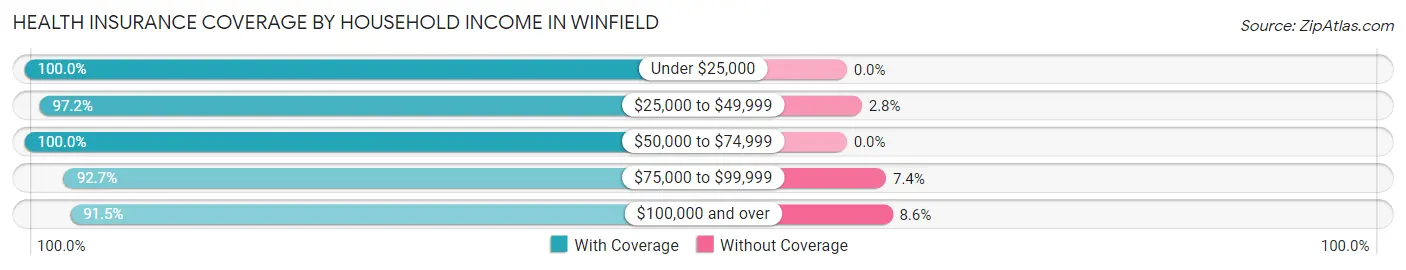
| Household Income | With Coverage | Without Coverage |
| Under $25,000 | 544 (100.0%) | 0 (0.0%) |
| $25,000 to $49,999 | 173 (97.2%) | 5 (2.8%) |
| $50,000 to $74,999 | 341 (100.0%) | 0 (0.0%) |
| $75,000 to $99,999 | 189 (92.6%) | 15 (7.3%) |
| $100,000 and over | 1,551 (91.4%) | 145 (8.6%) |
Public vs Private Health Insurance Coverage by Age in Winfield
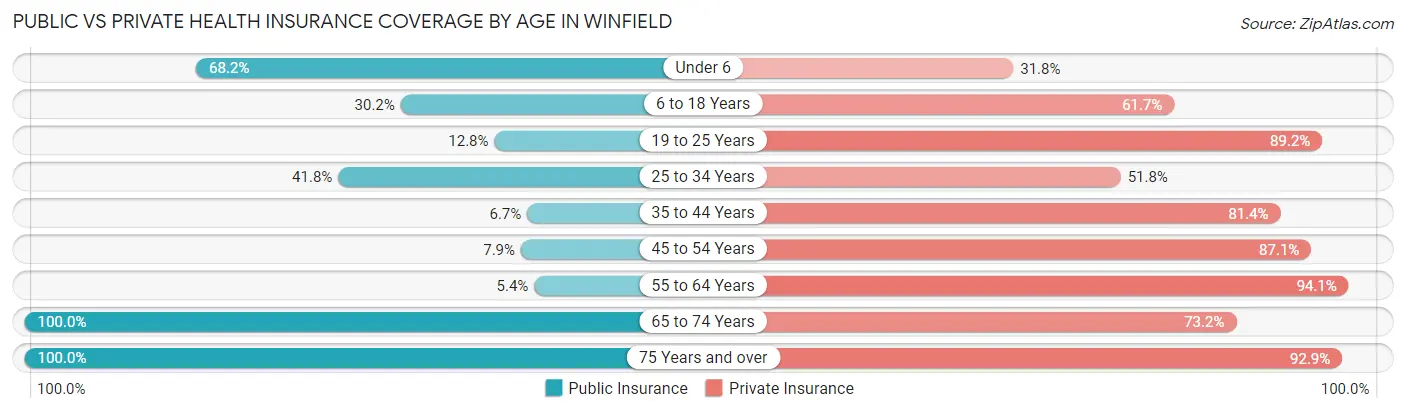
| Age Bracket | Public Insurance | Private Insurance |
| Under 6 | 137 (68.2%) | 64 (31.8%) |
| 6 to 18 Years | 190 (30.2%) | 388 (61.7%) |
| 19 to 25 Years | 26 (12.8%) | 181 (89.2%) |
| 25 to 34 Years | 130 (41.8%) | 161 (51.8%) |
| 35 to 44 Years | 21 (6.7%) | 254 (81.4%) |
| 45 to 54 Years | 30 (7.9%) | 331 (87.1%) |
| 55 to 64 Years | 32 (5.4%) | 556 (94.1%) |
| 65 to 74 Years | 168 (100.0%) | 123 (73.2%) |
| 75 Years and over | 168 (100.0%) | 156 (92.9%) |
| Total | 902 (30.4%) | 2,214 (74.7%) |
Disability Status by Sex by Age in Winfield
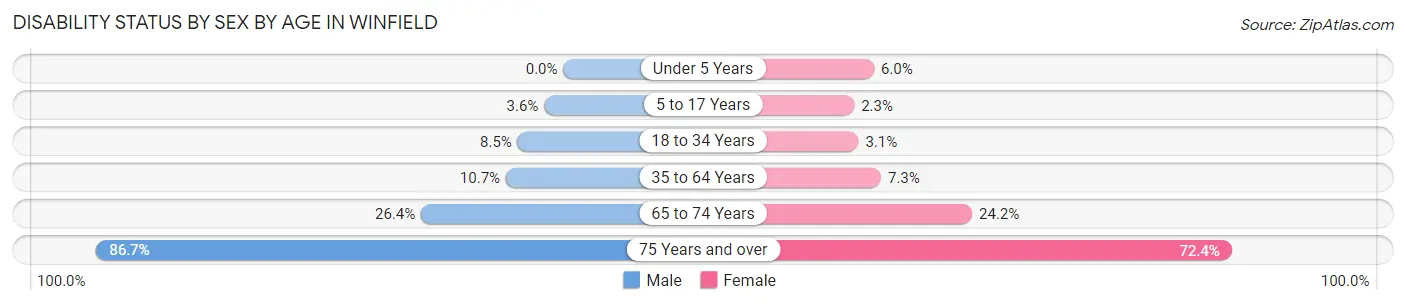
| Age Bracket | Male | Female |
| Under 5 Years | 0 (0.0%) | 4 (6.0%) |
| 5 to 17 Years | 13 (3.6%) | 5 (2.3%) |
| 18 to 34 Years | 24 (8.5%) | 9 (3.1%) |
| 35 to 64 Years | 65 (10.7%) | 49 (7.3%) |
| 65 to 74 Years | 28 (26.4%) | 15 (24.2%) |
| 75 Years and over | 39 (86.7%) | 89 (72.4%) |
Disability Class by Sex by Age in Winfield
Disability Class: Hearing Difficulty
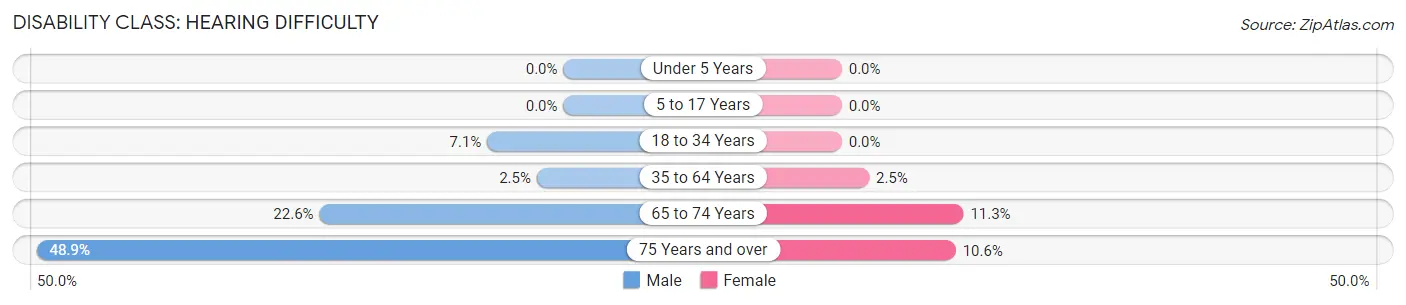
| Age Bracket | Male | Female |
| Under 5 Years | 0 (0.0%) | 0 (0.0%) |
| 5 to 17 Years | 0 (0.0%) | 0 (0.0%) |
| 18 to 34 Years | 20 (7.1%) | 0 (0.0%) |
| 35 to 64 Years | 15 (2.5%) | 17 (2.5%) |
| 65 to 74 Years | 24 (22.6%) | 7 (11.3%) |
| 75 Years and over | 22 (48.9%) | 13 (10.6%) |
Disability Class: Vision Difficulty
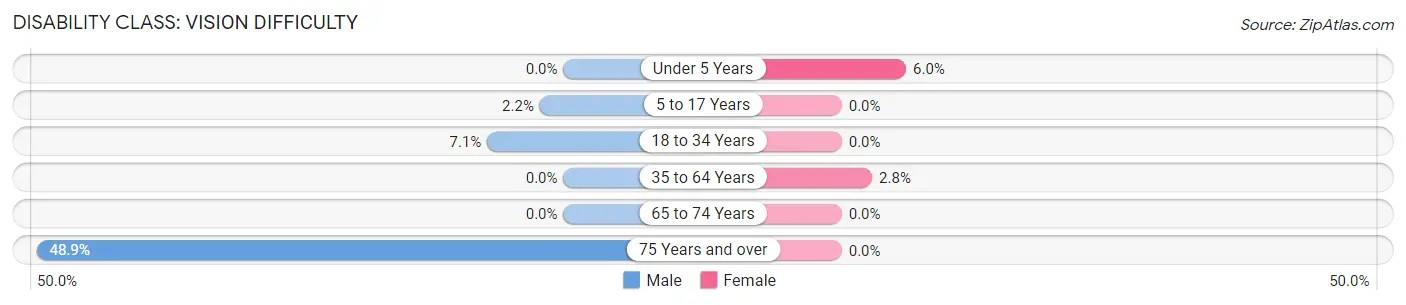
| Age Bracket | Male | Female |
| Under 5 Years | 0 (0.0%) | 4 (6.0%) |
| 5 to 17 Years | 8 (2.2%) | 0 (0.0%) |
| 18 to 34 Years | 20 (7.1%) | 0 (0.0%) |
| 35 to 64 Years | 0 (0.0%) | 19 (2.8%) |
| 65 to 74 Years | 0 (0.0%) | 0 (0.0%) |
| 75 Years and over | 22 (48.9%) | 0 (0.0%) |
Disability Class: Cognitive Difficulty
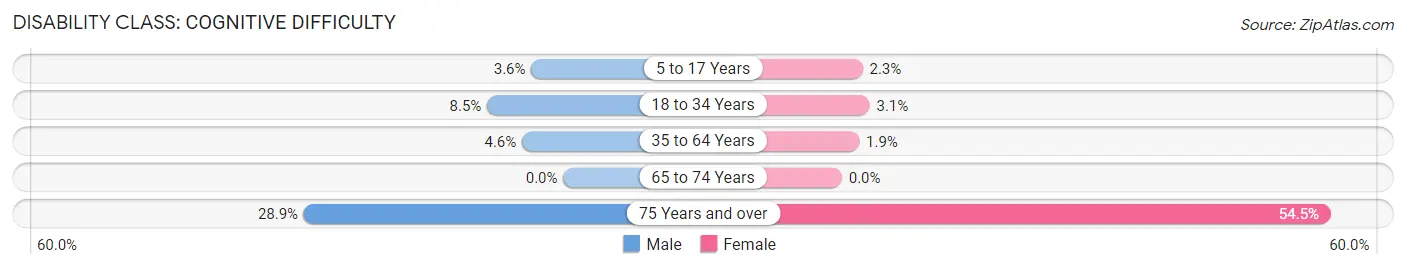
| Age Bracket | Male | Female |
| 5 to 17 Years | 13 (3.6%) | 5 (2.3%) |
| 18 to 34 Years | 24 (8.5%) | 9 (3.1%) |
| 35 to 64 Years | 28 (4.6%) | 13 (1.9%) |
| 65 to 74 Years | 0 (0.0%) | 0 (0.0%) |
| 75 Years and over | 13 (28.9%) | 67 (54.5%) |
Disability Class: Ambulatory Difficulty
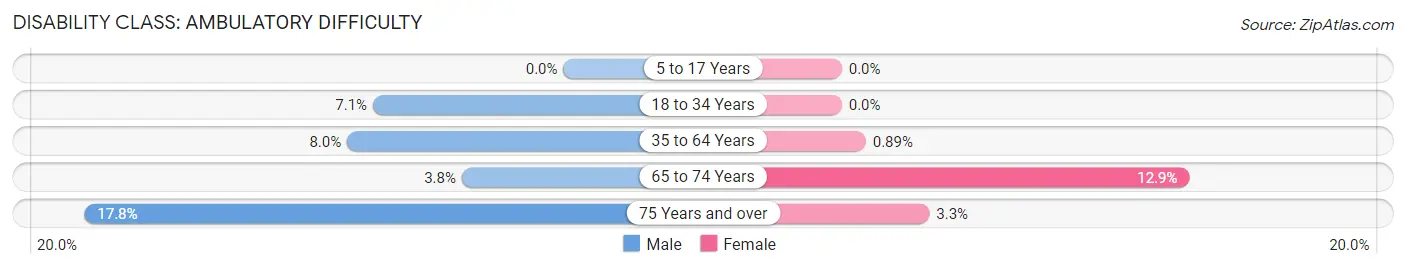
| Age Bracket | Male | Female |
| 5 to 17 Years | 0 (0.0%) | 0 (0.0%) |
| 18 to 34 Years | 20 (7.1%) | 0 (0.0%) |
| 35 to 64 Years | 49 (8.0%) | 6 (0.9%) |
| 65 to 74 Years | 4 (3.8%) | 8 (12.9%) |
| 75 Years and over | 8 (17.8%) | 4 (3.3%) |
Disability Class: Self-Care Difficulty
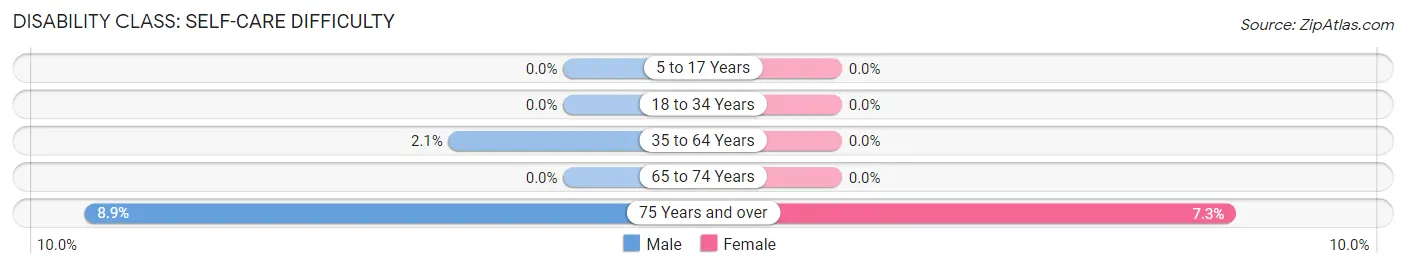
| Age Bracket | Male | Female |
| 5 to 17 Years | 0 (0.0%) | 0 (0.0%) |
| 18 to 34 Years | 0 (0.0%) | 0 (0.0%) |
| 35 to 64 Years | 13 (2.1%) | 0 (0.0%) |
| 65 to 74 Years | 0 (0.0%) | 0 (0.0%) |
| 75 Years and over | 4 (8.9%) | 9 (7.3%) |
Technology Access in Winfield
Computing Device Access in Winfield
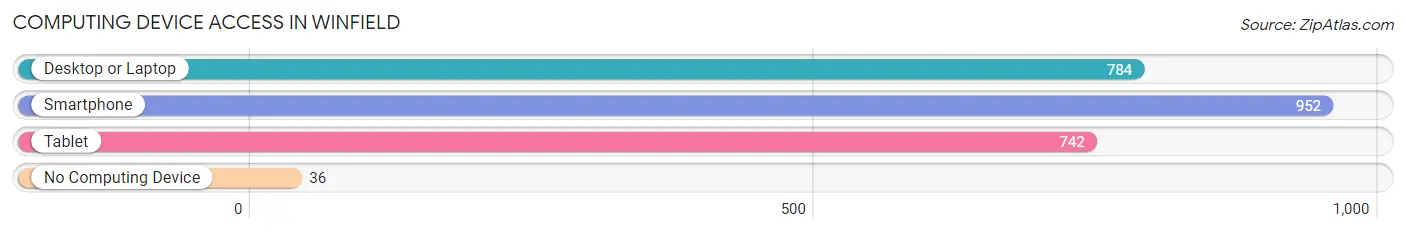
| Device Type | # Households | % Households |
| Desktop or Laptop | 784 | 77.8% |
| Smartphone | 952 | 94.4% |
| Tablet | 742 | 73.6% |
| No Computing Device | 36 | 3.6% |
| Total | 1,008 | 100.0% |
Internet Access in Winfield
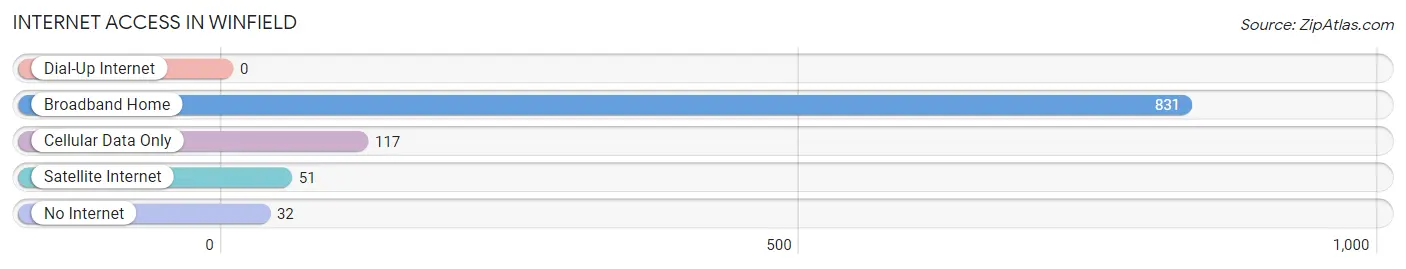
| Internet Type | # Households | % Households |
| Dial-Up Internet | 0 | 0.0% |
| Broadband Home | 831 | 82.4% |
| Cellular Data Only | 117 | 11.6% |
| Satellite Internet | 51 | 5.1% |
| No Internet | 32 | 3.2% |
| Total | 1,008 | 100.0% |
Winfield Summary
Winfield, West Virginia is a small town located in Putnam County, West Virginia. It is situated along the Kanawha River, approximately 25 miles east of Charleston, the state capital. The town was founded in 1871 and was named after General Winfield Scott, a prominent figure in the American Civil War.
History
The area that is now Winfield was originally inhabited by the Shawnee Native American tribe. The first European settlers arrived in the area in the late 1700s. The town was officially founded in 1871 and was named after General Winfield Scott, a prominent figure in the American Civil War.
In the late 1800s, the town was a major hub for the coal and timber industries. The town was also home to several brickyards and a large glass factory. The town was also home to a large number of churches, including the First Baptist Church, which was founded in 1871.
In the early 1900s, the town experienced a period of growth and prosperity. The population increased from 1,000 in 1900 to over 3,000 in 1930. The town was also home to several businesses, including a bank, a hotel, a movie theater, and several stores.
In the mid-1900s, the town experienced a period of decline. The coal and timber industries began to decline, and the population decreased to 1,500 in 1960. The town also experienced a period of economic stagnation, as many of the businesses closed or moved away.
Geography
Winfield is located in Putnam County, West Virginia. It is situated along the Kanawha River, approximately 25 miles east of Charleston, the state capital. The town is located in a rural area, with the nearest major city being Huntington, which is approximately 40 miles away.
The town is located in a hilly area, with the highest point being 1,000 feet above sea level. The town is located in a temperate climate, with hot summers and cold winters. The average annual temperature is around 50 degrees Fahrenheit.
Economy
The economy of Winfield is largely based on agriculture and tourism. The town is home to several farms, which produce a variety of crops, including corn, soybeans, and wheat. The town is also home to several wineries, which produce a variety of wines.
The town is also home to several tourist attractions, including the Winfield Historic District, which is listed on the National Register of Historic Places. The town is also home to several parks, including the Winfield City Park, which features a playground, picnic areas, and a walking trail.
Demographics
As of the 2010 census, the population of Winfield was 1,845. The town is predominantly white, with 95.3% of the population being white. The median household income is $37,500, and the median home value is $90,000. The town has a poverty rate of 16.3%.
Conclusion
Winfield, West Virginia is a small town located in Putnam County, West Virginia. It was founded in 1871 and was named after General Winfield Scott, a prominent figure in the American Civil War. The town was once a major hub for the coal and timber industries, but has since experienced a period of decline. The economy of Winfield is largely based on agriculture and tourism. The population of Winfield is predominantly white, with a median household income of $37,500 and a median home value of $90,000.
Common Questions
What is Per Capita Income in Winfield?
Per Capita income in Winfield is $41,257.
What is the Median Family Income in Winfield?
Median Family Income in Winfield is $118,190.
What is the Median Household income in Winfield?
Median Household Income in Winfield is $101,500.
What is Income or Wage Gap in Winfield?
Income or Wage Gap in Winfield is 14.1%.
Women in Winfield earn 85.9 cents for every dollar earned by a man.
What is Inequality or Gini Index in Winfield?
Inequality or Gini Index in Winfield is 0.44.
What is the Total Population of Winfield?
Total Population of Winfield is 2,975.
What is the Total Male Population of Winfield?
Total Male Population of Winfield is 1,543.
What is the Total Female Population of Winfield?
Total Female Population of Winfield is 1,432.
What is the Ratio of Males per 100 Females in Winfield?
There are 107.75 Males per 100 Females in Winfield.
What is the Ratio of Females per 100 Males in Winfield?
There are 92.81 Females per 100 Males in Winfield.
What is the Median Population Age in Winfield?
Median Population Age in Winfield is 41.1 Years.
What is the Average Family Size in Winfield
Average Family Size in Winfield is 3.5 People.
What is the Average Household Size in Winfield
Average Household Size in Winfield is 3.0 People.
How Large is the Labor Force in Winfield?
There are 1,469 People in the Labor Forcein in Winfield.
What is the Percentage of People in the Labor Force in Winfield?
65.6% of People are in the Labor Force in Winfield.
What is the Unemployment Rate in Winfield?
Unemployment Rate in Winfield is 2.9%.