Windsor Heights, WV Map & Demographics
Windsor Heights Map
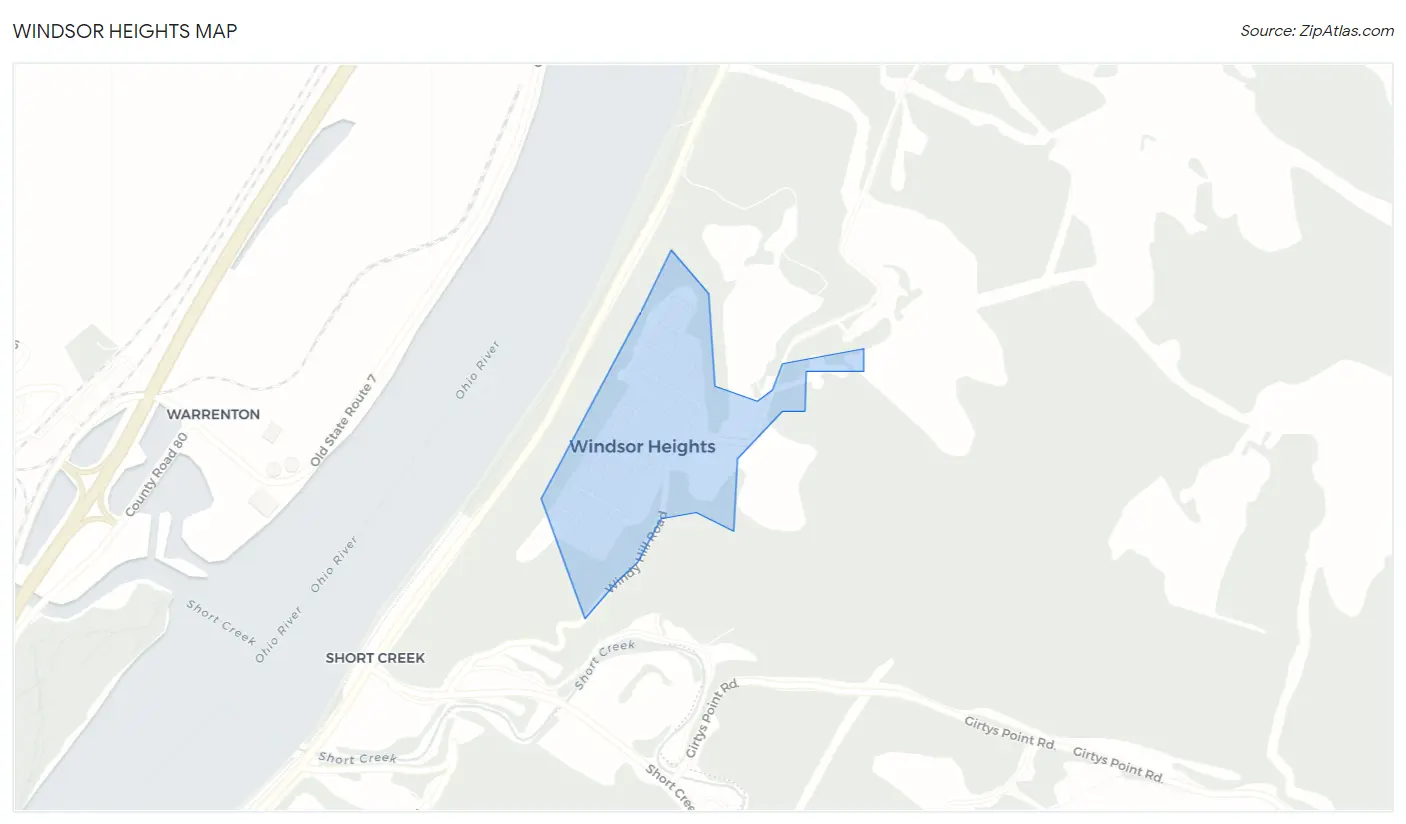
Windsor Heights Overview
$26,905
PER CAPITA INCOME
$61,964
AVG FAMILY INCOME
$46,058
AVG HOUSEHOLD INCOME
14.7%
WAGE / INCOME GAP [ % ]
85.3¢/ $1
WAGE / INCOME GAP [ $ ]
0.37
INEQUALITY / GINI INDEX
564
TOTAL POPULATION
346
MALE POPULATION
218
FEMALE POPULATION
158.72
MALES / 100 FEMALES
63.01
FEMALES / 100 MALES
47.4
MEDIAN AGE
3.4
AVG FAMILY SIZE
2.5
AVG HOUSEHOLD SIZE
183
LABOR FORCE [ PEOPLE ]
39.4%
PERCENT IN LABOR FORCE
15.9%
UNEMPLOYMENT RATE
Windsor Heights Zip Codes
Windsor Heights Area Codes
Income in Windsor Heights
Income Overview in Windsor Heights
Per Capita Income in Windsor Heights is $26,905, while median incomes of families and households are $61,964 and $46,058 respectively.
| Characteristic | Number | Measure |
| Per Capita Income | 564 | $26,905 |
| Median Family Income | 119 | $61,964 |
| Mean Family Income | 119 | $75,277 |
| Median Household Income | 221 | $46,058 |
| Mean Household Income | 221 | $64,405 |
| Income Deficit | 119 | $0 |
| Wage / Income Gap (%) | 564 | 14.74% |
| Wage / Income Gap ($) | 564 | 85.26¢ per $1 |
| Gini / Inequality Index | 564 | 0.37 |
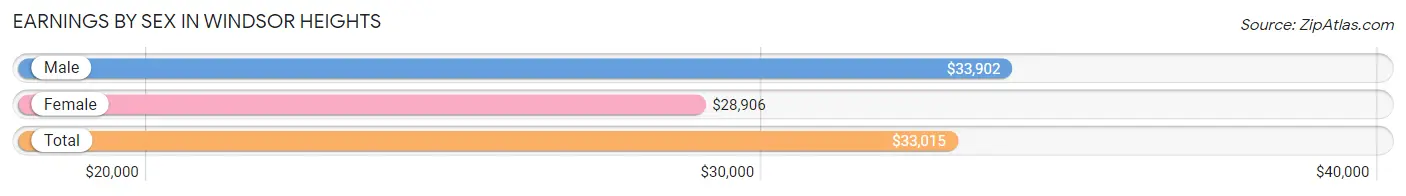
Earnings by Sex in Windsor Heights
Average Earnings in Windsor Heights are $33,015, $33,902 for men and $28,906 for women, a difference of 14.7%.
| Sex | Number | Average Earnings |
| Male | 129 (65.1%) | $33,902 |
| Female | 69 (34.8%) | $28,906 |
| Total | 198 (100.0%) | $33,015 |
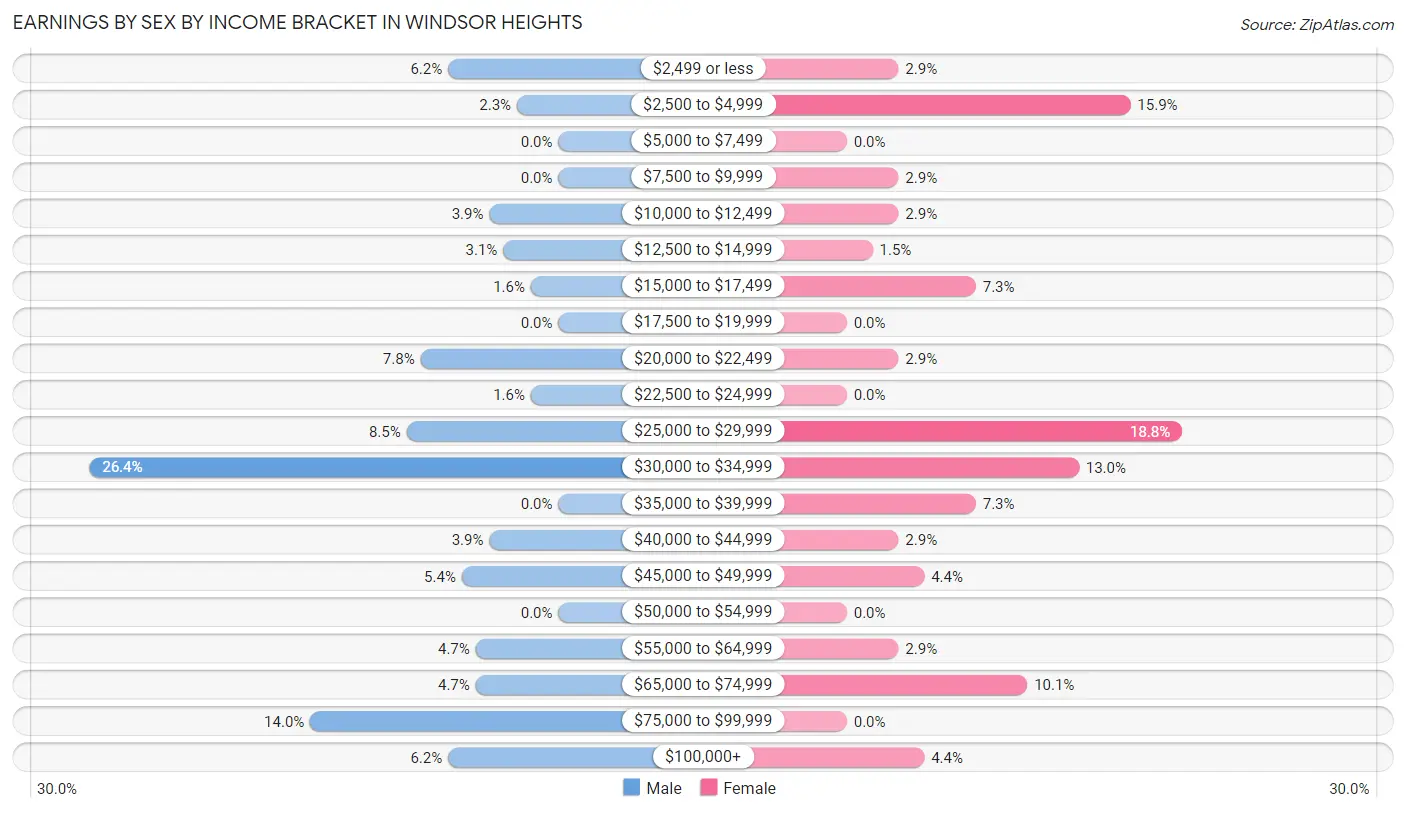
Earnings by Sex by Income Bracket in Windsor Heights
The most common earnings brackets in Windsor Heights are $30,000 to $34,999 for men (34 | 26.4%) and $25,000 to $29,999 for women (13 | 18.8%).
| Income | Male | Female |
| $2,499 or less | 8 (6.2%) | 2 (2.9%) |
| $2,500 to $4,999 | 3 (2.3%) | 11 (15.9%) |
| $5,000 to $7,499 | 0 (0.0%) | 0 (0.0%) |
| $7,500 to $9,999 | 0 (0.0%) | 2 (2.9%) |
| $10,000 to $12,499 | 5 (3.9%) | 2 (2.9%) |
| $12,500 to $14,999 | 4 (3.1%) | 1 (1.5%) |
| $15,000 to $17,499 | 2 (1.5%) | 5 (7.2%) |
| $17,500 to $19,999 | 0 (0.0%) | 0 (0.0%) |
| $20,000 to $22,499 | 10 (7.7%) | 2 (2.9%) |
| $22,500 to $24,999 | 2 (1.5%) | 0 (0.0%) |
| $25,000 to $29,999 | 11 (8.5%) | 13 (18.8%) |
| $30,000 to $34,999 | 34 (26.4%) | 9 (13.0%) |
| $35,000 to $39,999 | 0 (0.0%) | 5 (7.2%) |
| $40,000 to $44,999 | 5 (3.9%) | 2 (2.9%) |
| $45,000 to $49,999 | 7 (5.4%) | 3 (4.3%) |
| $50,000 to $54,999 | 0 (0.0%) | 0 (0.0%) |
| $55,000 to $64,999 | 6 (4.6%) | 2 (2.9%) |
| $65,000 to $74,999 | 6 (4.6%) | 7 (10.1%) |
| $75,000 to $99,999 | 18 (14.0%) | 0 (0.0%) |
| $100,000+ | 8 (6.2%) | 3 (4.3%) |
| Total | 129 (100.0%) | 69 (100.0%) |
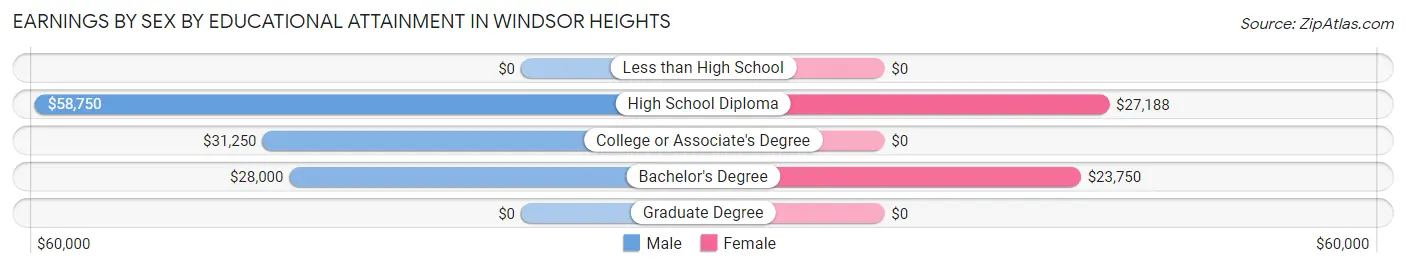
Earnings by Sex by Educational Attainment in Windsor Heights
Average earnings in Windsor Heights are $42,750 for men and $31,094 for women, a difference of 27.3%. Men with an educational attainment of high school diploma enjoy the highest average annual earnings of $58,750, while those with bachelor's degree education earn the least with $28,000. Women with an educational attainment of high school diploma earn the most with the average annual earnings of $27,188, while those with bachelor's degree education have the smallest earnings of $23,750.
| Educational Attainment | Male Income | Female Income |
| Less than High School | - | - |
| High School Diploma | $58,750 | $27,188 |
| College or Associate's Degree | $31,250 | $0 |
| Bachelor's Degree | $28,000 | $23,750 |
| Graduate Degree | - | - |
| Total | $42,750 | $31,094 |
Family Income in Windsor Heights
Family Income Brackets in Windsor Heights
According to the Windsor Heights family income data, there are 26 families falling into the $75,000 to $99,999 income range, which is the most common income bracket and makes up 21.8% of all families. Conversely, the $15,000 to $24,999 income bracket is the least frequent group with only 4 families (3.4%) belonging to this category.
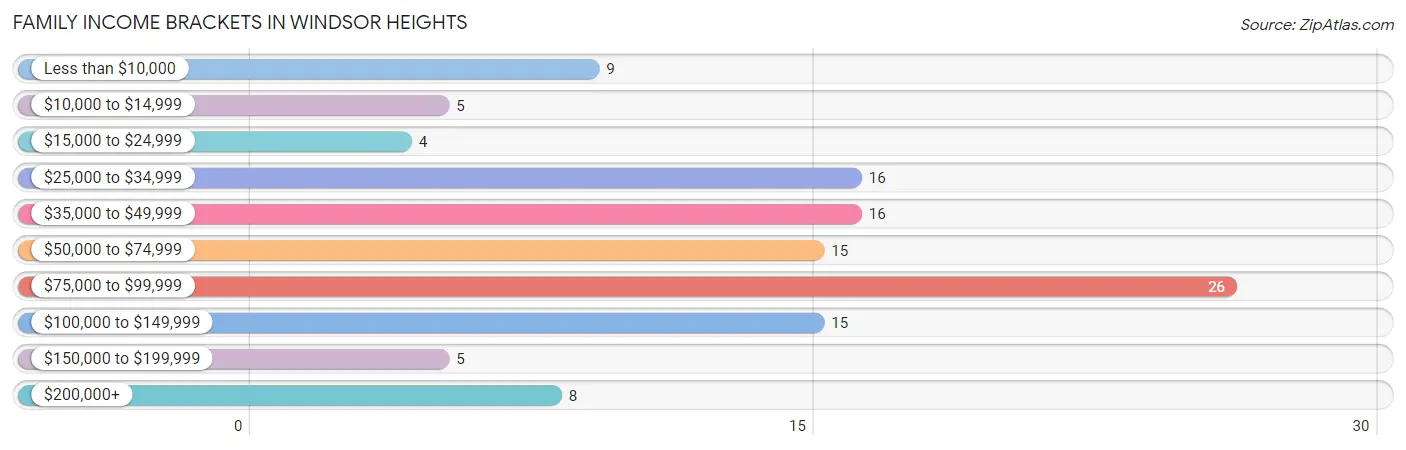
| Income Bracket | # Families | % Families |
| Less than $10,000 | 9 | 7.6% |
| $10,000 to $14,999 | 5 | 4.2% |
| $15,000 to $24,999 | 4 | 3.4% |
| $25,000 to $34,999 | 16 | 13.4% |
| $35,000 to $49,999 | 16 | 13.4% |
| $50,000 to $74,999 | 15 | 12.6% |
| $75,000 to $99,999 | 26 | 21.8% |
| $100,000 to $149,999 | 15 | 12.6% |
| $150,000 to $199,999 | 5 | 4.2% |
| $200,000+ | 8 | 6.7% |
Family Income by Famaliy Size in Windsor Heights
3-person families (36 | 30.2%) account for the highest median family income in Windsor Heights with $90,625 per family, while 3-person families (36 | 30.2%) have the highest median income of $30,208 per family member.
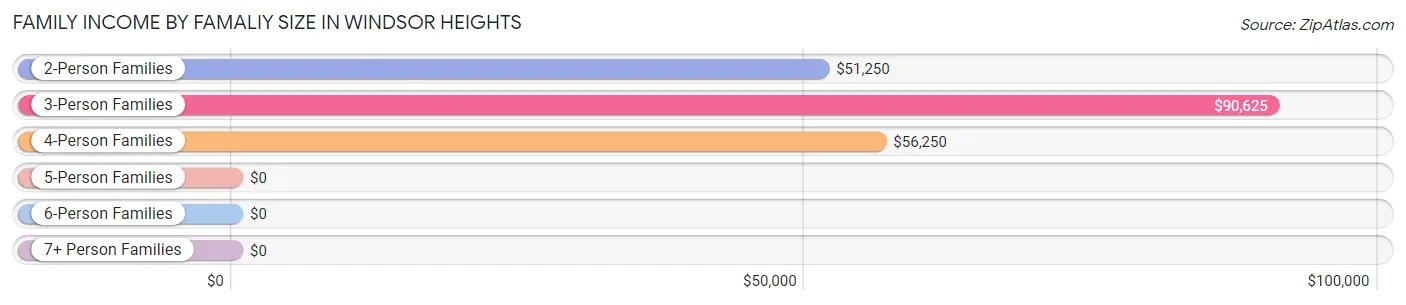
| Income Bracket | # Families | Median Income |
| 2-Person Families | 58 (48.7%) | $51,250 |
| 3-Person Families | 36 (30.2%) | $90,625 |
| 4-Person Families | 16 (13.5%) | $56,250 |
| 5-Person Families | 4 (3.4%) | $0 |
| 6-Person Families | 4 (3.4%) | $0 |
| 7+ Person Families | 1 (0.8%) | $0 |
| Total | 119 (100.0%) | $61,964 |
Family Income by Number of Earners in Windsor Heights
The median family income in Windsor Heights is $61,964, with families comprising 3+ earners (6) having the highest median family income of $138,750, while families with no earners (34) have the lowest median family income of $28,333, accounting for 5.0% and 28.6% of families, respectively.
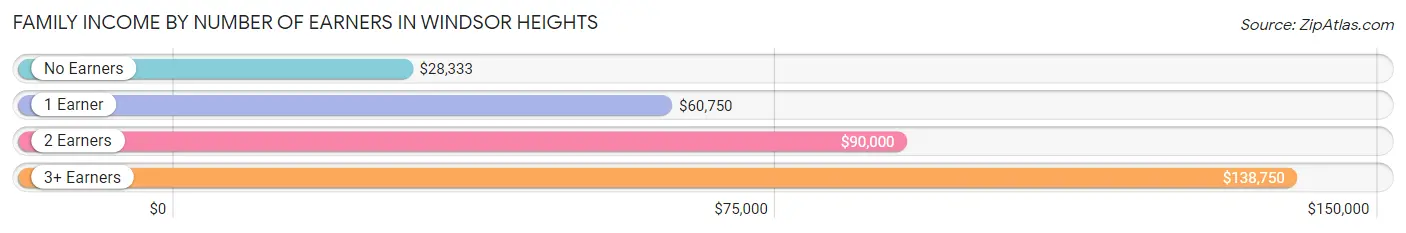
| Number of Earners | # Families | Median Income |
| No Earners | 34 (28.6%) | $28,333 |
| 1 Earner | 37 (31.1%) | $60,750 |
| 2 Earners | 42 (35.3%) | $90,000 |
| 3+ Earners | 6 (5.0%) | $138,750 |
| Total | 119 (100.0%) | $61,964 |
Household Income in Windsor Heights
Household Income Brackets in Windsor Heights
With 63 households falling in the category, the $35,000 to $49,999 income range is the most frequent in Windsor Heights, accounting for 28.5% of all households. In contrast, only 5 households (2.3%) fall into the $10,000 to $14,999 income bracket, making it the least populous group.
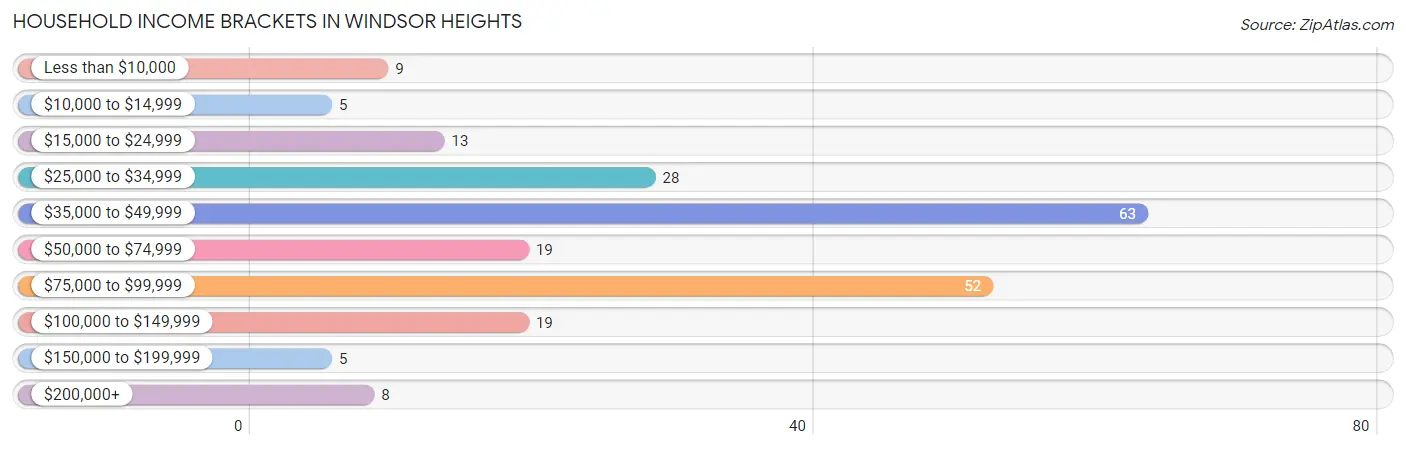
| Income Bracket | # Households | % Households |
| Less than $10,000 | 9 | 4.1% |
| $10,000 to $14,999 | 5 | 2.3% |
| $15,000 to $24,999 | 13 | 5.9% |
| $25,000 to $34,999 | 28 | 12.7% |
| $35,000 to $49,999 | 63 | 28.5% |
| $50,000 to $74,999 | 19 | 8.6% |
| $75,000 to $99,999 | 52 | 23.5% |
| $100,000 to $149,999 | 19 | 8.6% |
| $150,000 to $199,999 | 5 | 2.3% |
| $200,000+ | 8 | 3.6% |
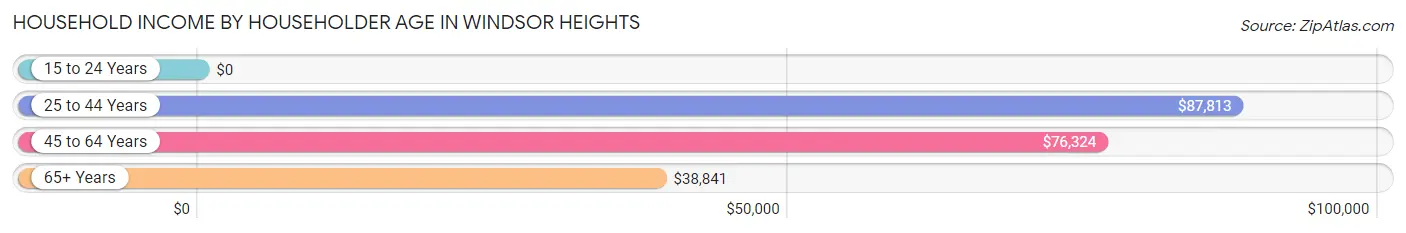
Household Income by Householder Age in Windsor Heights
The median household income in Windsor Heights is $46,058, with the highest median household income of $87,813 found in the 25 to 44 years age bracket for the primary householder. A total of 41 households (18.5%) fall into this category. Meanwhile, the 15 to 24 years age bracket for the primary householder has the lowest median household income of $0, with 2 households (0.9%) in this group.
| Income Bracket | # Households | Median Income |
| 15 to 24 Years | 2 (0.9%) | $0 |
| 25 to 44 Years | 41 (18.5%) | $87,813 |
| 45 to 64 Years | 70 (31.7%) | $76,324 |
| 65+ Years | 108 (48.9%) | $38,841 |
| Total | 221 (100.0%) | $46,058 |
Poverty in Windsor Heights
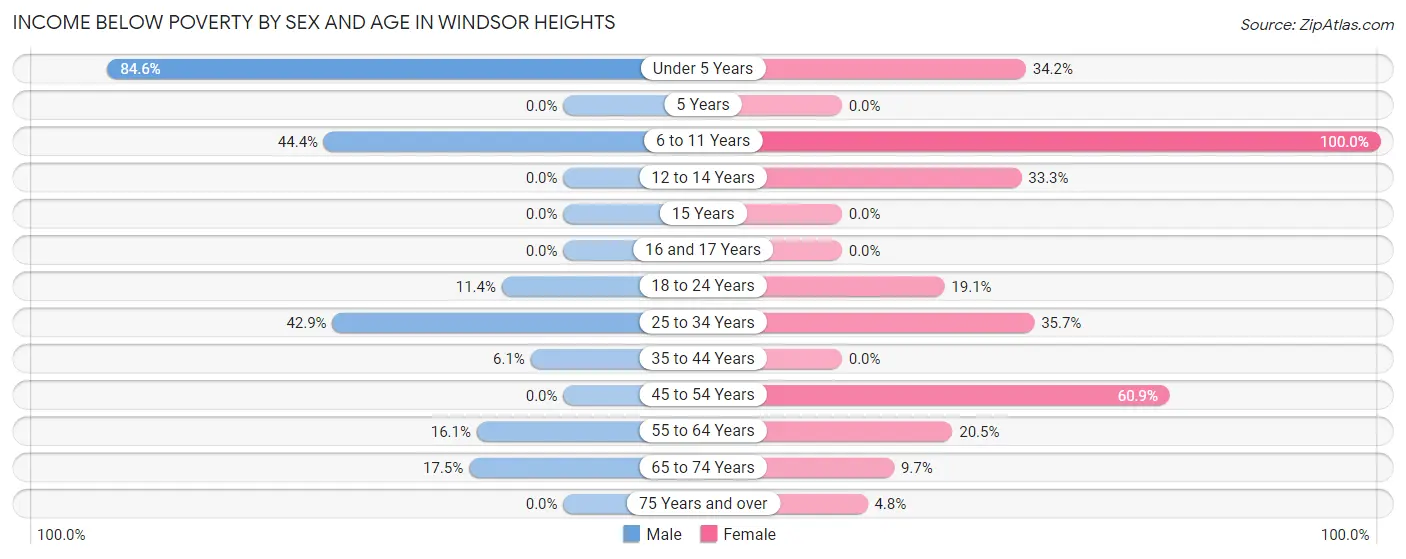
Income Below Poverty by Sex and Age in Windsor Heights
With 19.1% poverty level for males and 27.5% for females among the residents of Windsor Heights, under 5 year old males and 6 to 11 year old females are the most vulnerable to poverty, with 22 males (84.6%) and 9 females (100.0%) in their respective age groups living below the poverty level.
| Age Bracket | Male | Female |
| Under 5 Years | 22 (84.6%) | 14 (34.2%) |
| 5 Years | 0 (0.0%) | 0 (0.0%) |
| 6 to 11 Years | 4 (44.4%) | 9 (100.0%) |
| 12 to 14 Years | 0 (0.0%) | 2 (33.3%) |
| 15 Years | 0 (0.0%) | 0 (0.0%) |
| 16 and 17 Years | 0 (0.0%) | 0 (0.0%) |
| 18 to 24 Years | 4 (11.4%) | 4 (19.1%) |
| 25 to 34 Years | 18 (42.9%) | 5 (35.7%) |
| 35 to 44 Years | 2 (6.1%) | 0 (0.0%) |
| 45 to 54 Years | 0 (0.0%) | 14 (60.9%) |
| 55 to 64 Years | 9 (16.1%) | 8 (20.5%) |
| 65 to 74 Years | 7 (17.5%) | 3 (9.7%) |
| 75 Years and over | 0 (0.0%) | 1 (4.8%) |
| Total | 66 (19.1%) | 60 (27.5%) |
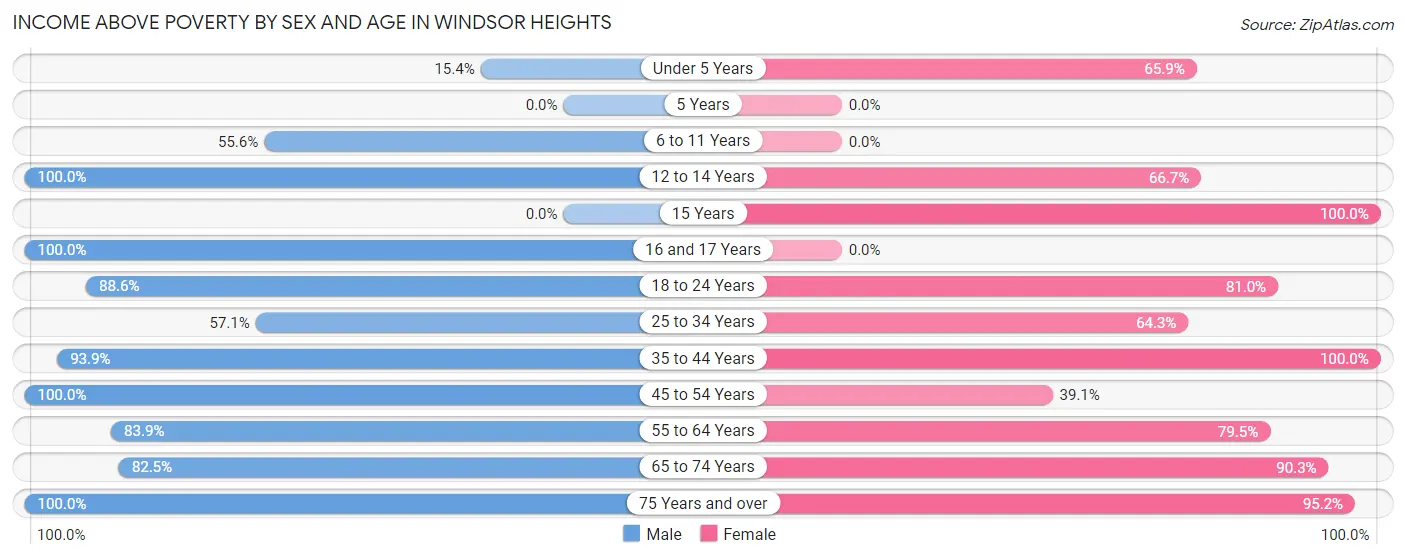
Income Above Poverty by Sex and Age in Windsor Heights
According to the poverty statistics in Windsor Heights, males aged 12 to 14 years and females aged 15 years are the age groups that are most secure financially, with 100.0% of males and 100.0% of females in these age groups living above the poverty line.
| Age Bracket | Male | Female |
| Under 5 Years | 4 (15.4%) | 27 (65.8%) |
| 5 Years | 0 (0.0%) | 0 (0.0%) |
| 6 to 11 Years | 5 (55.6%) | 0 (0.0%) |
| 12 to 14 Years | 7 (100.0%) | 4 (66.7%) |
| 15 Years | 0 (0.0%) | 1 (100.0%) |
| 16 and 17 Years | 16 (100.0%) | 0 (0.0%) |
| 18 to 24 Years | 31 (88.6%) | 17 (80.9%) |
| 25 to 34 Years | 24 (57.1%) | 9 (64.3%) |
| 35 to 44 Years | 31 (93.9%) | 12 (100.0%) |
| 45 to 54 Years | 20 (100.0%) | 9 (39.1%) |
| 55 to 64 Years | 47 (83.9%) | 31 (79.5%) |
| 65 to 74 Years | 33 (82.5%) | 28 (90.3%) |
| 75 Years and over | 62 (100.0%) | 20 (95.2%) |
| Total | 280 (80.9%) | 158 (72.5%) |
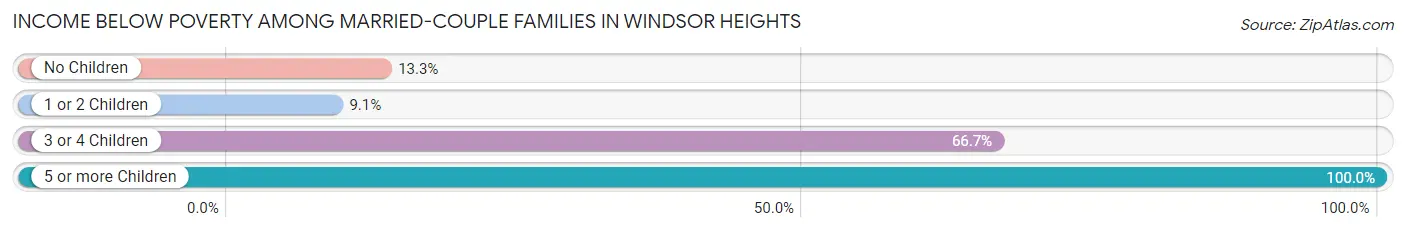
Income Below Poverty Among Married-Couple Families in Windsor Heights
The poverty statistics for married-couple families in Windsor Heights show that 16.9% or 15 of the total 89 families live below the poverty line. Families with 5 or more children have the highest poverty rate of 100.0%, comprising of 1 families. On the other hand, families with 1 or 2 children have the lowest poverty rate of 9.1%, which includes 2 families.
| Children | Above Poverty | Below Poverty |
| No Children | 52 (86.7%) | 8 (13.3%) |
| 1 or 2 Children | 20 (90.9%) | 2 (9.1%) |
| 3 or 4 Children | 2 (33.3%) | 4 (66.7%) |
| 5 or more Children | 0 (0.0%) | 1 (100.0%) |
| Total | 74 (83.2%) | 15 (16.9%) |
Income Below Poverty Among Single-Parent Households in Windsor Heights
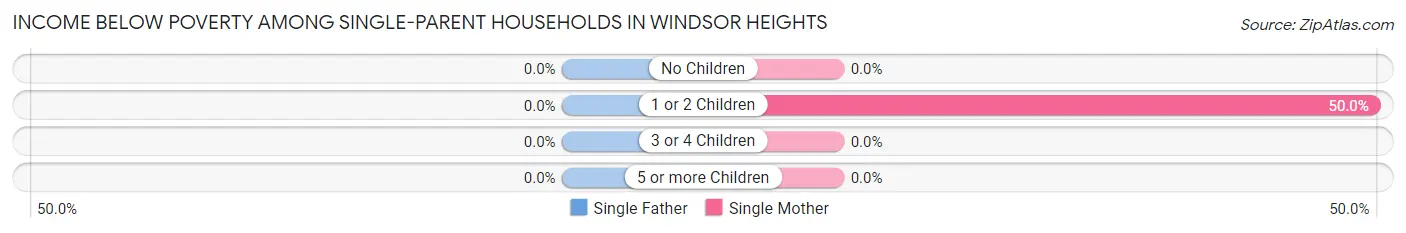
| Children | Single Father | Single Mother |
| No Children | 0 (0.0%) | 0 (0.0%) |
| 1 or 2 Children | 0 (0.0%) | 2 (50.0%) |
| 3 or 4 Children | 0 (0.0%) | 0 (0.0%) |
| 5 or more Children | 0 (0.0%) | 0 (0.0%) |
| Total | 0 (0.0%) | 2 (10.5%) |
Income Below Poverty Among Married-Couple vs Single-Parent Households in Windsor Heights
The poverty data for Windsor Heights shows that 15 of the married-couple family households (16.9%) and 2 of the single-parent households (6.7%) are living below the poverty level. Within the married-couple family households, those with 5 or more children have the highest poverty rate, with 1 households (100.0%) falling below the poverty line. Among the single-parent households, those with 1 or 2 children have the highest poverty rate, with 2 household (18.2%) living below poverty.
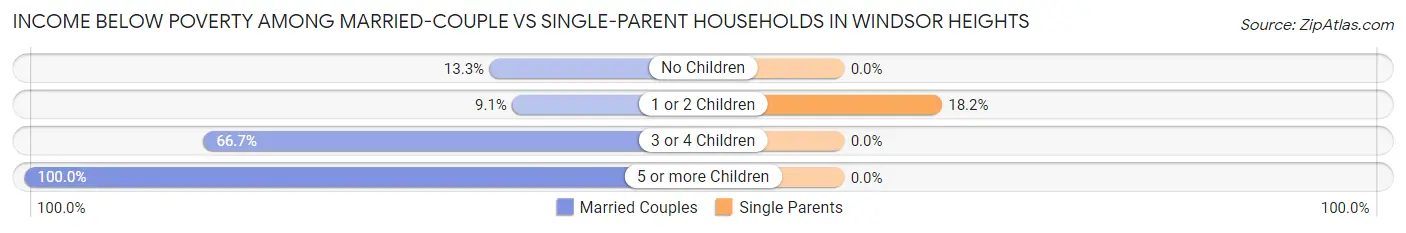
| Children | Married-Couple Families | Single-Parent Households |
| No Children | 8 (13.3%) | 0 (0.0%) |
| 1 or 2 Children | 2 (9.1%) | 2 (18.2%) |
| 3 or 4 Children | 4 (66.7%) | 0 (0.0%) |
| 5 or more Children | 1 (100.0%) | 0 (0.0%) |
| Total | 15 (16.9%) | 2 (6.7%) |
Race in Windsor Heights
The most populous races in Windsor Heights are White / Caucasian (560 | 99.3%), Two or more Races (3 | 0.5%), and Hispanic or Latino (2 | 0.4%).
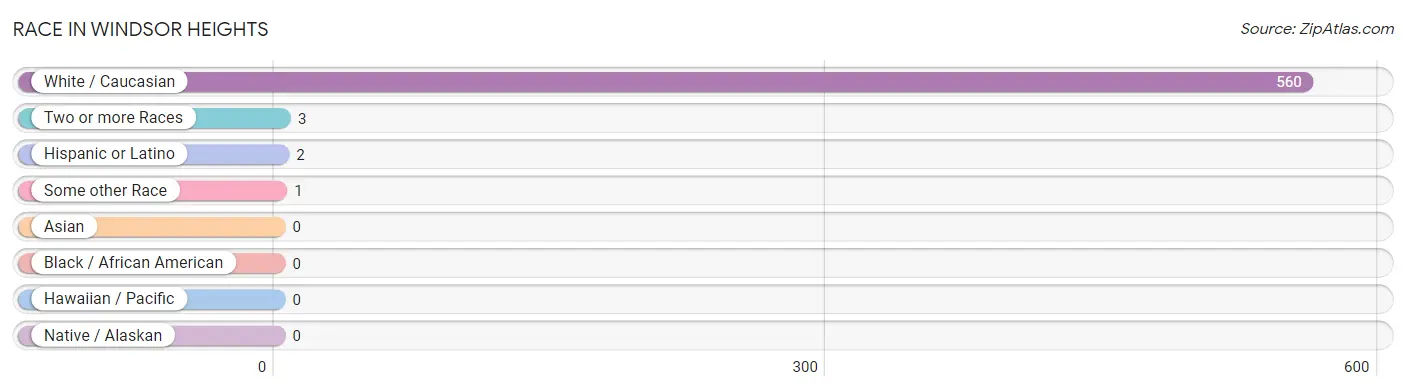
| Race | # Population | % Population |
| Asian | 0 | 0.0% |
| Black / African American | 0 | 0.0% |
| Hawaiian / Pacific | 0 | 0.0% |
| Hispanic or Latino | 2 | 0.4% |
| Native / Alaskan | 0 | 0.0% |
| White / Caucasian | 560 | 99.3% |
| Two or more Races | 3 | 0.5% |
| Some other Race | 1 | 0.2% |
| Total | 564 | 100.0% |
Ancestry in Windsor Heights
The most populous ancestries reported in Windsor Heights are German (117 | 20.7%), Irish (88 | 15.6%), Slovak (43 | 7.6%), Polish (42 | 7.4%), and English (32 | 5.7%), together accounting for 57.1% of all Windsor Heights residents.
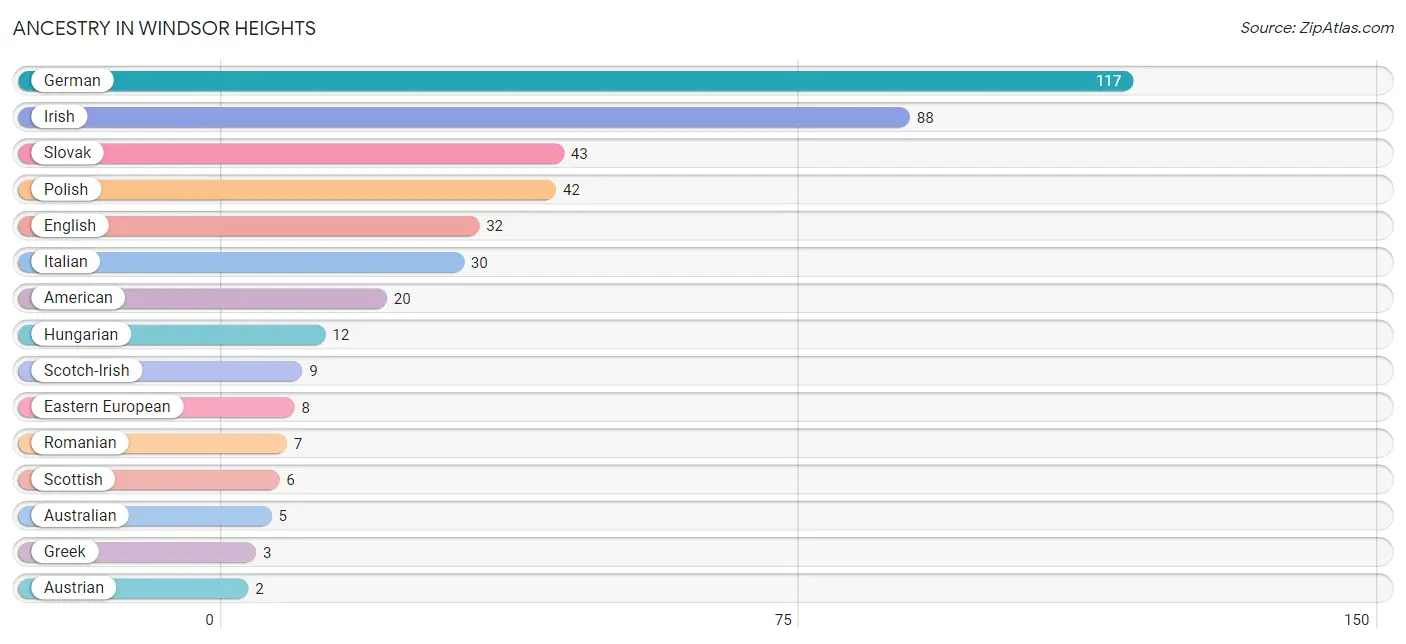
| Ancestry | # Population | % Population |
| American | 20 | 3.5% |
| Australian | 5 | 0.9% |
| Austrian | 2 | 0.4% |
| Belgian | 1 | 0.2% |
| Cherokee | 2 | 0.4% |
| Dominican | 1 | 0.2% |
| Dutch | 1 | 0.2% |
| Eastern European | 8 | 1.4% |
| English | 32 | 5.7% |
| German | 117 | 20.7% |
| Greek | 3 | 0.5% |
| Hungarian | 12 | 2.1% |
| Irish | 88 | 15.6% |
| Italian | 30 | 5.3% |
| Mexican | 1 | 0.2% |
| Polish | 42 | 7.4% |
| Romanian | 7 | 1.2% |
| Scotch-Irish | 9 | 1.6% |
| Scottish | 6 | 1.1% |
| Slovak | 43 | 7.6% |
| Slovene | 2 | 0.4% |
| Welsh | 1 | 0.2% | View All 22 Rows |
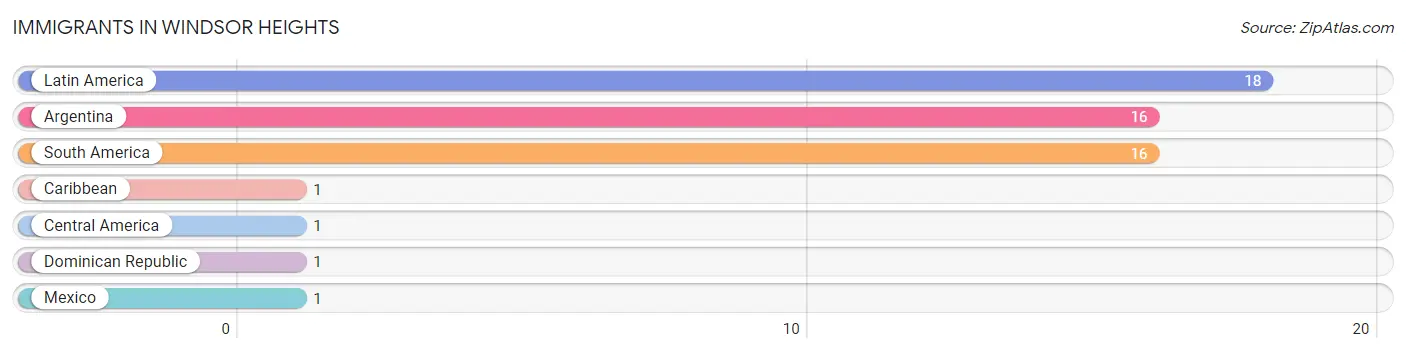
Immigrants in Windsor Heights
The most numerous immigrant groups reported in Windsor Heights came from Latin America (18 | 3.2%), Argentina (16 | 2.8%), South America (16 | 2.8%), Caribbean (1 | 0.2%), and Central America (1 | 0.2%), together accounting for 9.2% of all Windsor Heights residents.
| Immigration Origin | # Population | % Population |
| Argentina | 16 | 2.8% |
| Caribbean | 1 | 0.2% |
| Central America | 1 | 0.2% |
| Dominican Republic | 1 | 0.2% |
| Latin America | 18 | 3.2% |
| Mexico | 1 | 0.2% |
| South America | 16 | 2.8% | View All 7 Rows |
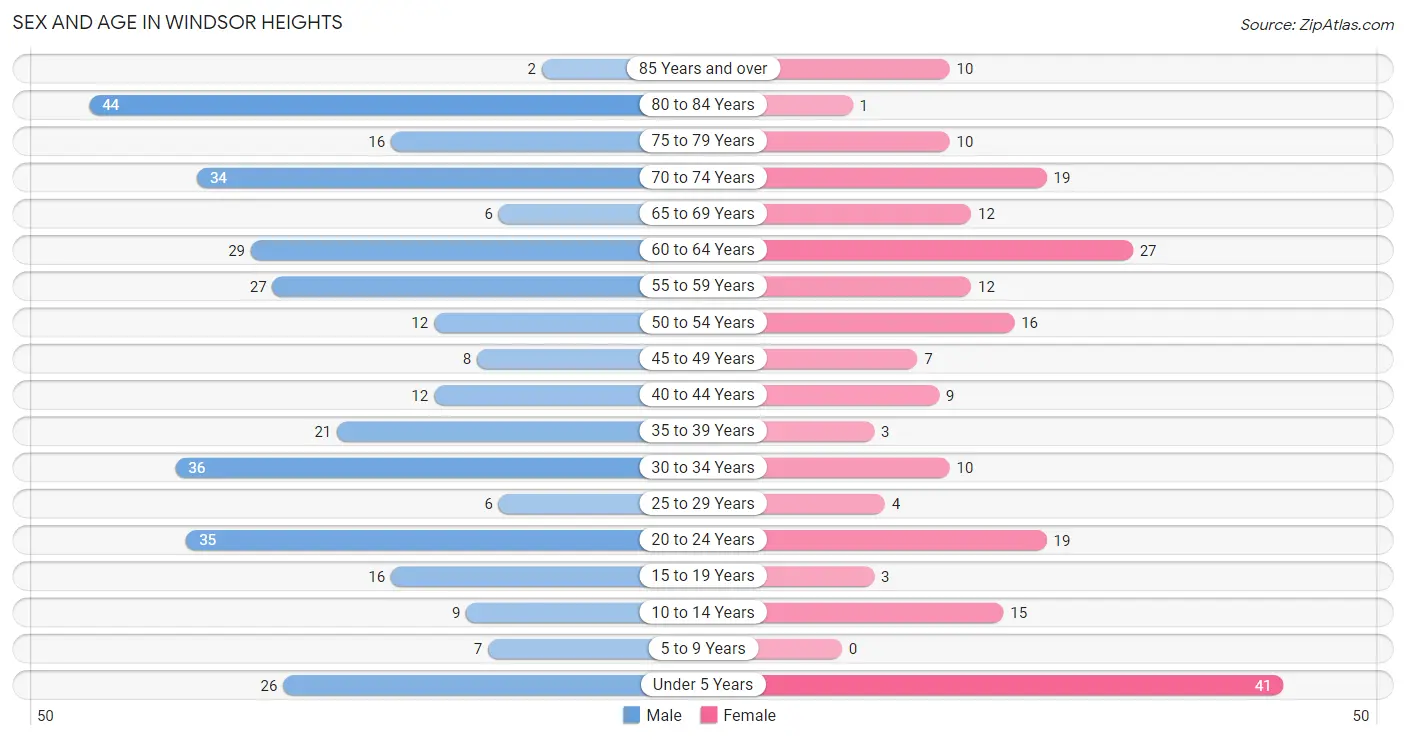
Sex and Age in Windsor Heights
Sex and Age in Windsor Heights
The most populous age groups in Windsor Heights are 80 to 84 Years (44 | 12.7%) for men and Under 5 Years (41 | 18.8%) for women.
| Age Bracket | Male | Female |
| Under 5 Years | 26 (7.5%) | 41 (18.8%) |
| 5 to 9 Years | 7 (2.0%) | 0 (0.0%) |
| 10 to 14 Years | 9 (2.6%) | 15 (6.9%) |
| 15 to 19 Years | 16 (4.6%) | 3 (1.4%) |
| 20 to 24 Years | 35 (10.1%) | 19 (8.7%) |
| 25 to 29 Years | 6 (1.7%) | 4 (1.8%) |
| 30 to 34 Years | 36 (10.4%) | 10 (4.6%) |
| 35 to 39 Years | 21 (6.1%) | 3 (1.4%) |
| 40 to 44 Years | 12 (3.5%) | 9 (4.1%) |
| 45 to 49 Years | 8 (2.3%) | 7 (3.2%) |
| 50 to 54 Years | 12 (3.5%) | 16 (7.3%) |
| 55 to 59 Years | 27 (7.8%) | 12 (5.5%) |
| 60 to 64 Years | 29 (8.4%) | 27 (12.4%) |
| 65 to 69 Years | 6 (1.7%) | 12 (5.5%) |
| 70 to 74 Years | 34 (9.8%) | 19 (8.7%) |
| 75 to 79 Years | 16 (4.6%) | 10 (4.6%) |
| 80 to 84 Years | 44 (12.7%) | 1 (0.5%) |
| 85 Years and over | 2 (0.6%) | 10 (4.6%) |
| Total | 346 (100.0%) | 218 (100.0%) |
Families and Households in Windsor Heights
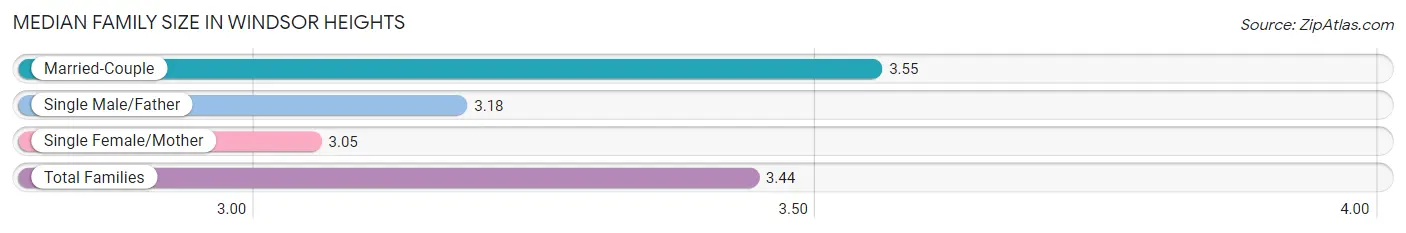
Median Family Size in Windsor Heights
The median family size in Windsor Heights is 3.44 persons per family, with married-couple families (89 | 74.8%) accounting for the largest median family size of 3.55 persons per family. On the other hand, single female/mother families (19 | 16.0%) represent the smallest median family size with 3.05 persons per family.
| Family Type | # Families | Family Size |
| Married-Couple | 89 (74.8%) | 3.55 |
| Single Male/Father | 11 (9.2%) | 3.18 |
| Single Female/Mother | 19 (16.0%) | 3.05 |
| Total Families | 119 (100.0%) | 3.44 |
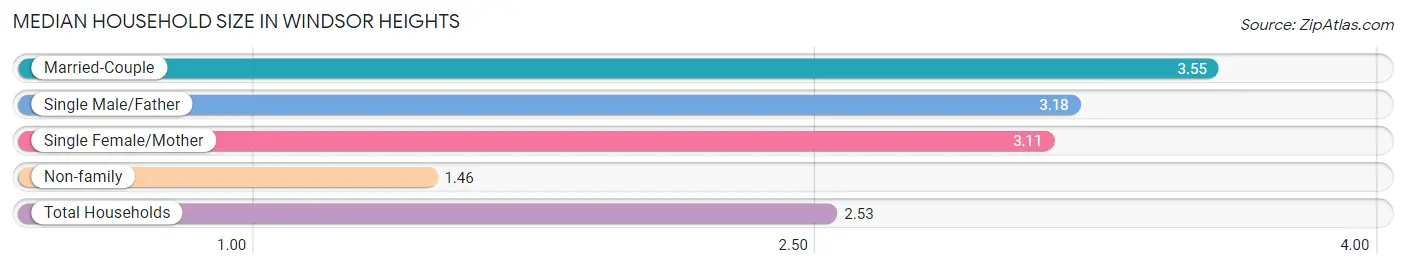
Median Household Size in Windsor Heights
The median household size in Windsor Heights is 2.53 persons per household, with married-couple households (89 | 40.3%) accounting for the largest median household size of 3.55 persons per household. non-family households (102 | 46.2%) represent the smallest median household size with 1.46 persons per household.
| Household Type | # Households | Household Size |
| Married-Couple | 89 (40.3%) | 3.55 |
| Single Male/Father | 11 (5.0%) | 3.18 |
| Single Female/Mother | 19 (8.6%) | 3.11 |
| Non-family | 102 (46.2%) | 1.46 |
| Total Households | 221 (100.0%) | 2.53 |
Household Size by Marriage Status in Windsor Heights
Out of a total of 221 households in Windsor Heights, 119 (53.8%) are family households, while 102 (46.2%) are nonfamily households. The most numerous type of family households are 2-person households, comprising 56, and the most common type of nonfamily households are 1-person households, comprising 81.
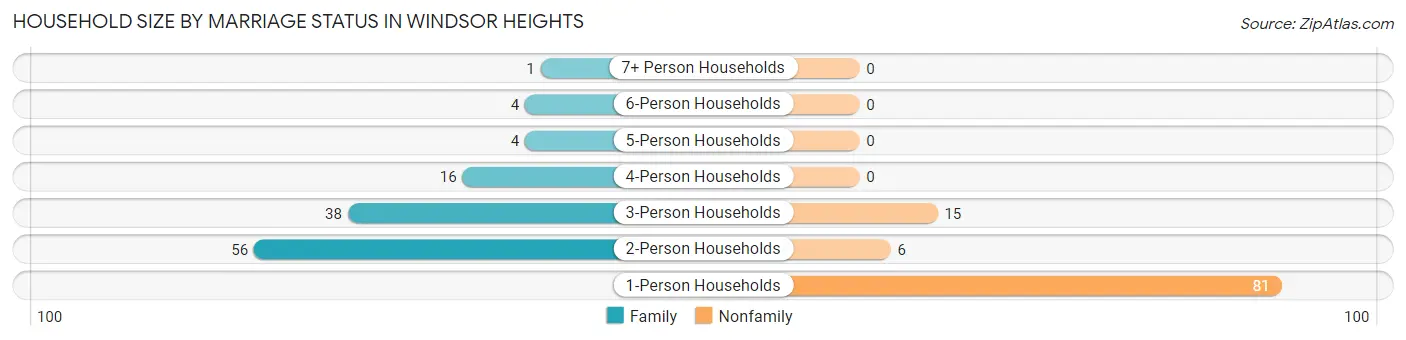
| Household Size | Family Households | Nonfamily Households |
| 1-Person Households | - | 81 (36.6%) |
| 2-Person Households | 56 (25.3%) | 6 (2.7%) |
| 3-Person Households | 38 (17.2%) | 15 (6.8%) |
| 4-Person Households | 16 (7.2%) | 0 (0.0%) |
| 5-Person Households | 4 (1.8%) | 0 (0.0%) |
| 6-Person Households | 4 (1.8%) | 0 (0.0%) |
| 7+ Person Households | 1 (0.4%) | 0 (0.0%) |
| Total | 119 (53.8%) | 102 (46.2%) |
Female Fertility in Windsor Heights
Fertility by Age in Windsor Heights
| Age Bracket | Women with Births | Births / 1,000 Women |
| 15 to 19 years | 0 (0.0%) | 0.0 |
| 20 to 34 years | 0 (0.0%) | 0.0 |
| 35 to 50 years | 0 (0.0%) | 0.0 |
| Total | 0 (0.0%) | 0.0 |
Fertility by Age by Marriage Status in Windsor Heights
| Age Bracket | Married | Unmarried |
| 15 to 19 years | 0 (0.0%) | 0 (0.0%) |
| 20 to 34 years | 0 (0.0%) | 0 (0.0%) |
| 35 to 50 years | 0 (0.0%) | 0 (0.0%) |
| Total | 0 (0.0%) | 0 (0.0%) |
Fertility by Education in Windsor Heights
| Educational Attainment | Women with Births | Births / 1,000 Women |
| Less than High School | 0 (0.0%) | 0.0 |
| High School Diploma | 0 (0.0%) | 0.0 |
| College or Associate's Degree | 0 (0.0%) | 0.0 |
| Bachelor's Degree | 0 (0.0%) | 0.0 |
| Graduate Degree | 0 (0.0%) | 0.0 |
| Total | 0 (0.0%) | 0.0 |
Fertility by Education by Marriage Status in Windsor Heights
| Educational Attainment | Married | Unmarried |
| Less than High School | 0 (0.0%) | 0 (0.0%) |
| High School Diploma | 0 (0.0%) | 0 (0.0%) |
| College or Associate's Degree | 0 (0.0%) | 0 (0.0%) |
| Bachelor's Degree | 0 (0.0%) | 0 (0.0%) |
| Graduate Degree | 0 (0.0%) | 0 (0.0%) |
| Total | 0 (0.0%) | 0 (0.0%) |
Employment Characteristics in Windsor Heights
Employment by Class of Employer in Windsor Heights
Among the 147 employed individuals in Windsor Heights, private company employees (108 | 73.5%), self-employed (not incorporated) (9 | 6.1%), and local government employees (8 | 5.4%) make up the most common classes of employment.
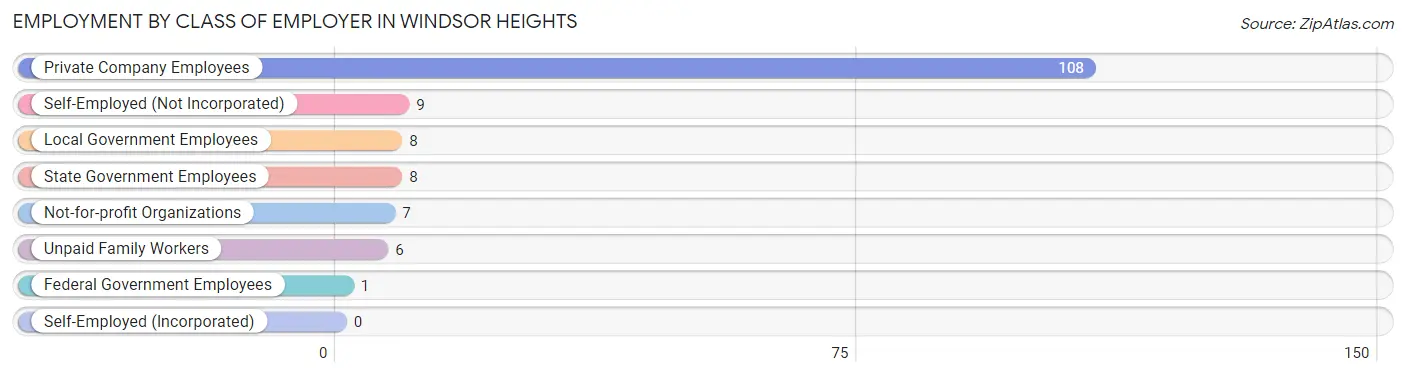
| Employer Class | # Employees | % Employees |
| Private Company Employees | 108 | 73.5% |
| Self-Employed (Incorporated) | 0 | 0.0% |
| Self-Employed (Not Incorporated) | 9 | 6.1% |
| Not-for-profit Organizations | 7 | 4.8% |
| Local Government Employees | 8 | 5.4% |
| State Government Employees | 8 | 5.4% |
| Federal Government Employees | 1 | 0.7% |
| Unpaid Family Workers | 6 | 4.1% |
| Total | 147 | 100.0% |
Employment Status by Age in Windsor Heights
According to the labor force statistics for Windsor Heights, out of the total population over 16 years of age (465), 39.4% or 183 individuals are in the labor force, with 15.9% or 29 of them unemployed. The age group with the highest labor force participation rate is 25 to 29 years, with 100.0% or 10 individuals in the labor force. Within the labor force, the 20 to 24 years age range has the highest percentage of unemployed individuals, with 73.0% or 27 of them being unemployed.
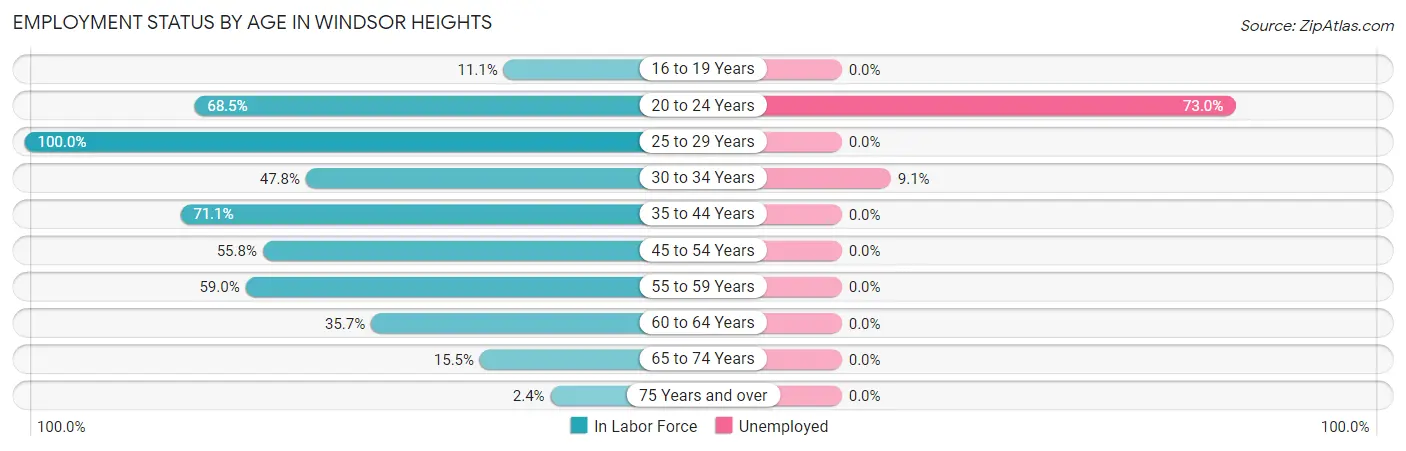
| Age Bracket | In Labor Force | Unemployed |
| 16 to 19 Years | 2 (11.1%) | 0 (0.0%) |
| 20 to 24 Years | 37 (68.5%) | 27 (73.0%) |
| 25 to 29 Years | 10 (100.0%) | 0 (0.0%) |
| 30 to 34 Years | 22 (47.8%) | 2 (9.1%) |
| 35 to 44 Years | 32 (71.1%) | 0 (0.0%) |
| 45 to 54 Years | 24 (55.8%) | 0 (0.0%) |
| 55 to 59 Years | 23 (59.0%) | 0 (0.0%) |
| 60 to 64 Years | 20 (35.7%) | 0 (0.0%) |
| 65 to 74 Years | 11 (15.5%) | 0 (0.0%) |
| 75 Years and over | 2 (2.4%) | 0 (0.0%) |
| Total | 183 (39.4%) | 29 (15.9%) |
Employment Status by Educational Attainment in Windsor Heights
According to labor force statistics for Windsor Heights, 54.8% of individuals (131) out of the total population between 25 and 64 years of age (239) are in the labor force, with 1.5% or 2 of them being unemployed. The group with the highest labor force participation rate are those with the educational attainment of college / associate degree, with 75.7% or 53 individuals in the labor force. Within the labor force, individuals with college / associate degree education have the highest percentage of unemployment, with 3.8% or 2 of them being unemployed.
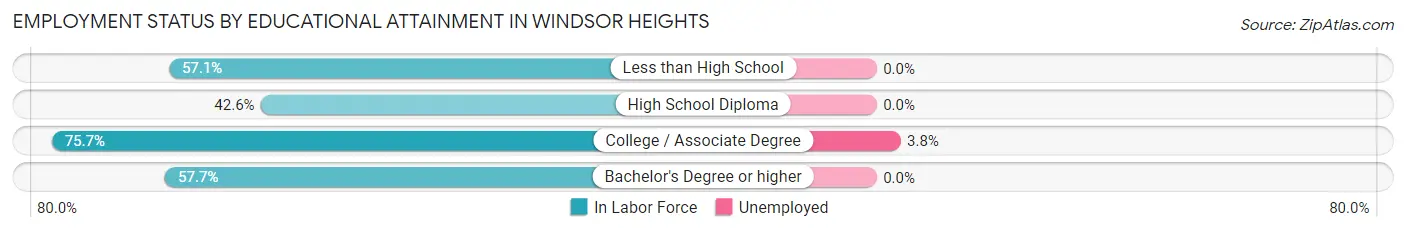
| Educational Attainment | In Labor Force | Unemployed |
| Less than High School | 8 (57.1%) | 0 (0.0%) |
| High School Diploma | 55 (42.6%) | 0 (0.0%) |
| College / Associate Degree | 53 (75.7%) | 3 (3.8%) |
| Bachelor's Degree or higher | 15 (57.7%) | 0 (0.0%) |
| Total | 131 (54.8%) | 4 (1.5%) |
Employment Occupations by Sex in Windsor Heights
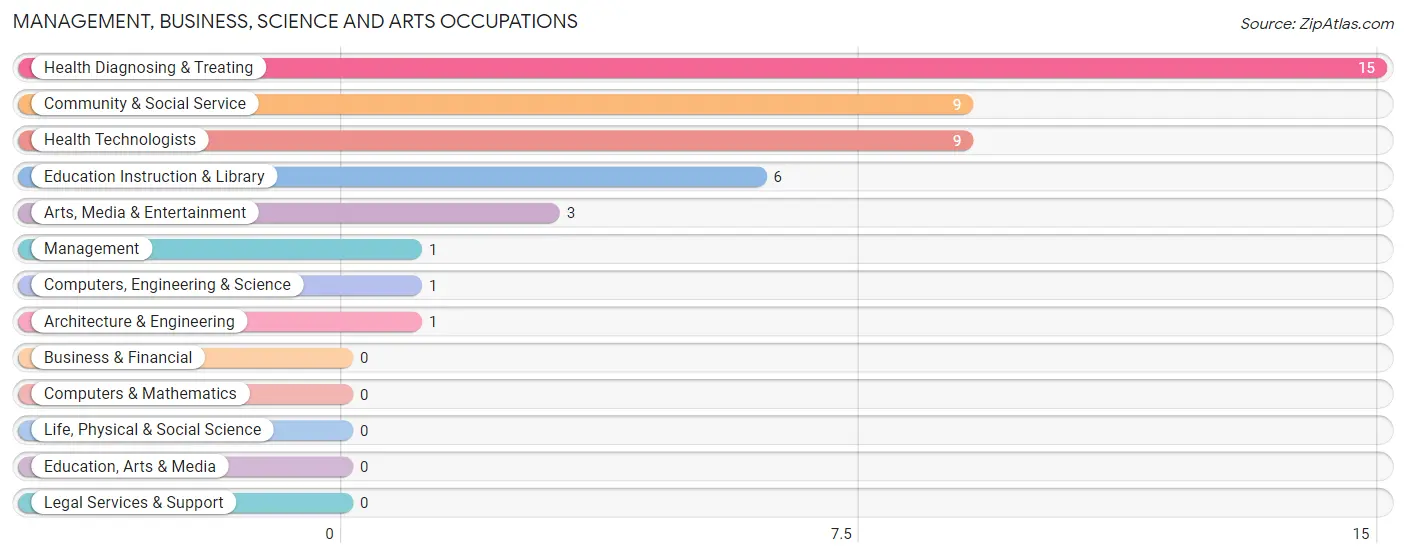
Management, Business, Science and Arts Occupations
The most common Management, Business, Science and Arts occupations in Windsor Heights are Health Diagnosing & Treating (15 | 9.8%), Community & Social Service (9 | 5.9%), Health Technologists (9 | 5.9%), Education Instruction & Library (6 | 3.9%), and Arts, Media & Entertainment (3 | 2.0%).
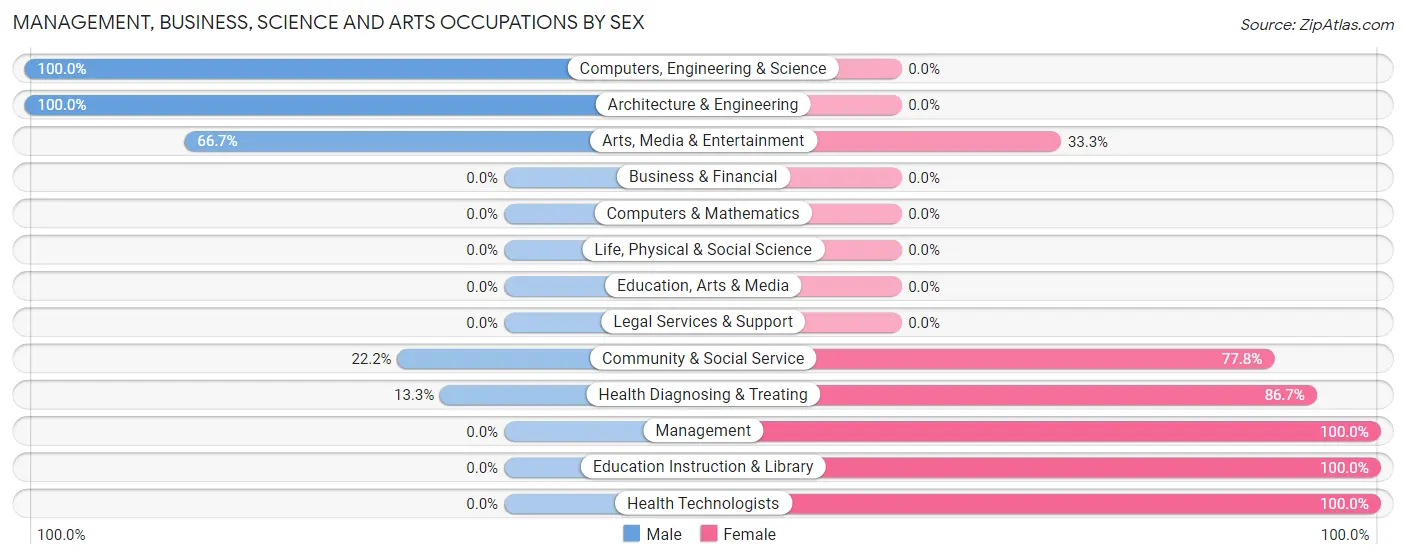
Management, Business, Science and Arts Occupations by Sex
Within the Management, Business, Science and Arts occupations in Windsor Heights, the most male-oriented occupations are Computers, Engineering & Science (100.0%), Architecture & Engineering (100.0%), and Arts, Media & Entertainment (66.7%), while the most female-oriented occupations are Management (100.0%), Education Instruction & Library (100.0%), and Health Technologists (100.0%).
| Occupation | Male | Female |
| Management | 0 (0.0%) | 1 (100.0%) |
| Business & Financial | 0 (0.0%) | 0 (0.0%) |
| Computers, Engineering & Science | 1 (100.0%) | 0 (0.0%) |
| Computers & Mathematics | 0 (0.0%) | 0 (0.0%) |
| Architecture & Engineering | 1 (100.0%) | 0 (0.0%) |
| Life, Physical & Social Science | 0 (0.0%) | 0 (0.0%) |
| Community & Social Service | 2 (22.2%) | 7 (77.8%) |
| Education, Arts & Media | 0 (0.0%) | 0 (0.0%) |
| Legal Services & Support | 0 (0.0%) | 0 (0.0%) |
| Education Instruction & Library | 0 (0.0%) | 6 (100.0%) |
| Arts, Media & Entertainment | 2 (66.7%) | 1 (33.3%) |
| Health Diagnosing & Treating | 2 (13.3%) | 13 (86.7%) |
| Health Technologists | 0 (0.0%) | 9 (100.0%) |
| Total (Category) | 5 (19.2%) | 21 (80.8%) |
| Total (Overall) | 88 (57.5%) | 65 (42.5%) |
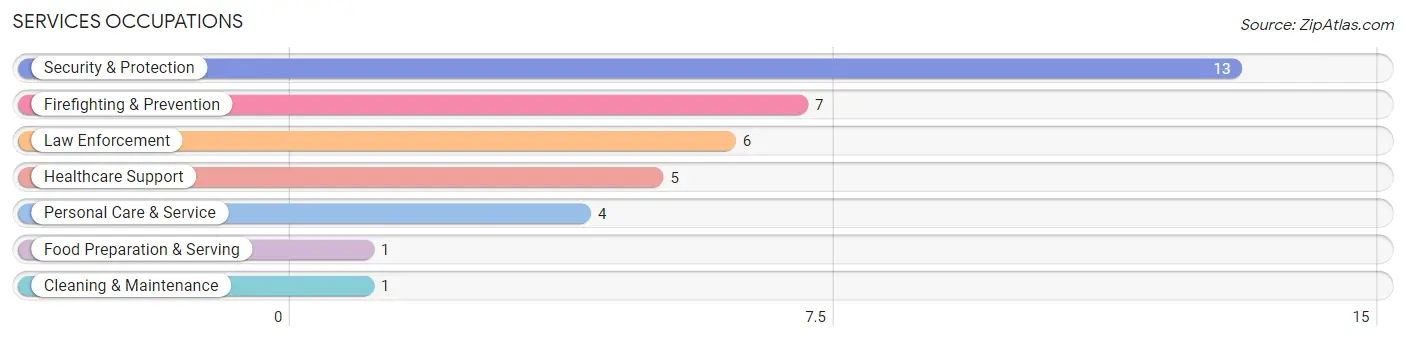
Services Occupations
The most common Services occupations in Windsor Heights are Security & Protection (13 | 8.5%), Firefighting & Prevention (7 | 4.6%), Law Enforcement (6 | 3.9%), Healthcare Support (5 | 3.3%), and Personal Care & Service (4 | 2.6%).
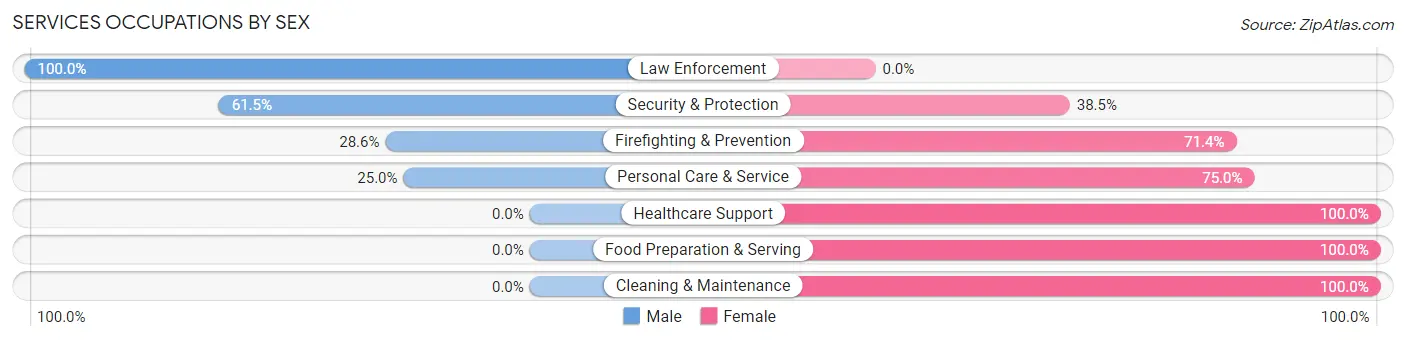
Services Occupations by Sex
Within the Services occupations in Windsor Heights, the most male-oriented occupations are Law Enforcement (100.0%), Security & Protection (61.5%), and Firefighting & Prevention (28.6%), while the most female-oriented occupations are Healthcare Support (100.0%), Food Preparation & Serving (100.0%), and Cleaning & Maintenance (100.0%).
| Occupation | Male | Female |
| Healthcare Support | 0 (0.0%) | 5 (100.0%) |
| Security & Protection | 8 (61.5%) | 5 (38.5%) |
| Firefighting & Prevention | 2 (28.6%) | 5 (71.4%) |
| Law Enforcement | 6 (100.0%) | 0 (0.0%) |
| Food Preparation & Serving | 0 (0.0%) | 1 (100.0%) |
| Cleaning & Maintenance | 0 (0.0%) | 1 (100.0%) |
| Personal Care & Service | 1 (25.0%) | 3 (75.0%) |
| Total (Category) | 9 (37.5%) | 15 (62.5%) |
| Total (Overall) | 88 (57.5%) | 65 (42.5%) |
Sales and Office Occupations
The most common Sales and Office occupations in Windsor Heights are Office & Administration (17 | 11.1%), and Sales & Related (13 | 8.5%).
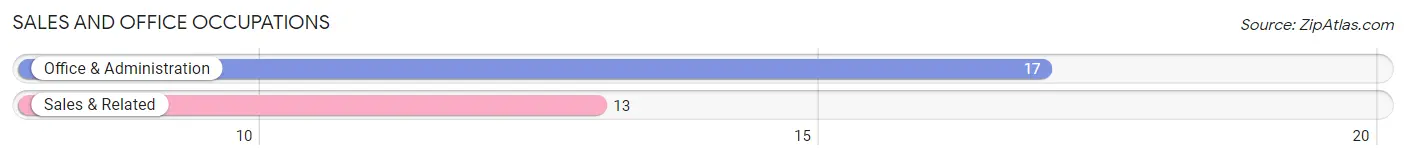
Sales and Office Occupations by Sex
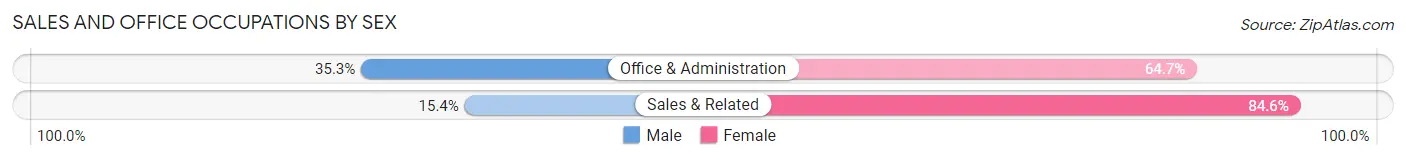
| Occupation | Male | Female |
| Sales & Related | 2 (15.4%) | 11 (84.6%) |
| Office & Administration | 6 (35.3%) | 11 (64.7%) |
| Total (Category) | 8 (26.7%) | 22 (73.3%) |
| Total (Overall) | 88 (57.5%) | 65 (42.5%) |
Natural Resources, Construction and Maintenance Occupations
The most common Natural Resources, Construction and Maintenance occupations in Windsor Heights are Construction & Extraction (16 | 10.5%), and Installation, Maintenance & Repair (5 | 3.3%).
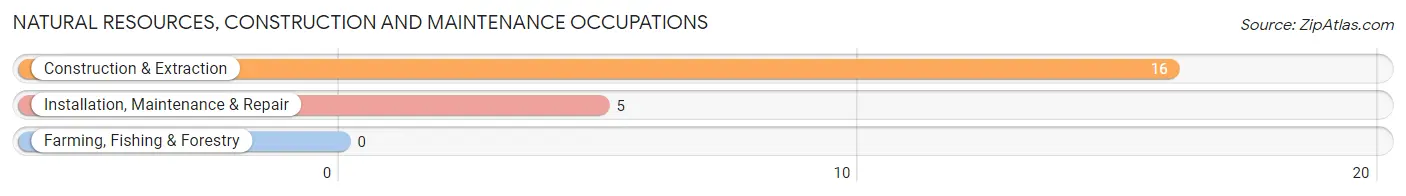
Natural Resources, Construction and Maintenance Occupations by Sex
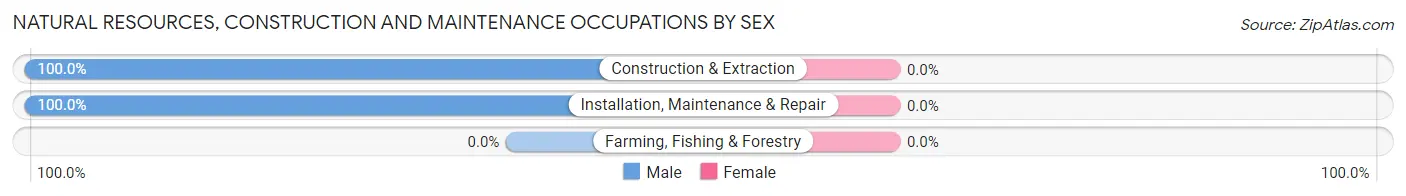
| Occupation | Male | Female |
| Farming, Fishing & Forestry | 0 (0.0%) | 0 (0.0%) |
| Construction & Extraction | 16 (100.0%) | 0 (0.0%) |
| Installation, Maintenance & Repair | 5 (100.0%) | 0 (0.0%) |
| Total (Category) | 21 (100.0%) | 0 (0.0%) |
| Total (Overall) | 88 (57.5%) | 65 (42.5%) |
Production, Transportation and Moving Occupations
The most common Production, Transportation and Moving occupations in Windsor Heights are Transportation (29 | 19.0%), Material Moving (15 | 9.8%), and Production (8 | 5.2%).
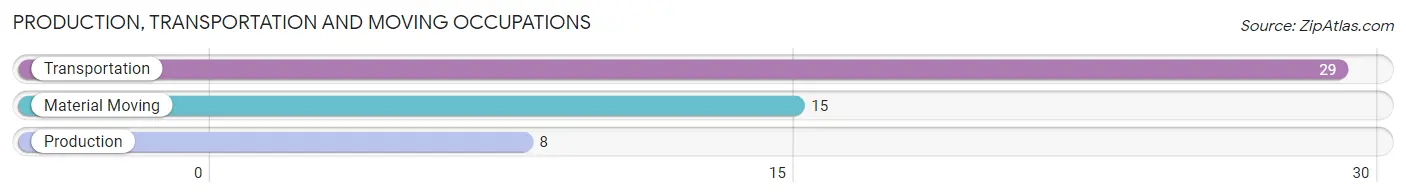
Production, Transportation and Moving Occupations by Sex
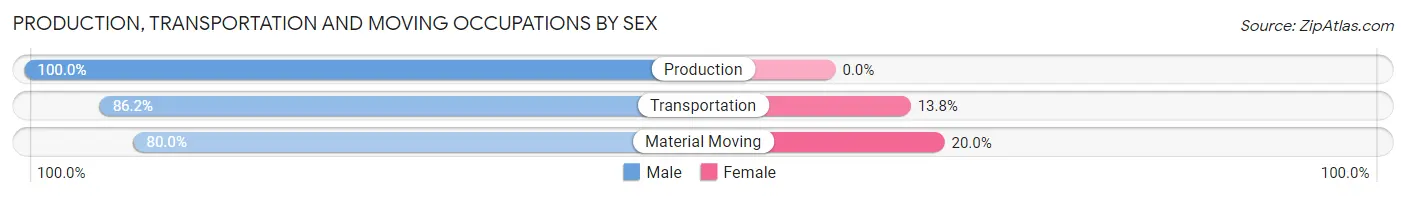
| Occupation | Male | Female |
| Production | 8 (100.0%) | 0 (0.0%) |
| Transportation | 25 (86.2%) | 4 (13.8%) |
| Material Moving | 12 (80.0%) | 3 (20.0%) |
| Total (Category) | 45 (86.5%) | 7 (13.5%) |
| Total (Overall) | 88 (57.5%) | 65 (42.5%) |
Employment Industries by Sex in Windsor Heights
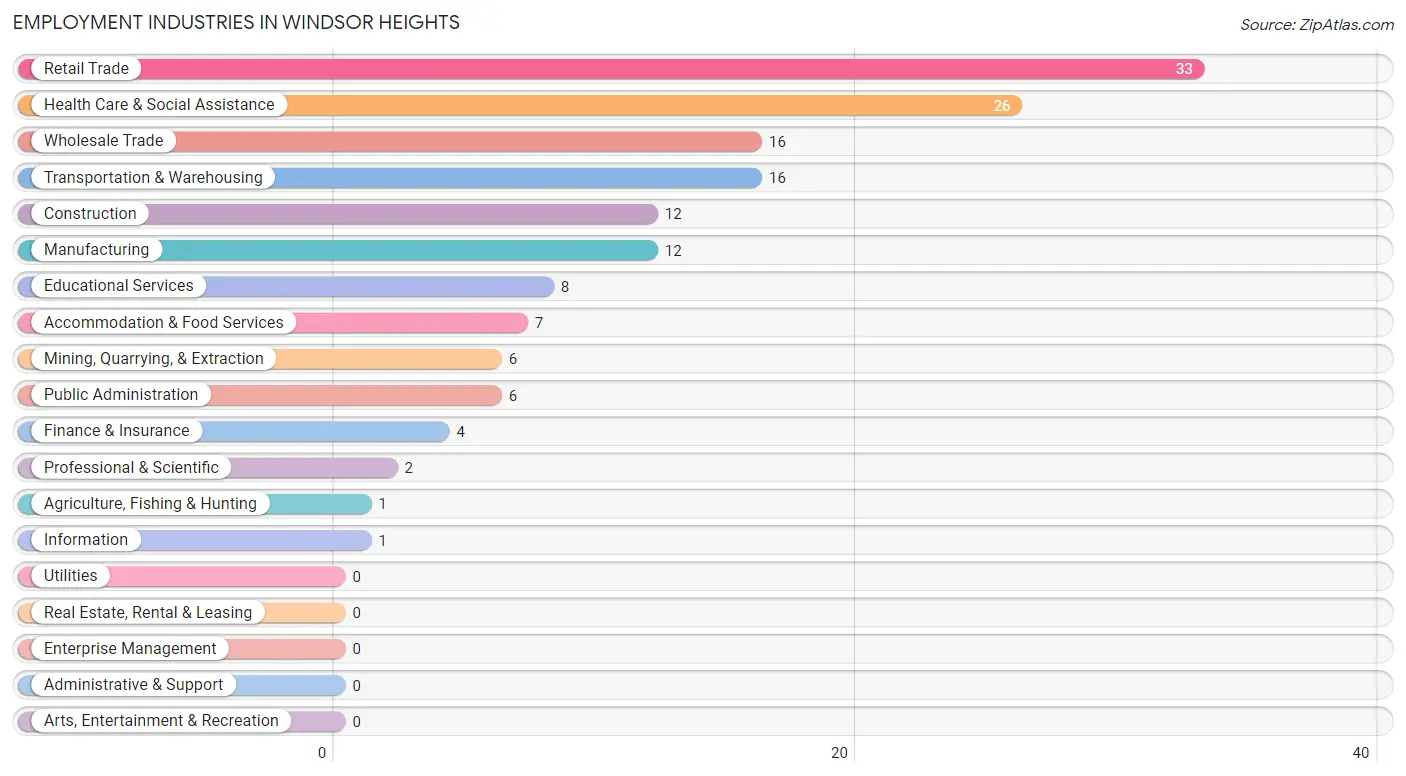
Employment Industries in Windsor Heights
The major employment industries in Windsor Heights include Retail Trade (33 | 21.6%), Health Care & Social Assistance (26 | 17.0%), Wholesale Trade (16 | 10.5%), Transportation & Warehousing (16 | 10.5%), and Construction (12 | 7.8%).
Employment Industries by Sex in Windsor Heights
The Windsor Heights industries that see more men than women are Mining, Quarrying, & Extraction (100.0%), Construction (100.0%), and Wholesale Trade (100.0%), whereas the industries that tend to have a higher number of women are Agriculture, Fishing & Hunting (100.0%), Information (100.0%), and Finance & Insurance (100.0%).
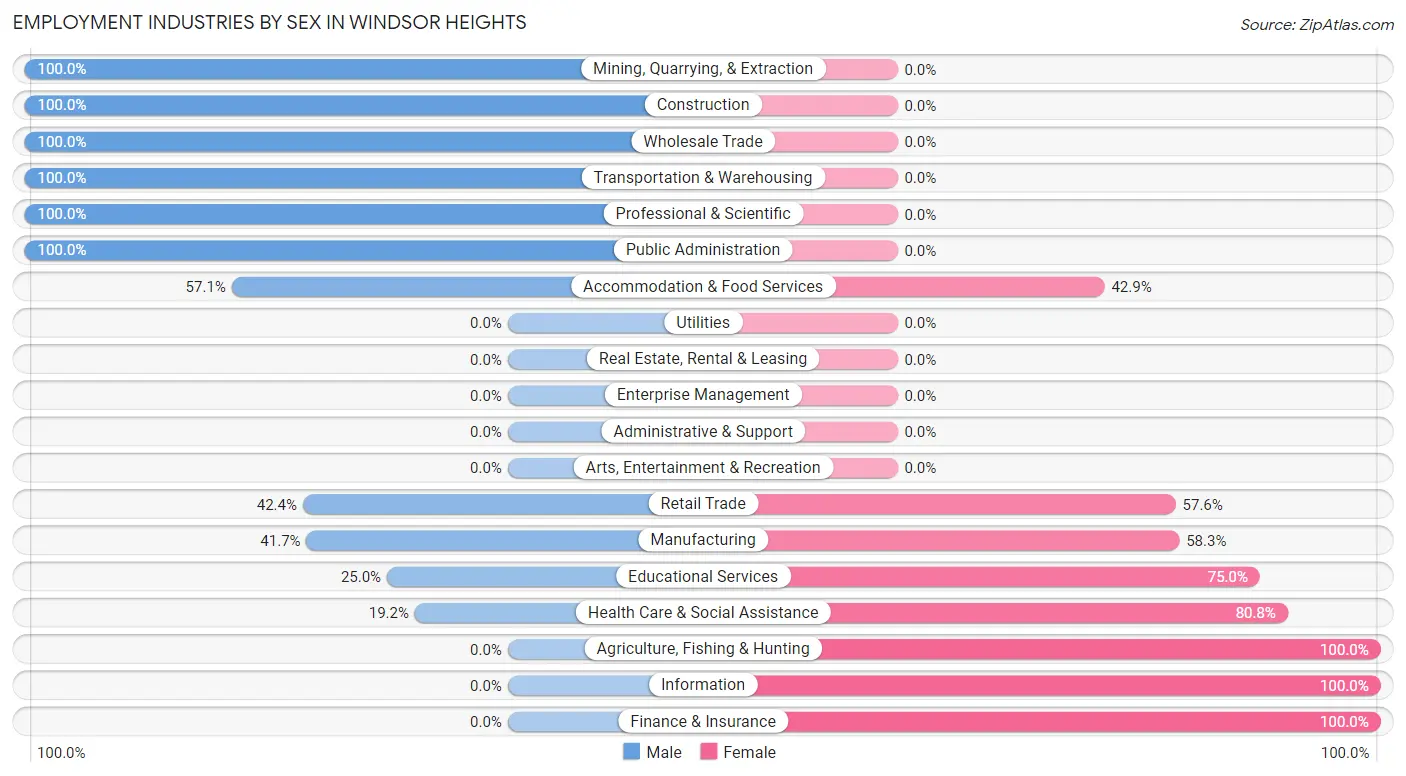
| Industry | Male | Female |
| Agriculture, Fishing & Hunting | 0 (0.0%) | 1 (100.0%) |
| Mining, Quarrying, & Extraction | 6 (100.0%) | 0 (0.0%) |
| Construction | 12 (100.0%) | 0 (0.0%) |
| Manufacturing | 5 (41.7%) | 7 (58.3%) |
| Wholesale Trade | 16 (100.0%) | 0 (0.0%) |
| Retail Trade | 14 (42.4%) | 19 (57.6%) |
| Transportation & Warehousing | 16 (100.0%) | 0 (0.0%) |
| Utilities | 0 (0.0%) | 0 (0.0%) |
| Information | 0 (0.0%) | 1 (100.0%) |
| Finance & Insurance | 0 (0.0%) | 4 (100.0%) |
| Real Estate, Rental & Leasing | 0 (0.0%) | 0 (0.0%) |
| Professional & Scientific | 2 (100.0%) | 0 (0.0%) |
| Enterprise Management | 0 (0.0%) | 0 (0.0%) |
| Administrative & Support | 0 (0.0%) | 0 (0.0%) |
| Educational Services | 2 (25.0%) | 6 (75.0%) |
| Health Care & Social Assistance | 5 (19.2%) | 21 (80.8%) |
| Arts, Entertainment & Recreation | 0 (0.0%) | 0 (0.0%) |
| Accommodation & Food Services | 4 (57.1%) | 3 (42.9%) |
| Public Administration | 6 (100.0%) | 0 (0.0%) |
| Total | 88 (57.5%) | 65 (42.5%) |
Education in Windsor Heights
School Enrollment in Windsor Heights
The most common levels of schooling among the 85 students in Windsor Heights are college / undergraduate (26 | 30.6%), high school (23 | 27.1%), and middle school (20 | 23.5%).
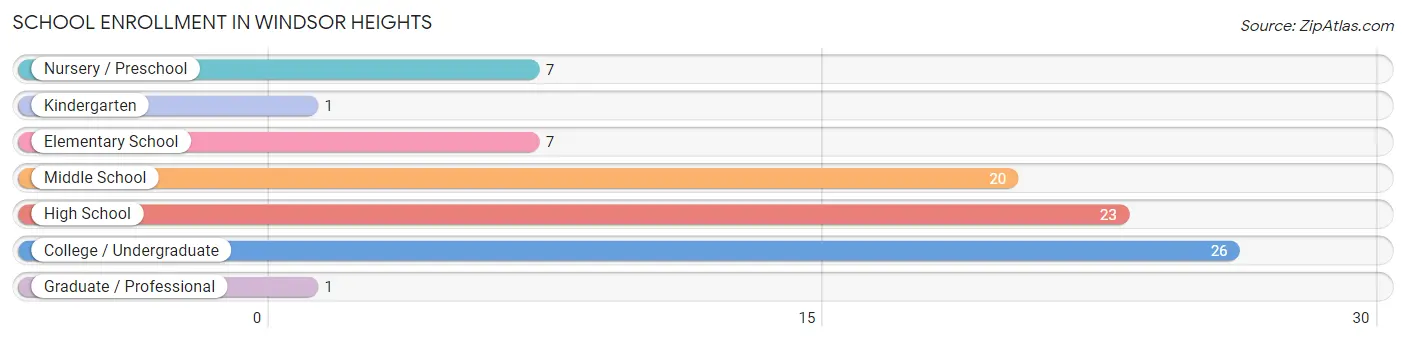
| School Level | # Students | % Students |
| Nursery / Preschool | 7 | 8.2% |
| Kindergarten | 1 | 1.2% |
| Elementary School | 7 | 8.2% |
| Middle School | 20 | 23.5% |
| High School | 23 | 27.1% |
| College / Undergraduate | 26 | 30.6% |
| Graduate / Professional | 1 | 1.2% |
| Total | 85 | 100.0% |
School Enrollment by Age by Funding Source in Windsor Heights
Out of a total of 85 students who are enrolled in schools in Windsor Heights, 11 (12.9%) attend a private institution, while the remaining 74 (87.1%) are enrolled in public schools. The age group of 3 to 4 year olds has the highest likelihood of being enrolled in private schools, with 5 (62.5% in the age bracket) enrolled. Conversely, the age group of 10 to 14 year olds has the lowest likelihood of being enrolled in a private school, with 24 (100.0% in the age bracket) attending a public institution.
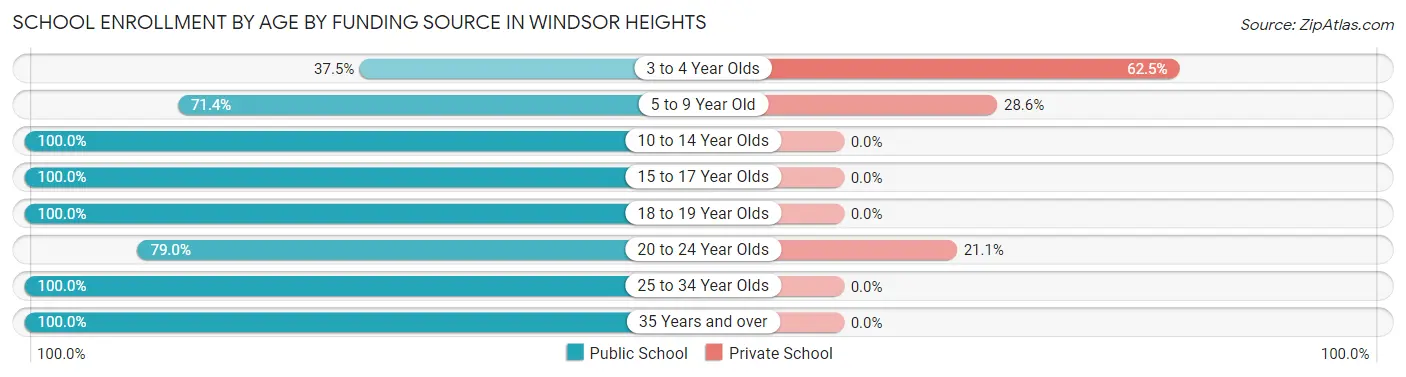
| Age Bracket | Public School | Private School |
| 3 to 4 Year Olds | 3 (37.5%) | 5 (62.5%) |
| 5 to 9 Year Old | 5 (71.4%) | 2 (28.6%) |
| 10 to 14 Year Olds | 24 (100.0%) | 0 (0.0%) |
| 15 to 17 Year Olds | 17 (100.0%) | 0 (0.0%) |
| 18 to 19 Year Olds | 2 (100.0%) | 0 (0.0%) |
| 20 to 24 Year Olds | 15 (78.9%) | 4 (21.0%) |
| 25 to 34 Year Olds | 7 (100.0%) | 0 (0.0%) |
| 35 Years and over | 1 (100.0%) | 0 (0.0%) |
| Total | 74 (87.1%) | 11 (12.9%) |
Educational Attainment by Field of Study in Windsor Heights
Education (14 | 38.9%), engineering (6 | 16.7%), psychology (4 | 11.1%), business (4 | 11.1%), and science & technology (3 | 8.3%) are the most common fields of study among 36 individuals in Windsor Heights who have obtained a bachelor's degree or higher.
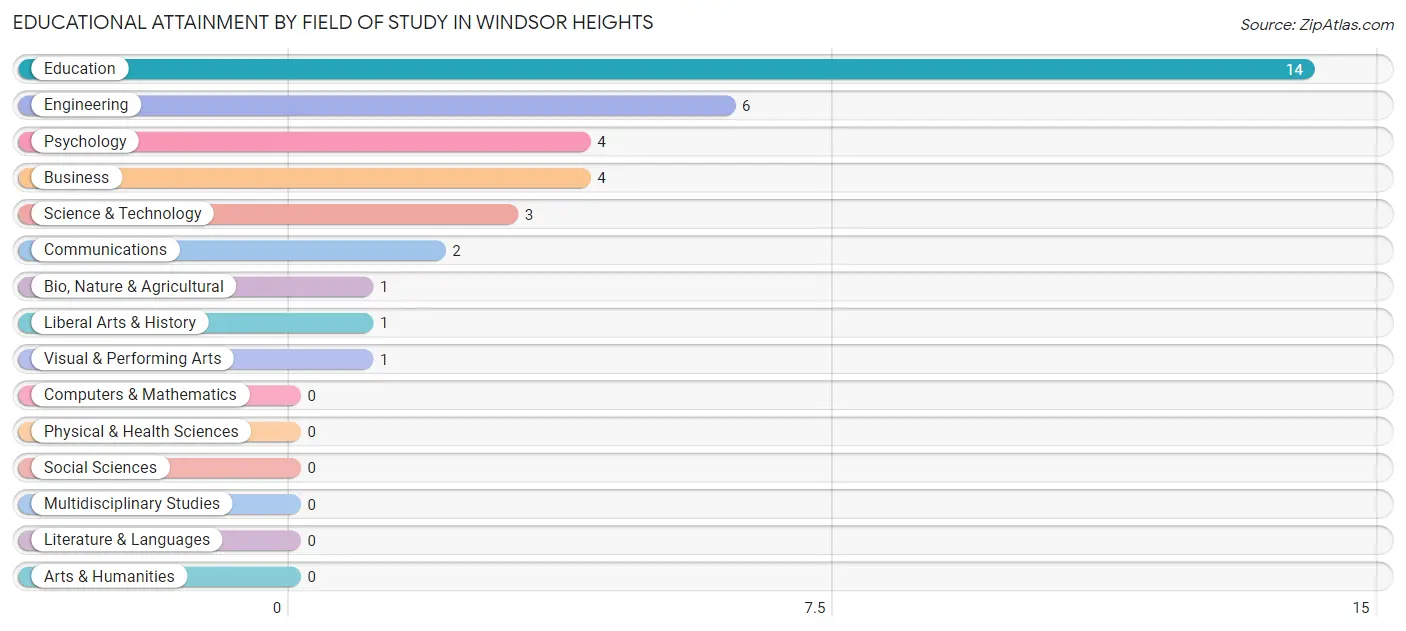
| Field of Study | # Graduates | % Graduates |
| Computers & Mathematics | 0 | 0.0% |
| Bio, Nature & Agricultural | 1 | 2.8% |
| Physical & Health Sciences | 0 | 0.0% |
| Psychology | 4 | 11.1% |
| Social Sciences | 0 | 0.0% |
| Engineering | 6 | 16.7% |
| Multidisciplinary Studies | 0 | 0.0% |
| Science & Technology | 3 | 8.3% |
| Business | 4 | 11.1% |
| Education | 14 | 38.9% |
| Literature & Languages | 0 | 0.0% |
| Liberal Arts & History | 1 | 2.8% |
| Visual & Performing Arts | 1 | 2.8% |
| Communications | 2 | 5.6% |
| Arts & Humanities | 0 | 0.0% |
| Total | 36 | 100.0% |
Transportation & Commute in Windsor Heights
Vehicle Availability by Sex in Windsor Heights
The most prevalent vehicle ownership categories in Windsor Heights are males with 2 vehicles (38, accounting for 44.2%) and females with 2 vehicles (27, making up 63.3%).
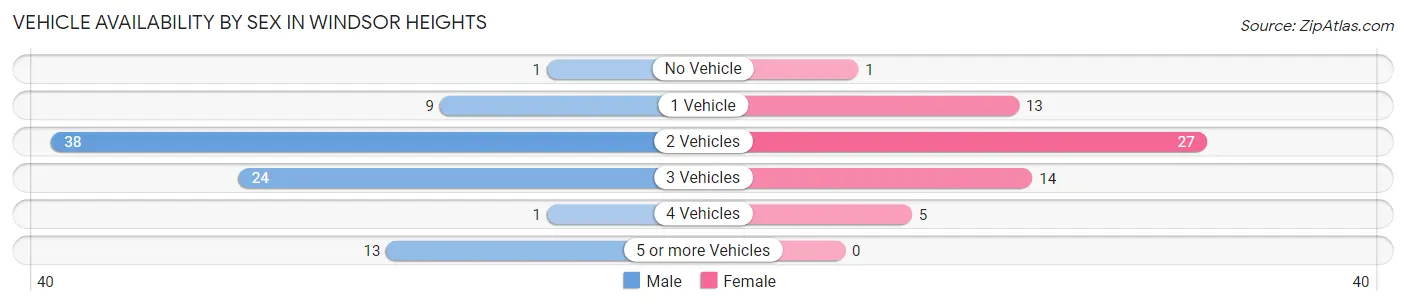
| Vehicles Available | Male | Female |
| No Vehicle | 1 (1.2%) | 1 (1.7%) |
| 1 Vehicle | 9 (10.5%) | 13 (21.7%) |
| 2 Vehicles | 38 (44.2%) | 27 (45.0%) |
| 3 Vehicles | 24 (27.9%) | 14 (23.3%) |
| 4 Vehicles | 1 (1.2%) | 5 (8.3%) |
| 5 or more Vehicles | 13 (15.1%) | 0 (0.0%) |
| Total | 86 (100.0%) | 60 (100.0%) |
Commute Time in Windsor Heights
The most frequently occuring commute durations in Windsor Heights are 30 to 34 minutes (36 commuters, 26.5%), 20 to 24 minutes (31 commuters, 22.8%), and 10 to 14 minutes (14 commuters, 10.3%).
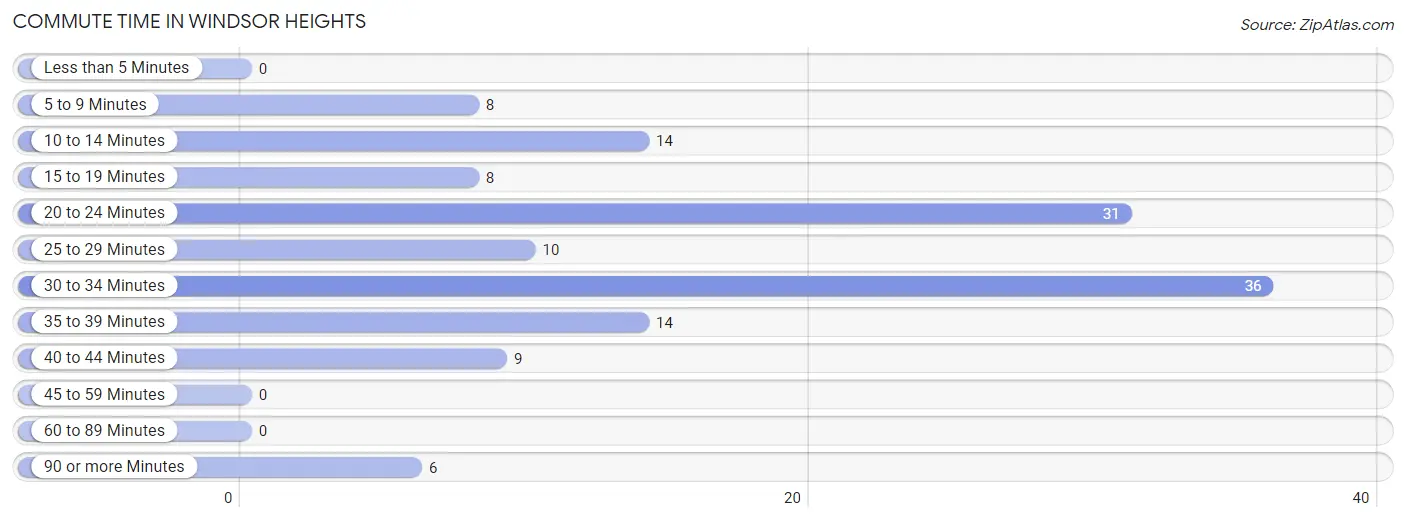
| Commute Time | # Commuters | % Commuters |
| Less than 5 Minutes | 0 | 0.0% |
| 5 to 9 Minutes | 8 | 5.9% |
| 10 to 14 Minutes | 14 | 10.3% |
| 15 to 19 Minutes | 8 | 5.9% |
| 20 to 24 Minutes | 31 | 22.8% |
| 25 to 29 Minutes | 10 | 7.3% |
| 30 to 34 Minutes | 36 | 26.5% |
| 35 to 39 Minutes | 14 | 10.3% |
| 40 to 44 Minutes | 9 | 6.6% |
| 45 to 59 Minutes | 0 | 0.0% |
| 60 to 89 Minutes | 0 | 0.0% |
| 90 or more Minutes | 6 | 4.4% |
Commute Time by Sex in Windsor Heights
The most common commute times in Windsor Heights are 30 to 34 minutes (22 commuters, 28.2%) for males and 20 to 24 minutes (17 commuters, 29.3%) for females.
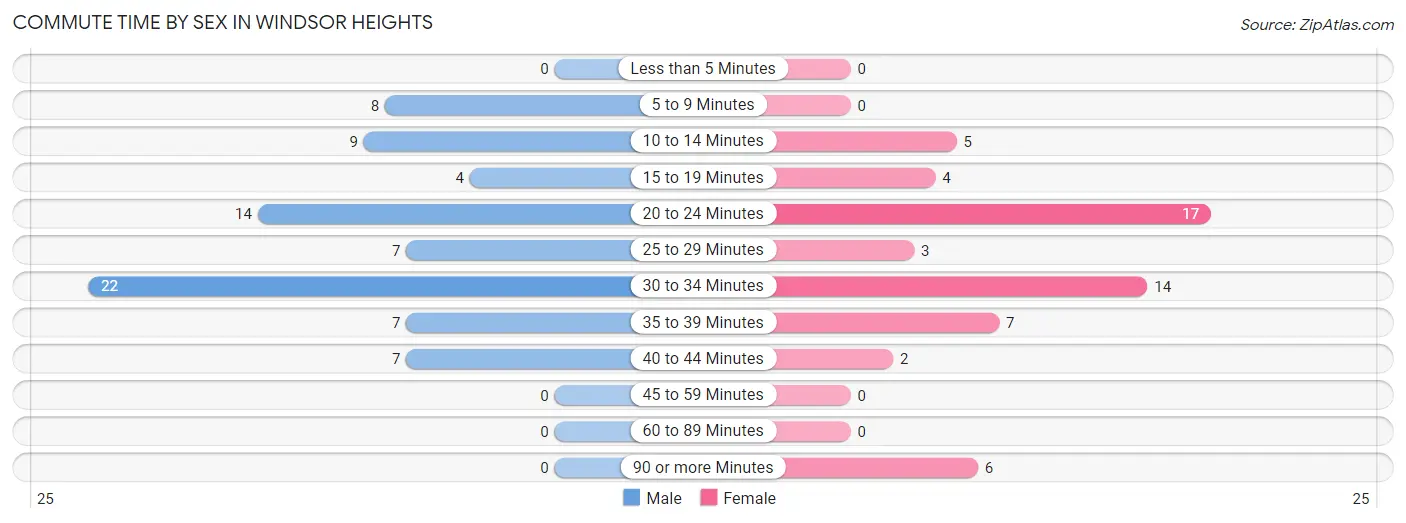
| Commute Time | Male | Female |
| Less than 5 Minutes | 0 (0.0%) | 0 (0.0%) |
| 5 to 9 Minutes | 8 (10.3%) | 0 (0.0%) |
| 10 to 14 Minutes | 9 (11.5%) | 5 (8.6%) |
| 15 to 19 Minutes | 4 (5.1%) | 4 (6.9%) |
| 20 to 24 Minutes | 14 (17.9%) | 17 (29.3%) |
| 25 to 29 Minutes | 7 (9.0%) | 3 (5.2%) |
| 30 to 34 Minutes | 22 (28.2%) | 14 (24.1%) |
| 35 to 39 Minutes | 7 (9.0%) | 7 (12.1%) |
| 40 to 44 Minutes | 7 (9.0%) | 2 (3.5%) |
| 45 to 59 Minutes | 0 (0.0%) | 0 (0.0%) |
| 60 to 89 Minutes | 0 (0.0%) | 0 (0.0%) |
| 90 or more Minutes | 0 (0.0%) | 6 (10.3%) |
Time of Departure to Work by Sex in Windsor Heights
The most frequent times of departure to work in Windsor Heights are 7:00 AM to 7:29 AM (16, 20.5%) for males and 6:00 AM to 6:29 AM (12, 20.7%) for females.
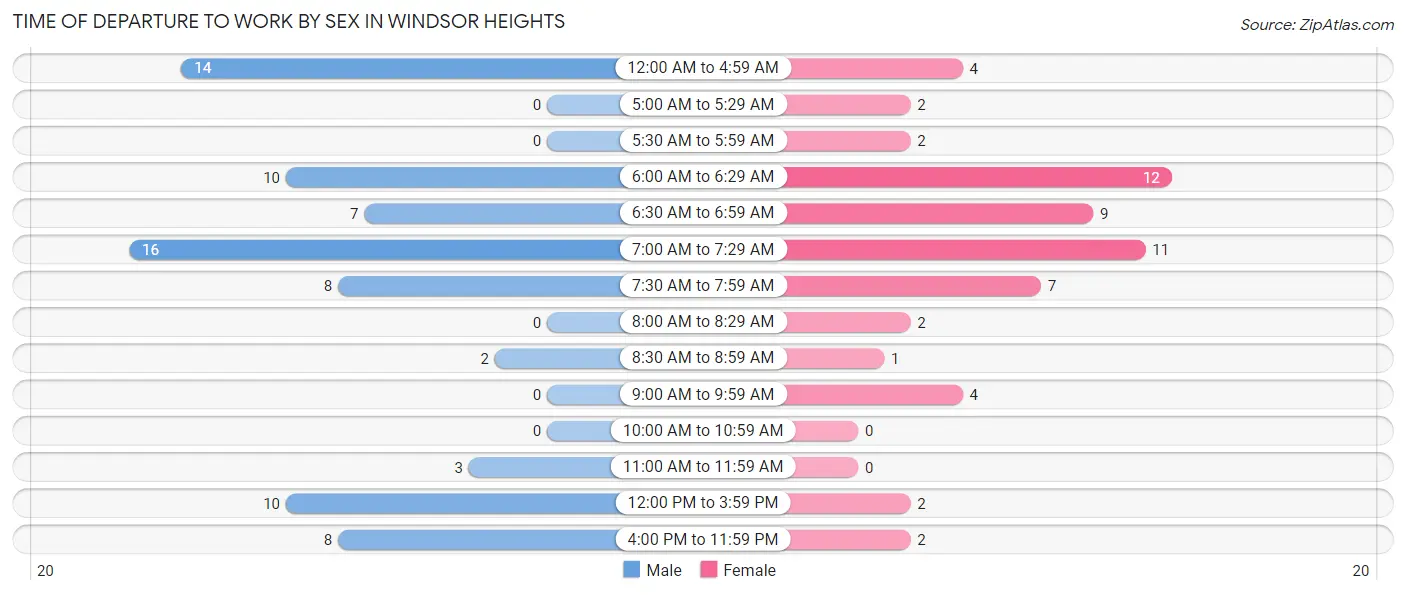
| Time of Departure | Male | Female |
| 12:00 AM to 4:59 AM | 14 (17.9%) | 4 (6.9%) |
| 5:00 AM to 5:29 AM | 0 (0.0%) | 2 (3.5%) |
| 5:30 AM to 5:59 AM | 0 (0.0%) | 2 (3.5%) |
| 6:00 AM to 6:29 AM | 10 (12.8%) | 12 (20.7%) |
| 6:30 AM to 6:59 AM | 7 (9.0%) | 9 (15.5%) |
| 7:00 AM to 7:29 AM | 16 (20.5%) | 11 (19.0%) |
| 7:30 AM to 7:59 AM | 8 (10.3%) | 7 (12.1%) |
| 8:00 AM to 8:29 AM | 0 (0.0%) | 2 (3.5%) |
| 8:30 AM to 8:59 AM | 2 (2.6%) | 1 (1.7%) |
| 9:00 AM to 9:59 AM | 0 (0.0%) | 4 (6.9%) |
| 10:00 AM to 10:59 AM | 0 (0.0%) | 0 (0.0%) |
| 11:00 AM to 11:59 AM | 3 (3.8%) | 0 (0.0%) |
| 12:00 PM to 3:59 PM | 10 (12.8%) | 2 (3.5%) |
| 4:00 PM to 11:59 PM | 8 (10.3%) | 2 (3.5%) |
| Total | 78 (100.0%) | 58 (100.0%) |
Housing Occupancy in Windsor Heights
Occupancy by Ownership in Windsor Heights
Of the total 221 dwellings in Windsor Heights, owner-occupied units account for 210 (95.0%), while renter-occupied units make up 11 (5.0%).
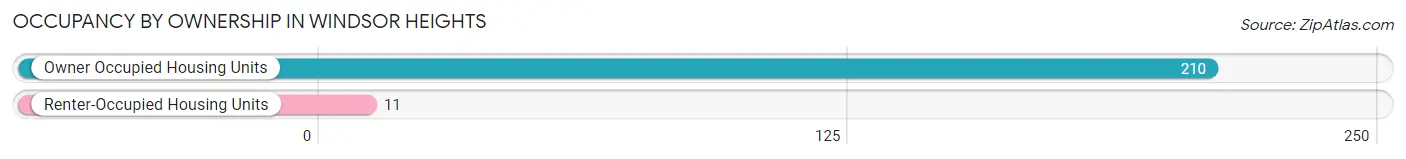
| Occupancy | # Housing Units | % Housing Units |
| Owner Occupied Housing Units | 210 | 95.0% |
| Renter-Occupied Housing Units | 11 | 5.0% |
| Total Occupied Housing Units | 221 | 100.0% |
Occupancy by Household Size in Windsor Heights
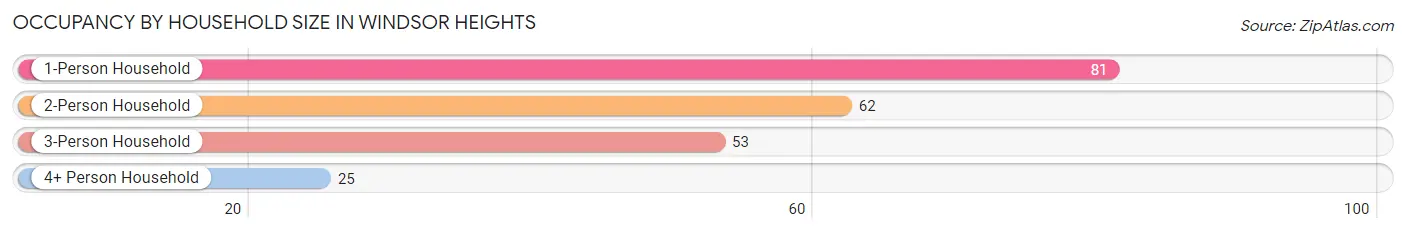
| Household Size | # Housing Units | % Housing Units |
| 1-Person Household | 81 | 36.6% |
| 2-Person Household | 62 | 28.1% |
| 3-Person Household | 53 | 24.0% |
| 4+ Person Household | 25 | 11.3% |
| Total Housing Units | 221 | 100.0% |
Occupancy by Ownership by Household Size in Windsor Heights
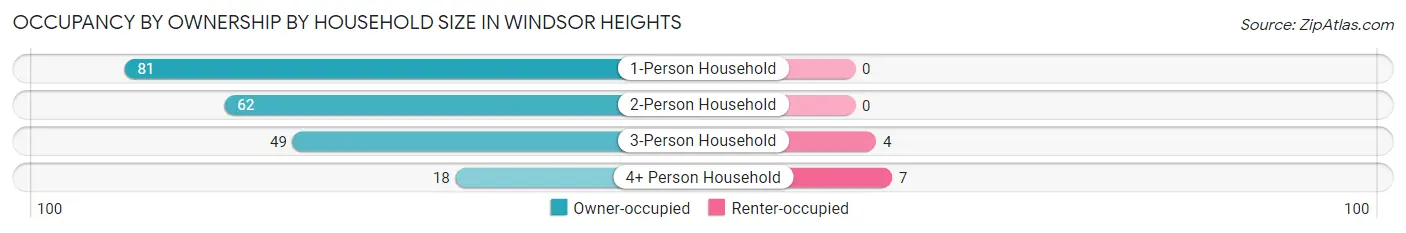
| Household Size | Owner-occupied | Renter-occupied |
| 1-Person Household | 81 (100.0%) | 0 (0.0%) |
| 2-Person Household | 62 (100.0%) | 0 (0.0%) |
| 3-Person Household | 49 (92.4%) | 4 (7.5%) |
| 4+ Person Household | 18 (72.0%) | 7 (28.0%) |
| Total Housing Units | 210 (95.0%) | 11 (5.0%) |
Occupancy by Educational Attainment in Windsor Heights
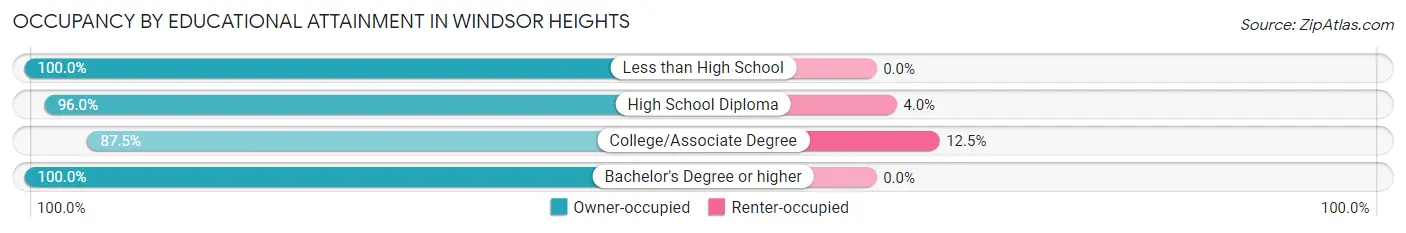
| Household Size | Owner-occupied | Renter-occupied |
| Less than High School | 10 (100.0%) | 0 (0.0%) |
| High School Diploma | 144 (96.0%) | 6 (4.0%) |
| College/Associate Degree | 35 (87.5%) | 5 (12.5%) |
| Bachelor's Degree or higher | 21 (100.0%) | 0 (0.0%) |
Occupancy by Age of Householder in Windsor Heights
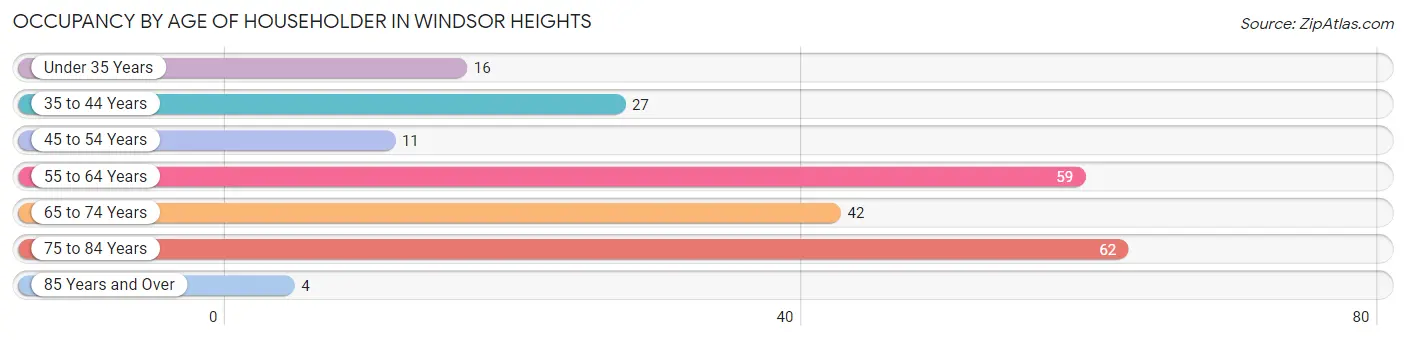
| Age Bracket | # Households | % Households |
| Under 35 Years | 16 | 7.2% |
| 35 to 44 Years | 27 | 12.2% |
| 45 to 54 Years | 11 | 5.0% |
| 55 to 64 Years | 59 | 26.7% |
| 65 to 74 Years | 42 | 19.0% |
| 75 to 84 Years | 62 | 28.1% |
| 85 Years and Over | 4 | 1.8% |
| Total | 221 | 100.0% |
Housing Finances in Windsor Heights
Median Income by Occupancy in Windsor Heights
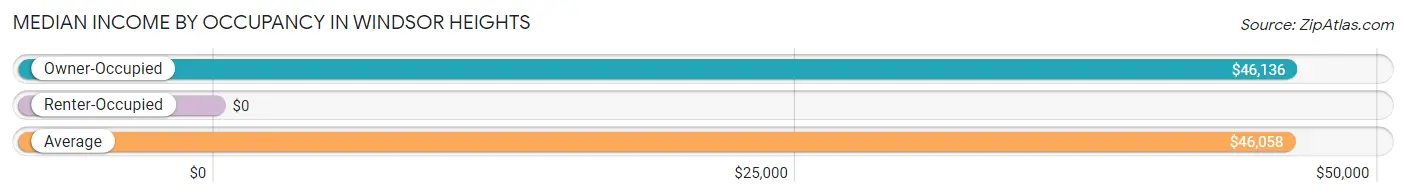
| Occupancy Type | # Households | Median Income |
| Owner-Occupied | 210 (95.0%) | $46,136 |
| Renter-Occupied | 11 (5.0%) | $0 |
| Average | 221 (100.0%) | $46,058 |
Occupancy by Householder Income Bracket in Windsor Heights
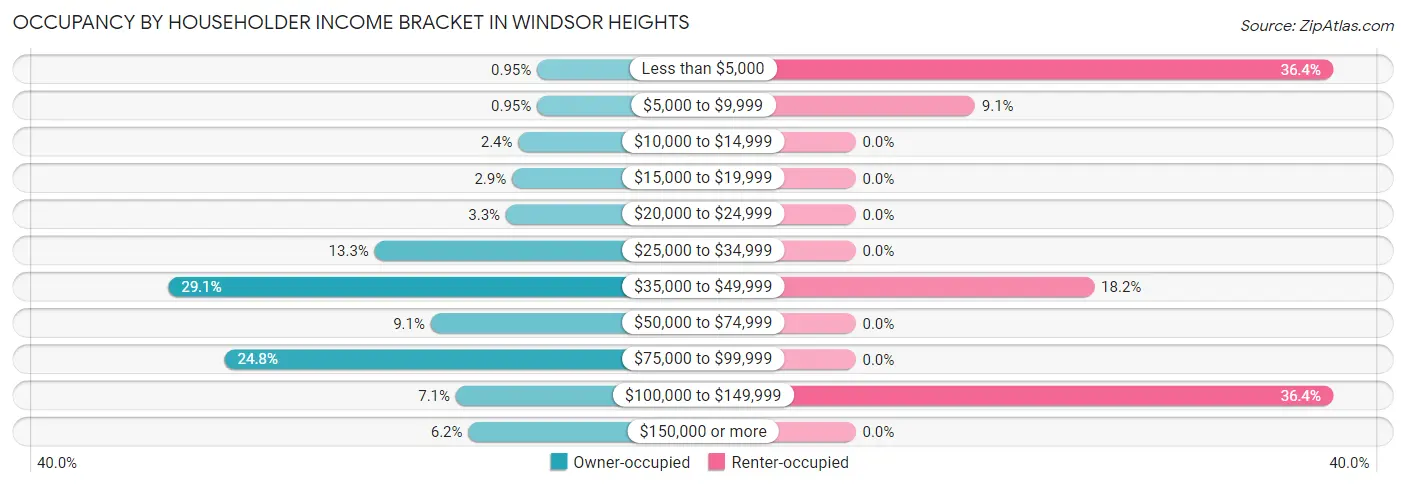
| Income Bracket | Owner-occupied | Renter-occupied |
| Less than $5,000 | 2 (0.9%) | 4 (36.4%) |
| $5,000 to $9,999 | 2 (0.9%) | 1 (9.1%) |
| $10,000 to $14,999 | 5 (2.4%) | 0 (0.0%) |
| $15,000 to $19,999 | 6 (2.9%) | 0 (0.0%) |
| $20,000 to $24,999 | 7 (3.3%) | 0 (0.0%) |
| $25,000 to $34,999 | 28 (13.3%) | 0 (0.0%) |
| $35,000 to $49,999 | 61 (29.0%) | 2 (18.2%) |
| $50,000 to $74,999 | 19 (9.0%) | 0 (0.0%) |
| $75,000 to $99,999 | 52 (24.8%) | 0 (0.0%) |
| $100,000 to $149,999 | 15 (7.1%) | 4 (36.4%) |
| $150,000 or more | 13 (6.2%) | 0 (0.0%) |
| Total | 210 (100.0%) | 11 (100.0%) |
Monthly Housing Cost Tiers in Windsor Heights
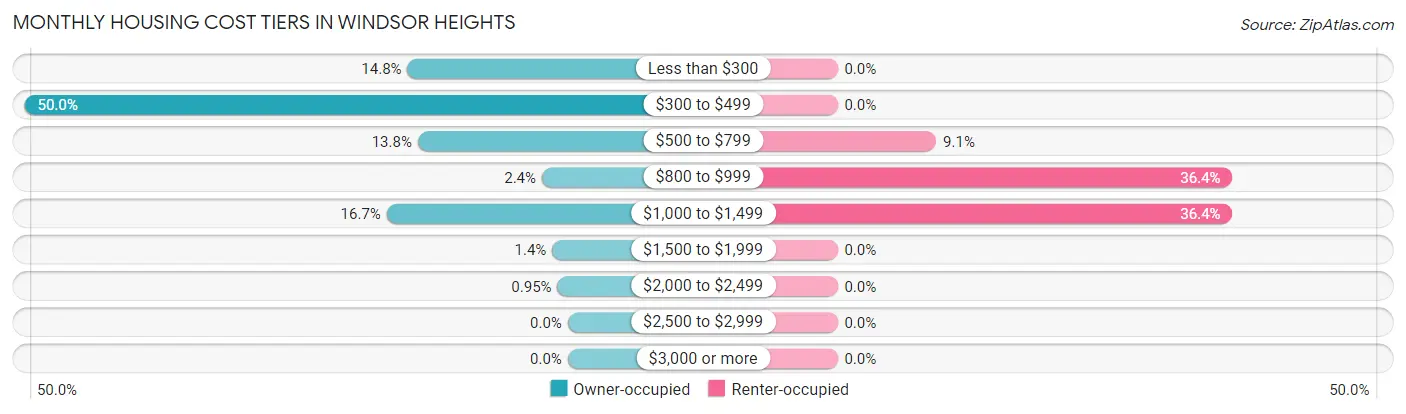
| Monthly Cost | Owner-occupied | Renter-occupied |
| Less than $300 | 31 (14.8%) | 0 (0.0%) |
| $300 to $499 | 105 (50.0%) | 0 (0.0%) |
| $500 to $799 | 29 (13.8%) | 1 (9.1%) |
| $800 to $999 | 5 (2.4%) | 4 (36.4%) |
| $1,000 to $1,499 | 35 (16.7%) | 4 (36.4%) |
| $1,500 to $1,999 | 3 (1.4%) | 0 (0.0%) |
| $2,000 to $2,499 | 2 (0.9%) | 0 (0.0%) |
| $2,500 to $2,999 | 0 (0.0%) | 0 (0.0%) |
| $3,000 or more | 0 (0.0%) | 0 (0.0%) |
| Total | 210 (100.0%) | 11 (100.0%) |
Physical Housing Characteristics in Windsor Heights
Housing Structures in Windsor Heights
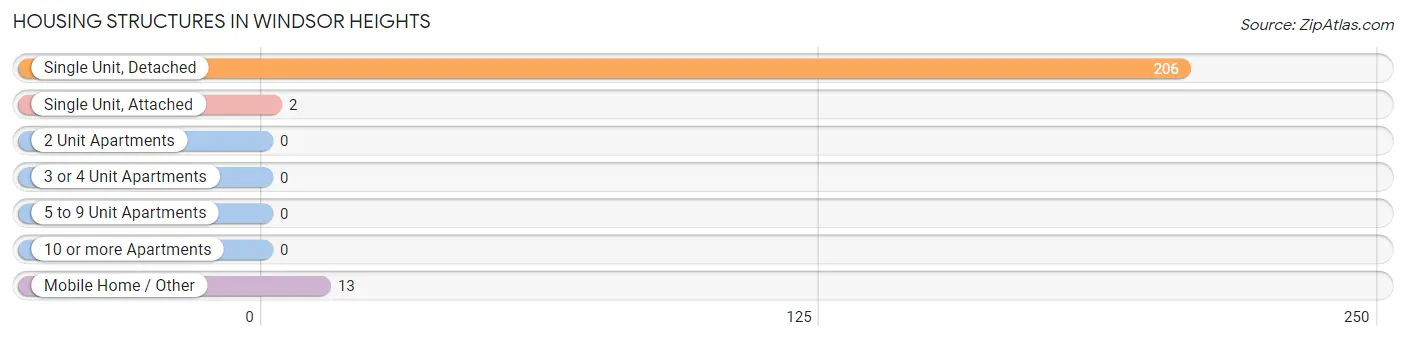
| Structure Type | # Housing Units | % Housing Units |
| Single Unit, Detached | 206 | 93.2% |
| Single Unit, Attached | 2 | 0.9% |
| 2 Unit Apartments | 0 | 0.0% |
| 3 or 4 Unit Apartments | 0 | 0.0% |
| 5 to 9 Unit Apartments | 0 | 0.0% |
| 10 or more Apartments | 0 | 0.0% |
| Mobile Home / Other | 13 | 5.9% |
| Total | 221 | 100.0% |
Housing Structures by Occupancy in Windsor Heights
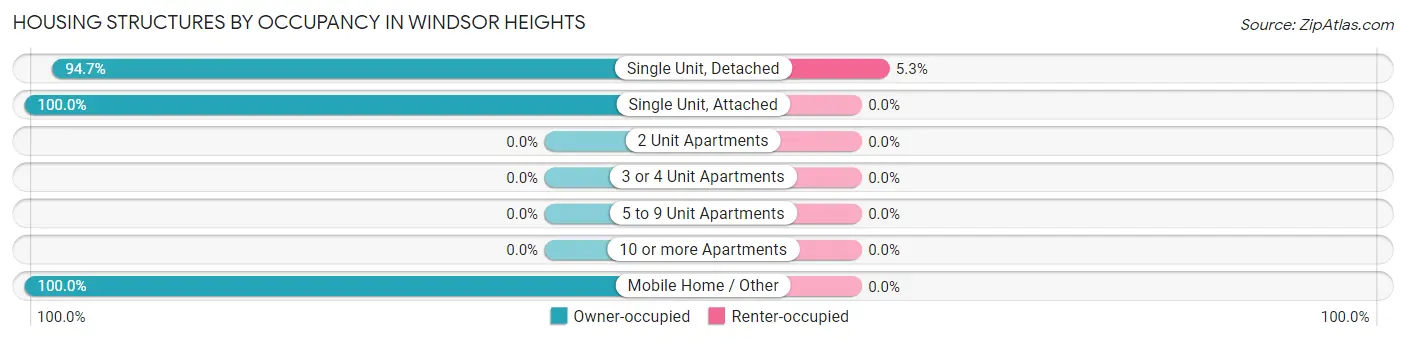
| Structure Type | Owner-occupied | Renter-occupied |
| Single Unit, Detached | 195 (94.7%) | 11 (5.3%) |
| Single Unit, Attached | 2 (100.0%) | 0 (0.0%) |
| 2 Unit Apartments | 0 (0.0%) | 0 (0.0%) |
| 3 or 4 Unit Apartments | 0 (0.0%) | 0 (0.0%) |
| 5 to 9 Unit Apartments | 0 (0.0%) | 0 (0.0%) |
| 10 or more Apartments | 0 (0.0%) | 0 (0.0%) |
| Mobile Home / Other | 13 (100.0%) | 0 (0.0%) |
| Total | 210 (95.0%) | 11 (5.0%) |
Housing Structures by Number of Rooms in Windsor Heights
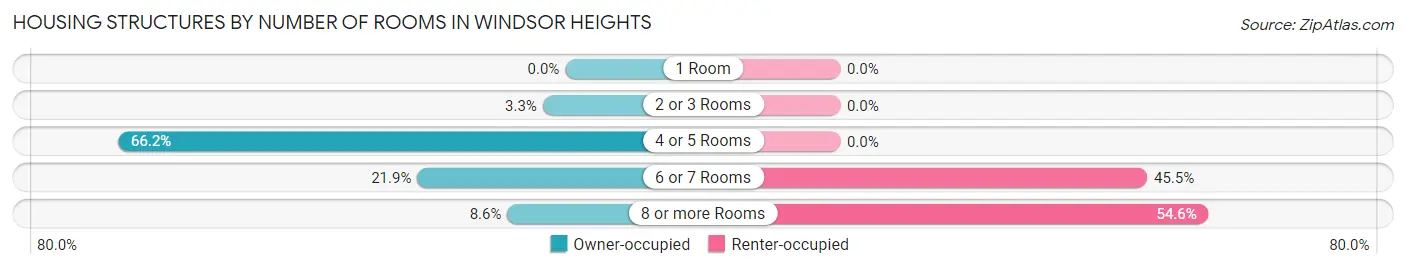
| Number of Rooms | Owner-occupied | Renter-occupied |
| 1 Room | 0 (0.0%) | 0 (0.0%) |
| 2 or 3 Rooms | 7 (3.3%) | 0 (0.0%) |
| 4 or 5 Rooms | 139 (66.2%) | 0 (0.0%) |
| 6 or 7 Rooms | 46 (21.9%) | 5 (45.5%) |
| 8 or more Rooms | 18 (8.6%) | 6 (54.5%) |
| Total | 210 (100.0%) | 11 (100.0%) |
Housing Structure by Heating Type in Windsor Heights
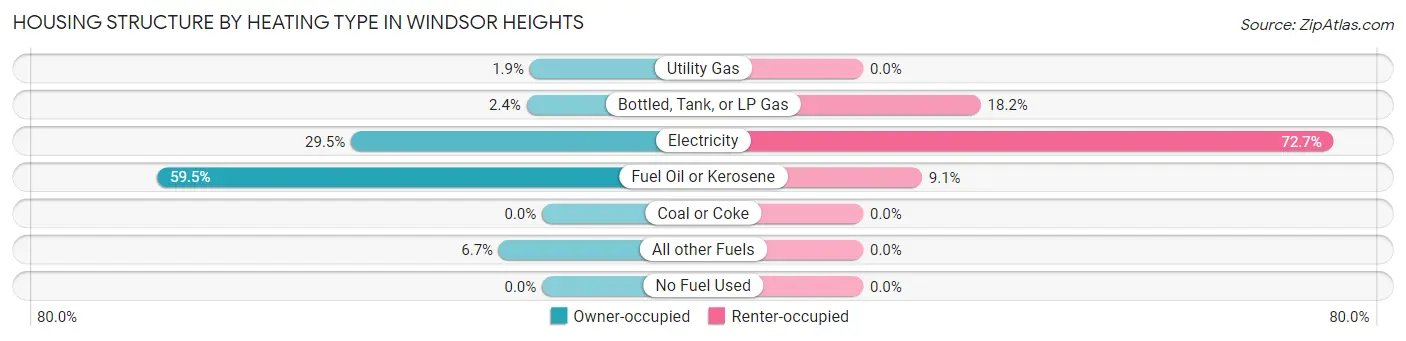
| Heating Type | Owner-occupied | Renter-occupied |
| Utility Gas | 4 (1.9%) | 0 (0.0%) |
| Bottled, Tank, or LP Gas | 5 (2.4%) | 2 (18.2%) |
| Electricity | 62 (29.5%) | 8 (72.7%) |
| Fuel Oil or Kerosene | 125 (59.5%) | 1 (9.1%) |
| Coal or Coke | 0 (0.0%) | 0 (0.0%) |
| All other Fuels | 14 (6.7%) | 0 (0.0%) |
| No Fuel Used | 0 (0.0%) | 0 (0.0%) |
| Total | 210 (100.0%) | 11 (100.0%) |
Household Vehicle Usage in Windsor Heights
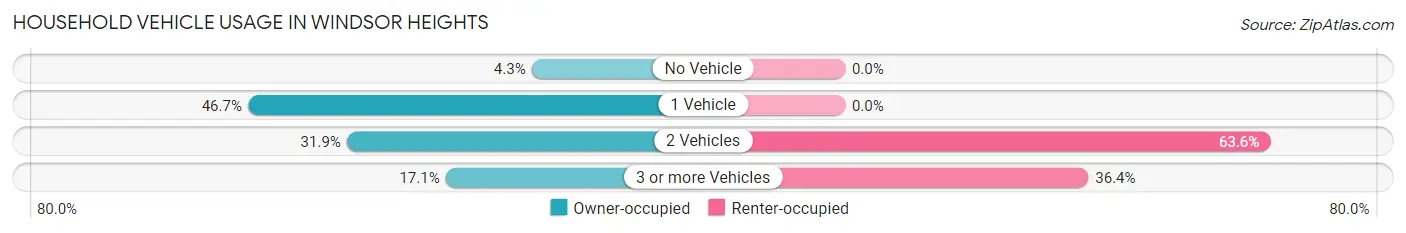
| Vehicles per Household | Owner-occupied | Renter-occupied |
| No Vehicle | 9 (4.3%) | 0 (0.0%) |
| 1 Vehicle | 98 (46.7%) | 0 (0.0%) |
| 2 Vehicles | 67 (31.9%) | 7 (63.6%) |
| 3 or more Vehicles | 36 (17.1%) | 4 (36.4%) |
| Total | 210 (100.0%) | 11 (100.0%) |
Real Estate & Mortgages in Windsor Heights
Real Estate and Mortgage Overview in Windsor Heights
| Characteristic | Without Mortgage | With Mortgage |
| Housing Units | 139 | 71 |
| Median Property Value | $55,000 | $77,900 |
| Median Household Income | $39,116 | $2 |
| Monthly Housing Costs | $328 | $0 |
| Real Estate Taxes | $363 | $0 |
Property Value by Mortgage Status in Windsor Heights
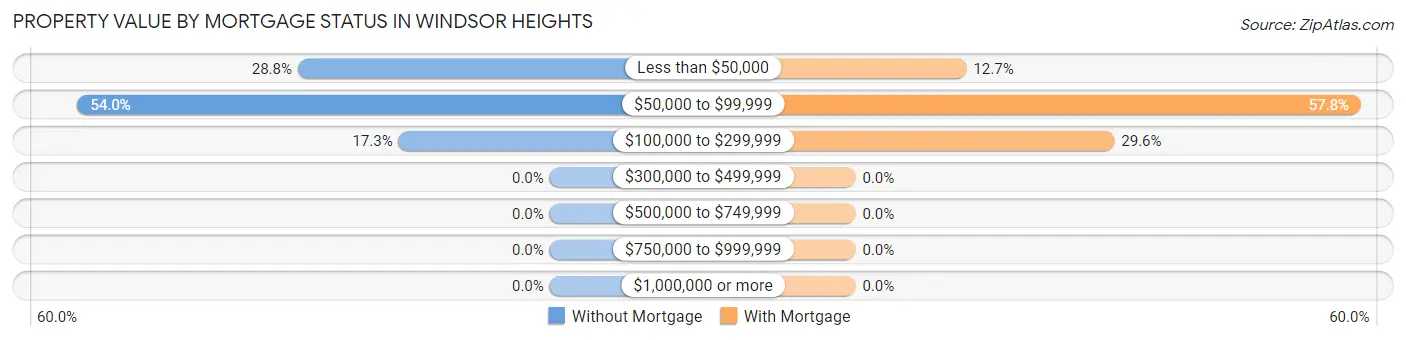
| Property Value | Without Mortgage | With Mortgage |
| Less than $50,000 | 40 (28.8%) | 9 (12.7%) |
| $50,000 to $99,999 | 75 (54.0%) | 41 (57.8%) |
| $100,000 to $299,999 | 24 (17.3%) | 21 (29.6%) |
| $300,000 to $499,999 | 0 (0.0%) | 0 (0.0%) |
| $500,000 to $749,999 | 0 (0.0%) | 0 (0.0%) |
| $750,000 to $999,999 | 0 (0.0%) | 0 (0.0%) |
| $1,000,000 or more | 0 (0.0%) | 0 (0.0%) |
| Total | 139 (100.0%) | 71 (100.0%) |
Household Income by Mortgage Status in Windsor Heights
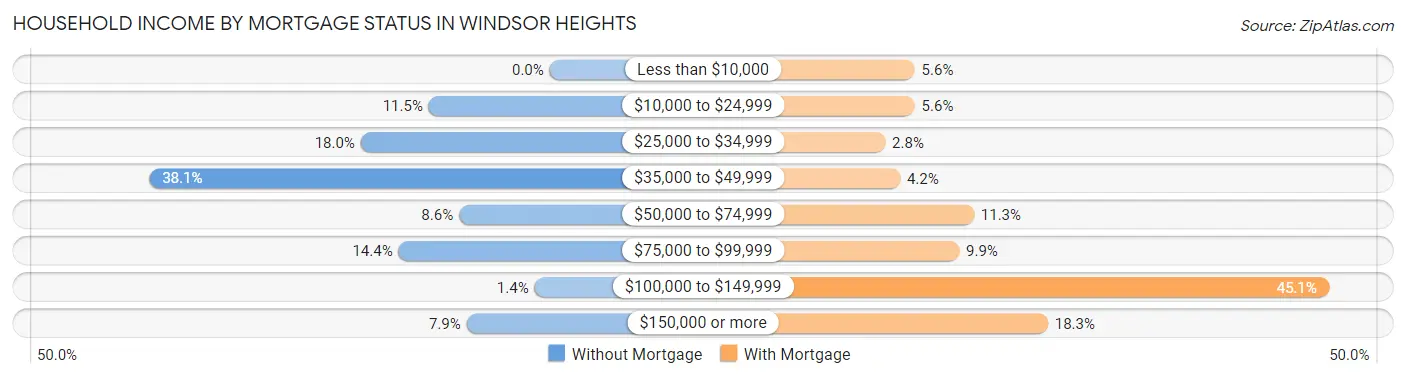
| Household Income | Without Mortgage | With Mortgage |
| Less than $10,000 | 0 (0.0%) | 4 (5.6%) |
| $10,000 to $24,999 | 16 (11.5%) | 4 (5.6%) |
| $25,000 to $34,999 | 25 (18.0%) | 2 (2.8%) |
| $35,000 to $49,999 | 53 (38.1%) | 3 (4.2%) |
| $50,000 to $74,999 | 12 (8.6%) | 8 (11.3%) |
| $75,000 to $99,999 | 20 (14.4%) | 7 (9.9%) |
| $100,000 to $149,999 | 2 (1.4%) | 32 (45.1%) |
| $150,000 or more | 11 (7.9%) | 13 (18.3%) |
| Total | 139 (100.0%) | 71 (100.0%) |
Property Value to Household Income Ratio in Windsor Heights
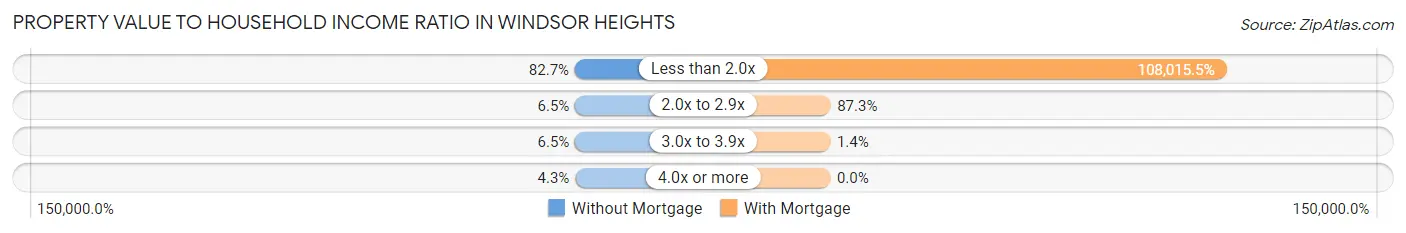
| Value-to-Income Ratio | Without Mortgage | With Mortgage |
| Less than 2.0x | 115 (82.7%) | 76,691 (108,015.5%) |
| 2.0x to 2.9x | 9 (6.5%) | 62 (87.3%) |
| 3.0x to 3.9x | 9 (6.5%) | 1 (1.4%) |
| 4.0x or more | 6 (4.3%) | 0 (0.0%) |
| Total | 139 (100.0%) | 71 (100.0%) |
Real Estate Taxes by Mortgage Status in Windsor Heights
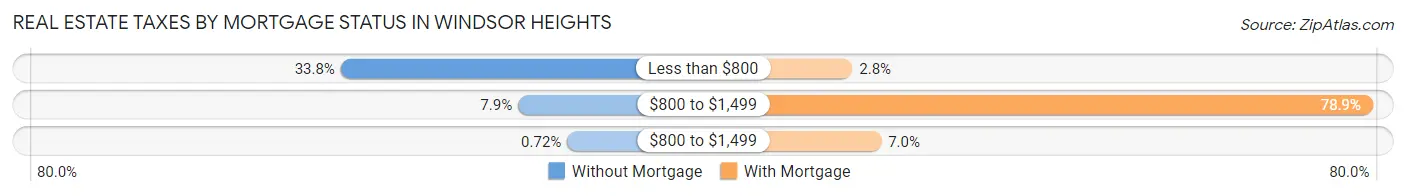
| Property Taxes | Without Mortgage | With Mortgage |
| Less than $800 | 47 (33.8%) | 2 (2.8%) |
| $800 to $1,499 | 11 (7.9%) | 56 (78.9%) |
| $800 to $1,499 | 1 (0.7%) | 5 (7.0%) |
| Total | 139 (100.0%) | 71 (100.0%) |
Health & Disability in Windsor Heights
Health Insurance Coverage by Age in Windsor Heights
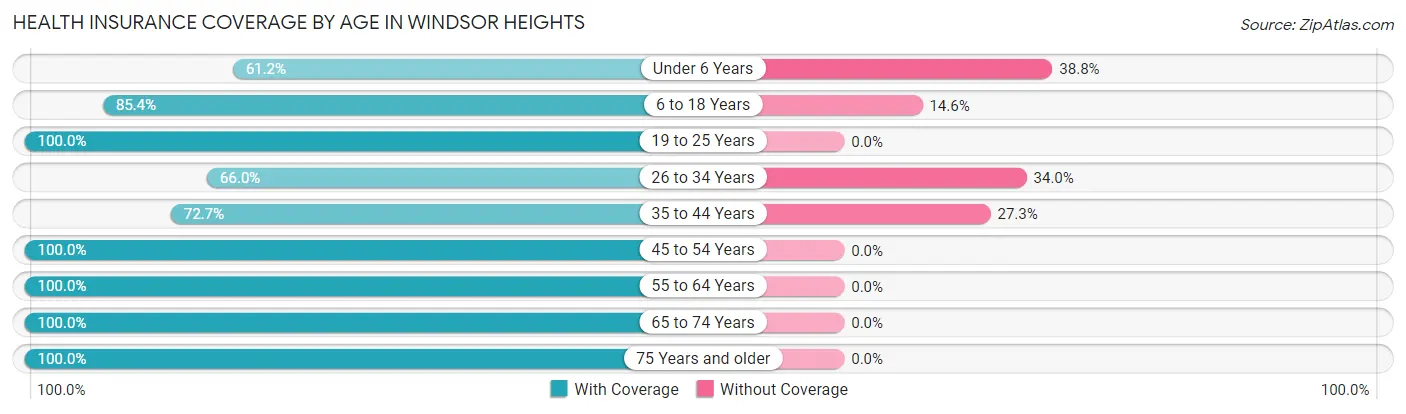
| Age Bracket | With Coverage | Without Coverage |
| Under 6 Years | 41 (61.2%) | 26 (38.8%) |
| 6 to 18 Years | 41 (85.4%) | 7 (14.6%) |
| 19 to 25 Years | 62 (100.0%) | 0 (0.0%) |
| 26 to 34 Years | 33 (66.0%) | 17 (34.0%) |
| 35 to 44 Years | 32 (72.7%) | 12 (27.3%) |
| 45 to 54 Years | 43 (100.0%) | 0 (0.0%) |
| 55 to 64 Years | 95 (100.0%) | 0 (0.0%) |
| 65 to 74 Years | 71 (100.0%) | 0 (0.0%) |
| 75 Years and older | 83 (100.0%) | 0 (0.0%) |
| Total | 501 (89.0%) | 62 (11.0%) |
Health Insurance Coverage by Citizenship Status in Windsor Heights
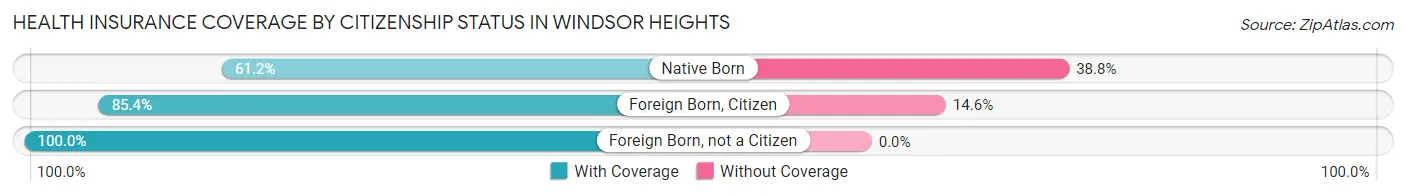
| Citizenship Status | With Coverage | Without Coverage |
| Native Born | 41 (61.2%) | 26 (38.8%) |
| Foreign Born, Citizen | 41 (85.4%) | 7 (14.6%) |
| Foreign Born, not a Citizen | 62 (100.0%) | 0 (0.0%) |
Health Insurance Coverage by Household Income in Windsor Heights
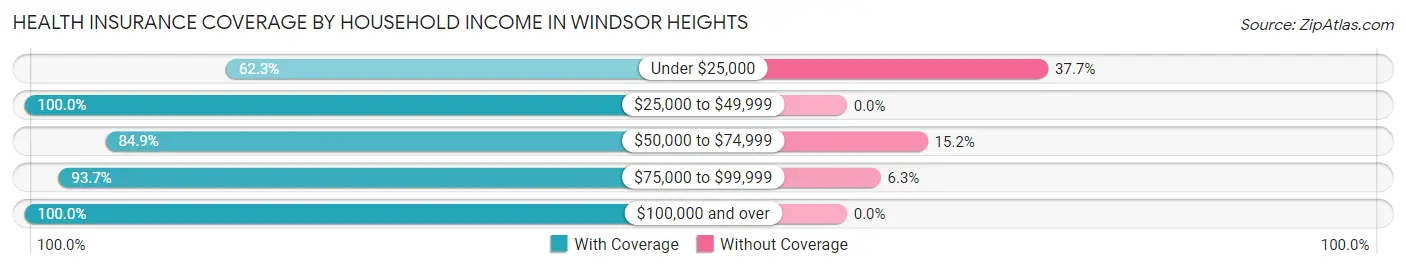
| Household Income | With Coverage | Without Coverage |
| Under $25,000 | 71 (62.3%) | 43 (37.7%) |
| $25,000 to $49,999 | 144 (100.0%) | 0 (0.0%) |
| $50,000 to $74,999 | 56 (84.9%) | 10 (15.1%) |
| $75,000 to $99,999 | 133 (93.7%) | 9 (6.3%) |
| $100,000 and over | 92 (100.0%) | 0 (0.0%) |
Public vs Private Health Insurance Coverage by Age in Windsor Heights
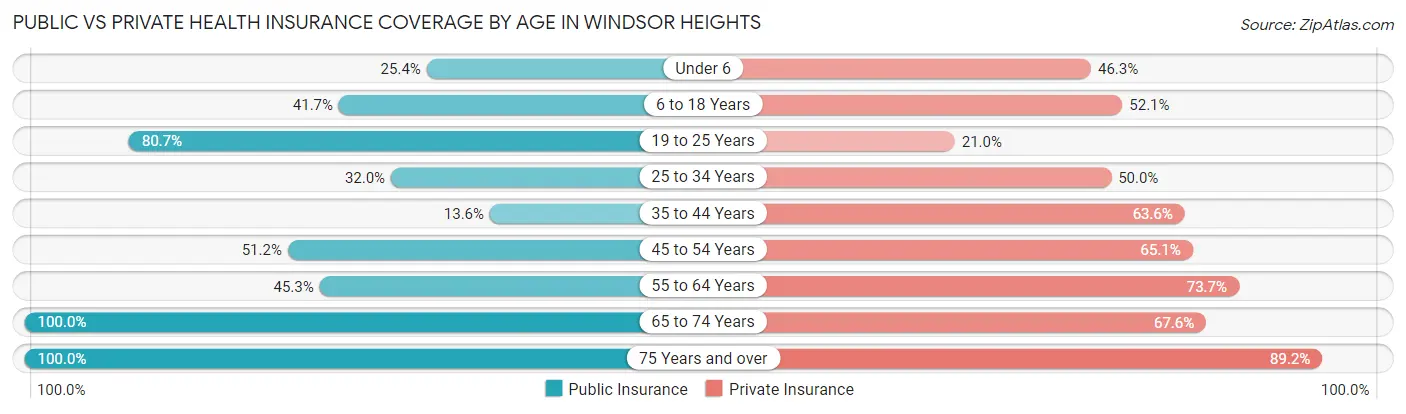
| Age Bracket | Public Insurance | Private Insurance |
| Under 6 | 17 (25.4%) | 31 (46.3%) |
| 6 to 18 Years | 20 (41.7%) | 25 (52.1%) |
| 19 to 25 Years | 50 (80.6%) | 13 (21.0%) |
| 25 to 34 Years | 16 (32.0%) | 25 (50.0%) |
| 35 to 44 Years | 6 (13.6%) | 28 (63.6%) |
| 45 to 54 Years | 22 (51.2%) | 28 (65.1%) |
| 55 to 64 Years | 43 (45.3%) | 70 (73.7%) |
| 65 to 74 Years | 71 (100.0%) | 48 (67.6%) |
| 75 Years and over | 83 (100.0%) | 74 (89.2%) |
| Total | 328 (58.3%) | 342 (60.8%) |
Disability Status by Sex by Age in Windsor Heights
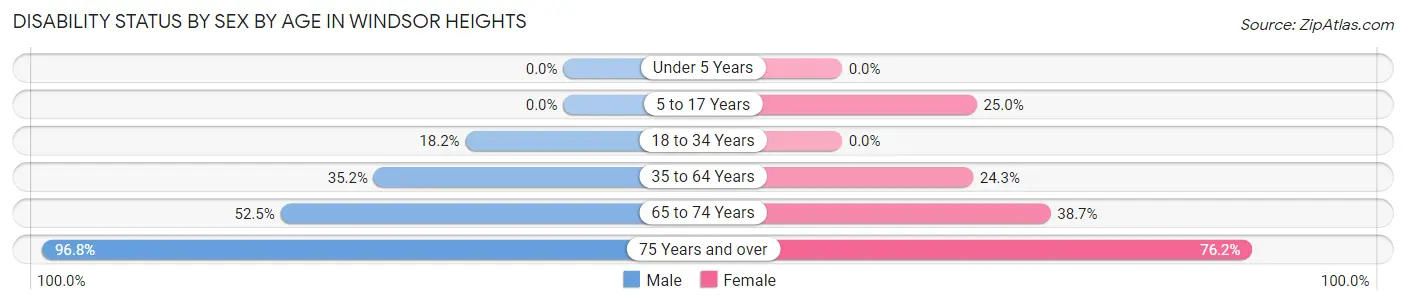
| Age Bracket | Male | Female |
| Under 5 Years | 0 (0.0%) | 0 (0.0%) |
| 5 to 17 Years | 0 (0.0%) | 4 (25.0%) |
| 18 to 34 Years | 14 (18.2%) | 0 (0.0%) |
| 35 to 64 Years | 38 (35.2%) | 18 (24.3%) |
| 65 to 74 Years | 21 (52.5%) | 12 (38.7%) |
| 75 Years and over | 60 (96.8%) | 16 (76.2%) |
Disability Class by Sex by Age in Windsor Heights
Disability Class: Hearing Difficulty
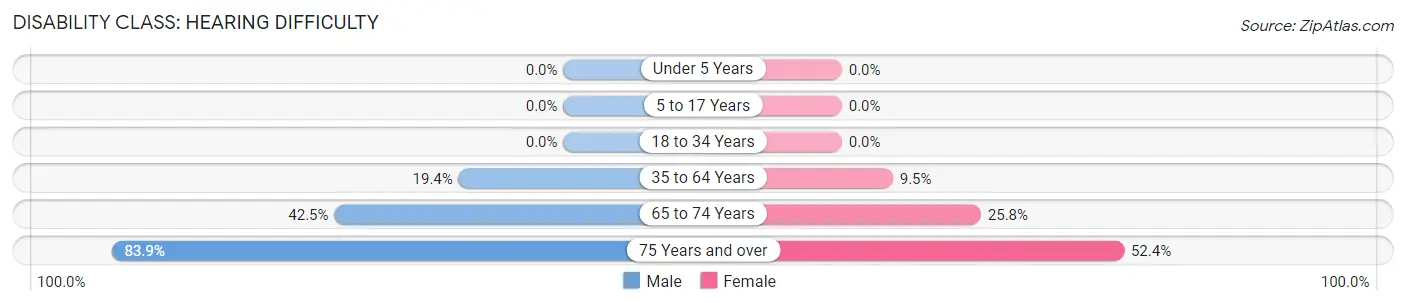
| Age Bracket | Male | Female |
| Under 5 Years | 0 (0.0%) | 0 (0.0%) |
| 5 to 17 Years | 0 (0.0%) | 0 (0.0%) |
| 18 to 34 Years | 0 (0.0%) | 0 (0.0%) |
| 35 to 64 Years | 21 (19.4%) | 7 (9.5%) |
| 65 to 74 Years | 17 (42.5%) | 8 (25.8%) |
| 75 Years and over | 52 (83.9%) | 11 (52.4%) |
Disability Class: Vision Difficulty
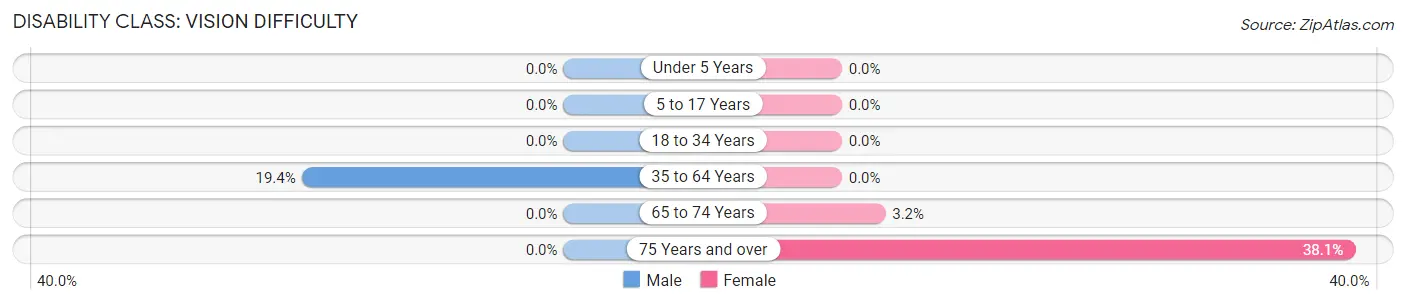
| Age Bracket | Male | Female |
| Under 5 Years | 0 (0.0%) | 0 (0.0%) |
| 5 to 17 Years | 0 (0.0%) | 0 (0.0%) |
| 18 to 34 Years | 0 (0.0%) | 0 (0.0%) |
| 35 to 64 Years | 21 (19.4%) | 0 (0.0%) |
| 65 to 74 Years | 0 (0.0%) | 1 (3.2%) |
| 75 Years and over | 0 (0.0%) | 8 (38.1%) |
Disability Class: Cognitive Difficulty
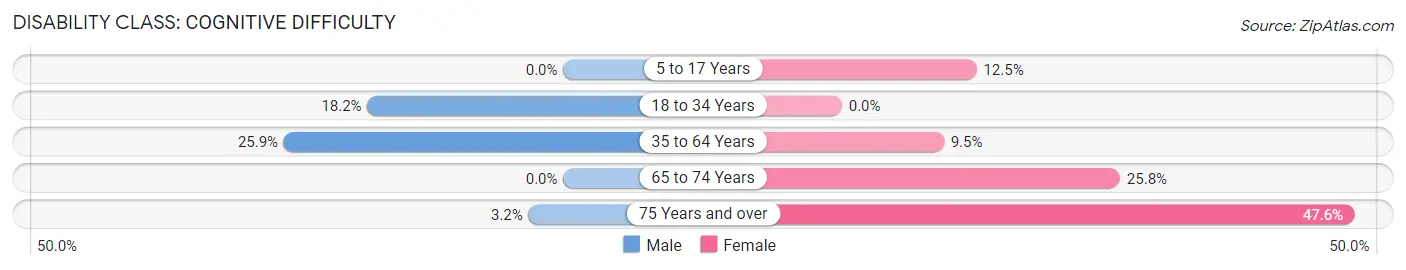
| Age Bracket | Male | Female |
| 5 to 17 Years | 0 (0.0%) | 2 (12.5%) |
| 18 to 34 Years | 14 (18.2%) | 0 (0.0%) |
| 35 to 64 Years | 28 (25.9%) | 7 (9.5%) |
| 65 to 74 Years | 0 (0.0%) | 8 (25.8%) |
| 75 Years and over | 2 (3.2%) | 10 (47.6%) |
Disability Class: Ambulatory Difficulty
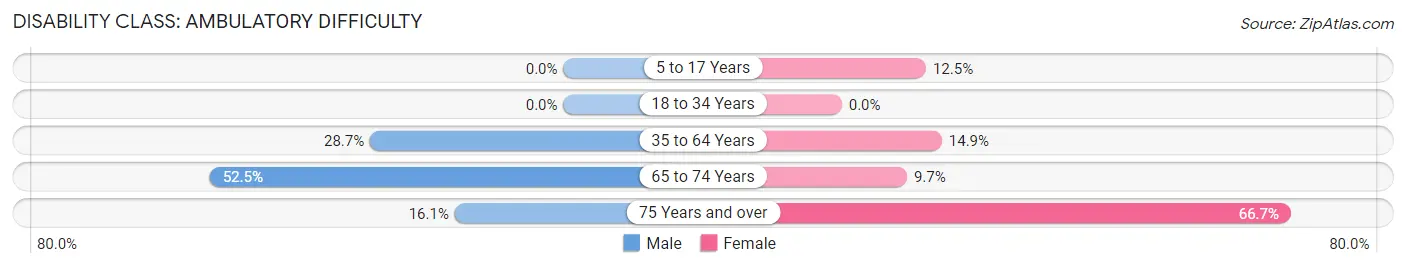
| Age Bracket | Male | Female |
| 5 to 17 Years | 0 (0.0%) | 2 (12.5%) |
| 18 to 34 Years | 0 (0.0%) | 0 (0.0%) |
| 35 to 64 Years | 31 (28.7%) | 11 (14.9%) |
| 65 to 74 Years | 21 (52.5%) | 3 (9.7%) |
| 75 Years and over | 10 (16.1%) | 14 (66.7%) |
Disability Class: Self-Care Difficulty
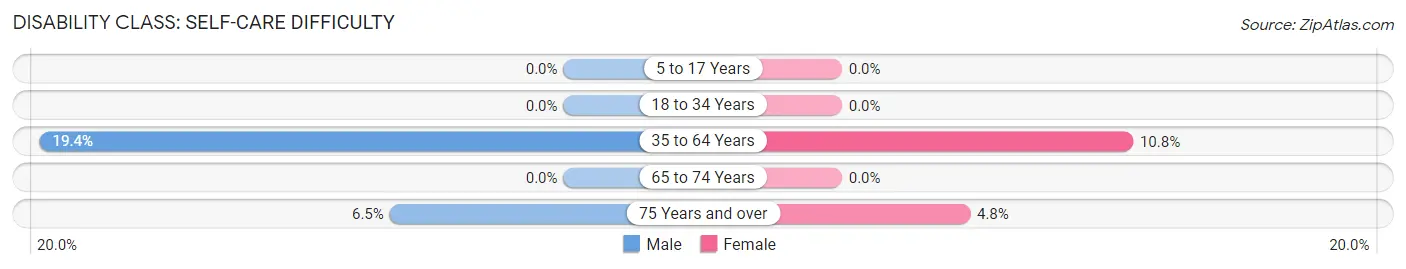
| Age Bracket | Male | Female |
| 5 to 17 Years | 0 (0.0%) | 0 (0.0%) |
| 18 to 34 Years | 0 (0.0%) | 0 (0.0%) |
| 35 to 64 Years | 21 (19.4%) | 8 (10.8%) |
| 65 to 74 Years | 0 (0.0%) | 0 (0.0%) |
| 75 Years and over | 4 (6.5%) | 1 (4.8%) |
Technology Access in Windsor Heights
Computing Device Access in Windsor Heights
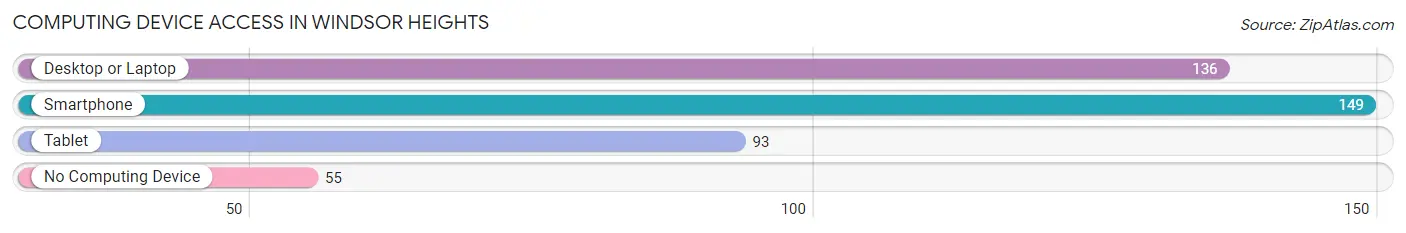
| Device Type | # Households | % Households |
| Desktop or Laptop | 136 | 61.5% |
| Smartphone | 149 | 67.4% |
| Tablet | 93 | 42.1% |
| No Computing Device | 55 | 24.9% |
| Total | 221 | 100.0% |
Internet Access in Windsor Heights
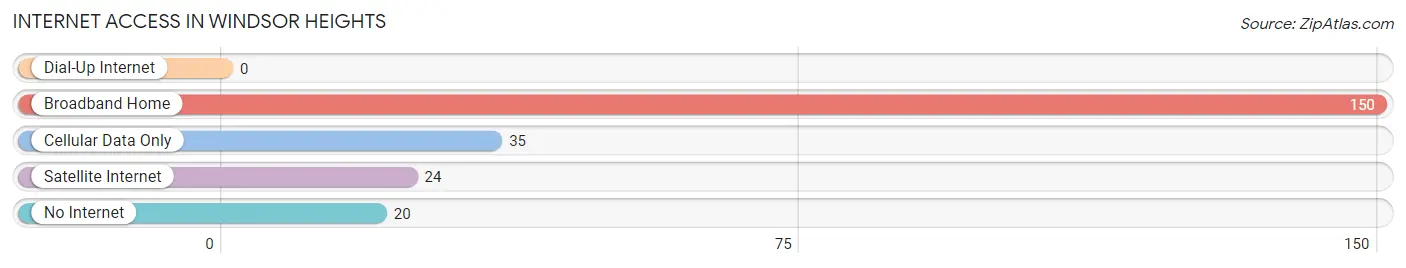
| Internet Type | # Households | % Households |
| Dial-Up Internet | 0 | 0.0% |
| Broadband Home | 150 | 67.9% |
| Cellular Data Only | 35 | 15.8% |
| Satellite Internet | 24 | 10.9% |
| No Internet | 20 | 9.0% |
| Total | 221 | 100.0% |
Windsor Heights Summary
Windsor Heights is a small town located in the eastern panhandle of West Virginia. It is situated in the northern part of Berkeley County, and is bordered by the Potomac River to the east and the Shenandoah River to the west. The town has a population of approximately 1,500 people, and is part of the larger metropolitan area of Martinsburg-Berkeley County.
History
Windsor Heights was founded in 1872 by a group of settlers from the nearby town of Martinsburg. The town was named after the nearby Windsor Castle, which was built in the late 1700s. The town was originally a farming community, and the main crops grown were wheat, corn, and hay. In the early 1900s, the town began to grow and develop, and by the 1920s, it had become a popular tourist destination.
The town was incorporated in 1924, and the first mayor was elected in 1925. During the 1930s, the town experienced a period of growth and development, and many new businesses were established. In the 1940s, the town was home to a number of factories, including a paper mill, a canning factory, and a furniture factory.
Geography
Windsor Heights is located in the northern part of Berkeley County, and is bordered by the Potomac River to the east and the Shenandoah River to the west. The town is situated at an elevation of 1,000 feet above sea level, and is located approximately 25 miles from the state capital of Charleston. The town is located in a rural area, and is surrounded by rolling hills and farmland.
Economy
Windsor Heights is a small town with a limited economy. The town is home to a few small businesses, including a grocery store, a hardware store, and a few restaurants. The town is also home to a number of small manufacturing companies, including a paper mill, a canning factory, and a furniture factory.
Demographics
As of the 2010 census, the population of Windsor Heights was 1,500 people. The town is predominantly white, with approximately 95% of the population being Caucasian. The median household income is $41,000, and the median home value is $150,000. The town has a low unemployment rate, and the majority of the population is employed in the manufacturing and service industries.
Conclusion
Windsor Heights is a small town located in the eastern panhandle of West Virginia. It is situated in the northern part of Berkeley County, and is bordered by the Potomac River to the east and the Shenandoah River to the west. The town has a population of approximately 1,500 people, and is part of the larger metropolitan area of Martinsburg-Berkeley County. The town was founded in 1872, and has a long history of farming and manufacturing. The town is predominantly white, with a median household income of $41,000 and a median home value of $150,000. The town has a low unemployment rate, and the majority of the population is employed in the manufacturing and service industries.
Common Questions
What is Per Capita Income in Windsor Heights?
Per Capita income in Windsor Heights is $26,905.
What is the Median Family Income in Windsor Heights?
Median Family Income in Windsor Heights is $61,964.
What is the Median Household income in Windsor Heights?
Median Household Income in Windsor Heights is $46,058.
What is Income or Wage Gap in Windsor Heights?
Income or Wage Gap in Windsor Heights is 14.7%.
Women in Windsor Heights earn 85.3 cents for every dollar earned by a man.
What is Inequality or Gini Index in Windsor Heights?
Inequality or Gini Index in Windsor Heights is 0.37.
What is the Total Population of Windsor Heights?
Total Population of Windsor Heights is 564.
What is the Total Male Population of Windsor Heights?
Total Male Population of Windsor Heights is 346.
What is the Total Female Population of Windsor Heights?
Total Female Population of Windsor Heights is 218.
What is the Ratio of Males per 100 Females in Windsor Heights?
There are 158.72 Males per 100 Females in Windsor Heights.
What is the Ratio of Females per 100 Males in Windsor Heights?
There are 63.01 Females per 100 Males in Windsor Heights.
What is the Median Population Age in Windsor Heights?
Median Population Age in Windsor Heights is 47.4 Years.
What is the Average Family Size in Windsor Heights
Average Family Size in Windsor Heights is 3.4 People.
What is the Average Household Size in Windsor Heights
Average Household Size in Windsor Heights is 2.5 People.
How Large is the Labor Force in Windsor Heights?
There are 183 People in the Labor Forcein in Windsor Heights.
What is the Percentage of People in the Labor Force in Windsor Heights?
39.4% of People are in the Labor Force in Windsor Heights.
What is the Unemployment Rate in Windsor Heights?
Unemployment Rate in Windsor Heights is 15.9%.