Milton, WV Map & Demographics
Milton Map
Milton Overview
$28,014
PER CAPITA INCOME
$69,333
AVG FAMILY INCOME
$42,857
AVG HOUSEHOLD INCOME
34.8%
WAGE / INCOME GAP [ % ]
65.2¢/ $1
WAGE / INCOME GAP [ $ ]
0.44
INEQUALITY / GINI INDEX
2,773
TOTAL POPULATION
1,233
MALE POPULATION
1,540
FEMALE POPULATION
80.06
MALES / 100 FEMALES
124.90
FEMALES / 100 MALES
41.5
MEDIAN AGE
3.1
AVG FAMILY SIZE
2.2
AVG HOUSEHOLD SIZE
1,254
LABOR FORCE [ PEOPLE ]
57.2%
PERCENT IN LABOR FORCE
8.0%
UNEMPLOYMENT RATE
Milton Zip Codes
Milton Area Codes
Income in Milton
Income Overview in Milton
Per Capita Income in Milton is $28,014, while median incomes of families and households are $69,333 and $42,857 respectively.
| Characteristic | Number | Measure |
| Per Capita Income | 2,773 | $28,014 |
| Median Family Income | 690 | $69,333 |
| Mean Family Income | 690 | $86,343 |
| Median Household Income | 1,274 | $42,857 |
| Mean Household Income | 1,274 | $61,760 |
| Income Deficit | 690 | $0 |
| Wage / Income Gap (%) | 2,773 | 34.83% |
| Wage / Income Gap ($) | 2,773 | 65.17¢ per $1 |
| Gini / Inequality Index | 2,773 | 0.44 |
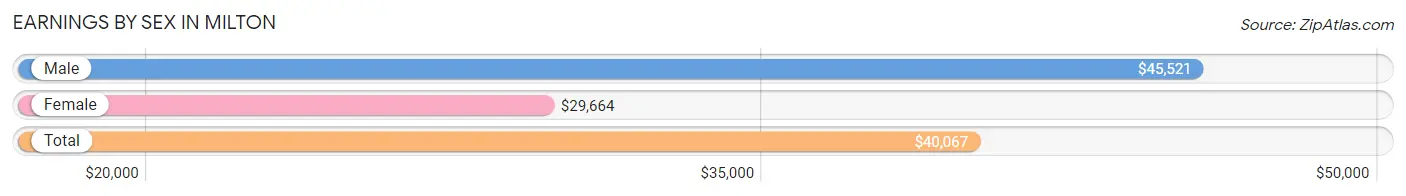
Earnings by Sex in Milton
Average Earnings in Milton are $40,067, $45,521 for men and $29,664 for women, a difference of 34.8%.
| Sex | Number | Average Earnings |
| Male | 594 (49.0%) | $45,521 |
| Female | 618 (51.0%) | $29,664 |
| Total | 1,212 (100.0%) | $40,067 |
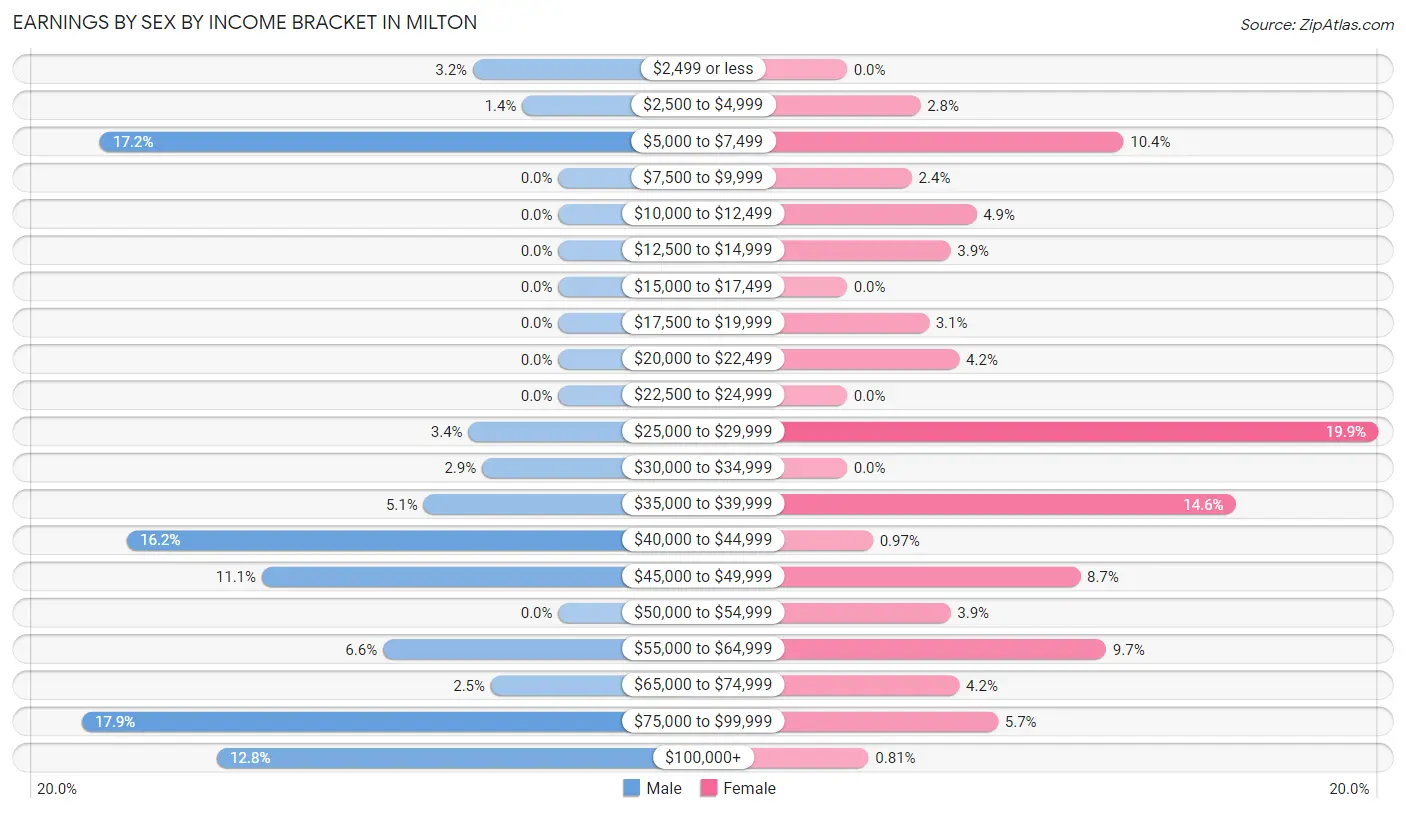
Earnings by Sex by Income Bracket in Milton
The most common earnings brackets in Milton are $75,000 to $99,999 for men (106 | 17.8%) and $25,000 to $29,999 for women (123 | 19.9%).
| Income | Male | Female |
| $2,499 or less | 19 (3.2%) | 0 (0.0%) |
| $2,500 to $4,999 | 8 (1.3%) | 17 (2.8%) |
| $5,000 to $7,499 | 102 (17.2%) | 64 (10.4%) |
| $7,500 to $9,999 | 0 (0.0%) | 15 (2.4%) |
| $10,000 to $12,499 | 0 (0.0%) | 30 (4.9%) |
| $12,500 to $14,999 | 0 (0.0%) | 24 (3.9%) |
| $15,000 to $17,499 | 0 (0.0%) | 0 (0.0%) |
| $17,500 to $19,999 | 0 (0.0%) | 19 (3.1%) |
| $20,000 to $22,499 | 0 (0.0%) | 26 (4.2%) |
| $22,500 to $24,999 | 0 (0.0%) | 0 (0.0%) |
| $25,000 to $29,999 | 20 (3.4%) | 123 (19.9%) |
| $30,000 to $34,999 | 17 (2.9%) | 0 (0.0%) |
| $35,000 to $39,999 | 30 (5.1%) | 90 (14.6%) |
| $40,000 to $44,999 | 96 (16.2%) | 6 (1.0%) |
| $45,000 to $49,999 | 66 (11.1%) | 54 (8.7%) |
| $50,000 to $54,999 | 0 (0.0%) | 24 (3.9%) |
| $55,000 to $64,999 | 39 (6.6%) | 60 (9.7%) |
| $65,000 to $74,999 | 15 (2.5%) | 26 (4.2%) |
| $75,000 to $99,999 | 106 (17.8%) | 35 (5.7%) |
| $100,000+ | 76 (12.8%) | 5 (0.8%) |
| Total | 594 (100.0%) | 618 (100.0%) |
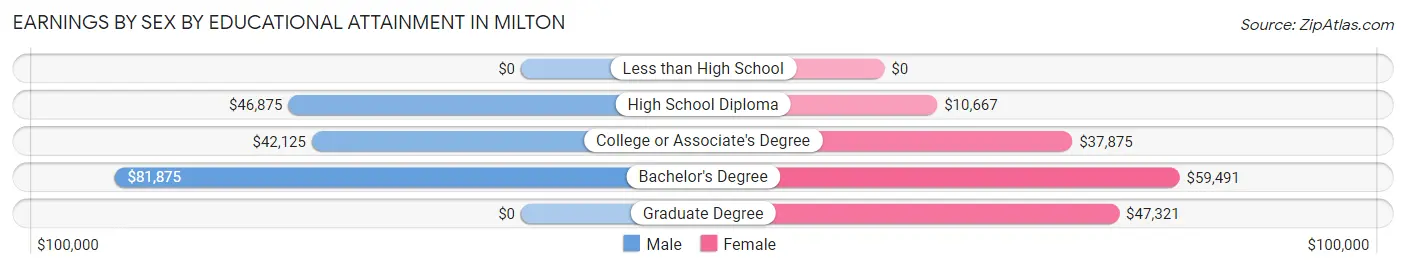
Earnings by Sex by Educational Attainment in Milton
Average earnings in Milton are $49,494 for men and $38,014 for women, a difference of 23.2%. Men with an educational attainment of bachelor's degree enjoy the highest average annual earnings of $81,875, while those with college or associate's degree education earn the least with $42,125. Women with an educational attainment of bachelor's degree earn the most with the average annual earnings of $59,491, while those with high school diploma education have the smallest earnings of $10,667.
| Educational Attainment | Male Income | Female Income |
| Less than High School | - | - |
| High School Diploma | $46,875 | $10,667 |
| College or Associate's Degree | $42,125 | $37,875 |
| Bachelor's Degree | $81,875 | $59,491 |
| Graduate Degree | - | - |
| Total | $49,494 | $38,014 |
Family Income in Milton
Family Income Brackets in Milton
According to the Milton family income data, there are 167 families falling into the $100,000 to $149,999 income range, which is the most common income bracket and makes up 24.2% of all families.
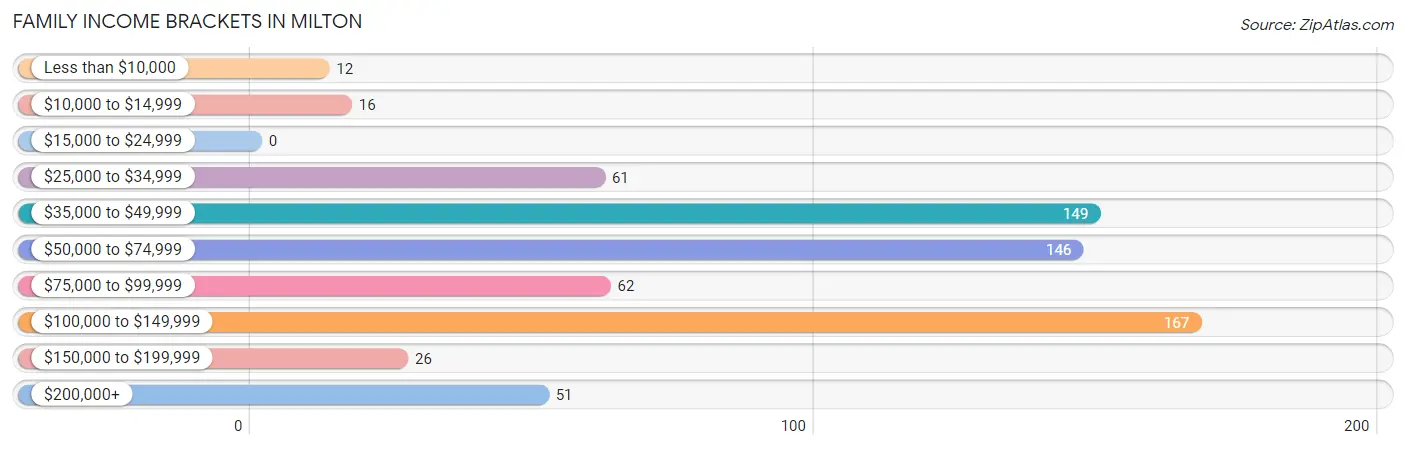
| Income Bracket | # Families | % Families |
| Less than $10,000 | 12 | 1.7% |
| $10,000 to $14,999 | 16 | 2.3% |
| $15,000 to $24,999 | 0 | 0.0% |
| $25,000 to $34,999 | 61 | 8.8% |
| $35,000 to $49,999 | 149 | 21.6% |
| $50,000 to $74,999 | 146 | 21.2% |
| $75,000 to $99,999 | 62 | 9.0% |
| $100,000 to $149,999 | 167 | 24.2% |
| $150,000 to $199,999 | 26 | 3.8% |
| $200,000+ | 51 | 7.4% |
Family Income by Famaliy Size in Milton
3-person families (230 | 33.3%) account for the highest median family income in Milton with $106,964 per family, while 3-person families (230 | 33.3%) have the highest median income of $35,655 per family member.
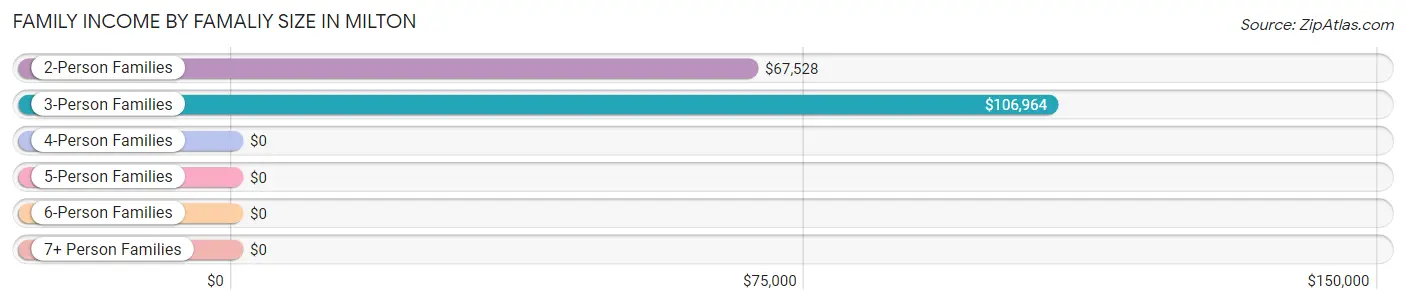
| Income Bracket | # Families | Median Income |
| 2-Person Families | 325 (47.1%) | $67,528 |
| 3-Person Families | 230 (33.3%) | $106,964 |
| 4-Person Families | 108 (15.7%) | $0 |
| 5-Person Families | 27 (3.9%) | $0 |
| 6-Person Families | 0 (0.0%) | $0 |
| 7+ Person Families | 0 (0.0%) | $0 |
| Total | 690 (100.0%) | $69,333 |
Family Income by Number of Earners in Milton
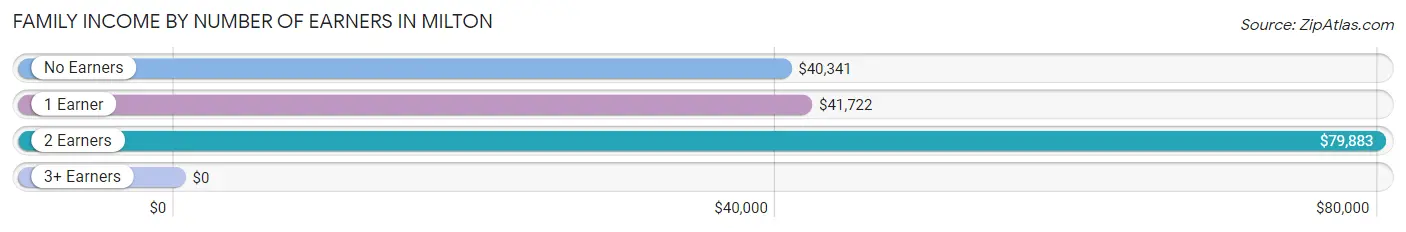
| Number of Earners | # Families | Median Income |
| No Earners | 108 (15.7%) | $40,341 |
| 1 Earner | 200 (29.0%) | $41,722 |
| 2 Earners | 353 (51.2%) | $79,883 |
| 3+ Earners | 29 (4.2%) | $0 |
| Total | 690 (100.0%) | $69,333 |
Household Income in Milton
Household Income Brackets in Milton
With 217 households falling in the category, the $35,000 to $49,999 income range is the most frequent in Milton, accounting for 17.0% of all households. In contrast, only 17 households (1.3%) fall into the $10,000 to $14,999 income bracket, making it the least populous group.
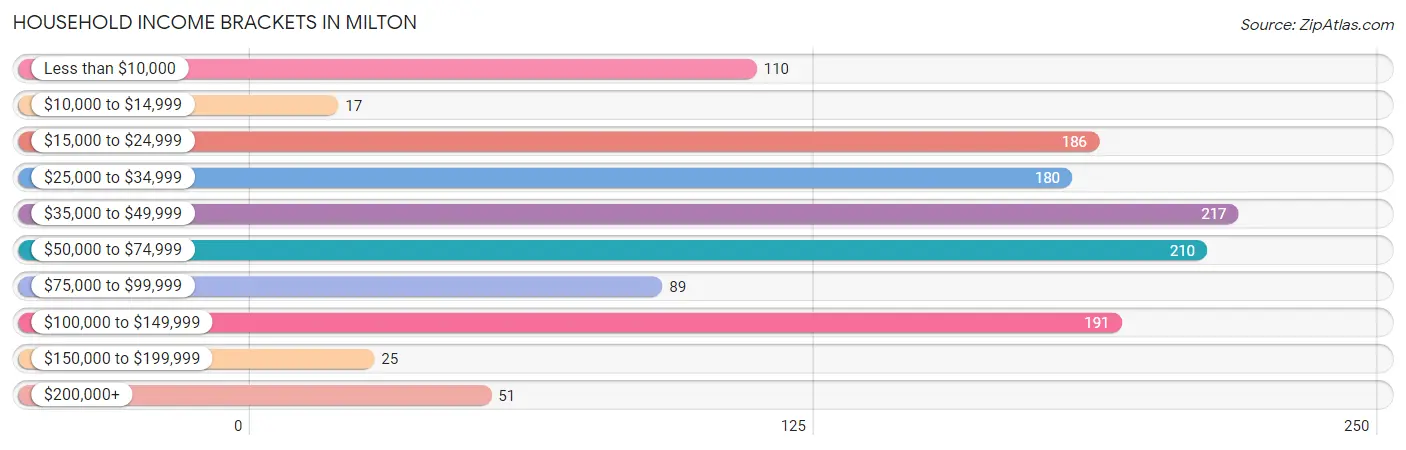
| Income Bracket | # Households | % Households |
| Less than $10,000 | 110 | 8.6% |
| $10,000 to $14,999 | 17 | 1.3% |
| $15,000 to $24,999 | 186 | 14.6% |
| $25,000 to $34,999 | 180 | 14.1% |
| $35,000 to $49,999 | 217 | 17.0% |
| $50,000 to $74,999 | 210 | 16.5% |
| $75,000 to $99,999 | 89 | 7.0% |
| $100,000 to $149,999 | 191 | 15.0% |
| $150,000 to $199,999 | 25 | 2.0% |
| $200,000+ | 51 | 4.0% |
Household Income by Householder Age in Milton
The median household income in Milton is $42,857, with the highest median household income of $62,135 found in the 45 to 64 years age bracket for the primary householder. A total of 483 households (37.9%) fall into this category. Meanwhile, the 15 to 24 years age bracket for the primary householder has the lowest median household income of $0, with 27 households (2.1%) in this group.
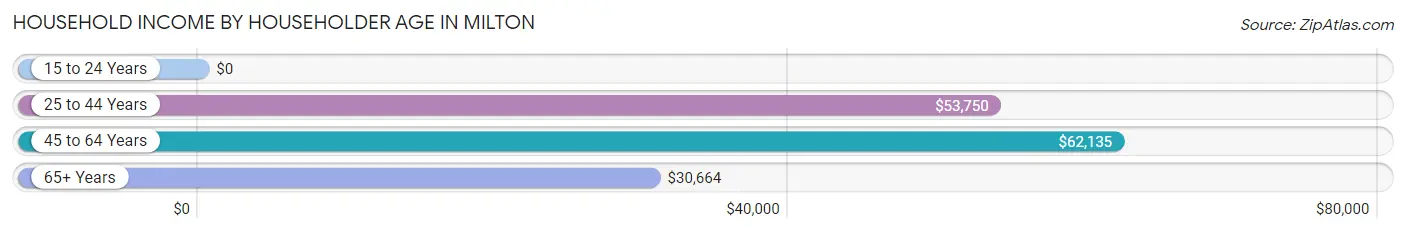
| Income Bracket | # Households | Median Income |
| 15 to 24 Years | 27 (2.1%) | $0 |
| 25 to 44 Years | 341 (26.8%) | $53,750 |
| 45 to 64 Years | 483 (37.9%) | $62,135 |
| 65+ Years | 423 (33.2%) | $30,664 |
| Total | 1,274 (100.0%) | $42,857 |
Poverty in Milton
Income Below Poverty by Sex and Age in Milton
With 5.5% poverty level for males and 10.0% for females among the residents of Milton, 15 year old males and 6 to 11 year old females are the most vulnerable to poverty, with 14 males (43.8%) and 18 females (45.0%) in their respective age groups living below the poverty level.
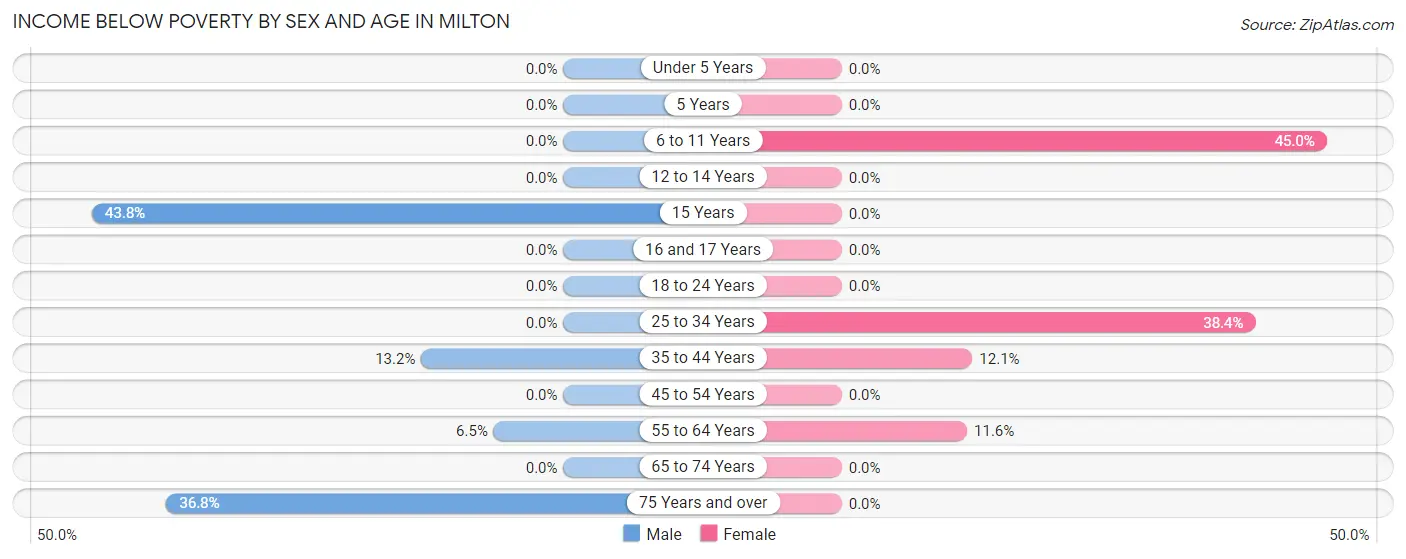
| Age Bracket | Male | Female |
| Under 5 Years | 0 (0.0%) | 0 (0.0%) |
| 5 Years | 0 (0.0%) | 0 (0.0%) |
| 6 to 11 Years | 0 (0.0%) | 18 (45.0%) |
| 12 to 14 Years | 0 (0.0%) | 0 (0.0%) |
| 15 Years | 14 (43.8%) | 0 (0.0%) |
| 16 and 17 Years | 0 (0.0%) | 0 (0.0%) |
| 18 to 24 Years | 0 (0.0%) | 0 (0.0%) |
| 25 to 34 Years | 0 (0.0%) | 104 (38.4%) |
| 35 to 44 Years | 12 (13.2%) | 12 (12.1%) |
| 45 to 54 Years | 0 (0.0%) | 0 (0.0%) |
| 55 to 64 Years | 21 (6.5%) | 20 (11.6%) |
| 65 to 74 Years | 0 (0.0%) | 0 (0.0%) |
| 75 Years and over | 21 (36.8%) | 0 (0.0%) |
| Total | 68 (5.5%) | 154 (10.0%) |
Income Above Poverty by Sex and Age in Milton
According to the poverty statistics in Milton, males aged under 5 years and females aged under 5 years are the age groups that are most secure financially, with 100.0% of males and 100.0% of females in these age groups living above the poverty line.
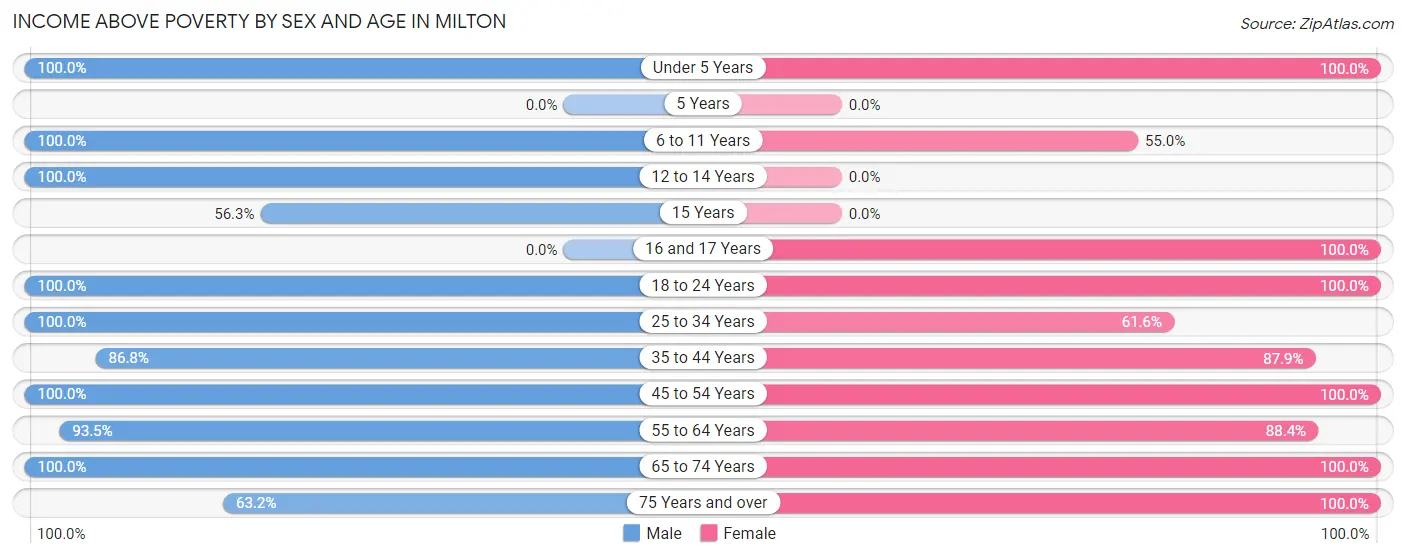
| Age Bracket | Male | Female |
| Under 5 Years | 191 (100.0%) | 217 (100.0%) |
| 5 Years | 0 (0.0%) | 0 (0.0%) |
| 6 to 11 Years | 86 (100.0%) | 22 (55.0%) |
| 12 to 14 Years | 14 (100.0%) | 0 (0.0%) |
| 15 Years | 18 (56.2%) | 0 (0.0%) |
| 16 and 17 Years | 0 (0.0%) | 116 (100.0%) |
| 18 to 24 Years | 105 (100.0%) | 55 (100.0%) |
| 25 to 34 Years | 131 (100.0%) | 167 (61.6%) |
| 35 to 44 Years | 79 (86.8%) | 87 (87.9%) |
| 45 to 54 Years | 136 (100.0%) | 182 (100.0%) |
| 55 to 64 Years | 304 (93.5%) | 152 (88.4%) |
| 65 to 74 Years | 65 (100.0%) | 132 (100.0%) |
| 75 Years and over | 36 (63.2%) | 256 (100.0%) |
| Total | 1,165 (94.5%) | 1,386 (90.0%) |
Income Below Poverty Among Married-Couple Families in Milton

| Children | Above Poverty | Below Poverty |
| No Children | 291 (100.0%) | 0 (0.0%) |
| 1 or 2 Children | 229 (100.0%) | 0 (0.0%) |
| 3 or 4 Children | 27 (100.0%) | 0 (0.0%) |
| 5 or more Children | 0 (0.0%) | 0 (0.0%) |
| Total | 547 (100.0%) | 0 (0.0%) |
Income Below Poverty Among Single-Parent Households in Milton
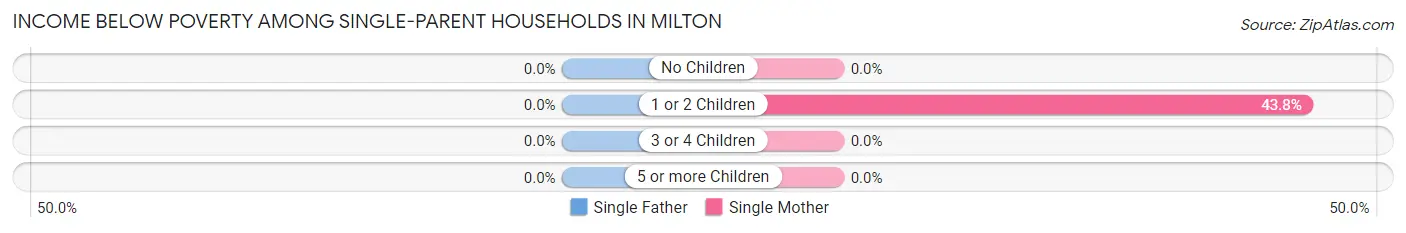
| Children | Single Father | Single Mother |
| No Children | 0 (0.0%) | 0 (0.0%) |
| 1 or 2 Children | 0 (0.0%) | 28 (43.8%) |
| 3 or 4 Children | 0 (0.0%) | 0 (0.0%) |
| 5 or more Children | 0 (0.0%) | 0 (0.0%) |
| Total | 0 (0.0%) | 28 (43.8%) |
Income Below Poverty Among Married-Couple vs Single-Parent Households in Milton
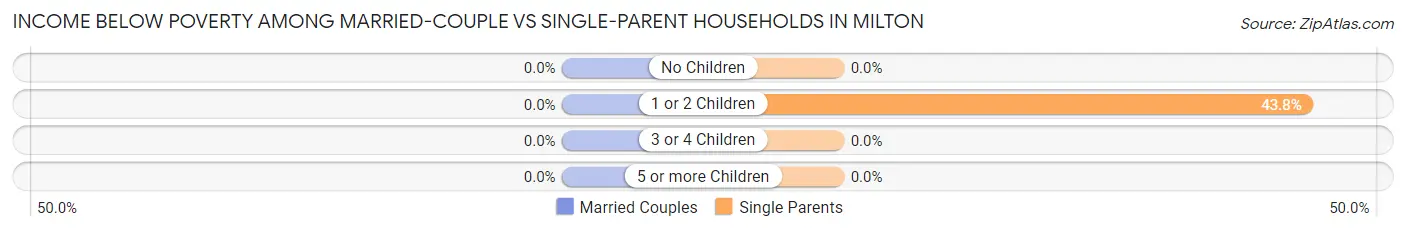
| Children | Married-Couple Families | Single-Parent Households |
| No Children | 0 (0.0%) | 0 (0.0%) |
| 1 or 2 Children | 0 (0.0%) | 28 (43.8%) |
| 3 or 4 Children | 0 (0.0%) | 0 (0.0%) |
| 5 or more Children | 0 (0.0%) | 0 (0.0%) |
| Total | 0 (0.0%) | 28 (19.6%) |
Race in Milton
The most populous races in Milton are White / Caucasian (2,766 | 99.8%), and Two or more Races (7 | 0.3%).
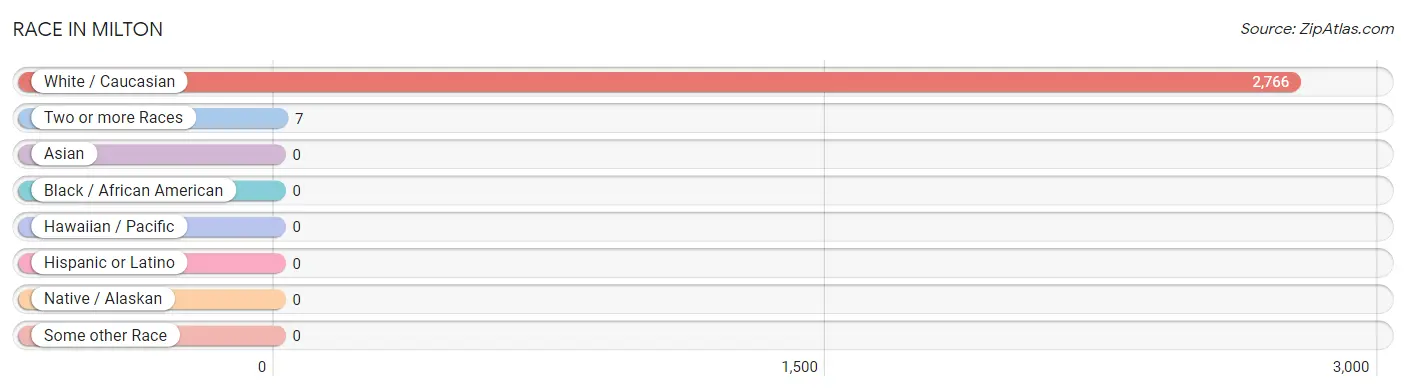
| Race | # Population | % Population |
| Asian | 0 | 0.0% |
| Black / African American | 0 | 0.0% |
| Hawaiian / Pacific | 0 | 0.0% |
| Hispanic or Latino | 0 | 0.0% |
| Native / Alaskan | 0 | 0.0% |
| White / Caucasian | 2,766 | 99.8% |
| Two or more Races | 7 | 0.3% |
| Some other Race | 0 | 0.0% |
| Total | 2,773 | 100.0% |
Ancestry in Milton
The most populous ancestries reported in Milton are American (756 | 27.3%), Irish (460 | 16.6%), German (379 | 13.7%), English (362 | 13.1%), and Scotch-Irish (91 | 3.3%), together accounting for 73.9% of all Milton residents.
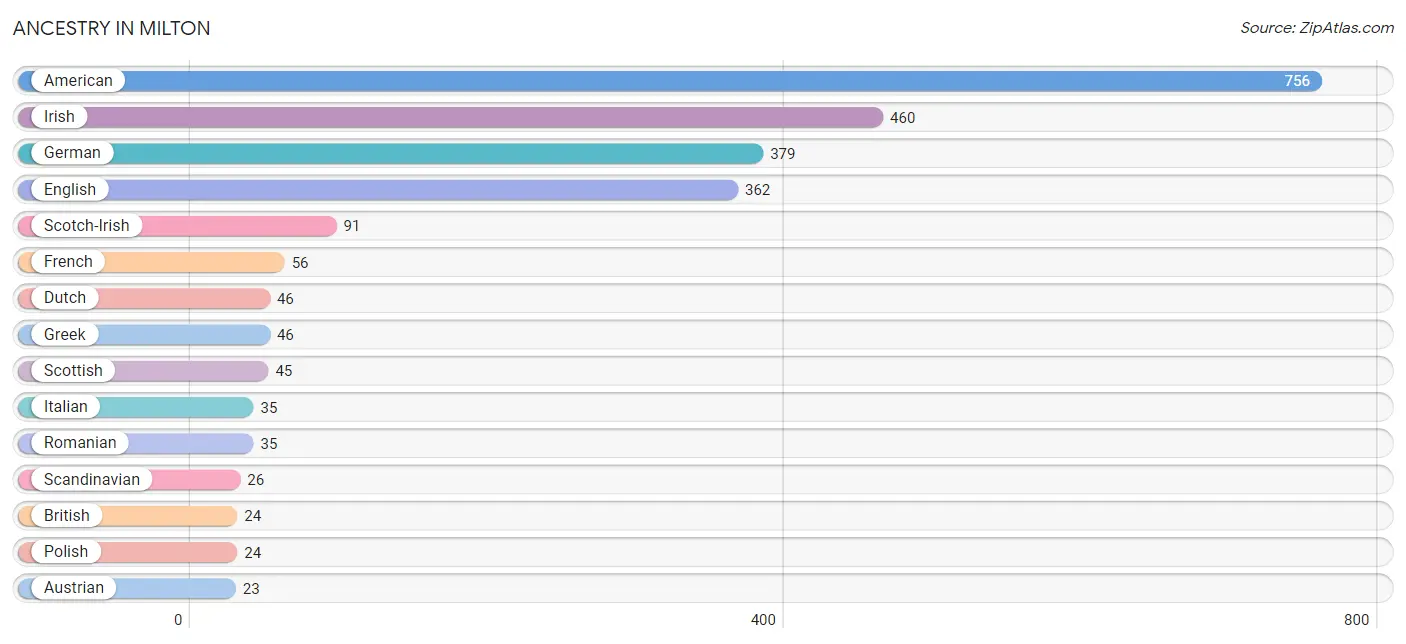
| Ancestry | # Population | % Population |
| American | 756 | 27.3% |
| Austrian | 23 | 0.8% |
| Blackfeet | 4 | 0.1% |
| British | 24 | 0.9% |
| Dutch | 46 | 1.7% |
| English | 362 | 13.1% |
| French | 56 | 2.0% |
| German | 379 | 13.7% |
| Greek | 46 | 1.7% |
| Irish | 460 | 16.6% |
| Italian | 35 | 1.3% |
| Polish | 24 | 0.9% |
| Portuguese | 19 | 0.7% |
| Romanian | 35 | 1.3% |
| Scandinavian | 26 | 0.9% |
| Scotch-Irish | 91 | 3.3% |
| Scottish | 45 | 1.6% |
| Slovak | 23 | 0.8% |
| Welsh | 15 | 0.5% | View All 19 Rows |
Immigrants in Milton

| Immigration Origin | # Population | % Population | View All 0 Rows |
Sex and Age in Milton
Sex and Age in Milton
The most populous age groups in Milton are Under 5 Years (191 | 15.5%) for men and Under 5 Years (217 | 14.1%) for women.
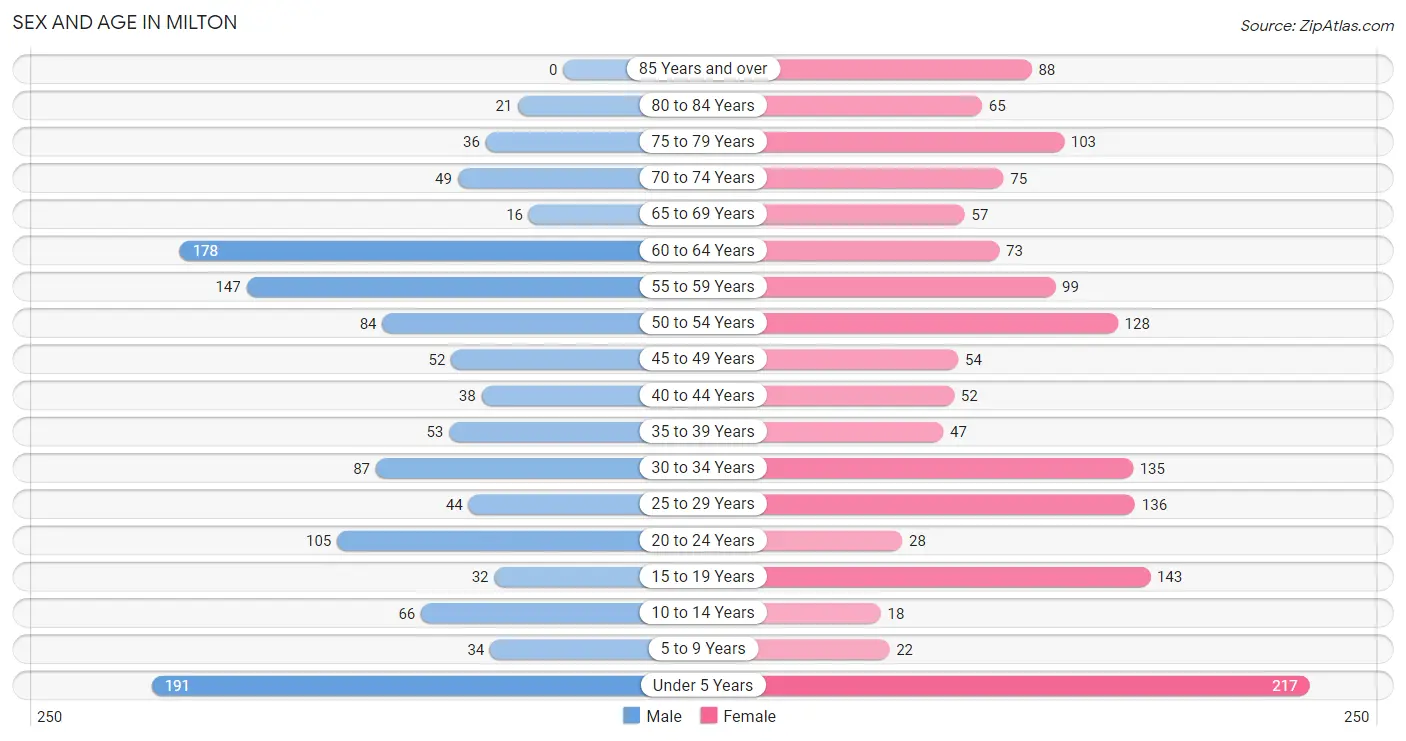
| Age Bracket | Male | Female |
| Under 5 Years | 191 (15.5%) | 217 (14.1%) |
| 5 to 9 Years | 34 (2.8%) | 22 (1.4%) |
| 10 to 14 Years | 66 (5.3%) | 18 (1.2%) |
| 15 to 19 Years | 32 (2.6%) | 143 (9.3%) |
| 20 to 24 Years | 105 (8.5%) | 28 (1.8%) |
| 25 to 29 Years | 44 (3.6%) | 136 (8.8%) |
| 30 to 34 Years | 87 (7.1%) | 135 (8.8%) |
| 35 to 39 Years | 53 (4.3%) | 47 (3.0%) |
| 40 to 44 Years | 38 (3.1%) | 52 (3.4%) |
| 45 to 49 Years | 52 (4.2%) | 54 (3.5%) |
| 50 to 54 Years | 84 (6.8%) | 128 (8.3%) |
| 55 to 59 Years | 147 (11.9%) | 99 (6.4%) |
| 60 to 64 Years | 178 (14.4%) | 73 (4.7%) |
| 65 to 69 Years | 16 (1.3%) | 57 (3.7%) |
| 70 to 74 Years | 49 (4.0%) | 75 (4.9%) |
| 75 to 79 Years | 36 (2.9%) | 103 (6.7%) |
| 80 to 84 Years | 21 (1.7%) | 65 (4.2%) |
| 85 Years and over | 0 (0.0%) | 88 (5.7%) |
| Total | 1,233 (100.0%) | 1,540 (100.0%) |
Families and Households in Milton
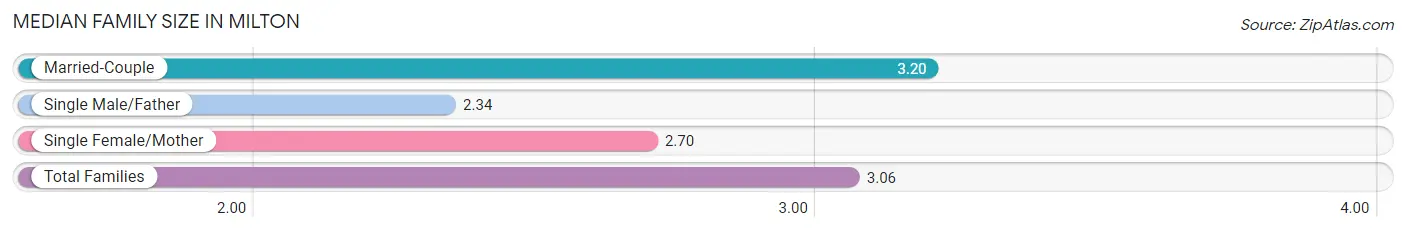
Median Family Size in Milton
The median family size in Milton is 3.06 persons per family, with married-couple families (547 | 79.3%) accounting for the largest median family size of 3.2 persons per family. On the other hand, single male/father families (79 | 11.5%) represent the smallest median family size with 2.34 persons per family.
| Family Type | # Families | Family Size |
| Married-Couple | 547 (79.3%) | 3.20 |
| Single Male/Father | 79 (11.5%) | 2.34 |
| Single Female/Mother | 64 (9.3%) | 2.70 |
| Total Families | 690 (100.0%) | 3.06 |
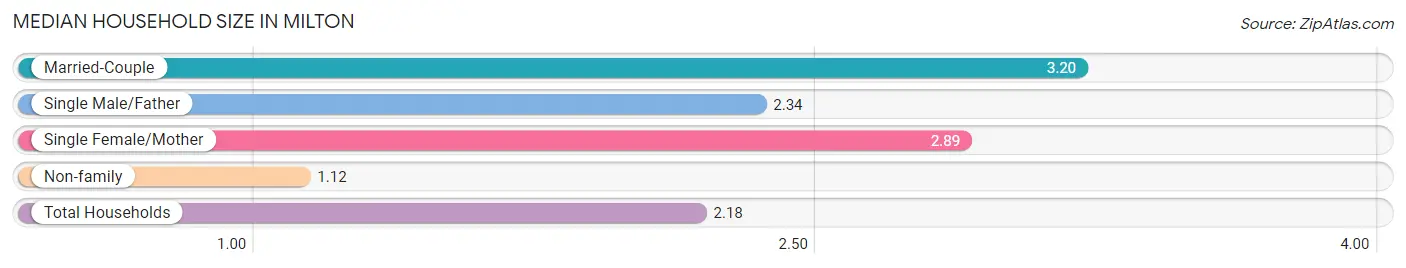
Median Household Size in Milton
The median household size in Milton is 2.18 persons per household, with married-couple households (547 | 42.9%) accounting for the largest median household size of 3.2 persons per household. non-family households (584 | 45.8%) represent the smallest median household size with 1.12 persons per household.
| Household Type | # Households | Household Size |
| Married-Couple | 547 (42.9%) | 3.20 |
| Single Male/Father | 79 (6.2%) | 2.34 |
| Single Female/Mother | 64 (5.0%) | 2.89 |
| Non-family | 584 (45.8%) | 1.12 |
| Total Households | 1,274 (100.0%) | 2.18 |
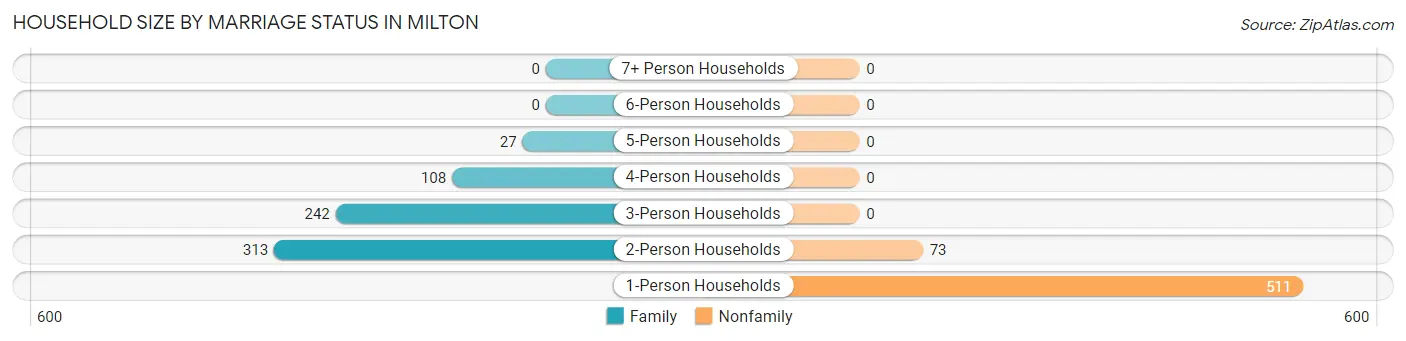
Household Size by Marriage Status in Milton
Out of a total of 1,274 households in Milton, 690 (54.2%) are family households, while 584 (45.8%) are nonfamily households. The most numerous type of family households are 2-person households, comprising 313, and the most common type of nonfamily households are 1-person households, comprising 511.
| Household Size | Family Households | Nonfamily Households |
| 1-Person Households | - | 511 (40.1%) |
| 2-Person Households | 313 (24.6%) | 73 (5.7%) |
| 3-Person Households | 242 (19.0%) | 0 (0.0%) |
| 4-Person Households | 108 (8.5%) | 0 (0.0%) |
| 5-Person Households | 27 (2.1%) | 0 (0.0%) |
| 6-Person Households | 0 (0.0%) | 0 (0.0%) |
| 7+ Person Households | 0 (0.0%) | 0 (0.0%) |
| Total | 690 (54.2%) | 584 (45.8%) |
Female Fertility in Milton
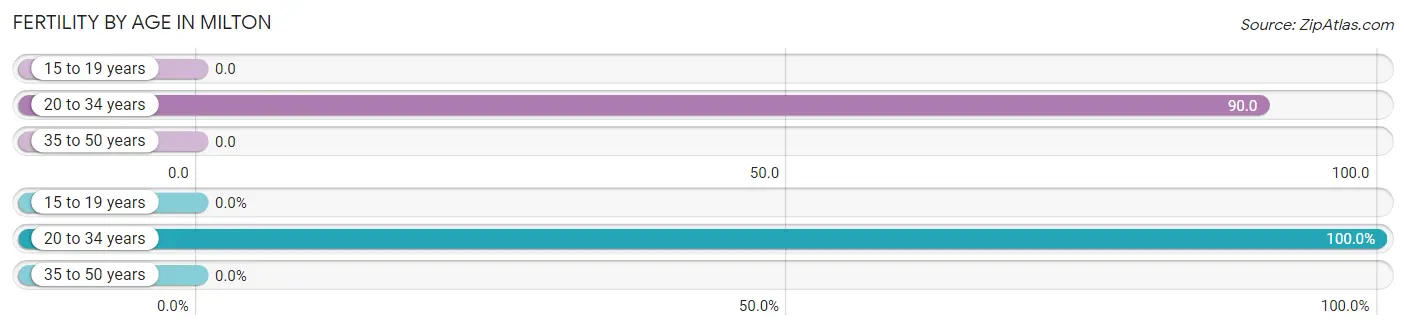
Fertility by Age in Milton
Average fertility rate in Milton is 39.0 births per 1,000 women. Women in the age bracket of 20 to 34 years have the highest fertility rate with 90.0 births per 1,000 women. Women in the age bracket of 20 to 34 years acount for 100.0% of all women with births.
| Age Bracket | Women with Births | Births / 1,000 Women |
| 15 to 19 years | 0 (0.0%) | 0.0 |
| 20 to 34 years | 27 (100.0%) | 90.0 |
| 35 to 50 years | 0 (0.0%) | 0.0 |
| Total | 27 (100.0%) | 39.0 |
Fertility by Age by Marriage Status in Milton
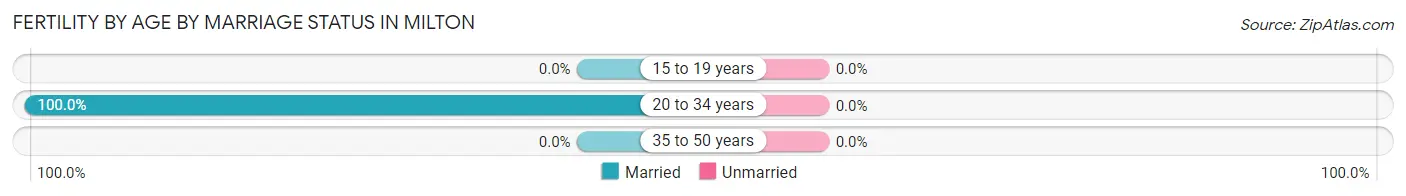
| Age Bracket | Married | Unmarried |
| 15 to 19 years | 0 (0.0%) | 0 (0.0%) |
| 20 to 34 years | 27 (100.0%) | 0 (0.0%) |
| 35 to 50 years | 0 (0.0%) | 0 (0.0%) |
| Total | 27 (100.0%) | 0 (0.0%) |
Fertility by Education in Milton
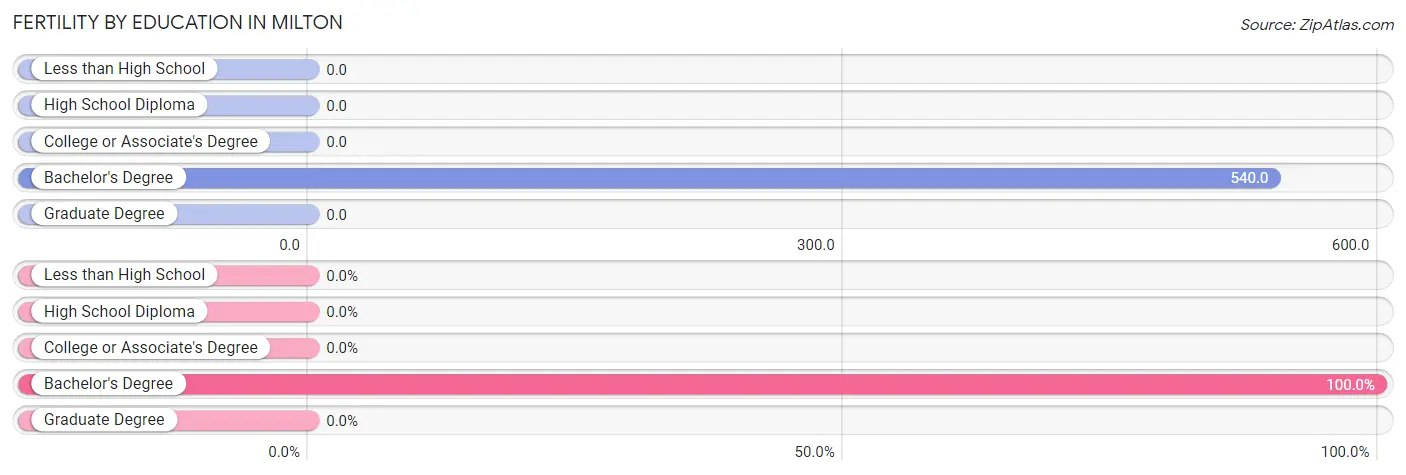
| Educational Attainment | Women with Births | Births / 1,000 Women |
| Less than High School | 0 (0.0%) | 0.0 |
| High School Diploma | 0 (0.0%) | 0.0 |
| College or Associate's Degree | 0 (0.0%) | 0.0 |
| Bachelor's Degree | 27 (100.0%) | 540.0 |
| Graduate Degree | 0 (0.0%) | 0.0 |
| Total | 27 (100.0%) | 39.0 |
Fertility by Education by Marriage Status in Milton
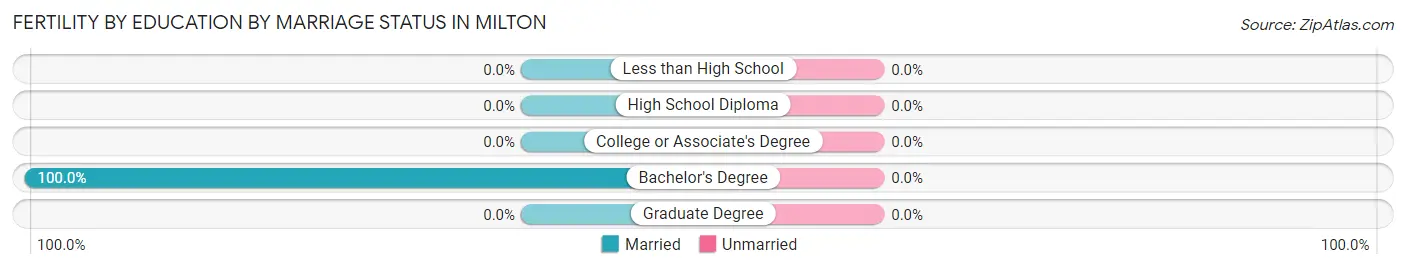
| Educational Attainment | Married | Unmarried |
| Less than High School | 0 (0.0%) | 0 (0.0%) |
| High School Diploma | 0 (0.0%) | 0 (0.0%) |
| College or Associate's Degree | 0 (0.0%) | 0 (0.0%) |
| Bachelor's Degree | 27 (100.0%) | 0 (0.0%) |
| Graduate Degree | 0 (0.0%) | 0 (0.0%) |
| Total | 27 (100.0%) | 0 (0.0%) |
Employment Characteristics in Milton
Employment by Class of Employer in Milton
Among the 1,107 employed individuals in Milton, private company employees (783 | 70.7%), state government employees (142 | 12.8%), and local government employees (80 | 7.2%) make up the most common classes of employment.
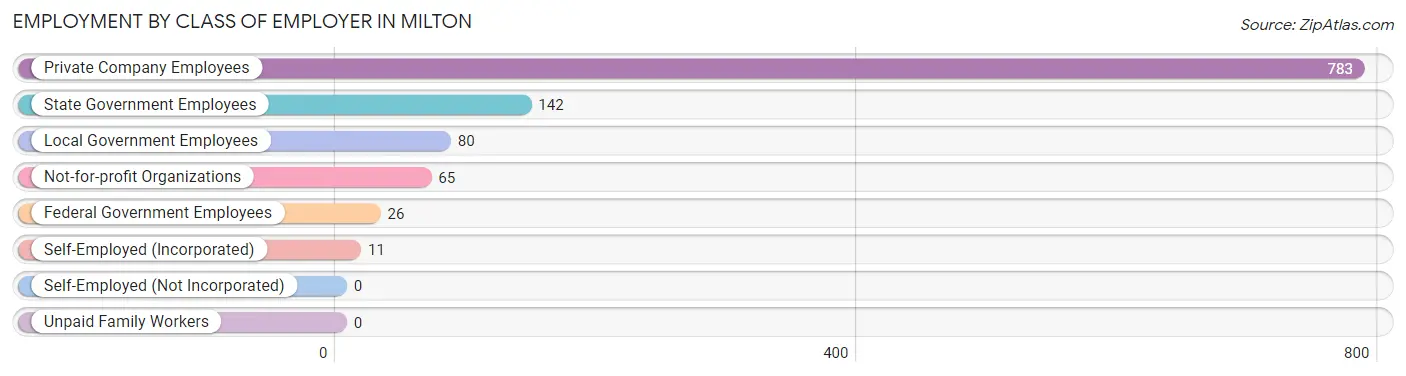
| Employer Class | # Employees | % Employees |
| Private Company Employees | 783 | 70.7% |
| Self-Employed (Incorporated) | 11 | 1.0% |
| Self-Employed (Not Incorporated) | 0 | 0.0% |
| Not-for-profit Organizations | 65 | 5.9% |
| Local Government Employees | 80 | 7.2% |
| State Government Employees | 142 | 12.8% |
| Federal Government Employees | 26 | 2.4% |
| Unpaid Family Workers | 0 | 0.0% |
| Total | 1,107 | 100.0% |
Employment Status by Age in Milton
According to the labor force statistics for Milton, out of the total population over 16 years of age (2,193), 57.2% or 1,254 individuals are in the labor force, with 8.0% or 100 of them unemployed. The age group with the highest labor force participation rate is 20 to 24 years, with 100.0% or 133 individuals in the labor force. Within the labor force, the 25 to 29 years age range has the highest percentage of unemployed individuals, with 48.1% or 77 of them being unemployed.
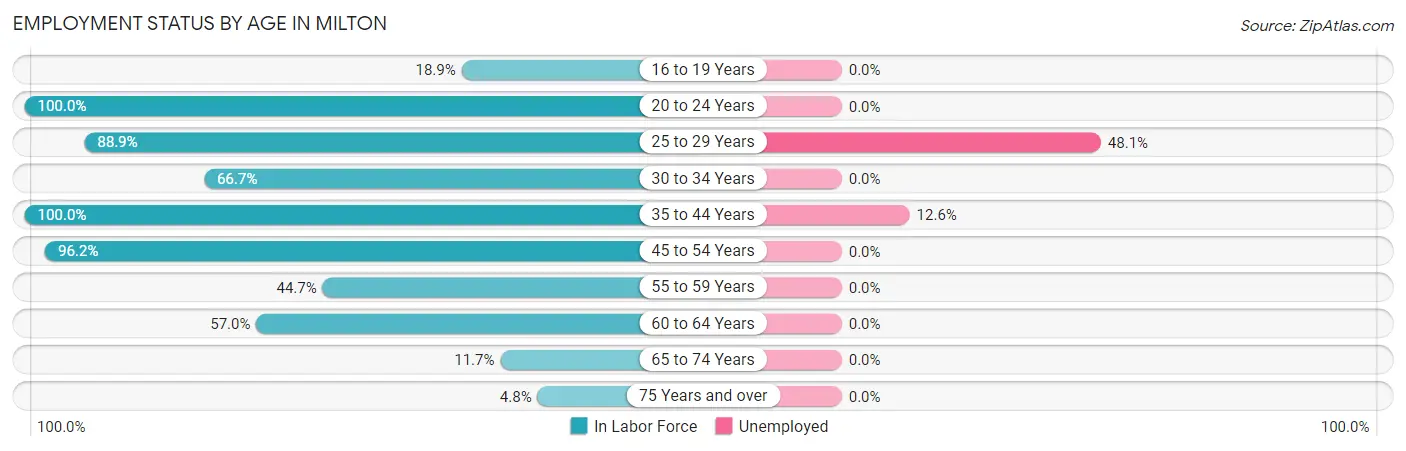
| Age Bracket | In Labor Force | Unemployed |
| 16 to 19 Years | 27 (18.9%) | 0 (0.0%) |
| 20 to 24 Years | 133 (100.0%) | 0 (0.0%) |
| 25 to 29 Years | 160 (88.9%) | 77 (48.1%) |
| 30 to 34 Years | 148 (66.7%) | 0 (0.0%) |
| 35 to 44 Years | 190 (100.0%) | 24 (12.6%) |
| 45 to 54 Years | 306 (96.2%) | 0 (0.0%) |
| 55 to 59 Years | 110 (44.7%) | 0 (0.0%) |
| 60 to 64 Years | 143 (57.0%) | 0 (0.0%) |
| 65 to 74 Years | 23 (11.7%) | 0 (0.0%) |
| 75 Years and over | 15 (4.8%) | 0 (0.0%) |
| Total | 1,254 (57.2%) | 100 (8.0%) |
Employment Status by Educational Attainment in Milton
According to labor force statistics for Milton, 75.1% of individuals (1,057) out of the total population between 25 and 64 years of age (1,407) are in the labor force, with 9.6% or 101 of them being unemployed. The group with the highest labor force participation rate are those with the educational attainment of bachelor's degree or higher, with 99.0% or 310 individuals in the labor force. Within the labor force, individuals with less than high school education have the highest percentage of unemployment, with 50.0% or 24 of them being unemployed.
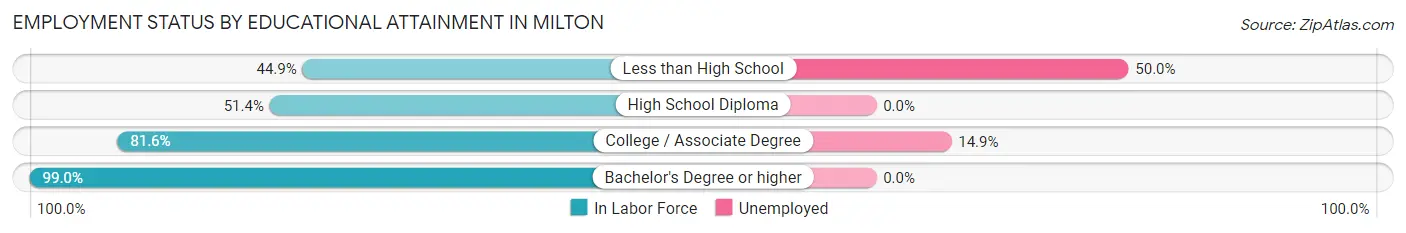
| Educational Attainment | In Labor Force | Unemployed |
| Less than High School | 48 (44.9%) | 54 (50.0%) |
| High School Diploma | 181 (51.4%) | 0 (0.0%) |
| College / Associate Degree | 518 (81.6%) | 95 (14.9%) |
| Bachelor's Degree or higher | 310 (99.0%) | 0 (0.0%) |
| Total | 1,057 (75.1%) | 135 (9.6%) |
Employment Occupations by Sex in Milton
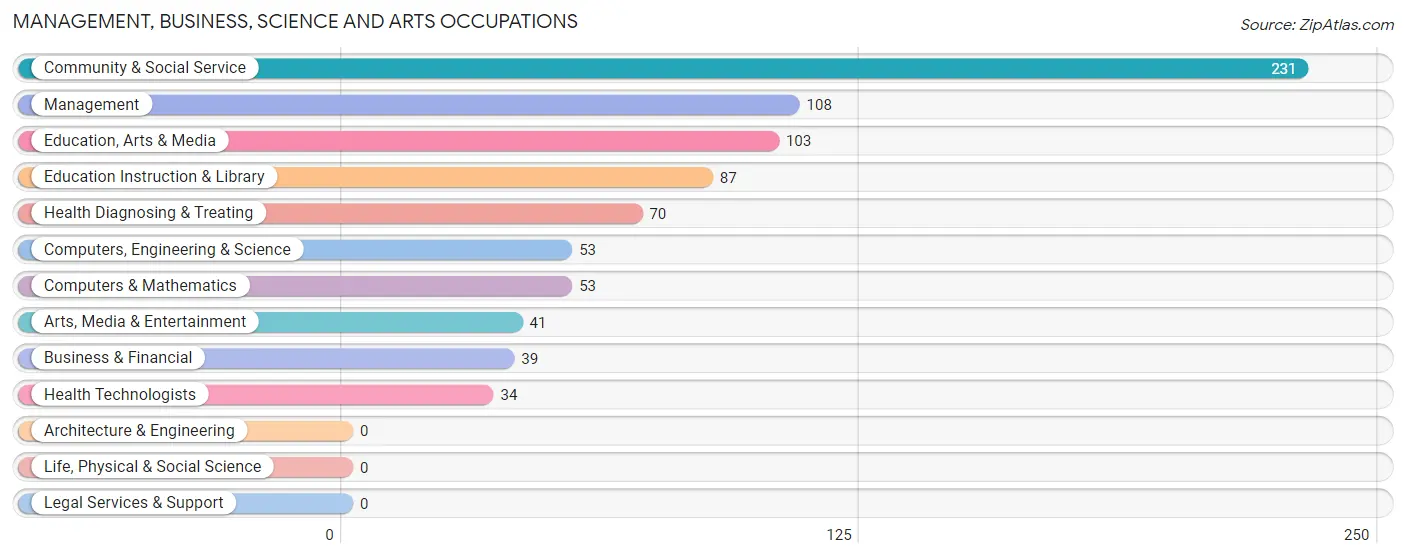
Management, Business, Science and Arts Occupations
The most common Management, Business, Science and Arts occupations in Milton are Community & Social Service (231 | 20.0%), Management (108 | 9.4%), Education, Arts & Media (103 | 8.9%), Education Instruction & Library (87 | 7.5%), and Health Diagnosing & Treating (70 | 6.1%).
Management, Business, Science and Arts Occupations by Sex
Within the Management, Business, Science and Arts occupations in Milton, the most male-oriented occupations are Computers, Engineering & Science (100.0%), Computers & Mathematics (100.0%), and Arts, Media & Entertainment (100.0%), while the most female-oriented occupations are Education Instruction & Library (100.0%), Education, Arts & Media (87.4%), and Health Diagnosing & Treating (84.3%).
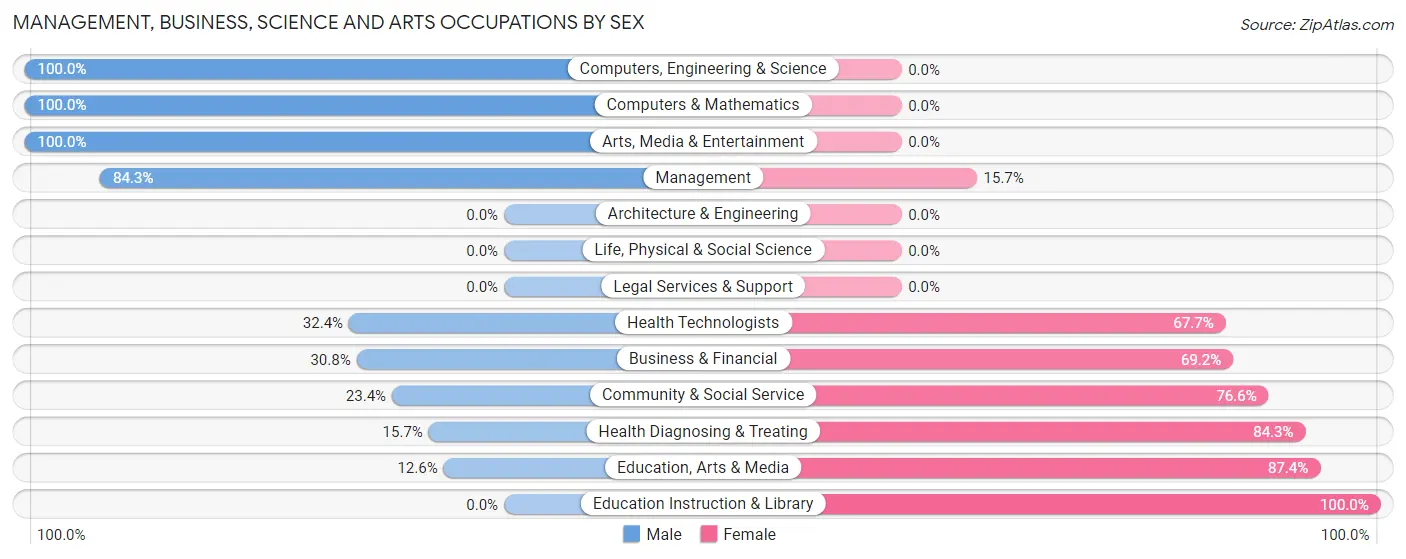
| Occupation | Male | Female |
| Management | 91 (84.3%) | 17 (15.7%) |
| Business & Financial | 12 (30.8%) | 27 (69.2%) |
| Computers, Engineering & Science | 53 (100.0%) | 0 (0.0%) |
| Computers & Mathematics | 53 (100.0%) | 0 (0.0%) |
| Architecture & Engineering | 0 (0.0%) | 0 (0.0%) |
| Life, Physical & Social Science | 0 (0.0%) | 0 (0.0%) |
| Community & Social Service | 54 (23.4%) | 177 (76.6%) |
| Education, Arts & Media | 13 (12.6%) | 90 (87.4%) |
| Legal Services & Support | 0 (0.0%) | 0 (0.0%) |
| Education Instruction & Library | 0 (0.0%) | 87 (100.0%) |
| Arts, Media & Entertainment | 41 (100.0%) | 0 (0.0%) |
| Health Diagnosing & Treating | 11 (15.7%) | 59 (84.3%) |
| Health Technologists | 11 (32.4%) | 23 (67.6%) |
| Total (Category) | 221 (44.1%) | 280 (55.9%) |
| Total (Overall) | 567 (49.1%) | 587 (50.9%) |
Services Occupations
The most common Services occupations in Milton are Healthcare Support (59 | 5.1%), Personal Care & Service (28 | 2.4%), Food Preparation & Serving (26 | 2.2%), Security & Protection (19 | 1.7%), and Firefighting & Prevention (19 | 1.7%).
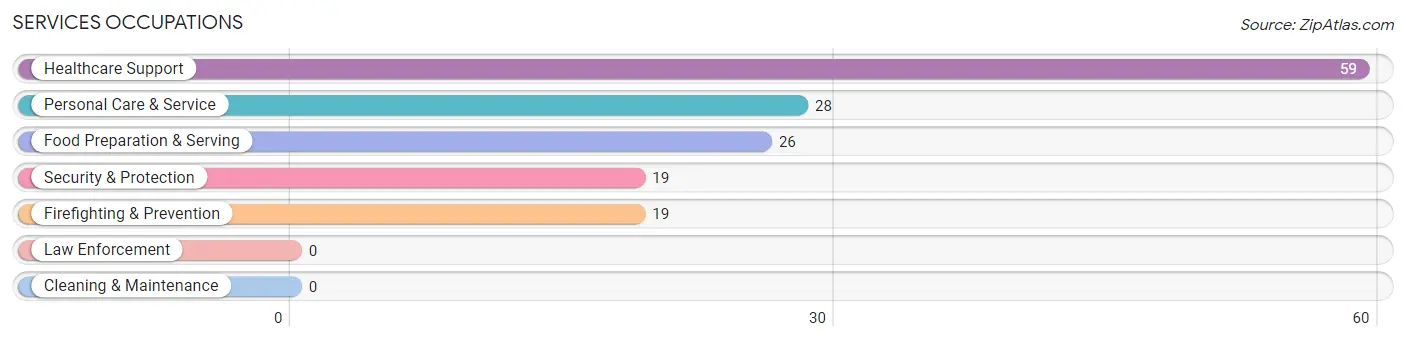
Services Occupations by Sex
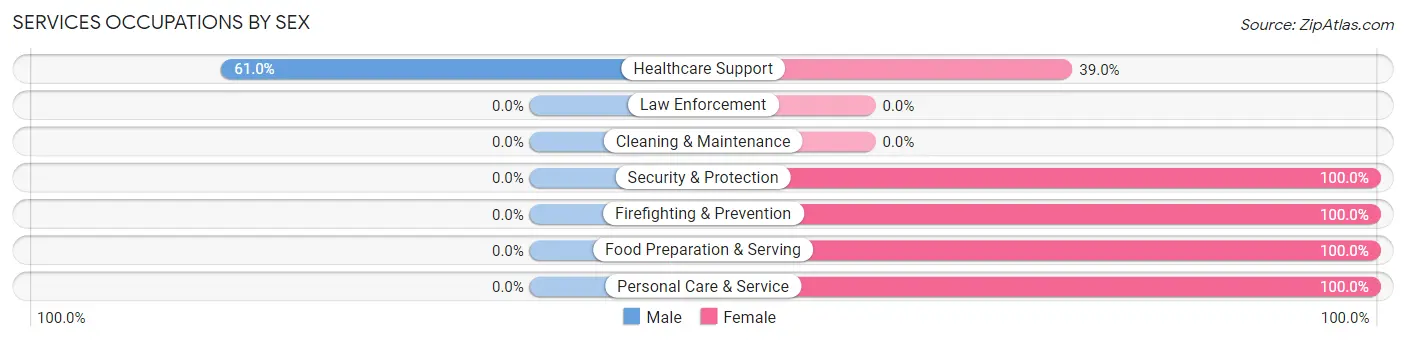
| Occupation | Male | Female |
| Healthcare Support | 36 (61.0%) | 23 (39.0%) |
| Security & Protection | 0 (0.0%) | 19 (100.0%) |
| Firefighting & Prevention | 0 (0.0%) | 19 (100.0%) |
| Law Enforcement | 0 (0.0%) | 0 (0.0%) |
| Food Preparation & Serving | 0 (0.0%) | 26 (100.0%) |
| Cleaning & Maintenance | 0 (0.0%) | 0 (0.0%) |
| Personal Care & Service | 0 (0.0%) | 28 (100.0%) |
| Total (Category) | 36 (27.3%) | 96 (72.7%) |
| Total (Overall) | 567 (49.1%) | 587 (50.9%) |
Sales and Office Occupations
The most common Sales and Office occupations in Milton are Office & Administration (187 | 16.2%), and Sales & Related (147 | 12.7%).
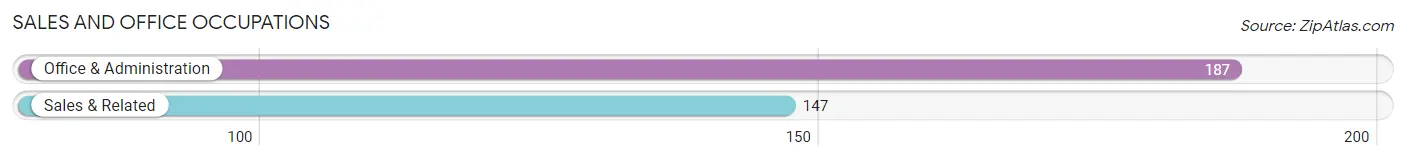
Sales and Office Occupations by Sex
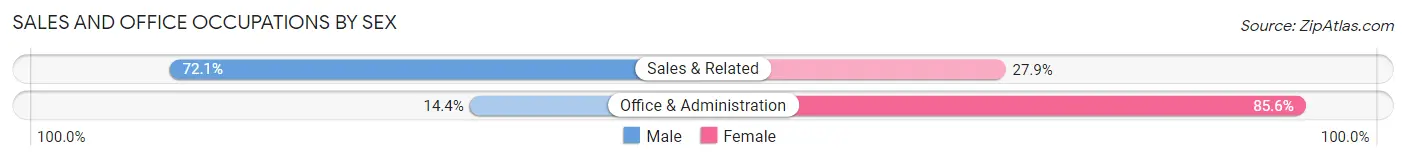
| Occupation | Male | Female |
| Sales & Related | 106 (72.1%) | 41 (27.9%) |
| Office & Administration | 27 (14.4%) | 160 (85.6%) |
| Total (Category) | 133 (39.8%) | 201 (60.2%) |
| Total (Overall) | 567 (49.1%) | 587 (50.9%) |
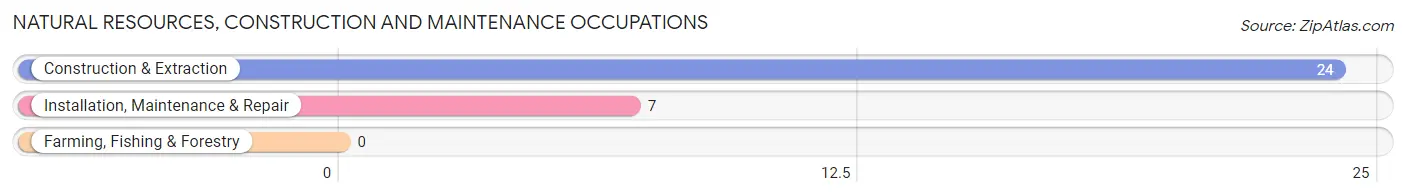
Natural Resources, Construction and Maintenance Occupations
The most common Natural Resources, Construction and Maintenance occupations in Milton are Construction & Extraction (24 | 2.1%), and Installation, Maintenance & Repair (7 | 0.6%).
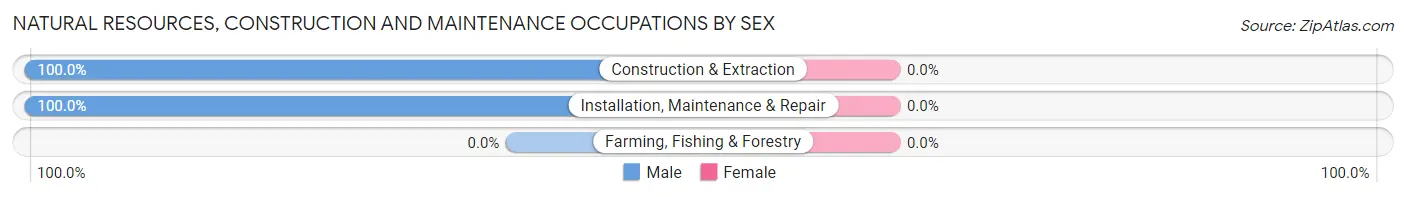
Natural Resources, Construction and Maintenance Occupations by Sex
| Occupation | Male | Female |
| Farming, Fishing & Forestry | 0 (0.0%) | 0 (0.0%) |
| Construction & Extraction | 24 (100.0%) | 0 (0.0%) |
| Installation, Maintenance & Repair | 7 (100.0%) | 0 (0.0%) |
| Total (Category) | 31 (100.0%) | 0 (0.0%) |
| Total (Overall) | 567 (49.1%) | 587 (50.9%) |
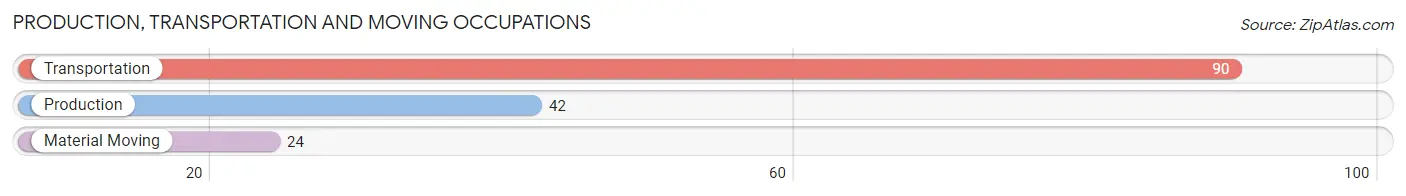
Production, Transportation and Moving Occupations
The most common Production, Transportation and Moving occupations in Milton are Transportation (90 | 7.8%), Production (42 | 3.6%), and Material Moving (24 | 2.1%).
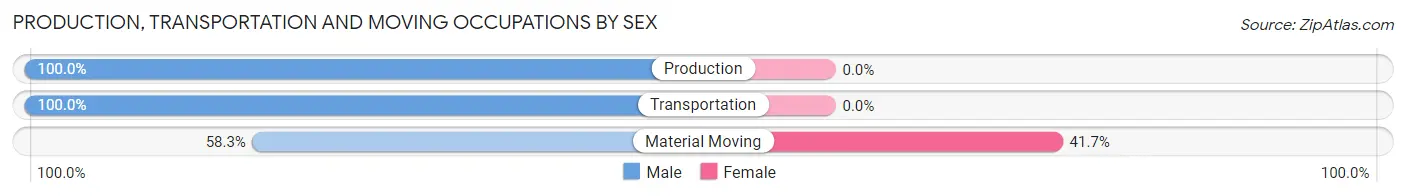
Production, Transportation and Moving Occupations by Sex
| Occupation | Male | Female |
| Production | 42 (100.0%) | 0 (0.0%) |
| Transportation | 90 (100.0%) | 0 (0.0%) |
| Material Moving | 14 (58.3%) | 10 (41.7%) |
| Total (Category) | 146 (93.6%) | 10 (6.4%) |
| Total (Overall) | 567 (49.1%) | 587 (50.9%) |
Employment Industries by Sex in Milton
Employment Industries in Milton
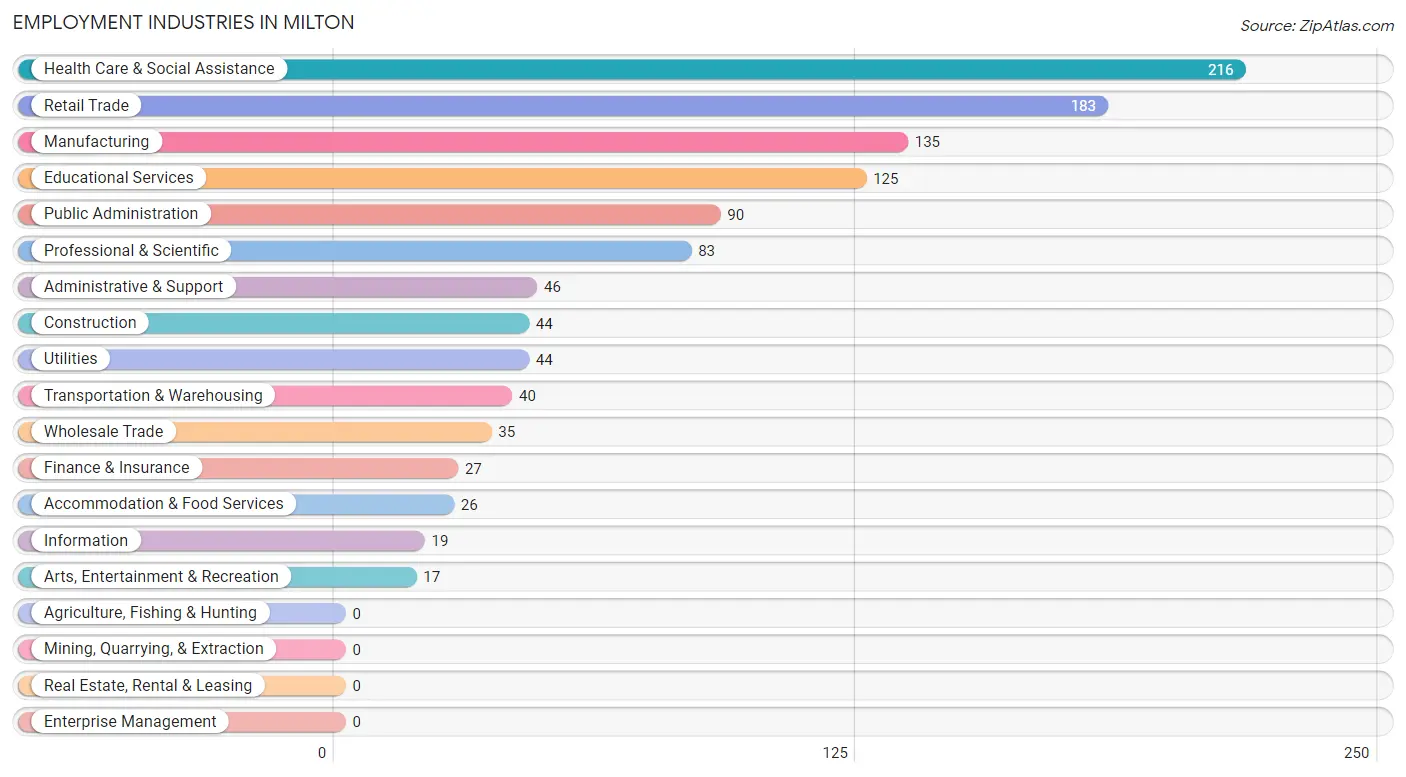
The major employment industries in Milton include Health Care & Social Assistance (216 | 18.7%), Retail Trade (183 | 15.9%), Manufacturing (135 | 11.7%), Educational Services (125 | 10.8%), and Public Administration (90 | 7.8%).
Employment Industries by Sex in Milton
The Milton industries that see more men than women are Transportation & Warehousing (100.0%), Administrative & Support (100.0%), and Construction (86.4%), whereas the industries that tend to have a higher number of women are Information (100.0%), Finance & Insurance (100.0%), and Arts, Entertainment & Recreation (100.0%).
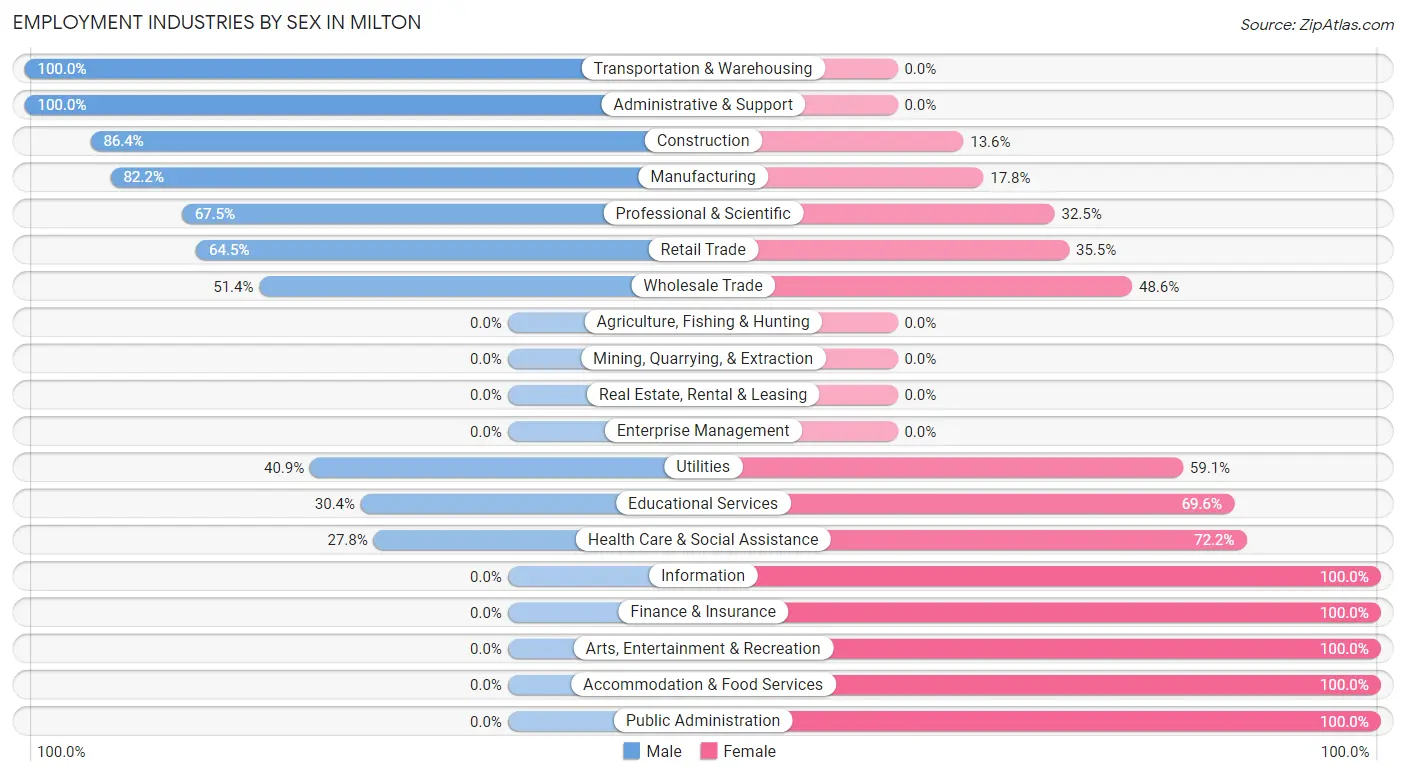
| Industry | Male | Female |
| Agriculture, Fishing & Hunting | 0 (0.0%) | 0 (0.0%) |
| Mining, Quarrying, & Extraction | 0 (0.0%) | 0 (0.0%) |
| Construction | 38 (86.4%) | 6 (13.6%) |
| Manufacturing | 111 (82.2%) | 24 (17.8%) |
| Wholesale Trade | 18 (51.4%) | 17 (48.6%) |
| Retail Trade | 118 (64.5%) | 65 (35.5%) |
| Transportation & Warehousing | 40 (100.0%) | 0 (0.0%) |
| Utilities | 18 (40.9%) | 26 (59.1%) |
| Information | 0 (0.0%) | 19 (100.0%) |
| Finance & Insurance | 0 (0.0%) | 27 (100.0%) |
| Real Estate, Rental & Leasing | 0 (0.0%) | 0 (0.0%) |
| Professional & Scientific | 56 (67.5%) | 27 (32.5%) |
| Enterprise Management | 0 (0.0%) | 0 (0.0%) |
| Administrative & Support | 46 (100.0%) | 0 (0.0%) |
| Educational Services | 38 (30.4%) | 87 (69.6%) |
| Health Care & Social Assistance | 60 (27.8%) | 156 (72.2%) |
| Arts, Entertainment & Recreation | 0 (0.0%) | 17 (100.0%) |
| Accommodation & Food Services | 0 (0.0%) | 26 (100.0%) |
| Public Administration | 0 (0.0%) | 90 (100.0%) |
| Total | 567 (49.1%) | 587 (50.9%) |
Education in Milton
School Enrollment in Milton
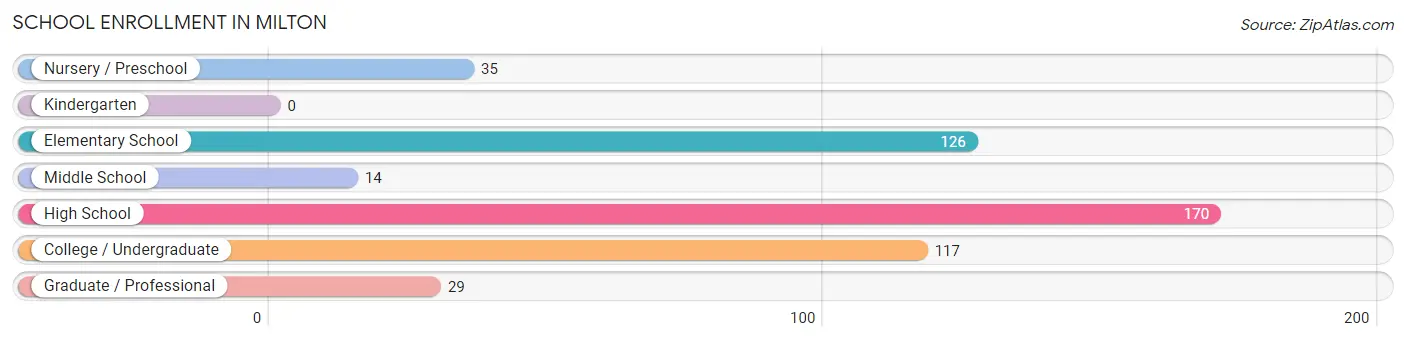
The most common levels of schooling among the 491 students in Milton are high school (170 | 34.6%), elementary school (126 | 25.7%), and college / undergraduate (117 | 23.8%).
| School Level | # Students | % Students |
| Nursery / Preschool | 35 | 7.1% |
| Kindergarten | 0 | 0.0% |
| Elementary School | 126 | 25.7% |
| Middle School | 14 | 2.9% |
| High School | 170 | 34.6% |
| College / Undergraduate | 117 | 23.8% |
| Graduate / Professional | 29 | 5.9% |
| Total | 491 | 100.0% |
School Enrollment by Age by Funding Source in Milton
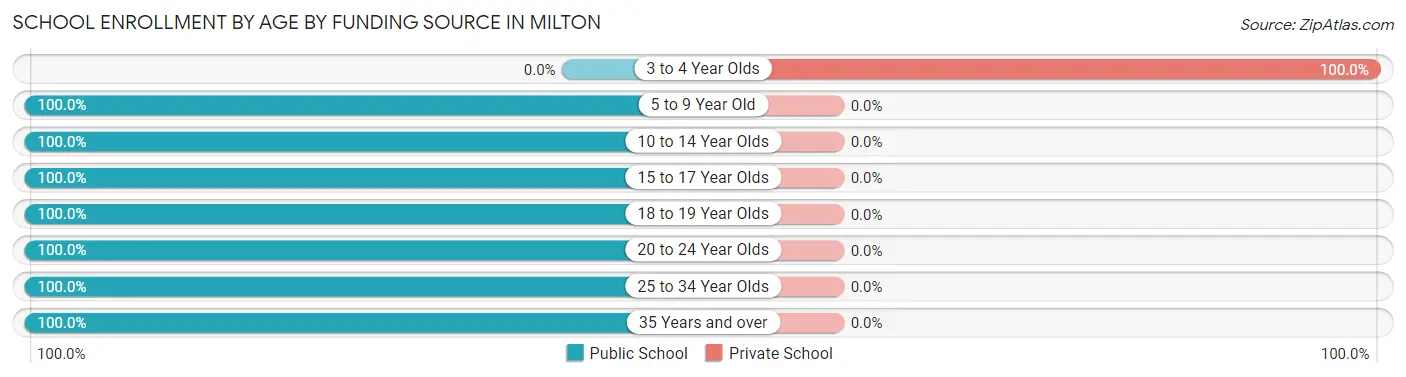
Out of a total of 491 students who are enrolled in schools in Milton, 35 (7.1%) attend a private institution, while the remaining 456 (92.9%) are enrolled in public schools. The age group of 3 to 4 year olds has the highest likelihood of being enrolled in private schools, with 35 (100.0% in the age bracket) enrolled. Conversely, the age group of 5 to 9 year old has the lowest likelihood of being enrolled in a private school, with 56 (100.0% in the age bracket) attending a public institution.
| Age Bracket | Public School | Private School |
| 3 to 4 Year Olds | 0 (0.0%) | 35 (100.0%) |
| 5 to 9 Year Old | 56 (100.0%) | 0 (0.0%) |
| 10 to 14 Year Olds | 84 (100.0%) | 0 (0.0%) |
| 15 to 17 Year Olds | 148 (100.0%) | 0 (0.0%) |
| 18 to 19 Year Olds | 27 (100.0%) | 0 (0.0%) |
| 20 to 24 Year Olds | 78 (100.0%) | 0 (0.0%) |
| 25 to 34 Year Olds | 41 (100.0%) | 0 (0.0%) |
| 35 Years and over | 22 (100.0%) | 0 (0.0%) |
| Total | 456 (92.9%) | 35 (7.1%) |
Educational Attainment by Field of Study in Milton
Education (134 | 36.4%), science & technology (73 | 19.8%), business (71 | 19.3%), arts & humanities (34 | 9.2%), and communications (29 | 7.9%) are the most common fields of study among 368 individuals in Milton who have obtained a bachelor's degree or higher.
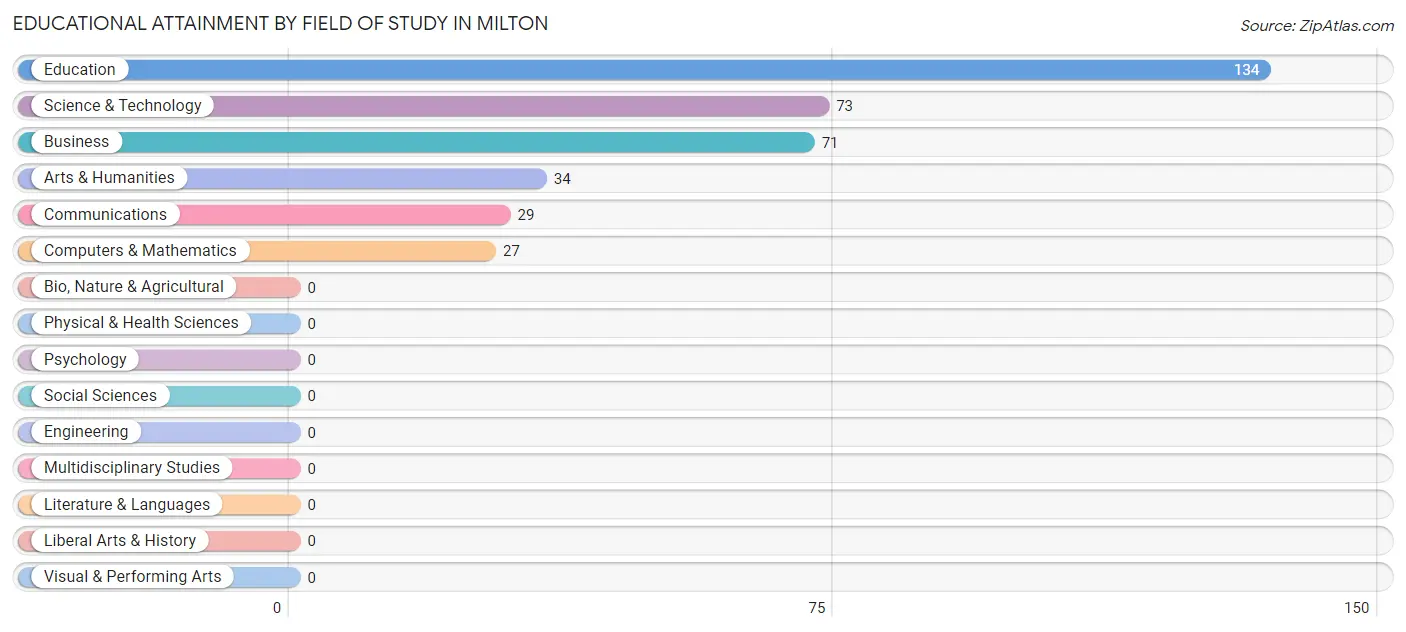
| Field of Study | # Graduates | % Graduates |
| Computers & Mathematics | 27 | 7.3% |
| Bio, Nature & Agricultural | 0 | 0.0% |
| Physical & Health Sciences | 0 | 0.0% |
| Psychology | 0 | 0.0% |
| Social Sciences | 0 | 0.0% |
| Engineering | 0 | 0.0% |
| Multidisciplinary Studies | 0 | 0.0% |
| Science & Technology | 73 | 19.8% |
| Business | 71 | 19.3% |
| Education | 134 | 36.4% |
| Literature & Languages | 0 | 0.0% |
| Liberal Arts & History | 0 | 0.0% |
| Visual & Performing Arts | 0 | 0.0% |
| Communications | 29 | 7.9% |
| Arts & Humanities | 34 | 9.2% |
| Total | 368 | 100.0% |
Transportation & Commute in Milton
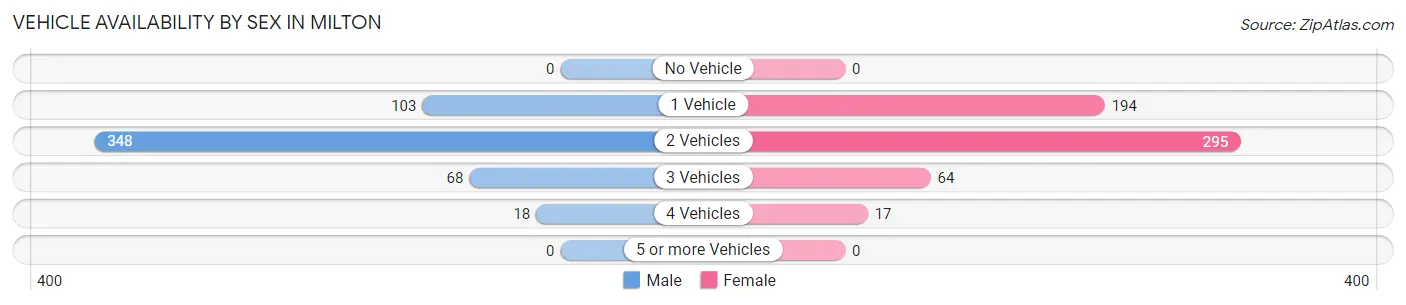
Vehicle Availability by Sex in Milton
The most prevalent vehicle ownership categories in Milton are males with 2 vehicles (348, accounting for 64.8%) and females with 2 vehicles (295, making up 61.1%).
| Vehicles Available | Male | Female |
| No Vehicle | 0 (0.0%) | 0 (0.0%) |
| 1 Vehicle | 103 (19.2%) | 194 (34.0%) |
| 2 Vehicles | 348 (64.8%) | 295 (51.7%) |
| 3 Vehicles | 68 (12.7%) | 64 (11.2%) |
| 4 Vehicles | 18 (3.4%) | 17 (3.0%) |
| 5 or more Vehicles | 0 (0.0%) | 0 (0.0%) |
| Total | 537 (100.0%) | 570 (100.0%) |
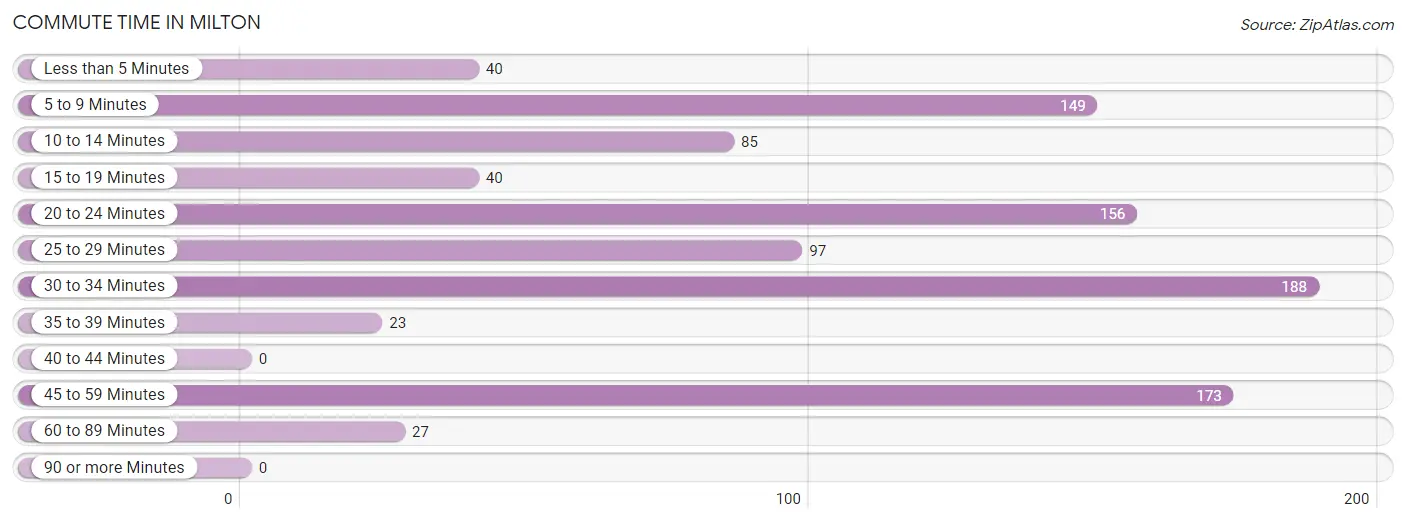
Commute Time in Milton
The most frequently occuring commute durations in Milton are 30 to 34 minutes (188 commuters, 19.2%), 45 to 59 minutes (173 commuters, 17.7%), and 20 to 24 minutes (156 commuters, 16.0%).
| Commute Time | # Commuters | % Commuters |
| Less than 5 Minutes | 40 | 4.1% |
| 5 to 9 Minutes | 149 | 15.2% |
| 10 to 14 Minutes | 85 | 8.7% |
| 15 to 19 Minutes | 40 | 4.1% |
| 20 to 24 Minutes | 156 | 16.0% |
| 25 to 29 Minutes | 97 | 9.9% |
| 30 to 34 Minutes | 188 | 19.2% |
| 35 to 39 Minutes | 23 | 2.4% |
| 40 to 44 Minutes | 0 | 0.0% |
| 45 to 59 Minutes | 173 | 17.7% |
| 60 to 89 Minutes | 27 | 2.8% |
| 90 or more Minutes | 0 | 0.0% |
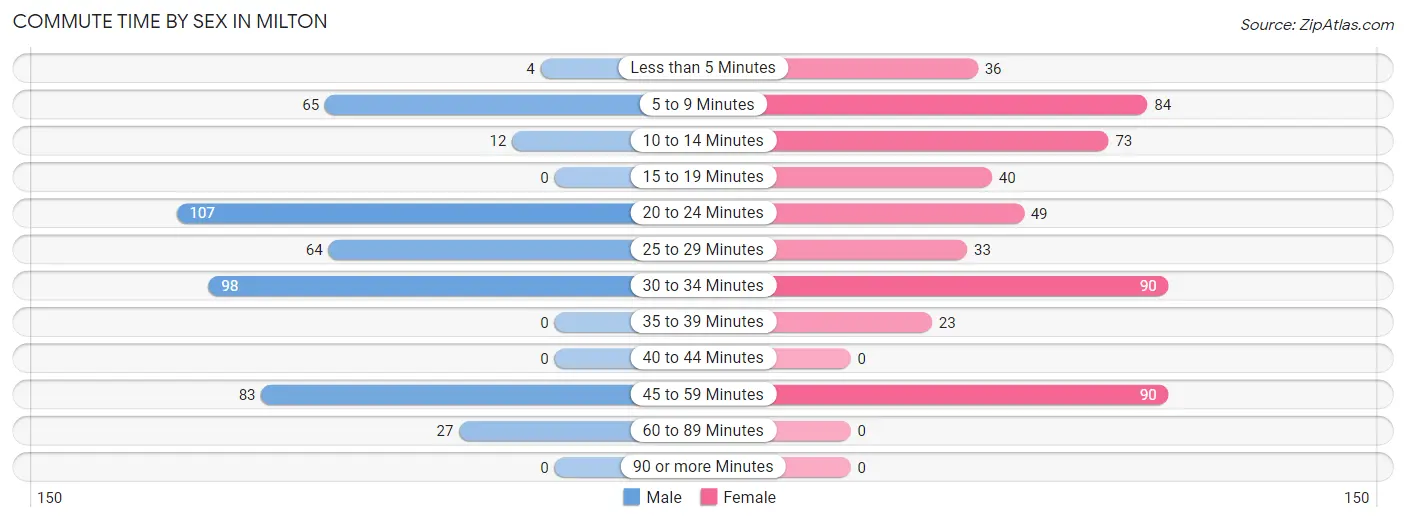
Commute Time by Sex in Milton
The most common commute times in Milton are 20 to 24 minutes (107 commuters, 23.3%) for males and 30 to 34 minutes (90 commuters, 17.4%) for females.
| Commute Time | Male | Female |
| Less than 5 Minutes | 4 (0.9%) | 36 (7.0%) |
| 5 to 9 Minutes | 65 (14.1%) | 84 (16.2%) |
| 10 to 14 Minutes | 12 (2.6%) | 73 (14.1%) |
| 15 to 19 Minutes | 0 (0.0%) | 40 (7.7%) |
| 20 to 24 Minutes | 107 (23.3%) | 49 (9.5%) |
| 25 to 29 Minutes | 64 (13.9%) | 33 (6.4%) |
| 30 to 34 Minutes | 98 (21.3%) | 90 (17.4%) |
| 35 to 39 Minutes | 0 (0.0%) | 23 (4.4%) |
| 40 to 44 Minutes | 0 (0.0%) | 0 (0.0%) |
| 45 to 59 Minutes | 83 (18.0%) | 90 (17.4%) |
| 60 to 89 Minutes | 27 (5.9%) | 0 (0.0%) |
| 90 or more Minutes | 0 (0.0%) | 0 (0.0%) |
Time of Departure to Work by Sex in Milton
The most frequent times of departure to work in Milton are 5:30 AM to 5:59 AM (99, 21.5%) for males and 7:00 AM to 7:29 AM (178, 34.4%) for females.
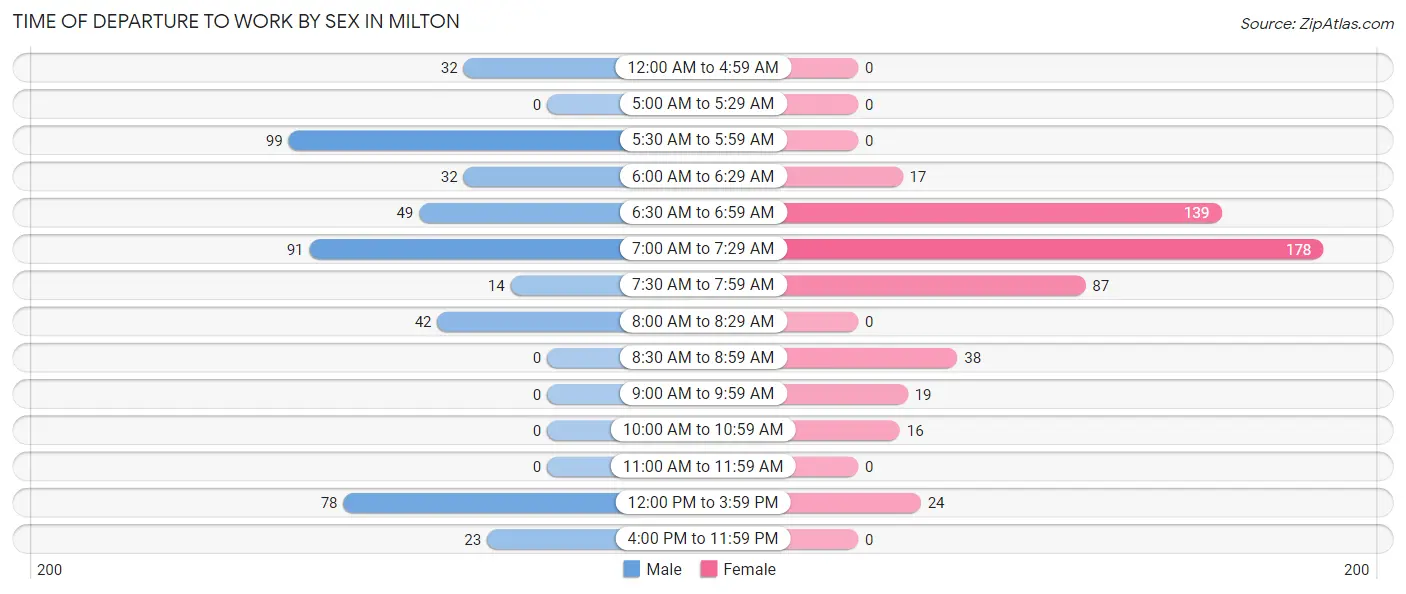
| Time of Departure | Male | Female |
| 12:00 AM to 4:59 AM | 32 (7.0%) | 0 (0.0%) |
| 5:00 AM to 5:29 AM | 0 (0.0%) | 0 (0.0%) |
| 5:30 AM to 5:59 AM | 99 (21.5%) | 0 (0.0%) |
| 6:00 AM to 6:29 AM | 32 (7.0%) | 17 (3.3%) |
| 6:30 AM to 6:59 AM | 49 (10.6%) | 139 (26.8%) |
| 7:00 AM to 7:29 AM | 91 (19.8%) | 178 (34.4%) |
| 7:30 AM to 7:59 AM | 14 (3.0%) | 87 (16.8%) |
| 8:00 AM to 8:29 AM | 42 (9.1%) | 0 (0.0%) |
| 8:30 AM to 8:59 AM | 0 (0.0%) | 38 (7.3%) |
| 9:00 AM to 9:59 AM | 0 (0.0%) | 19 (3.7%) |
| 10:00 AM to 10:59 AM | 0 (0.0%) | 16 (3.1%) |
| 11:00 AM to 11:59 AM | 0 (0.0%) | 0 (0.0%) |
| 12:00 PM to 3:59 PM | 78 (17.0%) | 24 (4.6%) |
| 4:00 PM to 11:59 PM | 23 (5.0%) | 0 (0.0%) |
| Total | 460 (100.0%) | 518 (100.0%) |
Housing Occupancy in Milton
Occupancy by Ownership in Milton
Of the total 1,274 dwellings in Milton, owner-occupied units account for 696 (54.6%), while renter-occupied units make up 578 (45.4%).
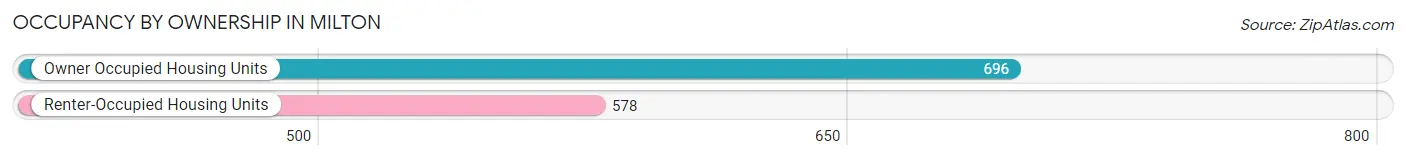
| Occupancy | # Housing Units | % Housing Units |
| Owner Occupied Housing Units | 696 | 54.6% |
| Renter-Occupied Housing Units | 578 | 45.4% |
| Total Occupied Housing Units | 1,274 | 100.0% |
Occupancy by Household Size in Milton
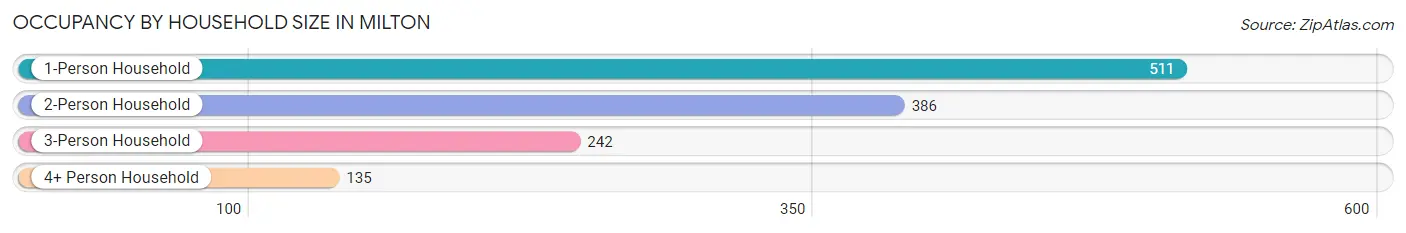
| Household Size | # Housing Units | % Housing Units |
| 1-Person Household | 511 | 40.1% |
| 2-Person Household | 386 | 30.3% |
| 3-Person Household | 242 | 19.0% |
| 4+ Person Household | 135 | 10.6% |
| Total Housing Units | 1,274 | 100.0% |
Occupancy by Ownership by Household Size in Milton
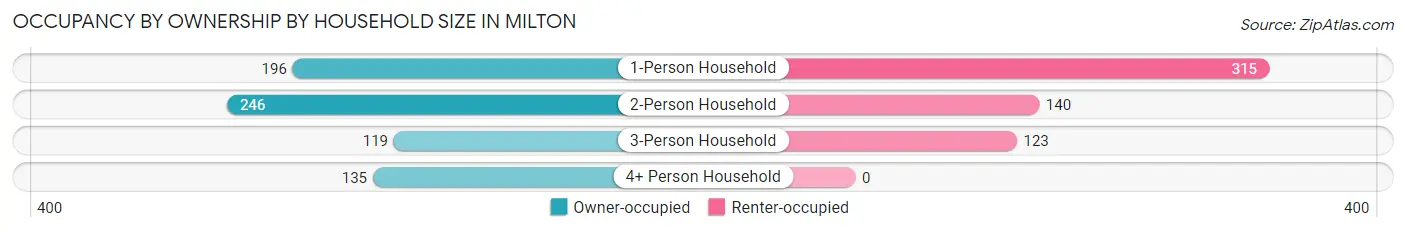
| Household Size | Owner-occupied | Renter-occupied |
| 1-Person Household | 196 (38.4%) | 315 (61.6%) |
| 2-Person Household | 246 (63.7%) | 140 (36.3%) |
| 3-Person Household | 119 (49.2%) | 123 (50.8%) |
| 4+ Person Household | 135 (100.0%) | 0 (0.0%) |
| Total Housing Units | 696 (54.6%) | 578 (45.4%) |
Occupancy by Educational Attainment in Milton
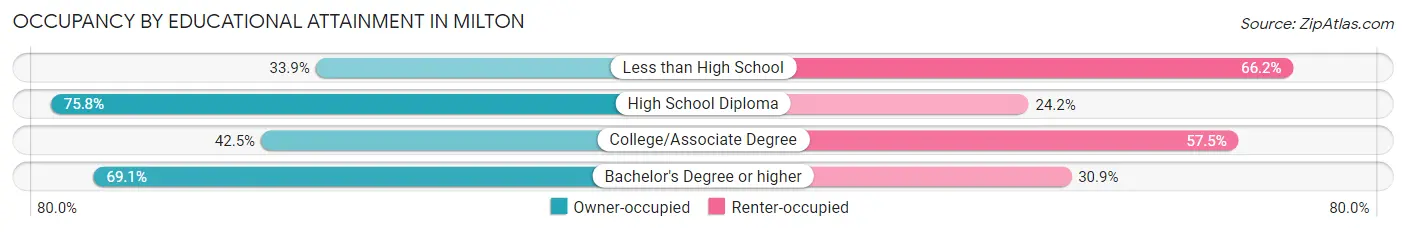
| Household Size | Owner-occupied | Renter-occupied |
| Less than High School | 65 (33.9%) | 127 (66.1%) |
| High School Diploma | 229 (75.8%) | 73 (24.2%) |
| College/Associate Degree | 219 (42.5%) | 296 (57.5%) |
| Bachelor's Degree or higher | 183 (69.1%) | 82 (30.9%) |
Occupancy by Age of Householder in Milton
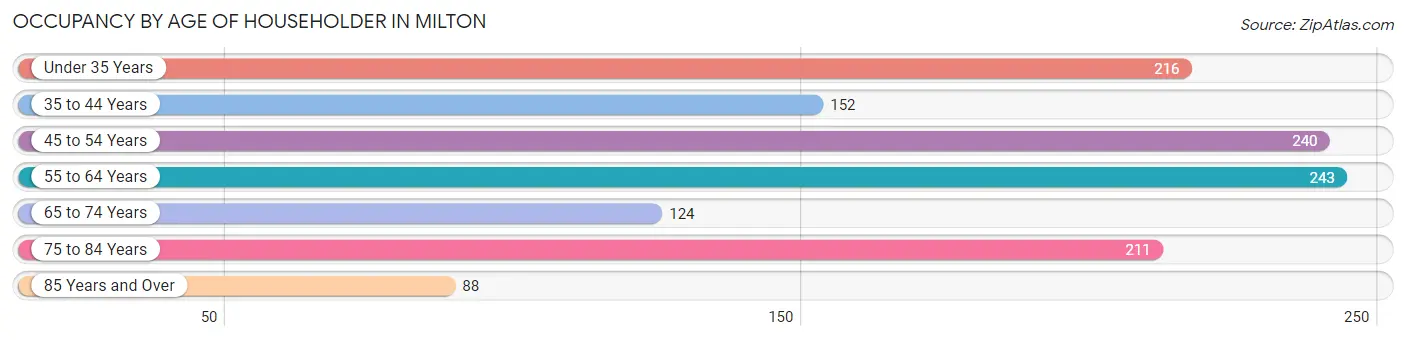
| Age Bracket | # Households | % Households |
| Under 35 Years | 216 | 17.0% |
| 35 to 44 Years | 152 | 11.9% |
| 45 to 54 Years | 240 | 18.8% |
| 55 to 64 Years | 243 | 19.1% |
| 65 to 74 Years | 124 | 9.7% |
| 75 to 84 Years | 211 | 16.6% |
| 85 Years and Over | 88 | 6.9% |
| Total | 1,274 | 100.0% |
Housing Finances in Milton
Median Income by Occupancy in Milton
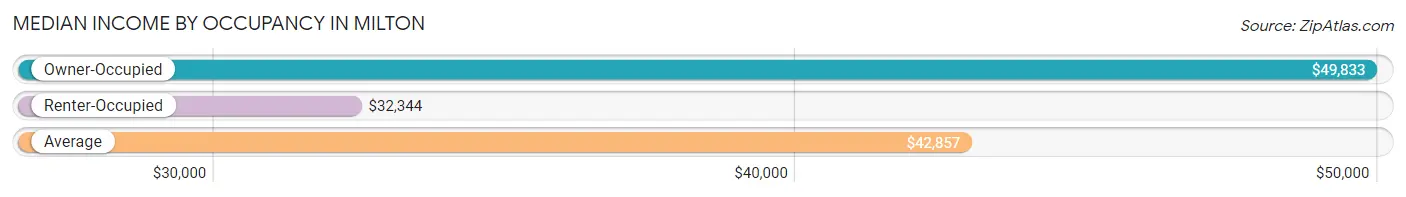
| Occupancy Type | # Households | Median Income |
| Owner-Occupied | 696 (54.6%) | $49,833 |
| Renter-Occupied | 578 (45.4%) | $32,344 |
| Average | 1,274 (100.0%) | $42,857 |
Occupancy by Householder Income Bracket in Milton
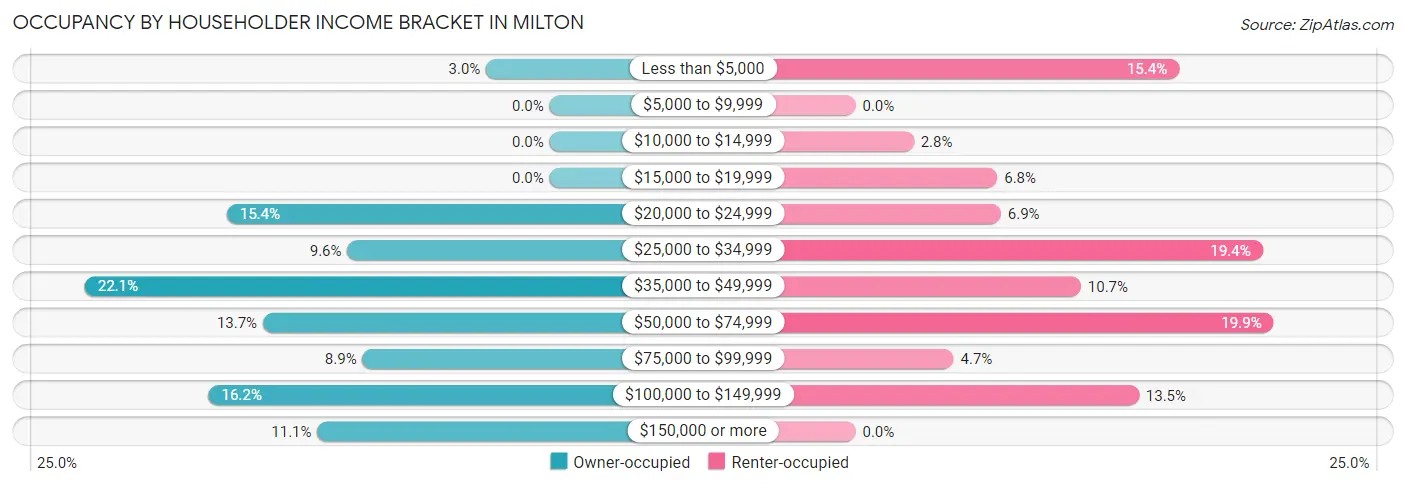
| Income Bracket | Owner-occupied | Renter-occupied |
| Less than $5,000 | 21 (3.0%) | 89 (15.4%) |
| $5,000 to $9,999 | 0 (0.0%) | 0 (0.0%) |
| $10,000 to $14,999 | 0 (0.0%) | 16 (2.8%) |
| $15,000 to $19,999 | 0 (0.0%) | 39 (6.8%) |
| $20,000 to $24,999 | 107 (15.4%) | 40 (6.9%) |
| $25,000 to $34,999 | 67 (9.6%) | 112 (19.4%) |
| $35,000 to $49,999 | 154 (22.1%) | 62 (10.7%) |
| $50,000 to $74,999 | 95 (13.7%) | 115 (19.9%) |
| $75,000 to $99,999 | 62 (8.9%) | 27 (4.7%) |
| $100,000 to $149,999 | 113 (16.2%) | 78 (13.5%) |
| $150,000 or more | 77 (11.1%) | 0 (0.0%) |
| Total | 696 (100.0%) | 578 (100.0%) |
Monthly Housing Cost Tiers in Milton
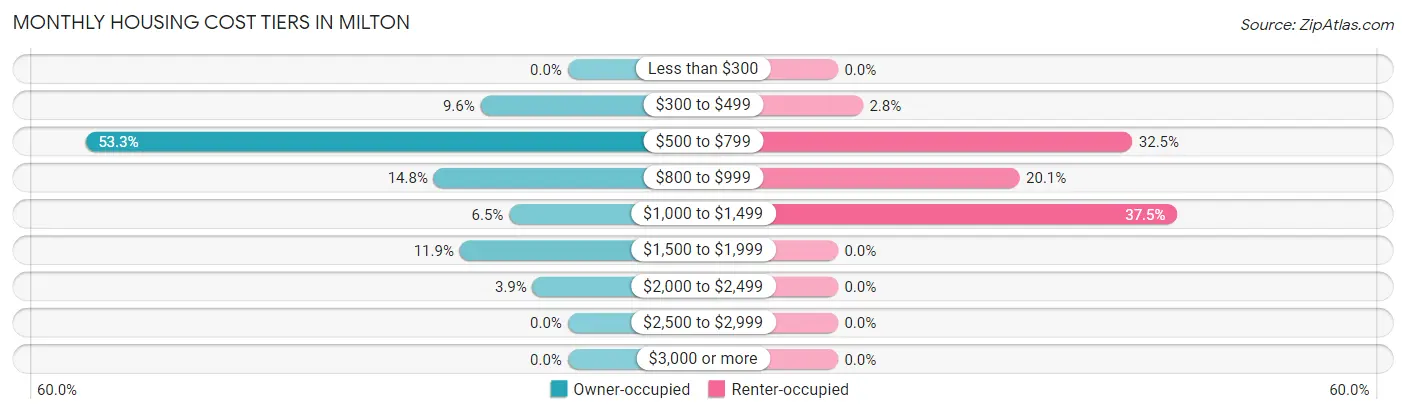
| Monthly Cost | Owner-occupied | Renter-occupied |
| Less than $300 | 0 (0.0%) | 0 (0.0%) |
| $300 to $499 | 67 (9.6%) | 16 (2.8%) |
| $500 to $799 | 371 (53.3%) | 188 (32.5%) |
| $800 to $999 | 103 (14.8%) | 116 (20.1%) |
| $1,000 to $1,499 | 45 (6.5%) | 217 (37.5%) |
| $1,500 to $1,999 | 83 (11.9%) | 0 (0.0%) |
| $2,000 to $2,499 | 27 (3.9%) | 0 (0.0%) |
| $2,500 to $2,999 | 0 (0.0%) | 0 (0.0%) |
| $3,000 or more | 0 (0.0%) | 0 (0.0%) |
| Total | 696 (100.0%) | 578 (100.0%) |
Physical Housing Characteristics in Milton
Housing Structures in Milton
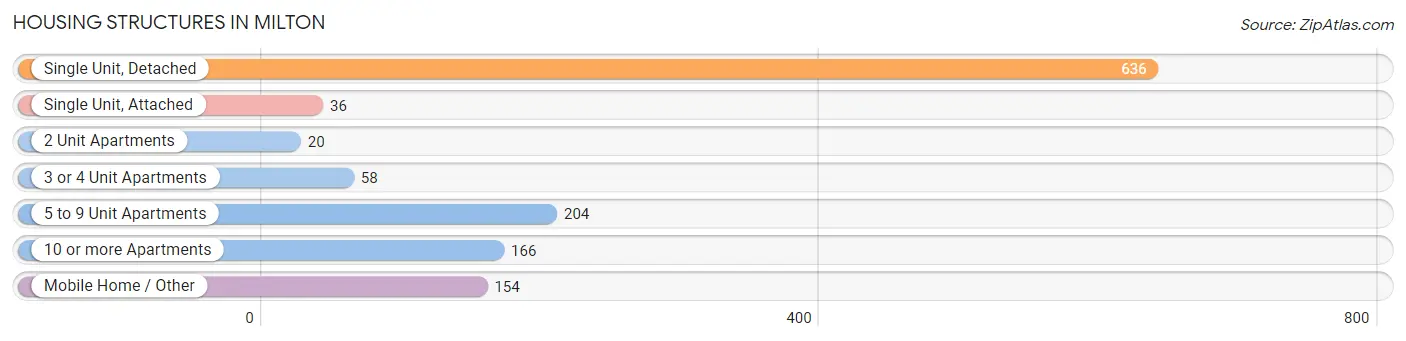
| Structure Type | # Housing Units | % Housing Units |
| Single Unit, Detached | 636 | 49.9% |
| Single Unit, Attached | 36 | 2.8% |
| 2 Unit Apartments | 20 | 1.6% |
| 3 or 4 Unit Apartments | 58 | 4.5% |
| 5 to 9 Unit Apartments | 204 | 16.0% |
| 10 or more Apartments | 166 | 13.0% |
| Mobile Home / Other | 154 | 12.1% |
| Total | 1,274 | 100.0% |
Housing Structures by Occupancy in Milton
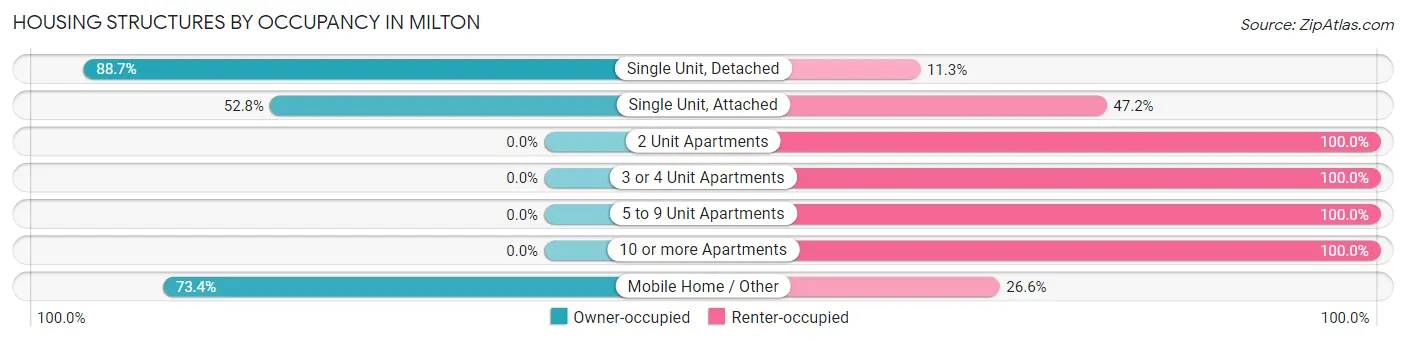
| Structure Type | Owner-occupied | Renter-occupied |
| Single Unit, Detached | 564 (88.7%) | 72 (11.3%) |
| Single Unit, Attached | 19 (52.8%) | 17 (47.2%) |
| 2 Unit Apartments | 0 (0.0%) | 20 (100.0%) |
| 3 or 4 Unit Apartments | 0 (0.0%) | 58 (100.0%) |
| 5 to 9 Unit Apartments | 0 (0.0%) | 204 (100.0%) |
| 10 or more Apartments | 0 (0.0%) | 166 (100.0%) |
| Mobile Home / Other | 113 (73.4%) | 41 (26.6%) |
| Total | 696 (54.6%) | 578 (45.4%) |
Housing Structures by Number of Rooms in Milton
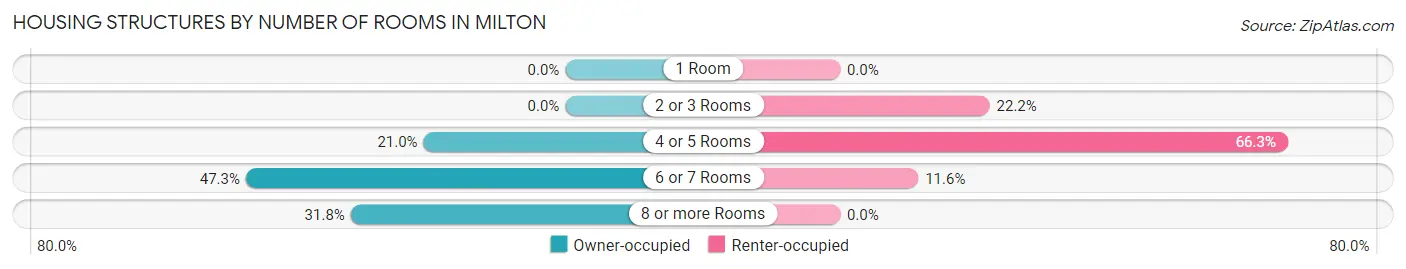
| Number of Rooms | Owner-occupied | Renter-occupied |
| 1 Room | 0 (0.0%) | 0 (0.0%) |
| 2 or 3 Rooms | 0 (0.0%) | 128 (22.2%) |
| 4 or 5 Rooms | 146 (21.0%) | 383 (66.3%) |
| 6 or 7 Rooms | 329 (47.3%) | 67 (11.6%) |
| 8 or more Rooms | 221 (31.8%) | 0 (0.0%) |
| Total | 696 (100.0%) | 578 (100.0%) |
Housing Structure by Heating Type in Milton
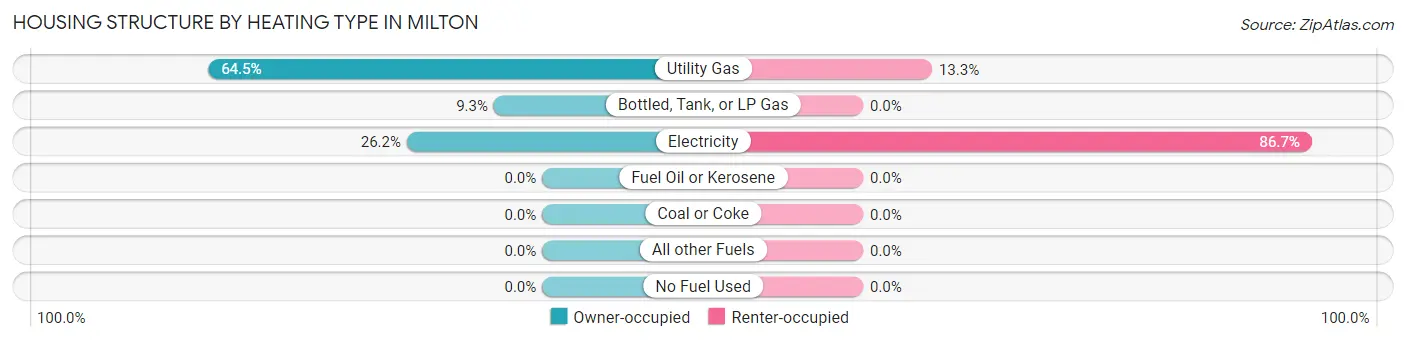
| Heating Type | Owner-occupied | Renter-occupied |
| Utility Gas | 449 (64.5%) | 77 (13.3%) |
| Bottled, Tank, or LP Gas | 65 (9.3%) | 0 (0.0%) |
| Electricity | 182 (26.2%) | 501 (86.7%) |
| Fuel Oil or Kerosene | 0 (0.0%) | 0 (0.0%) |
| Coal or Coke | 0 (0.0%) | 0 (0.0%) |
| All other Fuels | 0 (0.0%) | 0 (0.0%) |
| No Fuel Used | 0 (0.0%) | 0 (0.0%) |
| Total | 696 (100.0%) | 578 (100.0%) |
Household Vehicle Usage in Milton
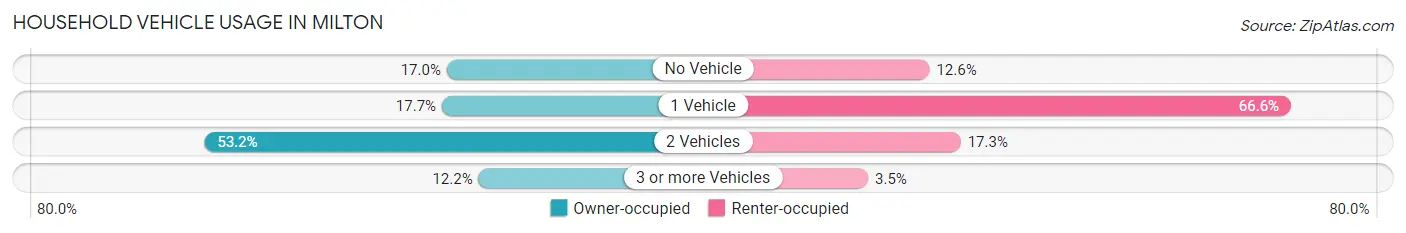
| Vehicles per Household | Owner-occupied | Renter-occupied |
| No Vehicle | 118 (17.0%) | 73 (12.6%) |
| 1 Vehicle | 123 (17.7%) | 385 (66.6%) |
| 2 Vehicles | 370 (53.2%) | 100 (17.3%) |
| 3 or more Vehicles | 85 (12.2%) | 20 (3.5%) |
| Total | 696 (100.0%) | 578 (100.0%) |
Real Estate & Mortgages in Milton
Real Estate and Mortgage Overview in Milton
| Characteristic | Without Mortgage | With Mortgage |
| Housing Units | 311 | 385 |
| Median Property Value | - | - |
| Median Household Income | - | - |
| Monthly Housing Costs | $606 | $0 |
| Real Estate Taxes | $912 | $0 |
Property Value by Mortgage Status in Milton
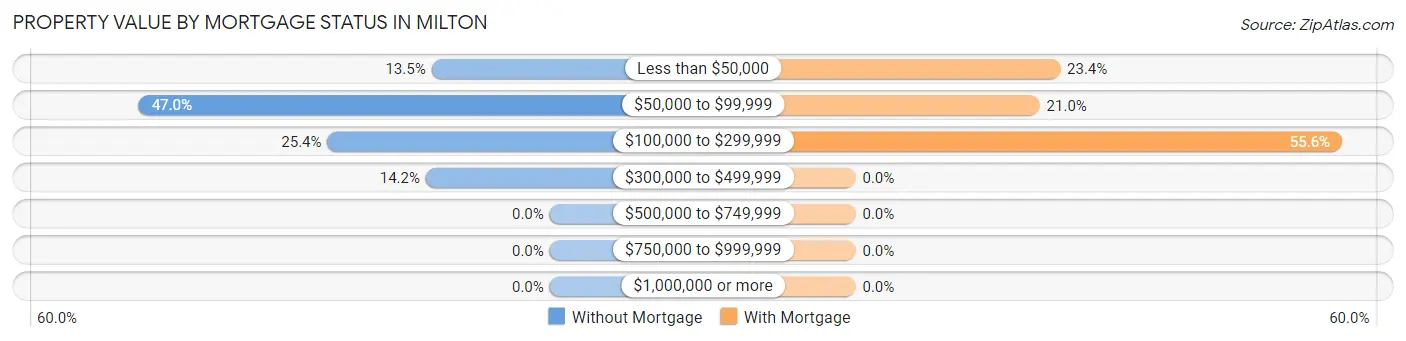
| Property Value | Without Mortgage | With Mortgage |
| Less than $50,000 | 42 (13.5%) | 90 (23.4%) |
| $50,000 to $99,999 | 146 (46.9%) | 81 (21.0%) |
| $100,000 to $299,999 | 79 (25.4%) | 214 (55.6%) |
| $300,000 to $499,999 | 44 (14.1%) | 0 (0.0%) |
| $500,000 to $749,999 | 0 (0.0%) | 0 (0.0%) |
| $750,000 to $999,999 | 0 (0.0%) | 0 (0.0%) |
| $1,000,000 or more | 0 (0.0%) | 0 (0.0%) |
| Total | 311 (100.0%) | 385 (100.0%) |
Household Income by Mortgage Status in Milton
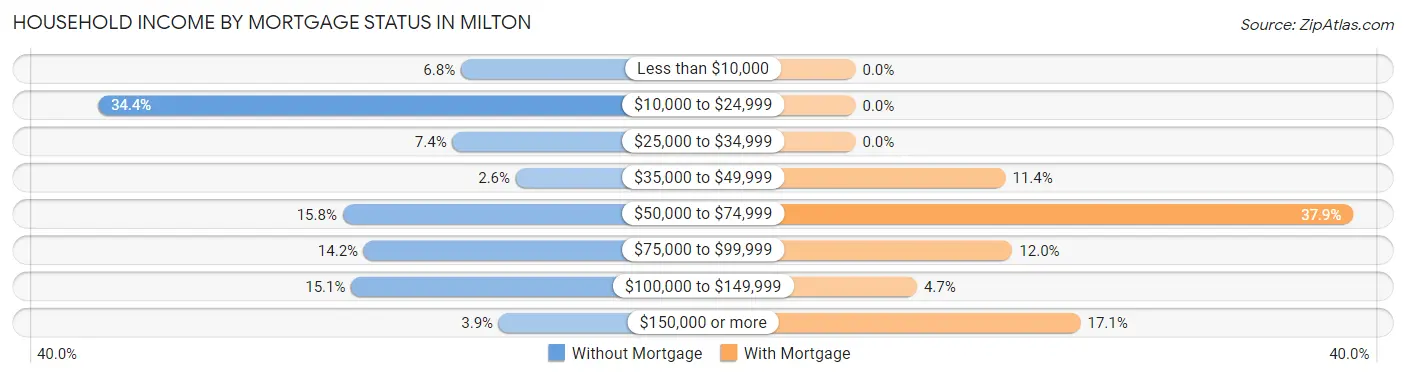
| Household Income | Without Mortgage | With Mortgage |
| Less than $10,000 | 21 (6.8%) | 0 (0.0%) |
| $10,000 to $24,999 | 107 (34.4%) | 0 (0.0%) |
| $25,000 to $34,999 | 23 (7.4%) | 0 (0.0%) |
| $35,000 to $49,999 | 8 (2.6%) | 44 (11.4%) |
| $50,000 to $74,999 | 49 (15.8%) | 146 (37.9%) |
| $75,000 to $99,999 | 44 (14.1%) | 46 (11.9%) |
| $100,000 to $149,999 | 47 (15.1%) | 18 (4.7%) |
| $150,000 or more | 12 (3.9%) | 66 (17.1%) |
| Total | 311 (100.0%) | 385 (100.0%) |
Property Value to Household Income Ratio in Milton
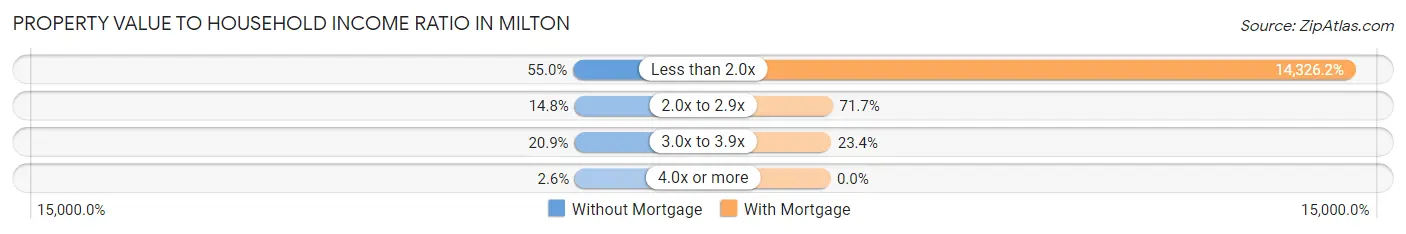
| Value-to-Income Ratio | Without Mortgage | With Mortgage |
| Less than 2.0x | 171 (55.0%) | 55,156 (14,326.2%) |
| 2.0x to 2.9x | 46 (14.8%) | 276 (71.7%) |
| 3.0x to 3.9x | 65 (20.9%) | 90 (23.4%) |
| 4.0x or more | 8 (2.6%) | 0 (0.0%) |
| Total | 311 (100.0%) | 385 (100.0%) |
Real Estate Taxes by Mortgage Status in Milton
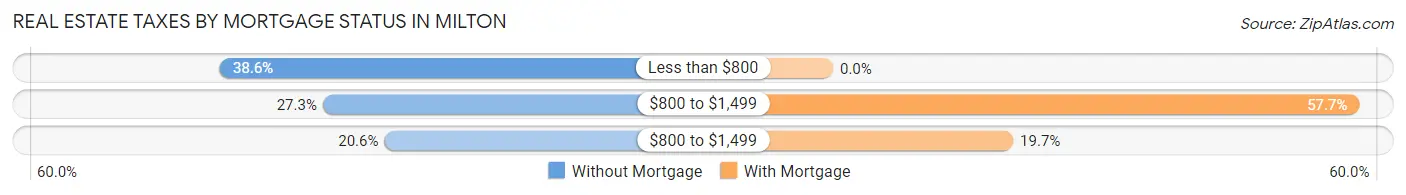
| Property Taxes | Without Mortgage | With Mortgage |
| Less than $800 | 120 (38.6%) | 0 (0.0%) |
| $800 to $1,499 | 85 (27.3%) | 222 (57.7%) |
| $800 to $1,499 | 64 (20.6%) | 76 (19.7%) |
| Total | 311 (100.0%) | 385 (100.0%) |
Health & Disability in Milton
Health Insurance Coverage by Age in Milton
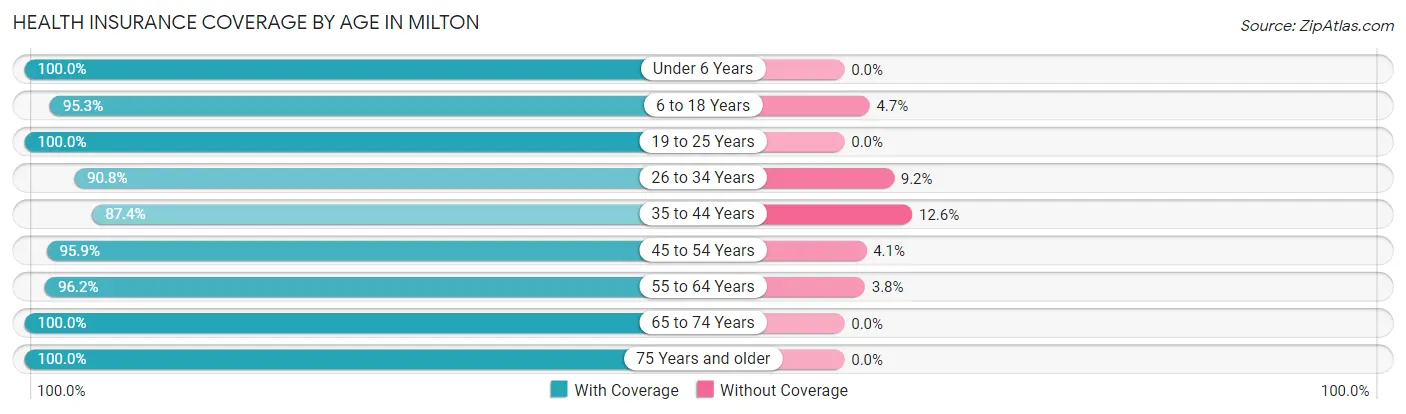
| Age Bracket | With Coverage | Without Coverage |
| Under 6 Years | 408 (100.0%) | 0 (0.0%) |
| 6 to 18 Years | 284 (95.3%) | 14 (4.7%) |
| 19 to 25 Years | 227 (100.0%) | 0 (0.0%) |
| 26 to 34 Years | 295 (90.8%) | 30 (9.2%) |
| 35 to 44 Years | 166 (87.4%) | 24 (12.6%) |
| 45 to 54 Years | 305 (95.9%) | 13 (4.1%) |
| 55 to 64 Years | 478 (96.2%) | 19 (3.8%) |
| 65 to 74 Years | 197 (100.0%) | 0 (0.0%) |
| 75 Years and older | 313 (100.0%) | 0 (0.0%) |
| Total | 2,673 (96.4%) | 100 (3.6%) |
Health Insurance Coverage by Citizenship Status in Milton
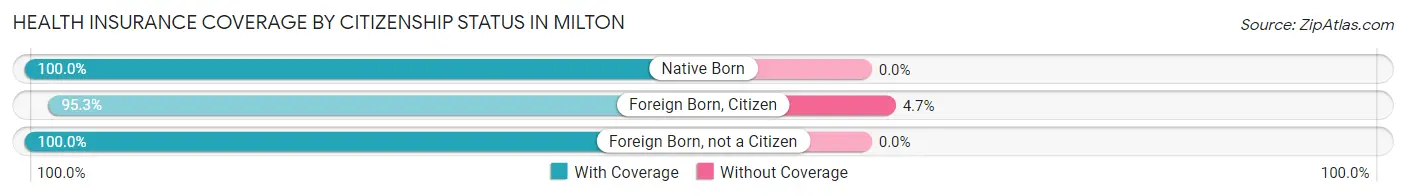
| Citizenship Status | With Coverage | Without Coverage |
| Native Born | 408 (100.0%) | 0 (0.0%) |
| Foreign Born, Citizen | 284 (95.3%) | 14 (4.7%) |
| Foreign Born, not a Citizen | 227 (100.0%) | 0 (0.0%) |
Health Insurance Coverage by Household Income in Milton
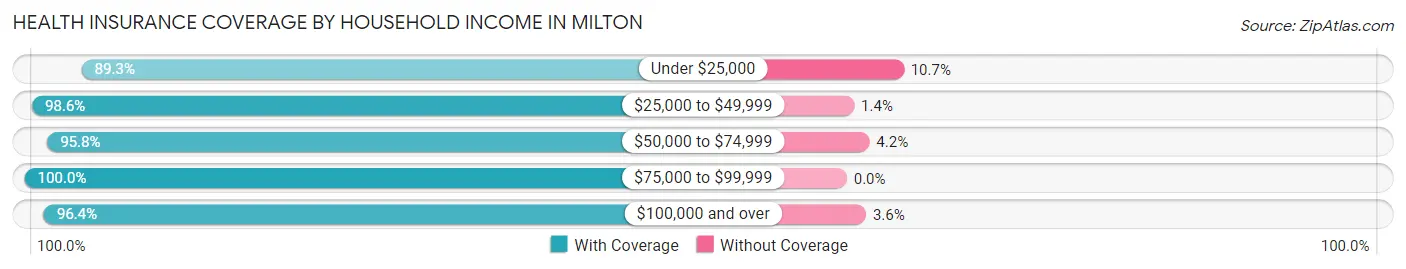
| Household Income | With Coverage | Without Coverage |
| Under $25,000 | 318 (89.3%) | 38 (10.7%) |
| $25,000 to $49,999 | 928 (98.6%) | 13 (1.4%) |
| $50,000 to $74,999 | 429 (95.8%) | 19 (4.2%) |
| $75,000 to $99,999 | 195 (100.0%) | 0 (0.0%) |
| $100,000 and over | 803 (96.4%) | 30 (3.6%) |
Public vs Private Health Insurance Coverage by Age in Milton
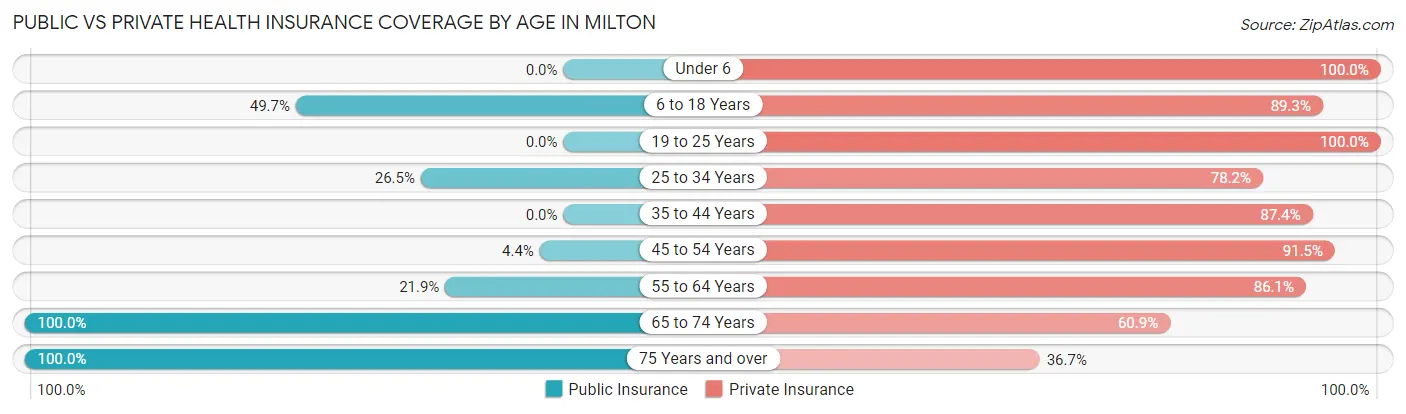
| Age Bracket | Public Insurance | Private Insurance |
| Under 6 | 0 (0.0%) | 408 (100.0%) |
| 6 to 18 Years | 148 (49.7%) | 266 (89.3%) |
| 19 to 25 Years | 0 (0.0%) | 227 (100.0%) |
| 25 to 34 Years | 86 (26.5%) | 254 (78.1%) |
| 35 to 44 Years | 0 (0.0%) | 166 (87.4%) |
| 45 to 54 Years | 14 (4.4%) | 291 (91.5%) |
| 55 to 64 Years | 109 (21.9%) | 428 (86.1%) |
| 65 to 74 Years | 197 (100.0%) | 120 (60.9%) |
| 75 Years and over | 313 (100.0%) | 115 (36.7%) |
| Total | 867 (31.3%) | 2,275 (82.0%) |
Disability Status by Sex by Age in Milton
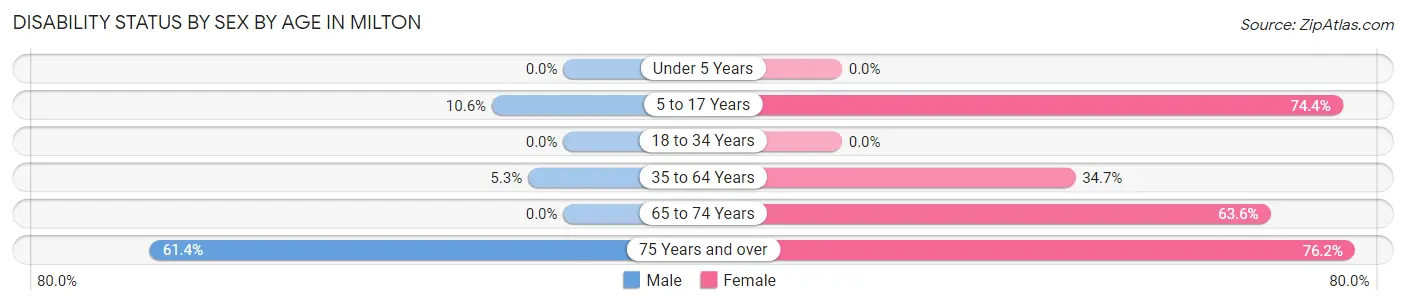
| Age Bracket | Male | Female |
| Under 5 Years | 0 (0.0%) | 0 (0.0%) |
| 5 to 17 Years | 14 (10.6%) | 116 (74.4%) |
| 18 to 34 Years | 0 (0.0%) | 0 (0.0%) |
| 35 to 64 Years | 29 (5.2%) | 157 (34.7%) |
| 65 to 74 Years | 0 (0.0%) | 84 (63.6%) |
| 75 Years and over | 35 (61.4%) | 195 (76.2%) |
Disability Class by Sex by Age in Milton
Disability Class: Hearing Difficulty
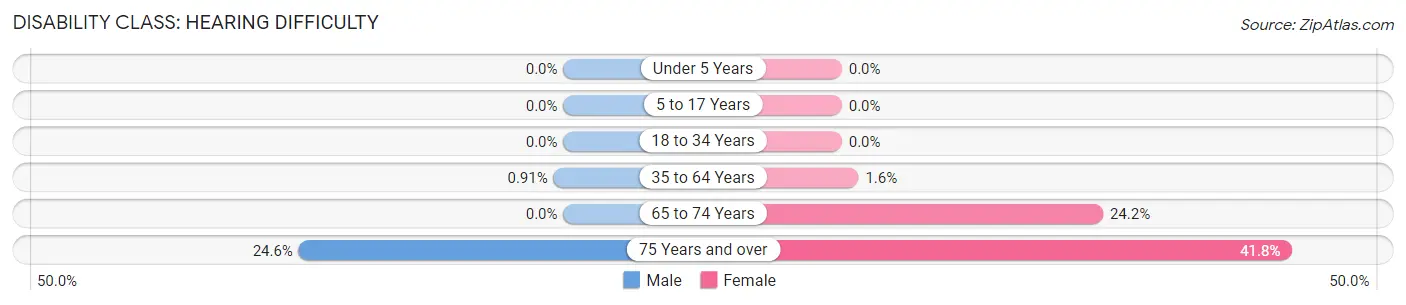
| Age Bracket | Male | Female |
| Under 5 Years | 0 (0.0%) | 0 (0.0%) |
| 5 to 17 Years | 0 (0.0%) | 0 (0.0%) |
| 18 to 34 Years | 0 (0.0%) | 0 (0.0%) |
| 35 to 64 Years | 5 (0.9%) | 7 (1.5%) |
| 65 to 74 Years | 0 (0.0%) | 32 (24.2%) |
| 75 Years and over | 14 (24.6%) | 107 (41.8%) |
Disability Class: Vision Difficulty
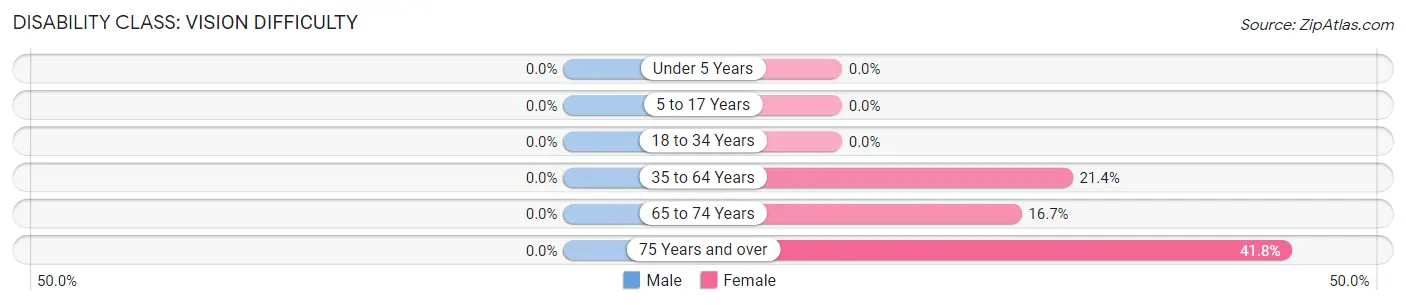
| Age Bracket | Male | Female |
| Under 5 Years | 0 (0.0%) | 0 (0.0%) |
| 5 to 17 Years | 0 (0.0%) | 0 (0.0%) |
| 18 to 34 Years | 0 (0.0%) | 0 (0.0%) |
| 35 to 64 Years | 0 (0.0%) | 97 (21.4%) |
| 65 to 74 Years | 0 (0.0%) | 22 (16.7%) |
| 75 Years and over | 0 (0.0%) | 107 (41.8%) |
Disability Class: Cognitive Difficulty
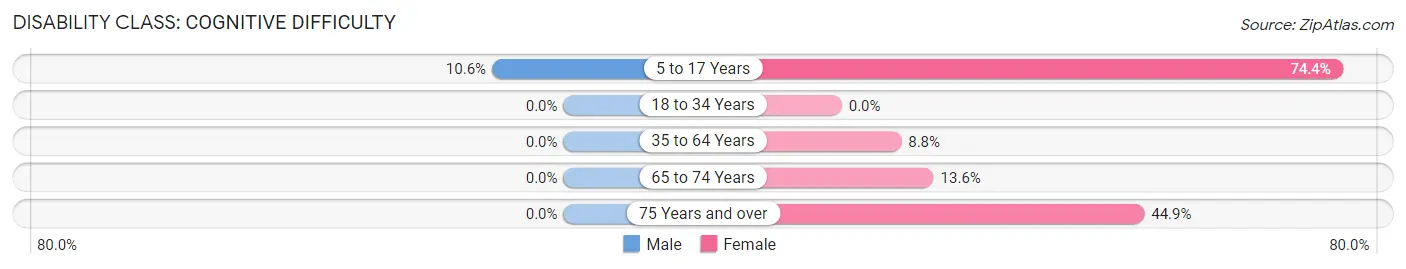
| Age Bracket | Male | Female |
| 5 to 17 Years | 14 (10.6%) | 116 (74.4%) |
| 18 to 34 Years | 0 (0.0%) | 0 (0.0%) |
| 35 to 64 Years | 0 (0.0%) | 40 (8.8%) |
| 65 to 74 Years | 0 (0.0%) | 18 (13.6%) |
| 75 Years and over | 0 (0.0%) | 115 (44.9%) |
Disability Class: Ambulatory Difficulty
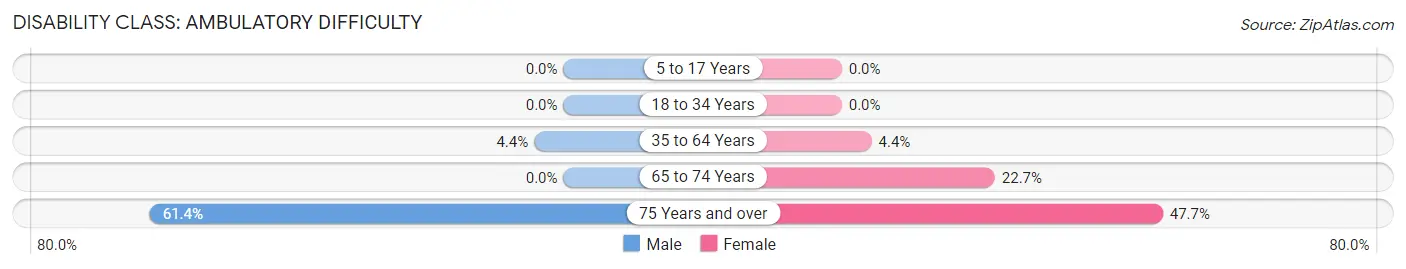
| Age Bracket | Male | Female |
| 5 to 17 Years | 0 (0.0%) | 0 (0.0%) |
| 18 to 34 Years | 0 (0.0%) | 0 (0.0%) |
| 35 to 64 Years | 24 (4.3%) | 20 (4.4%) |
| 65 to 74 Years | 0 (0.0%) | 30 (22.7%) |
| 75 Years and over | 35 (61.4%) | 122 (47.7%) |
Disability Class: Self-Care Difficulty
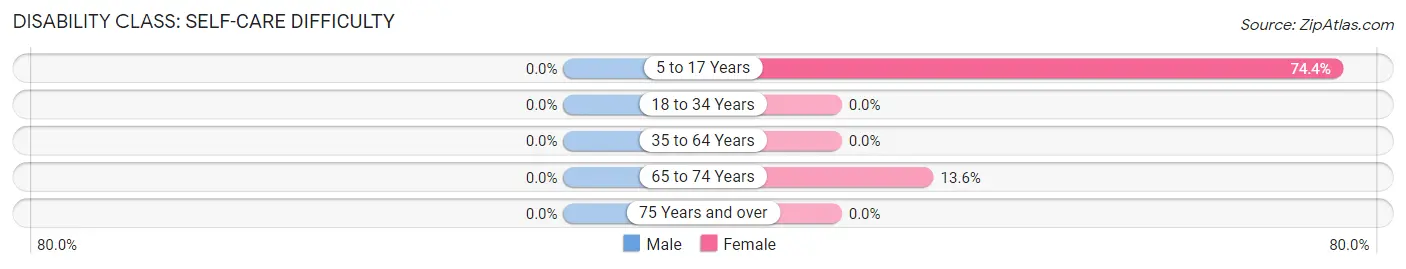
| Age Bracket | Male | Female |
| 5 to 17 Years | 0 (0.0%) | 116 (74.4%) |
| 18 to 34 Years | 0 (0.0%) | 0 (0.0%) |
| 35 to 64 Years | 0 (0.0%) | 0 (0.0%) |
| 65 to 74 Years | 0 (0.0%) | 18 (13.6%) |
| 75 Years and over | 0 (0.0%) | 0 (0.0%) |
Technology Access in Milton
Computing Device Access in Milton
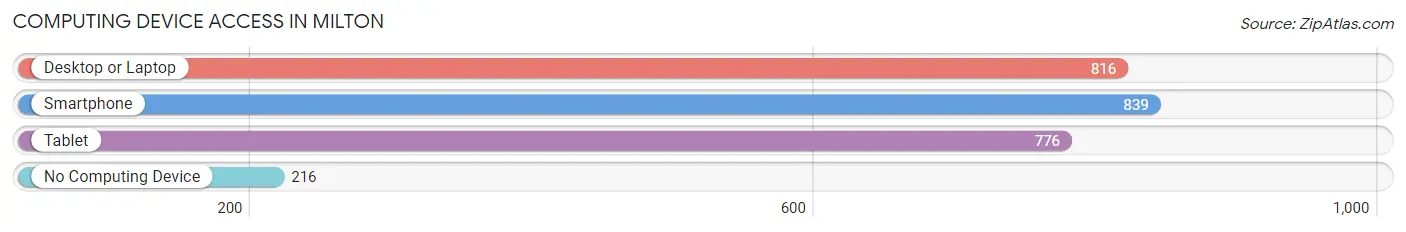
| Device Type | # Households | % Households |
| Desktop or Laptop | 816 | 64.0% |
| Smartphone | 839 | 65.9% |
| Tablet | 776 | 60.9% |
| No Computing Device | 216 | 17.0% |
| Total | 1,274 | 100.0% |
Internet Access in Milton
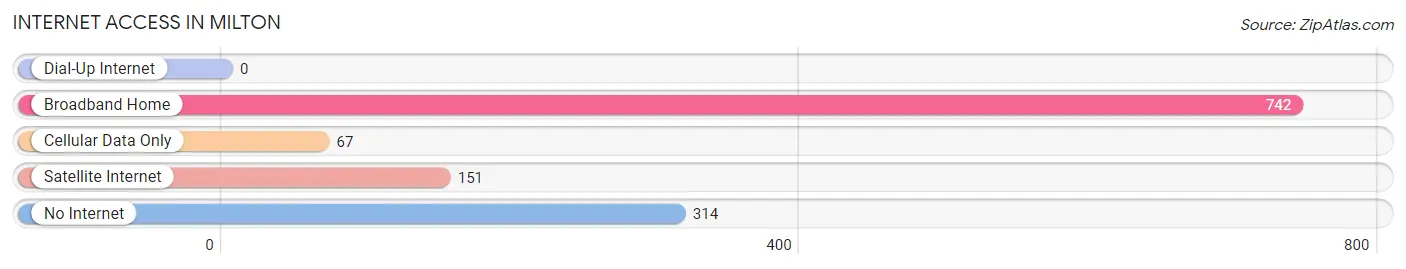
| Internet Type | # Households | % Households |
| Dial-Up Internet | 0 | 0.0% |
| Broadband Home | 742 | 58.2% |
| Cellular Data Only | 67 | 5.3% |
| Satellite Internet | 151 | 11.8% |
| No Internet | 314 | 24.6% |
| Total | 1,274 | 100.0% |
Milton Summary
Milton, West Virginia is a small town located in Cabell County, West Virginia. It is situated on the banks of the Guyandotte River, and is part of the Huntington-Ashland Metropolitan Statistical Area. The town has a population of approximately 1,800 people, and is known for its small-town charm and friendly atmosphere.
Geography
Milton is located in the southwestern part of Cabell County, West Virginia, and is situated on the banks of the Guyandotte River. The town is located approximately 10 miles south of Huntington, West Virginia, and is part of the Huntington-Ashland Metropolitan Statistical Area. The town is surrounded by rolling hills and lush forests, and is home to several parks and recreational areas.
Economy
Milton’s economy is largely based on the service industry, with many of the town’s residents employed in retail, hospitality, and healthcare. The town is also home to several small businesses, including a local grocery store, a hardware store, and a few restaurants. The town is also home to a number of manufacturing companies, including a plastics factory and a paper mill.
Demographics
As of the 2010 census, Milton had a population of 1,817 people. The racial makeup of the town was 95.3% White, 1.2% African American, 0.3% Native American, 0.7% Asian, 0.1% Pacific Islander, 0.7% from other races, and 1.7% from two or more races. Hispanic or Latino of any race were 1.7% of the population.
The median income for a household in Milton was $37,917, and the median income for a family was $45,000. The per capita income for the town was $18,945. About 11.2% of families and 14.2% of the population were below the poverty line, including 18.2% of those under age 18 and 8.3% of those age 65 or over.
History
Milton was first settled in the early 1800s by a group of settlers from Virginia. The town was originally known as Guyandotte, and was later renamed Milton in honor of the poet John Milton. The town was incorporated in 1891, and has since grown to become a small but vibrant community.
Milton has a rich history, and is home to several historic sites, including the Milton Historic District, which is listed on the National Register of Historic Places. The town is also home to the Milton Historic Museum, which houses artifacts and documents from the town’s past.
Milton is a small but vibrant town, and is known for its friendly atmosphere and small-town charm. The town is home to a number of parks and recreational areas, and is a popular destination for outdoor enthusiasts. The town is also home to a number of small businesses, and is a great place to live and work.
Common Questions
What is Per Capita Income in Milton?
Per Capita income in Milton is $28,014.
What is the Median Family Income in Milton?
Median Family Income in Milton is $69,333.
What is the Median Household income in Milton?
Median Household Income in Milton is $42,857.
What is Income or Wage Gap in Milton?
Income or Wage Gap in Milton is 34.8%.
Women in Milton earn 65.2 cents for every dollar earned by a man.
What is Inequality or Gini Index in Milton?
Inequality or Gini Index in Milton is 0.44.
What is the Total Population of Milton?
Total Population of Milton is 2,773.
What is the Total Male Population of Milton?
Total Male Population of Milton is 1,233.
What is the Total Female Population of Milton?
Total Female Population of Milton is 1,540.
What is the Ratio of Males per 100 Females in Milton?
There are 80.06 Males per 100 Females in Milton.
What is the Ratio of Females per 100 Males in Milton?
There are 124.90 Females per 100 Males in Milton.
What is the Median Population Age in Milton?
Median Population Age in Milton is 41.5 Years.
What is the Average Family Size in Milton
Average Family Size in Milton is 3.1 People.
What is the Average Household Size in Milton
Average Household Size in Milton is 2.2 People.
How Large is the Labor Force in Milton?
There are 1,254 People in the Labor Forcein in Milton.
What is the Percentage of People in the Labor Force in Milton?
57.2% of People are in the Labor Force in Milton.
What is the Unemployment Rate in Milton?
Unemployment Rate in Milton is 8.0%.