Brandonville, WV Map & Demographics
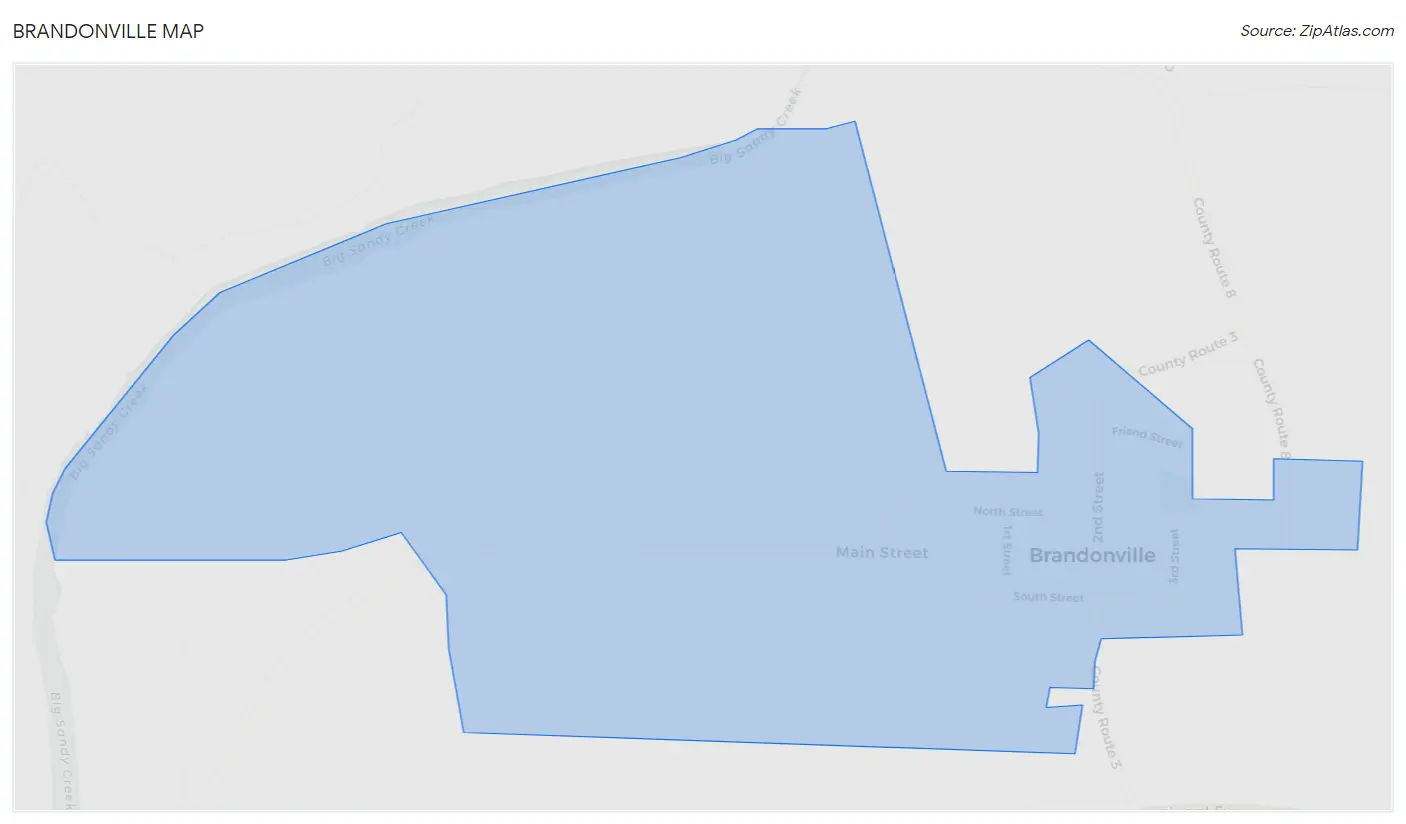
Brandonville Map
Brandonville Overview
$34,136
PER CAPITA INCOME
$86,667
AVG FAMILY INCOME
$78,333
AVG HOUSEHOLD INCOME
0.3%
WAGE / INCOME GAP [ % ]
99.7¢/ $1
WAGE / INCOME GAP [ $ ]
0.37
INEQUALITY / GINI INDEX
230
TOTAL POPULATION
98
MALE POPULATION
132
FEMALE POPULATION
74.24
MALES / 100 FEMALES
134.69
FEMALES / 100 MALES
39.3
MEDIAN AGE
3.1
AVG FAMILY SIZE
2.8
AVG HOUSEHOLD SIZE
109
LABOR FORCE [ PEOPLE ]
69.9%
PERCENT IN LABOR FORCE
7.3%
UNEMPLOYMENT RATE
Income in Brandonville
Income Overview in Brandonville
Per Capita Income in Brandonville is $34,136, while median incomes of families and households are $86,667 and $78,333 respectively.
| Characteristic | Number | Measure |
| Per Capita Income | 230 | $34,136 |
| Median Family Income | 64 | $86,667 |
| Mean Family Income | 64 | $110,983 |
| Median Household Income | 82 | $78,333 |
| Mean Household Income | 82 | $96,545 |
| Income Deficit | 64 | $0 |
| Wage / Income Gap (%) | 230 | 0.31% |
| Wage / Income Gap ($) | 230 | 99.69¢ per $1 |
| Gini / Inequality Index | 230 | 0.37 |
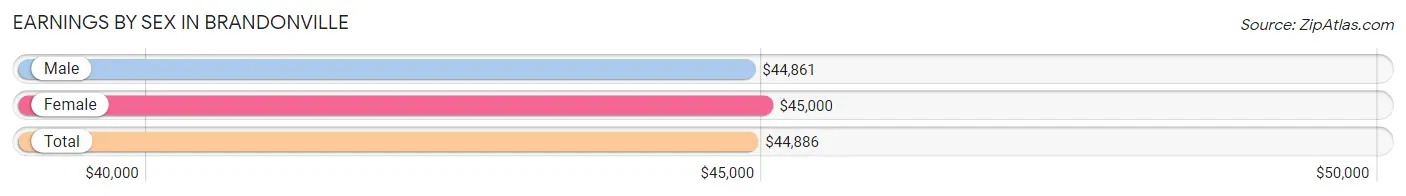
Earnings by Sex in Brandonville
Average Earnings in Brandonville are $44,886, $44,861 for men and $45,000 for women, a difference of 0.3%.
| Sex | Number | Average Earnings |
| Male | 45 (40.5%) | $44,861 |
| Female | 66 (59.5%) | $45,000 |
| Total | 111 (100.0%) | $44,886 |
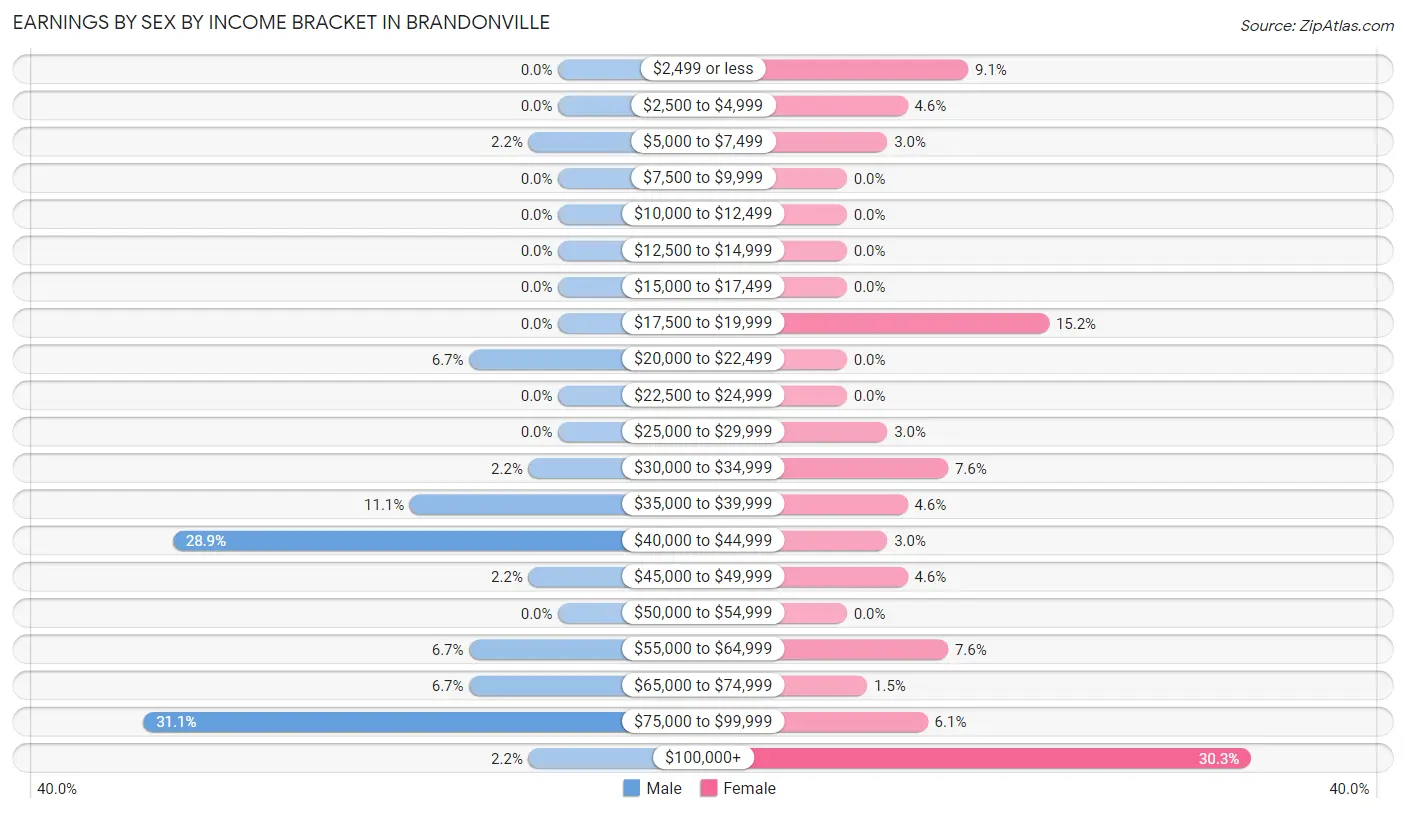
Earnings by Sex by Income Bracket in Brandonville
The most common earnings brackets in Brandonville are $75,000 to $99,999 for men (14 | 31.1%) and $100,000+ for women (20 | 30.3%).
| Income | Male | Female |
| $2,499 or less | 0 (0.0%) | 6 (9.1%) |
| $2,500 to $4,999 | 0 (0.0%) | 3 (4.5%) |
| $5,000 to $7,499 | 1 (2.2%) | 2 (3.0%) |
| $7,500 to $9,999 | 0 (0.0%) | 0 (0.0%) |
| $10,000 to $12,499 | 0 (0.0%) | 0 (0.0%) |
| $12,500 to $14,999 | 0 (0.0%) | 0 (0.0%) |
| $15,000 to $17,499 | 0 (0.0%) | 0 (0.0%) |
| $17,500 to $19,999 | 0 (0.0%) | 10 (15.1%) |
| $20,000 to $22,499 | 3 (6.7%) | 0 (0.0%) |
| $22,500 to $24,999 | 0 (0.0%) | 0 (0.0%) |
| $25,000 to $29,999 | 0 (0.0%) | 2 (3.0%) |
| $30,000 to $34,999 | 1 (2.2%) | 5 (7.6%) |
| $35,000 to $39,999 | 5 (11.1%) | 3 (4.5%) |
| $40,000 to $44,999 | 13 (28.9%) | 2 (3.0%) |
| $45,000 to $49,999 | 1 (2.2%) | 3 (4.5%) |
| $50,000 to $54,999 | 0 (0.0%) | 0 (0.0%) |
| $55,000 to $64,999 | 3 (6.7%) | 5 (7.6%) |
| $65,000 to $74,999 | 3 (6.7%) | 1 (1.5%) |
| $75,000 to $99,999 | 14 (31.1%) | 4 (6.1%) |
| $100,000+ | 1 (2.2%) | 20 (30.3%) |
| Total | 45 (100.0%) | 66 (100.0%) |
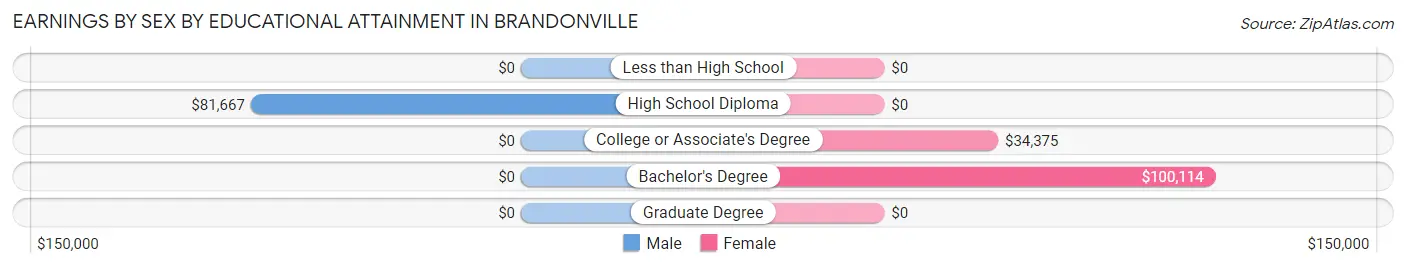
Earnings by Sex by Educational Attainment in Brandonville
Average earnings in Brandonville are $44,861 for men and $45,000 for women, a difference of 0.3%. Men with an educational attainment of high school diploma enjoy the highest average annual earnings of $81,667, while those with high school diploma education earn the least with $81,667. Women with an educational attainment of bachelor's degree earn the most with the average annual earnings of $100,114, while those with college or associate's degree education have the smallest earnings of $34,375.
| Educational Attainment | Male Income | Female Income |
| Less than High School | - | - |
| High School Diploma | $81,667 | $0 |
| College or Associate's Degree | - | - |
| Bachelor's Degree | - | - |
| Graduate Degree | - | - |
| Total | $44,861 | $45,000 |
Family Income in Brandonville
Family Income Brackets in Brandonville
According to the Brandonville family income data, there are 21 families falling into the $150,000 to $199,999 income range, which is the most common income bracket and makes up 32.8% of all families.
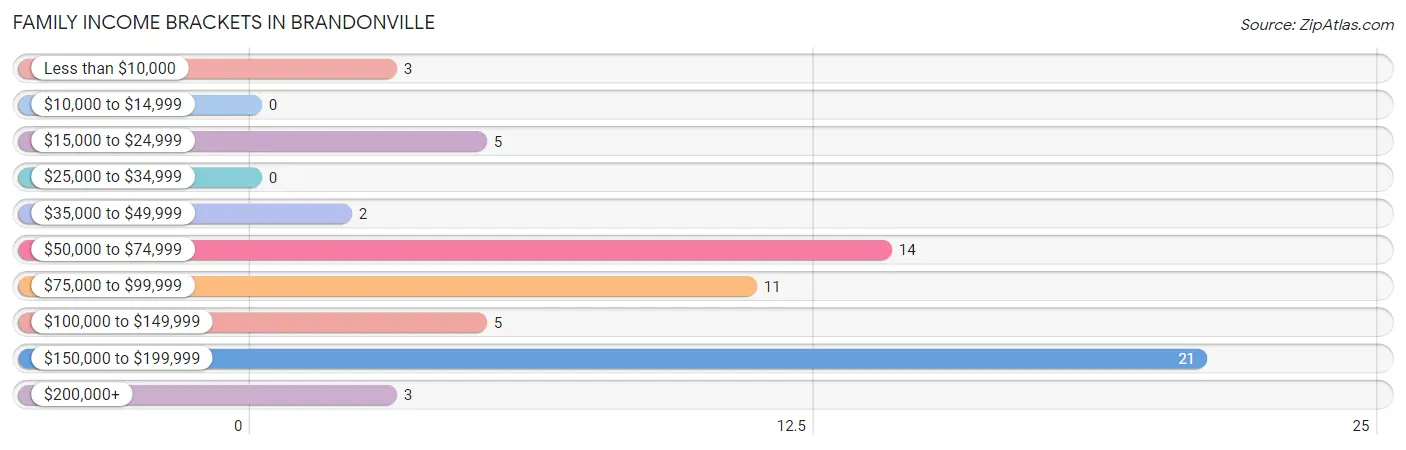
| Income Bracket | # Families | % Families |
| Less than $10,000 | 3 | 4.7% |
| $10,000 to $14,999 | 0 | 0.0% |
| $15,000 to $24,999 | 5 | 7.8% |
| $25,000 to $34,999 | 0 | 0.0% |
| $35,000 to $49,999 | 2 | 3.1% |
| $50,000 to $74,999 | 14 | 21.9% |
| $75,000 to $99,999 | 11 | 17.2% |
| $100,000 to $149,999 | 5 | 7.8% |
| $150,000 to $199,999 | 21 | 32.8% |
| $200,000+ | 3 | 4.7% |
Family Income by Famaliy Size in Brandonville
3-person families (18 | 28.1%) account for the highest median family income in Brandonville with $137,500 per family, while 3-person families (18 | 28.1%) have the highest median income of $45,833 per family member.
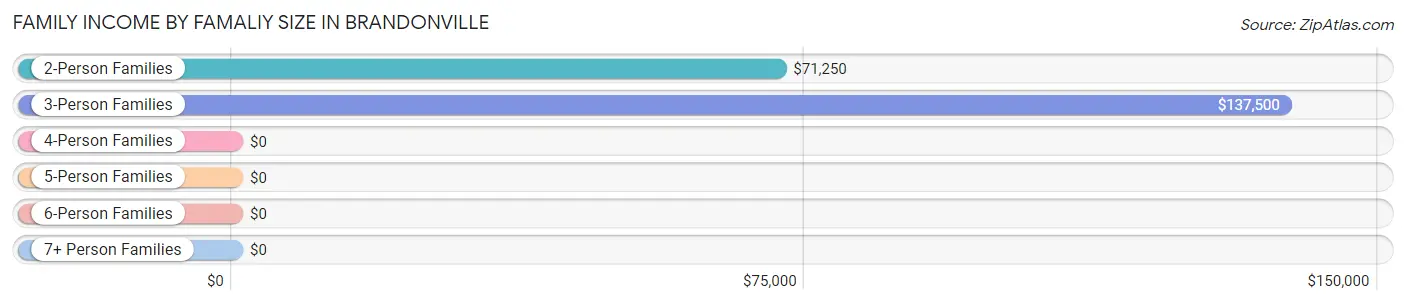
| Income Bracket | # Families | Median Income |
| 2-Person Families | 22 (34.4%) | $71,250 |
| 3-Person Families | 18 (28.1%) | $137,500 |
| 4-Person Families | 22 (34.4%) | $0 |
| 5-Person Families | 2 (3.1%) | $0 |
| 6-Person Families | 0 (0.0%) | $0 |
| 7+ Person Families | 0 (0.0%) | $0 |
| Total | 64 (100.0%) | $86,667 |
Family Income by Number of Earners in Brandonville
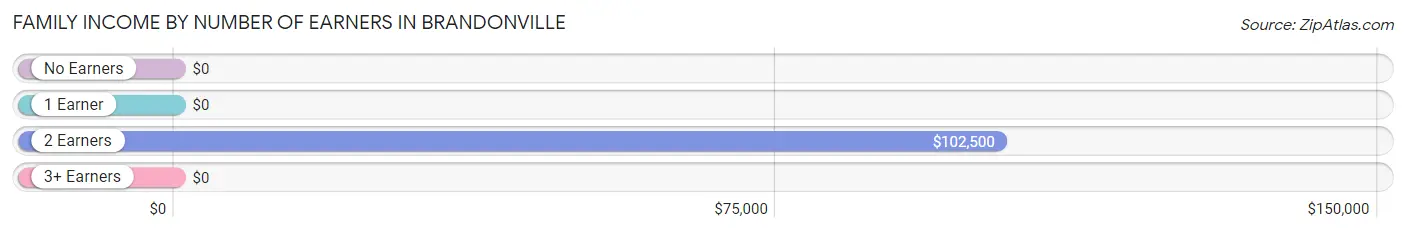
| Number of Earners | # Families | Median Income |
| No Earners | 8 (12.5%) | $0 |
| 1 Earner | 20 (31.2%) | $0 |
| 2 Earners | 36 (56.2%) | $102,500 |
| 3+ Earners | 0 (0.0%) | $0 |
| Total | 64 (100.0%) | $86,667 |
Household Income in Brandonville
Household Income Brackets in Brandonville
With 21 households falling in the category, the $150,000 to $199,999 income range is the most frequent in Brandonville, accounting for 25.6% of all households.
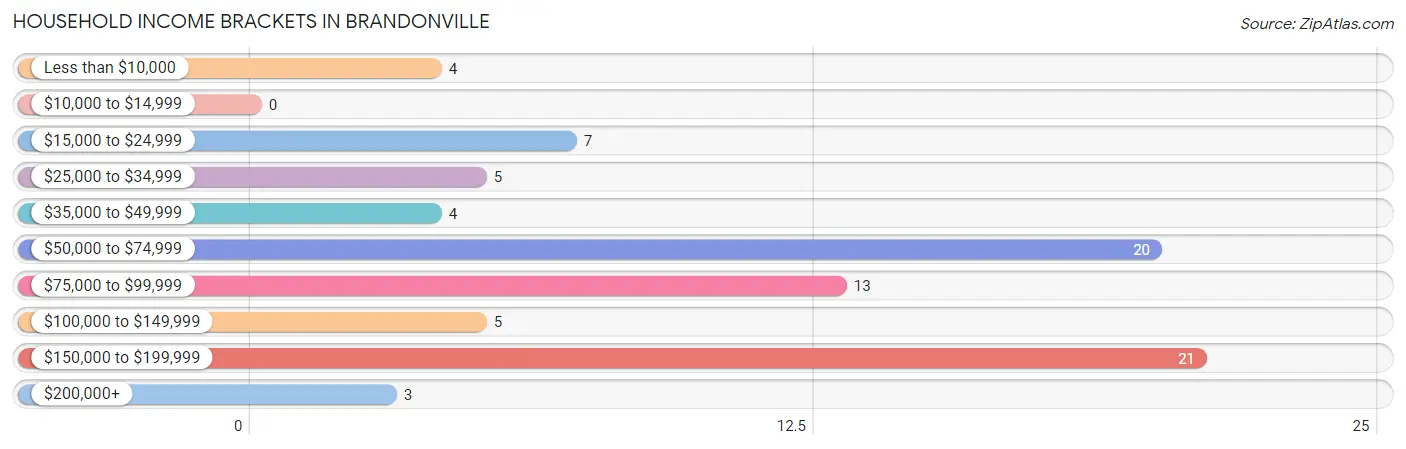
| Income Bracket | # Households | % Households |
| Less than $10,000 | 4 | 4.9% |
| $10,000 to $14,999 | 0 | 0.0% |
| $15,000 to $24,999 | 7 | 8.5% |
| $25,000 to $34,999 | 5 | 6.1% |
| $35,000 to $49,999 | 4 | 4.9% |
| $50,000 to $74,999 | 20 | 24.4% |
| $75,000 to $99,999 | 13 | 15.9% |
| $100,000 to $149,999 | 5 | 6.1% |
| $150,000 to $199,999 | 21 | 25.6% |
| $200,000+ | 3 | 3.7% |
Household Income by Householder Age in Brandonville
The median household income in Brandonville is $78,333, with the highest median household income of $102,500 found in the 45 to 64 years age bracket for the primary householder. A total of 12 households (14.6%) fall into this category.
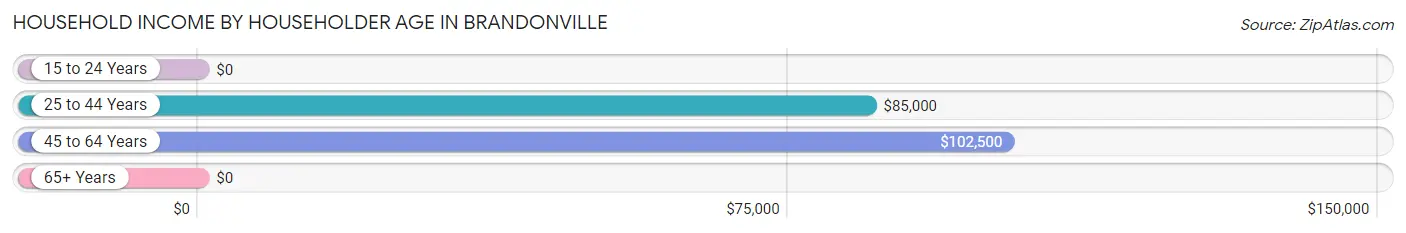
| Income Bracket | # Households | Median Income |
| 15 to 24 Years | 0 (0.0%) | $0 |
| 25 to 44 Years | 40 (48.8%) | $85,000 |
| 45 to 64 Years | 12 (14.6%) | $102,500 |
| 65+ Years | 30 (36.6%) | $0 |
| Total | 82 (100.0%) | $78,333 |
Poverty in Brandonville
Income Below Poverty by Sex and Age in Brandonville
With 8.2% poverty level for males and 13.6% for females among the residents of Brandonville, 25 to 34 year old males and 5 year old females are the most vulnerable to poverty, with 2 males (20.0%) and 3 females (100.0%) in their respective age groups living below the poverty level.
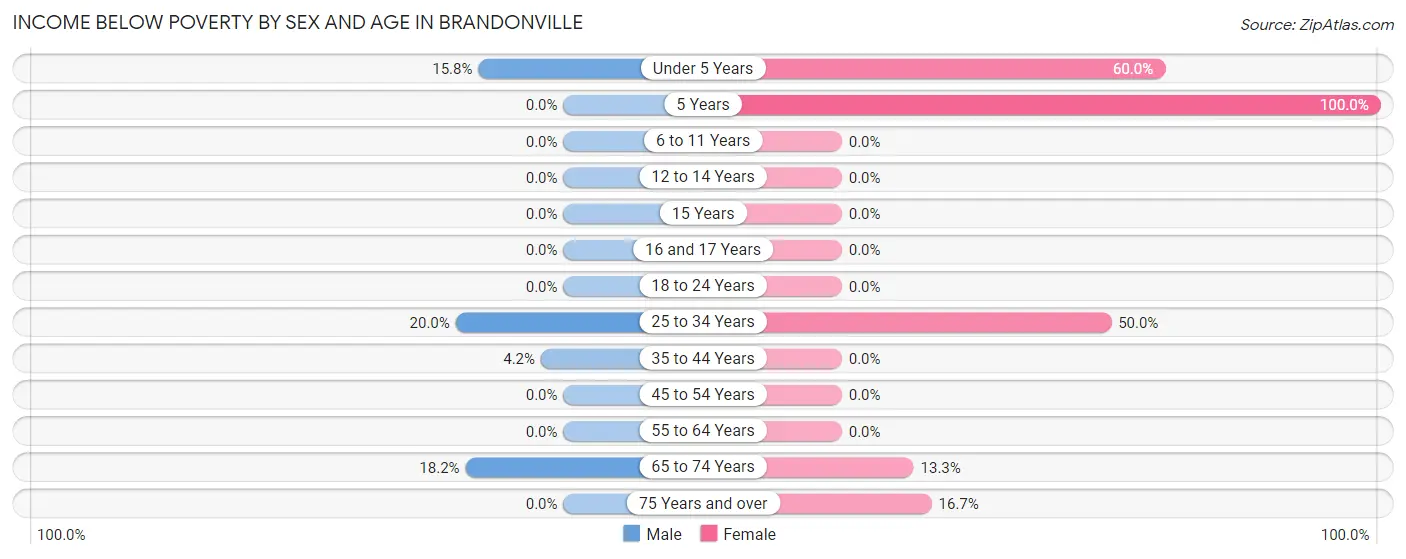
| Age Bracket | Male | Female |
| Under 5 Years | 3 (15.8%) | 3 (60.0%) |
| 5 Years | 0 (0.0%) | 3 (100.0%) |
| 6 to 11 Years | 0 (0.0%) | 0 (0.0%) |
| 12 to 14 Years | 0 (0.0%) | 0 (0.0%) |
| 15 Years | 0 (0.0%) | 0 (0.0%) |
| 16 and 17 Years | 0 (0.0%) | 0 (0.0%) |
| 18 to 24 Years | 0 (0.0%) | 0 (0.0%) |
| 25 to 34 Years | 2 (20.0%) | 9 (50.0%) |
| 35 to 44 Years | 1 (4.2%) | 0 (0.0%) |
| 45 to 54 Years | 0 (0.0%) | 0 (0.0%) |
| 55 to 64 Years | 0 (0.0%) | 0 (0.0%) |
| 65 to 74 Years | 2 (18.2%) | 2 (13.3%) |
| 75 Years and over | 0 (0.0%) | 1 (16.7%) |
| Total | 8 (8.2%) | 18 (13.6%) |
Income Above Poverty by Sex and Age in Brandonville
According to the poverty statistics in Brandonville, males aged 6 to 11 years and females aged 6 to 11 years are the age groups that are most secure financially, with 100.0% of males and 100.0% of females in these age groups living above the poverty line.
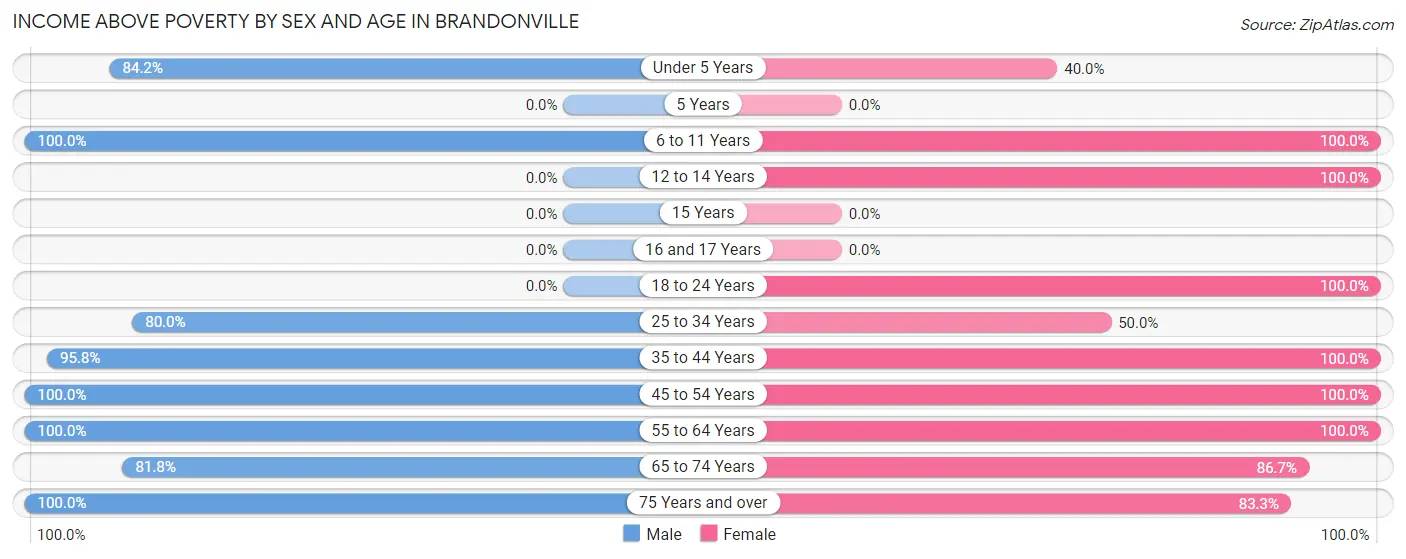
| Age Bracket | Male | Female |
| Under 5 Years | 16 (84.2%) | 2 (40.0%) |
| 5 Years | 0 (0.0%) | 0 (0.0%) |
| 6 to 11 Years | 11 (100.0%) | 25 (100.0%) |
| 12 to 14 Years | 0 (0.0%) | 11 (100.0%) |
| 15 Years | 0 (0.0%) | 0 (0.0%) |
| 16 and 17 Years | 0 (0.0%) | 0 (0.0%) |
| 18 to 24 Years | 0 (0.0%) | 2 (100.0%) |
| 25 to 34 Years | 8 (80.0%) | 9 (50.0%) |
| 35 to 44 Years | 23 (95.8%) | 36 (100.0%) |
| 45 to 54 Years | 7 (100.0%) | 7 (100.0%) |
| 55 to 64 Years | 7 (100.0%) | 4 (100.0%) |
| 65 to 74 Years | 9 (81.8%) | 13 (86.7%) |
| 75 Years and over | 9 (100.0%) | 5 (83.3%) |
| Total | 90 (91.8%) | 114 (86.4%) |
Income Below Poverty Among Married-Couple Families in Brandonville
The poverty statistics for married-couple families in Brandonville show that 4.3% or 2 of the total 47 families live below the poverty line. Families with 3 or 4 children have the highest poverty rate of 100.0%, comprising of 2 families. On the other hand, families with no children have the lowest poverty rate of 0.0%, which includes 0 families.
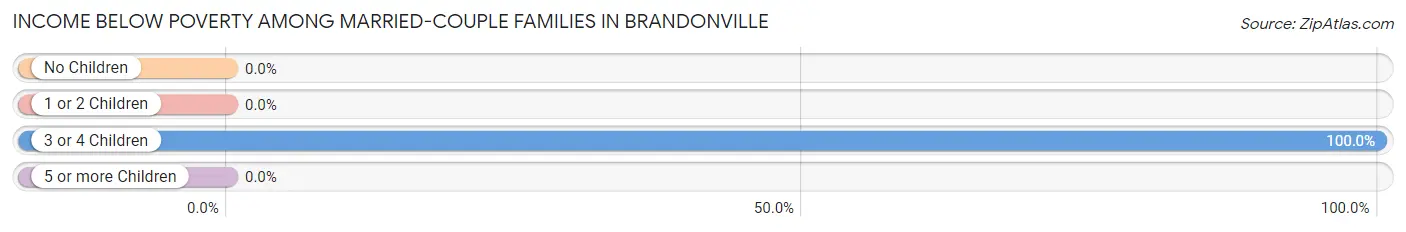
| Children | Above Poverty | Below Poverty |
| No Children | 17 (100.0%) | 0 (0.0%) |
| 1 or 2 Children | 28 (100.0%) | 0 (0.0%) |
| 3 or 4 Children | 0 (0.0%) | 2 (100.0%) |
| 5 or more Children | 0 (0.0%) | 0 (0.0%) |
| Total | 45 (95.7%) | 2 (4.3%) |
Income Below Poverty Among Single-Parent Households in Brandonville
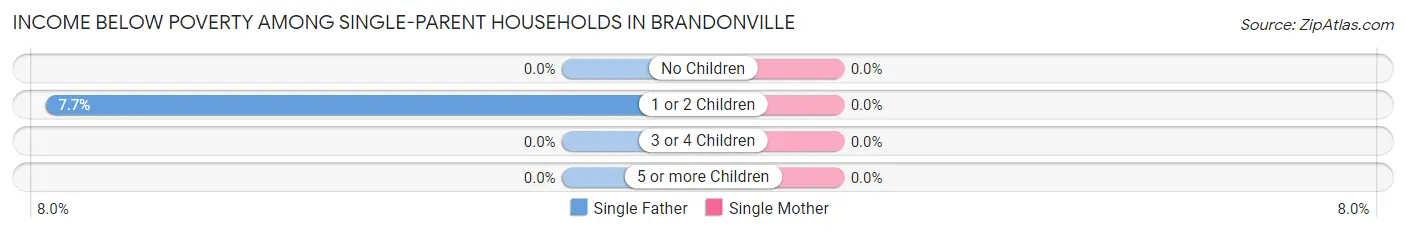
| Children | Single Father | Single Mother |
| No Children | 0 (0.0%) | 0 (0.0%) |
| 1 or 2 Children | 1 (7.7%) | 0 (0.0%) |
| 3 or 4 Children | 0 (0.0%) | 0 (0.0%) |
| 5 or more Children | 0 (0.0%) | 0 (0.0%) |
| Total | 1 (7.7%) | 0 (0.0%) |
Income Below Poverty Among Married-Couple vs Single-Parent Households in Brandonville
The poverty data for Brandonville shows that 2 of the married-couple family households (4.3%) and 1 of the single-parent households (5.9%) are living below the poverty level. Within the married-couple family households, those with 3 or 4 children have the highest poverty rate, with 2 households (100.0%) falling below the poverty line. Among the single-parent households, those with 1 or 2 children have the highest poverty rate, with 1 household (7.7%) living below poverty.
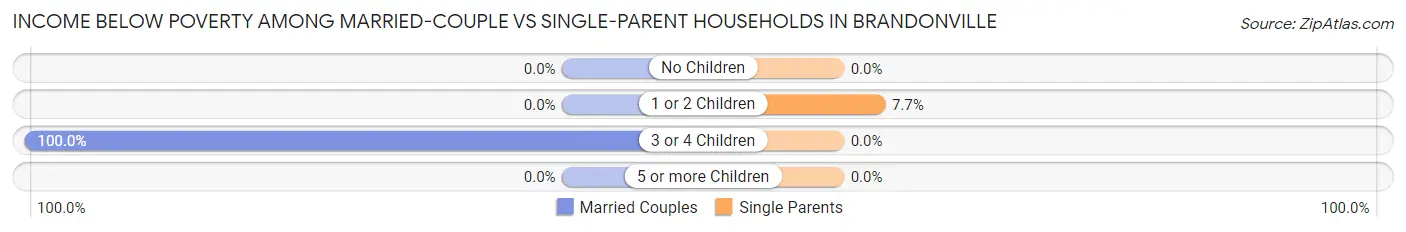
| Children | Married-Couple Families | Single-Parent Households |
| No Children | 0 (0.0%) | 0 (0.0%) |
| 1 or 2 Children | 0 (0.0%) | 1 (7.7%) |
| 3 or 4 Children | 2 (100.0%) | 0 (0.0%) |
| 5 or more Children | 0 (0.0%) | 0 (0.0%) |
| Total | 2 (4.3%) | 1 (5.9%) |
Race in Brandonville
The most populous races in Brandonville are White / Caucasian (227 | 98.7%), and Asian (3 | 1.3%).
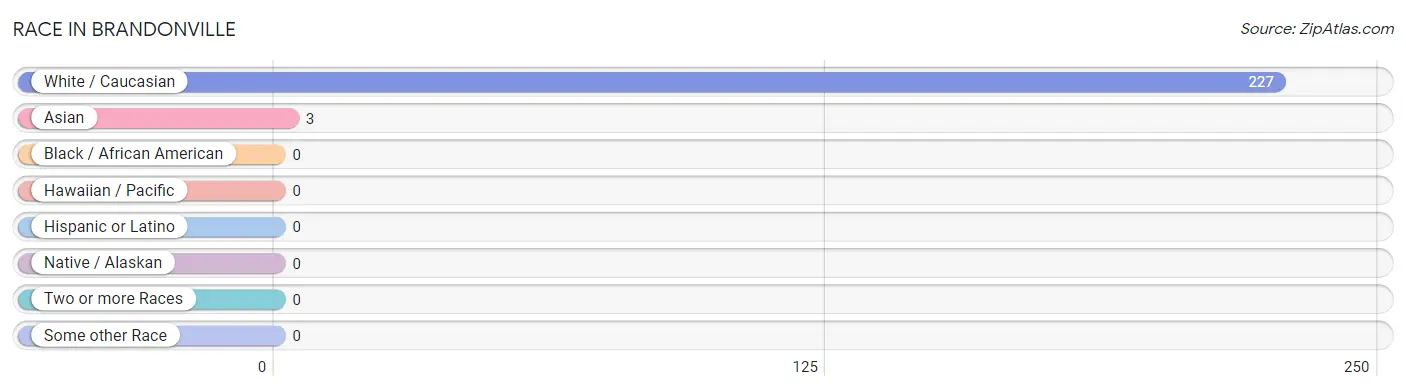
| Race | # Population | % Population |
| Asian | 3 | 1.3% |
| Black / African American | 0 | 0.0% |
| Hawaiian / Pacific | 0 | 0.0% |
| Hispanic or Latino | 0 | 0.0% |
| Native / Alaskan | 0 | 0.0% |
| White / Caucasian | 227 | 98.7% |
| Two or more Races | 0 | 0.0% |
| Some other Race | 0 | 0.0% |
| Total | 230 | 100.0% |
Ancestry in Brandonville
The most populous ancestries reported in Brandonville are Irish (78 | 33.9%), German (69 | 30.0%), American (61 | 26.5%), Italian (21 | 9.1%), and English (7 | 3.0%), together accounting for 102.6% of all Brandonville residents.
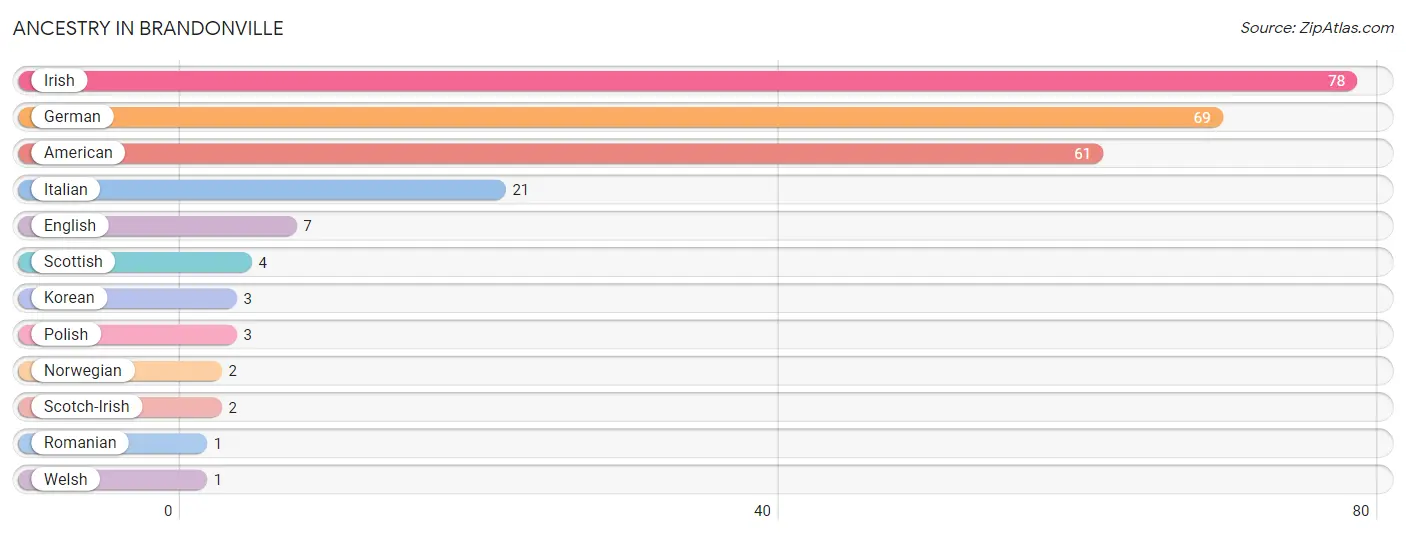
| Ancestry | # Population | % Population |
| American | 61 | 26.5% |
| English | 7 | 3.0% |
| German | 69 | 30.0% |
| Irish | 78 | 33.9% |
| Italian | 21 | 9.1% |
| Korean | 3 | 1.3% |
| Norwegian | 2 | 0.9% |
| Polish | 3 | 1.3% |
| Romanian | 1 | 0.4% |
| Scotch-Irish | 2 | 0.9% |
| Scottish | 4 | 1.7% |
| Welsh | 1 | 0.4% | View All 12 Rows |
Immigrants in Brandonville

| Immigration Origin | # Population | % Population | View All 0 Rows |
Sex and Age in Brandonville
Sex and Age in Brandonville
The most populous age groups in Brandonville are Under 5 Years (19 | 19.4%) for men and 10 to 14 Years (24 | 18.2%) for women.
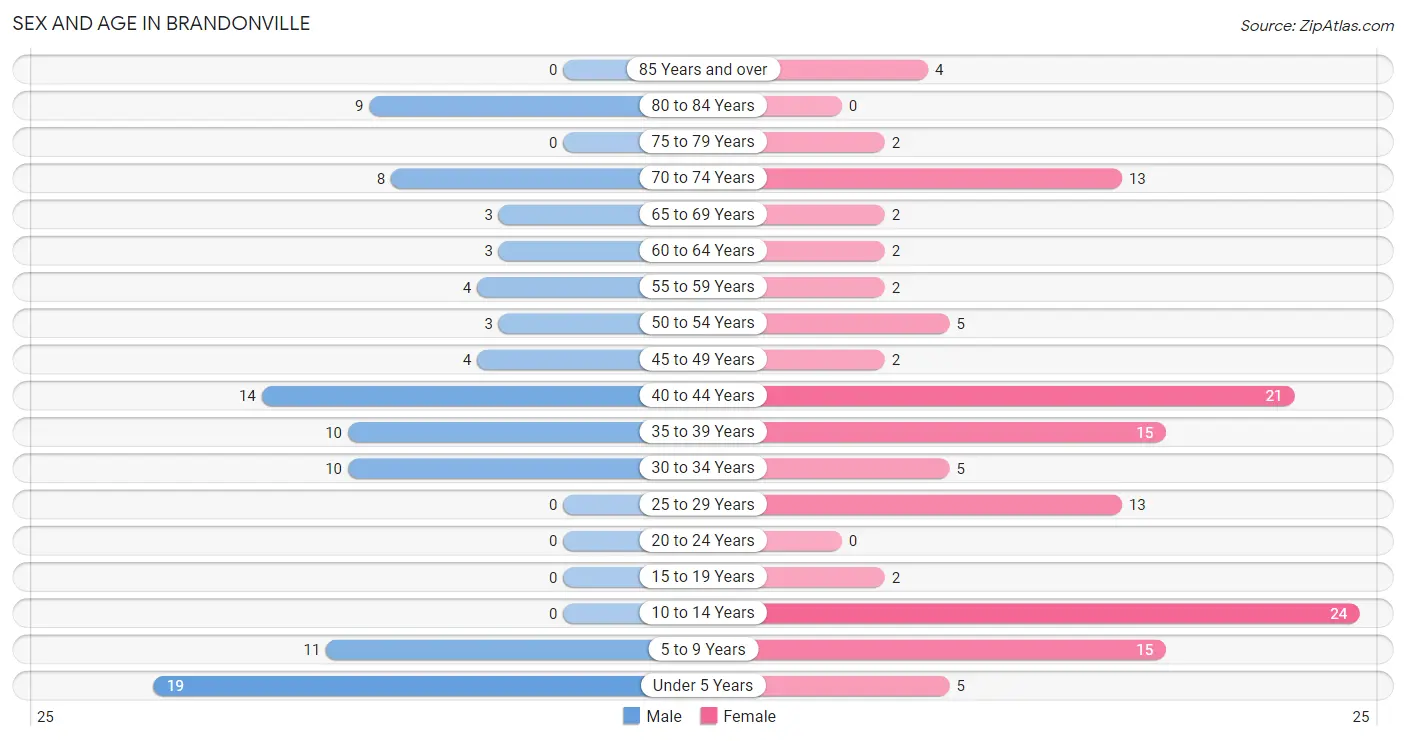
| Age Bracket | Male | Female |
| Under 5 Years | 19 (19.4%) | 5 (3.8%) |
| 5 to 9 Years | 11 (11.2%) | 15 (11.4%) |
| 10 to 14 Years | 0 (0.0%) | 24 (18.2%) |
| 15 to 19 Years | 0 (0.0%) | 2 (1.5%) |
| 20 to 24 Years | 0 (0.0%) | 0 (0.0%) |
| 25 to 29 Years | 0 (0.0%) | 13 (9.9%) |
| 30 to 34 Years | 10 (10.2%) | 5 (3.8%) |
| 35 to 39 Years | 10 (10.2%) | 15 (11.4%) |
| 40 to 44 Years | 14 (14.3%) | 21 (15.9%) |
| 45 to 49 Years | 4 (4.1%) | 2 (1.5%) |
| 50 to 54 Years | 3 (3.1%) | 5 (3.8%) |
| 55 to 59 Years | 4 (4.1%) | 2 (1.5%) |
| 60 to 64 Years | 3 (3.1%) | 2 (1.5%) |
| 65 to 69 Years | 3 (3.1%) | 2 (1.5%) |
| 70 to 74 Years | 8 (8.2%) | 13 (9.9%) |
| 75 to 79 Years | 0 (0.0%) | 2 (1.5%) |
| 80 to 84 Years | 9 (9.2%) | 0 (0.0%) |
| 85 Years and over | 0 (0.0%) | 4 (3.0%) |
| Total | 98 (100.0%) | 132 (100.0%) |
Families and Households in Brandonville
Median Family Size in Brandonville
The median family size in Brandonville is 3.13 persons per family, with married-couple families (47 | 73.4%) accounting for the largest median family size of 3.26 persons per family. On the other hand, single female/mother families (4 | 6.2%) represent the smallest median family size with 1.75 persons per family.
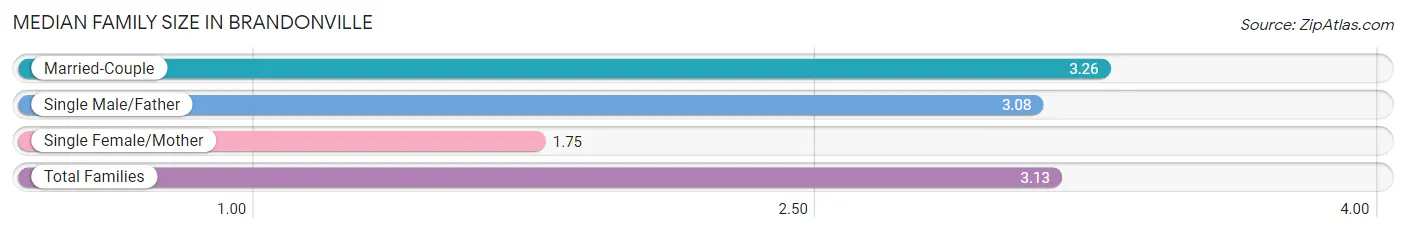
| Family Type | # Families | Family Size |
| Married-Couple | 47 (73.4%) | 3.26 |
| Single Male/Father | 13 (20.3%) | 3.08 |
| Single Female/Mother | 4 (6.2%) | 1.75 |
| Total Families | 64 (100.0%) | 3.13 |
Median Household Size in Brandonville
The median household size in Brandonville is 2.80 persons per household, with single male/father households (13 | 15.9%) accounting for the largest median household size of 3.54 persons per household. non-family households (18 | 22.0%) represent the smallest median household size with 1.33 persons per household.
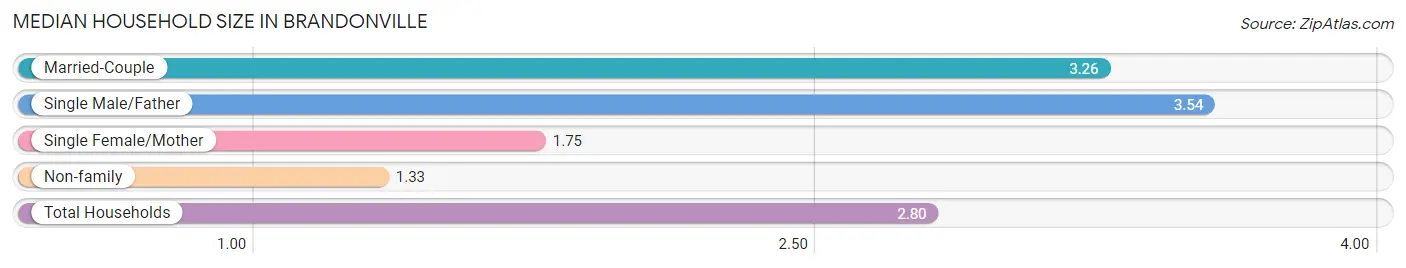
| Household Type | # Households | Household Size |
| Married-Couple | 47 (57.3%) | 3.26 |
| Single Male/Father | 13 (15.9%) | 3.54 |
| Single Female/Mother | 4 (4.9%) | 1.75 |
| Non-family | 18 (22.0%) | 1.33 |
| Total Households | 82 (100.0%) | 2.80 |
Household Size by Marriage Status in Brandonville
Out of a total of 82 households in Brandonville, 64 (78.0%) are family households, while 18 (22.0%) are nonfamily households. The most numerous type of family households are 4-person households, comprising 25, and the most common type of nonfamily households are 1-person households, comprising 12.
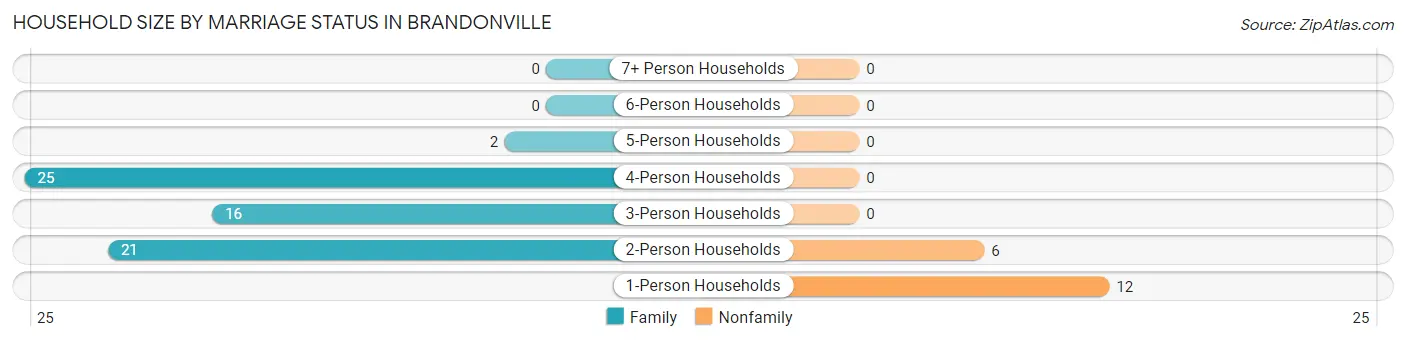
| Household Size | Family Households | Nonfamily Households |
| 1-Person Households | - | 12 (14.6%) |
| 2-Person Households | 21 (25.6%) | 6 (7.3%) |
| 3-Person Households | 16 (19.5%) | 0 (0.0%) |
| 4-Person Households | 25 (30.5%) | 0 (0.0%) |
| 5-Person Households | 2 (2.4%) | 0 (0.0%) |
| 6-Person Households | 0 (0.0%) | 0 (0.0%) |
| 7+ Person Households | 0 (0.0%) | 0 (0.0%) |
| Total | 64 (78.0%) | 18 (22.0%) |
Female Fertility in Brandonville
Fertility by Age in Brandonville
Average fertility rate in Brandonville is 186.0 births per 1,000 women. Women in the age bracket of 20 to 34 years have the highest fertility rate with 611.0 births per 1,000 women. Women in the age bracket of 20 to 34 years acount for 100.0% of all women with births.
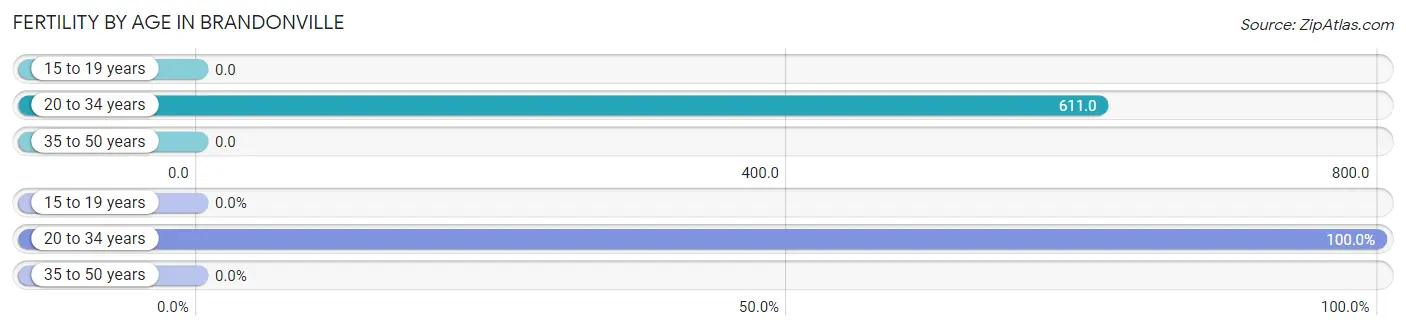
| Age Bracket | Women with Births | Births / 1,000 Women |
| 15 to 19 years | 0 (0.0%) | 0.0 |
| 20 to 34 years | 11 (100.0%) | 611.0 |
| 35 to 50 years | 0 (0.0%) | 0.0 |
| Total | 11 (100.0%) | 186.0 |
Fertility by Age by Marriage Status in Brandonville
54.5% of women with births (11) in Brandonville are married. The highest percentage of unmarried women with births falls into 20 to 34 years age bracket with 45.5% of them unmarried at the time of birth, while the lowest percentage of unmarried women with births belong to 20 to 34 years age bracket with 45.5% of them unmarried.
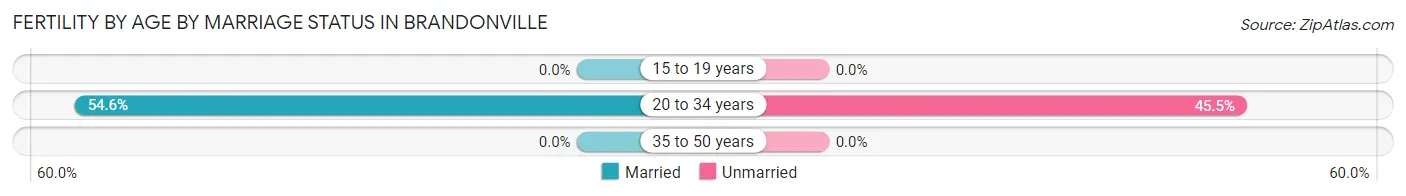
| Age Bracket | Married | Unmarried |
| 15 to 19 years | 0 (0.0%) | 0 (0.0%) |
| 20 to 34 years | 6 (54.5%) | 5 (45.5%) |
| 35 to 50 years | 0 (0.0%) | 0 (0.0%) |
| Total | 6 (54.5%) | 5 (45.5%) |
Fertility by Education in Brandonville
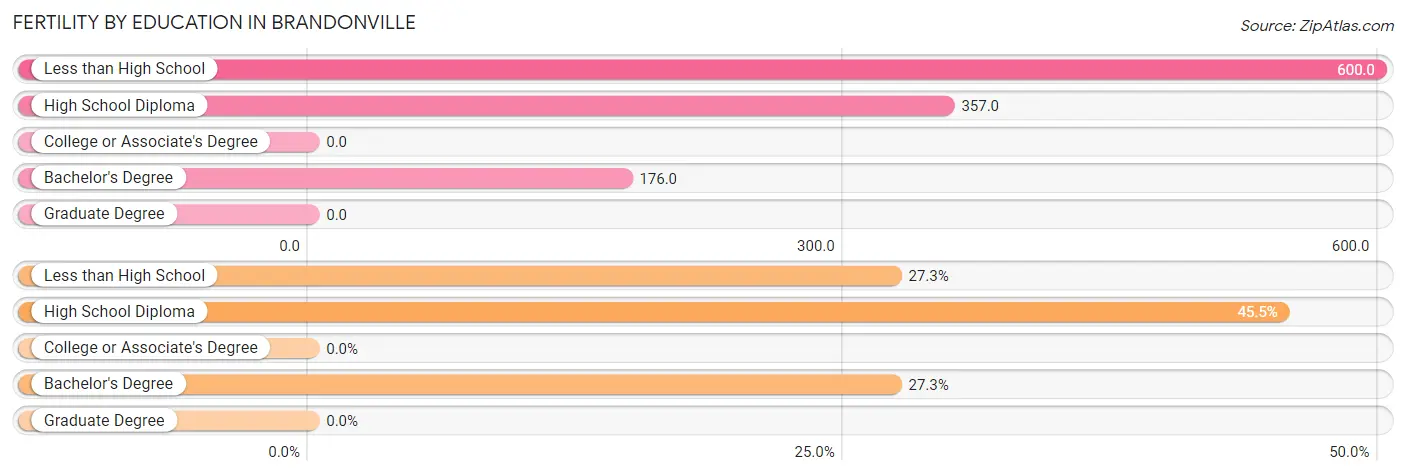
| Educational Attainment | Women with Births | Births / 1,000 Women |
| Less than High School | 3 (27.3%) | 600.0 |
| High School Diploma | 5 (45.5%) | 357.0 |
| College or Associate's Degree | 0 (0.0%) | 0.0 |
| Bachelor's Degree | 3 (27.3%) | 176.0 |
| Graduate Degree | 0 (0.0%) | 0.0 |
| Total | 11 (100.0%) | 186.0 |
Fertility by Education by Marriage Status in Brandonville
45.5% of women with births in Brandonville are unmarried. Women with the educational attainment of less than high school are most likely to be married with 100.0% of them married at childbirth, while women with the educational attainment of high school diploma are least likely to be married with 100.0% of them unmarried at childbirth.
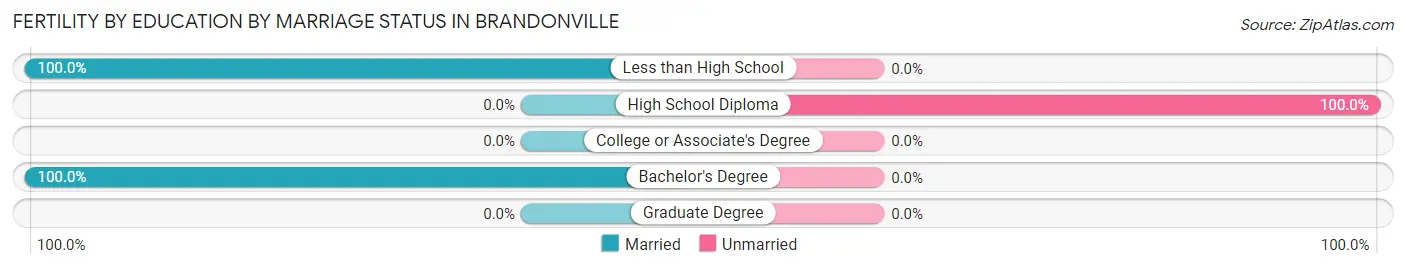
| Educational Attainment | Married | Unmarried |
| Less than High School | 3 (100.0%) | 0 (0.0%) |
| High School Diploma | 0 (0.0%) | 5 (100.0%) |
| College or Associate's Degree | 0 (0.0%) | 0 (0.0%) |
| Bachelor's Degree | 3 (100.0%) | 0 (0.0%) |
| Graduate Degree | 0 (0.0%) | 0 (0.0%) |
| Total | 6 (54.5%) | 5 (45.5%) |
Employment Characteristics in Brandonville
Employment by Class of Employer in Brandonville
Among the 101 employed individuals in Brandonville, private company employees (61 | 60.4%), self-employed (incorporated) (13 | 12.9%), and not-for-profit organizations (13 | 12.9%) make up the most common classes of employment.
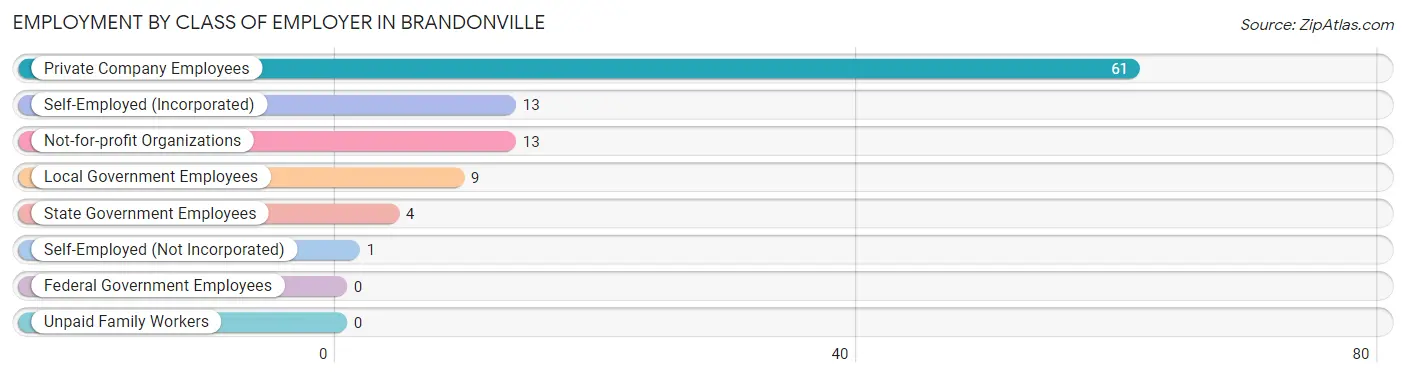
| Employer Class | # Employees | % Employees |
| Private Company Employees | 61 | 60.4% |
| Self-Employed (Incorporated) | 13 | 12.9% |
| Self-Employed (Not Incorporated) | 1 | 1.0% |
| Not-for-profit Organizations | 13 | 12.9% |
| Local Government Employees | 9 | 8.9% |
| State Government Employees | 4 | 4.0% |
| Federal Government Employees | 0 | 0.0% |
| Unpaid Family Workers | 0 | 0.0% |
| Total | 101 | 100.0% |
Employment Status by Age in Brandonville
According to the labor force statistics for Brandonville, out of the total population over 16 years of age (156), 69.9% or 109 individuals are in the labor force, with 7.3% or 8 of them unemployed. The age group with the highest labor force participation rate is 25 to 29 years, with 100.0% or 13 individuals in the labor force. Within the labor force, the 55 to 59 years age range has the highest percentage of unemployed individuals, with 50.0% or 2 of them being unemployed.
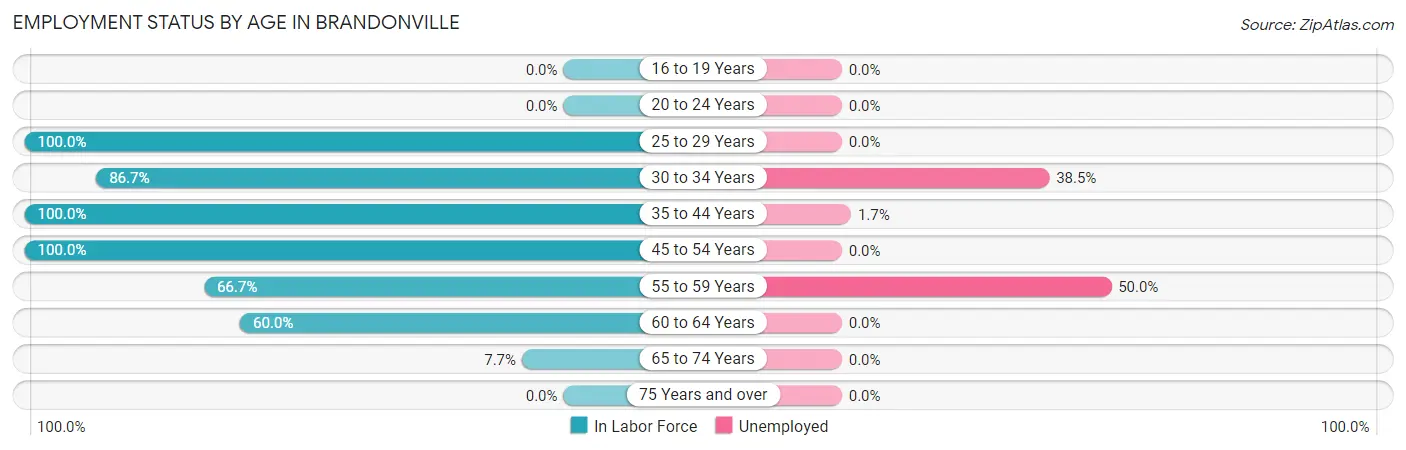
| Age Bracket | In Labor Force | Unemployed |
| 16 to 19 Years | 0 (0.0%) | 0 (0.0%) |
| 20 to 24 Years | 0 (0.0%) | 0 (0.0%) |
| 25 to 29 Years | 13 (100.0%) | 0 (0.0%) |
| 30 to 34 Years | 13 (86.7%) | 5 (38.5%) |
| 35 to 44 Years | 60 (100.0%) | 1 (1.7%) |
| 45 to 54 Years | 14 (100.0%) | 0 (0.0%) |
| 55 to 59 Years | 4 (66.7%) | 2 (50.0%) |
| 60 to 64 Years | 3 (60.0%) | 0 (0.0%) |
| 65 to 74 Years | 2 (7.7%) | 0 (0.0%) |
| 75 Years and over | 0 (0.0%) | 0 (0.0%) |
| Total | 109 (69.9%) | 8 (7.3%) |
Employment Status by Educational Attainment in Brandonville
According to labor force statistics for Brandonville, 94.7% of individuals (107) out of the total population between 25 and 64 years of age (113) are in the labor force, with 7.5% or 8 of them being unemployed. The group with the highest labor force participation rate are those with the educational attainment of less than high school, with 100.0% or 4 individuals in the labor force. Within the labor force, individuals with high school diploma education have the highest percentage of unemployment, with 16.7% or 7 of them being unemployed.
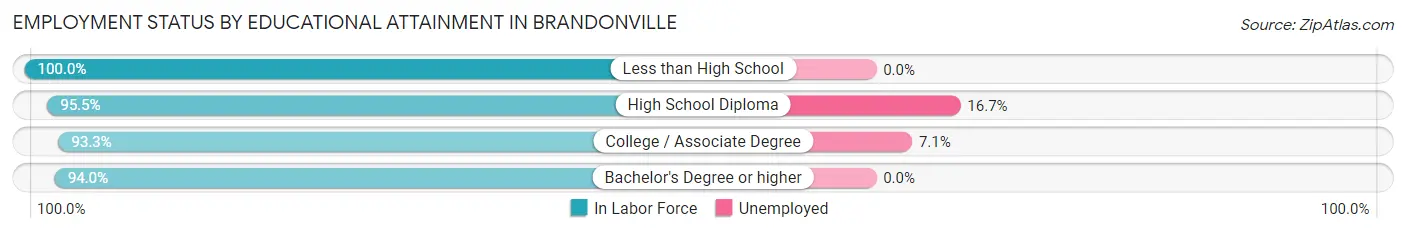
| Educational Attainment | In Labor Force | Unemployed |
| Less than High School | 4 (100.0%) | 0 (0.0%) |
| High School Diploma | 42 (95.5%) | 7 (16.7%) |
| College / Associate Degree | 14 (93.3%) | 1 (7.1%) |
| Bachelor's Degree or higher | 47 (94.0%) | 0 (0.0%) |
| Total | 107 (94.7%) | 8 (7.5%) |
Employment Occupations by Sex in Brandonville
Management, Business, Science and Arts Occupations
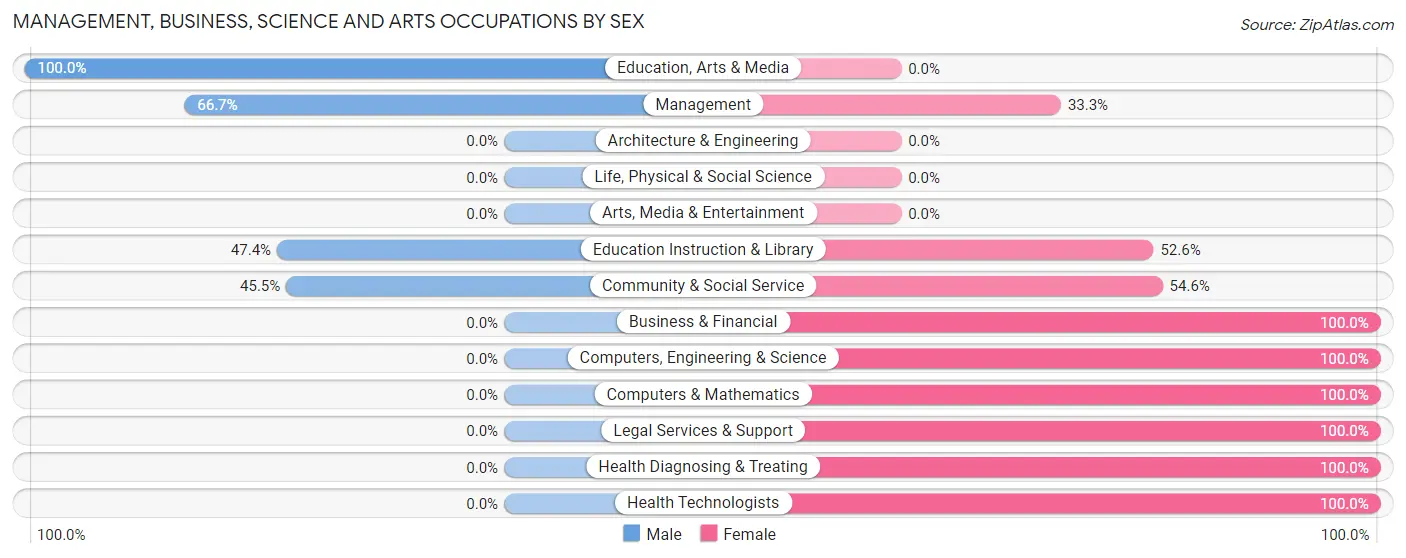
The most common Management, Business, Science and Arts occupations in Brandonville are Community & Social Service (22 | 21.8%), Education Instruction & Library (19 | 18.8%), Computers, Engineering & Science (14 | 13.9%), Computers & Mathematics (14 | 13.9%), and Health Diagnosing & Treating (5 | 5.0%).
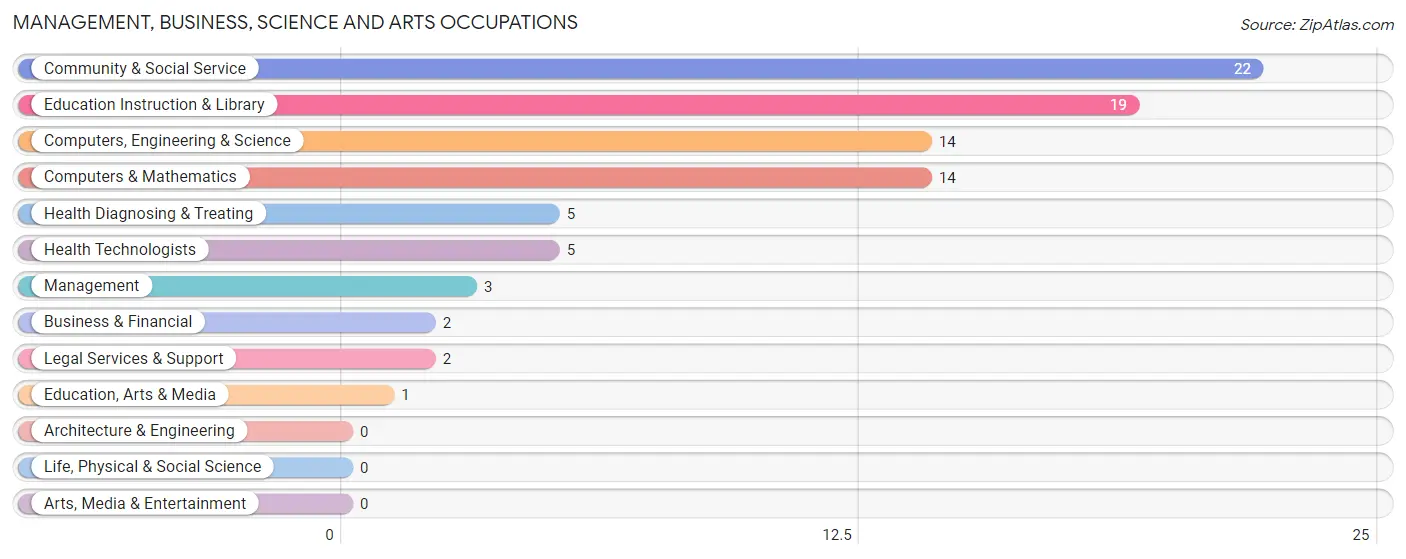
Management, Business, Science and Arts Occupations by Sex
Within the Management, Business, Science and Arts occupations in Brandonville, the most male-oriented occupations are Education, Arts & Media (100.0%), Management (66.7%), and Education Instruction & Library (47.4%), while the most female-oriented occupations are Business & Financial (100.0%), Computers, Engineering & Science (100.0%), and Computers & Mathematics (100.0%).
| Occupation | Male | Female |
| Management | 2 (66.7%) | 1 (33.3%) |
| Business & Financial | 0 (0.0%) | 2 (100.0%) |
| Computers, Engineering & Science | 0 (0.0%) | 14 (100.0%) |
| Computers & Mathematics | 0 (0.0%) | 14 (100.0%) |
| Architecture & Engineering | 0 (0.0%) | 0 (0.0%) |
| Life, Physical & Social Science | 0 (0.0%) | 0 (0.0%) |
| Community & Social Service | 10 (45.5%) | 12 (54.5%) |
| Education, Arts & Media | 1 (100.0%) | 0 (0.0%) |
| Legal Services & Support | 0 (0.0%) | 2 (100.0%) |
| Education Instruction & Library | 9 (47.4%) | 10 (52.6%) |
| Arts, Media & Entertainment | 0 (0.0%) | 0 (0.0%) |
| Health Diagnosing & Treating | 0 (0.0%) | 5 (100.0%) |
| Health Technologists | 0 (0.0%) | 5 (100.0%) |
| Total (Category) | 12 (26.1%) | 34 (73.9%) |
| Total (Overall) | 42 (41.6%) | 59 (58.4%) |
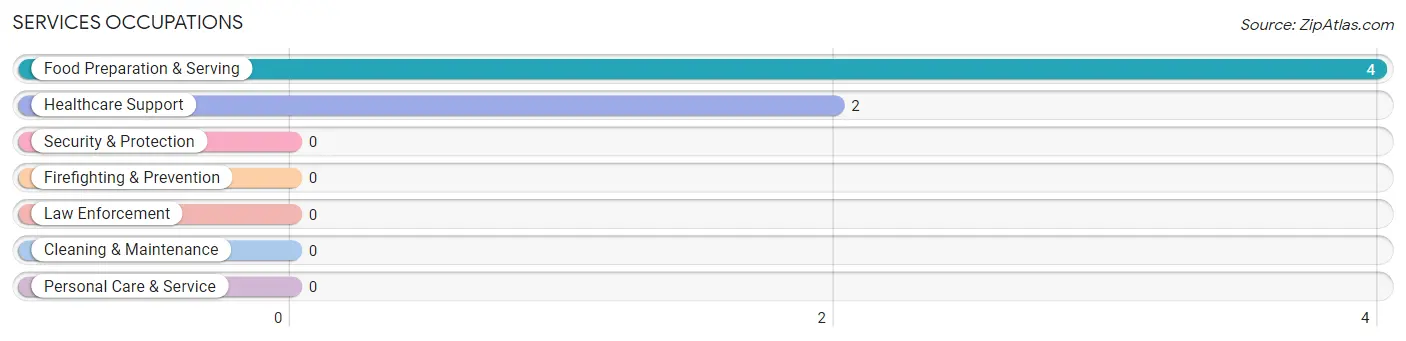
Services Occupations
The most common Services occupations in Brandonville are Food Preparation & Serving (4 | 4.0%), and Healthcare Support (2 | 2.0%).
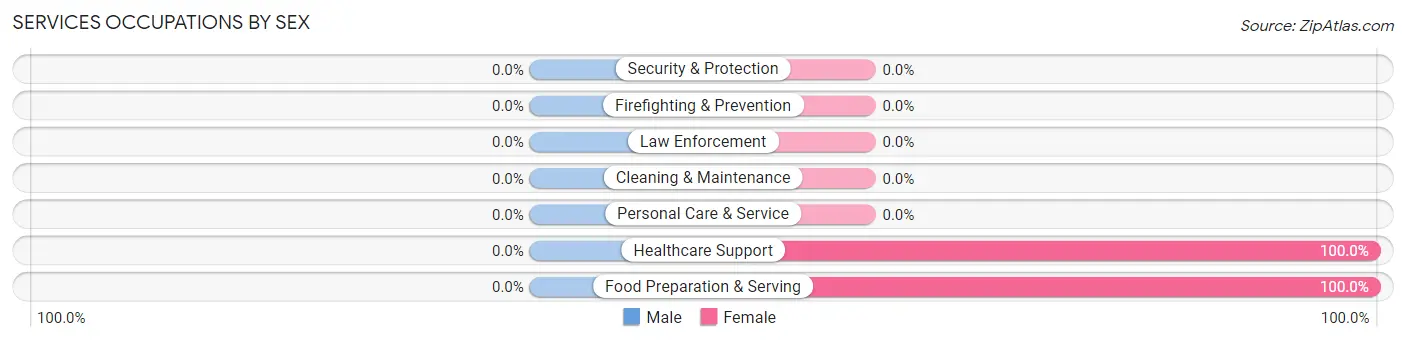
Services Occupations by Sex
| Occupation | Male | Female |
| Healthcare Support | 0 (0.0%) | 2 (100.0%) |
| Security & Protection | 0 (0.0%) | 0 (0.0%) |
| Firefighting & Prevention | 0 (0.0%) | 0 (0.0%) |
| Law Enforcement | 0 (0.0%) | 0 (0.0%) |
| Food Preparation & Serving | 0 (0.0%) | 4 (100.0%) |
| Cleaning & Maintenance | 0 (0.0%) | 0 (0.0%) |
| Personal Care & Service | 0 (0.0%) | 0 (0.0%) |
| Total (Category) | 0 (0.0%) | 6 (100.0%) |
| Total (Overall) | 42 (41.6%) | 59 (58.4%) |
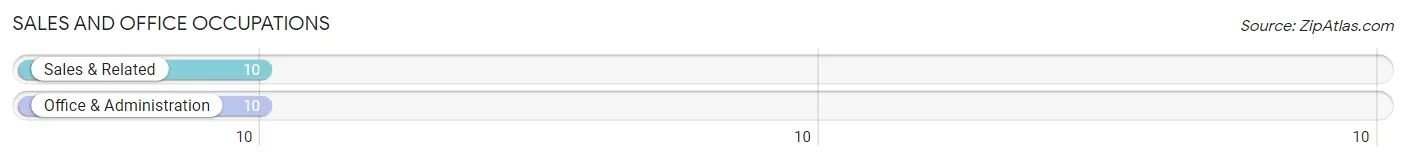
Sales and Office Occupations
The most common Sales and Office occupations in Brandonville are Sales & Related (10 | 9.9%), and Office & Administration (10 | 9.9%).
Sales and Office Occupations by Sex
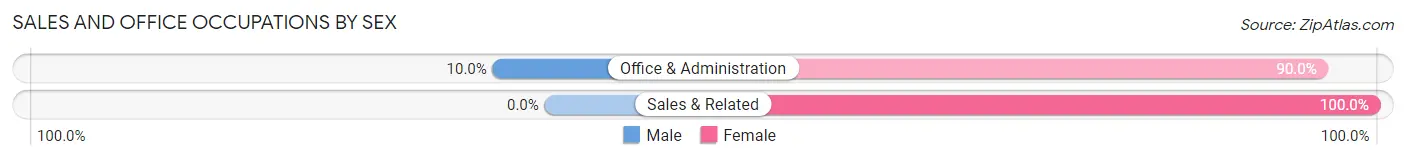
| Occupation | Male | Female |
| Sales & Related | 0 (0.0%) | 10 (100.0%) |
| Office & Administration | 1 (10.0%) | 9 (90.0%) |
| Total (Category) | 1 (5.0%) | 19 (95.0%) |
| Total (Overall) | 42 (41.6%) | 59 (58.4%) |
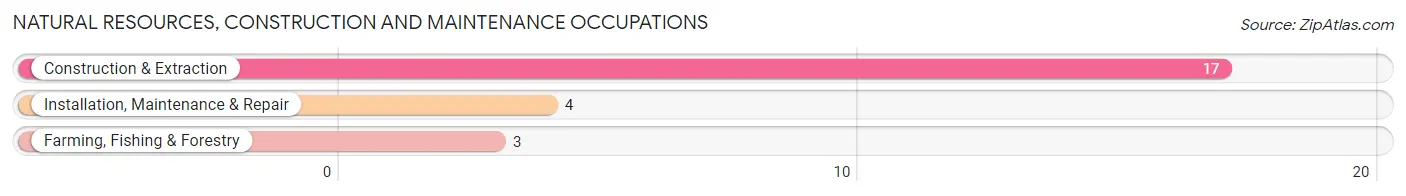
Natural Resources, Construction and Maintenance Occupations
The most common Natural Resources, Construction and Maintenance occupations in Brandonville are Construction & Extraction (17 | 16.8%), Installation, Maintenance & Repair (4 | 4.0%), and Farming, Fishing & Forestry (3 | 3.0%).
Natural Resources, Construction and Maintenance Occupations by Sex
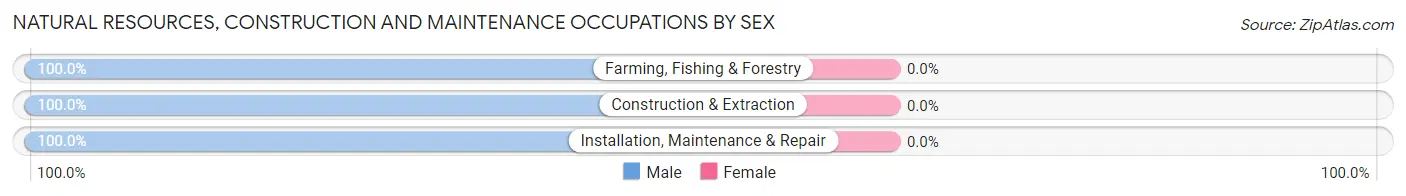
| Occupation | Male | Female |
| Farming, Fishing & Forestry | 3 (100.0%) | 0 (0.0%) |
| Construction & Extraction | 17 (100.0%) | 0 (0.0%) |
| Installation, Maintenance & Repair | 4 (100.0%) | 0 (0.0%) |
| Total (Category) | 24 (100.0%) | 0 (0.0%) |
| Total (Overall) | 42 (41.6%) | 59 (58.4%) |
Production, Transportation and Moving Occupations
The most common Production, Transportation and Moving occupations in Brandonville are Production (2 | 2.0%), Transportation (2 | 2.0%), and Material Moving (1 | 1.0%).
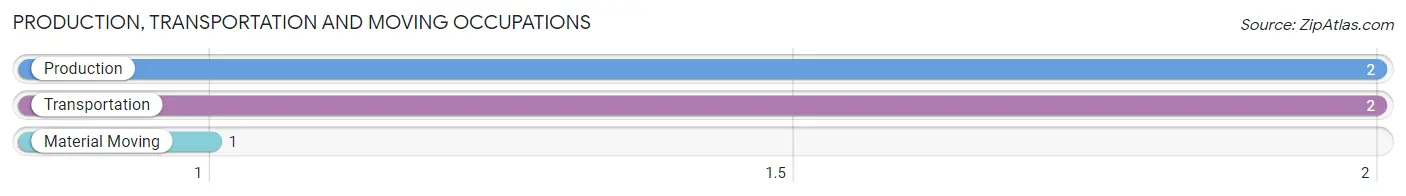
Production, Transportation and Moving Occupations by Sex
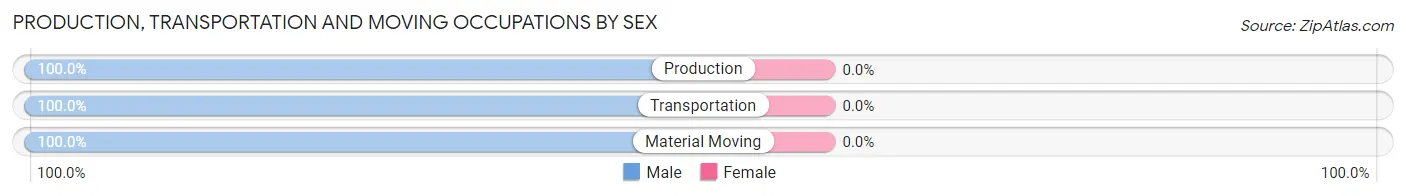
| Occupation | Male | Female |
| Production | 2 (100.0%) | 0 (0.0%) |
| Transportation | 2 (100.0%) | 0 (0.0%) |
| Material Moving | 1 (100.0%) | 0 (0.0%) |
| Total (Category) | 5 (100.0%) | 0 (0.0%) |
| Total (Overall) | 42 (41.6%) | 59 (58.4%) |
Employment Industries by Sex in Brandonville
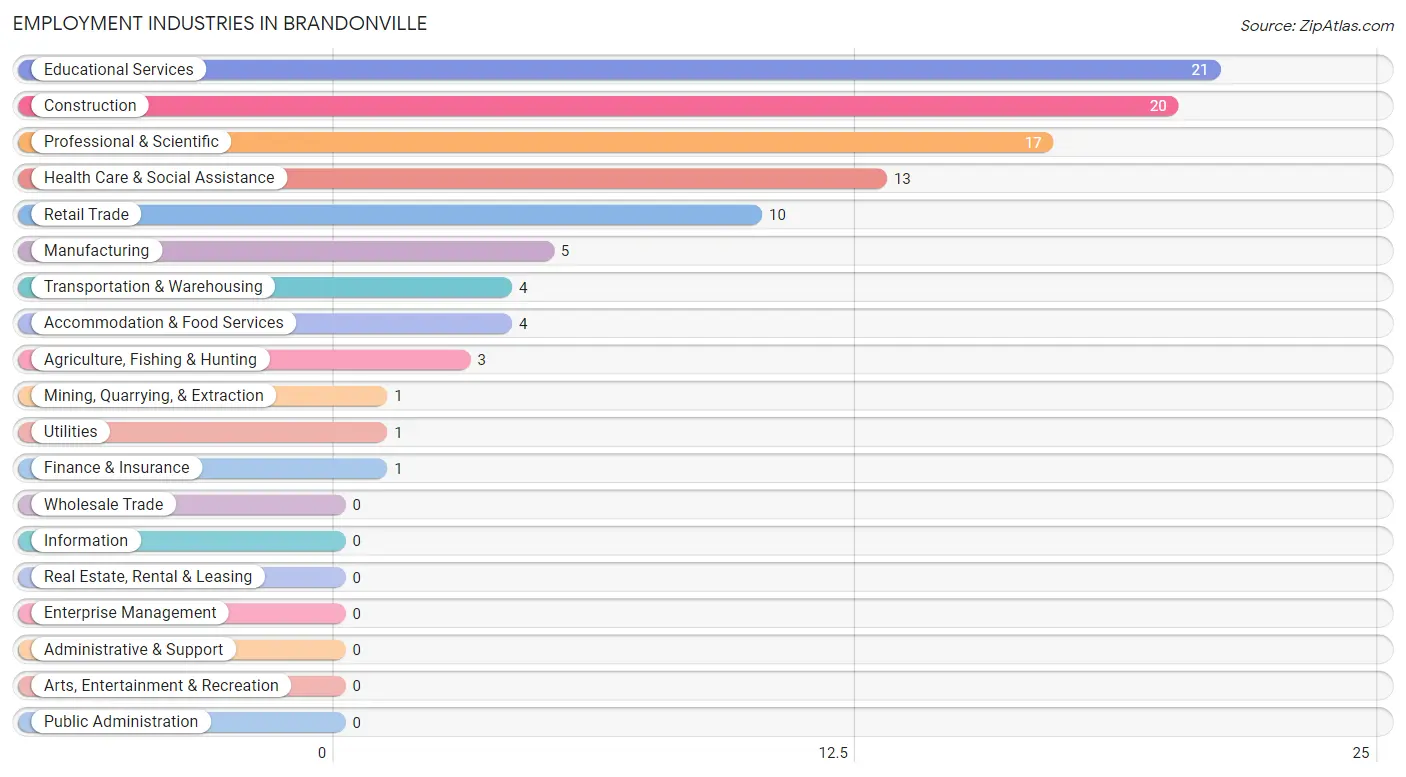
Employment Industries in Brandonville
The major employment industries in Brandonville include Educational Services (21 | 20.8%), Construction (20 | 19.8%), Professional & Scientific (17 | 16.8%), Health Care & Social Assistance (13 | 12.9%), and Retail Trade (10 | 9.9%).
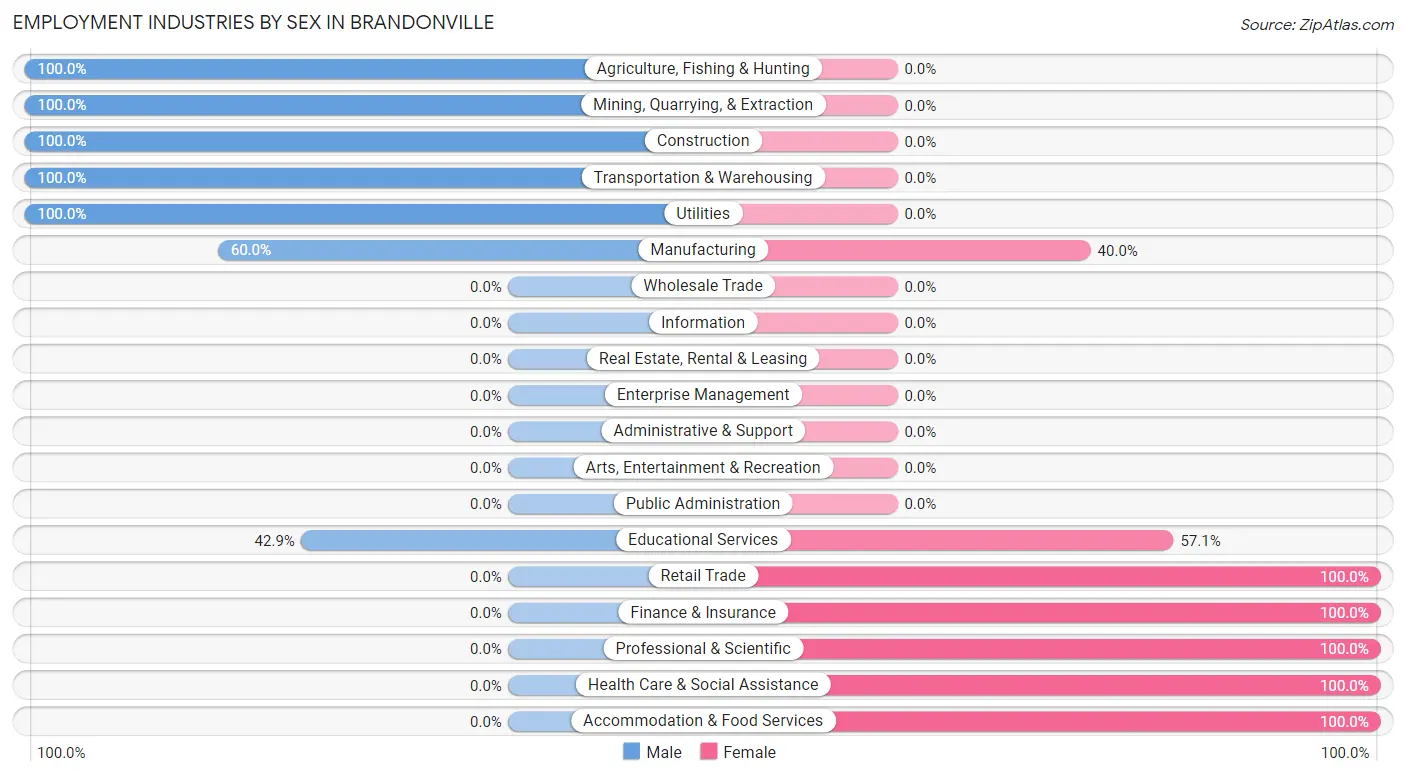
Employment Industries by Sex in Brandonville
The Brandonville industries that see more men than women are Agriculture, Fishing & Hunting (100.0%), Mining, Quarrying, & Extraction (100.0%), and Construction (100.0%), whereas the industries that tend to have a higher number of women are Retail Trade (100.0%), Finance & Insurance (100.0%), and Professional & Scientific (100.0%).
| Industry | Male | Female |
| Agriculture, Fishing & Hunting | 3 (100.0%) | 0 (0.0%) |
| Mining, Quarrying, & Extraction | 1 (100.0%) | 0 (0.0%) |
| Construction | 20 (100.0%) | 0 (0.0%) |
| Manufacturing | 3 (60.0%) | 2 (40.0%) |
| Wholesale Trade | 0 (0.0%) | 0 (0.0%) |
| Retail Trade | 0 (0.0%) | 10 (100.0%) |
| Transportation & Warehousing | 4 (100.0%) | 0 (0.0%) |
| Utilities | 1 (100.0%) | 0 (0.0%) |
| Information | 0 (0.0%) | 0 (0.0%) |
| Finance & Insurance | 0 (0.0%) | 1 (100.0%) |
| Real Estate, Rental & Leasing | 0 (0.0%) | 0 (0.0%) |
| Professional & Scientific | 0 (0.0%) | 17 (100.0%) |
| Enterprise Management | 0 (0.0%) | 0 (0.0%) |
| Administrative & Support | 0 (0.0%) | 0 (0.0%) |
| Educational Services | 9 (42.9%) | 12 (57.1%) |
| Health Care & Social Assistance | 0 (0.0%) | 13 (100.0%) |
| Arts, Entertainment & Recreation | 0 (0.0%) | 0 (0.0%) |
| Accommodation & Food Services | 0 (0.0%) | 4 (100.0%) |
| Public Administration | 0 (0.0%) | 0 (0.0%) |
| Total | 42 (41.6%) | 59 (58.4%) |
Education in Brandonville
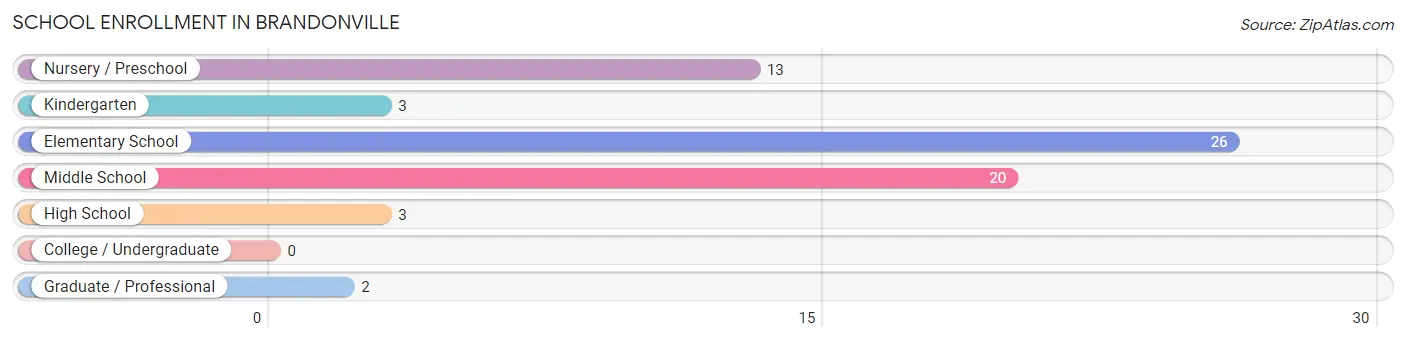
School Enrollment in Brandonville
The most common levels of schooling among the 67 students in Brandonville are elementary school (26 | 38.8%), middle school (20 | 29.8%), and nursery / preschool (13 | 19.4%).
| School Level | # Students | % Students |
| Nursery / Preschool | 13 | 19.4% |
| Kindergarten | 3 | 4.5% |
| Elementary School | 26 | 38.8% |
| Middle School | 20 | 29.8% |
| High School | 3 | 4.5% |
| College / Undergraduate | 0 | 0.0% |
| Graduate / Professional | 2 | 3.0% |
| Total | 67 | 100.0% |
School Enrollment by Age by Funding Source in Brandonville
Out of a total of 67 students who are enrolled in schools in Brandonville, 23 (34.3%) attend a private institution, while the remaining 44 (65.7%) are enrolled in public schools. The age group of 5 to 9 year old has the highest likelihood of being enrolled in private schools, with 11 (42.3% in the age bracket) enrolled. Conversely, the age group of 18 to 19 year olds has the lowest likelihood of being enrolled in a private school, with 2 (100.0% in the age bracket) attending a public institution.
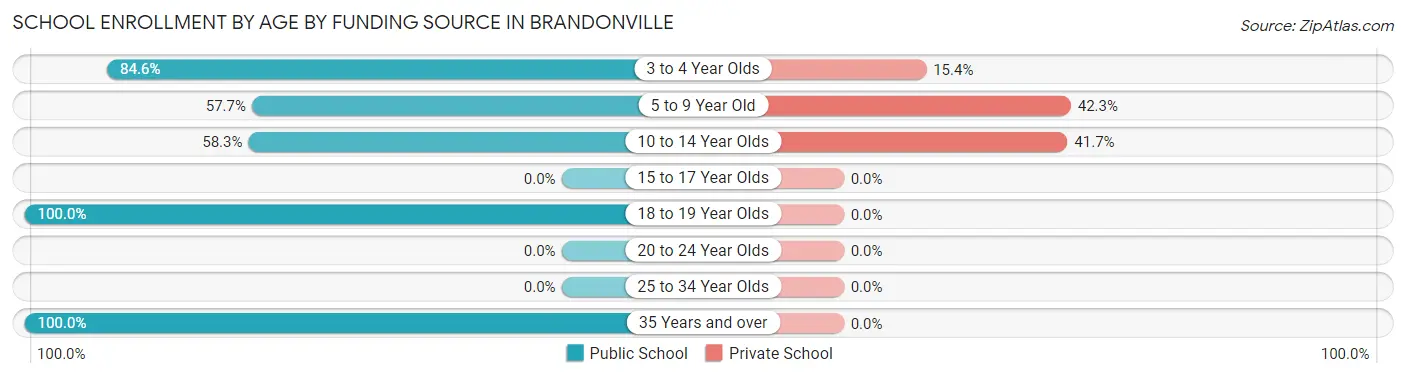
| Age Bracket | Public School | Private School |
| 3 to 4 Year Olds | 11 (84.6%) | 2 (15.4%) |
| 5 to 9 Year Old | 15 (57.7%) | 11 (42.3%) |
| 10 to 14 Year Olds | 14 (58.3%) | 10 (41.7%) |
| 15 to 17 Year Olds | 0 (0.0%) | 0 (0.0%) |
| 18 to 19 Year Olds | 2 (100.0%) | 0 (0.0%) |
| 20 to 24 Year Olds | 0 (0.0%) | 0 (0.0%) |
| 25 to 34 Year Olds | 0 (0.0%) | 0 (0.0%) |
| 35 Years and over | 2 (100.0%) | 0 (0.0%) |
| Total | 44 (65.7%) | 23 (34.3%) |
Educational Attainment by Field of Study in Brandonville
Education (19 | 35.8%), arts & humanities (15 | 28.3%), psychology (8 | 15.1%), business (4 | 7.5%), and literature & languages (3 | 5.7%) are the most common fields of study among 53 individuals in Brandonville who have obtained a bachelor's degree or higher.
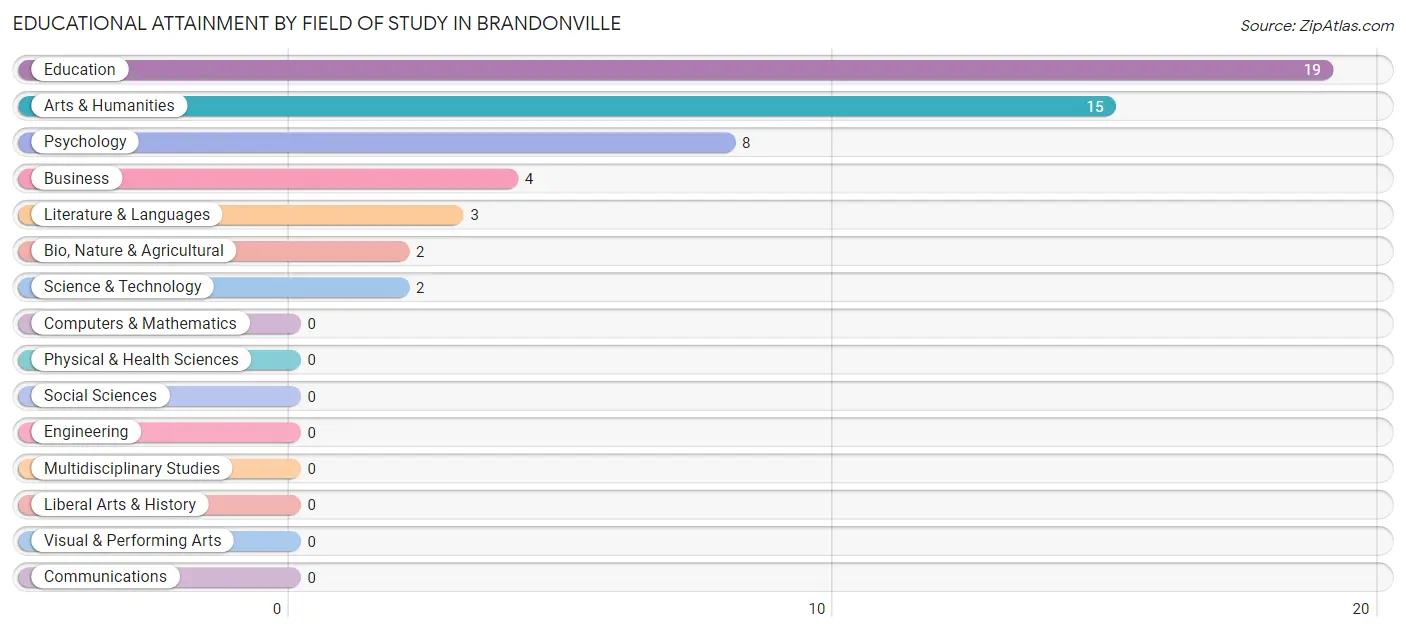
| Field of Study | # Graduates | % Graduates |
| Computers & Mathematics | 0 | 0.0% |
| Bio, Nature & Agricultural | 2 | 3.8% |
| Physical & Health Sciences | 0 | 0.0% |
| Psychology | 8 | 15.1% |
| Social Sciences | 0 | 0.0% |
| Engineering | 0 | 0.0% |
| Multidisciplinary Studies | 0 | 0.0% |
| Science & Technology | 2 | 3.8% |
| Business | 4 | 7.5% |
| Education | 19 | 35.8% |
| Literature & Languages | 3 | 5.7% |
| Liberal Arts & History | 0 | 0.0% |
| Visual & Performing Arts | 0 | 0.0% |
| Communications | 0 | 0.0% |
| Arts & Humanities | 15 | 28.3% |
| Total | 53 | 100.0% |
Transportation & Commute in Brandonville
Vehicle Availability by Sex in Brandonville
The most prevalent vehicle ownership categories in Brandonville are males with 2 vehicles (31, accounting for 73.8%) and females with 2 vehicles (44, making up 52.5%).
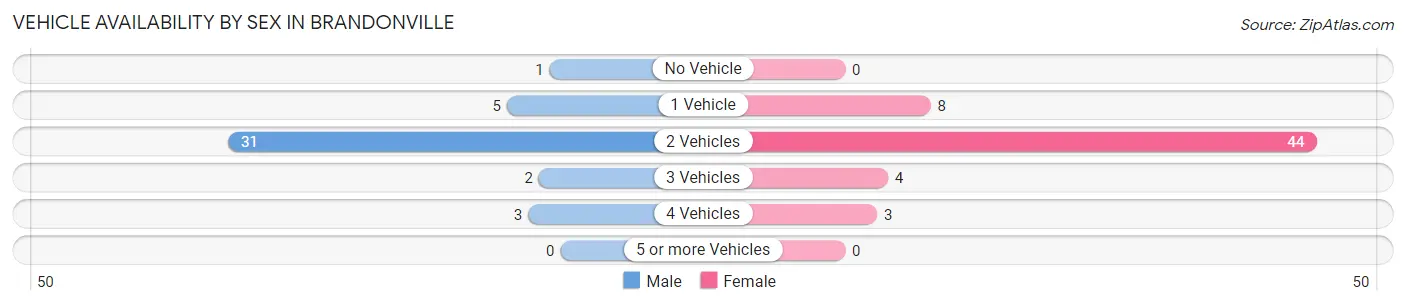
| Vehicles Available | Male | Female |
| No Vehicle | 1 (2.4%) | 0 (0.0%) |
| 1 Vehicle | 5 (11.9%) | 8 (13.6%) |
| 2 Vehicles | 31 (73.8%) | 44 (74.6%) |
| 3 Vehicles | 2 (4.8%) | 4 (6.8%) |
| 4 Vehicles | 3 (7.1%) | 3 (5.1%) |
| 5 or more Vehicles | 0 (0.0%) | 0 (0.0%) |
| Total | 42 (100.0%) | 59 (100.0%) |
Commute Time in Brandonville
The most frequently occuring commute durations in Brandonville are 30 to 34 minutes (50 commuters, 57.5%), 25 to 29 minutes (15 commuters, 17.2%), and less than 5 minutes (12 commuters, 13.8%).
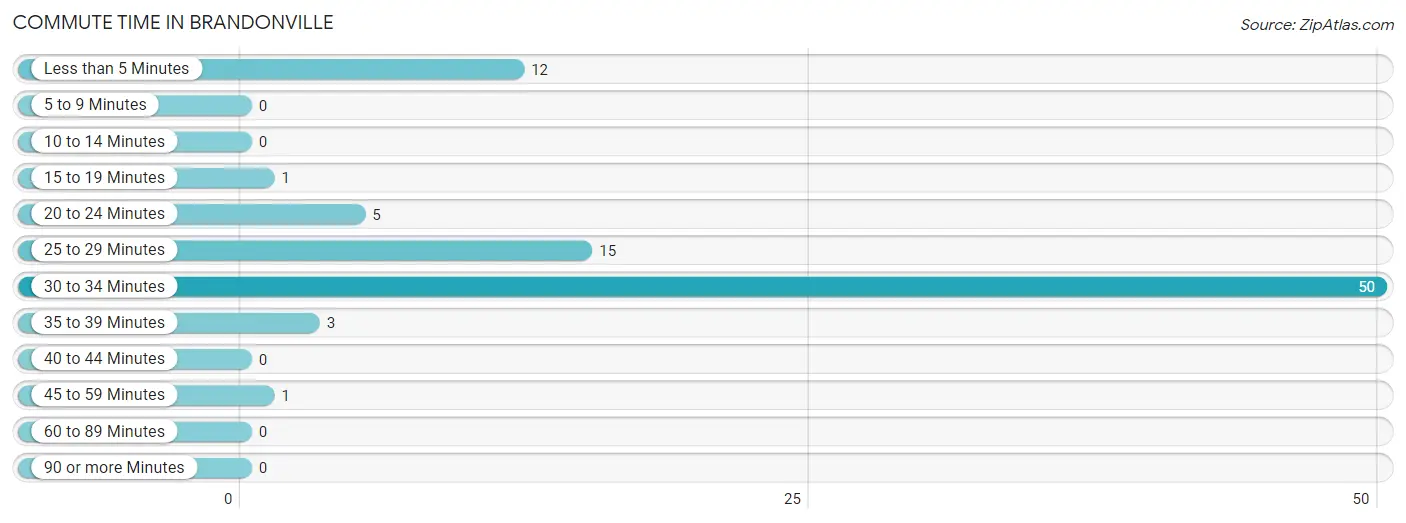
| Commute Time | # Commuters | % Commuters |
| Less than 5 Minutes | 12 | 13.8% |
| 5 to 9 Minutes | 0 | 0.0% |
| 10 to 14 Minutes | 0 | 0.0% |
| 15 to 19 Minutes | 1 | 1.1% |
| 20 to 24 Minutes | 5 | 5.8% |
| 25 to 29 Minutes | 15 | 17.2% |
| 30 to 34 Minutes | 50 | 57.5% |
| 35 to 39 Minutes | 3 | 3.5% |
| 40 to 44 Minutes | 0 | 0.0% |
| 45 to 59 Minutes | 1 | 1.1% |
| 60 to 89 Minutes | 0 | 0.0% |
| 90 or more Minutes | 0 | 0.0% |
Commute Time by Sex in Brandonville
The most common commute times in Brandonville are 30 to 34 minutes (17 commuters, 40.5%) for males and 30 to 34 minutes (33 commuters, 73.3%) for females.
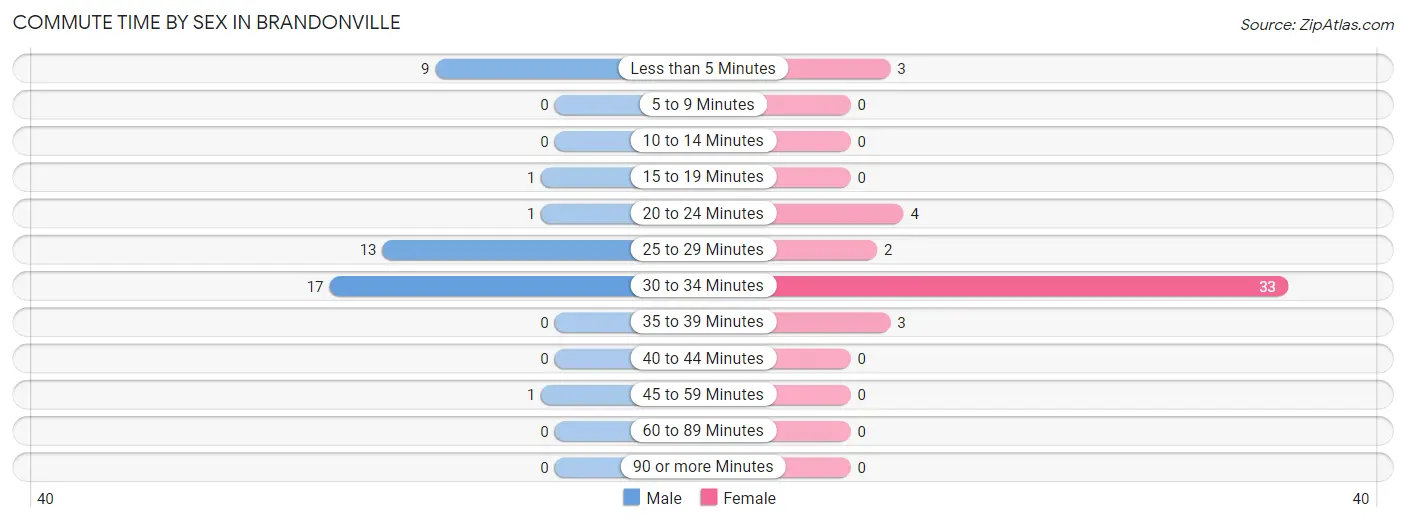
| Commute Time | Male | Female |
| Less than 5 Minutes | 9 (21.4%) | 3 (6.7%) |
| 5 to 9 Minutes | 0 (0.0%) | 0 (0.0%) |
| 10 to 14 Minutes | 0 (0.0%) | 0 (0.0%) |
| 15 to 19 Minutes | 1 (2.4%) | 0 (0.0%) |
| 20 to 24 Minutes | 1 (2.4%) | 4 (8.9%) |
| 25 to 29 Minutes | 13 (30.9%) | 2 (4.4%) |
| 30 to 34 Minutes | 17 (40.5%) | 33 (73.3%) |
| 35 to 39 Minutes | 0 (0.0%) | 3 (6.7%) |
| 40 to 44 Minutes | 0 (0.0%) | 0 (0.0%) |
| 45 to 59 Minutes | 1 (2.4%) | 0 (0.0%) |
| 60 to 89 Minutes | 0 (0.0%) | 0 (0.0%) |
| 90 or more Minutes | 0 (0.0%) | 0 (0.0%) |
Time of Departure to Work by Sex in Brandonville
The most frequent times of departure to work in Brandonville are 7:00 AM to 7:29 AM (13, 30.9%) for males and 8:00 AM to 8:29 AM (15, 33.3%) for females.
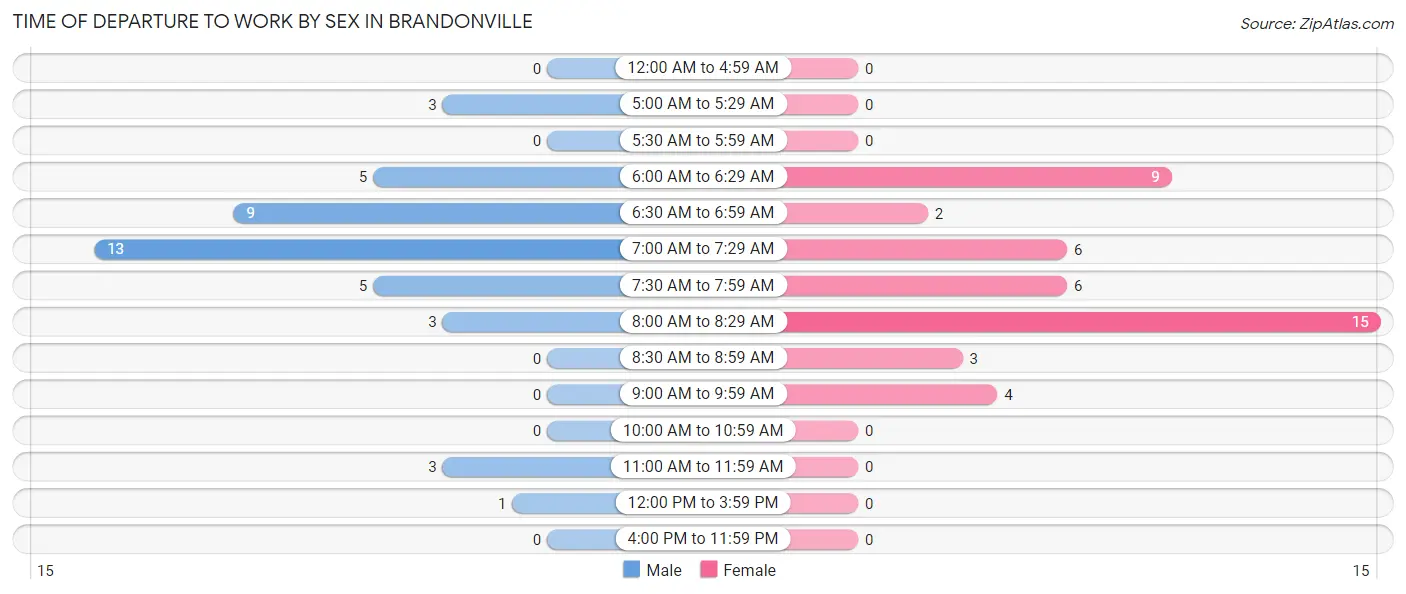
| Time of Departure | Male | Female |
| 12:00 AM to 4:59 AM | 0 (0.0%) | 0 (0.0%) |
| 5:00 AM to 5:29 AM | 3 (7.1%) | 0 (0.0%) |
| 5:30 AM to 5:59 AM | 0 (0.0%) | 0 (0.0%) |
| 6:00 AM to 6:29 AM | 5 (11.9%) | 9 (20.0%) |
| 6:30 AM to 6:59 AM | 9 (21.4%) | 2 (4.4%) |
| 7:00 AM to 7:29 AM | 13 (30.9%) | 6 (13.3%) |
| 7:30 AM to 7:59 AM | 5 (11.9%) | 6 (13.3%) |
| 8:00 AM to 8:29 AM | 3 (7.1%) | 15 (33.3%) |
| 8:30 AM to 8:59 AM | 0 (0.0%) | 3 (6.7%) |
| 9:00 AM to 9:59 AM | 0 (0.0%) | 4 (8.9%) |
| 10:00 AM to 10:59 AM | 0 (0.0%) | 0 (0.0%) |
| 11:00 AM to 11:59 AM | 3 (7.1%) | 0 (0.0%) |
| 12:00 PM to 3:59 PM | 1 (2.4%) | 0 (0.0%) |
| 4:00 PM to 11:59 PM | 0 (0.0%) | 0 (0.0%) |
| Total | 42 (100.0%) | 45 (100.0%) |
Housing Occupancy in Brandonville
Occupancy by Ownership in Brandonville
Of the total 82 dwellings in Brandonville, owner-occupied units account for 71 (86.6%), while renter-occupied units make up 11 (13.4%).
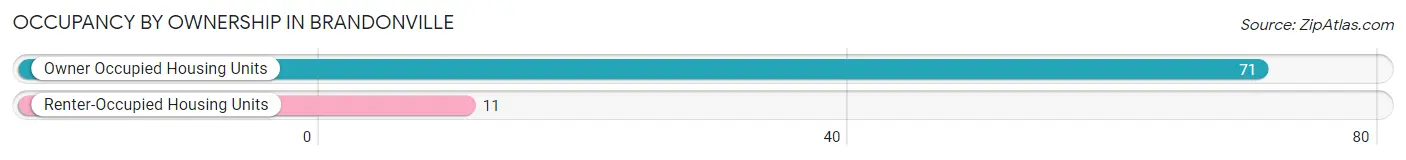
| Occupancy | # Housing Units | % Housing Units |
| Owner Occupied Housing Units | 71 | 86.6% |
| Renter-Occupied Housing Units | 11 | 13.4% |
| Total Occupied Housing Units | 82 | 100.0% |
Occupancy by Household Size in Brandonville
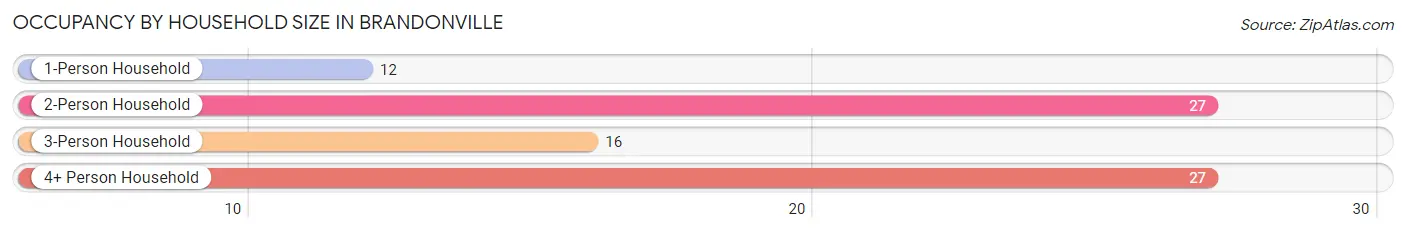
| Household Size | # Housing Units | % Housing Units |
| 1-Person Household | 12 | 14.6% |
| 2-Person Household | 27 | 32.9% |
| 3-Person Household | 16 | 19.5% |
| 4+ Person Household | 27 | 32.9% |
| Total Housing Units | 82 | 100.0% |
Occupancy by Ownership by Household Size in Brandonville
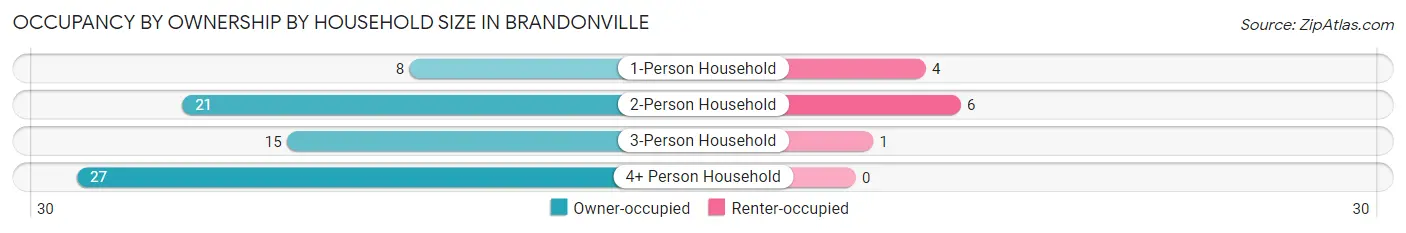
| Household Size | Owner-occupied | Renter-occupied |
| 1-Person Household | 8 (66.7%) | 4 (33.3%) |
| 2-Person Household | 21 (77.8%) | 6 (22.2%) |
| 3-Person Household | 15 (93.8%) | 1 (6.2%) |
| 4+ Person Household | 27 (100.0%) | 0 (0.0%) |
| Total Housing Units | 71 (86.6%) | 11 (13.4%) |
Occupancy by Educational Attainment in Brandonville
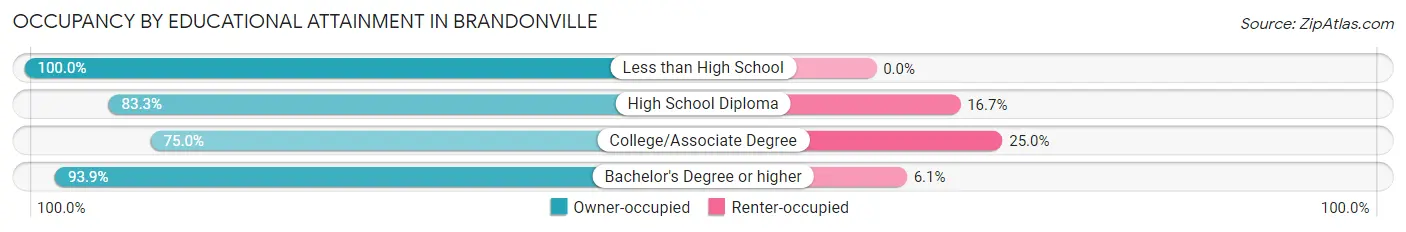
| Household Size | Owner-occupied | Renter-occupied |
| Less than High School | 3 (100.0%) | 0 (0.0%) |
| High School Diploma | 25 (83.3%) | 5 (16.7%) |
| College/Associate Degree | 12 (75.0%) | 4 (25.0%) |
| Bachelor's Degree or higher | 31 (93.9%) | 2 (6.1%) |
Occupancy by Age of Householder in Brandonville
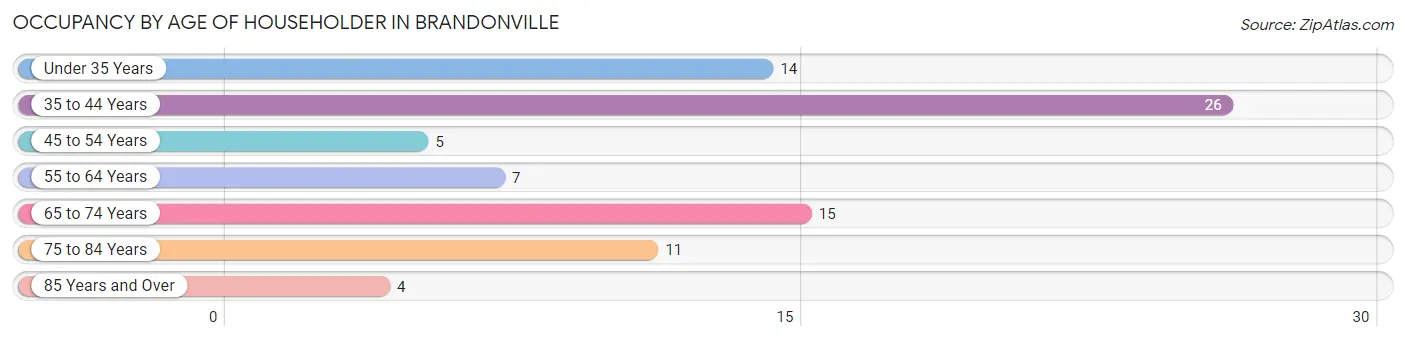
| Age Bracket | # Households | % Households |
| Under 35 Years | 14 | 17.1% |
| 35 to 44 Years | 26 | 31.7% |
| 45 to 54 Years | 5 | 6.1% |
| 55 to 64 Years | 7 | 8.5% |
| 65 to 74 Years | 15 | 18.3% |
| 75 to 84 Years | 11 | 13.4% |
| 85 Years and Over | 4 | 4.9% |
| Total | 82 | 100.0% |
Housing Finances in Brandonville
Median Income by Occupancy in Brandonville
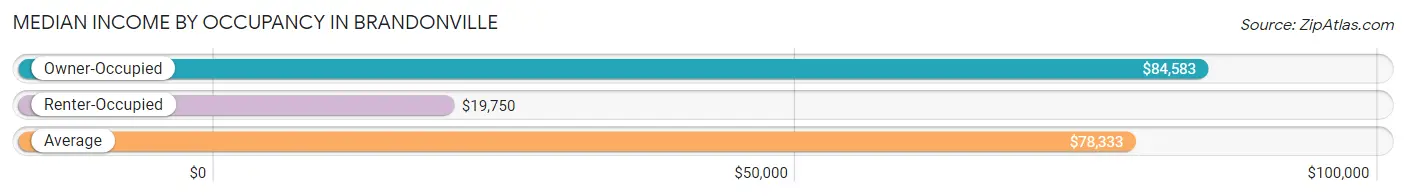
| Occupancy Type | # Households | Median Income |
| Owner-Occupied | 71 (86.6%) | $84,583 |
| Renter-Occupied | 11 (13.4%) | $19,750 |
| Average | 82 (100.0%) | $78,333 |
Occupancy by Householder Income Bracket in Brandonville
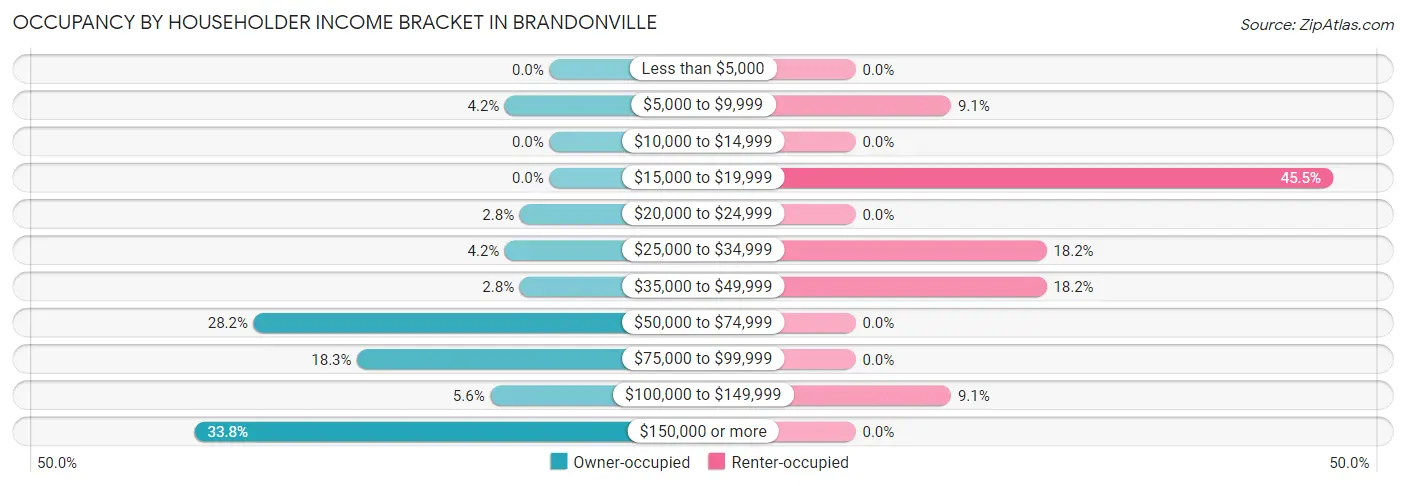
| Income Bracket | Owner-occupied | Renter-occupied |
| Less than $5,000 | 0 (0.0%) | 0 (0.0%) |
| $5,000 to $9,999 | 3 (4.2%) | 1 (9.1%) |
| $10,000 to $14,999 | 0 (0.0%) | 0 (0.0%) |
| $15,000 to $19,999 | 0 (0.0%) | 5 (45.5%) |
| $20,000 to $24,999 | 2 (2.8%) | 0 (0.0%) |
| $25,000 to $34,999 | 3 (4.2%) | 2 (18.2%) |
| $35,000 to $49,999 | 2 (2.8%) | 2 (18.2%) |
| $50,000 to $74,999 | 20 (28.2%) | 0 (0.0%) |
| $75,000 to $99,999 | 13 (18.3%) | 0 (0.0%) |
| $100,000 to $149,999 | 4 (5.6%) | 1 (9.1%) |
| $150,000 or more | 24 (33.8%) | 0 (0.0%) |
| Total | 71 (100.0%) | 11 (100.0%) |
Monthly Housing Cost Tiers in Brandonville
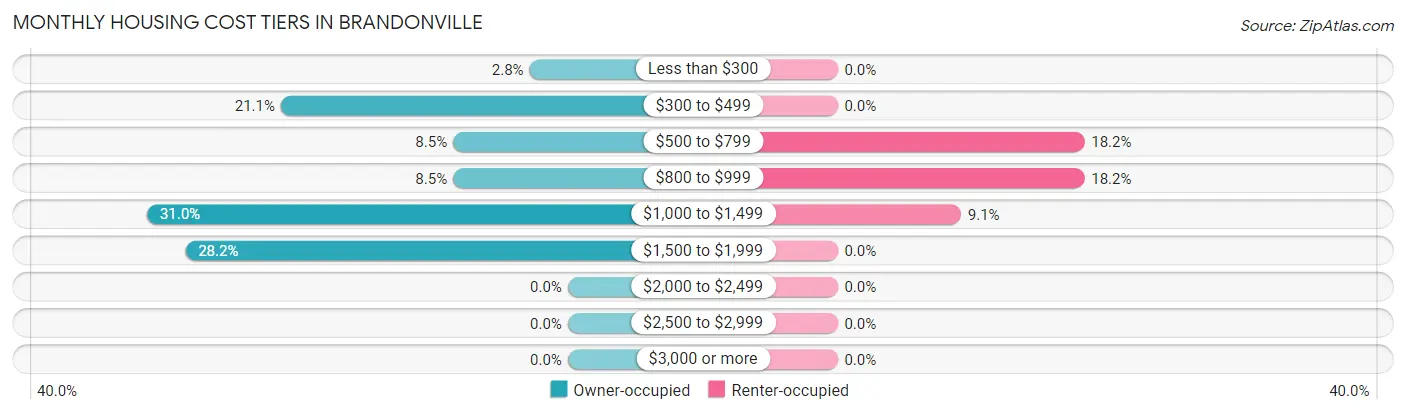
| Monthly Cost | Owner-occupied | Renter-occupied |
| Less than $300 | 2 (2.8%) | 0 (0.0%) |
| $300 to $499 | 15 (21.1%) | 0 (0.0%) |
| $500 to $799 | 6 (8.5%) | 2 (18.2%) |
| $800 to $999 | 6 (8.5%) | 2 (18.2%) |
| $1,000 to $1,499 | 22 (31.0%) | 1 (9.1%) |
| $1,500 to $1,999 | 20 (28.2%) | 0 (0.0%) |
| $2,000 to $2,499 | 0 (0.0%) | 0 (0.0%) |
| $2,500 to $2,999 | 0 (0.0%) | 0 (0.0%) |
| $3,000 or more | 0 (0.0%) | 0 (0.0%) |
| Total | 71 (100.0%) | 11 (100.0%) |
Physical Housing Characteristics in Brandonville
Housing Structures in Brandonville
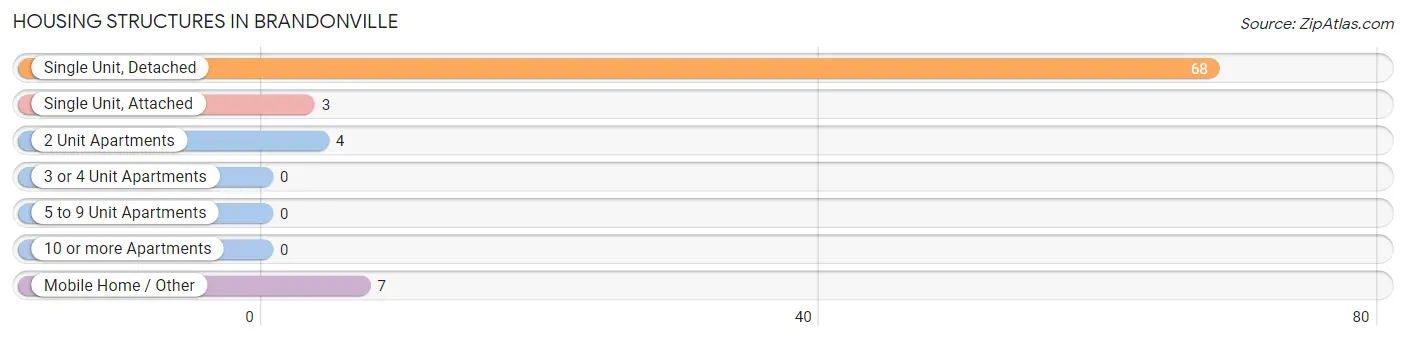
| Structure Type | # Housing Units | % Housing Units |
| Single Unit, Detached | 68 | 82.9% |
| Single Unit, Attached | 3 | 3.7% |
| 2 Unit Apartments | 4 | 4.9% |
| 3 or 4 Unit Apartments | 0 | 0.0% |
| 5 to 9 Unit Apartments | 0 | 0.0% |
| 10 or more Apartments | 0 | 0.0% |
| Mobile Home / Other | 7 | 8.5% |
| Total | 82 | 100.0% |
Housing Structures by Occupancy in Brandonville
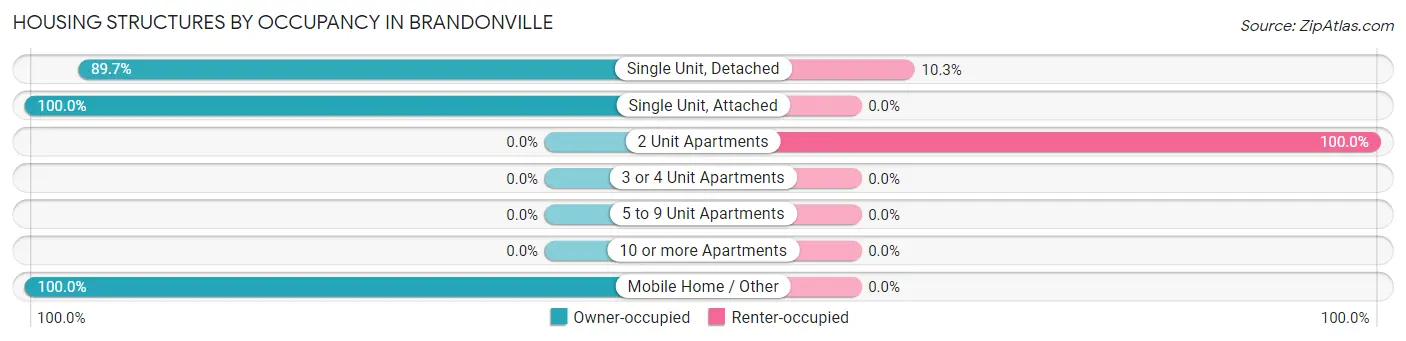
| Structure Type | Owner-occupied | Renter-occupied |
| Single Unit, Detached | 61 (89.7%) | 7 (10.3%) |
| Single Unit, Attached | 3 (100.0%) | 0 (0.0%) |
| 2 Unit Apartments | 0 (0.0%) | 4 (100.0%) |
| 3 or 4 Unit Apartments | 0 (0.0%) | 0 (0.0%) |
| 5 to 9 Unit Apartments | 0 (0.0%) | 0 (0.0%) |
| 10 or more Apartments | 0 (0.0%) | 0 (0.0%) |
| Mobile Home / Other | 7 (100.0%) | 0 (0.0%) |
| Total | 71 (86.6%) | 11 (13.4%) |
Housing Structures by Number of Rooms in Brandonville
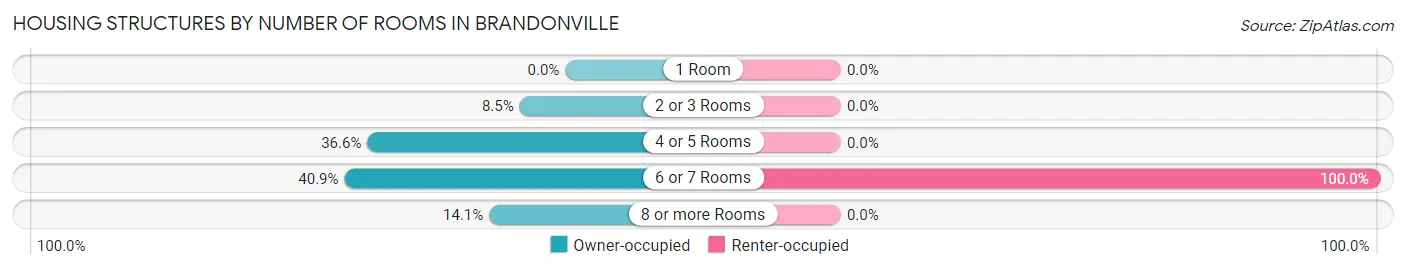
| Number of Rooms | Owner-occupied | Renter-occupied |
| 1 Room | 0 (0.0%) | 0 (0.0%) |
| 2 or 3 Rooms | 6 (8.5%) | 0 (0.0%) |
| 4 or 5 Rooms | 26 (36.6%) | 0 (0.0%) |
| 6 or 7 Rooms | 29 (40.8%) | 11 (100.0%) |
| 8 or more Rooms | 10 (14.1%) | 0 (0.0%) |
| Total | 71 (100.0%) | 11 (100.0%) |
Housing Structure by Heating Type in Brandonville
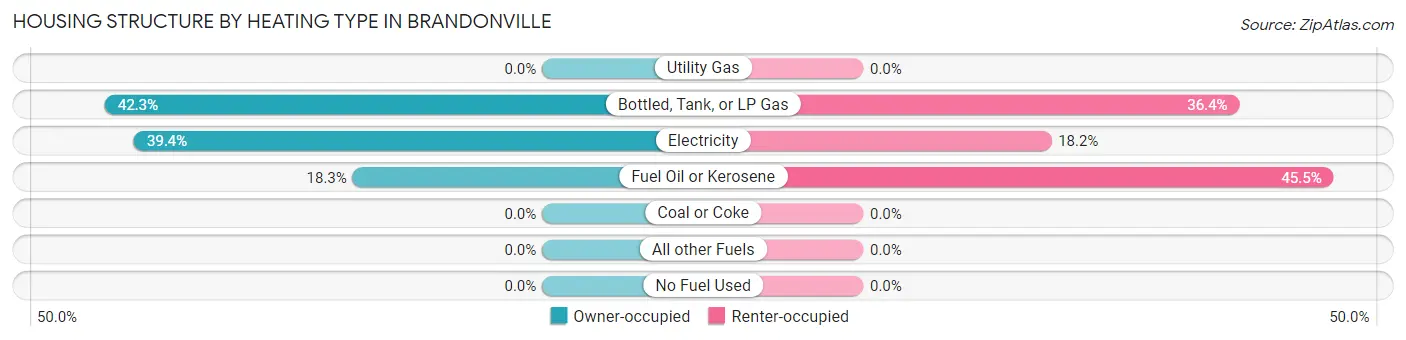
| Heating Type | Owner-occupied | Renter-occupied |
| Utility Gas | 0 (0.0%) | 0 (0.0%) |
| Bottled, Tank, or LP Gas | 30 (42.2%) | 4 (36.4%) |
| Electricity | 28 (39.4%) | 2 (18.2%) |
| Fuel Oil or Kerosene | 13 (18.3%) | 5 (45.5%) |
| Coal or Coke | 0 (0.0%) | 0 (0.0%) |
| All other Fuels | 0 (0.0%) | 0 (0.0%) |
| No Fuel Used | 0 (0.0%) | 0 (0.0%) |
| Total | 71 (100.0%) | 11 (100.0%) |
Household Vehicle Usage in Brandonville
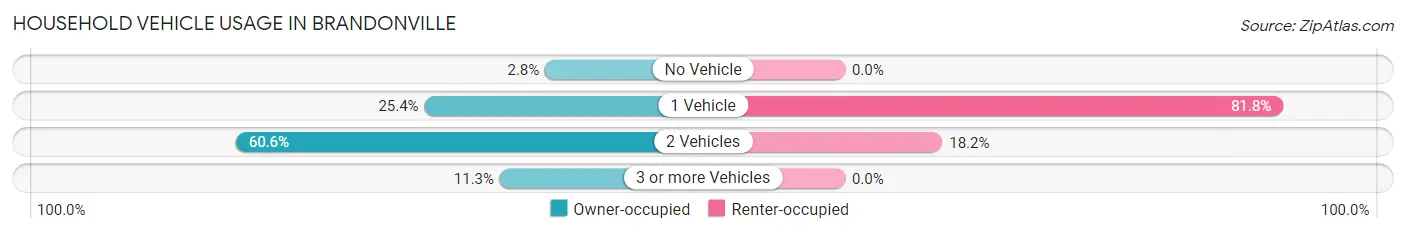
| Vehicles per Household | Owner-occupied | Renter-occupied |
| No Vehicle | 2 (2.8%) | 0 (0.0%) |
| 1 Vehicle | 18 (25.4%) | 9 (81.8%) |
| 2 Vehicles | 43 (60.6%) | 2 (18.2%) |
| 3 or more Vehicles | 8 (11.3%) | 0 (0.0%) |
| Total | 71 (100.0%) | 11 (100.0%) |
Real Estate & Mortgages in Brandonville
Real Estate and Mortgage Overview in Brandonville
| Characteristic | Without Mortgage | With Mortgage |
| Housing Units | 23 | 48 |
| Median Property Value | $121,300 | $161,100 |
| Median Household Income | - | - |
| Monthly Housing Costs | $458 | $0 |
| Real Estate Taxes | - | - |
Property Value by Mortgage Status in Brandonville
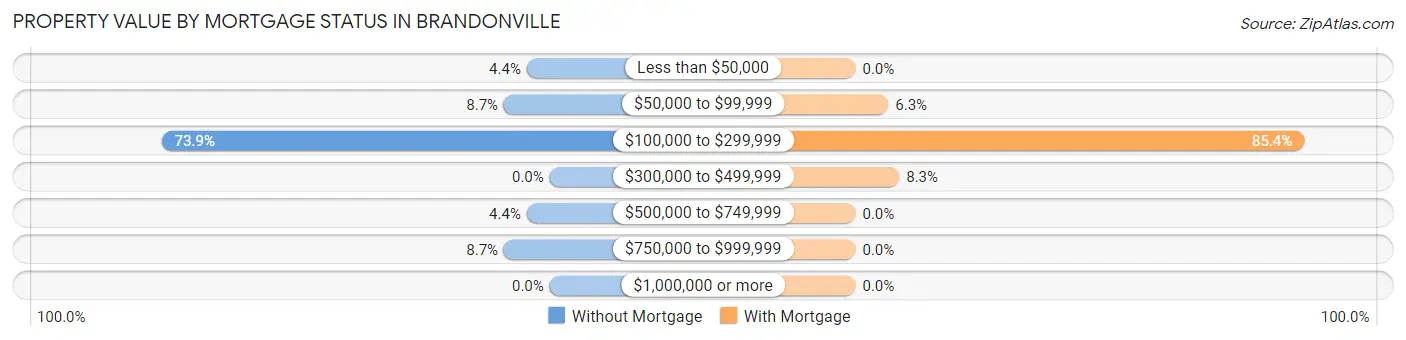
| Property Value | Without Mortgage | With Mortgage |
| Less than $50,000 | 1 (4.3%) | 0 (0.0%) |
| $50,000 to $99,999 | 2 (8.7%) | 3 (6.2%) |
| $100,000 to $299,999 | 17 (73.9%) | 41 (85.4%) |
| $300,000 to $499,999 | 0 (0.0%) | 4 (8.3%) |
| $500,000 to $749,999 | 1 (4.3%) | 0 (0.0%) |
| $750,000 to $999,999 | 2 (8.7%) | 0 (0.0%) |
| $1,000,000 or more | 0 (0.0%) | 0 (0.0%) |
| Total | 23 (100.0%) | 48 (100.0%) |
Household Income by Mortgage Status in Brandonville
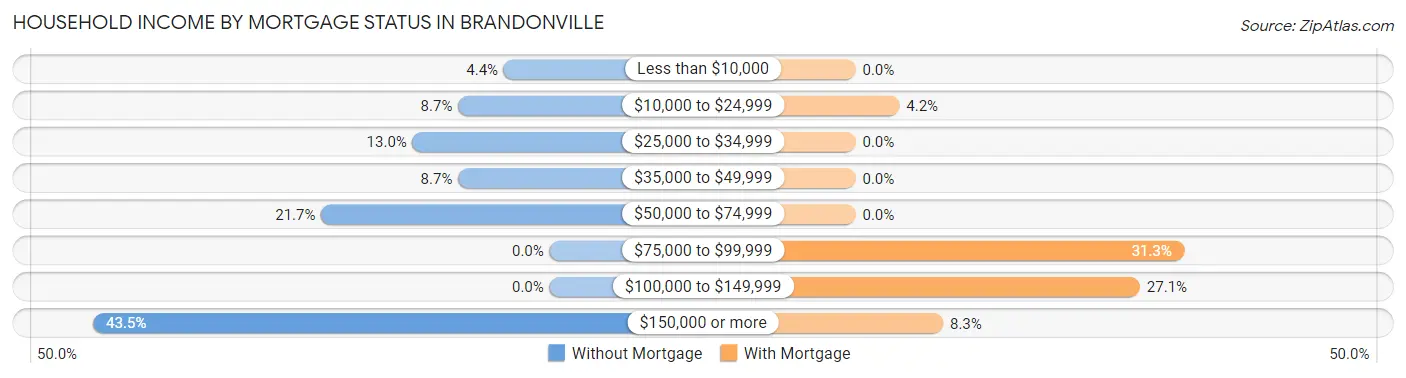
| Household Income | Without Mortgage | With Mortgage |
| Less than $10,000 | 1 (4.3%) | 0 (0.0%) |
| $10,000 to $24,999 | 2 (8.7%) | 2 (4.2%) |
| $25,000 to $34,999 | 3 (13.0%) | 0 (0.0%) |
| $35,000 to $49,999 | 2 (8.7%) | 0 (0.0%) |
| $50,000 to $74,999 | 5 (21.7%) | 0 (0.0%) |
| $75,000 to $99,999 | 0 (0.0%) | 15 (31.2%) |
| $100,000 to $149,999 | 0 (0.0%) | 13 (27.1%) |
| $150,000 or more | 10 (43.5%) | 4 (8.3%) |
| Total | 23 (100.0%) | 48 (100.0%) |
Property Value to Household Income Ratio in Brandonville
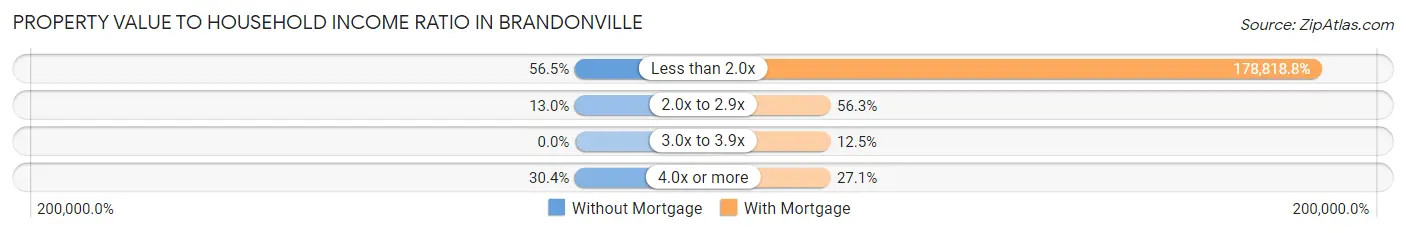
| Value-to-Income Ratio | Without Mortgage | With Mortgage |
| Less than 2.0x | 13 (56.5%) | 85,833 (178,818.8%) |
| 2.0x to 2.9x | 3 (13.0%) | 27 (56.2%) |
| 3.0x to 3.9x | 0 (0.0%) | 6 (12.5%) |
| 4.0x or more | 7 (30.4%) | 13 (27.1%) |
| Total | 23 (100.0%) | 48 (100.0%) |
Real Estate Taxes by Mortgage Status in Brandonville
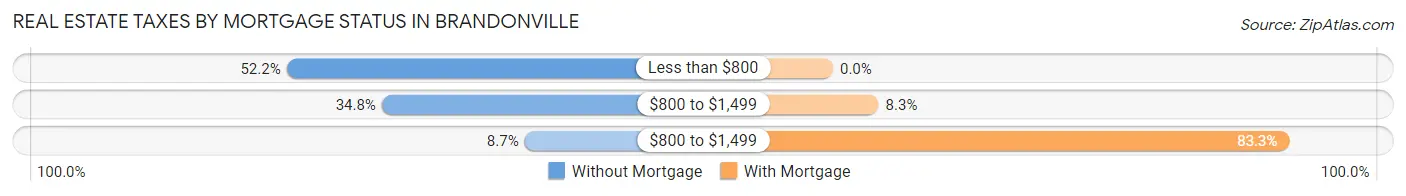
| Property Taxes | Without Mortgage | With Mortgage |
| Less than $800 | 12 (52.2%) | 0 (0.0%) |
| $800 to $1,499 | 8 (34.8%) | 4 (8.3%) |
| $800 to $1,499 | 2 (8.7%) | 40 (83.3%) |
| Total | 23 (100.0%) | 48 (100.0%) |
Health & Disability in Brandonville
Health Insurance Coverage by Age in Brandonville
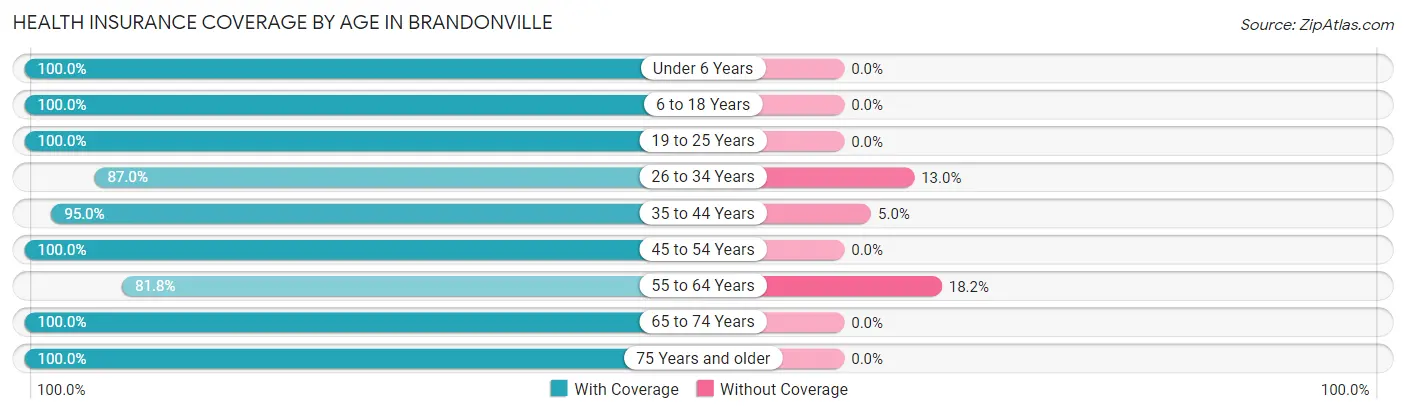
| Age Bracket | With Coverage | Without Coverage |
| Under 6 Years | 27 (100.0%) | 0 (0.0%) |
| 6 to 18 Years | 49 (100.0%) | 0 (0.0%) |
| 19 to 25 Years | 5 (100.0%) | 0 (0.0%) |
| 26 to 34 Years | 20 (87.0%) | 3 (13.0%) |
| 35 to 44 Years | 57 (95.0%) | 3 (5.0%) |
| 45 to 54 Years | 14 (100.0%) | 0 (0.0%) |
| 55 to 64 Years | 9 (81.8%) | 2 (18.2%) |
| 65 to 74 Years | 26 (100.0%) | 0 (0.0%) |
| 75 Years and older | 15 (100.0%) | 0 (0.0%) |
| Total | 222 (96.5%) | 8 (3.5%) |
Health Insurance Coverage by Citizenship Status in Brandonville
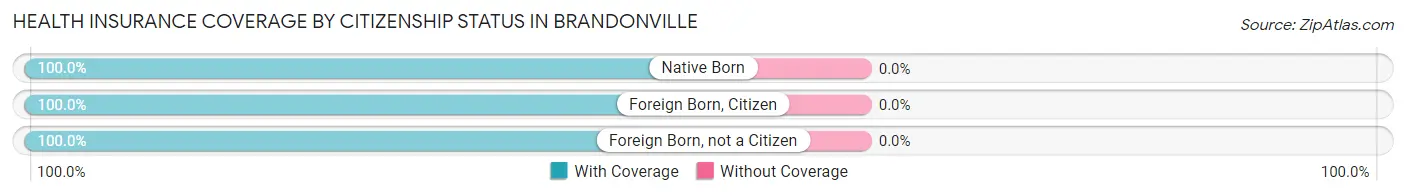
| Citizenship Status | With Coverage | Without Coverage |
| Native Born | 27 (100.0%) | 0 (0.0%) |
| Foreign Born, Citizen | 49 (100.0%) | 0 (0.0%) |
| Foreign Born, not a Citizen | 5 (100.0%) | 0 (0.0%) |
Health Insurance Coverage by Household Income in Brandonville
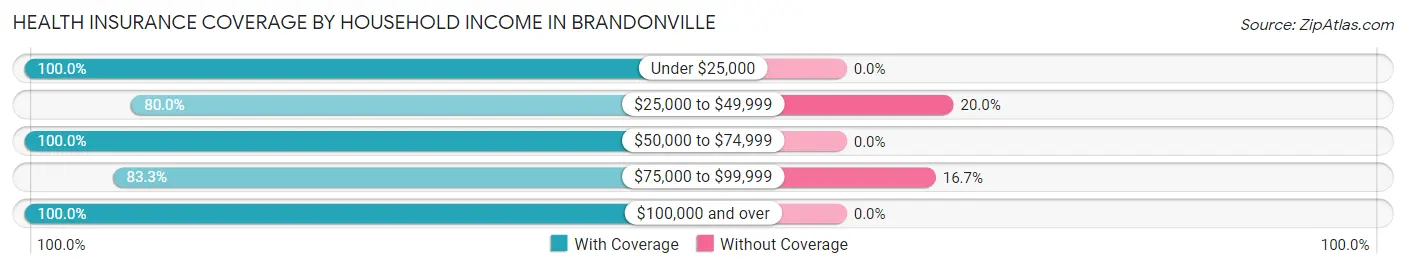
| Household Income | With Coverage | Without Coverage |
| Under $25,000 | 29 (100.0%) | 0 (0.0%) |
| $25,000 to $49,999 | 8 (80.0%) | 2 (20.0%) |
| $50,000 to $74,999 | 61 (100.0%) | 0 (0.0%) |
| $75,000 to $99,999 | 30 (83.3%) | 6 (16.7%) |
| $100,000 and over | 94 (100.0%) | 0 (0.0%) |
Public vs Private Health Insurance Coverage by Age in Brandonville
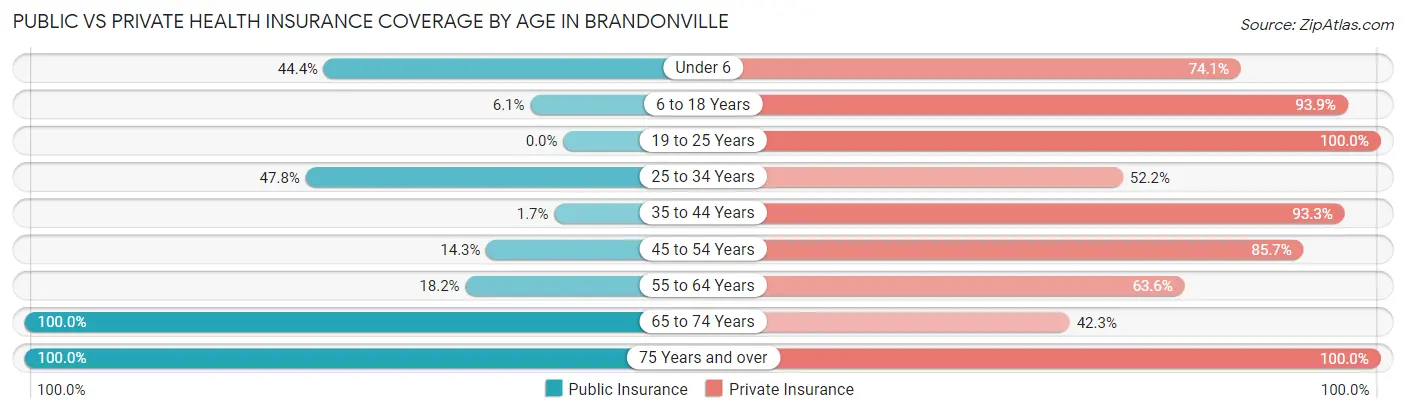
| Age Bracket | Public Insurance | Private Insurance |
| Under 6 | 12 (44.4%) | 20 (74.1%) |
| 6 to 18 Years | 3 (6.1%) | 46 (93.9%) |
| 19 to 25 Years | 0 (0.0%) | 5 (100.0%) |
| 25 to 34 Years | 11 (47.8%) | 12 (52.2%) |
| 35 to 44 Years | 1 (1.7%) | 56 (93.3%) |
| 45 to 54 Years | 2 (14.3%) | 12 (85.7%) |
| 55 to 64 Years | 2 (18.2%) | 7 (63.6%) |
| 65 to 74 Years | 26 (100.0%) | 11 (42.3%) |
| 75 Years and over | 15 (100.0%) | 15 (100.0%) |
| Total | 72 (31.3%) | 184 (80.0%) |
Disability Status by Sex by Age in Brandonville
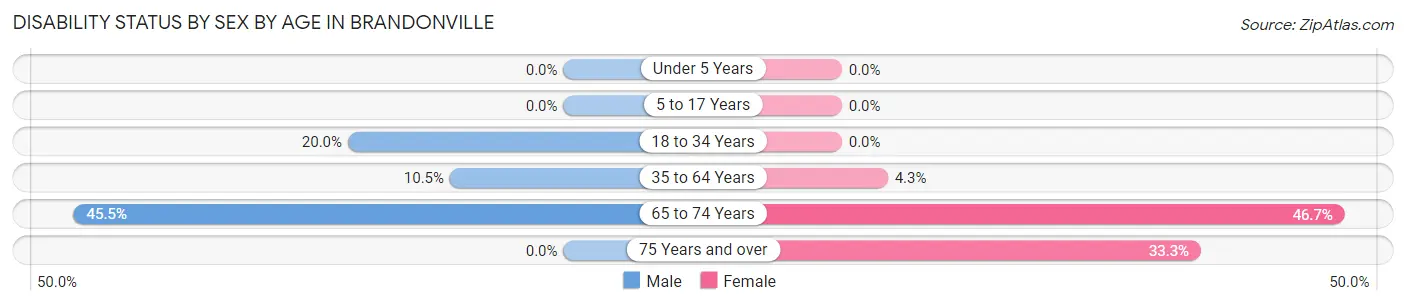
| Age Bracket | Male | Female |
| Under 5 Years | 0 (0.0%) | 0 (0.0%) |
| 5 to 17 Years | 0 (0.0%) | 0 (0.0%) |
| 18 to 34 Years | 2 (20.0%) | 0 (0.0%) |
| 35 to 64 Years | 4 (10.5%) | 2 (4.3%) |
| 65 to 74 Years | 5 (45.5%) | 7 (46.7%) |
| 75 Years and over | 0 (0.0%) | 2 (33.3%) |
Disability Class by Sex by Age in Brandonville
Disability Class: Hearing Difficulty
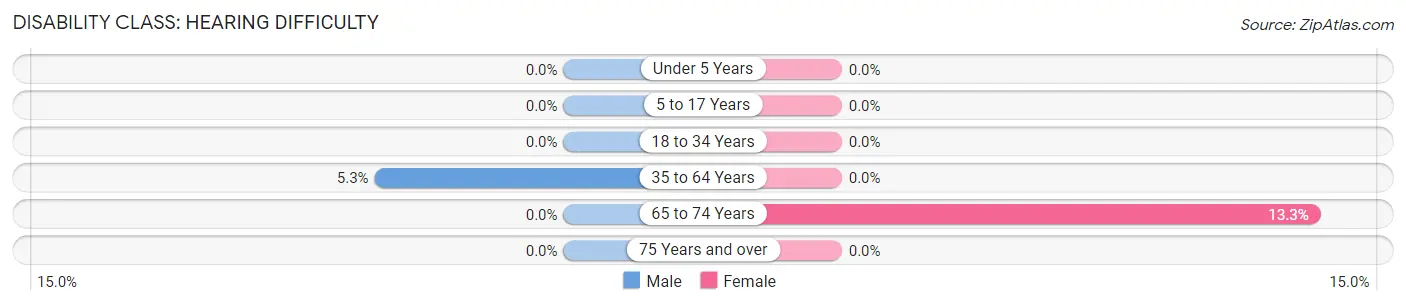
| Age Bracket | Male | Female |
| Under 5 Years | 0 (0.0%) | 0 (0.0%) |
| 5 to 17 Years | 0 (0.0%) | 0 (0.0%) |
| 18 to 34 Years | 0 (0.0%) | 0 (0.0%) |
| 35 to 64 Years | 2 (5.3%) | 0 (0.0%) |
| 65 to 74 Years | 0 (0.0%) | 2 (13.3%) |
| 75 Years and over | 0 (0.0%) | 0 (0.0%) |
Disability Class: Vision Difficulty
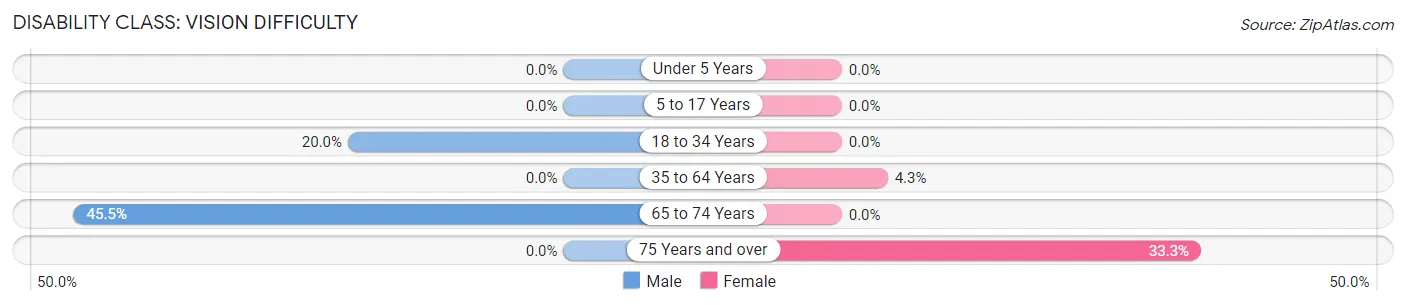
| Age Bracket | Male | Female |
| Under 5 Years | 0 (0.0%) | 0 (0.0%) |
| 5 to 17 Years | 0 (0.0%) | 0 (0.0%) |
| 18 to 34 Years | 2 (20.0%) | 0 (0.0%) |
| 35 to 64 Years | 0 (0.0%) | 2 (4.3%) |
| 65 to 74 Years | 5 (45.5%) | 0 (0.0%) |
| 75 Years and over | 0 (0.0%) | 2 (33.3%) |
Disability Class: Cognitive Difficulty
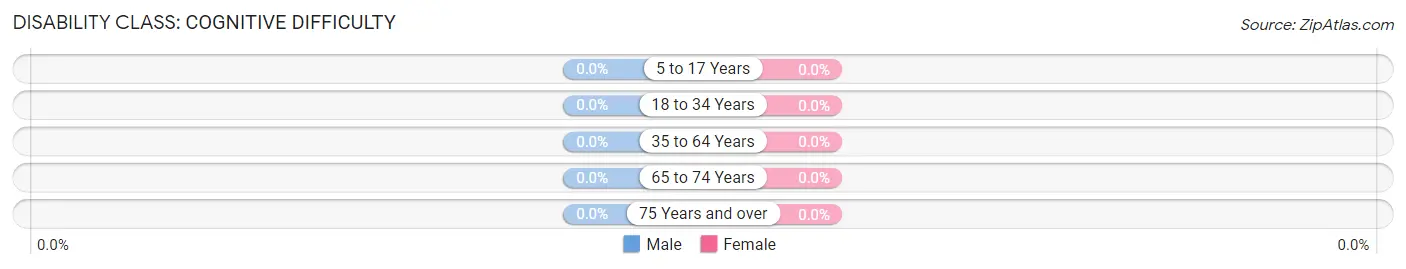
| Age Bracket | Male | Female |
| 5 to 17 Years | 0 (0.0%) | 0 (0.0%) |
| 18 to 34 Years | 0 (0.0%) | 0 (0.0%) |
| 35 to 64 Years | 0 (0.0%) | 0 (0.0%) |
| 65 to 74 Years | 0 (0.0%) | 0 (0.0%) |
| 75 Years and over | 0 (0.0%) | 0 (0.0%) |
Disability Class: Ambulatory Difficulty
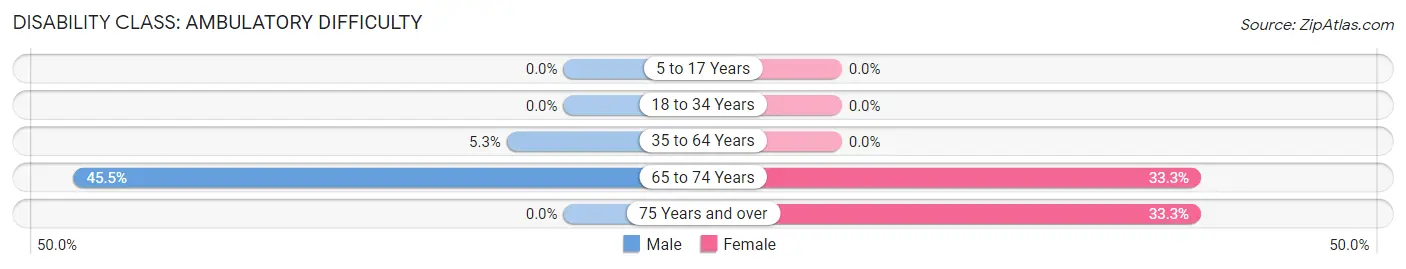
| Age Bracket | Male | Female |
| 5 to 17 Years | 0 (0.0%) | 0 (0.0%) |
| 18 to 34 Years | 0 (0.0%) | 0 (0.0%) |
| 35 to 64 Years | 2 (5.3%) | 0 (0.0%) |
| 65 to 74 Years | 5 (45.5%) | 5 (33.3%) |
| 75 Years and over | 0 (0.0%) | 2 (33.3%) |
Disability Class: Self-Care Difficulty
| Age Bracket | Male | Female |
| 5 to 17 Years | 0 (0.0%) | 0 (0.0%) |
| 18 to 34 Years | 0 (0.0%) | 0 (0.0%) |
| 35 to 64 Years | 0 (0.0%) | 0 (0.0%) |
| 65 to 74 Years | 0 (0.0%) | 0 (0.0%) |
| 75 Years and over | 0 (0.0%) | 0 (0.0%) |
Technology Access in Brandonville
Computing Device Access in Brandonville
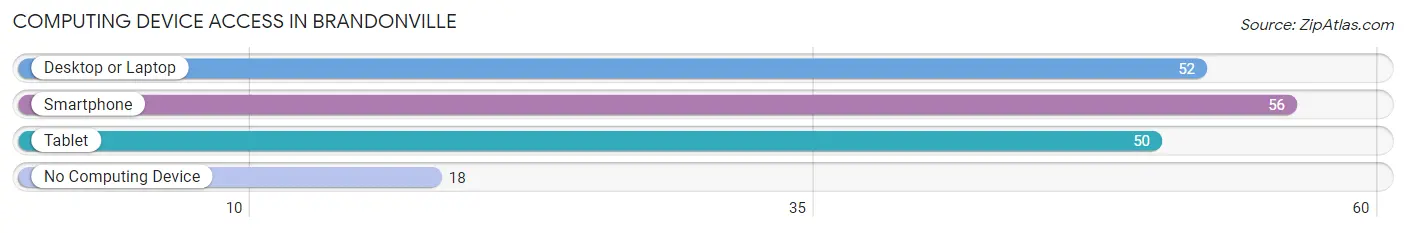
| Device Type | # Households | % Households |
| Desktop or Laptop | 52 | 63.4% |
| Smartphone | 56 | 68.3% |
| Tablet | 50 | 61.0% |
| No Computing Device | 18 | 22.0% |
| Total | 82 | 100.0% |
Internet Access in Brandonville
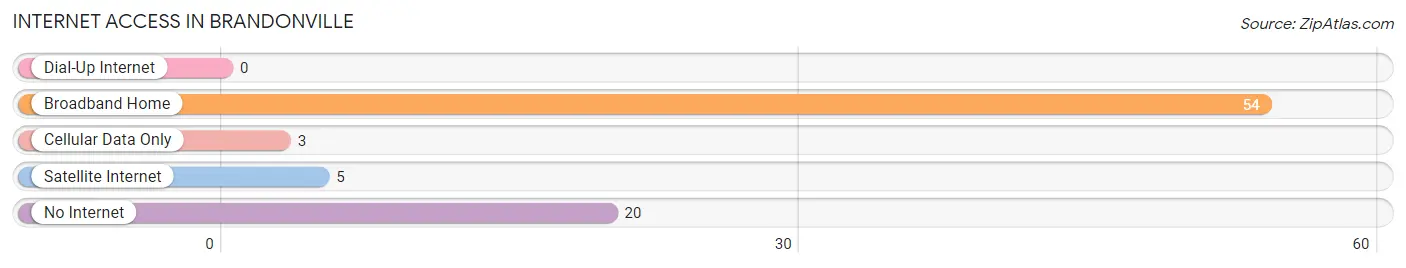
| Internet Type | # Households | % Households |
| Dial-Up Internet | 0 | 0.0% |
| Broadband Home | 54 | 65.8% |
| Cellular Data Only | 3 | 3.7% |
| Satellite Internet | 5 | 6.1% |
| No Internet | 20 | 24.4% |
| Total | 82 | 100.0% |
Brandonville Summary
Brandonville is a small unincorporated community located in Preston County, West Virginia. It is situated in the northern part of the county, near the border with Garrett County, Maryland. The community is located along the North Branch of the Potomac River, and is part of the greater Morgantown metropolitan area.
History
The area that is now Brandonville was first settled in the late 1700s by German immigrants. The community was originally known as “Brandenburg”, after the German city of the same name. The name was later changed to Brandonville, after the Brandon family, who owned a large amount of land in the area.
The community was officially established in 1845, when the first post office was opened. The post office was named after the Brandon family, and the name of the community was changed to Brandonville.
The community grew slowly over the years, and by the early 1900s, it had become a small farming and logging community. The population peaked in the 1940s, when it had a population of around 500 people.
Geography
Brandonville is located in northern Preston County, near the border with Garrett County, Maryland. It is situated along the North Branch of the Potomac River, and is part of the greater Morgantown metropolitan area.
The community is located in a rural area, and is surrounded by rolling hills and forests. The climate is temperate, with hot summers and cold winters.
Economy
The economy of Brandonville is largely based on agriculture and forestry. The area is home to several small farms, and the surrounding forests are used for logging.
The community also has a few small businesses, including a general store, a gas station, and a few restaurants.
Demographics
As of the 2010 census, the population of Brandonville was 545. The racial makeup of the community was 97.3% White, 0.7% African American, 0.2% Native American, 0.2% Asian, and 1.6% from other races.
The median household income in Brandonville was $37,500, and the median family income was $41,250. The per capita income was $17,500.
Conclusion
Brandonville is a small unincorporated community located in Preston County, West Virginia. It is situated in the northern part of the county, near the border with Garrett County, Maryland. The community was established in 1845, and has a population of around 500 people. The economy of Brandonville is largely based on agriculture and forestry, and the community also has a few small businesses. The racial makeup of the community is predominantly White, with a small percentage of African American, Native American, and Asian residents.
Common Questions
What is Per Capita Income in Brandonville?
Per Capita income in Brandonville is $34,136.
What is the Median Family Income in Brandonville?
Median Family Income in Brandonville is $86,667.
What is the Median Household income in Brandonville?
Median Household Income in Brandonville is $78,333.
What is Income or Wage Gap in Brandonville?
Income or Wage Gap in Brandonville is 0.3%.
Women in Brandonville earn 99.7 cents for every dollar earned by a man.
What is Inequality or Gini Index in Brandonville?
Inequality or Gini Index in Brandonville is 0.37.
What is the Total Population of Brandonville?
Total Population of Brandonville is 230.
What is the Total Male Population of Brandonville?
Total Male Population of Brandonville is 98.
What is the Total Female Population of Brandonville?
Total Female Population of Brandonville is 132.
What is the Ratio of Males per 100 Females in Brandonville?
There are 74.24 Males per 100 Females in Brandonville.
What is the Ratio of Females per 100 Males in Brandonville?
There are 134.69 Females per 100 Males in Brandonville.
What is the Median Population Age in Brandonville?
Median Population Age in Brandonville is 39.3 Years.
What is the Average Family Size in Brandonville
Average Family Size in Brandonville is 3.1 People.
What is the Average Household Size in Brandonville
Average Household Size in Brandonville is 2.8 People.
How Large is the Labor Force in Brandonville?
There are 109 People in the Labor Forcein in Brandonville.
What is the Percentage of People in the Labor Force in Brandonville?
69.9% of People are in the Labor Force in Brandonville.
What is the Unemployment Rate in Brandonville?
Unemployment Rate in Brandonville is 7.3%.