Blacksville, WV Map & Demographics
Blacksville Map
Blacksville Overview
$60,104
PER CAPITA INCOME
$45,833
AVG HOUSEHOLD INCOME
32.6%
WAGE / INCOME GAP [ % ]
67.4¢/ $1
WAGE / INCOME GAP [ $ ]
0.46
INEQUALITY / GINI INDEX
48
TOTAL POPULATION
27
MALE POPULATION
21
FEMALE POPULATION
128.57
MALES / 100 FEMALES
77.78
FEMALES / 100 MALES
62.3
MEDIAN AGE
2.1
AVG FAMILY SIZE
1.6
AVG HOUSEHOLD SIZE
28
LABOR FORCE [ PEOPLE ]
58.3%
PERCENT IN LABOR FORCE
Blacksville Zip Codes
Income in Blacksville
Income Overview in Blacksville
| Characteristic | Number | Measure |
| Per Capita Income | 48 | $60,104 |
| Median Family Income | 16 | $0 |
| Mean Family Income | 16 | $133,525 |
| Median Household Income | 30 | $45,833 |
| Mean Household Income | 30 | $94,950 |
| Income Deficit | 16 | $0 |
| Wage / Income Gap (%) | 48 | 32.56% |
| Wage / Income Gap ($) | 48 | 67.44¢ per $1 |
| Gini / Inequality Index | 48 | 0.46 |
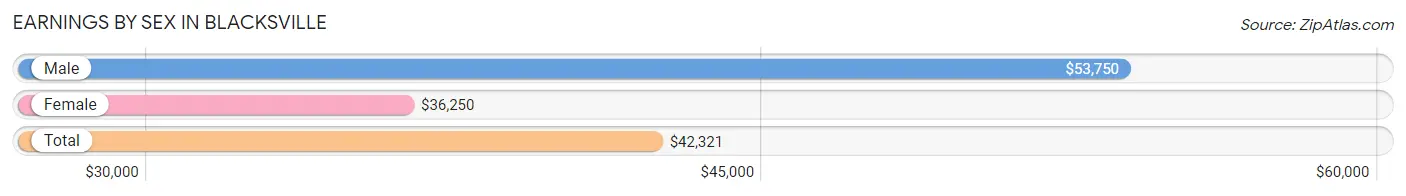
Earnings by Sex in Blacksville
Average Earnings in Blacksville are $42,321, $53,750 for men and $36,250 for women, a difference of 32.6%.
| Sex | Number | Average Earnings |
| Male | 17 (58.6%) | $53,750 |
| Female | 12 (41.4%) | $36,250 |
| Total | 29 (100.0%) | $42,321 |
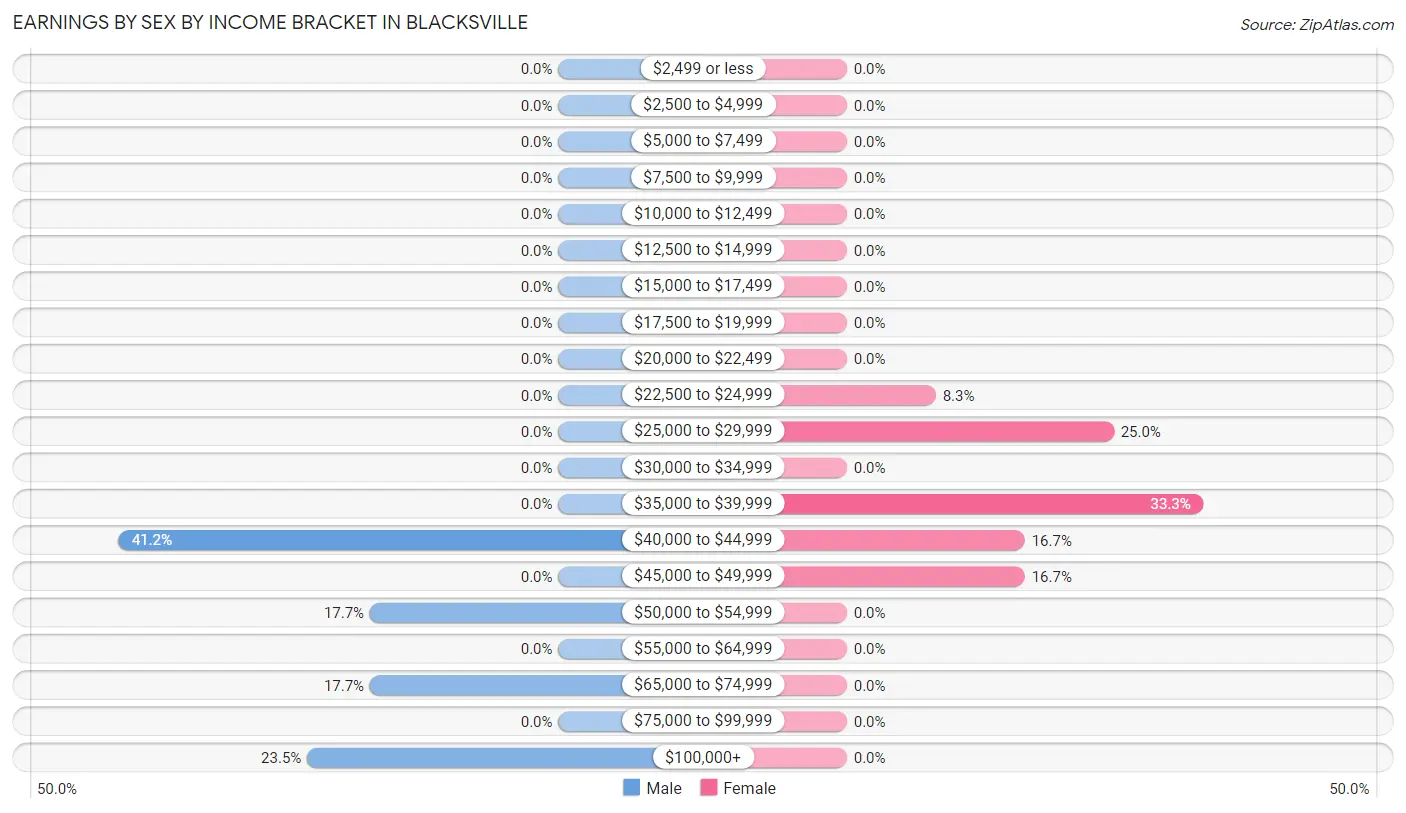
Earnings by Sex by Income Bracket in Blacksville
The most common earnings brackets in Blacksville are $40,000 to $44,999 for men (7 | 41.2%) and $35,000 to $39,999 for women (4 | 33.3%).
| Income | Male | Female |
| $2,499 or less | 0 (0.0%) | 0 (0.0%) |
| $2,500 to $4,999 | 0 (0.0%) | 0 (0.0%) |
| $5,000 to $7,499 | 0 (0.0%) | 0 (0.0%) |
| $7,500 to $9,999 | 0 (0.0%) | 0 (0.0%) |
| $10,000 to $12,499 | 0 (0.0%) | 0 (0.0%) |
| $12,500 to $14,999 | 0 (0.0%) | 0 (0.0%) |
| $15,000 to $17,499 | 0 (0.0%) | 0 (0.0%) |
| $17,500 to $19,999 | 0 (0.0%) | 0 (0.0%) |
| $20,000 to $22,499 | 0 (0.0%) | 0 (0.0%) |
| $22,500 to $24,999 | 0 (0.0%) | 1 (8.3%) |
| $25,000 to $29,999 | 0 (0.0%) | 3 (25.0%) |
| $30,000 to $34,999 | 0 (0.0%) | 0 (0.0%) |
| $35,000 to $39,999 | 0 (0.0%) | 4 (33.3%) |
| $40,000 to $44,999 | 7 (41.2%) | 2 (16.7%) |
| $45,000 to $49,999 | 0 (0.0%) | 2 (16.7%) |
| $50,000 to $54,999 | 3 (17.6%) | 0 (0.0%) |
| $55,000 to $64,999 | 0 (0.0%) | 0 (0.0%) |
| $65,000 to $74,999 | 3 (17.6%) | 0 (0.0%) |
| $75,000 to $99,999 | 0 (0.0%) | 0 (0.0%) |
| $100,000+ | 4 (23.5%) | 0 (0.0%) |
| Total | 17 (100.0%) | 12 (100.0%) |
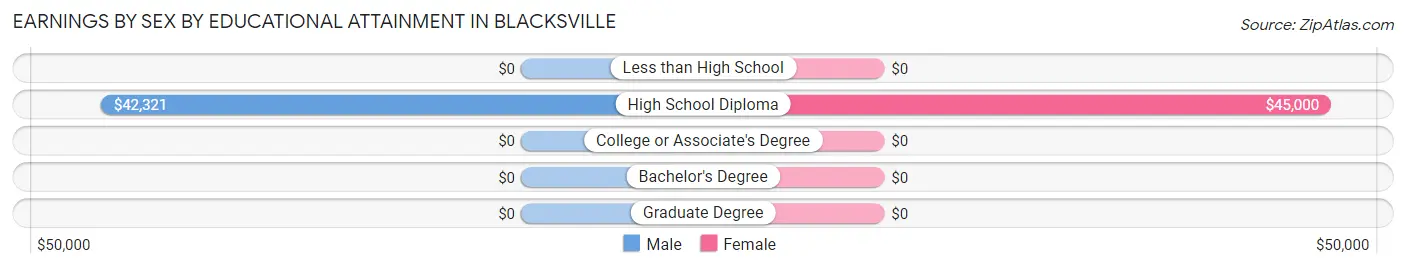
Earnings by Sex by Educational Attainment in Blacksville
Average earnings in Blacksville are $53,750 for men and $37,188 for women, a difference of 30.8%. Men with an educational attainment of high school diploma enjoy the highest average annual earnings of $42,321, while those with high school diploma education earn the least with $42,321. Women with an educational attainment of high school diploma earn the most with the average annual earnings of $45,000, while those with high school diploma education have the smallest earnings of $45,000.
| Educational Attainment | Male Income | Female Income |
| Less than High School | - | - |
| High School Diploma | $42,321 | $45,000 |
| College or Associate's Degree | - | - |
| Bachelor's Degree | - | - |
| Graduate Degree | - | - |
| Total | $53,750 | $37,188 |
Family Income in Blacksville
Family Income Brackets in Blacksville
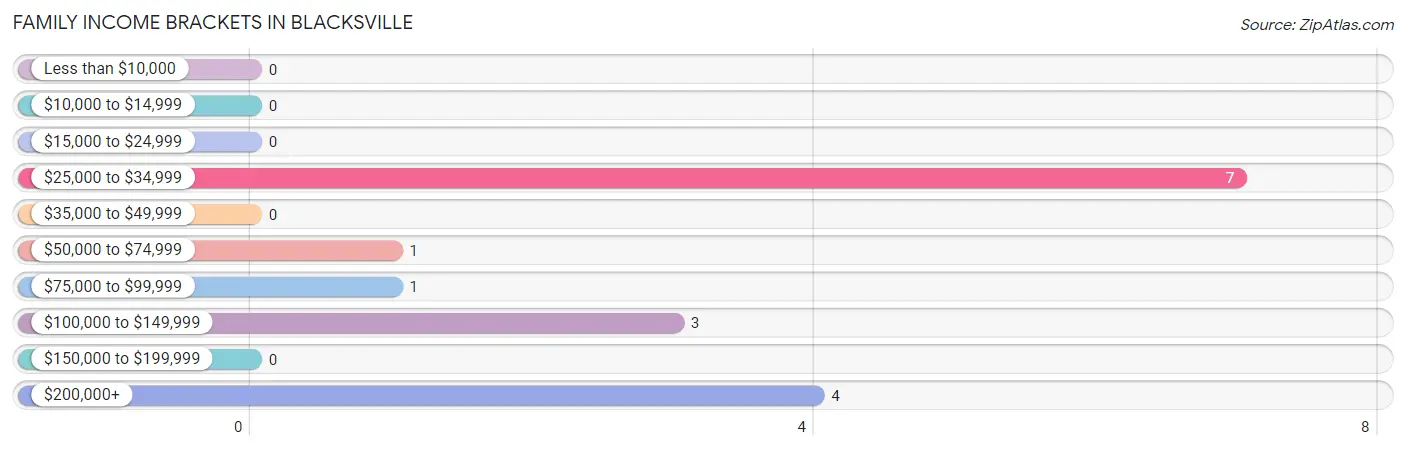
According to the Blacksville family income data, there are 7 families falling into the $25,000 to $34,999 income range, which is the most common income bracket and makes up 43.8% of all families.
| Income Bracket | # Families | % Families |
| Less than $10,000 | 0 | 0.0% |
| $10,000 to $14,999 | 0 | 0.0% |
| $15,000 to $24,999 | 0 | 0.0% |
| $25,000 to $34,999 | 7 | 43.8% |
| $35,000 to $49,999 | 0 | 0.0% |
| $50,000 to $74,999 | 1 | 6.3% |
| $75,000 to $99,999 | 1 | 6.3% |
| $100,000 to $149,999 | 3 | 18.8% |
| $150,000 to $199,999 | 0 | 0.0% |
| $200,000+ | 4 | 25.0% |
Family Income by Famaliy Size in Blacksville
| Income Bracket | # Families | Median Income |
| 2-Person Families | 13 (81.2%) | $0 |
| 3-Person Families | 3 (18.8%) | $0 |
| 4-Person Families | 0 (0.0%) | $0 |
| 5-Person Families | 0 (0.0%) | $0 |
| 6-Person Families | 0 (0.0%) | $0 |
| 7+ Person Families | 0 (0.0%) | $0 |
| Total | 16 (100.0%) | $0 |
Family Income by Number of Earners in Blacksville
| Number of Earners | # Families | Median Income |
| No Earners | 8 (50.0%) | $0 |
| 1 Earner | 5 (31.2%) | $0 |
| 2 Earners | 0 (0.0%) | $0 |
| 3+ Earners | 3 (18.8%) | $0 |
| Total | 16 (100.0%) | $0 |
Household Income in Blacksville
Household Income Brackets in Blacksville
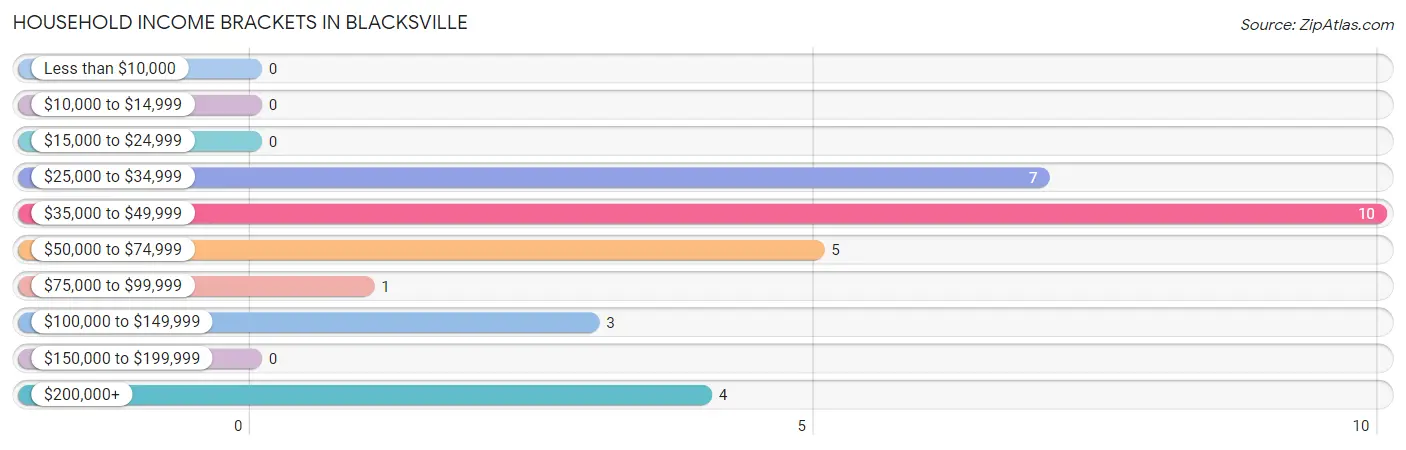
With 10 households falling in the category, the $35,000 to $49,999 income range is the most frequent in Blacksville, accounting for 33.3% of all households.
| Income Bracket | # Households | % Households |
| Less than $10,000 | 0 | 0.0% |
| $10,000 to $14,999 | 0 | 0.0% |
| $15,000 to $24,999 | 0 | 0.0% |
| $25,000 to $34,999 | 7 | 23.3% |
| $35,000 to $49,999 | 10 | 33.3% |
| $50,000 to $74,999 | 5 | 16.7% |
| $75,000 to $99,999 | 1 | 3.3% |
| $100,000 to $149,999 | 3 | 10.0% |
| $150,000 to $199,999 | 0 | 0.0% |
| $200,000+ | 4 | 13.3% |
Household Income by Householder Age in Blacksville
The median household income in Blacksville is $45,833, with the highest median household income of $34,464 found in the 65+ years age bracket for the primary householder. A total of 11 households (36.7%) fall into this category.
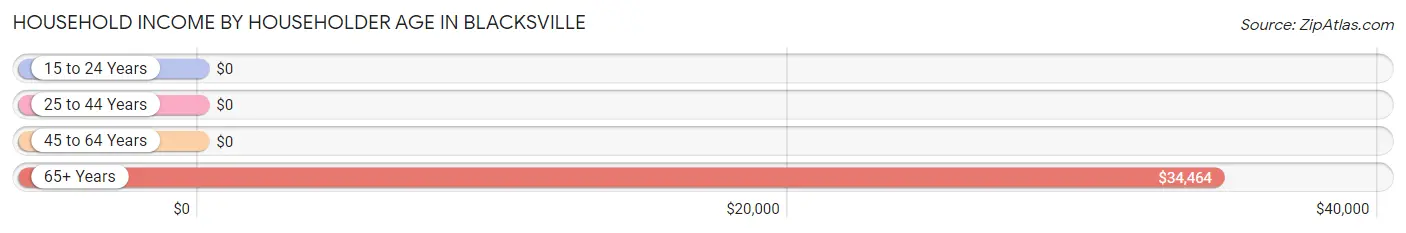
| Income Bracket | # Households | Median Income |
| 15 to 24 Years | 0 (0.0%) | $0 |
| 25 to 44 Years | 10 (33.3%) | $0 |
| 45 to 64 Years | 9 (30.0%) | $0 |
| 65+ Years | 11 (36.7%) | $34,464 |
| Total | 30 (100.0%) | $45,833 |
Poverty in Blacksville
Income Below Poverty by Sex and Age in Blacksville
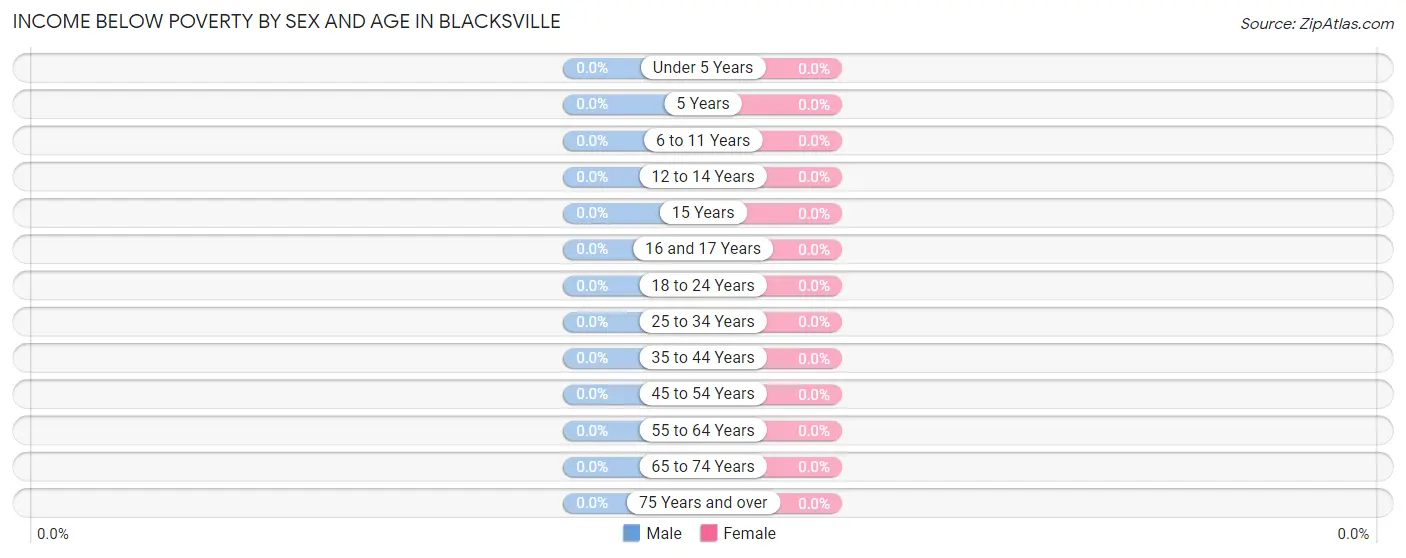
| Age Bracket | Male | Female |
| Under 5 Years | 0 (0.0%) | 0 (0.0%) |
| 5 Years | 0 (0.0%) | 0 (0.0%) |
| 6 to 11 Years | 0 (0.0%) | 0 (0.0%) |
| 12 to 14 Years | 0 (0.0%) | 0 (0.0%) |
| 15 Years | 0 (0.0%) | 0 (0.0%) |
| 16 and 17 Years | 0 (0.0%) | 0 (0.0%) |
| 18 to 24 Years | 0 (0.0%) | 0 (0.0%) |
| 25 to 34 Years | 0 (0.0%) | 0 (0.0%) |
| 35 to 44 Years | 0 (0.0%) | 0 (0.0%) |
| 45 to 54 Years | 0 (0.0%) | 0 (0.0%) |
| 55 to 64 Years | 0 (0.0%) | 0 (0.0%) |
| 65 to 74 Years | 0 (0.0%) | 0 (0.0%) |
| 75 Years and over | 0 (0.0%) | 0 (0.0%) |
| Total | 0 (0.0%) | 0 (0.0%) |
Income Above Poverty by Sex and Age in Blacksville
According to the poverty statistics in Blacksville, males aged 35 to 44 years and females aged 18 to 24 years are the age groups that are most secure financially, with 100.0% of males and 100.0% of females in these age groups living above the poverty line.
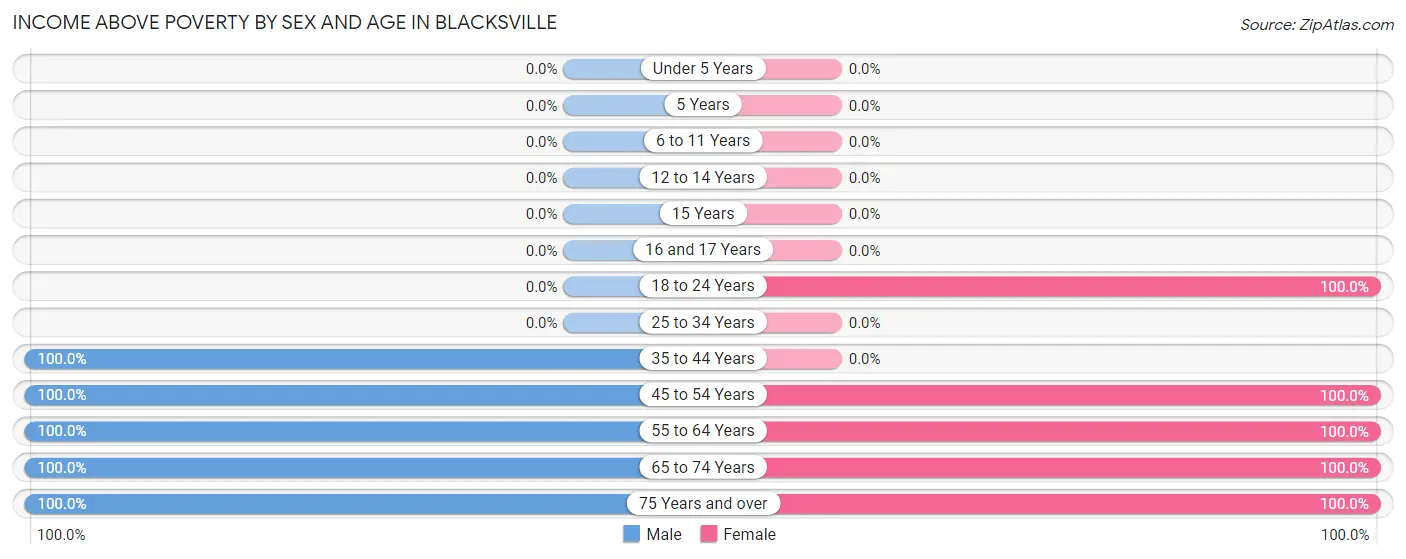
| Age Bracket | Male | Female |
| Under 5 Years | 0 (0.0%) | 0 (0.0%) |
| 5 Years | 0 (0.0%) | 0 (0.0%) |
| 6 to 11 Years | 0 (0.0%) | 0 (0.0%) |
| 12 to 14 Years | 0 (0.0%) | 0 (0.0%) |
| 15 Years | 0 (0.0%) | 0 (0.0%) |
| 16 and 17 Years | 0 (0.0%) | 0 (0.0%) |
| 18 to 24 Years | 0 (0.0%) | 3 (100.0%) |
| 25 to 34 Years | 0 (0.0%) | 0 (0.0%) |
| 35 to 44 Years | 10 (100.0%) | 0 (0.0%) |
| 45 to 54 Years | 3 (100.0%) | 4 (100.0%) |
| 55 to 64 Years | 12 (100.0%) | 2 (100.0%) |
| 65 to 74 Years | 1 (100.0%) | 5 (100.0%) |
| 75 Years and over | 1 (100.0%) | 7 (100.0%) |
| Total | 27 (100.0%) | 21 (100.0%) |
Income Below Poverty Among Married-Couple Families in Blacksville
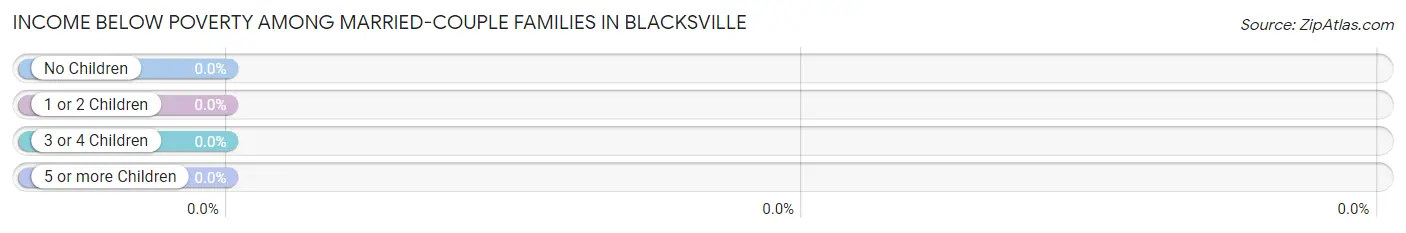
| Children | Above Poverty | Below Poverty |
| No Children | 16 (100.0%) | 0 (0.0%) |
| 1 or 2 Children | 0 (0.0%) | 0 (0.0%) |
| 3 or 4 Children | 0 (0.0%) | 0 (0.0%) |
| 5 or more Children | 0 (0.0%) | 0 (0.0%) |
| Total | 16 (100.0%) | 0 (0.0%) |
Income Below Poverty Among Single-Parent Households in Blacksville
| Children | Single Father | Single Mother |
| No Children | 0 (0.0%) | 0 (0.0%) |
| 1 or 2 Children | 0 (0.0%) | 0 (0.0%) |
| 3 or 4 Children | 0 (0.0%) | 0 (0.0%) |
| 5 or more Children | 0 (0.0%) | 0 (0.0%) |
| Total | 0 (0.0%) | 0 (0.0%) |
Income Below Poverty Among Married-Couple vs Single-Parent Households in Blacksville
| Children | Married-Couple Families | Single-Parent Households |
| No Children | 0 (0.0%) | 0 (0.0%) |
| 1 or 2 Children | 0 (0.0%) | 0 (0.0%) |
| 3 or 4 Children | 0 (0.0%) | 0 (0.0%) |
| 5 or more Children | 0 (0.0%) | 0 (0.0%) |
| Total | 0 (0.0%) | 0 (0.0%) |
Race in Blacksville
The most populous races in Blacksville are , and White / Caucasian (48 | 100.0%).
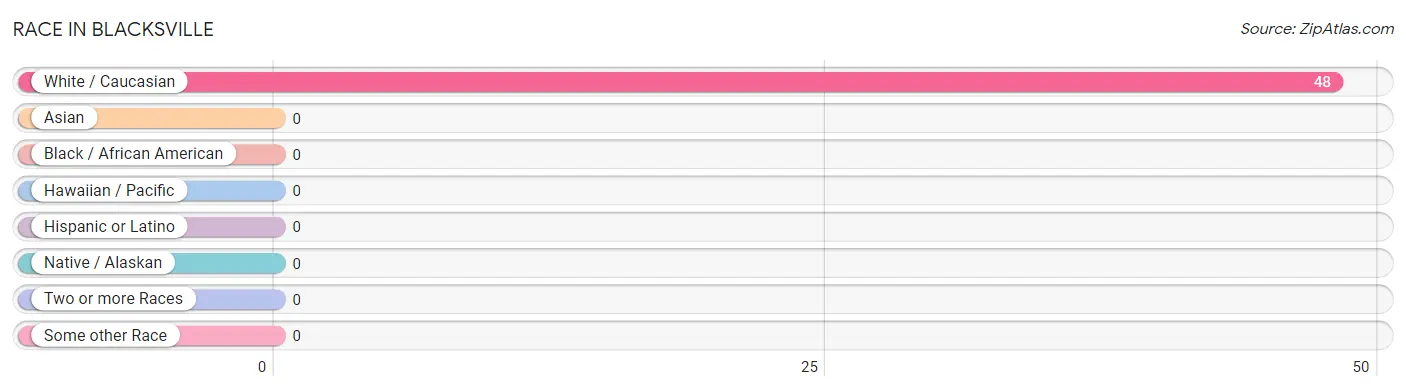
| Race | # Population | % Population |
| Asian | 0 | 0.0% |
| Black / African American | 0 | 0.0% |
| Hawaiian / Pacific | 0 | 0.0% |
| Hispanic or Latino | 0 | 0.0% |
| Native / Alaskan | 0 | 0.0% |
| White / Caucasian | 48 | 100.0% |
| Two or more Races | 0 | 0.0% |
| Some other Race | 0 | 0.0% |
| Total | 48 | 100.0% |
Ancestry in Blacksville
The most populous ancestries reported in Blacksville are Irish (8 | 16.7%), American (7 | 14.6%), German (5 | 10.4%), Polish (3 | 6.2%), and Dutch (2 | 4.2%), together accounting for 52.1% of all Blacksville residents.
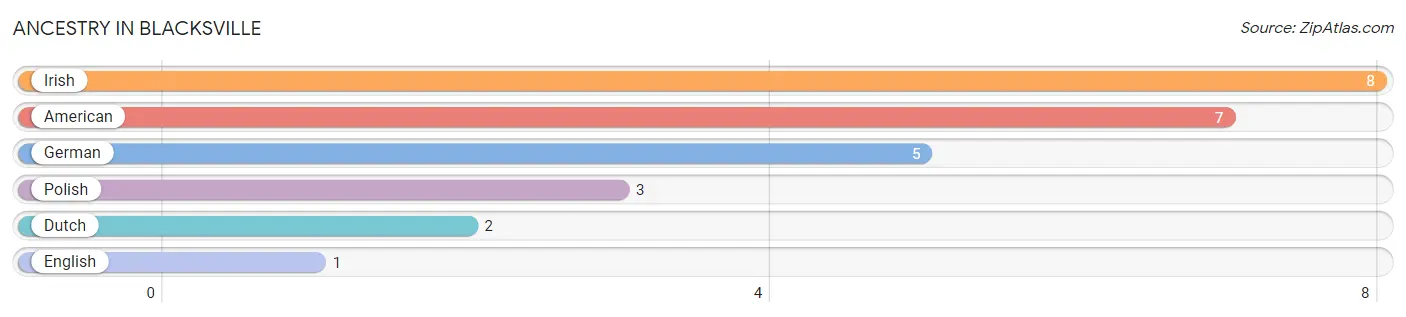
| Ancestry | # Population | % Population |
| American | 7 | 14.6% |
| Dutch | 2 | 4.2% |
| English | 1 | 2.1% |
| German | 5 | 10.4% |
| Irish | 8 | 16.7% |
| Polish | 3 | 6.2% | View All 6 Rows |
Immigrants in Blacksville

| Immigration Origin | # Population | % Population | View All 0 Rows |
Sex and Age in Blacksville
Sex and Age in Blacksville
The most populous age groups in Blacksville are 60 to 64 Years (12 | 44.4%) for men and 75 to 79 Years (7 | 33.3%) for women.
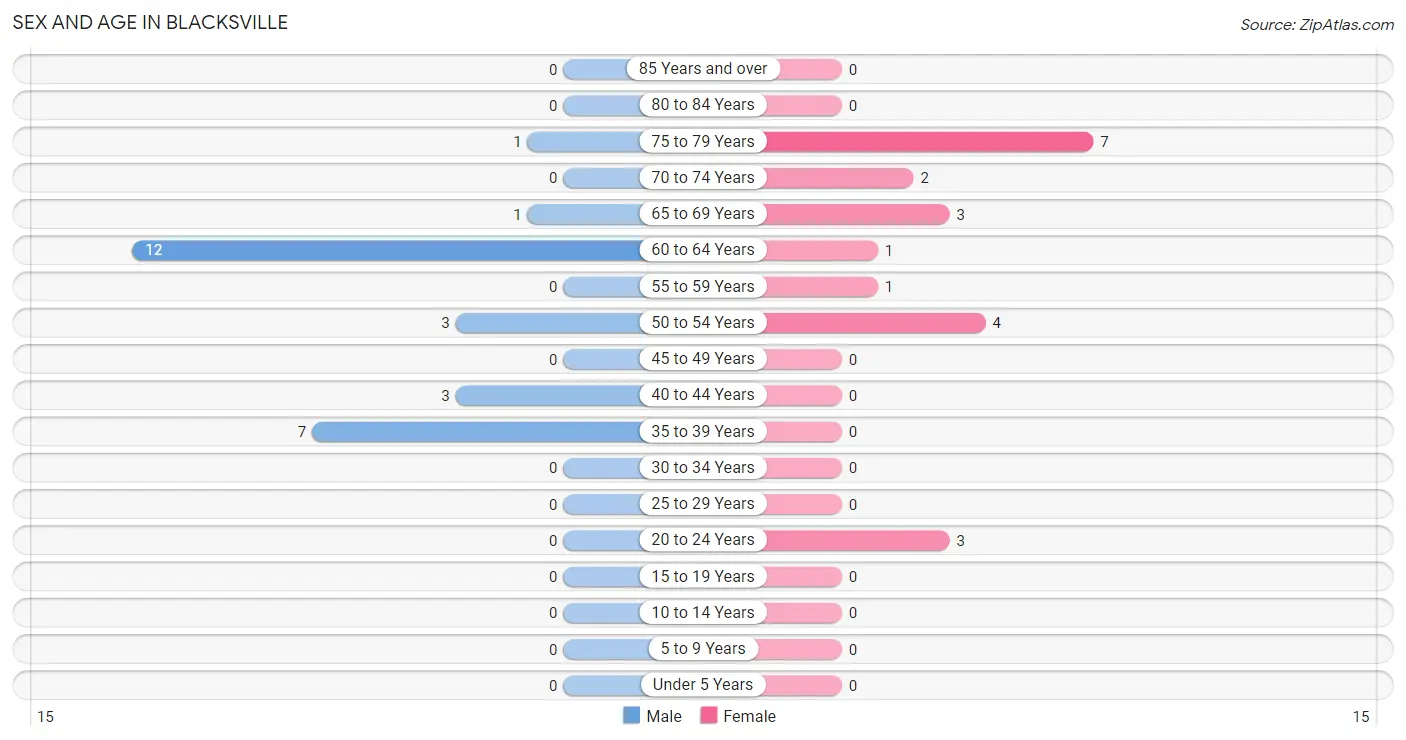
| Age Bracket | Male | Female |
| Under 5 Years | 0 (0.0%) | 0 (0.0%) |
| 5 to 9 Years | 0 (0.0%) | 0 (0.0%) |
| 10 to 14 Years | 0 (0.0%) | 0 (0.0%) |
| 15 to 19 Years | 0 (0.0%) | 0 (0.0%) |
| 20 to 24 Years | 0 (0.0%) | 3 (14.3%) |
| 25 to 29 Years | 0 (0.0%) | 0 (0.0%) |
| 30 to 34 Years | 0 (0.0%) | 0 (0.0%) |
| 35 to 39 Years | 7 (25.9%) | 0 (0.0%) |
| 40 to 44 Years | 3 (11.1%) | 0 (0.0%) |
| 45 to 49 Years | 0 (0.0%) | 0 (0.0%) |
| 50 to 54 Years | 3 (11.1%) | 4 (19.1%) |
| 55 to 59 Years | 0 (0.0%) | 1 (4.8%) |
| 60 to 64 Years | 12 (44.4%) | 1 (4.8%) |
| 65 to 69 Years | 1 (3.7%) | 3 (14.3%) |
| 70 to 74 Years | 0 (0.0%) | 2 (9.5%) |
| 75 to 79 Years | 1 (3.7%) | 7 (33.3%) |
| 80 to 84 Years | 0 (0.0%) | 0 (0.0%) |
| 85 Years and over | 0 (0.0%) | 0 (0.0%) |
| Total | 27 (100.0%) | 21 (100.0%) |
Families and Households in Blacksville
Median Family Size in Blacksville
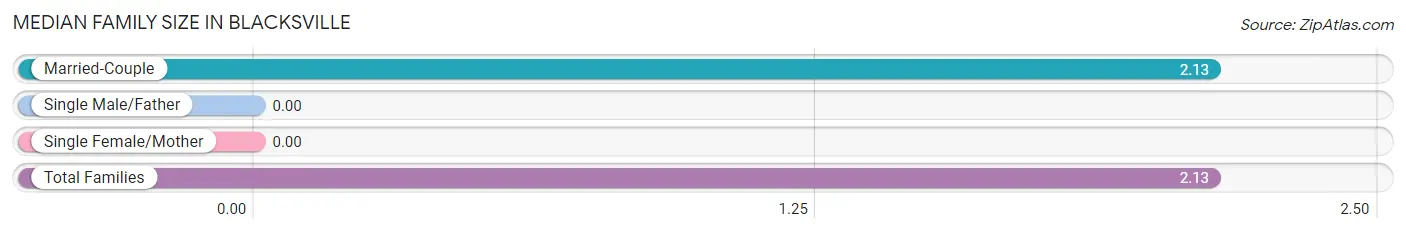
| Family Type | # Families | Family Size |
| Married-Couple | 16 (100.0%) | 2.13 |
| Single Male/Father | 0 (0.0%) | - |
| Single Female/Mother | 0 (0.0%) | - |
| Total Families | 16 (100.0%) | 2.13 |
Median Household Size in Blacksville
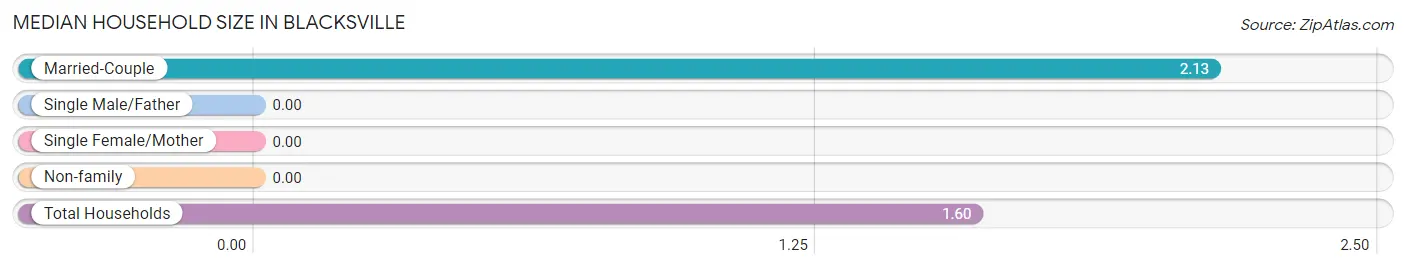
| Household Type | # Households | Household Size |
| Married-Couple | 16 (53.3%) | 2.13 |
| Single Male/Father | 0 (0.0%) | - |
| Single Female/Mother | 0 (0.0%) | - |
| Non-family | 14 (46.7%) | - |
| Total Households | 30 (100.0%) | 1.60 |
Household Size by Marriage Status in Blacksville
Out of a total of 30 households in Blacksville, 16 (53.3%) are family households, while 14 (46.7%) are nonfamily households. The most numerous type of family households are 2-person households, comprising 13, and the most common type of nonfamily households are 1-person households, comprising 14.
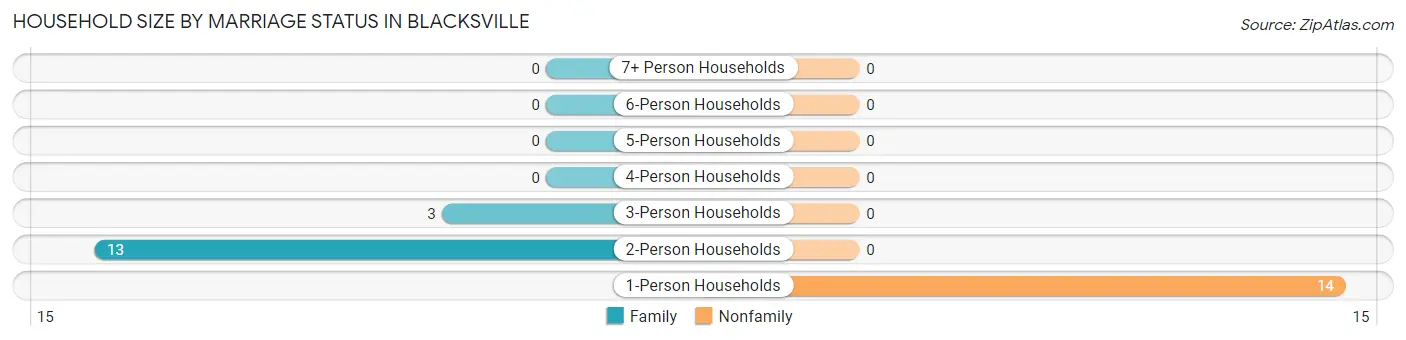
| Household Size | Family Households | Nonfamily Households |
| 1-Person Households | - | 14 (46.7%) |
| 2-Person Households | 13 (43.3%) | 0 (0.0%) |
| 3-Person Households | 3 (10.0%) | 0 (0.0%) |
| 4-Person Households | 0 (0.0%) | 0 (0.0%) |
| 5-Person Households | 0 (0.0%) | 0 (0.0%) |
| 6-Person Households | 0 (0.0%) | 0 (0.0%) |
| 7+ Person Households | 0 (0.0%) | 0 (0.0%) |
| Total | 16 (53.3%) | 14 (46.7%) |
Female Fertility in Blacksville
Fertility by Age in Blacksville
| Age Bracket | Women with Births | Births / 1,000 Women |
| 15 to 19 years | 0 (0.0%) | 0.0 |
| 20 to 34 years | 0 (0.0%) | 0.0 |
| 35 to 50 years | 0 (0.0%) | 0.0 |
| Total | 0 (0.0%) | 0.0 |
Fertility by Age by Marriage Status in Blacksville
| Age Bracket | Married | Unmarried |
| 15 to 19 years | 0 (0.0%) | 0 (0.0%) |
| 20 to 34 years | 0 (0.0%) | 0 (0.0%) |
| 35 to 50 years | 0 (0.0%) | 0 (0.0%) |
| Total | 0 (0.0%) | 0 (0.0%) |
Fertility by Education in Blacksville
| Educational Attainment | Women with Births | Births / 1,000 Women |
| Less than High School | 0 (0.0%) | 0.0 |
| High School Diploma | 0 (0.0%) | 0.0 |
| College or Associate's Degree | 0 (0.0%) | 0.0 |
| Bachelor's Degree | 0 (0.0%) | 0.0 |
| Graduate Degree | 0 (0.0%) | 0.0 |
| Total | 0 (0.0%) | 0.0 |
Fertility by Education by Marriage Status in Blacksville
| Educational Attainment | Married | Unmarried |
| Less than High School | 0 (0.0%) | 0 (0.0%) |
| High School Diploma | 0 (0.0%) | 0 (0.0%) |
| College or Associate's Degree | 0 (0.0%) | 0 (0.0%) |
| Bachelor's Degree | 0 (0.0%) | 0 (0.0%) |
| Graduate Degree | 0 (0.0%) | 0 (0.0%) |
| Total | 0 (0.0%) | 0 (0.0%) |
Employment Characteristics in Blacksville
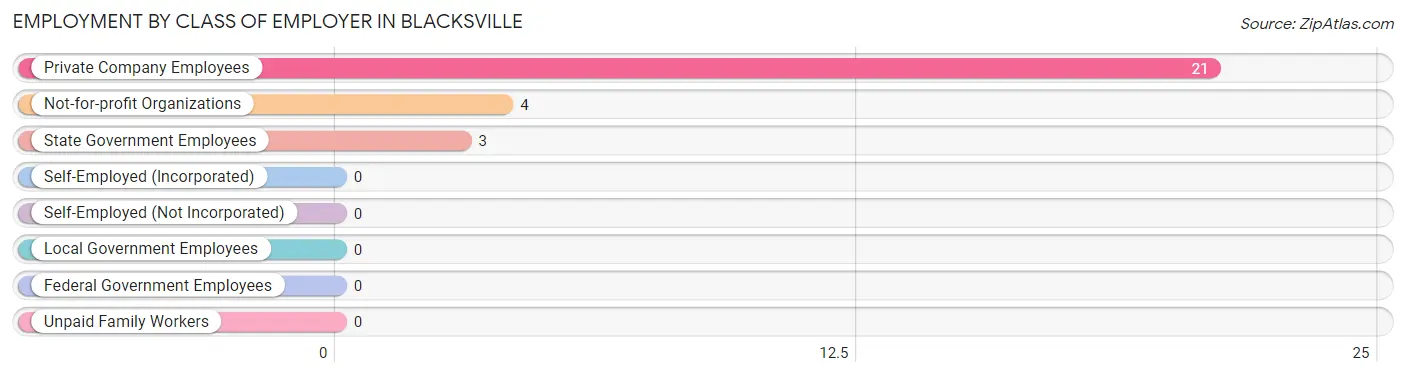
Employment by Class of Employer in Blacksville
Among the 28 employed individuals in Blacksville, private company employees (21 | 75.0%), not-for-profit organizations (4 | 14.3%), and state government employees (3 | 10.7%) make up the most common classes of employment.
| Employer Class | # Employees | % Employees |
| Private Company Employees | 21 | 75.0% |
| Self-Employed (Incorporated) | 0 | 0.0% |
| Self-Employed (Not Incorporated) | 0 | 0.0% |
| Not-for-profit Organizations | 4 | 14.3% |
| Local Government Employees | 0 | 0.0% |
| State Government Employees | 3 | 10.7% |
| Federal Government Employees | 0 | 0.0% |
| Unpaid Family Workers | 0 | 0.0% |
| Total | 28 | 100.0% |
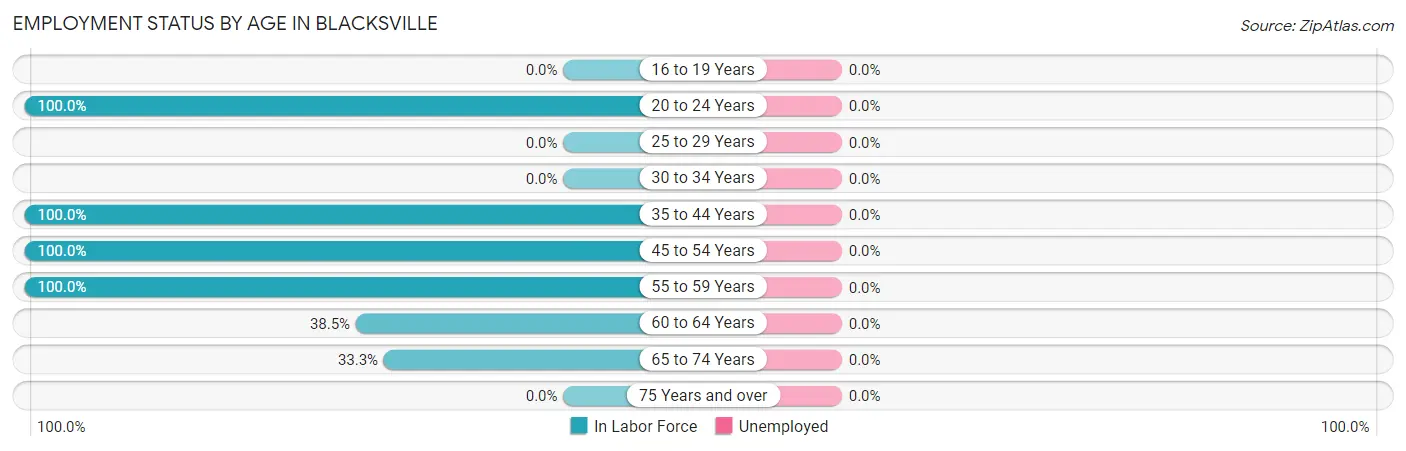
Employment Status by Age in Blacksville
| Age Bracket | In Labor Force | Unemployed |
| 16 to 19 Years | 0 (0.0%) | 0 (0.0%) |
| 20 to 24 Years | 3 (100.0%) | 0 (0.0%) |
| 25 to 29 Years | 0 (0.0%) | 0 (0.0%) |
| 30 to 34 Years | 0 (0.0%) | 0 (0.0%) |
| 35 to 44 Years | 10 (100.0%) | 0 (0.0%) |
| 45 to 54 Years | 7 (100.0%) | 0 (0.0%) |
| 55 to 59 Years | 1 (100.0%) | 0 (0.0%) |
| 60 to 64 Years | 5 (38.5%) | 0 (0.0%) |
| 65 to 74 Years | 2 (33.3%) | 0 (0.0%) |
| 75 Years and over | 0 (0.0%) | 0 (0.0%) |
| Total | 28 (58.3%) | 0 (0.0%) |
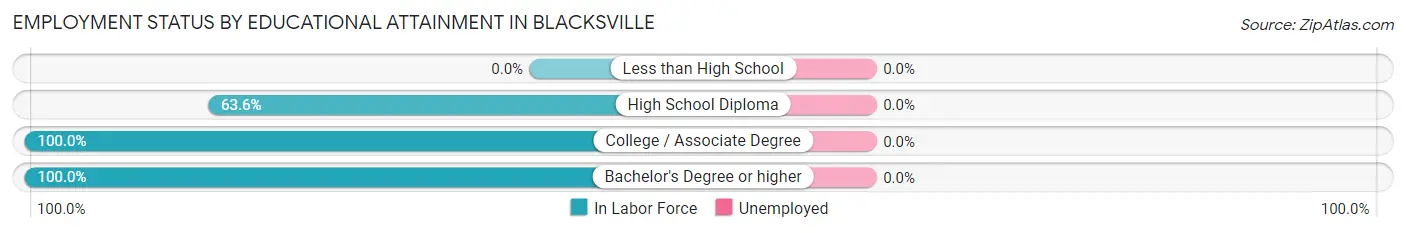
Employment Status by Educational Attainment in Blacksville
| Educational Attainment | In Labor Force | Unemployed |
| Less than High School | 0 (0.0%) | 0 (0.0%) |
| High School Diploma | 14 (63.6%) | 0 (0.0%) |
| College / Associate Degree | 8 (100.0%) | 0 (0.0%) |
| Bachelor's Degree or higher | 1 (100.0%) | 0 (0.0%) |
| Total | 23 (74.2%) | 0 (0.0%) |
Employment Occupations by Sex in Blacksville
Management, Business, Science and Arts Occupations
The most common Management, Business, Science and Arts occupations in Blacksville are Management (5 | 17.9%), Business & Financial (5 | 17.9%), Community & Social Service (1 | 3.6%), and Education Instruction & Library (1 | 3.6%).
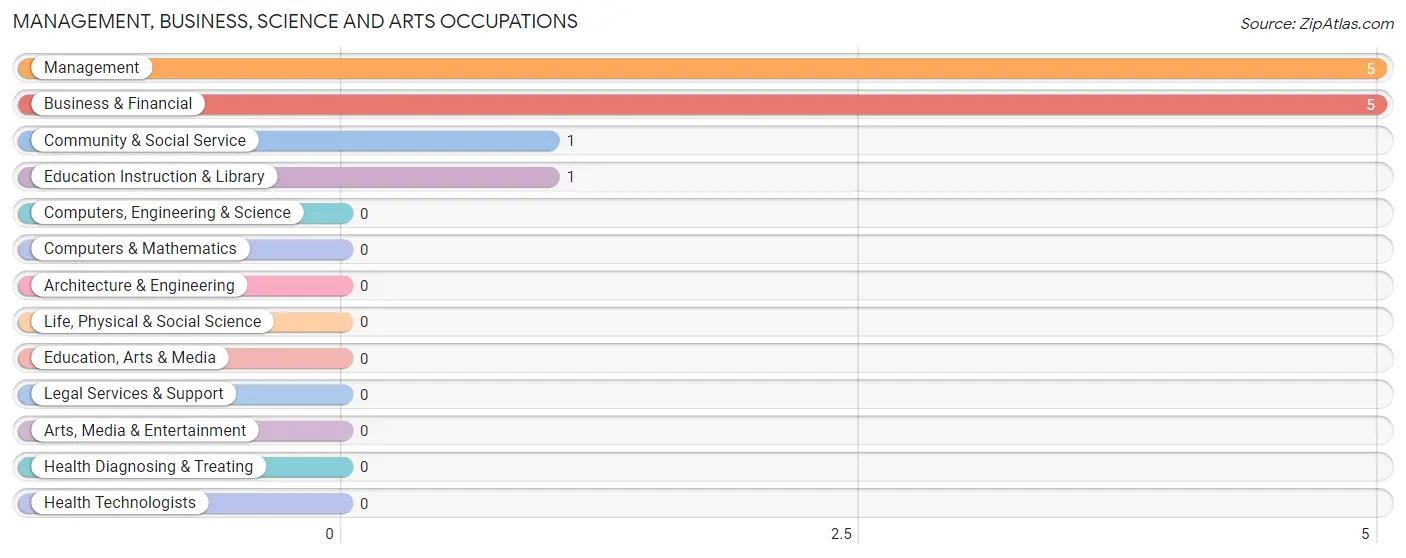
Management, Business, Science and Arts Occupations by Sex
Within the Management, Business, Science and Arts occupations in Blacksville, the most male-oriented occupations are Management (80.0%), and Business & Financial (60.0%), while the most female-oriented occupations are Community & Social Service (100.0%), Education Instruction & Library (100.0%), and Business & Financial (40.0%).
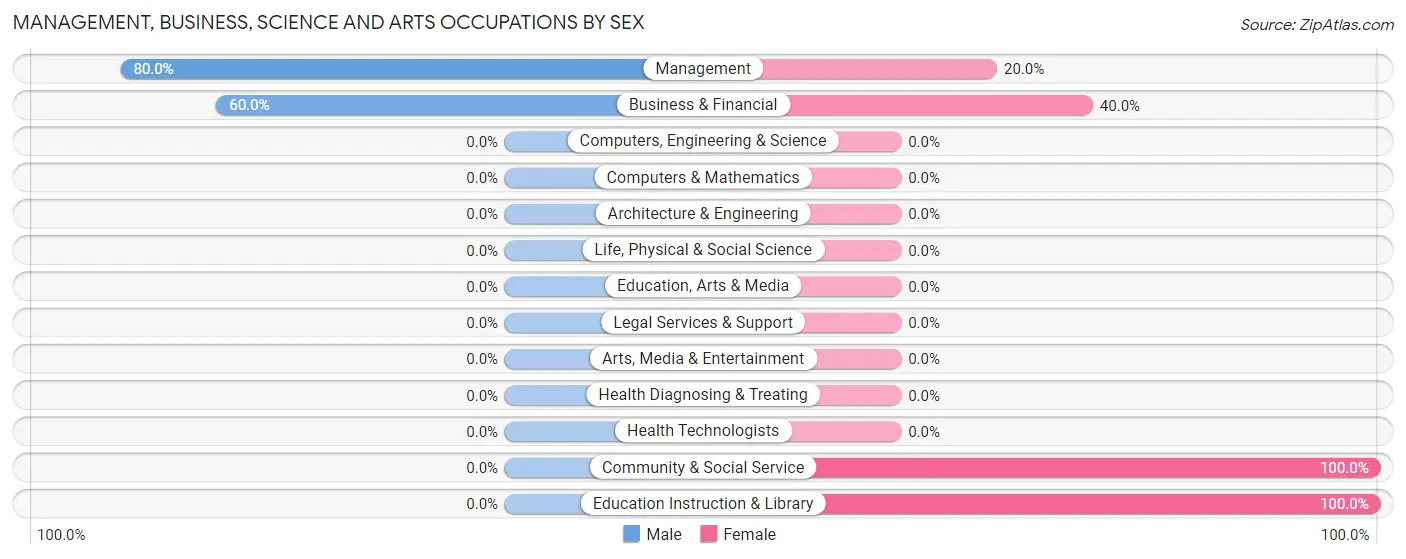
| Occupation | Male | Female |
| Management | 4 (80.0%) | 1 (20.0%) |
| Business & Financial | 3 (60.0%) | 2 (40.0%) |
| Computers, Engineering & Science | 0 (0.0%) | 0 (0.0%) |
| Computers & Mathematics | 0 (0.0%) | 0 (0.0%) |
| Architecture & Engineering | 0 (0.0%) | 0 (0.0%) |
| Life, Physical & Social Science | 0 (0.0%) | 0 (0.0%) |
| Community & Social Service | 0 (0.0%) | 1 (100.0%) |
| Education, Arts & Media | 0 (0.0%) | 0 (0.0%) |
| Legal Services & Support | 0 (0.0%) | 0 (0.0%) |
| Education Instruction & Library | 0 (0.0%) | 1 (100.0%) |
| Arts, Media & Entertainment | 0 (0.0%) | 0 (0.0%) |
| Health Diagnosing & Treating | 0 (0.0%) | 0 (0.0%) |
| Health Technologists | 0 (0.0%) | 0 (0.0%) |
| Total (Category) | 7 (63.6%) | 4 (36.4%) |
| Total (Overall) | 17 (60.7%) | 11 (39.3%) |
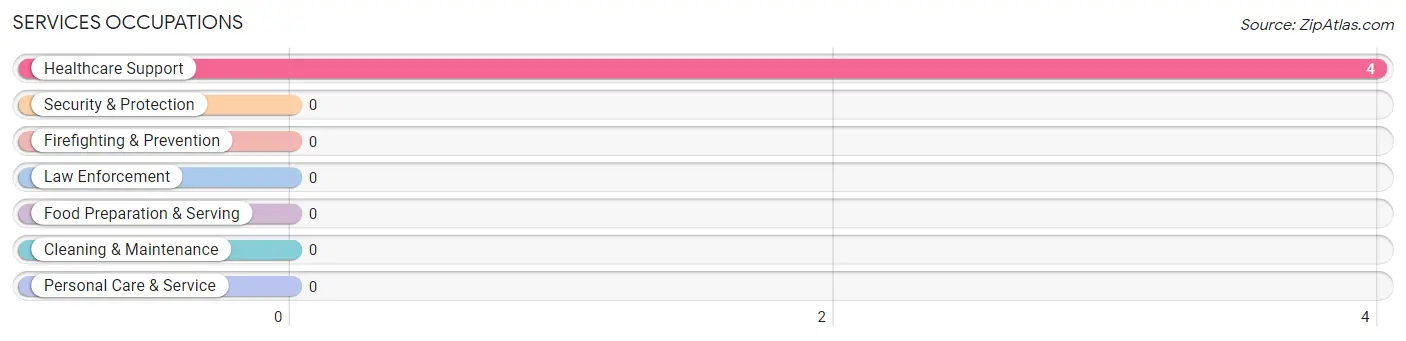
Services Occupations
The most common Services occupations in Blacksville are , and Healthcare Support (4 | 14.3%).
Services Occupations by Sex
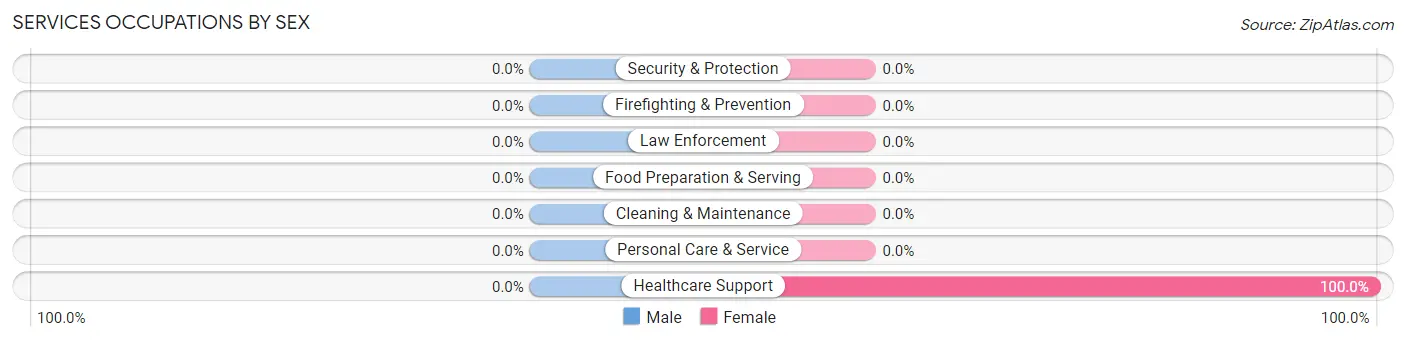
| Occupation | Male | Female |
| Healthcare Support | 0 (0.0%) | 4 (100.0%) |
| Security & Protection | 0 (0.0%) | 0 (0.0%) |
| Firefighting & Prevention | 0 (0.0%) | 0 (0.0%) |
| Law Enforcement | 0 (0.0%) | 0 (0.0%) |
| Food Preparation & Serving | 0 (0.0%) | 0 (0.0%) |
| Cleaning & Maintenance | 0 (0.0%) | 0 (0.0%) |
| Personal Care & Service | 0 (0.0%) | 0 (0.0%) |
| Total (Category) | 0 (0.0%) | 4 (100.0%) |
| Total (Overall) | 17 (60.7%) | 11 (39.3%) |
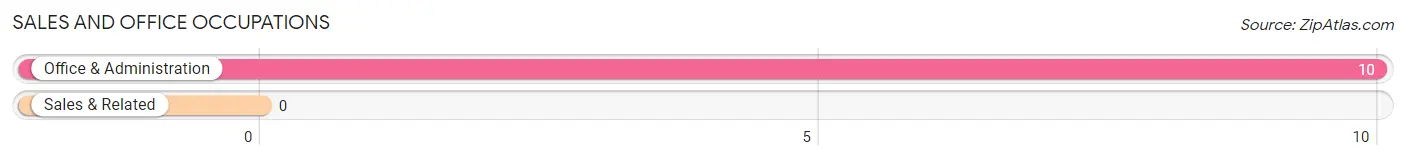
Sales and Office Occupations
The most common Sales and Office occupations in Blacksville are , and Office & Administration (10 | 35.7%).
Sales and Office Occupations by Sex
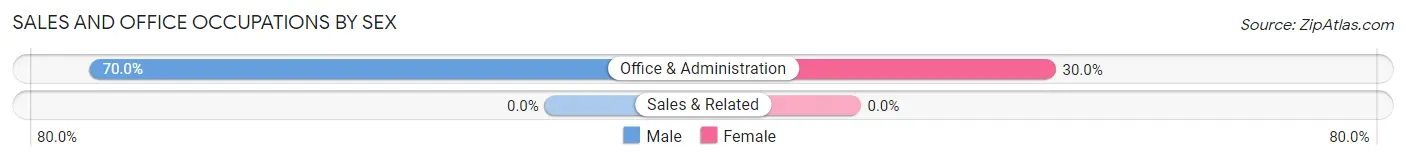
| Occupation | Male | Female |
| Sales & Related | 0 (0.0%) | 0 (0.0%) |
| Office & Administration | 7 (70.0%) | 3 (30.0%) |
| Total (Category) | 7 (70.0%) | 3 (30.0%) |
| Total (Overall) | 17 (60.7%) | 11 (39.3%) |
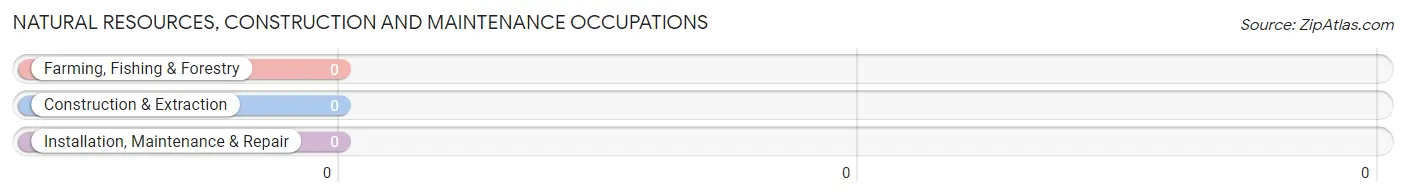
Natural Resources, Construction and Maintenance Occupations
Natural Resources, Construction and Maintenance Occupations by Sex
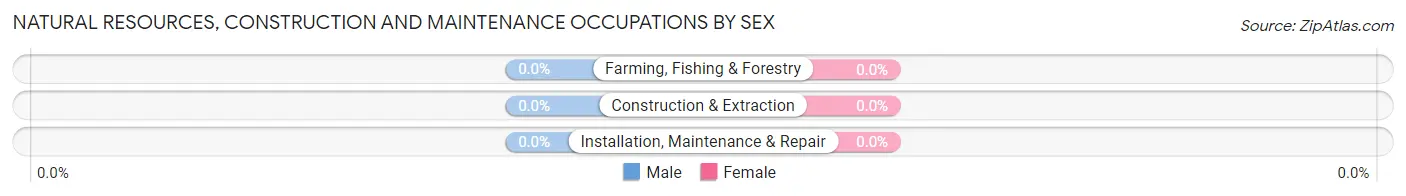
| Occupation | Male | Female |
| Farming, Fishing & Forestry | 0 (0.0%) | 0 (0.0%) |
| Construction & Extraction | 0 (0.0%) | 0 (0.0%) |
| Installation, Maintenance & Repair | 0 (0.0%) | 0 (0.0%) |
| Total (Category) | 0 (0.0%) | 0 (0.0%) |
| Total (Overall) | 17 (60.7%) | 11 (39.3%) |
Production, Transportation and Moving Occupations
The most common Production, Transportation and Moving occupations in Blacksville are , and Production (3 | 10.7%).
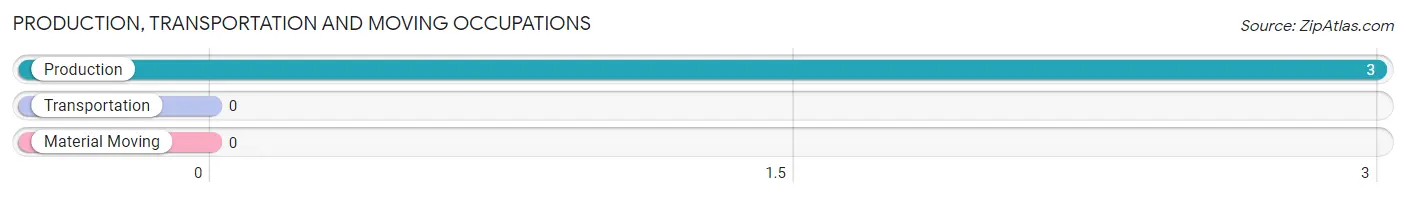
Production, Transportation and Moving Occupations by Sex
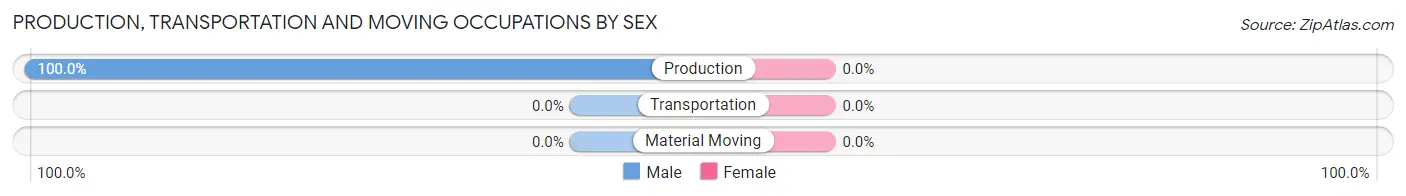
| Occupation | Male | Female |
| Production | 3 (100.0%) | 0 (0.0%) |
| Transportation | 0 (0.0%) | 0 (0.0%) |
| Material Moving | 0 (0.0%) | 0 (0.0%) |
| Total (Category) | 3 (100.0%) | 0 (0.0%) |
| Total (Overall) | 17 (60.7%) | 11 (39.3%) |
Employment Industries by Sex in Blacksville
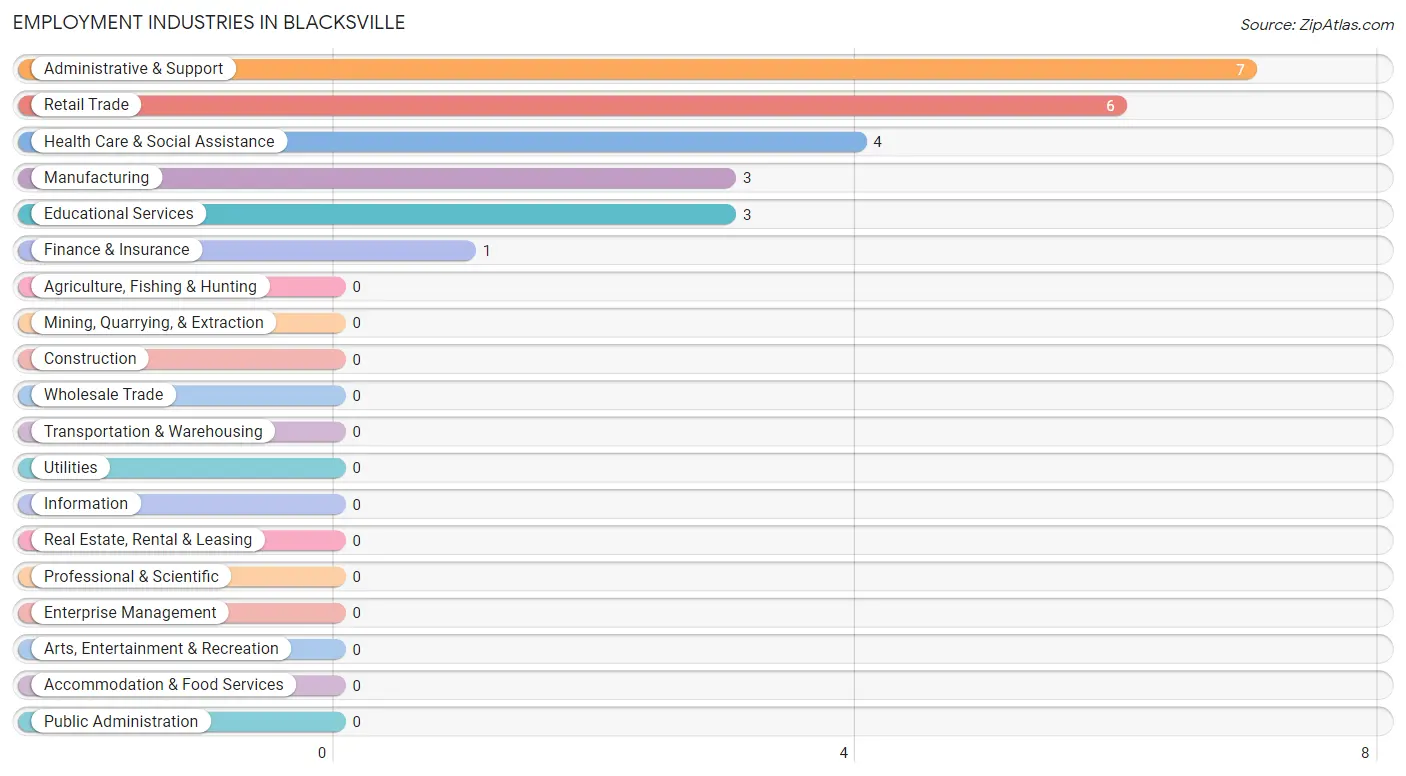
Employment Industries in Blacksville
The major employment industries in Blacksville include Administrative & Support (7 | 25.0%), Retail Trade (6 | 21.4%), Health Care & Social Assistance (4 | 14.3%), Manufacturing (3 | 10.7%), and Educational Services (3 | 10.7%).
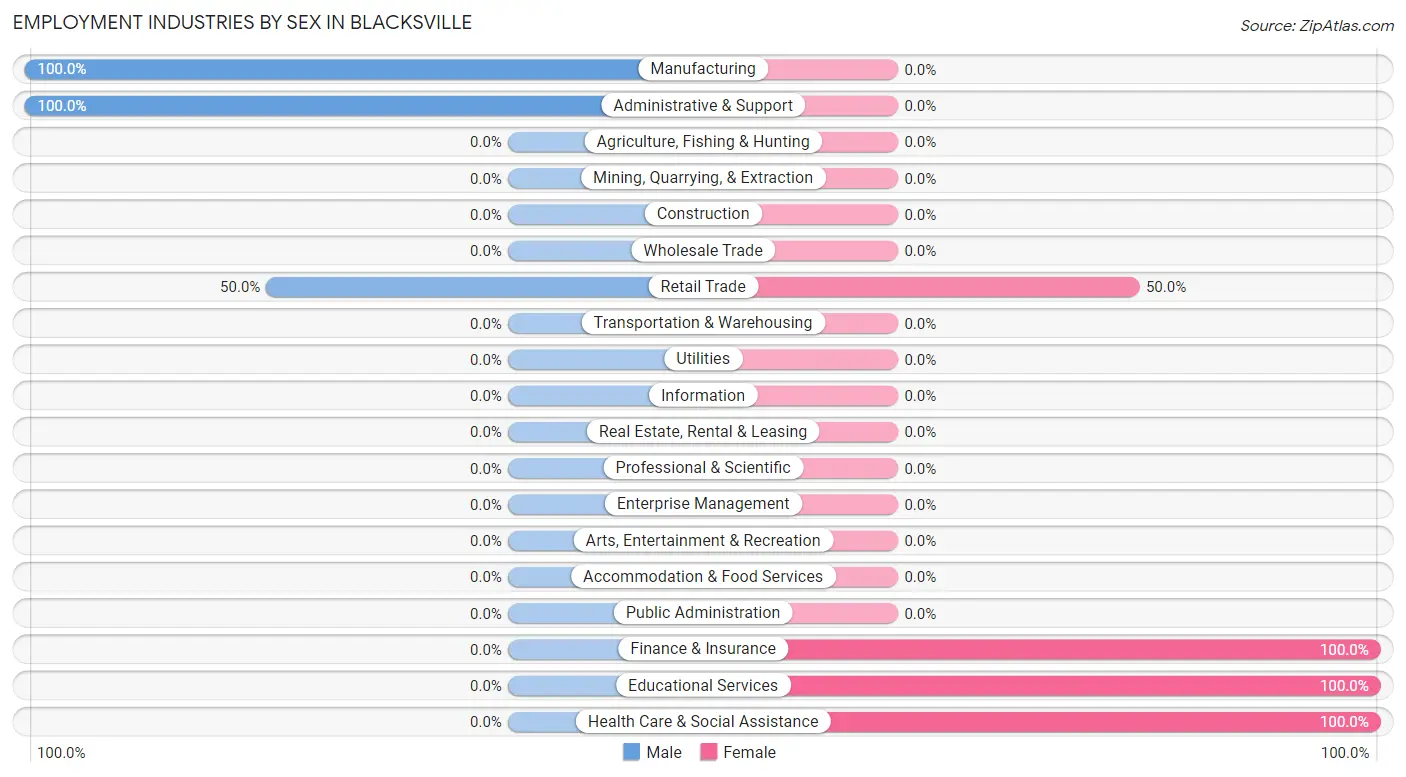
Employment Industries by Sex in Blacksville
The Blacksville industries that see more men than women are Manufacturing (100.0%), Administrative & Support (100.0%), and Retail Trade (50.0%), whereas the industries that tend to have a higher number of women are Finance & Insurance (100.0%), Educational Services (100.0%), and Health Care & Social Assistance (100.0%).
| Industry | Male | Female |
| Agriculture, Fishing & Hunting | 0 (0.0%) | 0 (0.0%) |
| Mining, Quarrying, & Extraction | 0 (0.0%) | 0 (0.0%) |
| Construction | 0 (0.0%) | 0 (0.0%) |
| Manufacturing | 3 (100.0%) | 0 (0.0%) |
| Wholesale Trade | 0 (0.0%) | 0 (0.0%) |
| Retail Trade | 3 (50.0%) | 3 (50.0%) |
| Transportation & Warehousing | 0 (0.0%) | 0 (0.0%) |
| Utilities | 0 (0.0%) | 0 (0.0%) |
| Information | 0 (0.0%) | 0 (0.0%) |
| Finance & Insurance | 0 (0.0%) | 1 (100.0%) |
| Real Estate, Rental & Leasing | 0 (0.0%) | 0 (0.0%) |
| Professional & Scientific | 0 (0.0%) | 0 (0.0%) |
| Enterprise Management | 0 (0.0%) | 0 (0.0%) |
| Administrative & Support | 7 (100.0%) | 0 (0.0%) |
| Educational Services | 0 (0.0%) | 3 (100.0%) |
| Health Care & Social Assistance | 0 (0.0%) | 4 (100.0%) |
| Arts, Entertainment & Recreation | 0 (0.0%) | 0 (0.0%) |
| Accommodation & Food Services | 0 (0.0%) | 0 (0.0%) |
| Public Administration | 0 (0.0%) | 0 (0.0%) |
| Total | 17 (60.7%) | 11 (39.3%) |
Education in Blacksville
School Enrollment in Blacksville
| School Level | # Students | % Students |
| Nursery / Preschool | 0 | 0.0% |
| Kindergarten | 0 | 0.0% |
| Elementary School | 0 | 0.0% |
| Middle School | 0 | 0.0% |
| High School | 0 | 0.0% |
| College / Undergraduate | 0 | 0.0% |
| Graduate / Professional | 0 | 0.0% |
| Total | 0 | 0.0% |
School Enrollment by Age by Funding Source in Blacksville
| Age Bracket | Public School | Private School |
| 3 to 4 Year Olds | 0 (0.0%) | 0 (0.0%) |
| 5 to 9 Year Old | 0 (0.0%) | 0 (0.0%) |
| 10 to 14 Year Olds | 0 (0.0%) | 0 (0.0%) |
| 15 to 17 Year Olds | 0 (0.0%) | 0 (0.0%) |
| 18 to 19 Year Olds | 0 (0.0%) | 0 (0.0%) |
| 20 to 24 Year Olds | 0 (0.0%) | 0 (0.0%) |
| 25 to 34 Year Olds | 0 (0.0%) | 0 (0.0%) |
| 35 Years and over | 0 (0.0%) | 0 (0.0%) |
| Total | 0 (0.0%) | 0 (0.0%) |
Educational Attainment by Field of Study in Blacksville
, and education (1 | 100.0%) are the most common fields of study among 1 individuals in Blacksville who have obtained a bachelor's degree or higher.
| Field of Study | # Graduates | % Graduates |
| Computers & Mathematics | 0 | 0.0% |
| Bio, Nature & Agricultural | 0 | 0.0% |
| Physical & Health Sciences | 0 | 0.0% |
| Psychology | 0 | 0.0% |
| Social Sciences | 0 | 0.0% |
| Engineering | 0 | 0.0% |
| Multidisciplinary Studies | 0 | 0.0% |
| Science & Technology | 0 | 0.0% |
| Business | 0 | 0.0% |
| Education | 1 | 100.0% |
| Literature & Languages | 0 | 0.0% |
| Liberal Arts & History | 0 | 0.0% |
| Visual & Performing Arts | 0 | 0.0% |
| Communications | 0 | 0.0% |
| Arts & Humanities | 0 | 0.0% |
| Total | 1 | 100.0% |
Transportation & Commute in Blacksville
Vehicle Availability by Sex in Blacksville
The most prevalent vehicle ownership categories in Blacksville are males with 1 vehicle (7, accounting for 41.2%) and females with 1 vehicle (4, making up 63.6%).
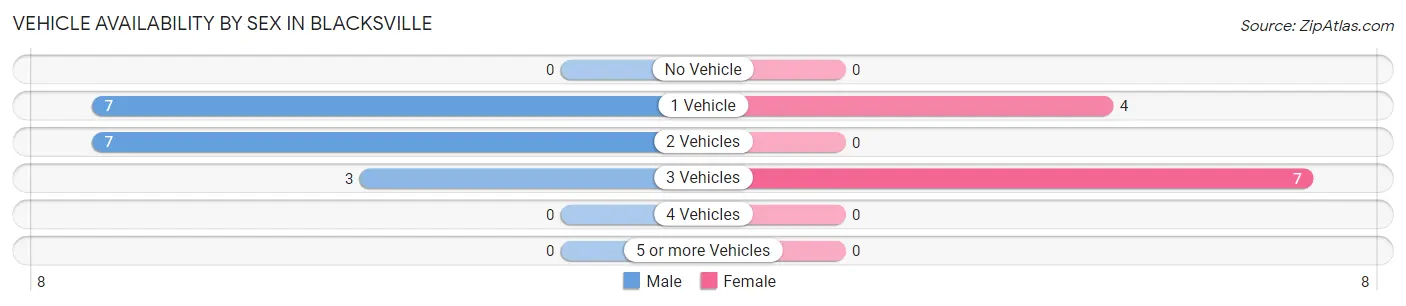
| Vehicles Available | Male | Female |
| No Vehicle | 0 (0.0%) | 0 (0.0%) |
| 1 Vehicle | 7 (41.2%) | 4 (36.4%) |
| 2 Vehicles | 7 (41.2%) | 0 (0.0%) |
| 3 Vehicles | 3 (17.6%) | 7 (63.6%) |
| 4 Vehicles | 0 (0.0%) | 0 (0.0%) |
| 5 or more Vehicles | 0 (0.0%) | 0 (0.0%) |
| Total | 17 (100.0%) | 11 (100.0%) |
Commute Time in Blacksville
The most frequently occuring commute durations in Blacksville are 90 or more minutes (7 commuters, 30.4%), 30 to 34 minutes (5 commuters, 21.7%), and 20 to 24 minutes (3 commuters, 13.0%).
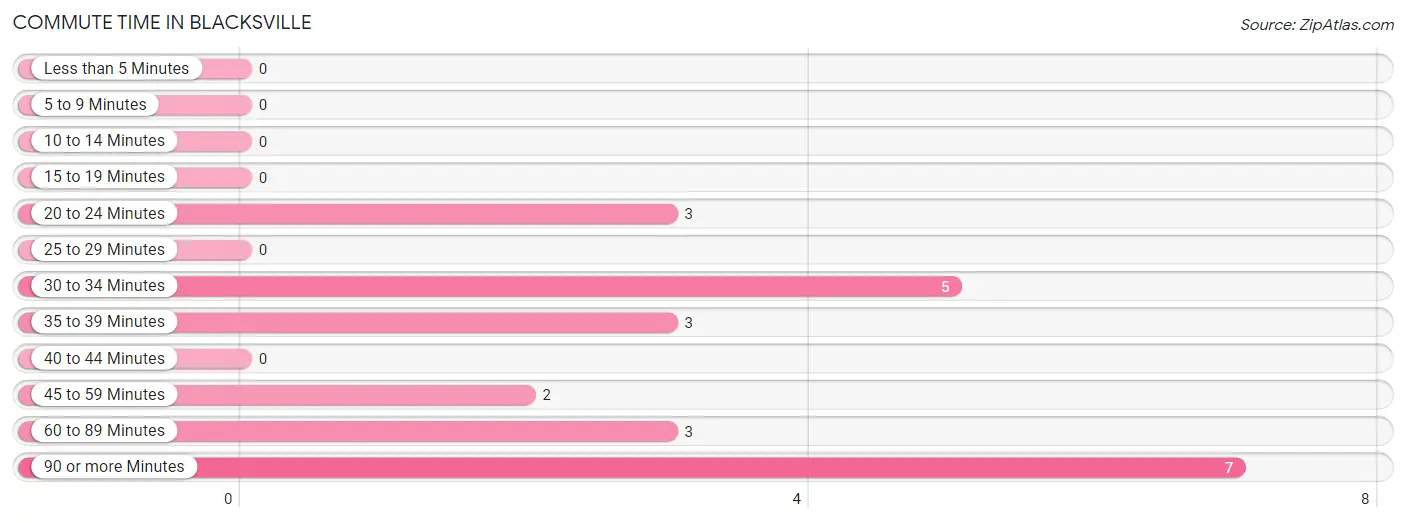
| Commute Time | # Commuters | % Commuters |
| Less than 5 Minutes | 0 | 0.0% |
| 5 to 9 Minutes | 0 | 0.0% |
| 10 to 14 Minutes | 0 | 0.0% |
| 15 to 19 Minutes | 0 | 0.0% |
| 20 to 24 Minutes | 3 | 13.0% |
| 25 to 29 Minutes | 0 | 0.0% |
| 30 to 34 Minutes | 5 | 21.7% |
| 35 to 39 Minutes | 3 | 13.0% |
| 40 to 44 Minutes | 0 | 0.0% |
| 45 to 59 Minutes | 2 | 8.7% |
| 60 to 89 Minutes | 3 | 13.0% |
| 90 or more Minutes | 7 | 30.4% |
Commute Time by Sex in Blacksville
The most common commute times in Blacksville are 90 or more minutes (7 commuters, 53.8%) for males and 30 to 34 minutes (5 commuters, 50.0%) for females.
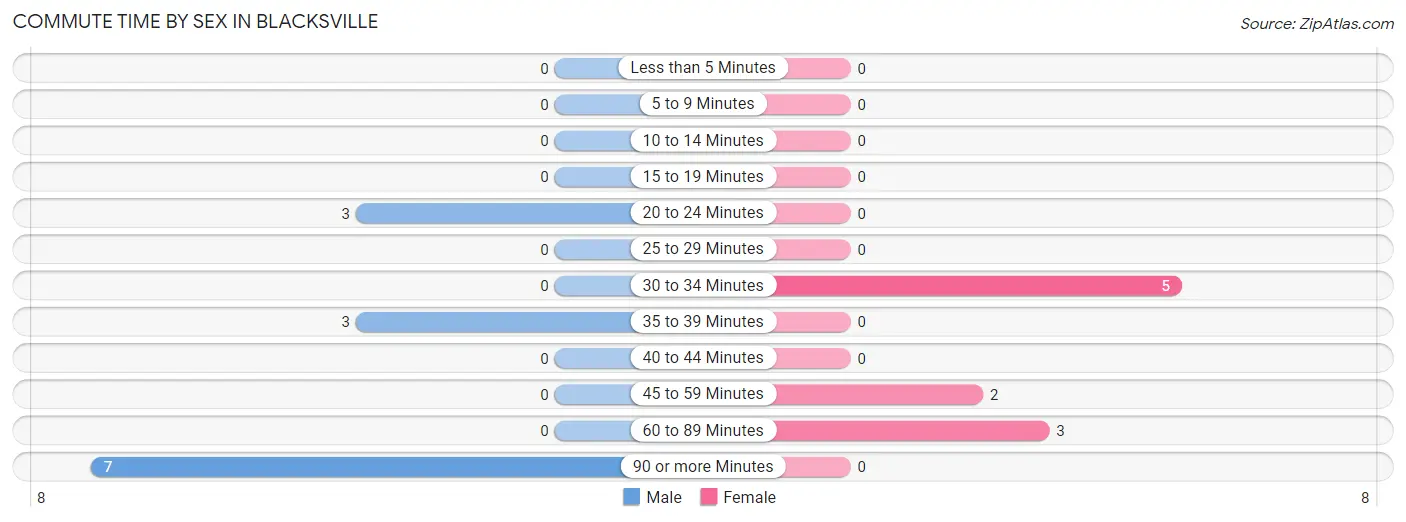
| Commute Time | Male | Female |
| Less than 5 Minutes | 0 (0.0%) | 0 (0.0%) |
| 5 to 9 Minutes | 0 (0.0%) | 0 (0.0%) |
| 10 to 14 Minutes | 0 (0.0%) | 0 (0.0%) |
| 15 to 19 Minutes | 0 (0.0%) | 0 (0.0%) |
| 20 to 24 Minutes | 3 (23.1%) | 0 (0.0%) |
| 25 to 29 Minutes | 0 (0.0%) | 0 (0.0%) |
| 30 to 34 Minutes | 0 (0.0%) | 5 (50.0%) |
| 35 to 39 Minutes | 3 (23.1%) | 0 (0.0%) |
| 40 to 44 Minutes | 0 (0.0%) | 0 (0.0%) |
| 45 to 59 Minutes | 0 (0.0%) | 2 (20.0%) |
| 60 to 89 Minutes | 0 (0.0%) | 3 (30.0%) |
| 90 or more Minutes | 7 (53.8%) | 0 (0.0%) |
Time of Departure to Work by Sex in Blacksville
The most frequent times of departure to work in Blacksville are 7:00 AM to 7:29 AM (7, 53.8%) for males and 7:00 AM to 7:29 AM (6, 60.0%) for females.
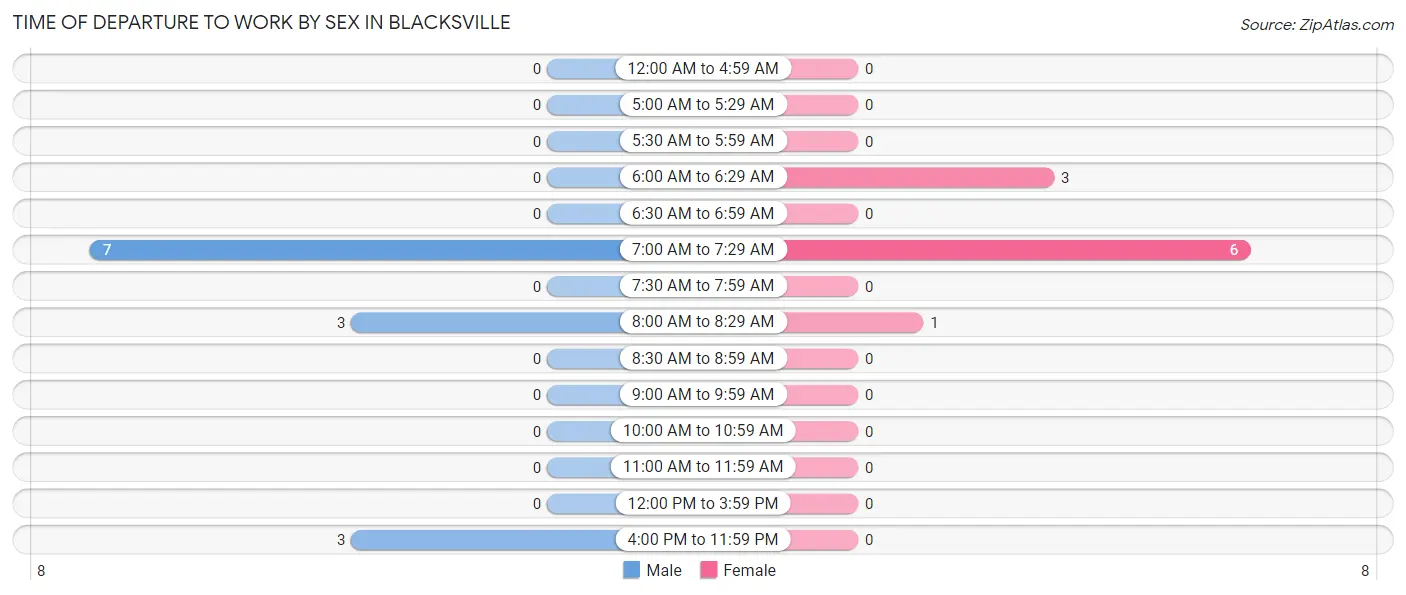
| Time of Departure | Male | Female |
| 12:00 AM to 4:59 AM | 0 (0.0%) | 0 (0.0%) |
| 5:00 AM to 5:29 AM | 0 (0.0%) | 0 (0.0%) |
| 5:30 AM to 5:59 AM | 0 (0.0%) | 0 (0.0%) |
| 6:00 AM to 6:29 AM | 0 (0.0%) | 3 (30.0%) |
| 6:30 AM to 6:59 AM | 0 (0.0%) | 0 (0.0%) |
| 7:00 AM to 7:29 AM | 7 (53.8%) | 6 (60.0%) |
| 7:30 AM to 7:59 AM | 0 (0.0%) | 0 (0.0%) |
| 8:00 AM to 8:29 AM | 3 (23.1%) | 1 (10.0%) |
| 8:30 AM to 8:59 AM | 0 (0.0%) | 0 (0.0%) |
| 9:00 AM to 9:59 AM | 0 (0.0%) | 0 (0.0%) |
| 10:00 AM to 10:59 AM | 0 (0.0%) | 0 (0.0%) |
| 11:00 AM to 11:59 AM | 0 (0.0%) | 0 (0.0%) |
| 12:00 PM to 3:59 PM | 0 (0.0%) | 0 (0.0%) |
| 4:00 PM to 11:59 PM | 3 (23.1%) | 0 (0.0%) |
| Total | 13 (100.0%) | 10 (100.0%) |
Housing Occupancy in Blacksville
Occupancy by Ownership in Blacksville
Of the total 30 dwellings in Blacksville, owner-occupied units account for 23 (76.7%), while renter-occupied units make up 7 (23.3%).
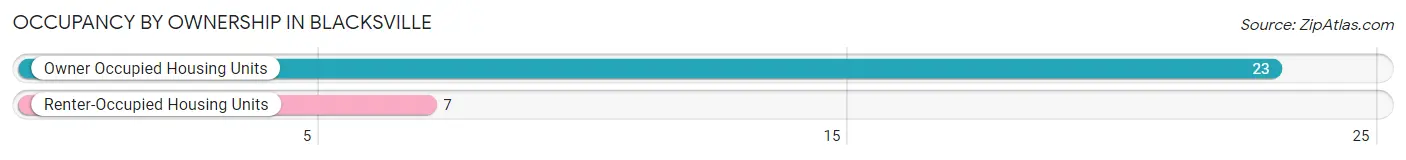
| Occupancy | # Housing Units | % Housing Units |
| Owner Occupied Housing Units | 23 | 76.7% |
| Renter-Occupied Housing Units | 7 | 23.3% |
| Total Occupied Housing Units | 30 | 100.0% |
Occupancy by Household Size in Blacksville
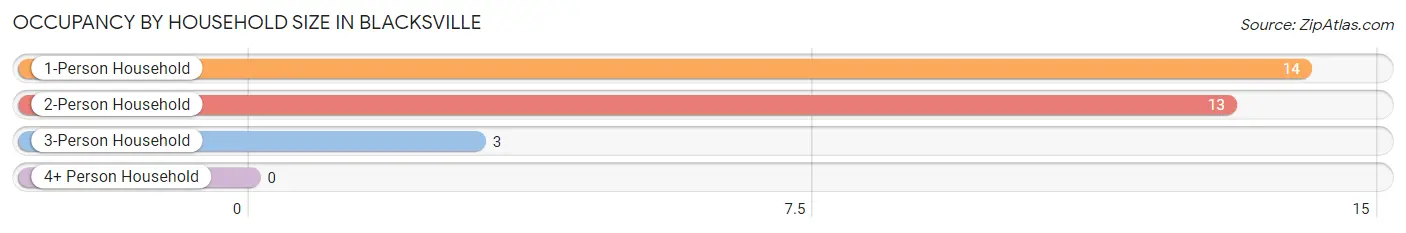
| Household Size | # Housing Units | % Housing Units |
| 1-Person Household | 14 | 46.7% |
| 2-Person Household | 13 | 43.3% |
| 3-Person Household | 3 | 10.0% |
| 4+ Person Household | 0 | 0.0% |
| Total Housing Units | 30 | 100.0% |
Occupancy by Ownership by Household Size in Blacksville
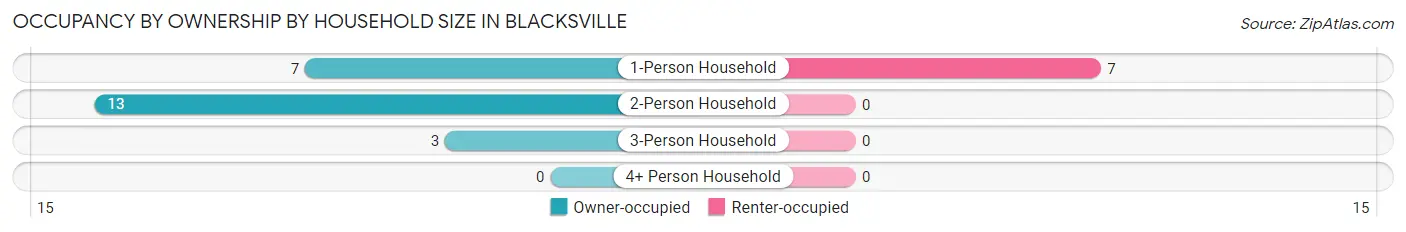
| Household Size | Owner-occupied | Renter-occupied |
| 1-Person Household | 7 (50.0%) | 7 (50.0%) |
| 2-Person Household | 13 (100.0%) | 0 (0.0%) |
| 3-Person Household | 3 (100.0%) | 0 (0.0%) |
| 4+ Person Household | 0 (0.0%) | 0 (0.0%) |
| Total Housing Units | 23 (76.7%) | 7 (23.3%) |
Occupancy by Educational Attainment in Blacksville
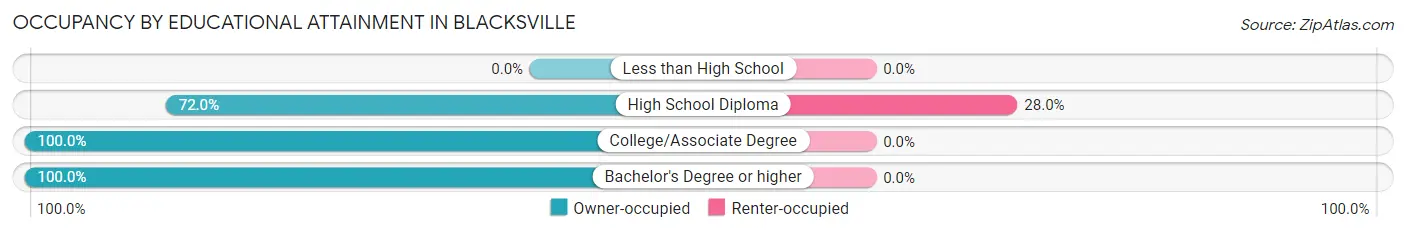
| Household Size | Owner-occupied | Renter-occupied |
| Less than High School | 0 (0.0%) | 0 (0.0%) |
| High School Diploma | 18 (72.0%) | 7 (28.0%) |
| College/Associate Degree | 4 (100.0%) | 0 (0.0%) |
| Bachelor's Degree or higher | 1 (100.0%) | 0 (0.0%) |
Occupancy by Age of Householder in Blacksville
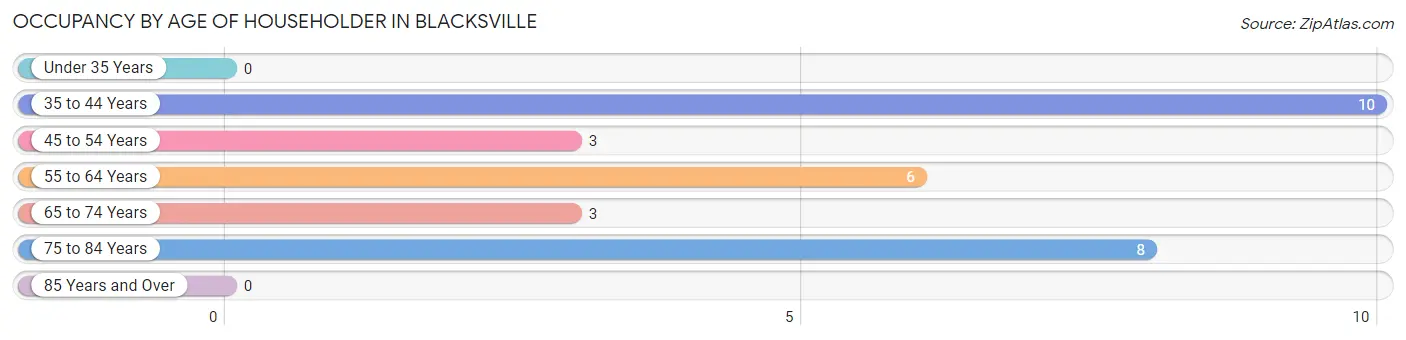
| Age Bracket | # Households | % Households |
| Under 35 Years | 0 | 0.0% |
| 35 to 44 Years | 10 | 33.3% |
| 45 to 54 Years | 3 | 10.0% |
| 55 to 64 Years | 6 | 20.0% |
| 65 to 74 Years | 3 | 10.0% |
| 75 to 84 Years | 8 | 26.7% |
| 85 Years and Over | 0 | 0.0% |
| Total | 30 | 100.0% |
Housing Finances in Blacksville
Median Income by Occupancy in Blacksville
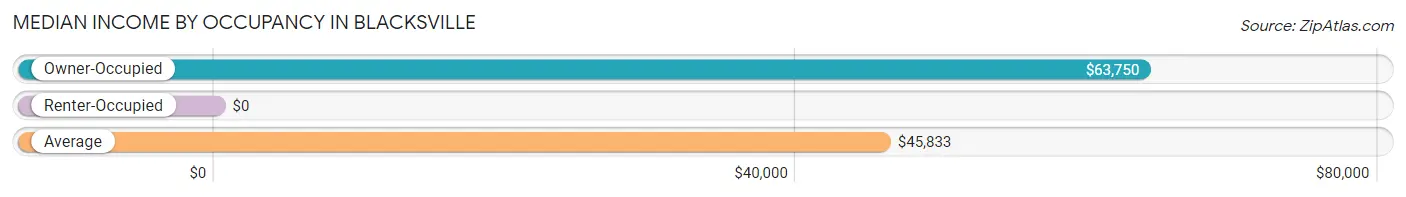
| Occupancy Type | # Households | Median Income |
| Owner-Occupied | 23 (76.7%) | $63,750 |
| Renter-Occupied | 7 (23.3%) | $0 |
| Average | 30 (100.0%) | $45,833 |
Occupancy by Householder Income Bracket in Blacksville
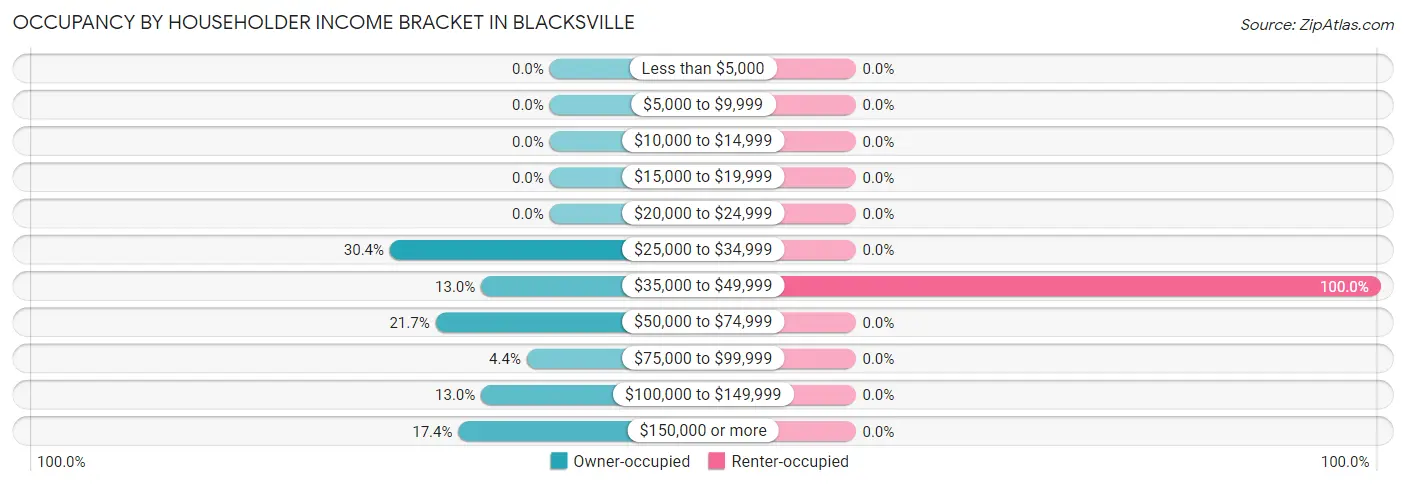
| Income Bracket | Owner-occupied | Renter-occupied |
| Less than $5,000 | 0 (0.0%) | 0 (0.0%) |
| $5,000 to $9,999 | 0 (0.0%) | 0 (0.0%) |
| $10,000 to $14,999 | 0 (0.0%) | 0 (0.0%) |
| $15,000 to $19,999 | 0 (0.0%) | 0 (0.0%) |
| $20,000 to $24,999 | 0 (0.0%) | 0 (0.0%) |
| $25,000 to $34,999 | 7 (30.4%) | 0 (0.0%) |
| $35,000 to $49,999 | 3 (13.0%) | 7 (100.0%) |
| $50,000 to $74,999 | 5 (21.7%) | 0 (0.0%) |
| $75,000 to $99,999 | 1 (4.3%) | 0 (0.0%) |
| $100,000 to $149,999 | 3 (13.0%) | 0 (0.0%) |
| $150,000 or more | 4 (17.4%) | 0 (0.0%) |
| Total | 23 (100.0%) | 7 (100.0%) |
Monthly Housing Cost Tiers in Blacksville
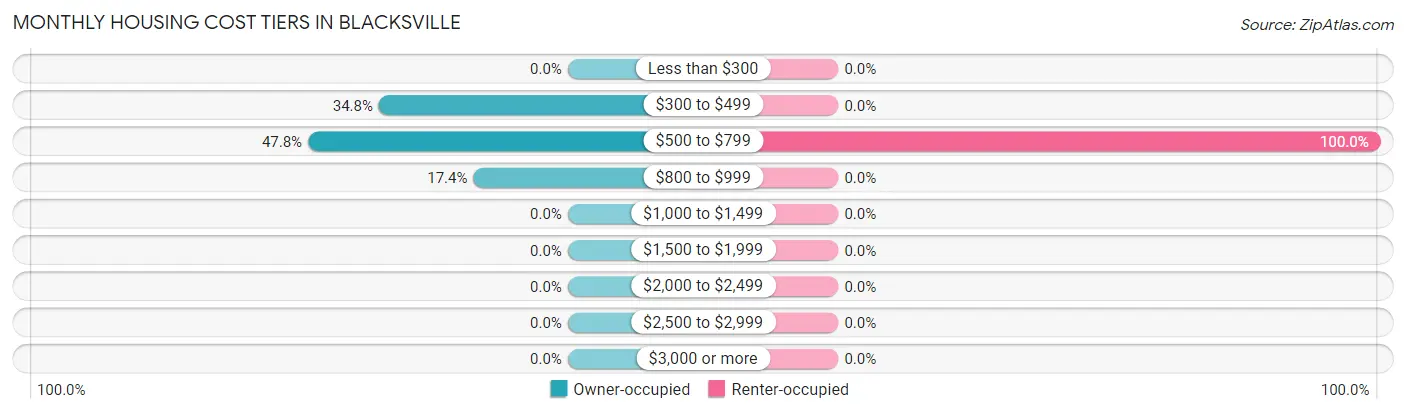
| Monthly Cost | Owner-occupied | Renter-occupied |
| Less than $300 | 0 (0.0%) | 0 (0.0%) |
| $300 to $499 | 8 (34.8%) | 0 (0.0%) |
| $500 to $799 | 11 (47.8%) | 7 (100.0%) |
| $800 to $999 | 4 (17.4%) | 0 (0.0%) |
| $1,000 to $1,499 | 0 (0.0%) | 0 (0.0%) |
| $1,500 to $1,999 | 0 (0.0%) | 0 (0.0%) |
| $2,000 to $2,499 | 0 (0.0%) | 0 (0.0%) |
| $2,500 to $2,999 | 0 (0.0%) | 0 (0.0%) |
| $3,000 or more | 0 (0.0%) | 0 (0.0%) |
| Total | 23 (100.0%) | 7 (100.0%) |
Physical Housing Characteristics in Blacksville
Housing Structures in Blacksville
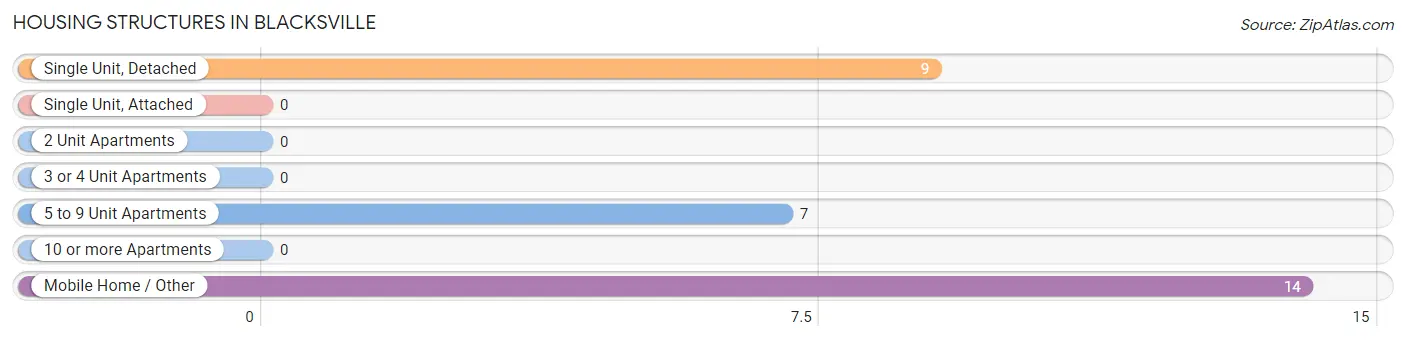
| Structure Type | # Housing Units | % Housing Units |
| Single Unit, Detached | 9 | 30.0% |
| Single Unit, Attached | 0 | 0.0% |
| 2 Unit Apartments | 0 | 0.0% |
| 3 or 4 Unit Apartments | 0 | 0.0% |
| 5 to 9 Unit Apartments | 7 | 23.3% |
| 10 or more Apartments | 0 | 0.0% |
| Mobile Home / Other | 14 | 46.7% |
| Total | 30 | 100.0% |
Housing Structures by Occupancy in Blacksville
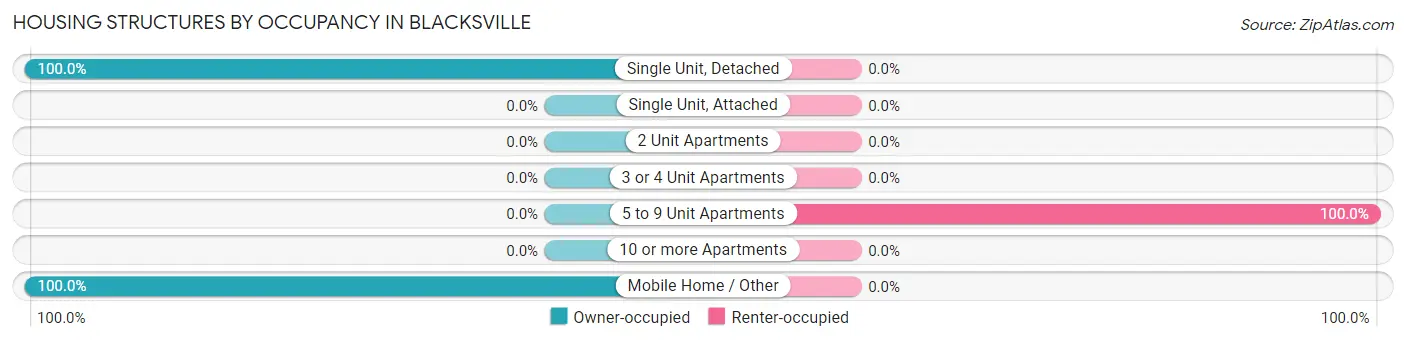
| Structure Type | Owner-occupied | Renter-occupied |
| Single Unit, Detached | 9 (100.0%) | 0 (0.0%) |
| Single Unit, Attached | 0 (0.0%) | 0 (0.0%) |
| 2 Unit Apartments | 0 (0.0%) | 0 (0.0%) |
| 3 or 4 Unit Apartments | 0 (0.0%) | 0 (0.0%) |
| 5 to 9 Unit Apartments | 0 (0.0%) | 7 (100.0%) |
| 10 or more Apartments | 0 (0.0%) | 0 (0.0%) |
| Mobile Home / Other | 14 (100.0%) | 0 (0.0%) |
| Total | 23 (76.7%) | 7 (23.3%) |
Housing Structures by Number of Rooms in Blacksville
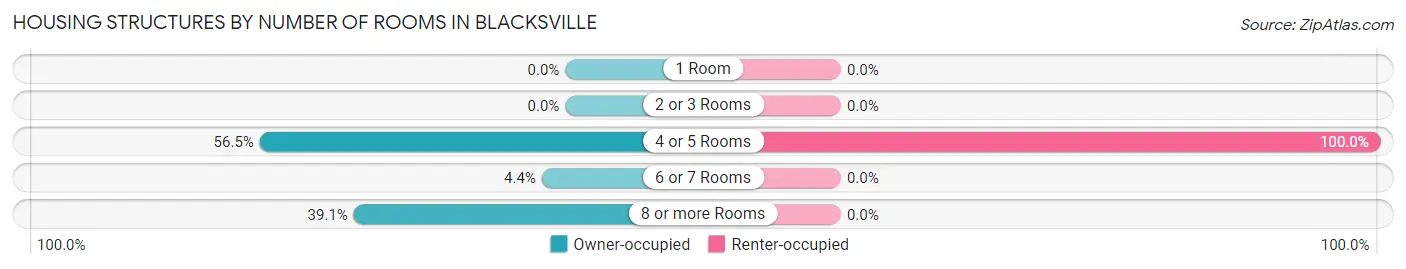
| Number of Rooms | Owner-occupied | Renter-occupied |
| 1 Room | 0 (0.0%) | 0 (0.0%) |
| 2 or 3 Rooms | 0 (0.0%) | 0 (0.0%) |
| 4 or 5 Rooms | 13 (56.5%) | 7 (100.0%) |
| 6 or 7 Rooms | 1 (4.3%) | 0 (0.0%) |
| 8 or more Rooms | 9 (39.1%) | 0 (0.0%) |
| Total | 23 (100.0%) | 7 (100.0%) |
Housing Structure by Heating Type in Blacksville
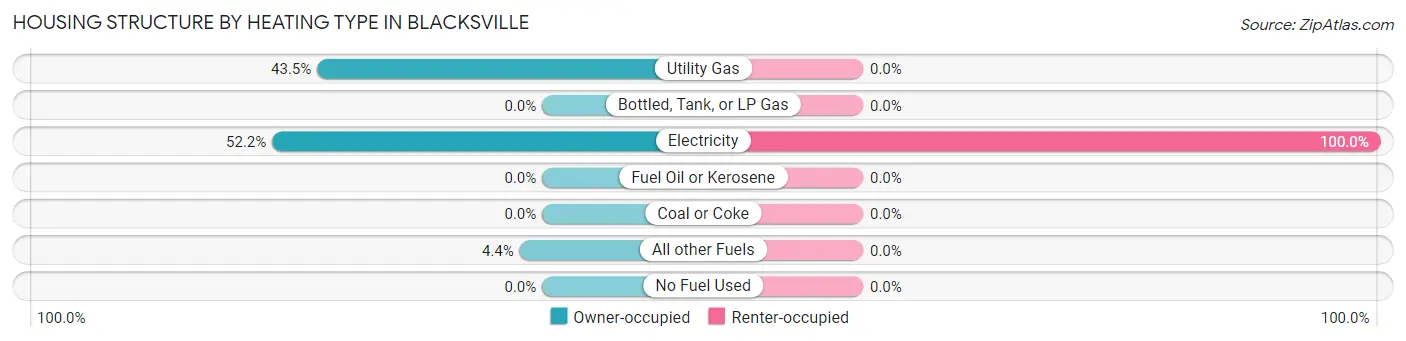
| Heating Type | Owner-occupied | Renter-occupied |
| Utility Gas | 10 (43.5%) | 0 (0.0%) |
| Bottled, Tank, or LP Gas | 0 (0.0%) | 0 (0.0%) |
| Electricity | 12 (52.2%) | 7 (100.0%) |
| Fuel Oil or Kerosene | 0 (0.0%) | 0 (0.0%) |
| Coal or Coke | 0 (0.0%) | 0 (0.0%) |
| All other Fuels | 1 (4.3%) | 0 (0.0%) |
| No Fuel Used | 0 (0.0%) | 0 (0.0%) |
| Total | 23 (100.0%) | 7 (100.0%) |
Household Vehicle Usage in Blacksville
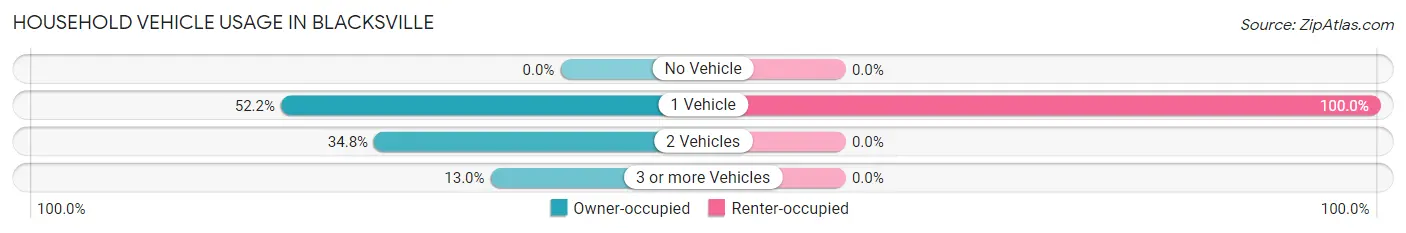
| Vehicles per Household | Owner-occupied | Renter-occupied |
| No Vehicle | 0 (0.0%) | 0 (0.0%) |
| 1 Vehicle | 12 (52.2%) | 7 (100.0%) |
| 2 Vehicles | 8 (34.8%) | 0 (0.0%) |
| 3 or more Vehicles | 3 (13.0%) | 0 (0.0%) |
| Total | 23 (100.0%) | 7 (100.0%) |
Real Estate & Mortgages in Blacksville
Real Estate and Mortgage Overview in Blacksville
| Characteristic | Without Mortgage | With Mortgage |
| Housing Units | 17 | 6 |
| Median Property Value | - | - |
| Median Household Income | - | - |
| Monthly Housing Costs | $510 | $0 |
| Real Estate Taxes | - | - |
Property Value by Mortgage Status in Blacksville
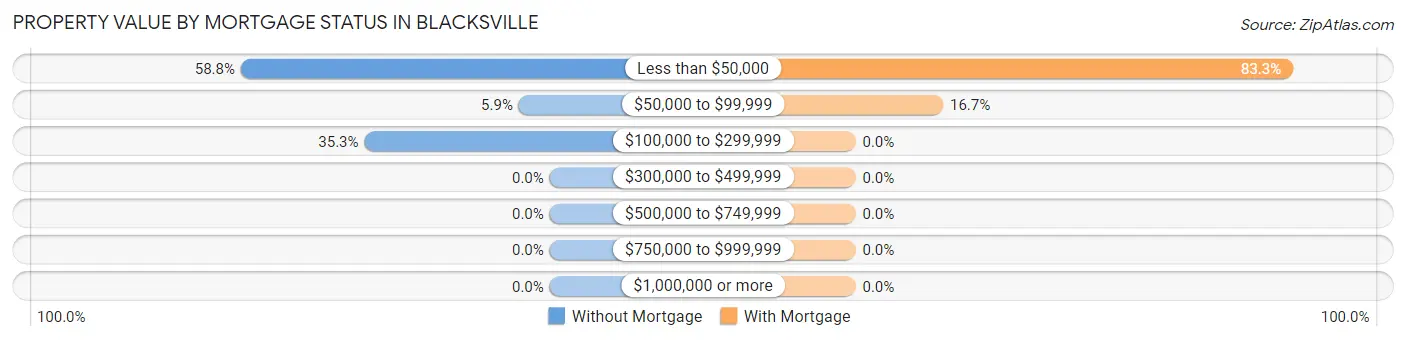
| Property Value | Without Mortgage | With Mortgage |
| Less than $50,000 | 10 (58.8%) | 5 (83.3%) |
| $50,000 to $99,999 | 1 (5.9%) | 1 (16.7%) |
| $100,000 to $299,999 | 6 (35.3%) | 0 (0.0%) |
| $300,000 to $499,999 | 0 (0.0%) | 0 (0.0%) |
| $500,000 to $749,999 | 0 (0.0%) | 0 (0.0%) |
| $750,000 to $999,999 | 0 (0.0%) | 0 (0.0%) |
| $1,000,000 or more | 0 (0.0%) | 0 (0.0%) |
| Total | 17 (100.0%) | 6 (100.0%) |
Household Income by Mortgage Status in Blacksville
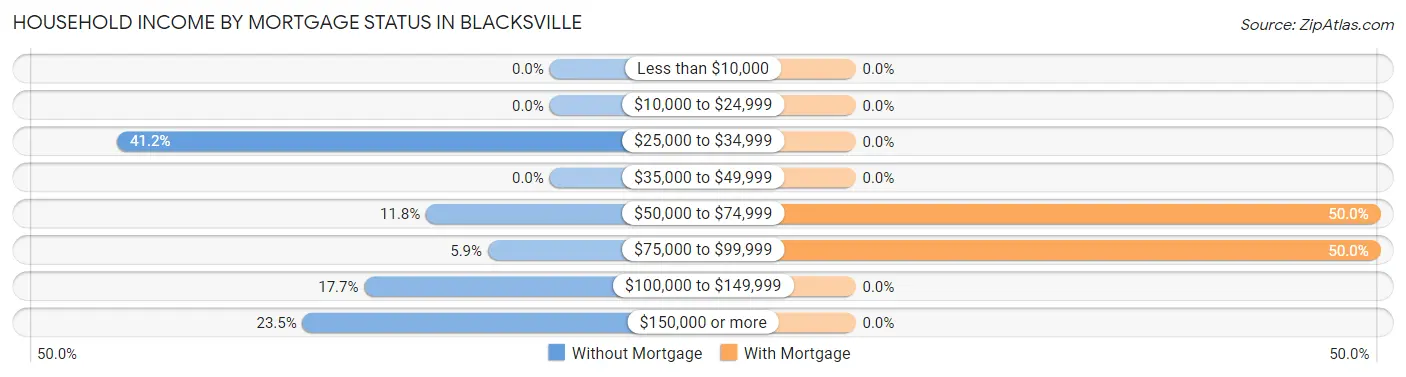
| Household Income | Without Mortgage | With Mortgage |
| Less than $10,000 | 0 (0.0%) | 0 (0.0%) |
| $10,000 to $24,999 | 0 (0.0%) | 0 (0.0%) |
| $25,000 to $34,999 | 7 (41.2%) | 0 (0.0%) |
| $35,000 to $49,999 | 0 (0.0%) | 0 (0.0%) |
| $50,000 to $74,999 | 2 (11.8%) | 3 (50.0%) |
| $75,000 to $99,999 | 1 (5.9%) | 3 (50.0%) |
| $100,000 to $149,999 | 3 (17.6%) | 0 (0.0%) |
| $150,000 or more | 4 (23.5%) | 0 (0.0%) |
| Total | 17 (100.0%) | 6 (100.0%) |
Property Value to Household Income Ratio in Blacksville
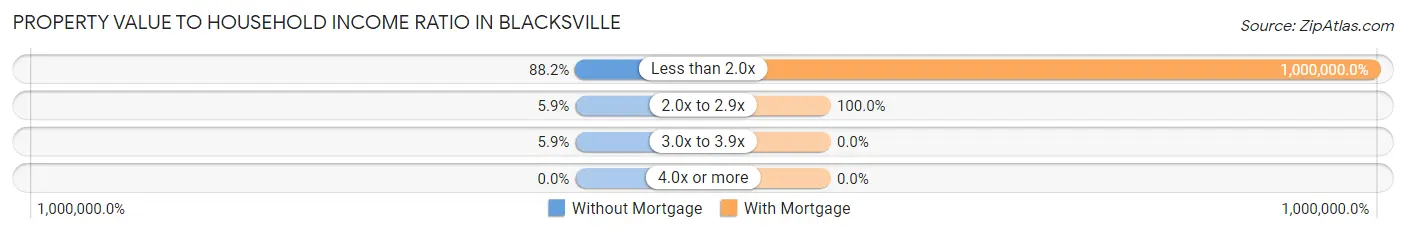
| Value-to-Income Ratio | Without Mortgage | With Mortgage |
| Less than 2.0x | 15 (88.2%) | 60,000 (1,000,000.0%) |
| 2.0x to 2.9x | 1 (5.9%) | 6 (100.0%) |
| 3.0x to 3.9x | 1 (5.9%) | 0 (0.0%) |
| 4.0x or more | 0 (0.0%) | 0 (0.0%) |
| Total | 17 (100.0%) | 6 (100.0%) |
Real Estate Taxes by Mortgage Status in Blacksville
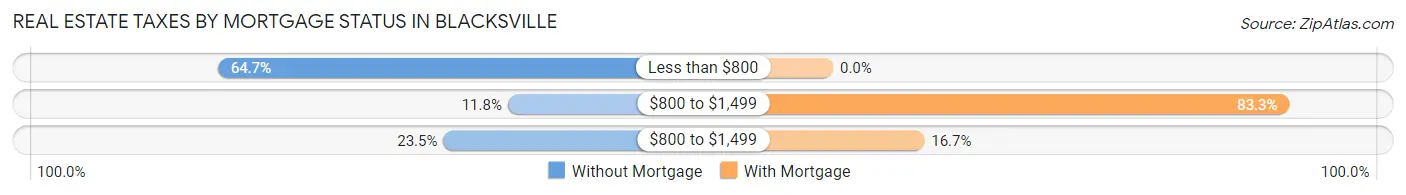
| Property Taxes | Without Mortgage | With Mortgage |
| Less than $800 | 11 (64.7%) | 0 (0.0%) |
| $800 to $1,499 | 2 (11.8%) | 5 (83.3%) |
| $800 to $1,499 | 4 (23.5%) | 1 (16.7%) |
| Total | 17 (100.0%) | 6 (100.0%) |
Health & Disability in Blacksville
Health Insurance Coverage by Age in Blacksville
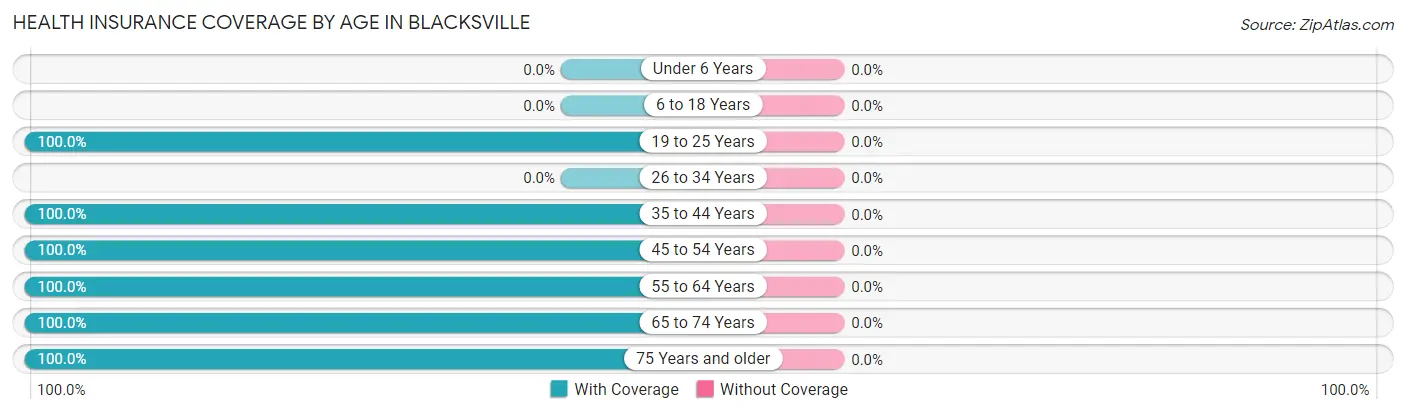
| Age Bracket | With Coverage | Without Coverage |
| Under 6 Years | 0 (0.0%) | 0 (0.0%) |
| 6 to 18 Years | 0 (0.0%) | 0 (0.0%) |
| 19 to 25 Years | 3 (100.0%) | 0 (0.0%) |
| 26 to 34 Years | 0 (0.0%) | 0 (0.0%) |
| 35 to 44 Years | 10 (100.0%) | 0 (0.0%) |
| 45 to 54 Years | 7 (100.0%) | 0 (0.0%) |
| 55 to 64 Years | 14 (100.0%) | 0 (0.0%) |
| 65 to 74 Years | 6 (100.0%) | 0 (0.0%) |
| 75 Years and older | 8 (100.0%) | 0 (0.0%) |
| Total | 48 (100.0%) | 0 (0.0%) |
Health Insurance Coverage by Citizenship Status in Blacksville
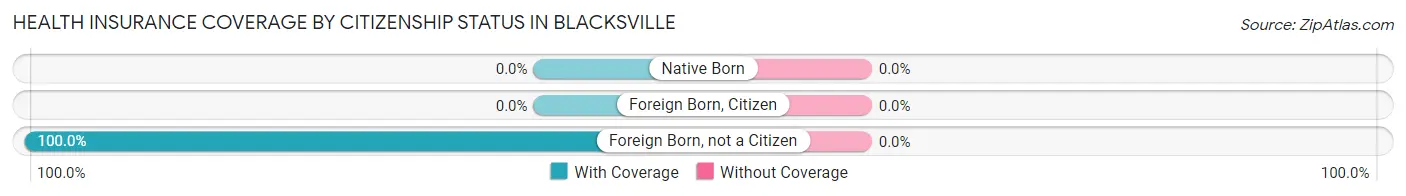
| Citizenship Status | With Coverage | Without Coverage |
| Native Born | 0 (0.0%) | 0 (0.0%) |
| Foreign Born, Citizen | 0 (0.0%) | 0 (0.0%) |
| Foreign Born, not a Citizen | 3 (100.0%) | 0 (0.0%) |
Health Insurance Coverage by Household Income in Blacksville
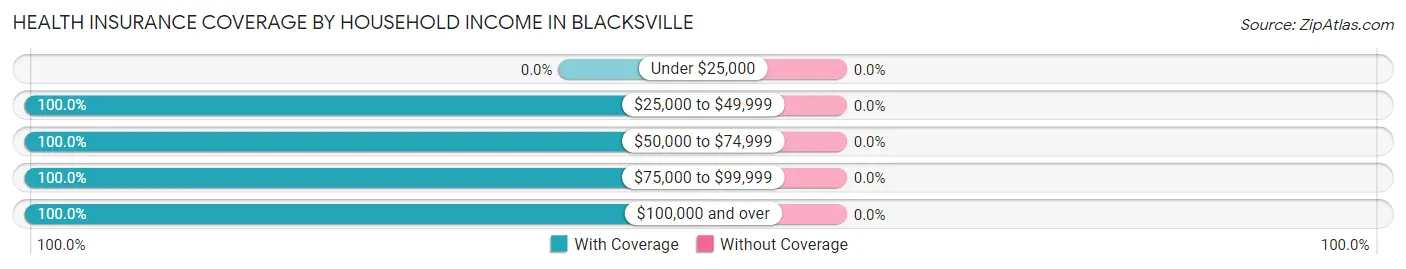
| Household Income | With Coverage | Without Coverage |
| Under $25,000 | 0 (0.0%) | 0 (0.0%) |
| $25,000 to $49,999 | 25 (100.0%) | 0 (0.0%) |
| $50,000 to $74,999 | 6 (100.0%) | 0 (0.0%) |
| $75,000 to $99,999 | 2 (100.0%) | 0 (0.0%) |
| $100,000 and over | 15 (100.0%) | 0 (0.0%) |
Public vs Private Health Insurance Coverage by Age in Blacksville
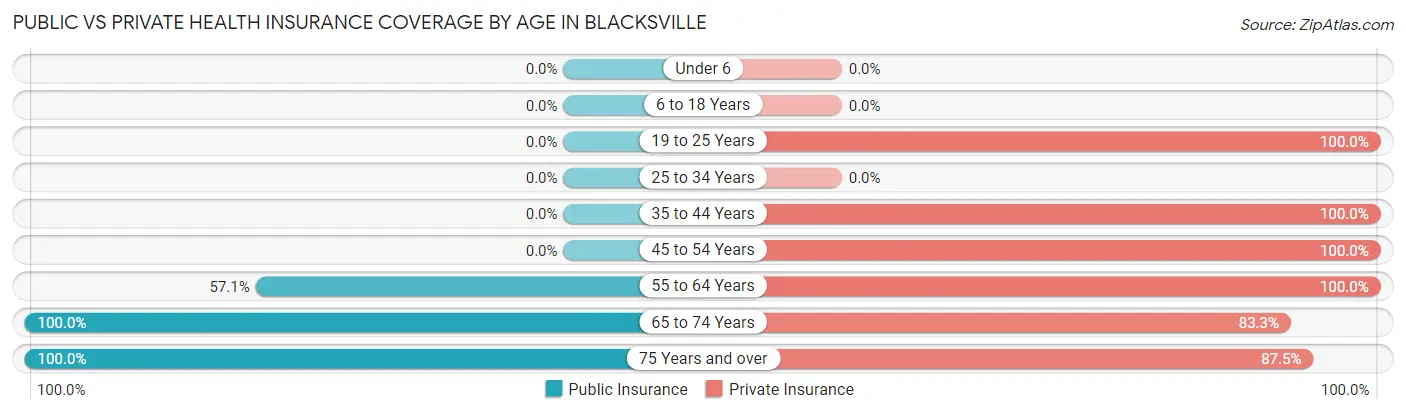
| Age Bracket | Public Insurance | Private Insurance |
| Under 6 | 0 (0.0%) | 0 (0.0%) |
| 6 to 18 Years | 0 (0.0%) | 0 (0.0%) |
| 19 to 25 Years | 0 (0.0%) | 3 (100.0%) |
| 25 to 34 Years | 0 (0.0%) | 0 (0.0%) |
| 35 to 44 Years | 0 (0.0%) | 10 (100.0%) |
| 45 to 54 Years | 0 (0.0%) | 7 (100.0%) |
| 55 to 64 Years | 8 (57.1%) | 14 (100.0%) |
| 65 to 74 Years | 6 (100.0%) | 5 (83.3%) |
| 75 Years and over | 8 (100.0%) | 7 (87.5%) |
| Total | 22 (45.8%) | 46 (95.8%) |
Disability Status by Sex by Age in Blacksville
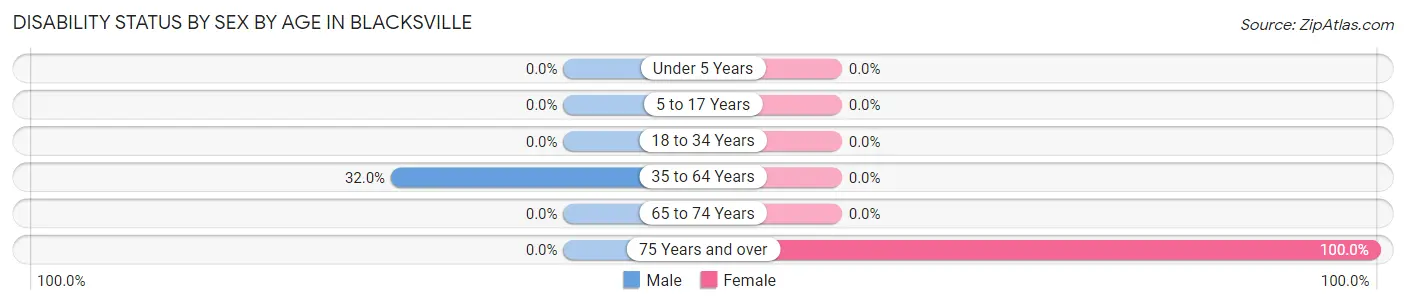
| Age Bracket | Male | Female |
| Under 5 Years | 0 (0.0%) | 0 (0.0%) |
| 5 to 17 Years | 0 (0.0%) | 0 (0.0%) |
| 18 to 34 Years | 0 (0.0%) | 0 (0.0%) |
| 35 to 64 Years | 8 (32.0%) | 0 (0.0%) |
| 65 to 74 Years | 0 (0.0%) | 0 (0.0%) |
| 75 Years and over | 0 (0.0%) | 7 (100.0%) |
Disability Class by Sex by Age in Blacksville
Disability Class: Hearing Difficulty
| Age Bracket | Male | Female |
| Under 5 Years | 0 (0.0%) | 0 (0.0%) |
| 5 to 17 Years | 0 (0.0%) | 0 (0.0%) |
| 18 to 34 Years | 0 (0.0%) | 0 (0.0%) |
| 35 to 64 Years | 0 (0.0%) | 0 (0.0%) |
| 65 to 74 Years | 0 (0.0%) | 0 (0.0%) |
| 75 Years and over | 0 (0.0%) | 0 (0.0%) |
Disability Class: Vision Difficulty
| Age Bracket | Male | Female |
| Under 5 Years | 0 (0.0%) | 0 (0.0%) |
| 5 to 17 Years | 0 (0.0%) | 0 (0.0%) |
| 18 to 34 Years | 0 (0.0%) | 0 (0.0%) |
| 35 to 64 Years | 0 (0.0%) | 0 (0.0%) |
| 65 to 74 Years | 0 (0.0%) | 0 (0.0%) |
| 75 Years and over | 0 (0.0%) | 0 (0.0%) |
Disability Class: Cognitive Difficulty

| Age Bracket | Male | Female |
| 5 to 17 Years | 0 (0.0%) | 0 (0.0%) |
| 18 to 34 Years | 0 (0.0%) | 0 (0.0%) |
| 35 to 64 Years | 0 (0.0%) | 0 (0.0%) |
| 65 to 74 Years | 0 (0.0%) | 0 (0.0%) |
| 75 Years and over | 0 (0.0%) | 0 (0.0%) |
Disability Class: Ambulatory Difficulty
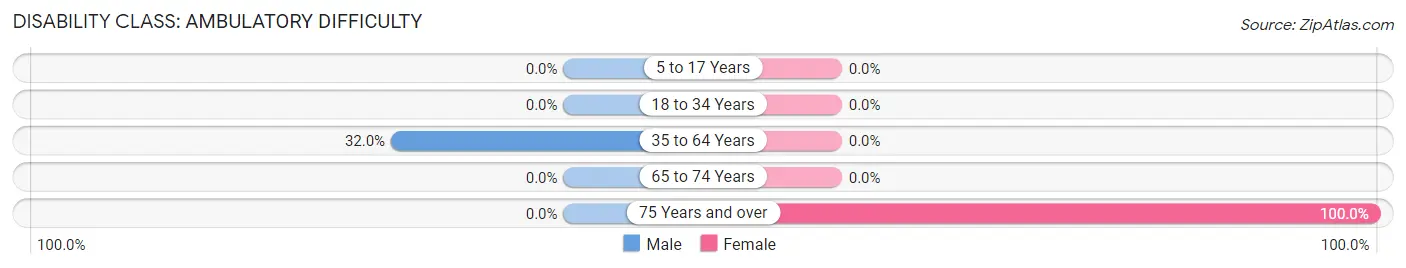
| Age Bracket | Male | Female |
| 5 to 17 Years | 0 (0.0%) | 0 (0.0%) |
| 18 to 34 Years | 0 (0.0%) | 0 (0.0%) |
| 35 to 64 Years | 8 (32.0%) | 0 (0.0%) |
| 65 to 74 Years | 0 (0.0%) | 0 (0.0%) |
| 75 Years and over | 0 (0.0%) | 7 (100.0%) |
Disability Class: Self-Care Difficulty
| Age Bracket | Male | Female |
| 5 to 17 Years | 0 (0.0%) | 0 (0.0%) |
| 18 to 34 Years | 0 (0.0%) | 0 (0.0%) |
| 35 to 64 Years | 0 (0.0%) | 0 (0.0%) |
| 65 to 74 Years | 0 (0.0%) | 0 (0.0%) |
| 75 Years and over | 0 (0.0%) | 0 (0.0%) |
Technology Access in Blacksville
Computing Device Access in Blacksville
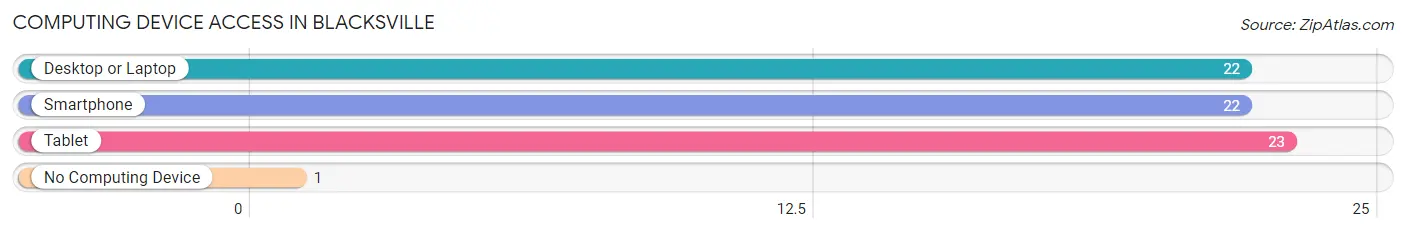
| Device Type | # Households | % Households |
| Desktop or Laptop | 22 | 73.3% |
| Smartphone | 22 | 73.3% |
| Tablet | 23 | 76.7% |
| No Computing Device | 1 | 3.3% |
| Total | 30 | 100.0% |
Internet Access in Blacksville
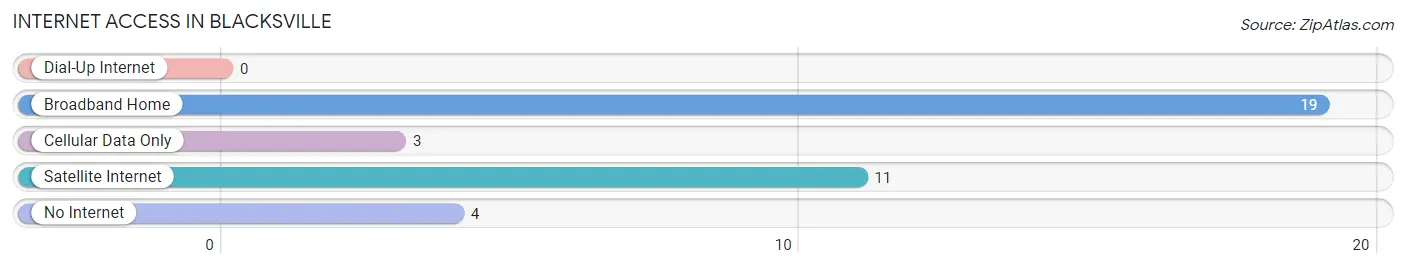
| Internet Type | # Households | % Households |
| Dial-Up Internet | 0 | 0.0% |
| Broadband Home | 19 | 63.3% |
| Cellular Data Only | 3 | 10.0% |
| Satellite Internet | 11 | 36.7% |
| No Internet | 4 | 13.3% |
| Total | 30 | 100.0% |
Blacksville Summary
Blacksville is a small unincorporated community located in Monongalia County, West Virginia. It is situated along the West Fork River, approximately five miles south of the county seat of Morgantown. The population of Blacksville was estimated to be around 500 in 2020.
History
Blacksville was first settled in the late 1700s by a group of African-American settlers. The town was originally known as “Black’s Town”, named after the first settler, John Black. The town was later renamed to Blacksville in 1883.
The town was a major stop on the Baltimore and Ohio Railroad, which ran through the area in the late 1800s. The railroad provided a major economic boost to the town, as it allowed for the transportation of goods and people.
In the early 1900s, Blacksville was home to a number of businesses, including a general store, a blacksmith shop, a hotel, and a post office. The town also had a school, which was attended by both white and black students.
Geography
Blacksville is located in the Appalachian Mountains of West Virginia. The town is situated along the West Fork River, approximately five miles south of the county seat of Morgantown. The terrain of the area is mostly hilly, with some flat areas.
The climate of Blacksville is humid continental, with hot summers and cold winters. The average annual temperature is around 50 degrees Fahrenheit. The average annual precipitation is around 40 inches.
Economy
The economy of Blacksville is largely based on agriculture and tourism. The town is home to a number of farms, which produce a variety of crops, including corn, soybeans, and hay. The town also has a number of tourist attractions, including a historic railroad station and a museum.
Demographics
The population of Blacksville was estimated to be around 500 in 2020. The racial makeup of the town is predominantly white, with a small percentage of African-Americans. The median household income in Blacksville is around $35,000. The median age of the population is around 40 years old.
Common Questions
What is Per Capita Income in Blacksville?
Per Capita income in Blacksville is $60,104.
What is the Median Household income in Blacksville?
Median Household Income in Blacksville is $45,833.
What is Income or Wage Gap in Blacksville?
Income or Wage Gap in Blacksville is 32.6%.
Women in Blacksville earn 67.4 cents for every dollar earned by a man.
What is Inequality or Gini Index in Blacksville?
Inequality or Gini Index in Blacksville is 0.46.
What is the Total Population of Blacksville?
Total Population of Blacksville is 48.
What is the Total Male Population of Blacksville?
Total Male Population of Blacksville is 27.
What is the Total Female Population of Blacksville?
Total Female Population of Blacksville is 21.
What is the Ratio of Males per 100 Females in Blacksville?
There are 128.57 Males per 100 Females in Blacksville.
What is the Ratio of Females per 100 Males in Blacksville?
There are 77.78 Females per 100 Males in Blacksville.
What is the Median Population Age in Blacksville?
Median Population Age in Blacksville is 62.3 Years.
What is the Average Family Size in Blacksville
Average Family Size in Blacksville is 2.1 People.
What is the Average Household Size in Blacksville
Average Household Size in Blacksville is 1.6 People.
How Large is the Labor Force in Blacksville?
There are 28 People in the Labor Forcein in Blacksville.
What is the Percentage of People in the Labor Force in Blacksville?
58.3% of People are in the Labor Force in Blacksville.