Enterprise, WV Map & Demographics
Enterprise Map
Enterprise Overview
$43,155
PER CAPITA INCOME
$83,672
AVG FAMILY INCOME
$77,788
AVG HOUSEHOLD INCOME
0.47
INEQUALITY / GINI INDEX
1,185
TOTAL POPULATION
570
MALE POPULATION
615
FEMALE POPULATION
92.68
MALES / 100 FEMALES
107.89
FEMALES / 100 MALES
53.1
MEDIAN AGE
2.9
AVG FAMILY SIZE
2.7
AVG HOUSEHOLD SIZE
717
LABOR FORCE [ PEOPLE ]
74.7%
PERCENT IN LABOR FORCE
10.7%
UNEMPLOYMENT RATE
Enterprise Zip Codes
Enterprise Area Codes
Income in Enterprise
Income Overview in Enterprise
Per Capita Income in Enterprise is $43,155, while median incomes of families and households are $83,672 and $77,788 respectively.
| Characteristic | Number | Measure |
| Per Capita Income | 1,185 | $43,155 |
| Median Family Income | 381 | $83,672 |
| Mean Family Income | 381 | $107,258 |
| Median Household Income | 437 | $77,788 |
| Mean Household Income | 437 | $101,029 |
| Income Deficit | 381 | $0 |
| Wage / Income Gap (%) | 1,185 | 0.00% |
| Wage / Income Gap ($) | 1,185 | 100.00¢ per $1 |
| Gini / Inequality Index | 1,185 | 0.47 |
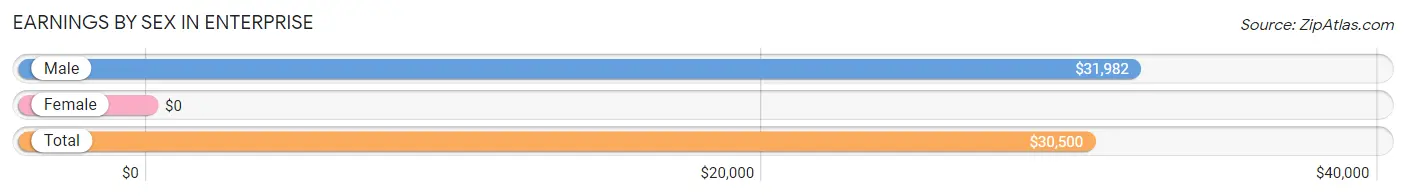
Earnings by Sex in Enterprise
| Sex | Number | Average Earnings |
| Male | 409 (62.4%) | $31,982 |
| Female | 247 (37.7%) | $0 |
| Total | 656 (100.0%) | $30,500 |
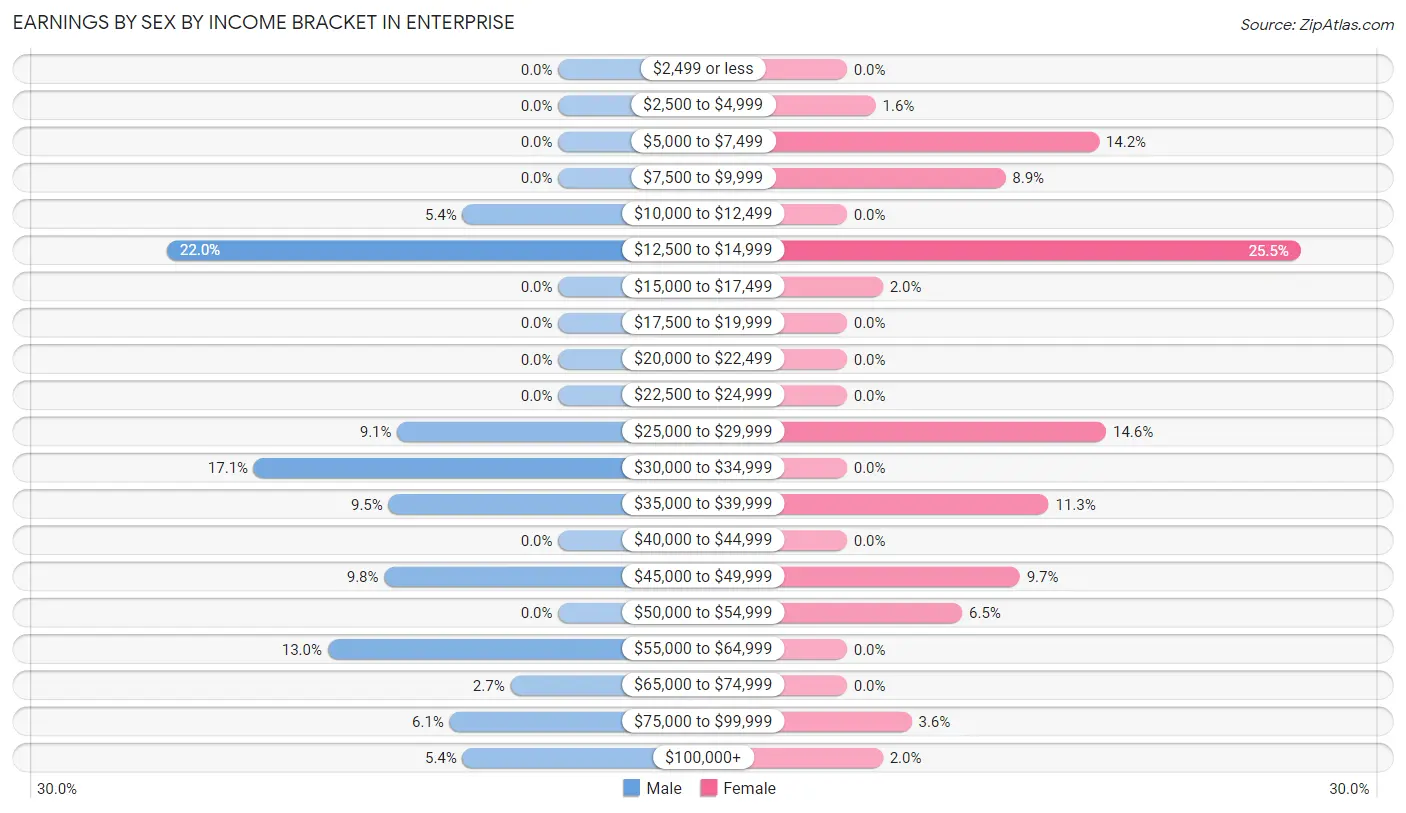
Earnings by Sex by Income Bracket in Enterprise
The most common earnings brackets in Enterprise are $12,500 to $14,999 for men (90 | 22.0%) and $12,500 to $14,999 for women (63 | 25.5%).
| Income | Male | Female |
| $2,499 or less | 0 (0.0%) | 0 (0.0%) |
| $2,500 to $4,999 | 0 (0.0%) | 4 (1.6%) |
| $5,000 to $7,499 | 0 (0.0%) | 35 (14.2%) |
| $7,500 to $9,999 | 0 (0.0%) | 22 (8.9%) |
| $10,000 to $12,499 | 22 (5.4%) | 0 (0.0%) |
| $12,500 to $14,999 | 90 (22.0%) | 63 (25.5%) |
| $15,000 to $17,499 | 0 (0.0%) | 5 (2.0%) |
| $17,500 to $19,999 | 0 (0.0%) | 0 (0.0%) |
| $20,000 to $22,499 | 0 (0.0%) | 0 (0.0%) |
| $22,500 to $24,999 | 0 (0.0%) | 0 (0.0%) |
| $25,000 to $29,999 | 37 (9.0%) | 36 (14.6%) |
| $30,000 to $34,999 | 70 (17.1%) | 0 (0.0%) |
| $35,000 to $39,999 | 39 (9.5%) | 28 (11.3%) |
| $40,000 to $44,999 | 0 (0.0%) | 0 (0.0%) |
| $45,000 to $49,999 | 40 (9.8%) | 24 (9.7%) |
| $50,000 to $54,999 | 0 (0.0%) | 16 (6.5%) |
| $55,000 to $64,999 | 53 (13.0%) | 0 (0.0%) |
| $65,000 to $74,999 | 11 (2.7%) | 0 (0.0%) |
| $75,000 to $99,999 | 25 (6.1%) | 9 (3.6%) |
| $100,000+ | 22 (5.4%) | 5 (2.0%) |
| Total | 409 (100.0%) | 247 (100.0%) |
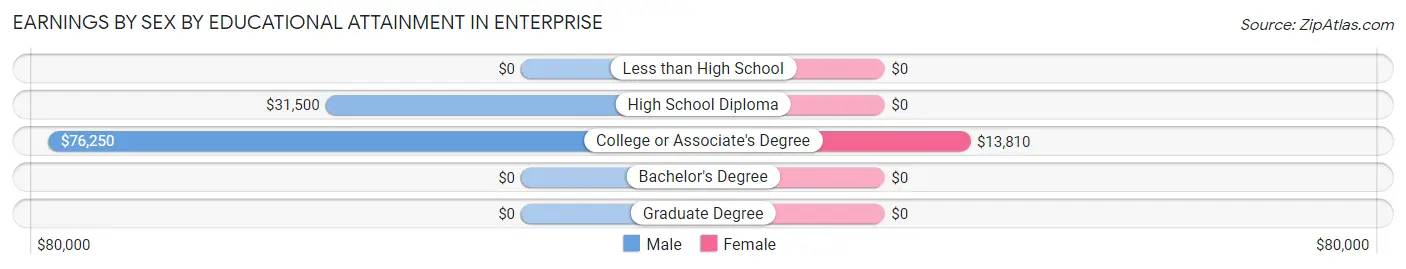
Earnings by Sex by Educational Attainment in Enterprise
| Educational Attainment | Male Income | Female Income |
| Less than High School | - | - |
| High School Diploma | $31,500 | $0 |
| College or Associate's Degree | $76,250 | $13,810 |
| Bachelor's Degree | - | - |
| Graduate Degree | - | - |
| Total | $37,756 | $0 |
Family Income in Enterprise
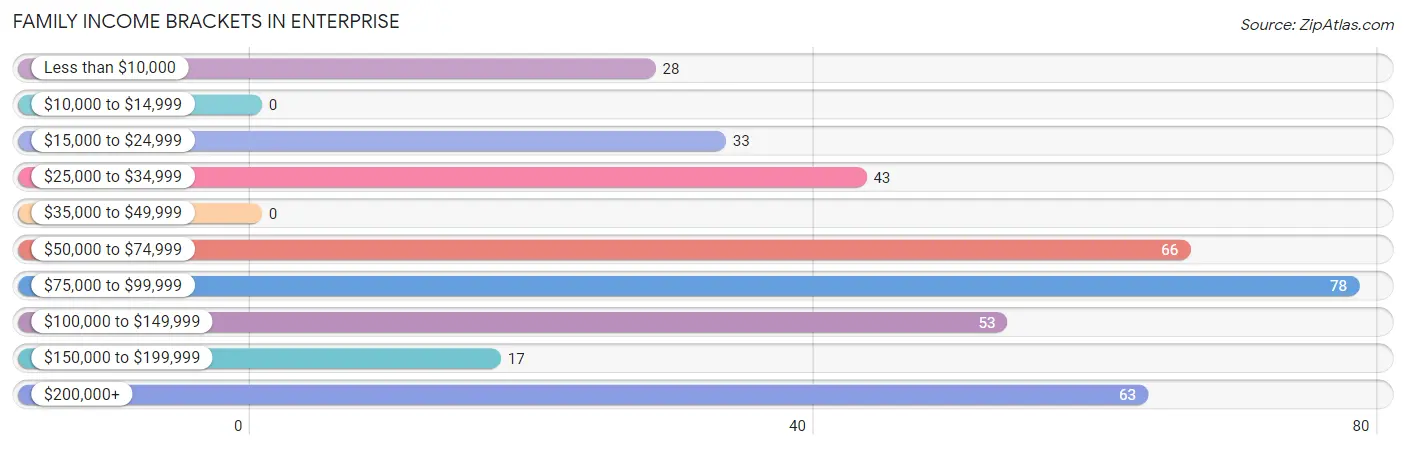
Family Income Brackets in Enterprise
According to the Enterprise family income data, there are 78 families falling into the $75,000 to $99,999 income range, which is the most common income bracket and makes up 20.5% of all families.
| Income Bracket | # Families | % Families |
| Less than $10,000 | 28 | 7.3% |
| $10,000 to $14,999 | 0 | 0.0% |
| $15,000 to $24,999 | 33 | 8.7% |
| $25,000 to $34,999 | 43 | 11.3% |
| $35,000 to $49,999 | 0 | 0.0% |
| $50,000 to $74,999 | 66 | 17.3% |
| $75,000 to $99,999 | 78 | 20.5% |
| $100,000 to $149,999 | 53 | 13.9% |
| $150,000 to $199,999 | 17 | 4.5% |
| $200,000+ | 63 | 16.5% |
Family Income by Famaliy Size in Enterprise
| Income Bracket | # Families | Median Income |
| 2-Person Families | 246 (64.6%) | $0 |
| 3-Person Families | 41 (10.8%) | $0 |
| 4-Person Families | 81 (21.3%) | $0 |
| 5-Person Families | 13 (3.4%) | $0 |
| 6-Person Families | 0 (0.0%) | $0 |
| 7+ Person Families | 0 (0.0%) | $0 |
| Total | 381 (100.0%) | $83,672 |
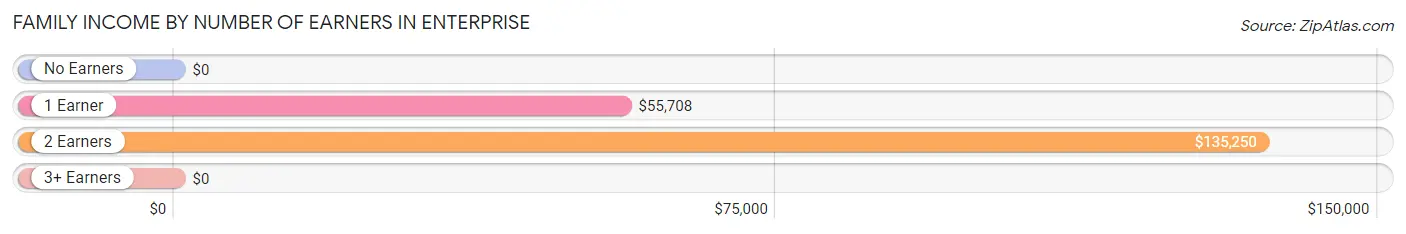
Family Income by Number of Earners in Enterprise
| Number of Earners | # Families | Median Income |
| No Earners | 77 (20.2%) | $0 |
| 1 Earner | 84 (22.1%) | $55,708 |
| 2 Earners | 196 (51.4%) | $135,250 |
| 3+ Earners | 24 (6.3%) | $0 |
| Total | 381 (100.0%) | $83,672 |
Household Income in Enterprise
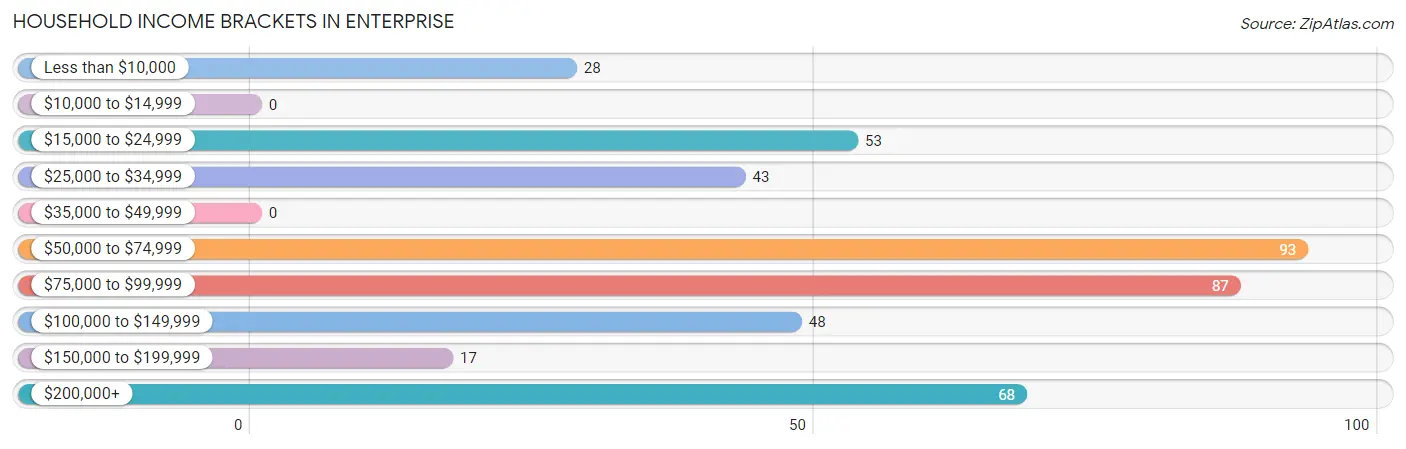
Household Income Brackets in Enterprise
With 93 households falling in the category, the $50,000 to $74,999 income range is the most frequent in Enterprise, accounting for 21.3% of all households.
| Income Bracket | # Households | % Households |
| Less than $10,000 | 28 | 6.4% |
| $10,000 to $14,999 | 0 | 0.0% |
| $15,000 to $24,999 | 53 | 12.1% |
| $25,000 to $34,999 | 43 | 9.8% |
| $35,000 to $49,999 | 0 | 0.0% |
| $50,000 to $74,999 | 93 | 21.3% |
| $75,000 to $99,999 | 87 | 19.9% |
| $100,000 to $149,999 | 48 | 11.0% |
| $150,000 to $199,999 | 17 | 3.9% |
| $200,000+ | 68 | 15.6% |
Household Income by Householder Age in Enterprise
| Income Bracket | # Households | Median Income |
| 15 to 24 Years | 0 (0.0%) | $0 |
| 25 to 44 Years | 80 (18.3%) | $0 |
| 45 to 64 Years | 204 (46.7%) | $0 |
| 65+ Years | 153 (35.0%) | $0 |
| Total | 437 (100.0%) | $77,788 |
Poverty in Enterprise
Income Below Poverty by Sex and Age in Enterprise
With 11.2% poverty level for males and 9.4% for females among the residents of Enterprise, 6 to 11 year old males and 5 year old females are the most vulnerable to poverty, with 64 males (58.7%) and 30 females (100.0%) in their respective age groups living below the poverty level.
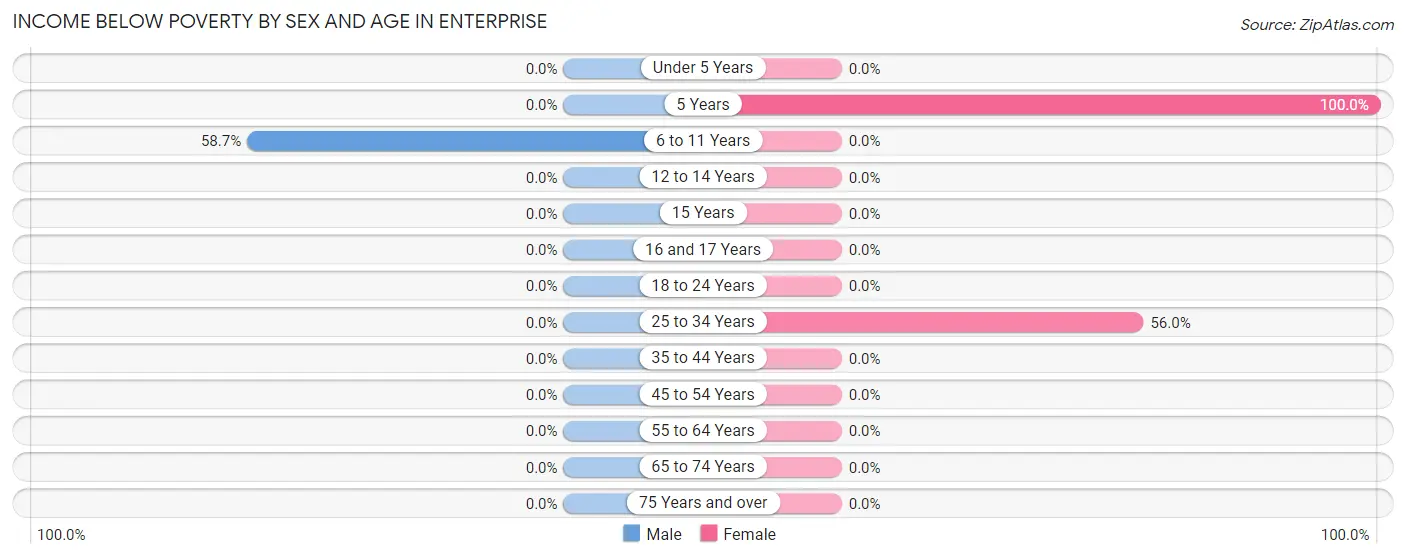
| Age Bracket | Male | Female |
| Under 5 Years | 0 (0.0%) | 0 (0.0%) |
| 5 Years | 0 (0.0%) | 30 (100.0%) |
| 6 to 11 Years | 64 (58.7%) | 0 (0.0%) |
| 12 to 14 Years | 0 (0.0%) | 0 (0.0%) |
| 15 Years | 0 (0.0%) | 0 (0.0%) |
| 16 and 17 Years | 0 (0.0%) | 0 (0.0%) |
| 18 to 24 Years | 0 (0.0%) | 0 (0.0%) |
| 25 to 34 Years | 0 (0.0%) | 28 (56.0%) |
| 35 to 44 Years | 0 (0.0%) | 0 (0.0%) |
| 45 to 54 Years | 0 (0.0%) | 0 (0.0%) |
| 55 to 64 Years | 0 (0.0%) | 0 (0.0%) |
| 65 to 74 Years | 0 (0.0%) | 0 (0.0%) |
| 75 Years and over | 0 (0.0%) | 0 (0.0%) |
| Total | 64 (11.2%) | 58 (9.4%) |
Income Above Poverty by Sex and Age in Enterprise
According to the poverty statistics in Enterprise, males aged 15 years and females aged under 5 years are the age groups that are most secure financially, with 100.0% of males and 100.0% of females in these age groups living above the poverty line.
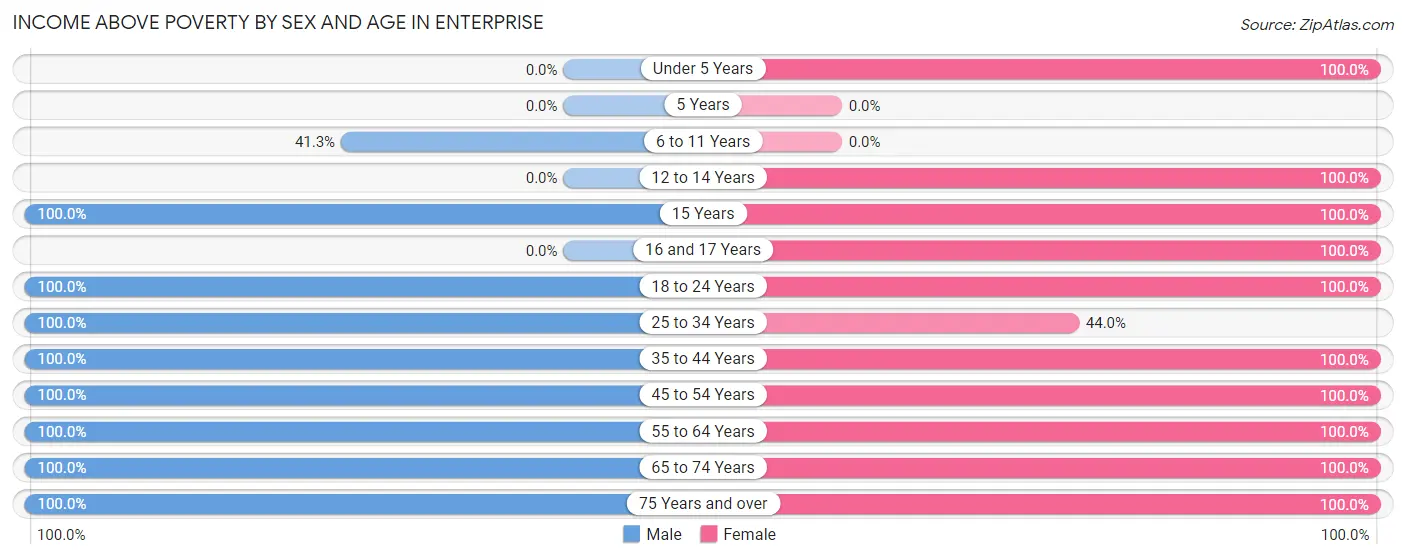
| Age Bracket | Male | Female |
| Under 5 Years | 0 (0.0%) | 42 (100.0%) |
| 5 Years | 0 (0.0%) | 0 (0.0%) |
| 6 to 11 Years | 45 (41.3%) | 0 (0.0%) |
| 12 to 14 Years | 0 (0.0%) | 14 (100.0%) |
| 15 Years | 16 (100.0%) | 14 (100.0%) |
| 16 and 17 Years | 0 (0.0%) | 33 (100.0%) |
| 18 to 24 Years | 57 (100.0%) | 4 (100.0%) |
| 25 to 34 Years | 10 (100.0%) | 22 (44.0%) |
| 35 to 44 Years | 71 (100.0%) | 29 (100.0%) |
| 45 to 54 Years | 70 (100.0%) | 65 (100.0%) |
| 55 to 64 Years | 119 (100.0%) | 131 (100.0%) |
| 65 to 74 Years | 28 (100.0%) | 144 (100.0%) |
| 75 Years and over | 90 (100.0%) | 59 (100.0%) |
| Total | 506 (88.8%) | 557 (90.6%) |
Income Below Poverty Among Married-Couple Families in Enterprise
| Children | Above Poverty | Below Poverty |
| No Children | 132 (100.0%) | 0 (0.0%) |
| 1 or 2 Children | 53 (100.0%) | 0 (0.0%) |
| 3 or 4 Children | 13 (100.0%) | 0 (0.0%) |
| 5 or more Children | 0 (0.0%) | 0 (0.0%) |
| Total | 198 (100.0%) | 0 (0.0%) |
Income Below Poverty Among Single-Parent Households in Enterprise
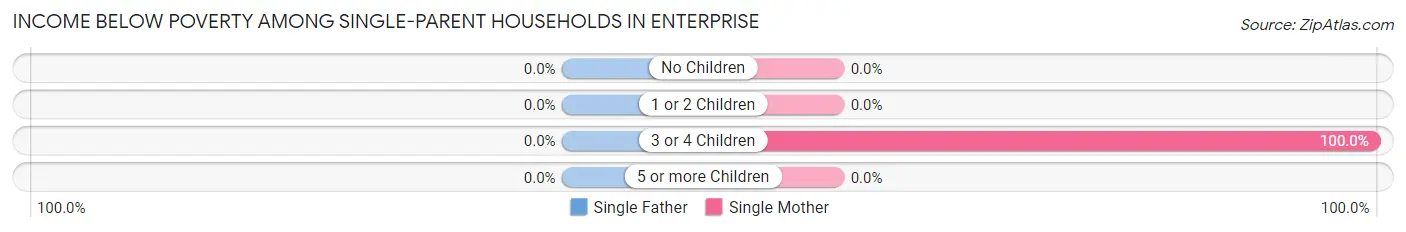
| Children | Single Father | Single Mother |
| No Children | 0 (0.0%) | 0 (0.0%) |
| 1 or 2 Children | 0 (0.0%) | 0 (0.0%) |
| 3 or 4 Children | 0 (0.0%) | 28 (100.0%) |
| 5 or more Children | 0 (0.0%) | 0 (0.0%) |
| Total | 0 (0.0%) | 28 (18.5%) |
Income Below Poverty Among Married-Couple vs Single-Parent Households in Enterprise
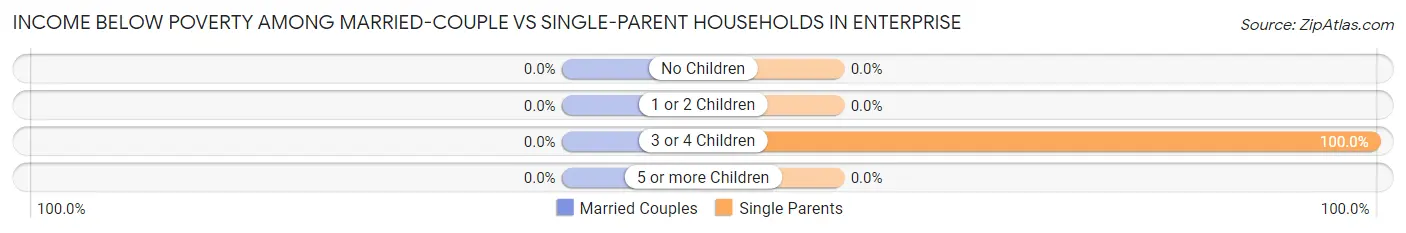
| Children | Married-Couple Families | Single-Parent Households |
| No Children | 0 (0.0%) | 0 (0.0%) |
| 1 or 2 Children | 0 (0.0%) | 0 (0.0%) |
| 3 or 4 Children | 0 (0.0%) | 28 (100.0%) |
| 5 or more Children | 0 (0.0%) | 0 (0.0%) |
| Total | 0 (0.0%) | 28 (15.3%) |
Race in Enterprise
The most populous races in Enterprise are , and White / Caucasian (1,185 | 100.0%).
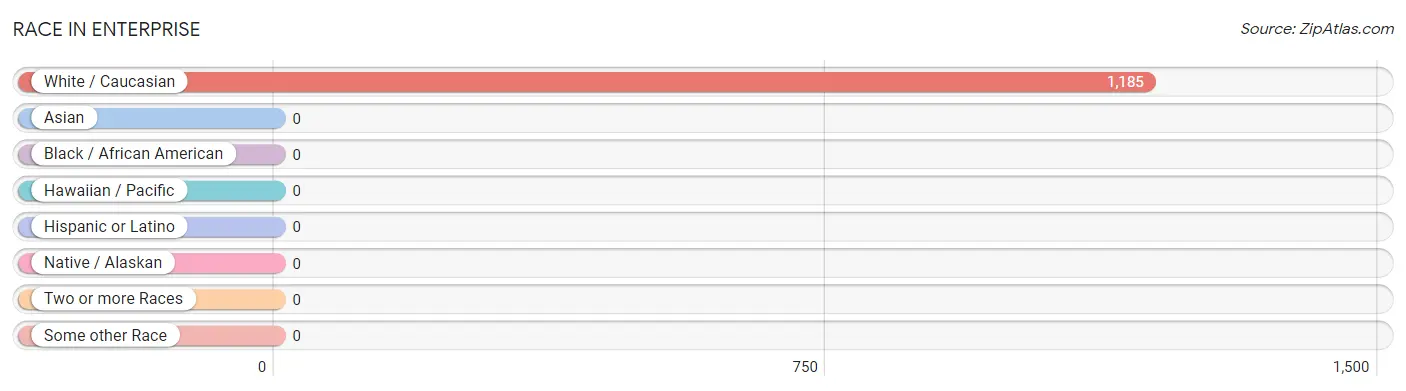
| Race | # Population | % Population |
| Asian | 0 | 0.0% |
| Black / African American | 0 | 0.0% |
| Hawaiian / Pacific | 0 | 0.0% |
| Hispanic or Latino | 0 | 0.0% |
| Native / Alaskan | 0 | 0.0% |
| White / Caucasian | 1,185 | 100.0% |
| Two or more Races | 0 | 0.0% |
| Some other Race | 0 | 0.0% |
| Total | 1,185 | 100.0% |
Ancestry in Enterprise
The most populous ancestries reported in Enterprise are Irish (271 | 22.9%), Dutch (191 | 16.1%), Italian (181 | 15.3%), English (101 | 8.5%), and German (93 | 7.9%), together accounting for 70.6% of all Enterprise residents.
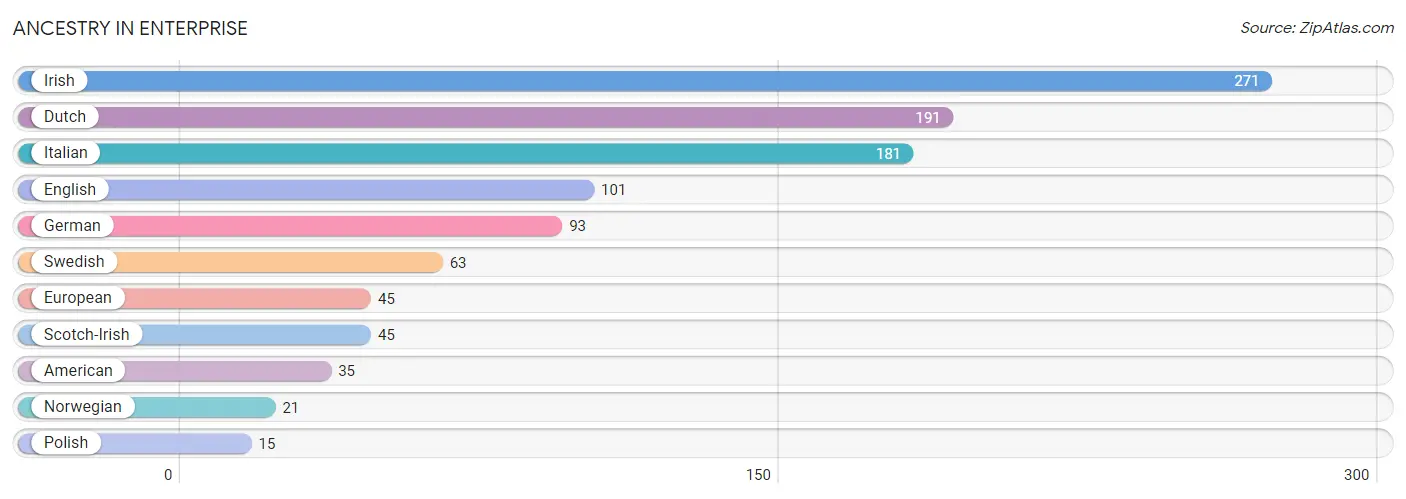
| Ancestry | # Population | % Population |
| American | 35 | 2.9% |
| Dutch | 191 | 16.1% |
| English | 101 | 8.5% |
| European | 45 | 3.8% |
| German | 93 | 7.9% |
| Irish | 271 | 22.9% |
| Italian | 181 | 15.3% |
| Norwegian | 21 | 1.8% |
| Polish | 15 | 1.3% |
| Scotch-Irish | 45 | 3.8% |
| Swedish | 63 | 5.3% | View All 11 Rows |
Immigrants in Enterprise

| Immigration Origin | # Population | % Population | View All 0 Rows |
Sex and Age in Enterprise
Sex and Age in Enterprise
The most populous age groups in Enterprise are 10 to 14 Years (109 | 19.1%) for men and 65 to 69 Years (86 | 14.0%) for women.
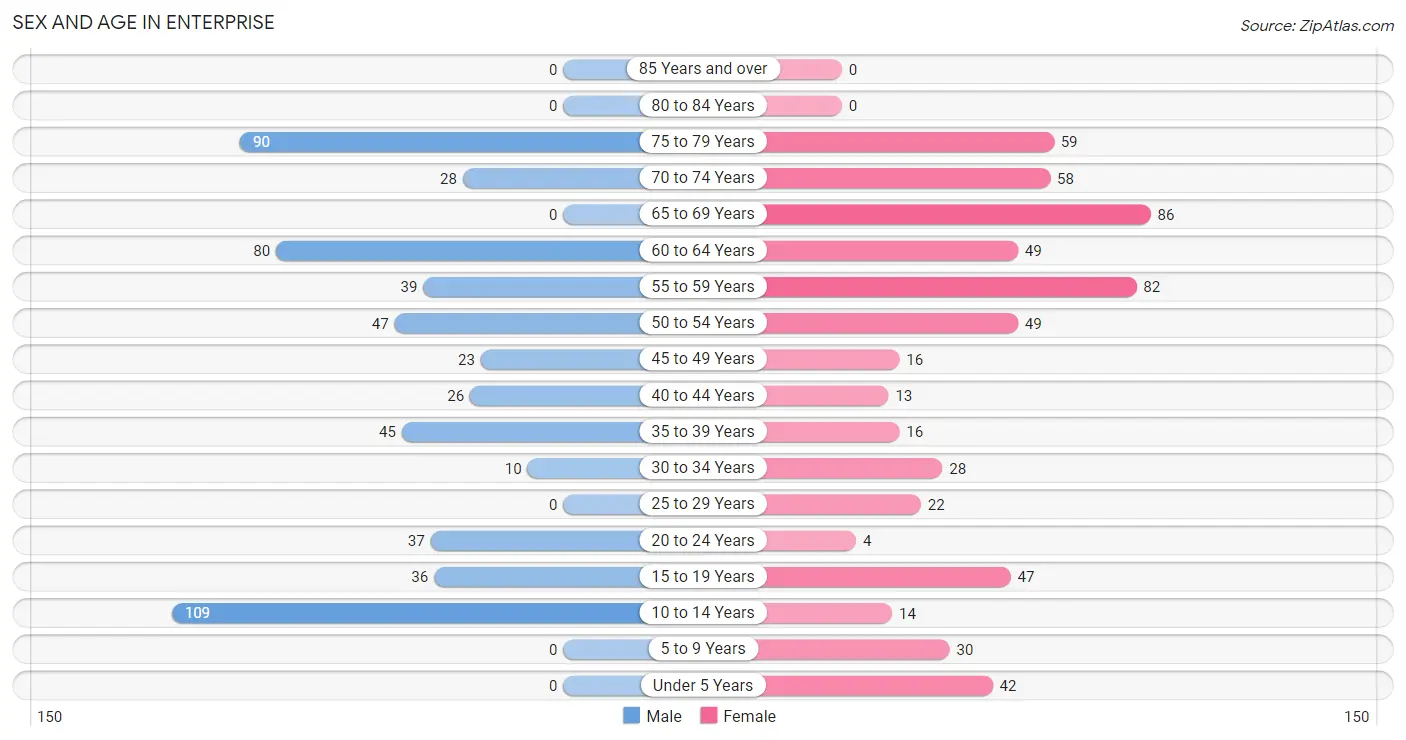
| Age Bracket | Male | Female |
| Under 5 Years | 0 (0.0%) | 42 (6.8%) |
| 5 to 9 Years | 0 (0.0%) | 30 (4.9%) |
| 10 to 14 Years | 109 (19.1%) | 14 (2.3%) |
| 15 to 19 Years | 36 (6.3%) | 47 (7.6%) |
| 20 to 24 Years | 37 (6.5%) | 4 (0.6%) |
| 25 to 29 Years | 0 (0.0%) | 22 (3.6%) |
| 30 to 34 Years | 10 (1.8%) | 28 (4.5%) |
| 35 to 39 Years | 45 (7.9%) | 16 (2.6%) |
| 40 to 44 Years | 26 (4.6%) | 13 (2.1%) |
| 45 to 49 Years | 23 (4.0%) | 16 (2.6%) |
| 50 to 54 Years | 47 (8.3%) | 49 (8.0%) |
| 55 to 59 Years | 39 (6.8%) | 82 (13.3%) |
| 60 to 64 Years | 80 (14.0%) | 49 (8.0%) |
| 65 to 69 Years | 0 (0.0%) | 86 (14.0%) |
| 70 to 74 Years | 28 (4.9%) | 58 (9.4%) |
| 75 to 79 Years | 90 (15.8%) | 59 (9.6%) |
| 80 to 84 Years | 0 (0.0%) | 0 (0.0%) |
| 85 Years and over | 0 (0.0%) | 0 (0.0%) |
| Total | 570 (100.0%) | 615 (100.0%) |
Families and Households in Enterprise
Median Family Size in Enterprise
The median family size in Enterprise is 2.85 persons per family, with single male/father families (32 | 8.4%) accounting for the largest median family size of 3.75 persons per family. On the other hand, married-couple families (198 | 52.0%) represent the smallest median family size with 2.76 persons per family.
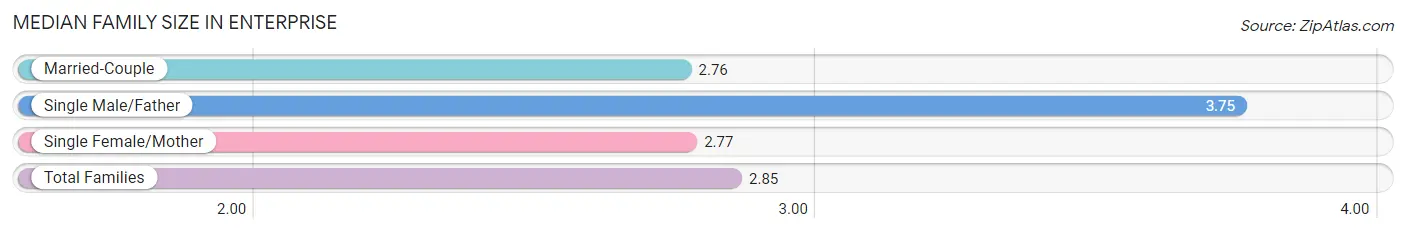
| Family Type | # Families | Family Size |
| Married-Couple | 198 (52.0%) | 2.76 |
| Single Male/Father | 32 (8.4%) | 3.75 |
| Single Female/Mother | 151 (39.6%) | 2.77 |
| Total Families | 381 (100.0%) | 2.85 |
Median Household Size in Enterprise
The median household size in Enterprise is 2.71 persons per household, with single male/father households (32 | 7.3%) accounting for the largest median household size of 3.91 persons per household. non-family households (56 | 12.8%) represent the smallest median household size with 1.70 persons per household.
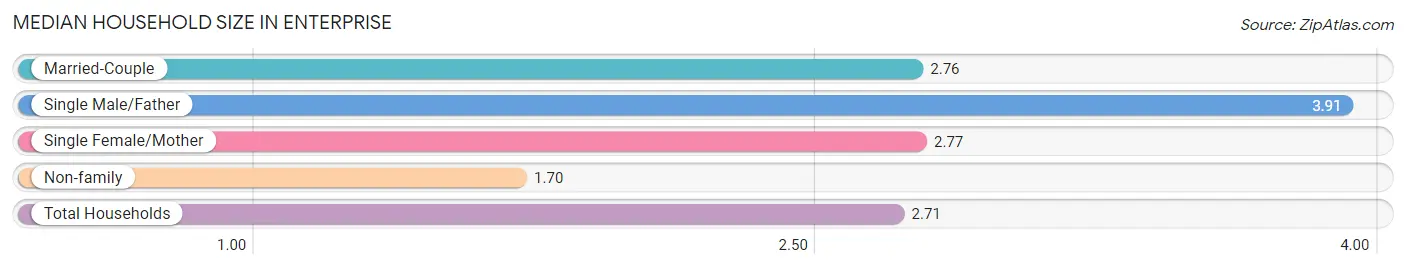
| Household Type | # Households | Household Size |
| Married-Couple | 198 (45.3%) | 2.76 |
| Single Male/Father | 32 (7.3%) | 3.91 |
| Single Female/Mother | 151 (34.5%) | 2.77 |
| Non-family | 56 (12.8%) | 1.70 |
| Total Households | 437 (100.0%) | 2.71 |
Household Size by Marriage Status in Enterprise
Out of a total of 437 households in Enterprise, 381 (87.2%) are family households, while 56 (12.8%) are nonfamily households. The most numerous type of family households are 2-person households, comprising 241, and the most common type of nonfamily households are 1-person households, comprising 29.
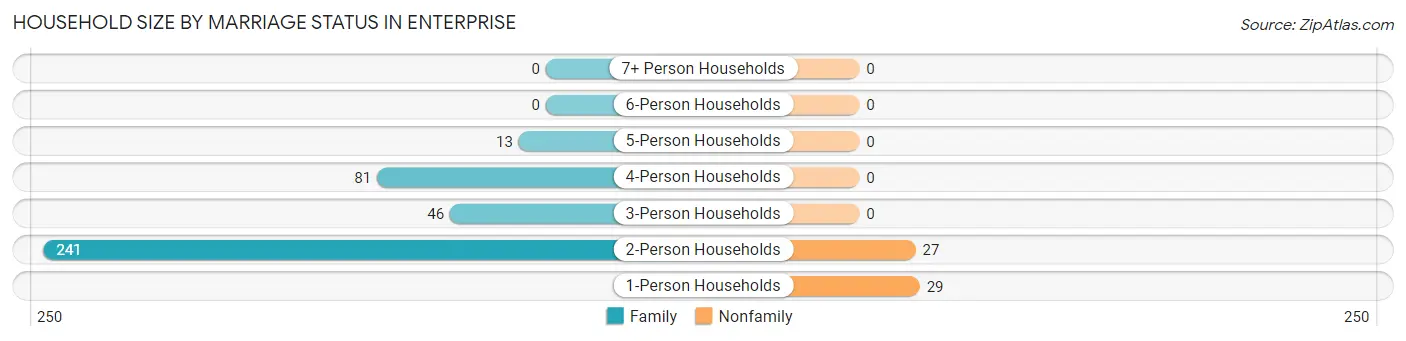
| Household Size | Family Households | Nonfamily Households |
| 1-Person Households | - | 29 (6.6%) |
| 2-Person Households | 241 (55.1%) | 27 (6.2%) |
| 3-Person Households | 46 (10.5%) | 0 (0.0%) |
| 4-Person Households | 81 (18.5%) | 0 (0.0%) |
| 5-Person Households | 13 (3.0%) | 0 (0.0%) |
| 6-Person Households | 0 (0.0%) | 0 (0.0%) |
| 7+ Person Households | 0 (0.0%) | 0 (0.0%) |
| Total | 381 (87.2%) | 56 (12.8%) |
Female Fertility in Enterprise
Fertility by Age in Enterprise
| Age Bracket | Women with Births | Births / 1,000 Women |
| 15 to 19 years | 0 (0.0%) | 0.0 |
| 20 to 34 years | 0 (0.0%) | 0.0 |
| 35 to 50 years | 0 (0.0%) | 0.0 |
| Total | 0 (0.0%) | 0.0 |
Fertility by Age by Marriage Status in Enterprise
| Age Bracket | Married | Unmarried |
| 15 to 19 years | 0 (0.0%) | 0 (0.0%) |
| 20 to 34 years | 0 (0.0%) | 0 (0.0%) |
| 35 to 50 years | 0 (0.0%) | 0 (0.0%) |
| Total | 0 (0.0%) | 0 (0.0%) |
Fertility by Education in Enterprise
| Educational Attainment | Women with Births | Births / 1,000 Women |
| Less than High School | 0 (0.0%) | 0.0 |
| High School Diploma | 0 (0.0%) | 0.0 |
| College or Associate's Degree | 0 (0.0%) | 0.0 |
| Bachelor's Degree | 0 (0.0%) | 0.0 |
| Graduate Degree | 0 (0.0%) | 0.0 |
| Total | 0 (0.0%) | 0.0 |
Fertility by Education by Marriage Status in Enterprise
| Educational Attainment | Married | Unmarried |
| Less than High School | 0 (0.0%) | 0 (0.0%) |
| High School Diploma | 0 (0.0%) | 0 (0.0%) |
| College or Associate's Degree | 0 (0.0%) | 0 (0.0%) |
| Bachelor's Degree | 0 (0.0%) | 0 (0.0%) |
| Graduate Degree | 0 (0.0%) | 0 (0.0%) |
| Total | 0 (0.0%) | 0 (0.0%) |
Employment Characteristics in Enterprise
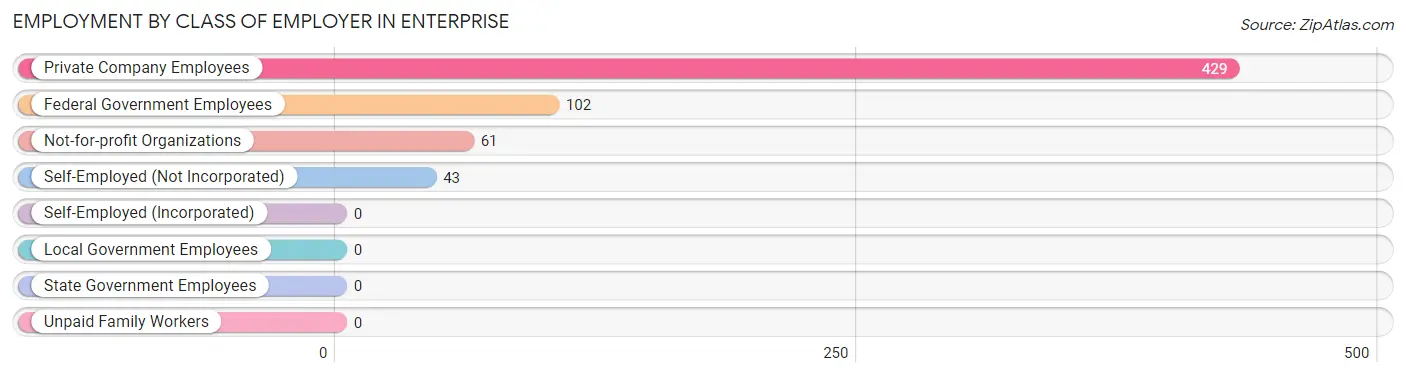
Employment by Class of Employer in Enterprise
Among the 635 employed individuals in Enterprise, private company employees (429 | 67.6%), federal government employees (102 | 16.1%), and not-for-profit organizations (61 | 9.6%) make up the most common classes of employment.
| Employer Class | # Employees | % Employees |
| Private Company Employees | 429 | 67.6% |
| Self-Employed (Incorporated) | 0 | 0.0% |
| Self-Employed (Not Incorporated) | 43 | 6.8% |
| Not-for-profit Organizations | 61 | 9.6% |
| Local Government Employees | 0 | 0.0% |
| State Government Employees | 0 | 0.0% |
| Federal Government Employees | 102 | 16.1% |
| Unpaid Family Workers | 0 | 0.0% |
| Total | 635 | 100.0% |
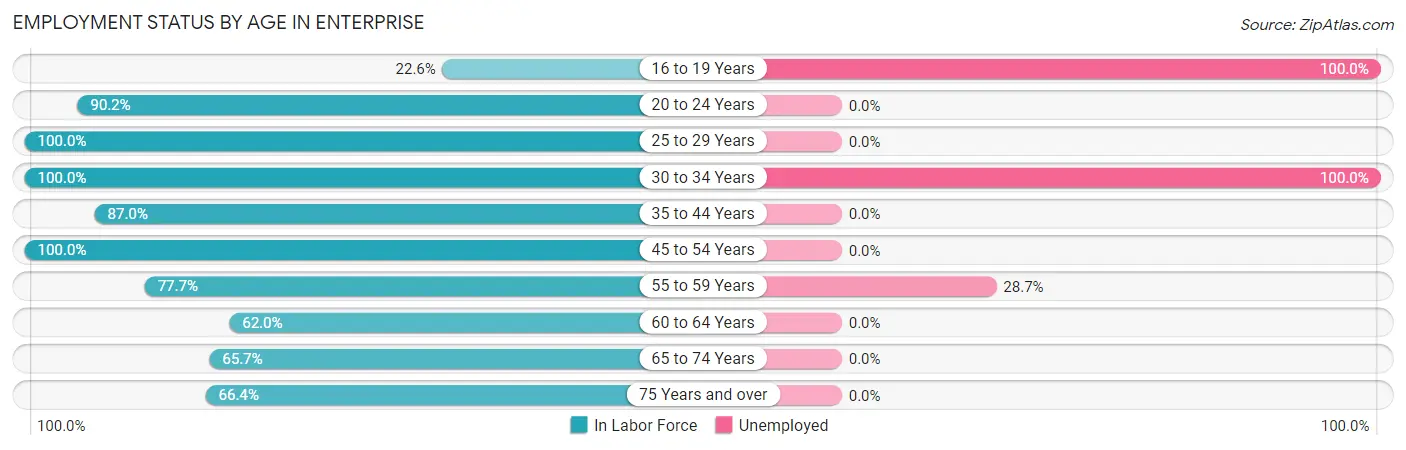
Employment Status by Age in Enterprise
According to the labor force statistics for Enterprise, out of the total population over 16 years of age (960), 74.7% or 717 individuals are in the labor force, with 10.7% or 77 of them unemployed. The age group with the highest labor force participation rate is 25 to 29 years, with 100.0% or 22 individuals in the labor force. Within the labor force, the 16 to 19 years age range has the highest percentage of unemployed individuals, with 100.0% or 12 of them being unemployed.
| Age Bracket | In Labor Force | Unemployed |
| 16 to 19 Years | 12 (22.6%) | 12 (100.0%) |
| 20 to 24 Years | 37 (90.2%) | 0 (0.0%) |
| 25 to 29 Years | 22 (100.0%) | 0 (0.0%) |
| 30 to 34 Years | 38 (100.0%) | 38 (100.0%) |
| 35 to 44 Years | 87 (87.0%) | 0 (0.0%) |
| 45 to 54 Years | 135 (100.0%) | 0 (0.0%) |
| 55 to 59 Years | 94 (77.7%) | 27 (28.7%) |
| 60 to 64 Years | 80 (62.0%) | 0 (0.0%) |
| 65 to 74 Years | 113 (65.7%) | 0 (0.0%) |
| 75 Years and over | 99 (66.4%) | 0 (0.0%) |
| Total | 717 (74.7%) | 77 (10.7%) |
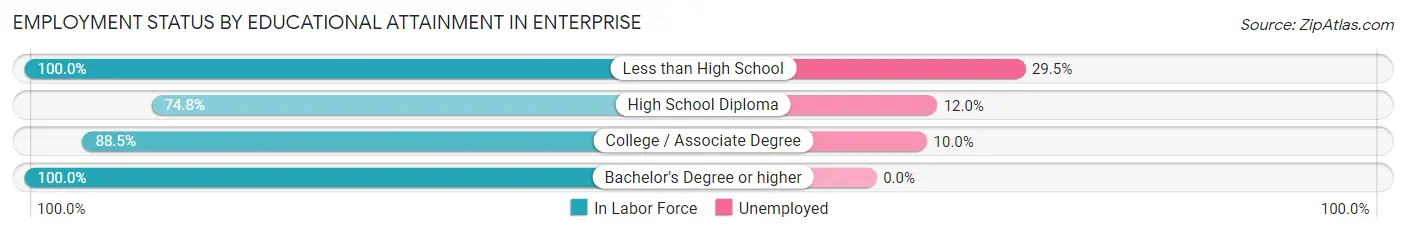
Employment Status by Educational Attainment in Enterprise
According to labor force statistics for Enterprise, 83.7% of individuals (456) out of the total population between 25 and 64 years of age (545) are in the labor force, with 14.3% or 65 of them being unemployed. The group with the highest labor force participation rate are those with the educational attainment of less than high school, with 100.0% or 95 individuals in the labor force. Within the labor force, individuals with less than high school education have the highest percentage of unemployment, with 29.5% or 28 of them being unemployed.
| Educational Attainment | In Labor Force | Unemployed |
| Less than High School | 95 (100.0%) | 28 (29.5%) |
| High School Diploma | 225 (74.8%) | 36 (12.0%) |
| College / Associate Degree | 100 (88.5%) | 11 (10.0%) |
| Bachelor's Degree or higher | 36 (100.0%) | 0 (0.0%) |
| Total | 456 (83.7%) | 78 (14.3%) |
Employment Occupations by Sex in Enterprise
Management, Business, Science and Arts Occupations
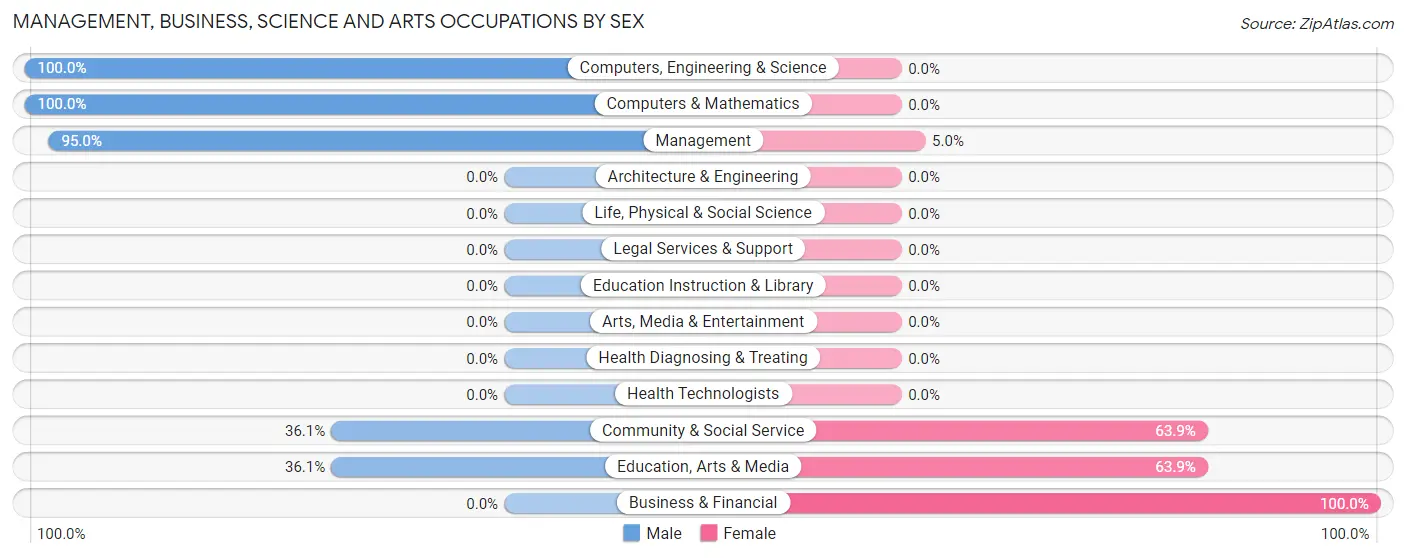
The most common Management, Business, Science and Arts occupations in Enterprise are Management (100 | 15.6%), Community & Social Service (61 | 9.5%), Education, Arts & Media (61 | 9.5%), Computers, Engineering & Science (37 | 5.8%), and Computers & Mathematics (37 | 5.8%).
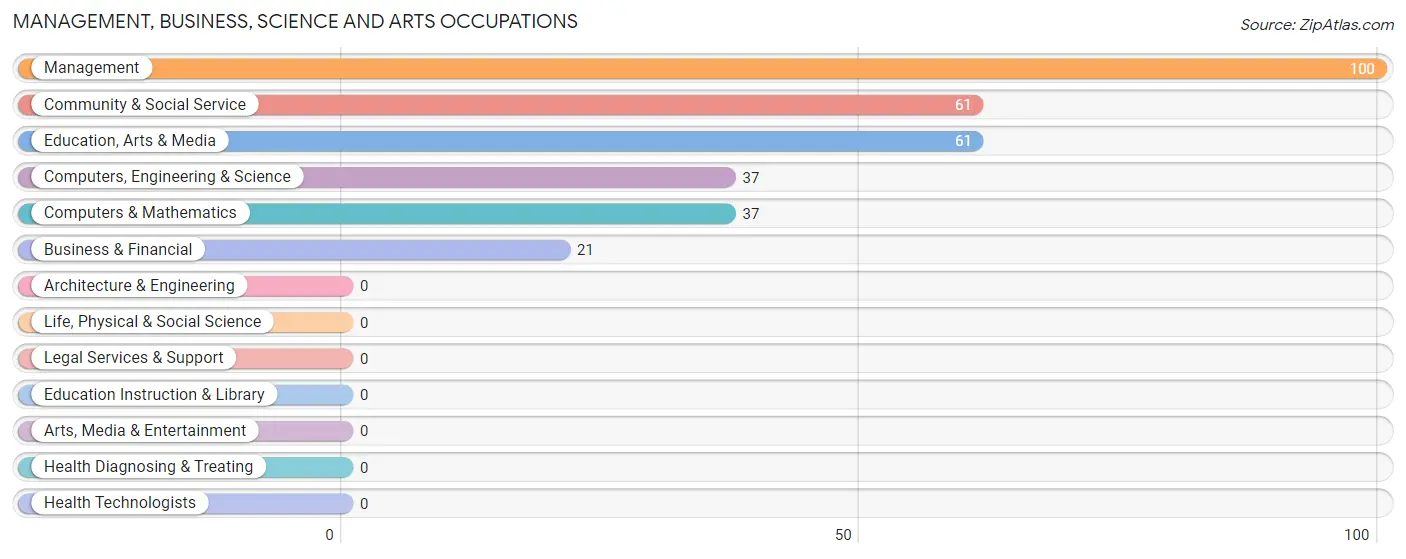
Management, Business, Science and Arts Occupations by Sex
Within the Management, Business, Science and Arts occupations in Enterprise, the most male-oriented occupations are Computers, Engineering & Science (100.0%), Computers & Mathematics (100.0%), and Management (95.0%), while the most female-oriented occupations are Business & Financial (100.0%), Community & Social Service (63.9%), and Education, Arts & Media (63.9%).
| Occupation | Male | Female |
| Management | 95 (95.0%) | 5 (5.0%) |
| Business & Financial | 0 (0.0%) | 21 (100.0%) |
| Computers, Engineering & Science | 37 (100.0%) | 0 (0.0%) |
| Computers & Mathematics | 37 (100.0%) | 0 (0.0%) |
| Architecture & Engineering | 0 (0.0%) | 0 (0.0%) |
| Life, Physical & Social Science | 0 (0.0%) | 0 (0.0%) |
| Community & Social Service | 22 (36.1%) | 39 (63.9%) |
| Education, Arts & Media | 22 (36.1%) | 39 (63.9%) |
| Legal Services & Support | 0 (0.0%) | 0 (0.0%) |
| Education Instruction & Library | 0 (0.0%) | 0 (0.0%) |
| Arts, Media & Entertainment | 0 (0.0%) | 0 (0.0%) |
| Health Diagnosing & Treating | 0 (0.0%) | 0 (0.0%) |
| Health Technologists | 0 (0.0%) | 0 (0.0%) |
| Total (Category) | 154 (70.3%) | 65 (29.7%) |
| Total (Overall) | 409 (63.9%) | 231 (36.1%) |
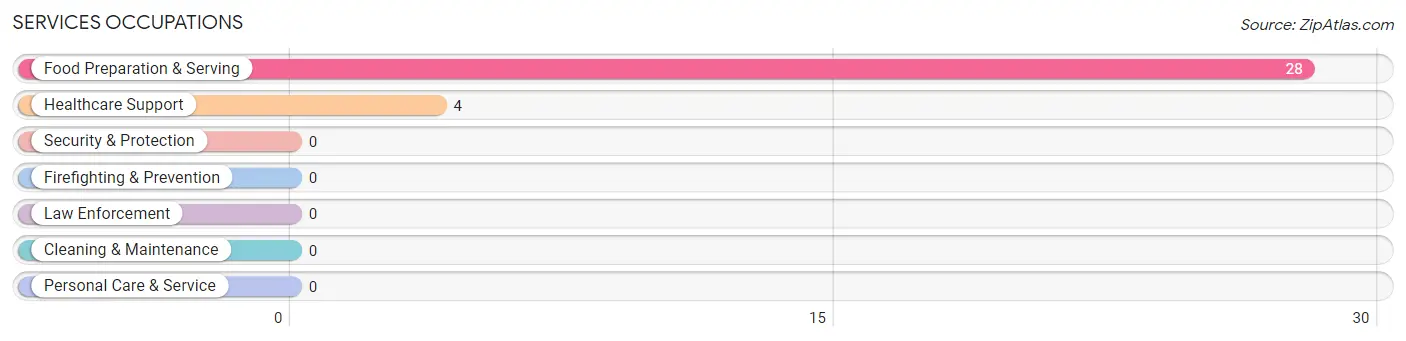
Services Occupations
The most common Services occupations in Enterprise are Food Preparation & Serving (28 | 4.4%), and Healthcare Support (4 | 0.6%).
Services Occupations by Sex
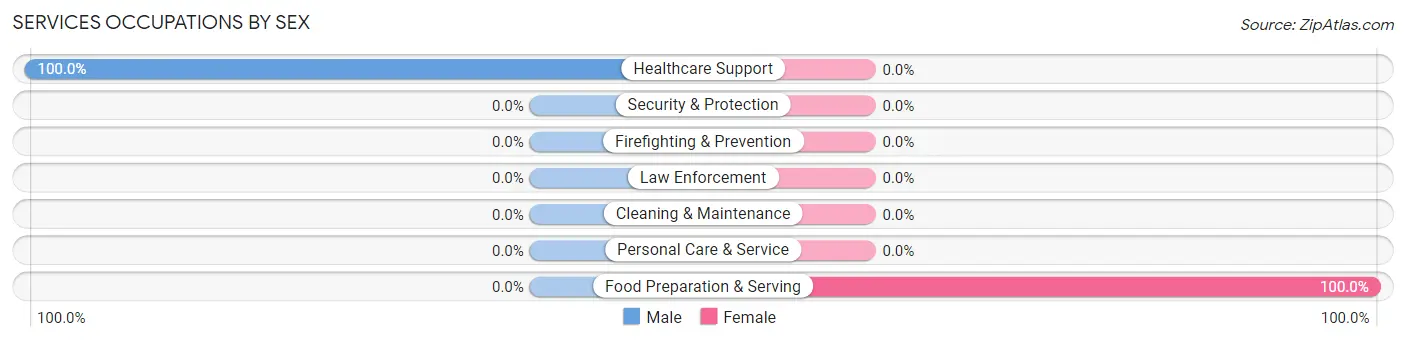
| Occupation | Male | Female |
| Healthcare Support | 4 (100.0%) | 0 (0.0%) |
| Security & Protection | 0 (0.0%) | 0 (0.0%) |
| Firefighting & Prevention | 0 (0.0%) | 0 (0.0%) |
| Law Enforcement | 0 (0.0%) | 0 (0.0%) |
| Food Preparation & Serving | 0 (0.0%) | 28 (100.0%) |
| Cleaning & Maintenance | 0 (0.0%) | 0 (0.0%) |
| Personal Care & Service | 0 (0.0%) | 0 (0.0%) |
| Total (Category) | 4 (12.5%) | 28 (87.5%) |
| Total (Overall) | 409 (63.9%) | 231 (36.1%) |
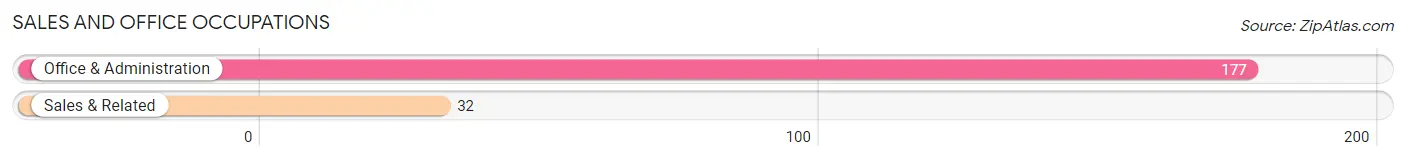
Sales and Office Occupations
The most common Sales and Office occupations in Enterprise are Office & Administration (177 | 27.7%), and Sales & Related (32 | 5.0%).
Sales and Office Occupations by Sex
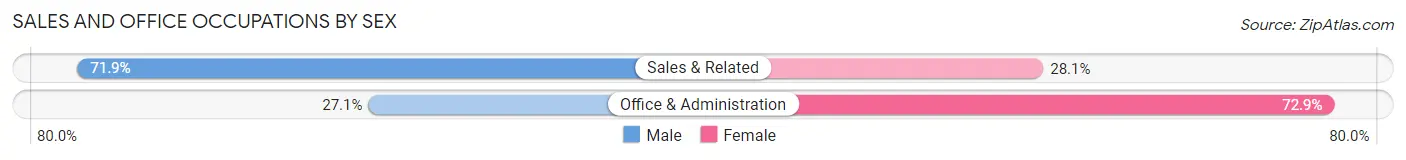
| Occupation | Male | Female |
| Sales & Related | 23 (71.9%) | 9 (28.1%) |
| Office & Administration | 48 (27.1%) | 129 (72.9%) |
| Total (Category) | 71 (34.0%) | 138 (66.0%) |
| Total (Overall) | 409 (63.9%) | 231 (36.1%) |
Natural Resources, Construction and Maintenance Occupations
The most common Natural Resources, Construction and Maintenance occupations in Enterprise are , and Construction & Extraction (127 | 19.8%).
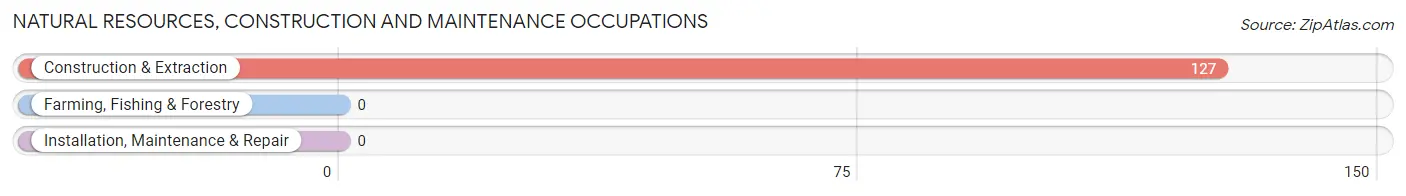
Natural Resources, Construction and Maintenance Occupations by Sex
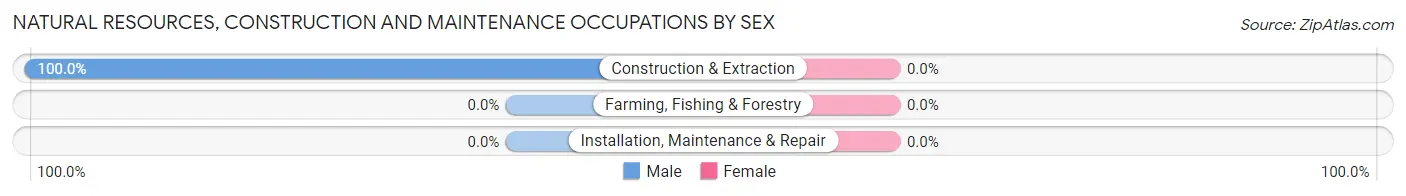
| Occupation | Male | Female |
| Farming, Fishing & Forestry | 0 (0.0%) | 0 (0.0%) |
| Construction & Extraction | 127 (100.0%) | 0 (0.0%) |
| Installation, Maintenance & Repair | 0 (0.0%) | 0 (0.0%) |
| Total (Category) | 127 (100.0%) | 0 (0.0%) |
| Total (Overall) | 409 (63.9%) | 231 (36.1%) |
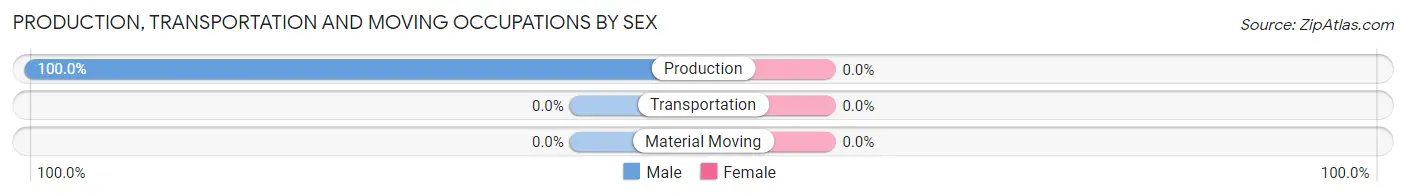
Production, Transportation and Moving Occupations
The most common Production, Transportation and Moving occupations in Enterprise are , and Production (53 | 8.3%).
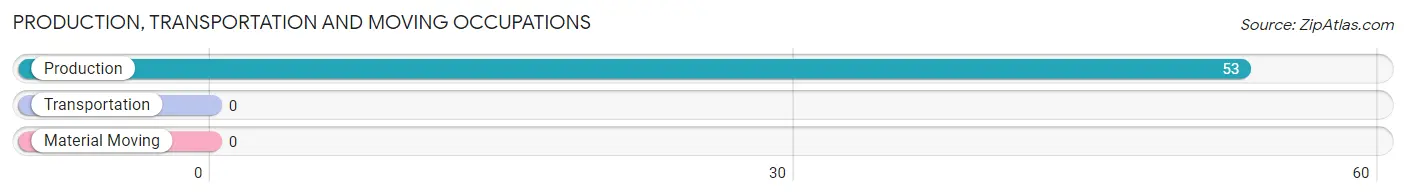
Production, Transportation and Moving Occupations by Sex
| Occupation | Male | Female |
| Production | 53 (100.0%) | 0 (0.0%) |
| Transportation | 0 (0.0%) | 0 (0.0%) |
| Material Moving | 0 (0.0%) | 0 (0.0%) |
| Total (Category) | 53 (100.0%) | 0 (0.0%) |
| Total (Overall) | 409 (63.9%) | 231 (36.1%) |
Employment Industries by Sex in Enterprise
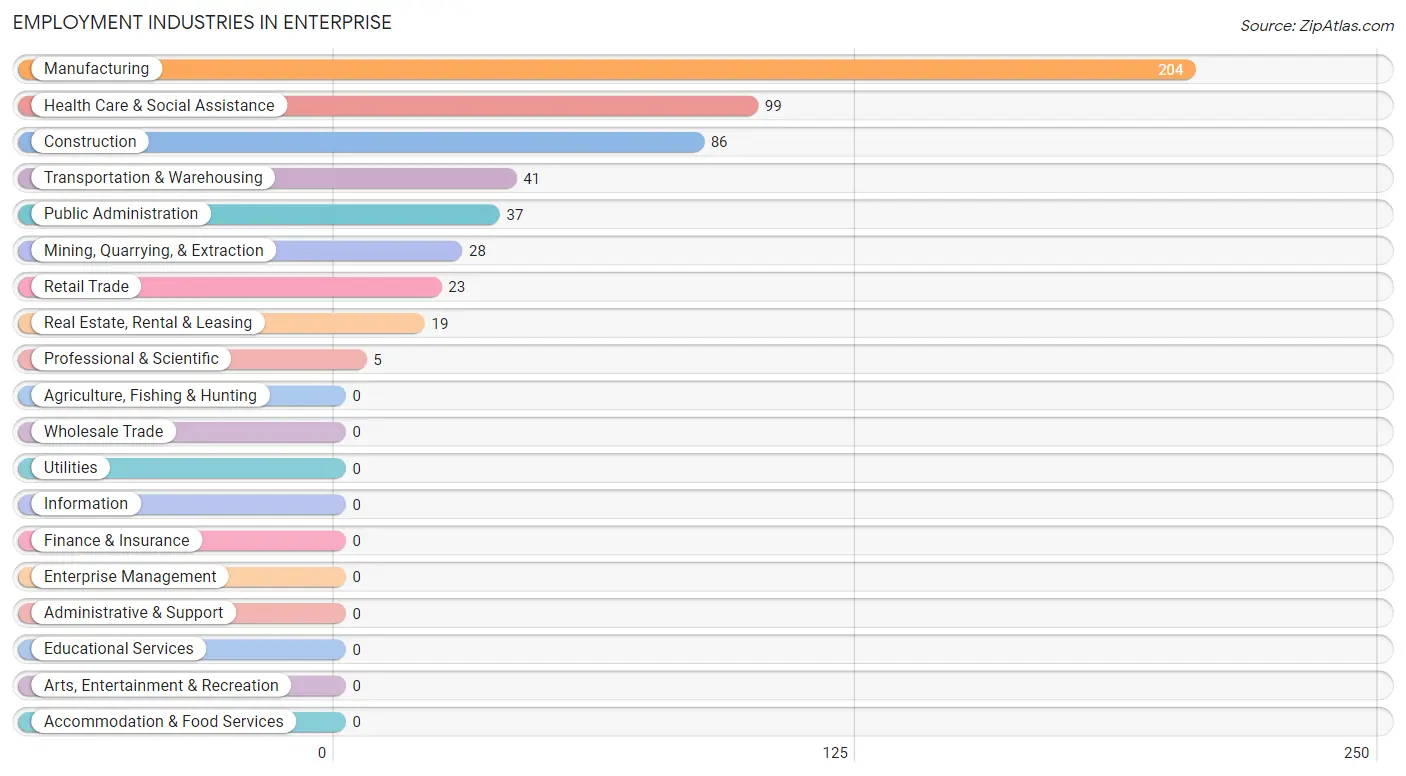
Employment Industries in Enterprise
The major employment industries in Enterprise include Manufacturing (204 | 31.9%), Health Care & Social Assistance (99 | 15.5%), Construction (86 | 13.4%), Transportation & Warehousing (41 | 6.4%), and Public Administration (37 | 5.8%).
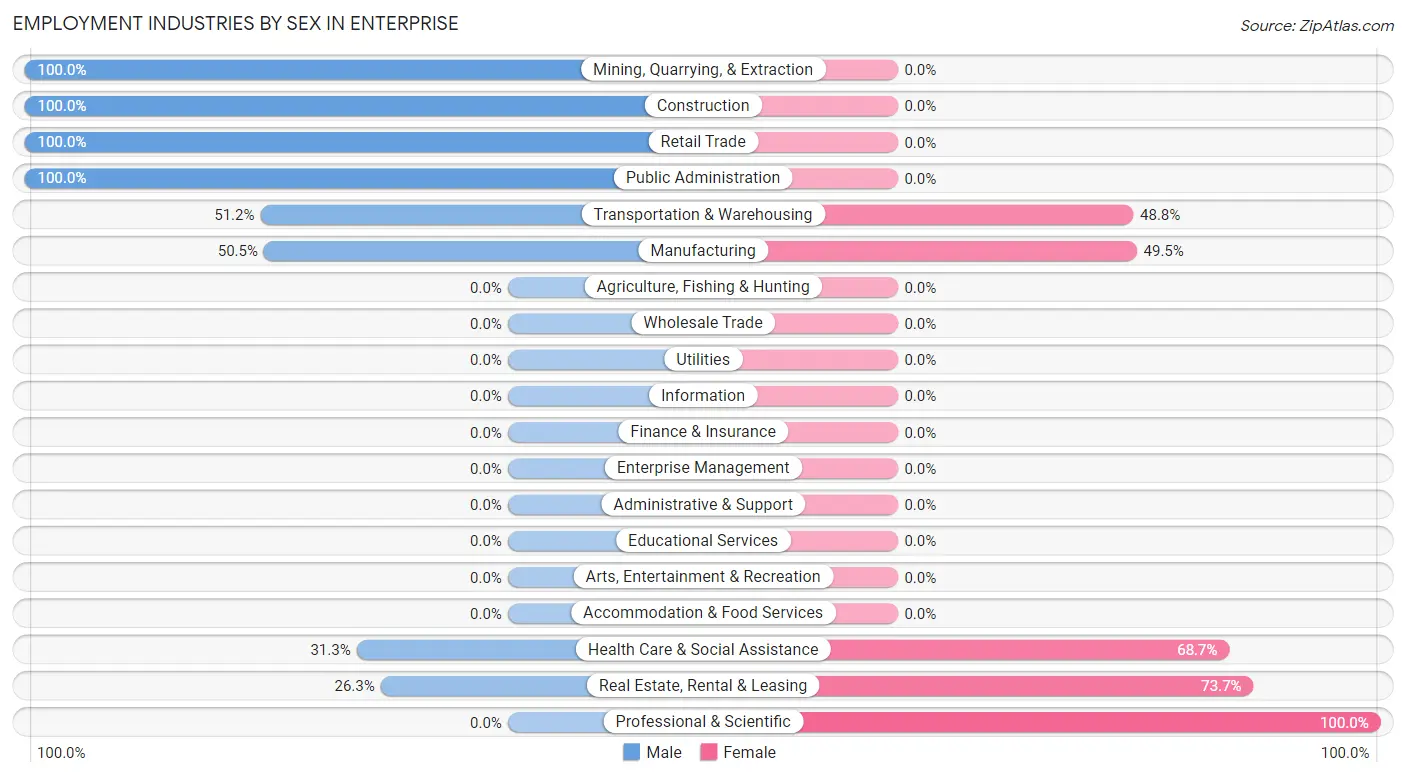
Employment Industries by Sex in Enterprise
The Enterprise industries that see more men than women are Mining, Quarrying, & Extraction (100.0%), Construction (100.0%), and Retail Trade (100.0%), whereas the industries that tend to have a higher number of women are Professional & Scientific (100.0%), Real Estate, Rental & Leasing (73.7%), and Health Care & Social Assistance (68.7%).
| Industry | Male | Female |
| Agriculture, Fishing & Hunting | 0 (0.0%) | 0 (0.0%) |
| Mining, Quarrying, & Extraction | 28 (100.0%) | 0 (0.0%) |
| Construction | 86 (100.0%) | 0 (0.0%) |
| Manufacturing | 103 (50.5%) | 101 (49.5%) |
| Wholesale Trade | 0 (0.0%) | 0 (0.0%) |
| Retail Trade | 23 (100.0%) | 0 (0.0%) |
| Transportation & Warehousing | 21 (51.2%) | 20 (48.8%) |
| Utilities | 0 (0.0%) | 0 (0.0%) |
| Information | 0 (0.0%) | 0 (0.0%) |
| Finance & Insurance | 0 (0.0%) | 0 (0.0%) |
| Real Estate, Rental & Leasing | 5 (26.3%) | 14 (73.7%) |
| Professional & Scientific | 0 (0.0%) | 5 (100.0%) |
| Enterprise Management | 0 (0.0%) | 0 (0.0%) |
| Administrative & Support | 0 (0.0%) | 0 (0.0%) |
| Educational Services | 0 (0.0%) | 0 (0.0%) |
| Health Care & Social Assistance | 31 (31.3%) | 68 (68.7%) |
| Arts, Entertainment & Recreation | 0 (0.0%) | 0 (0.0%) |
| Accommodation & Food Services | 0 (0.0%) | 0 (0.0%) |
| Public Administration | 37 (100.0%) | 0 (0.0%) |
| Total | 409 (63.9%) | 231 (36.1%) |
Education in Enterprise
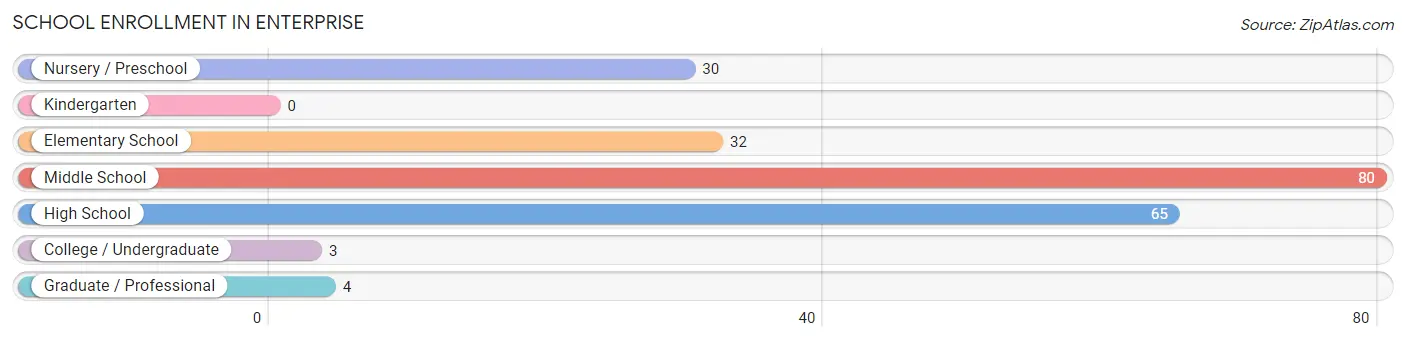
School Enrollment in Enterprise
The most common levels of schooling among the 214 students in Enterprise are middle school (80 | 37.4%), high school (65 | 30.4%), and elementary school (32 | 14.9%).
| School Level | # Students | % Students |
| Nursery / Preschool | 30 | 14.0% |
| Kindergarten | 0 | 0.0% |
| Elementary School | 32 | 14.9% |
| Middle School | 80 | 37.4% |
| High School | 65 | 30.4% |
| College / Undergraduate | 3 | 1.4% |
| Graduate / Professional | 4 | 1.9% |
| Total | 214 | 100.0% |
School Enrollment by Age by Funding Source in Enterprise
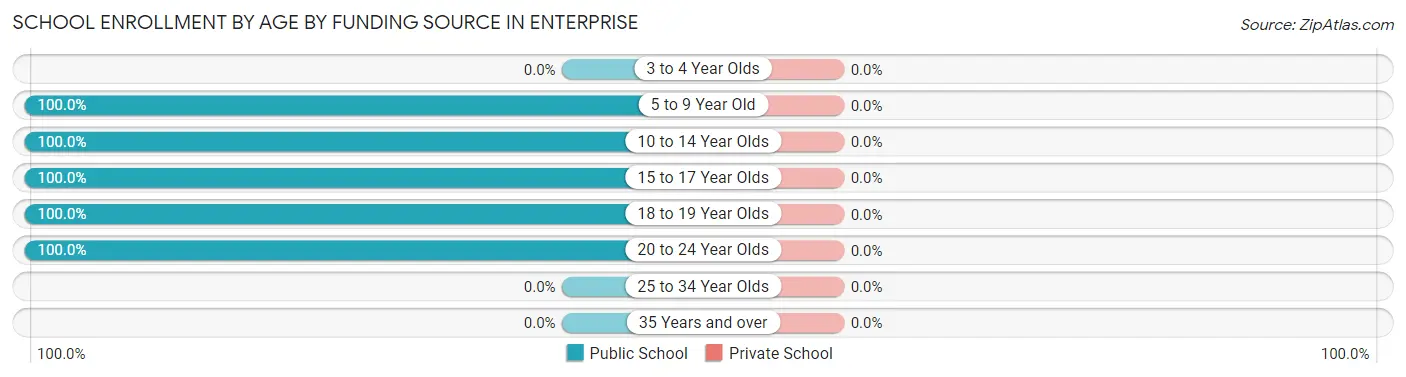
| Age Bracket | Public School | Private School |
| 3 to 4 Year Olds | 0 (0.0%) | 0 (0.0%) |
| 5 to 9 Year Old | 30 (100.0%) | 0 (0.0%) |
| 10 to 14 Year Olds | 112 (100.0%) | 0 (0.0%) |
| 15 to 17 Year Olds | 63 (100.0%) | 0 (0.0%) |
| 18 to 19 Year Olds | 5 (100.0%) | 0 (0.0%) |
| 20 to 24 Year Olds | 4 (100.0%) | 0 (0.0%) |
| 25 to 34 Year Olds | 0 (0.0%) | 0 (0.0%) |
| 35 Years and over | 0 (0.0%) | 0 (0.0%) |
| Total | 214 (100.0%) | 0 (0.0%) |
Educational Attainment by Field of Study in Enterprise
Science & technology (23 | 28.1%), education (23 | 28.1%), business (20 | 24.4%), and psychology (16 | 19.5%) are the most common fields of study among 82 individuals in Enterprise who have obtained a bachelor's degree or higher.
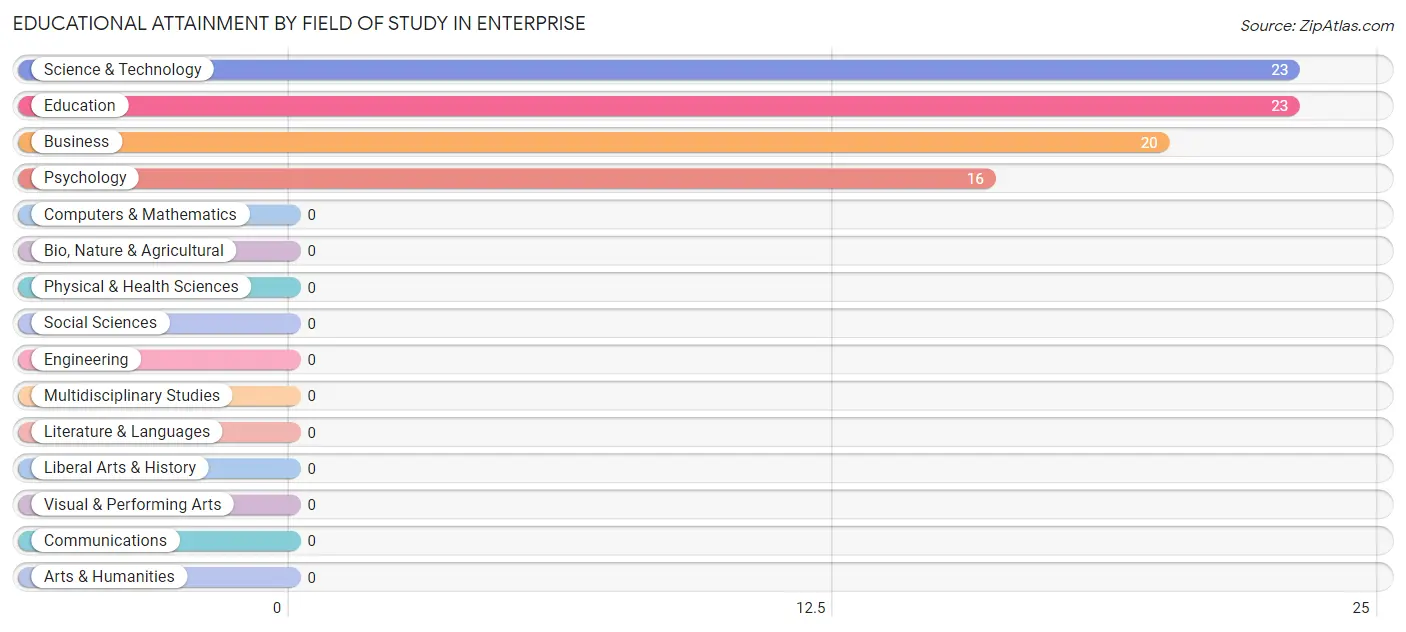
| Field of Study | # Graduates | % Graduates |
| Computers & Mathematics | 0 | 0.0% |
| Bio, Nature & Agricultural | 0 | 0.0% |
| Physical & Health Sciences | 0 | 0.0% |
| Psychology | 16 | 19.5% |
| Social Sciences | 0 | 0.0% |
| Engineering | 0 | 0.0% |
| Multidisciplinary Studies | 0 | 0.0% |
| Science & Technology | 23 | 28.1% |
| Business | 20 | 24.4% |
| Education | 23 | 28.1% |
| Literature & Languages | 0 | 0.0% |
| Liberal Arts & History | 0 | 0.0% |
| Visual & Performing Arts | 0 | 0.0% |
| Communications | 0 | 0.0% |
| Arts & Humanities | 0 | 0.0% |
| Total | 82 | 100.0% |
Transportation & Commute in Enterprise
Vehicle Availability by Sex in Enterprise
The most prevalent vehicle ownership categories in Enterprise are males with 2 vehicles (240, accounting for 58.7%) and females with 2 vehicles (169, making up 106.2%).
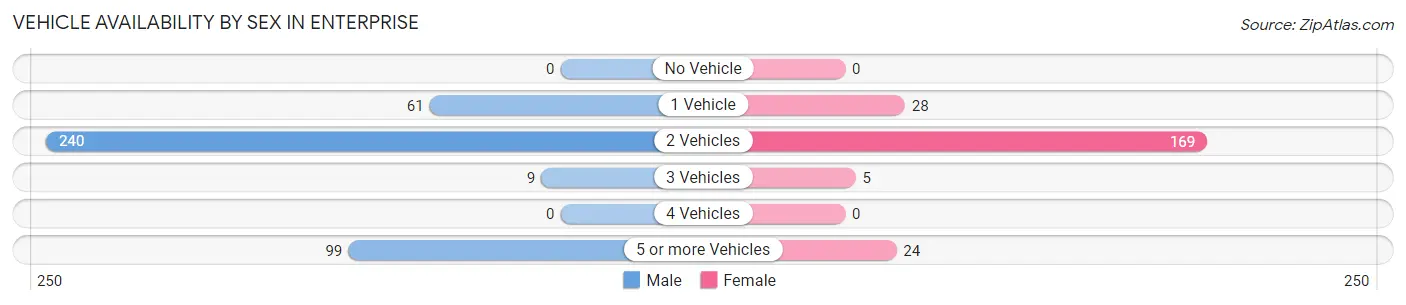
| Vehicles Available | Male | Female |
| No Vehicle | 0 (0.0%) | 0 (0.0%) |
| 1 Vehicle | 61 (14.9%) | 28 (12.4%) |
| 2 Vehicles | 240 (58.7%) | 169 (74.8%) |
| 3 Vehicles | 9 (2.2%) | 5 (2.2%) |
| 4 Vehicles | 0 (0.0%) | 0 (0.0%) |
| 5 or more Vehicles | 99 (24.2%) | 24 (10.6%) |
| Total | 409 (100.0%) | 226 (100.0%) |
Commute Time in Enterprise
The most frequently occuring commute durations in Enterprise are 30 to 34 minutes (240 commuters, 39.7%), 5 to 9 minutes (90 commuters, 14.9%), and 20 to 24 minutes (79 commuters, 13.1%).
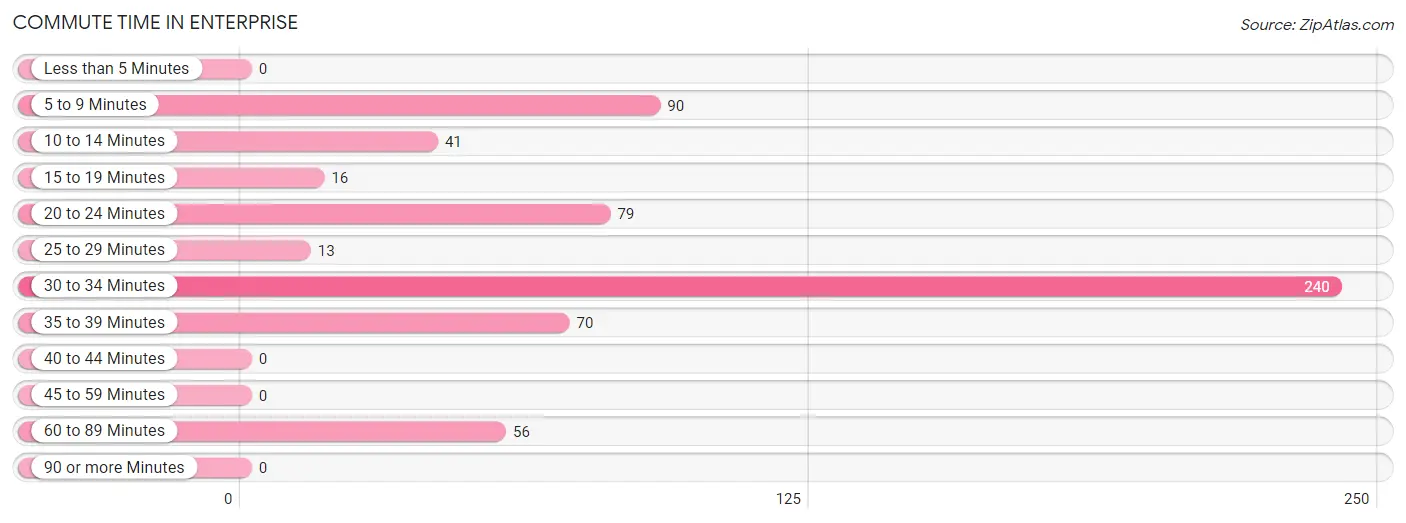
| Commute Time | # Commuters | % Commuters |
| Less than 5 Minutes | 0 | 0.0% |
| 5 to 9 Minutes | 90 | 14.9% |
| 10 to 14 Minutes | 41 | 6.8% |
| 15 to 19 Minutes | 16 | 2.6% |
| 20 to 24 Minutes | 79 | 13.1% |
| 25 to 29 Minutes | 13 | 2.1% |
| 30 to 34 Minutes | 240 | 39.7% |
| 35 to 39 Minutes | 70 | 11.6% |
| 40 to 44 Minutes | 0 | 0.0% |
| 45 to 59 Minutes | 0 | 0.0% |
| 60 to 89 Minutes | 56 | 9.3% |
| 90 or more Minutes | 0 | 0.0% |
Commute Time by Sex in Enterprise
The most common commute times in Enterprise are 30 to 34 minutes (155 commuters, 37.9%) for males and 30 to 34 minutes (85 commuters, 43.4%) for females.
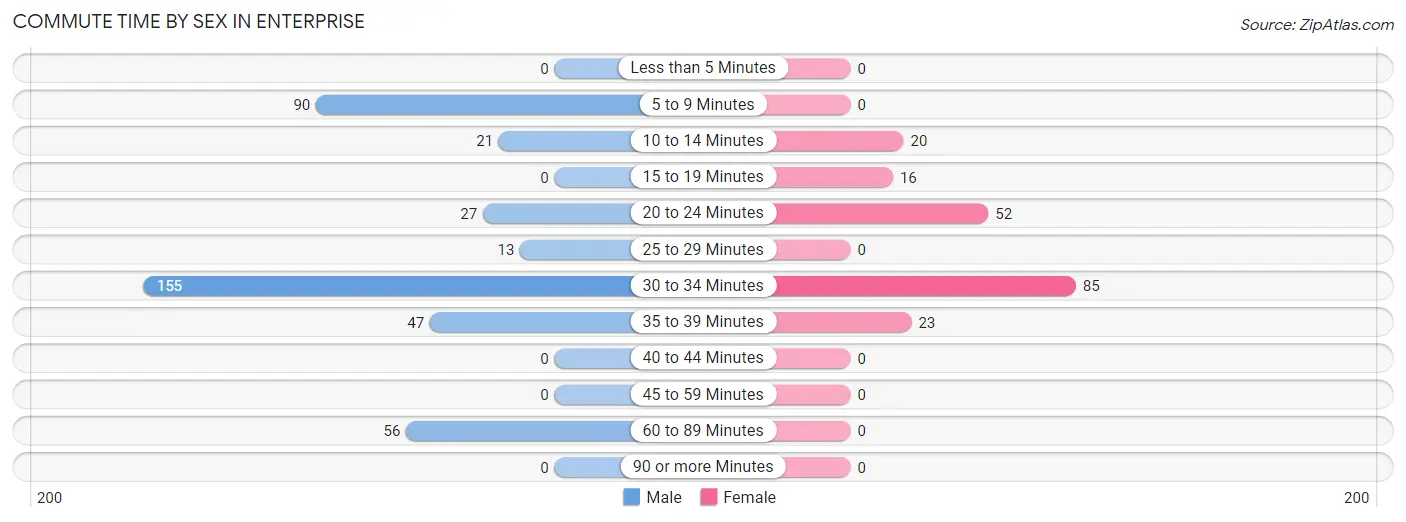
| Commute Time | Male | Female |
| Less than 5 Minutes | 0 (0.0%) | 0 (0.0%) |
| 5 to 9 Minutes | 90 (22.0%) | 0 (0.0%) |
| 10 to 14 Minutes | 21 (5.1%) | 20 (10.2%) |
| 15 to 19 Minutes | 0 (0.0%) | 16 (8.2%) |
| 20 to 24 Minutes | 27 (6.6%) | 52 (26.5%) |
| 25 to 29 Minutes | 13 (3.2%) | 0 (0.0%) |
| 30 to 34 Minutes | 155 (37.9%) | 85 (43.4%) |
| 35 to 39 Minutes | 47 (11.5%) | 23 (11.7%) |
| 40 to 44 Minutes | 0 (0.0%) | 0 (0.0%) |
| 45 to 59 Minutes | 0 (0.0%) | 0 (0.0%) |
| 60 to 89 Minutes | 56 (13.7%) | 0 (0.0%) |
| 90 or more Minutes | 0 (0.0%) | 0 (0.0%) |
Time of Departure to Work by Sex in Enterprise
The most frequent times of departure to work in Enterprise are 7:30 AM to 7:59 AM (171, 41.8%) for males and 12:00 AM to 4:59 AM (63, 32.1%) for females.
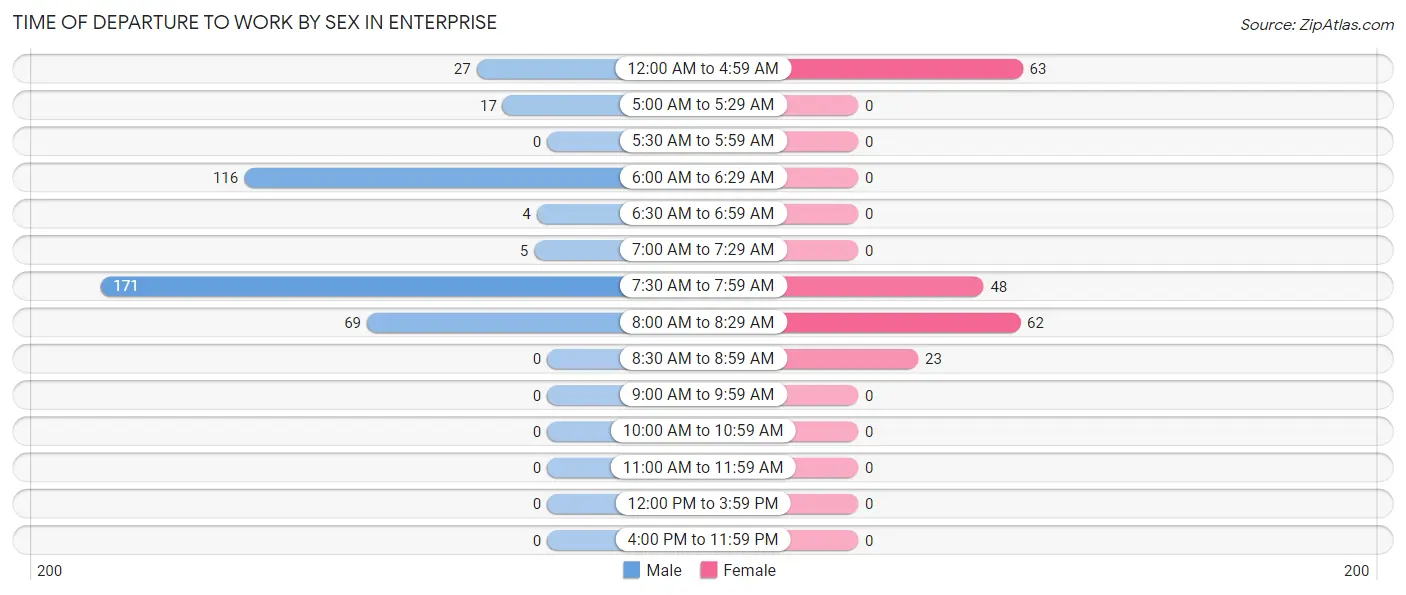
| Time of Departure | Male | Female |
| 12:00 AM to 4:59 AM | 27 (6.6%) | 63 (32.1%) |
| 5:00 AM to 5:29 AM | 17 (4.2%) | 0 (0.0%) |
| 5:30 AM to 5:59 AM | 0 (0.0%) | 0 (0.0%) |
| 6:00 AM to 6:29 AM | 116 (28.4%) | 0 (0.0%) |
| 6:30 AM to 6:59 AM | 4 (1.0%) | 0 (0.0%) |
| 7:00 AM to 7:29 AM | 5 (1.2%) | 0 (0.0%) |
| 7:30 AM to 7:59 AM | 171 (41.8%) | 48 (24.5%) |
| 8:00 AM to 8:29 AM | 69 (16.9%) | 62 (31.6%) |
| 8:30 AM to 8:59 AM | 0 (0.0%) | 23 (11.7%) |
| 9:00 AM to 9:59 AM | 0 (0.0%) | 0 (0.0%) |
| 10:00 AM to 10:59 AM | 0 (0.0%) | 0 (0.0%) |
| 11:00 AM to 11:59 AM | 0 (0.0%) | 0 (0.0%) |
| 12:00 PM to 3:59 PM | 0 (0.0%) | 0 (0.0%) |
| 4:00 PM to 11:59 PM | 0 (0.0%) | 0 (0.0%) |
| Total | 409 (100.0%) | 196 (100.0%) |
Housing Occupancy in Enterprise
Occupancy by Ownership in Enterprise
Of the total 437 dwellings in Enterprise, owner-occupied units account for 382 (87.4%), while renter-occupied units make up 55 (12.6%).
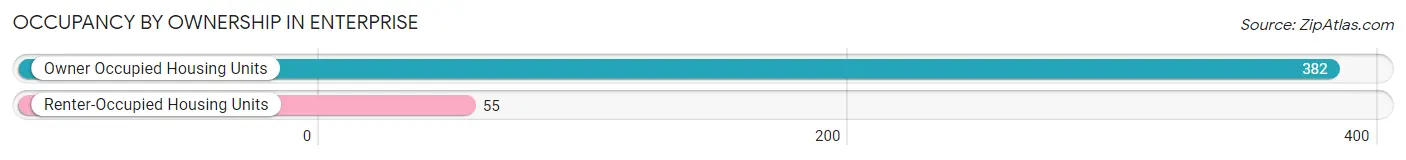
| Occupancy | # Housing Units | % Housing Units |
| Owner Occupied Housing Units | 382 | 87.4% |
| Renter-Occupied Housing Units | 55 | 12.6% |
| Total Occupied Housing Units | 437 | 100.0% |
Occupancy by Household Size in Enterprise
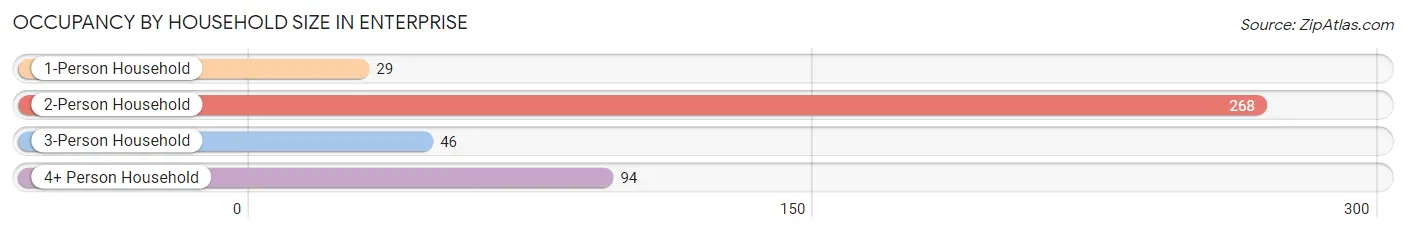
| Household Size | # Housing Units | % Housing Units |
| 1-Person Household | 29 | 6.6% |
| 2-Person Household | 268 | 61.3% |
| 3-Person Household | 46 | 10.5% |
| 4+ Person Household | 94 | 21.5% |
| Total Housing Units | 437 | 100.0% |
Occupancy by Ownership by Household Size in Enterprise
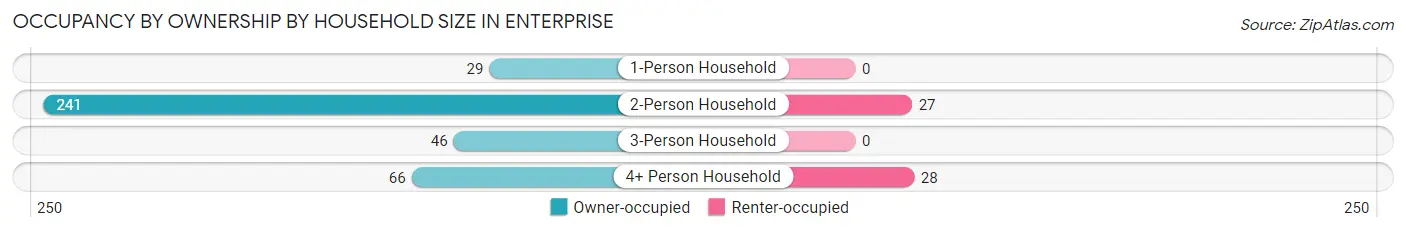
| Household Size | Owner-occupied | Renter-occupied |
| 1-Person Household | 29 (100.0%) | 0 (0.0%) |
| 2-Person Household | 241 (89.9%) | 27 (10.1%) |
| 3-Person Household | 46 (100.0%) | 0 (0.0%) |
| 4+ Person Household | 66 (70.2%) | 28 (29.8%) |
| Total Housing Units | 382 (87.4%) | 55 (12.6%) |
Occupancy by Educational Attainment in Enterprise
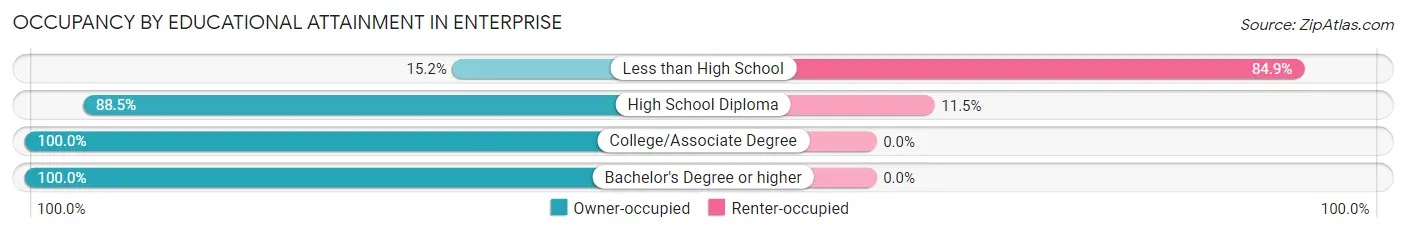
| Household Size | Owner-occupied | Renter-occupied |
| Less than High School | 5 (15.1%) | 28 (84.9%) |
| High School Diploma | 207 (88.5%) | 27 (11.5%) |
| College/Associate Degree | 150 (100.0%) | 0 (0.0%) |
| Bachelor's Degree or higher | 20 (100.0%) | 0 (0.0%) |
Occupancy by Age of Householder in Enterprise
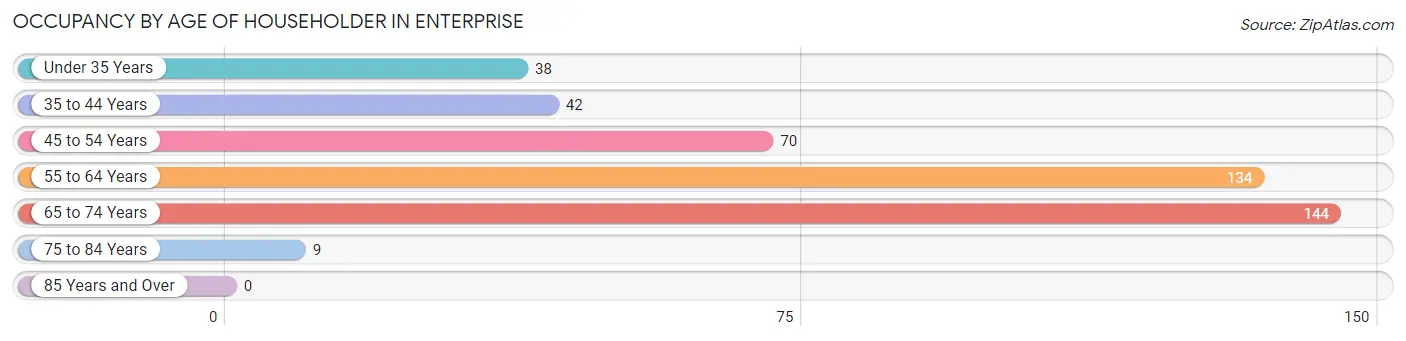
| Age Bracket | # Households | % Households |
| Under 35 Years | 38 | 8.7% |
| 35 to 44 Years | 42 | 9.6% |
| 45 to 54 Years | 70 | 16.0% |
| 55 to 64 Years | 134 | 30.7% |
| 65 to 74 Years | 144 | 33.0% |
| 75 to 84 Years | 9 | 2.1% |
| 85 Years and Over | 0 | 0.0% |
| Total | 437 | 100.0% |
Housing Finances in Enterprise
Median Income by Occupancy in Enterprise
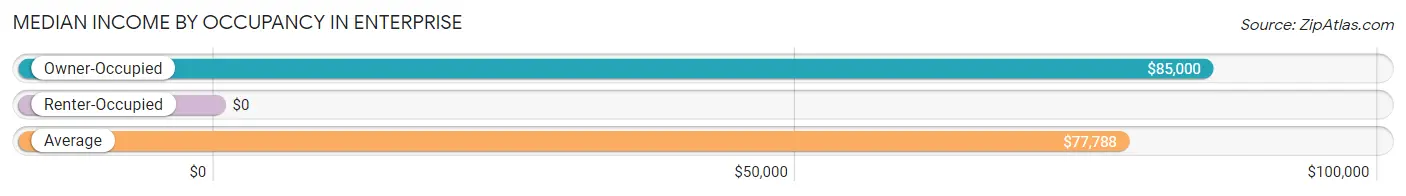
| Occupancy Type | # Households | Median Income |
| Owner-Occupied | 382 (87.4%) | $85,000 |
| Renter-Occupied | 55 (12.6%) | $0 |
| Average | 437 (100.0%) | $77,788 |
Occupancy by Householder Income Bracket in Enterprise
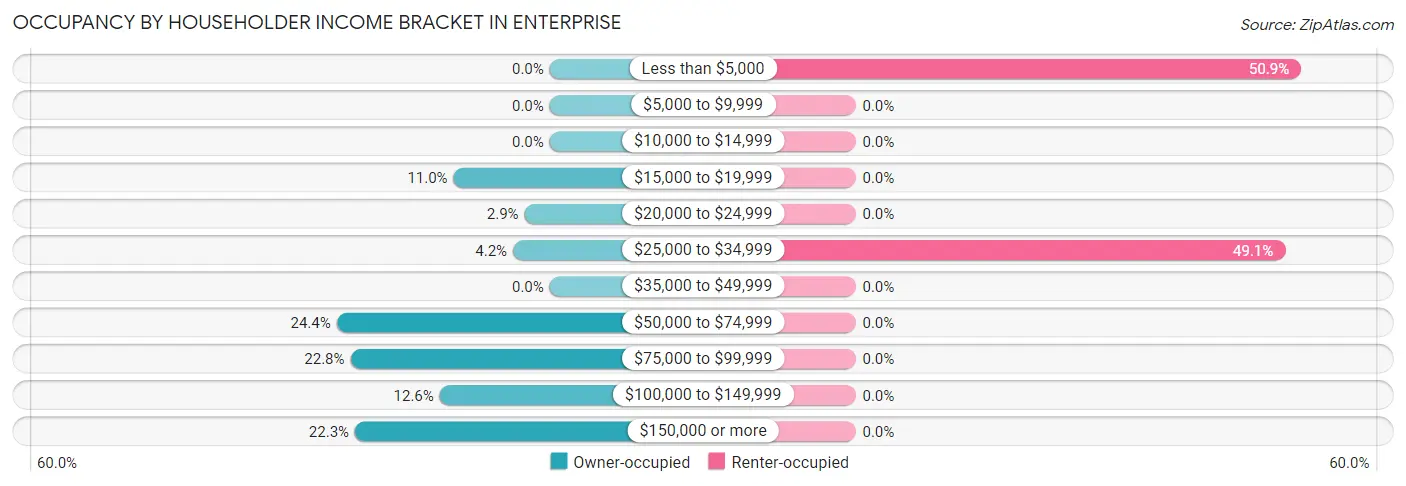
| Income Bracket | Owner-occupied | Renter-occupied |
| Less than $5,000 | 0 (0.0%) | 28 (50.9%) |
| $5,000 to $9,999 | 0 (0.0%) | 0 (0.0%) |
| $10,000 to $14,999 | 0 (0.0%) | 0 (0.0%) |
| $15,000 to $19,999 | 42 (11.0%) | 0 (0.0%) |
| $20,000 to $24,999 | 11 (2.9%) | 0 (0.0%) |
| $25,000 to $34,999 | 16 (4.2%) | 27 (49.1%) |
| $35,000 to $49,999 | 0 (0.0%) | 0 (0.0%) |
| $50,000 to $74,999 | 93 (24.3%) | 0 (0.0%) |
| $75,000 to $99,999 | 87 (22.8%) | 0 (0.0%) |
| $100,000 to $149,999 | 48 (12.6%) | 0 (0.0%) |
| $150,000 or more | 85 (22.3%) | 0 (0.0%) |
| Total | 382 (100.0%) | 55 (100.0%) |
Monthly Housing Cost Tiers in Enterprise
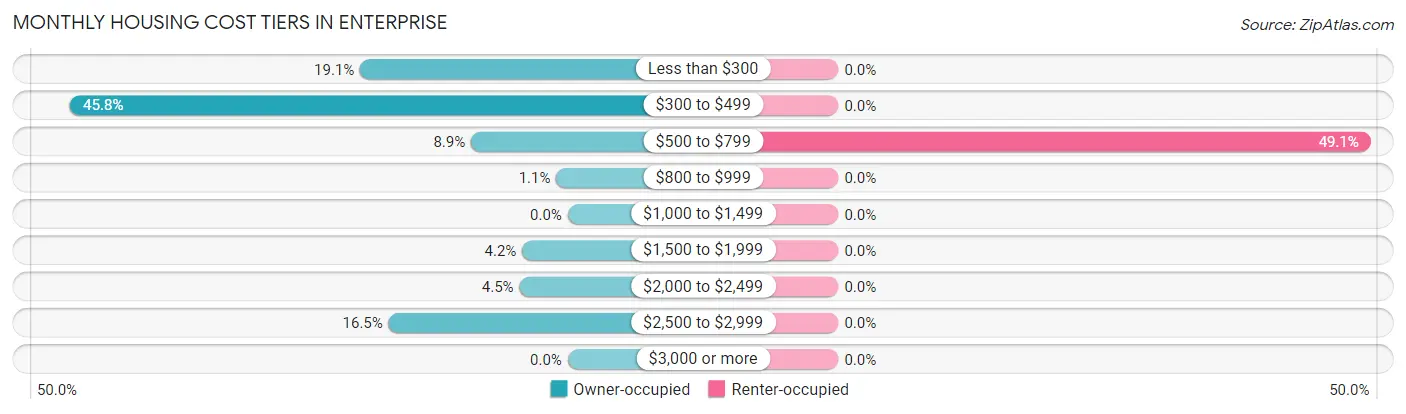
| Monthly Cost | Owner-occupied | Renter-occupied |
| Less than $300 | 73 (19.1%) | 0 (0.0%) |
| $300 to $499 | 175 (45.8%) | 0 (0.0%) |
| $500 to $799 | 34 (8.9%) | 27 (49.1%) |
| $800 to $999 | 4 (1.1%) | 0 (0.0%) |
| $1,000 to $1,499 | 0 (0.0%) | 0 (0.0%) |
| $1,500 to $1,999 | 16 (4.2%) | 0 (0.0%) |
| $2,000 to $2,499 | 17 (4.4%) | 0 (0.0%) |
| $2,500 to $2,999 | 63 (16.5%) | 0 (0.0%) |
| $3,000 or more | 0 (0.0%) | 0 (0.0%) |
| Total | 382 (100.0%) | 55 (100.0%) |
Physical Housing Characteristics in Enterprise
Housing Structures in Enterprise
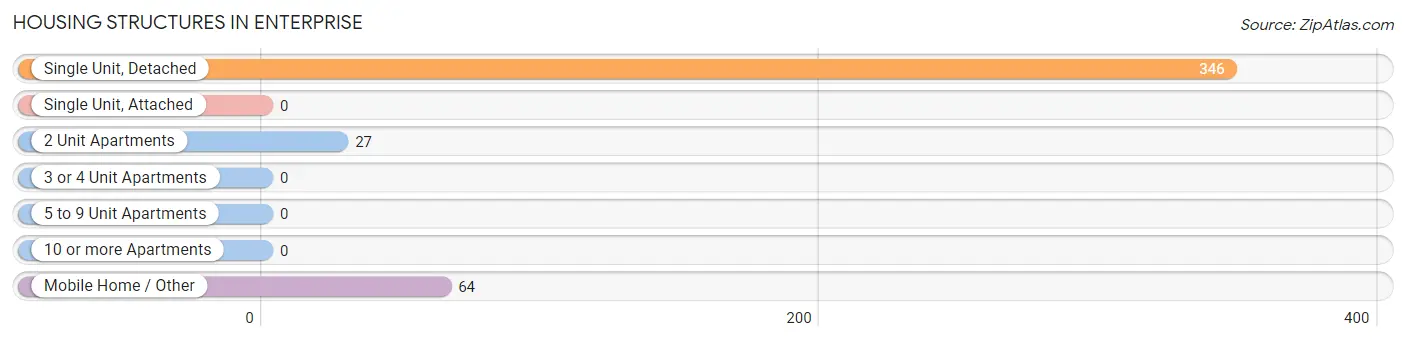
| Structure Type | # Housing Units | % Housing Units |
| Single Unit, Detached | 346 | 79.2% |
| Single Unit, Attached | 0 | 0.0% |
| 2 Unit Apartments | 27 | 6.2% |
| 3 or 4 Unit Apartments | 0 | 0.0% |
| 5 to 9 Unit Apartments | 0 | 0.0% |
| 10 or more Apartments | 0 | 0.0% |
| Mobile Home / Other | 64 | 14.6% |
| Total | 437 | 100.0% |
Housing Structures by Occupancy in Enterprise
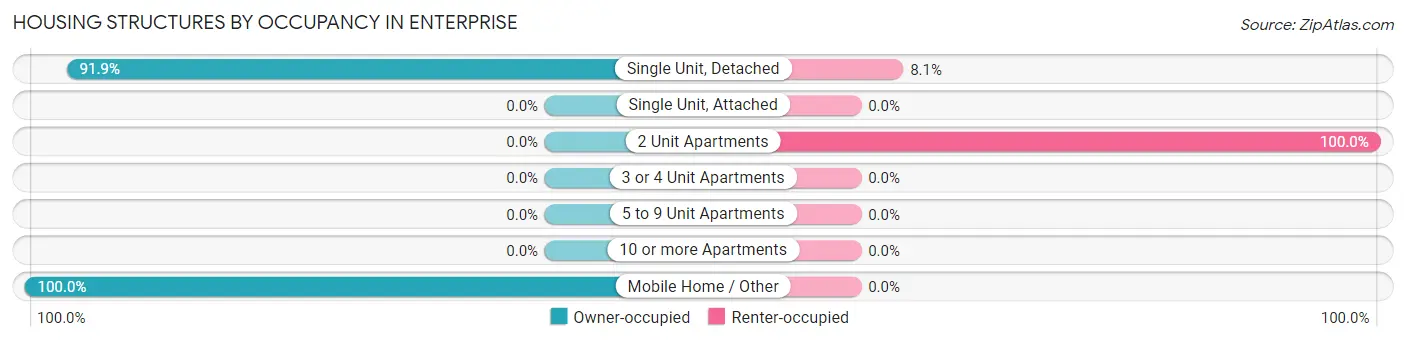
| Structure Type | Owner-occupied | Renter-occupied |
| Single Unit, Detached | 318 (91.9%) | 28 (8.1%) |
| Single Unit, Attached | 0 (0.0%) | 0 (0.0%) |
| 2 Unit Apartments | 0 (0.0%) | 27 (100.0%) |
| 3 or 4 Unit Apartments | 0 (0.0%) | 0 (0.0%) |
| 5 to 9 Unit Apartments | 0 (0.0%) | 0 (0.0%) |
| 10 or more Apartments | 0 (0.0%) | 0 (0.0%) |
| Mobile Home / Other | 64 (100.0%) | 0 (0.0%) |
| Total | 382 (87.4%) | 55 (12.6%) |
Housing Structures by Number of Rooms in Enterprise
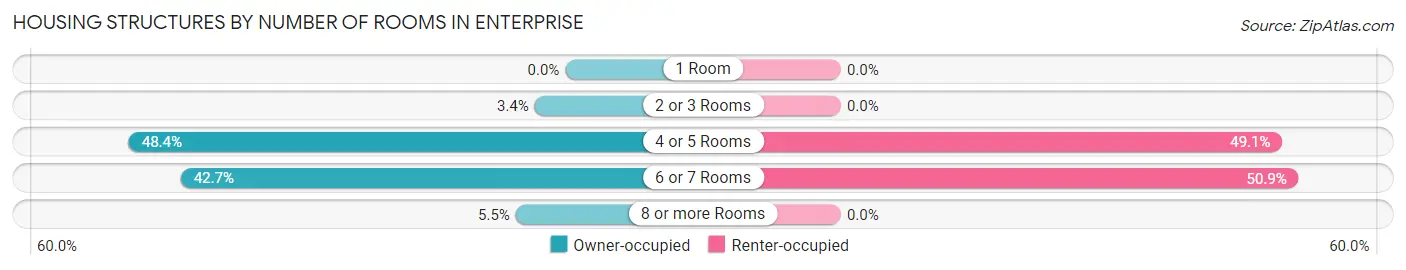
| Number of Rooms | Owner-occupied | Renter-occupied |
| 1 Room | 0 (0.0%) | 0 (0.0%) |
| 2 or 3 Rooms | 13 (3.4%) | 0 (0.0%) |
| 4 or 5 Rooms | 185 (48.4%) | 27 (49.1%) |
| 6 or 7 Rooms | 163 (42.7%) | 28 (50.9%) |
| 8 or more Rooms | 21 (5.5%) | 0 (0.0%) |
| Total | 382 (100.0%) | 55 (100.0%) |
Housing Structure by Heating Type in Enterprise
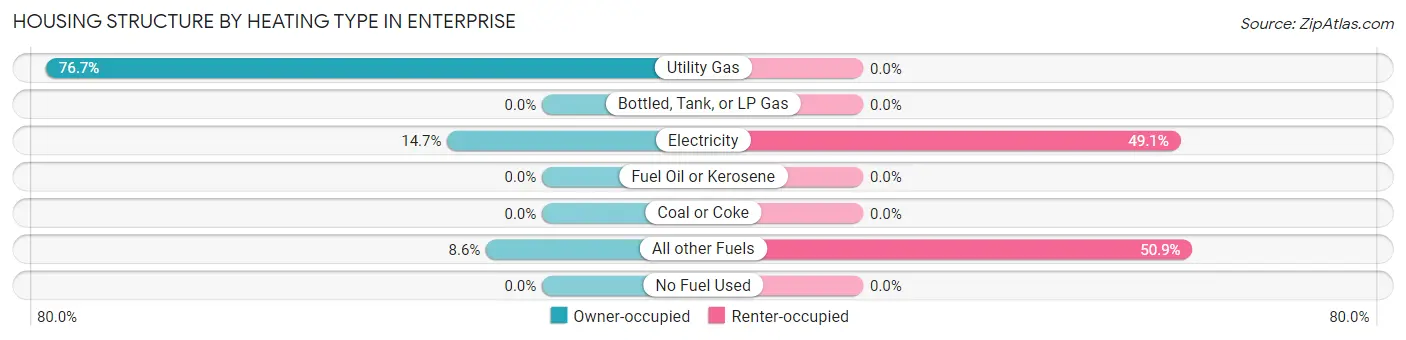
| Heating Type | Owner-occupied | Renter-occupied |
| Utility Gas | 293 (76.7%) | 0 (0.0%) |
| Bottled, Tank, or LP Gas | 0 (0.0%) | 0 (0.0%) |
| Electricity | 56 (14.7%) | 27 (49.1%) |
| Fuel Oil or Kerosene | 0 (0.0%) | 0 (0.0%) |
| Coal or Coke | 0 (0.0%) | 0 (0.0%) |
| All other Fuels | 33 (8.6%) | 28 (50.9%) |
| No Fuel Used | 0 (0.0%) | 0 (0.0%) |
| Total | 382 (100.0%) | 55 (100.0%) |
Household Vehicle Usage in Enterprise
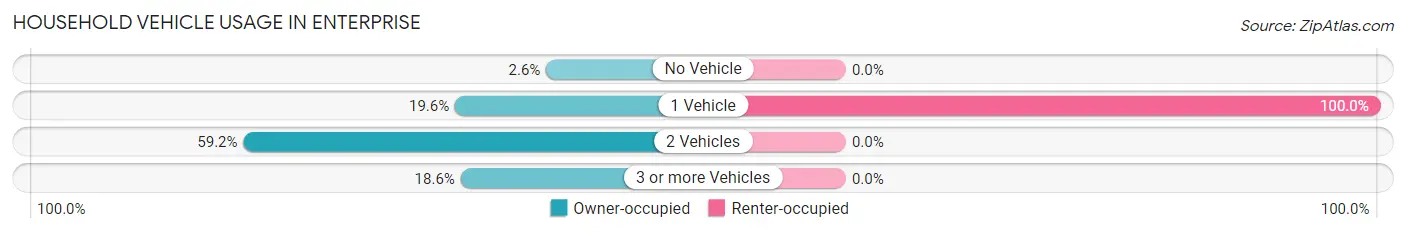
| Vehicles per Household | Owner-occupied | Renter-occupied |
| No Vehicle | 10 (2.6%) | 0 (0.0%) |
| 1 Vehicle | 75 (19.6%) | 55 (100.0%) |
| 2 Vehicles | 226 (59.2%) | 0 (0.0%) |
| 3 or more Vehicles | 71 (18.6%) | 0 (0.0%) |
| Total | 382 (100.0%) | 55 (100.0%) |
Real Estate & Mortgages in Enterprise
Real Estate and Mortgage Overview in Enterprise
| Characteristic | Without Mortgage | With Mortgage |
| Housing Units | 282 | 100 |
| Median Property Value | $87,000 | $320,600 |
| Median Household Income | $56,844 | $80 |
| Monthly Housing Costs | $370 | $0 |
| Real Estate Taxes | $472 | $0 |
Property Value by Mortgage Status in Enterprise
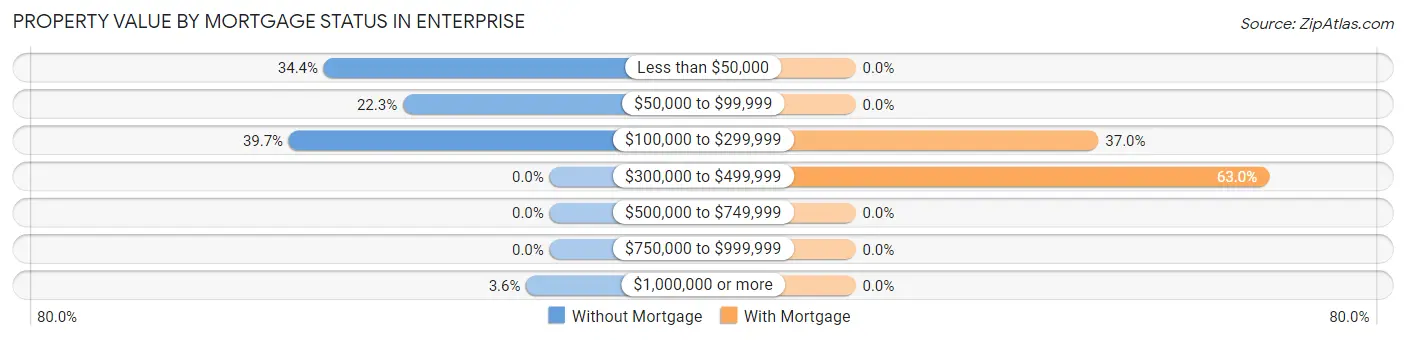
| Property Value | Without Mortgage | With Mortgage |
| Less than $50,000 | 97 (34.4%) | 0 (0.0%) |
| $50,000 to $99,999 | 63 (22.3%) | 0 (0.0%) |
| $100,000 to $299,999 | 112 (39.7%) | 37 (37.0%) |
| $300,000 to $499,999 | 0 (0.0%) | 63 (63.0%) |
| $500,000 to $749,999 | 0 (0.0%) | 0 (0.0%) |
| $750,000 to $999,999 | 0 (0.0%) | 0 (0.0%) |
| $1,000,000 or more | 10 (3.5%) | 0 (0.0%) |
| Total | 282 (100.0%) | 100 (100.0%) |
Household Income by Mortgage Status in Enterprise
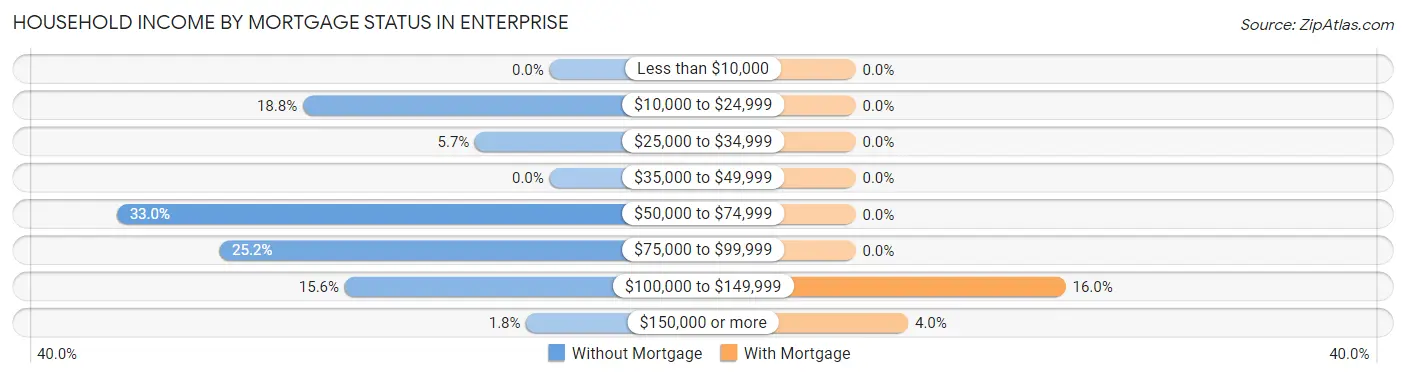
| Household Income | Without Mortgage | With Mortgage |
| Less than $10,000 | 0 (0.0%) | 0 (0.0%) |
| $10,000 to $24,999 | 53 (18.8%) | 0 (0.0%) |
| $25,000 to $34,999 | 16 (5.7%) | 0 (0.0%) |
| $35,000 to $49,999 | 0 (0.0%) | 0 (0.0%) |
| $50,000 to $74,999 | 93 (33.0%) | 0 (0.0%) |
| $75,000 to $99,999 | 71 (25.2%) | 0 (0.0%) |
| $100,000 to $149,999 | 44 (15.6%) | 16 (16.0%) |
| $150,000 or more | 5 (1.8%) | 4 (4.0%) |
| Total | 282 (100.0%) | 100 (100.0%) |
Property Value to Household Income Ratio in Enterprise
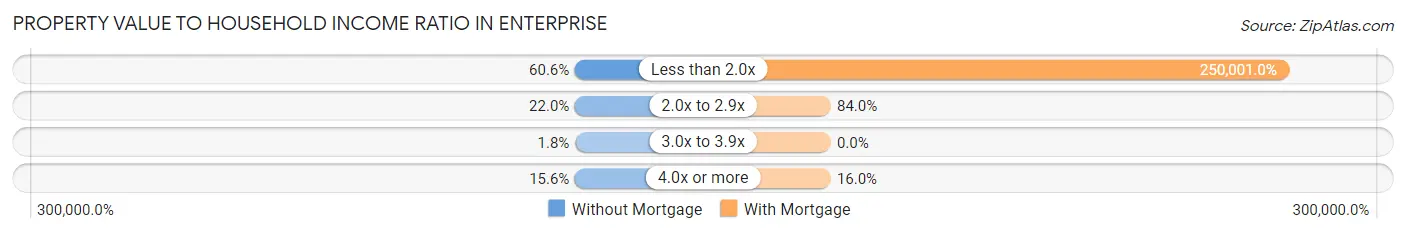
| Value-to-Income Ratio | Without Mortgage | With Mortgage |
| Less than 2.0x | 171 (60.6%) | 250,001 (250,001.0%) |
| 2.0x to 2.9x | 62 (22.0%) | 84 (84.0%) |
| 3.0x to 3.9x | 5 (1.8%) | 0 (0.0%) |
| 4.0x or more | 44 (15.6%) | 16 (16.0%) |
| Total | 282 (100.0%) | 100 (100.0%) |
Real Estate Taxes by Mortgage Status in Enterprise
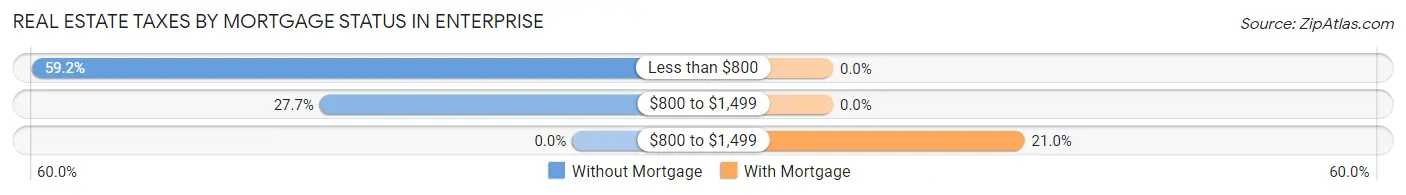
| Property Taxes | Without Mortgage | With Mortgage |
| Less than $800 | 167 (59.2%) | 0 (0.0%) |
| $800 to $1,499 | 78 (27.7%) | 0 (0.0%) |
| $800 to $1,499 | 0 (0.0%) | 21 (21.0%) |
| Total | 282 (100.0%) | 100 (100.0%) |
Health & Disability in Enterprise
Health Insurance Coverage by Age in Enterprise
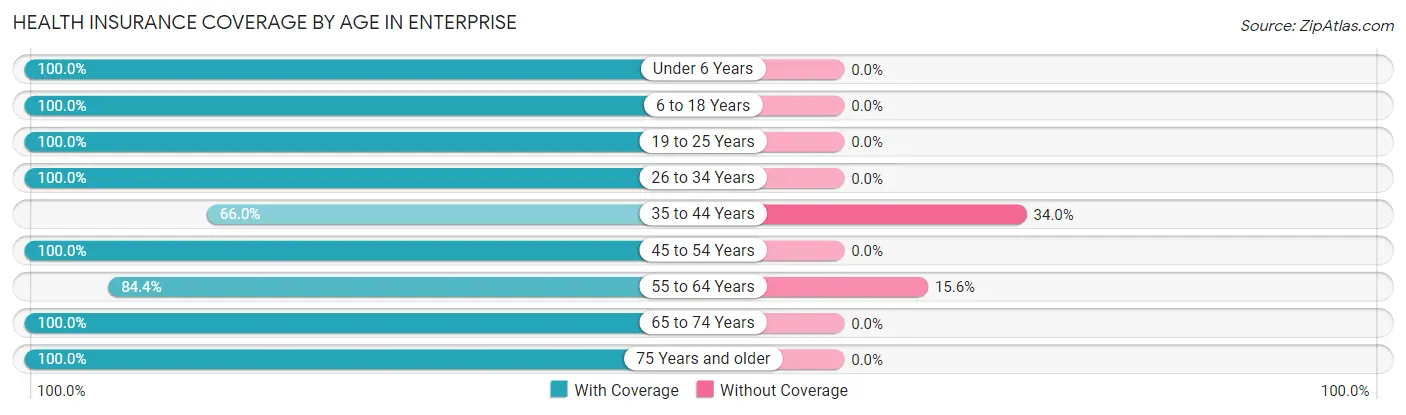
| Age Bracket | With Coverage | Without Coverage |
| Under 6 Years | 72 (100.0%) | 0 (0.0%) |
| 6 to 18 Years | 186 (100.0%) | 0 (0.0%) |
| 19 to 25 Years | 61 (100.0%) | 0 (0.0%) |
| 26 to 34 Years | 60 (100.0%) | 0 (0.0%) |
| 35 to 44 Years | 66 (66.0%) | 34 (34.0%) |
| 45 to 54 Years | 135 (100.0%) | 0 (0.0%) |
| 55 to 64 Years | 211 (84.4%) | 39 (15.6%) |
| 65 to 74 Years | 172 (100.0%) | 0 (0.0%) |
| 75 Years and older | 149 (100.0%) | 0 (0.0%) |
| Total | 1,112 (93.8%) | 73 (6.2%) |
Health Insurance Coverage by Citizenship Status in Enterprise
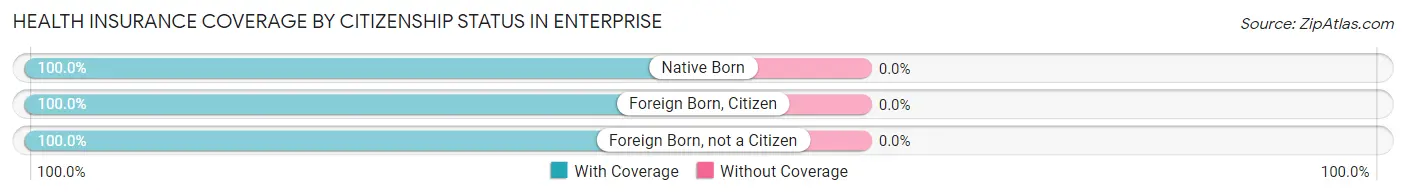
| Citizenship Status | With Coverage | Without Coverage |
| Native Born | 72 (100.0%) | 0 (0.0%) |
| Foreign Born, Citizen | 186 (100.0%) | 0 (0.0%) |
| Foreign Born, not a Citizen | 61 (100.0%) | 0 (0.0%) |
Health Insurance Coverage by Household Income in Enterprise
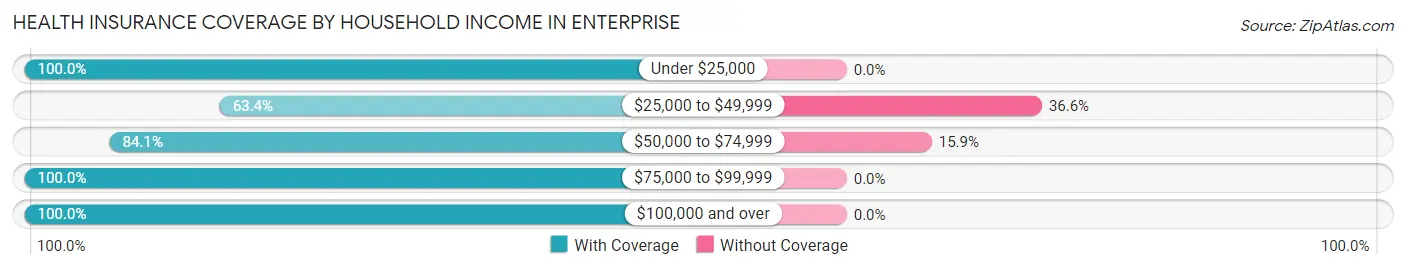
| Household Income | With Coverage | Without Coverage |
| Under $25,000 | 225 (100.0%) | 0 (0.0%) |
| $25,000 to $49,999 | 59 (63.4%) | 34 (36.6%) |
| $50,000 to $74,999 | 206 (84.1%) | 39 (15.9%) |
| $75,000 to $99,999 | 236 (100.0%) | 0 (0.0%) |
| $100,000 and over | 386 (100.0%) | 0 (0.0%) |
Public vs Private Health Insurance Coverage by Age in Enterprise
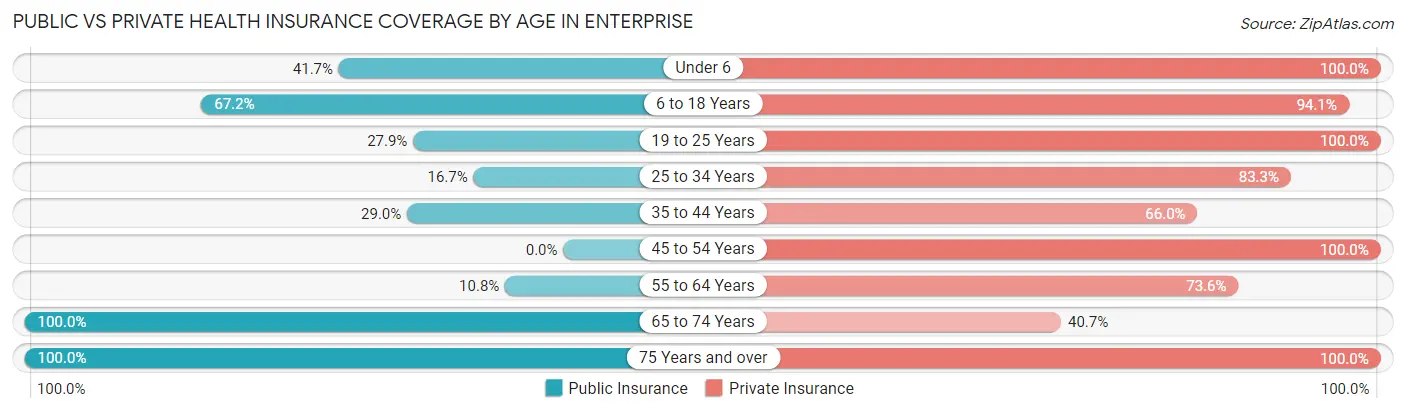
| Age Bracket | Public Insurance | Private Insurance |
| Under 6 | 30 (41.7%) | 72 (100.0%) |
| 6 to 18 Years | 125 (67.2%) | 175 (94.1%) |
| 19 to 25 Years | 17 (27.9%) | 61 (100.0%) |
| 25 to 34 Years | 10 (16.7%) | 50 (83.3%) |
| 35 to 44 Years | 29 (29.0%) | 66 (66.0%) |
| 45 to 54 Years | 0 (0.0%) | 135 (100.0%) |
| 55 to 64 Years | 27 (10.8%) | 184 (73.6%) |
| 65 to 74 Years | 172 (100.0%) | 70 (40.7%) |
| 75 Years and over | 149 (100.0%) | 149 (100.0%) |
| Total | 559 (47.2%) | 962 (81.2%) |
Disability Status by Sex by Age in Enterprise
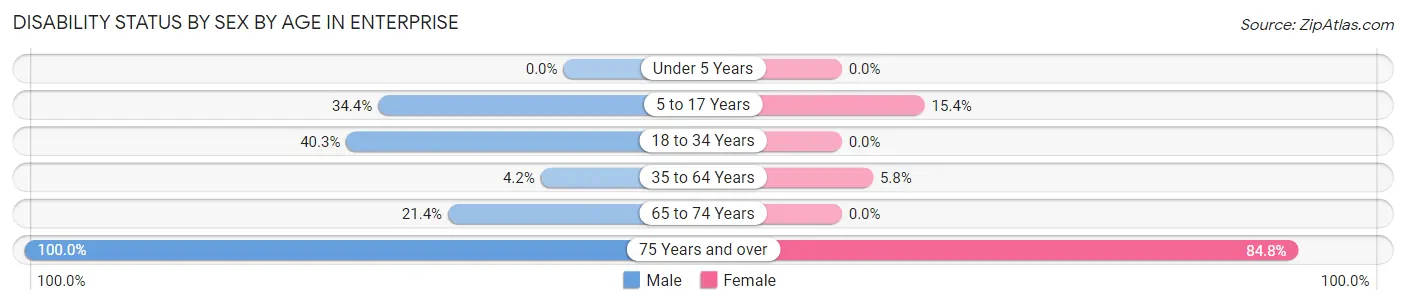
| Age Bracket | Male | Female |
| Under 5 Years | 0 (0.0%) | 0 (0.0%) |
| 5 to 17 Years | 43 (34.4%) | 14 (15.4%) |
| 18 to 34 Years | 27 (40.3%) | 0 (0.0%) |
| 35 to 64 Years | 11 (4.2%) | 13 (5.8%) |
| 65 to 74 Years | 6 (21.4%) | 0 (0.0%) |
| 75 Years and over | 90 (100.0%) | 50 (84.8%) |
Disability Class by Sex by Age in Enterprise
Disability Class: Hearing Difficulty
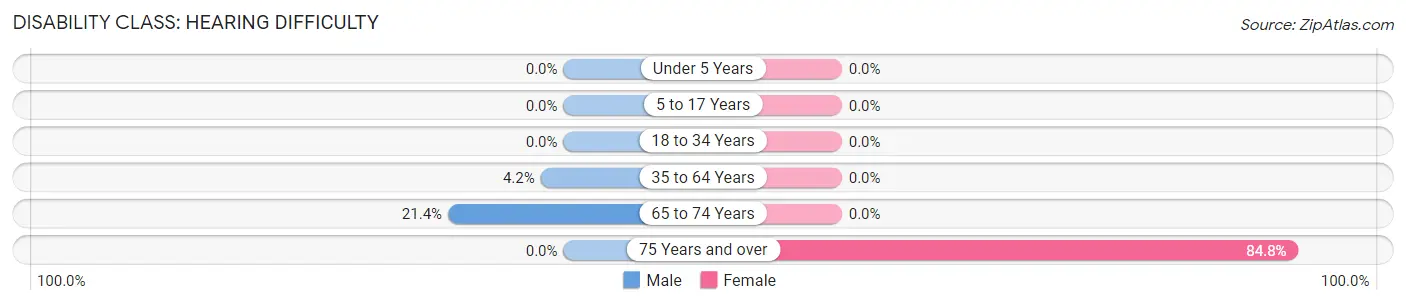
| Age Bracket | Male | Female |
| Under 5 Years | 0 (0.0%) | 0 (0.0%) |
| 5 to 17 Years | 0 (0.0%) | 0 (0.0%) |
| 18 to 34 Years | 0 (0.0%) | 0 (0.0%) |
| 35 to 64 Years | 11 (4.2%) | 0 (0.0%) |
| 65 to 74 Years | 6 (21.4%) | 0 (0.0%) |
| 75 Years and over | 0 (0.0%) | 50 (84.8%) |
Disability Class: Vision Difficulty
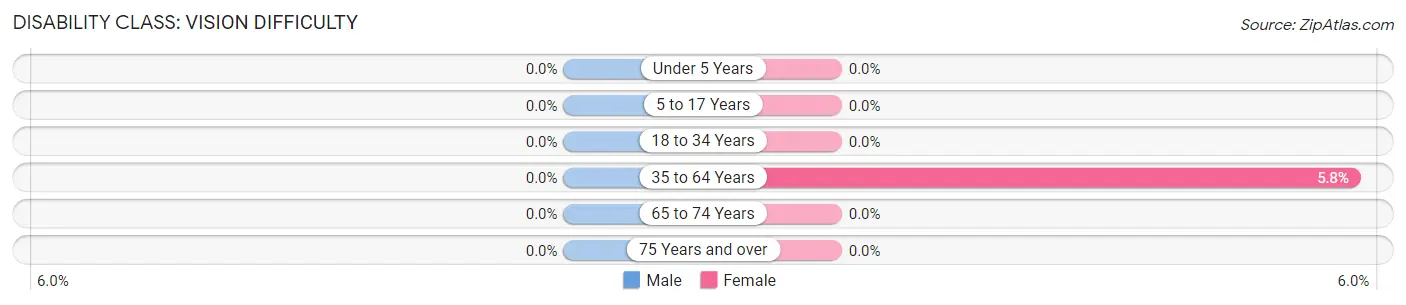
| Age Bracket | Male | Female |
| Under 5 Years | 0 (0.0%) | 0 (0.0%) |
| 5 to 17 Years | 0 (0.0%) | 0 (0.0%) |
| 18 to 34 Years | 0 (0.0%) | 0 (0.0%) |
| 35 to 64 Years | 0 (0.0%) | 13 (5.8%) |
| 65 to 74 Years | 0 (0.0%) | 0 (0.0%) |
| 75 Years and over | 0 (0.0%) | 0 (0.0%) |
Disability Class: Cognitive Difficulty
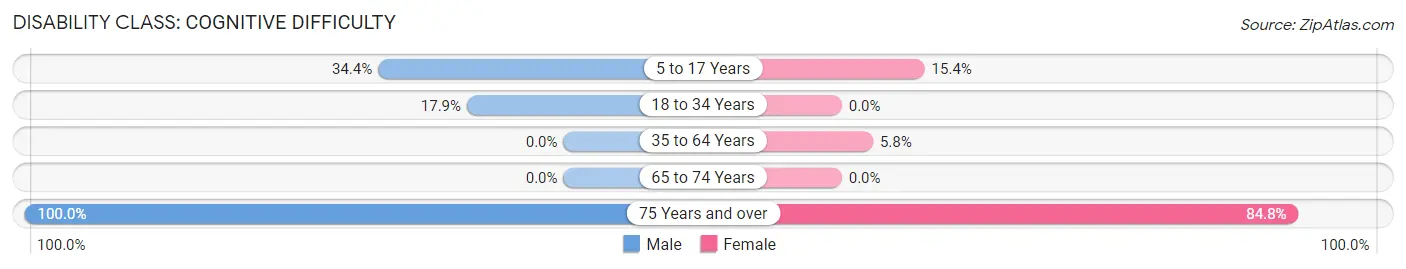
| Age Bracket | Male | Female |
| 5 to 17 Years | 43 (34.4%) | 14 (15.4%) |
| 18 to 34 Years | 12 (17.9%) | 0 (0.0%) |
| 35 to 64 Years | 0 (0.0%) | 13 (5.8%) |
| 65 to 74 Years | 0 (0.0%) | 0 (0.0%) |
| 75 Years and over | 90 (100.0%) | 50 (84.8%) |
Disability Class: Ambulatory Difficulty
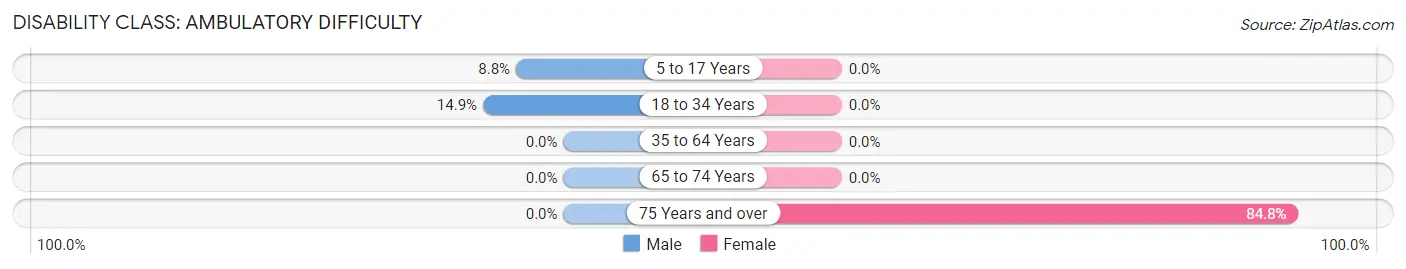
| Age Bracket | Male | Female |
| 5 to 17 Years | 11 (8.8%) | 0 (0.0%) |
| 18 to 34 Years | 10 (14.9%) | 0 (0.0%) |
| 35 to 64 Years | 0 (0.0%) | 0 (0.0%) |
| 65 to 74 Years | 0 (0.0%) | 0 (0.0%) |
| 75 Years and over | 0 (0.0%) | 50 (84.8%) |
Disability Class: Self-Care Difficulty

| Age Bracket | Male | Female |
| 5 to 17 Years | 11 (8.8%) | 0 (0.0%) |
| 18 to 34 Years | 12 (17.9%) | 0 (0.0%) |
| 35 to 64 Years | 0 (0.0%) | 0 (0.0%) |
| 65 to 74 Years | 0 (0.0%) | 0 (0.0%) |
| 75 Years and over | 0 (0.0%) | 50 (84.8%) |
Technology Access in Enterprise
Computing Device Access in Enterprise
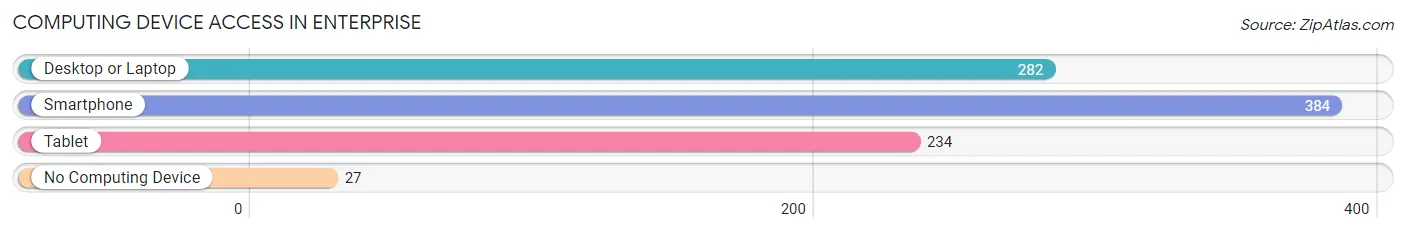
| Device Type | # Households | % Households |
| Desktop or Laptop | 282 | 64.5% |
| Smartphone | 384 | 87.9% |
| Tablet | 234 | 53.5% |
| No Computing Device | 27 | 6.2% |
| Total | 437 | 100.0% |
Internet Access in Enterprise
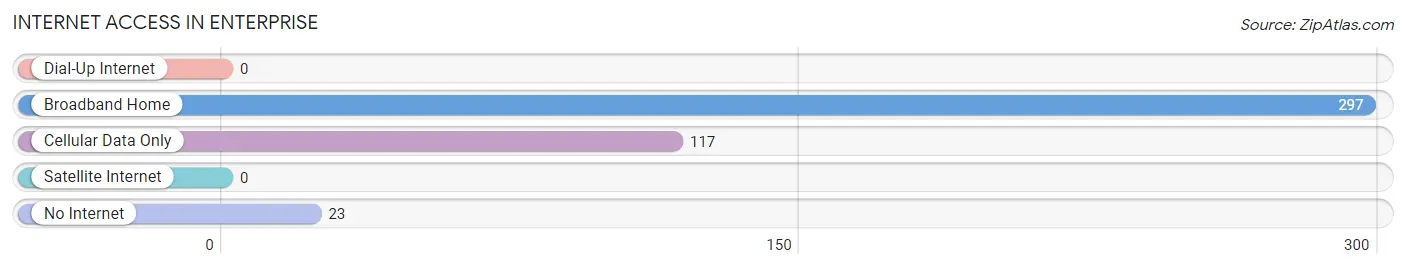
| Internet Type | # Households | % Households |
| Dial-Up Internet | 0 | 0.0% |
| Broadband Home | 297 | 68.0% |
| Cellular Data Only | 117 | 26.8% |
| Satellite Internet | 0 | 0.0% |
| No Internet | 23 | 5.3% |
| Total | 437 | 100.0% |
Enterprise Summary
Enterprise is a small town located in the eastern panhandle of West Virginia. It is situated in the Appalachian Mountains and is part of the Potomac Highlands region. The town is located in Hampshire County and is bordered by the towns of Capon Bridge, Romney, and Springfield. The population of Enterprise was 1,093 as of the 2010 census.
Geography
Enterprise is located at 39°14'45"N 78°37'45"W (39.245833, -78.629167). According to the United States Census Bureau, the town has a total area of 0.3 square miles (0.8 km2), all of it land.
The town is situated in the Appalachian Mountains and is part of the Potomac Highlands region. The town is located in Hampshire County and is bordered by the towns of Capon Bridge, Romney, and Springfield.
History
The town of Enterprise was founded in 1817 by a group of settlers from Pennsylvania. The town was named after the USS Enterprise, a ship that was part of the United States Navy during the War of 1812. The town was incorporated in 1819 and has remained a small, rural community ever since.
The town was an important stop on the Northwestern Turnpike, which connected Winchester, Virginia to Parkersburg, West Virginia. The turnpike was an important transportation route for settlers and goods traveling between the two cities.
The town was also an important stop on the Baltimore and Ohio Railroad, which connected Cumberland, Maryland to Parkersburg, West Virginia. The railroad was an important transportation route for goods and passengers traveling between the two cities.
Economy
The economy of Enterprise is largely based on agriculture and tourism. The town is home to several farms, which produce a variety of crops, including corn, wheat, and hay. The town is also home to several small businesses, including a grocery store, a hardware store, and a restaurant.
The town is also a popular tourist destination, due to its proximity to the Appalachian Trail and the Cacapon River. The town is home to several bed and breakfasts, as well as a campground.
Demographics
As of the 2010 census, the population of Enterprise was 1,093. The racial makeup of the town was 97.2% White, 0.7% African American, 0.2% Native American, 0.2% Asian, 0.2% from other races, and 1.7% from two or more races. Hispanic or Latino of any race were 0.7% of the population.
The median income for a household in the town was $35,625, and the median income for a family was $41,250. The per capita income for the town was $17,845. About 11.2% of families and 14.2% of the population were below the poverty line, including 18.2% of those under age 18 and 8.3% of those age 65 or over.
Conclusion
Enterprise is a small town located in the eastern panhandle of West Virginia. It is situated in the Appalachian Mountains and is part of the Potomac Highlands region. The town is located in Hampshire County and is bordered by the towns of Capon Bridge, Romney, and Springfield. The population of Enterprise was 1,093 as of the 2010 census. The economy of Enterprise is largely based on agriculture and tourism. The town is home to several farms, which produce a variety of crops, including corn, wheat, and hay. The town is also home to several small businesses, including a grocery store, a hardware store, and a restaurant. The town is also a popular tourist destination, due to its proximity to the Appalachian Trail and the Cacapon River. The racial makeup of the town was 97.2% White, 0.7% African American, 0.2% Native American, 0.2% Asian, 0.2% from other races, and 1.7% from two or more races. The median income for a household in the town was $35,625, and the median income for a family was $41,250. Enterprise is a small, rural community with a rich history and a vibrant economy.
Common Questions
What is Per Capita Income in Enterprise?
Per Capita income in Enterprise is $43,155.
What is the Median Family Income in Enterprise?
Median Family Income in Enterprise is $83,672.
What is the Median Household income in Enterprise?
Median Household Income in Enterprise is $77,788.
What is Inequality or Gini Index in Enterprise?
Inequality or Gini Index in Enterprise is 0.47.
What is the Total Population of Enterprise?
Total Population of Enterprise is 1,185.
What is the Total Male Population of Enterprise?
Total Male Population of Enterprise is 570.
What is the Total Female Population of Enterprise?
Total Female Population of Enterprise is 615.
What is the Ratio of Males per 100 Females in Enterprise?
There are 92.68 Males per 100 Females in Enterprise.
What is the Ratio of Females per 100 Males in Enterprise?
There are 107.89 Females per 100 Males in Enterprise.
What is the Median Population Age in Enterprise?
Median Population Age in Enterprise is 53.1 Years.
What is the Average Family Size in Enterprise
Average Family Size in Enterprise is 2.9 People.
What is the Average Household Size in Enterprise
Average Household Size in Enterprise is 2.7 People.
How Large is the Labor Force in Enterprise?
There are 717 People in the Labor Forcein in Enterprise.
What is the Percentage of People in the Labor Force in Enterprise?
74.7% of People are in the Labor Force in Enterprise.
What is the Unemployment Rate in Enterprise?
Unemployment Rate in Enterprise is 10.7%.