Fort Ashby, WV Map & Demographics
Fort Ashby Map
Fort Ashby Overview
$34,618
PER CAPITA INCOME
$76,169
AVG FAMILY INCOME
$41,992
AVG HOUSEHOLD INCOME
71.2%
WAGE / INCOME GAP [ % ]
28.8¢/ $1
WAGE / INCOME GAP [ $ ]
0.49
INEQUALITY / GINI INDEX
1,174
TOTAL POPULATION
537
MALE POPULATION
637
FEMALE POPULATION
84.30
MALES / 100 FEMALES
118.62
FEMALES / 100 MALES
50.5
MEDIAN AGE
2.7
AVG FAMILY SIZE
2.0
AVG HOUSEHOLD SIZE
640
LABOR FORCE [ PEOPLE ]
56.3%
PERCENT IN LABOR FORCE
Fort Ashby Zip Codes
Fort Ashby Area Codes
Income in Fort Ashby
Income Overview in Fort Ashby
Per Capita Income in Fort Ashby is $34,618, while median incomes of families and households are $76,169 and $41,992 respectively.
| Characteristic | Number | Measure |
| Per Capita Income | 1,174 | $34,618 |
| Median Family Income | 323 | $76,169 |
| Mean Family Income | 323 | $98,518 |
| Median Household Income | 596 | $41,992 |
| Mean Household Income | 596 | $66,021 |
| Income Deficit | 323 | $0 |
| Wage / Income Gap (%) | 1,174 | 71.21% |
| Wage / Income Gap ($) | 1,174 | 28.79¢ per $1 |
| Gini / Inequality Index | 1,174 | 0.49 |
Earnings by Sex in Fort Ashby
Average Earnings in Fort Ashby are $27,587, $70,824 for men and $20,389 for women, a difference of 71.2%.
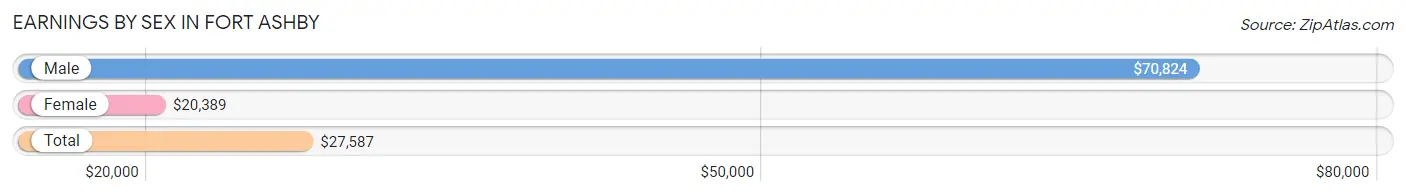
| Sex | Number | Average Earnings |
| Male | 235 (36.8%) | $70,824 |
| Female | 404 (63.2%) | $20,389 |
| Total | 639 (100.0%) | $27,587 |
Earnings by Sex by Income Bracket in Fort Ashby
The most common earnings brackets in Fort Ashby are $22,500 to $24,999 for men (70 | 29.8%) and $2,499 or less for women (101 | 25.0%).
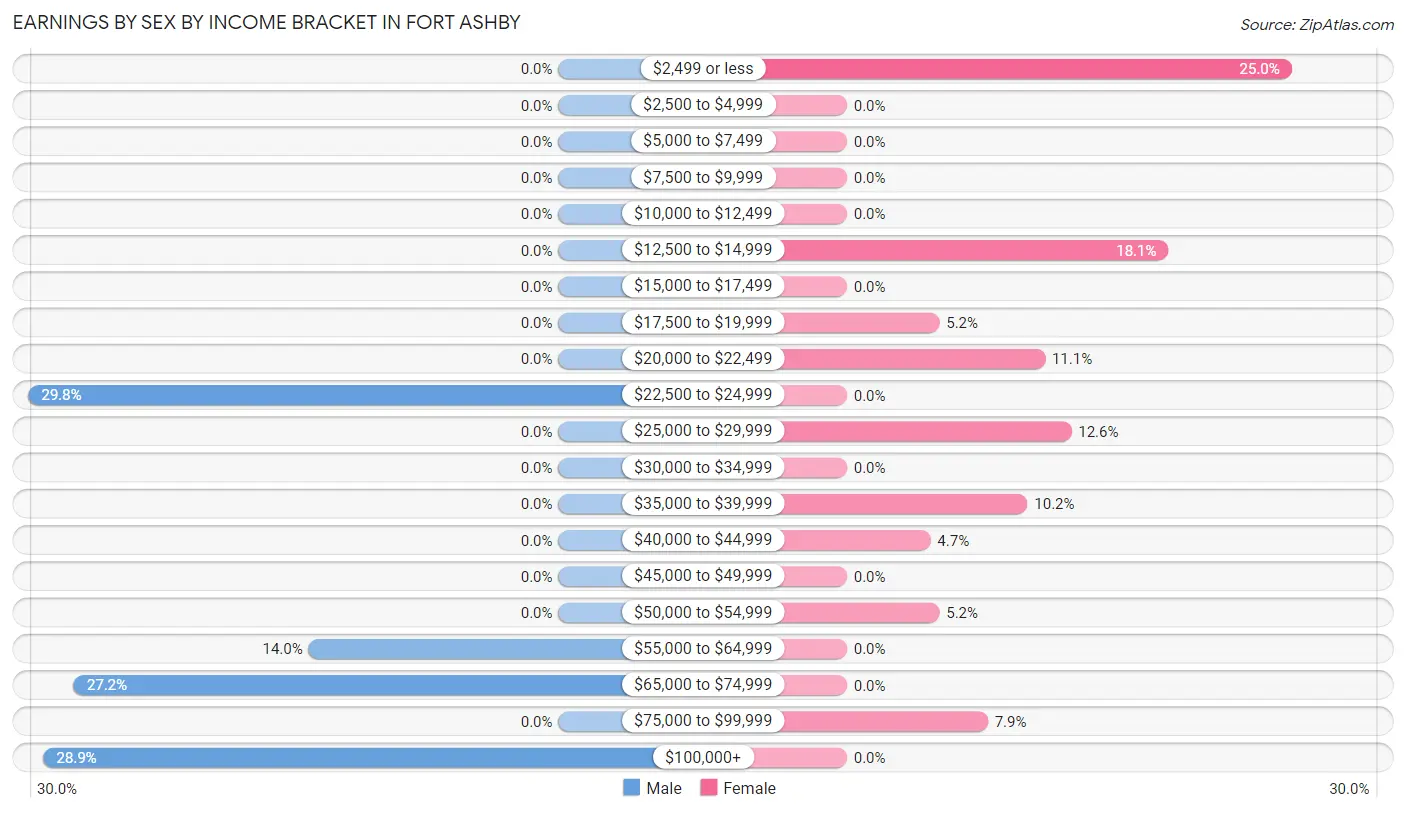
| Income | Male | Female |
| $2,499 or less | 0 (0.0%) | 101 (25.0%) |
| $2,500 to $4,999 | 0 (0.0%) | 0 (0.0%) |
| $5,000 to $7,499 | 0 (0.0%) | 0 (0.0%) |
| $7,500 to $9,999 | 0 (0.0%) | 0 (0.0%) |
| $10,000 to $12,499 | 0 (0.0%) | 0 (0.0%) |
| $12,500 to $14,999 | 0 (0.0%) | 73 (18.1%) |
| $15,000 to $17,499 | 0 (0.0%) | 0 (0.0%) |
| $17,500 to $19,999 | 0 (0.0%) | 21 (5.2%) |
| $20,000 to $22,499 | 0 (0.0%) | 45 (11.1%) |
| $22,500 to $24,999 | 70 (29.8%) | 0 (0.0%) |
| $25,000 to $29,999 | 0 (0.0%) | 51 (12.6%) |
| $30,000 to $34,999 | 0 (0.0%) | 0 (0.0%) |
| $35,000 to $39,999 | 0 (0.0%) | 41 (10.2%) |
| $40,000 to $44,999 | 0 (0.0%) | 19 (4.7%) |
| $45,000 to $49,999 | 0 (0.0%) | 0 (0.0%) |
| $50,000 to $54,999 | 0 (0.0%) | 21 (5.2%) |
| $55,000 to $64,999 | 33 (14.0%) | 0 (0.0%) |
| $65,000 to $74,999 | 64 (27.2%) | 0 (0.0%) |
| $75,000 to $99,999 | 0 (0.0%) | 32 (7.9%) |
| $100,000+ | 68 (28.9%) | 0 (0.0%) |
| Total | 235 (100.0%) | 404 (100.0%) |
Earnings by Sex by Educational Attainment in Fort Ashby
Average earnings in Fort Ashby are $70,824 for men and $22,056 for women, a difference of 68.9%. Men with an educational attainment of college or associate's degree enjoy the highest average annual earnings of $72,386, while those with high school diploma education earn the least with $24,107. Women with an educational attainment of high school diploma earn the most with the average annual earnings of $20,944, while those with high school diploma education have the smallest earnings of $20,944.
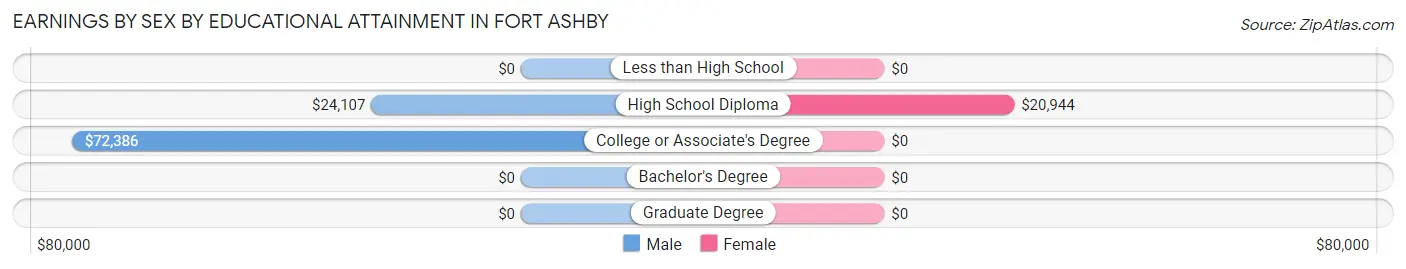
| Educational Attainment | Male Income | Female Income |
| Less than High School | - | - |
| High School Diploma | $24,107 | $20,944 |
| College or Associate's Degree | $72,386 | $0 |
| Bachelor's Degree | - | - |
| Graduate Degree | - | - |
| Total | $70,824 | $22,056 |
Family Income in Fort Ashby
Family Income Brackets in Fort Ashby
According to the Fort Ashby family income data, there are 98 families falling into the $35,000 to $49,999 income range, which is the most common income bracket and makes up 30.3% of all families.
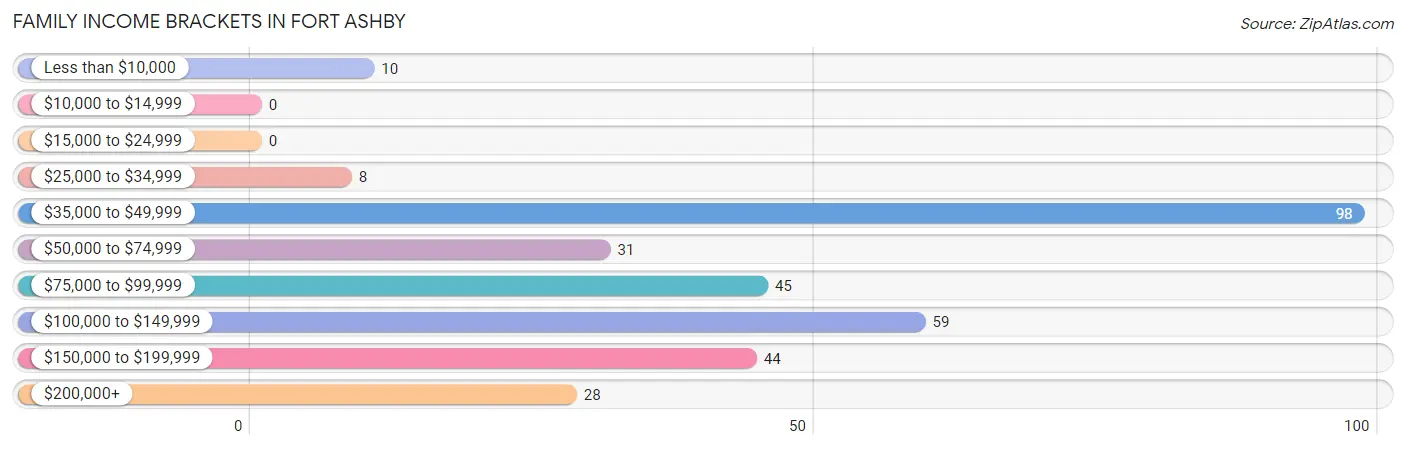
| Income Bracket | # Families | % Families |
| Less than $10,000 | 10 | 3.1% |
| $10,000 to $14,999 | 0 | 0.0% |
| $15,000 to $24,999 | 0 | 0.0% |
| $25,000 to $34,999 | 8 | 2.5% |
| $35,000 to $49,999 | 98 | 30.3% |
| $50,000 to $74,999 | 31 | 9.6% |
| $75,000 to $99,999 | 45 | 13.9% |
| $100,000 to $149,999 | 59 | 18.3% |
| $150,000 to $199,999 | 44 | 13.6% |
| $200,000+ | 28 | 8.7% |
Family Income by Famaliy Size in Fort Ashby
2-person families (214 | 66.2%) account for the highest median family income in Fort Ashby with $46,923 per family, while 2-person families (214 | 66.2%) have the highest median income of $23,462 per family member.
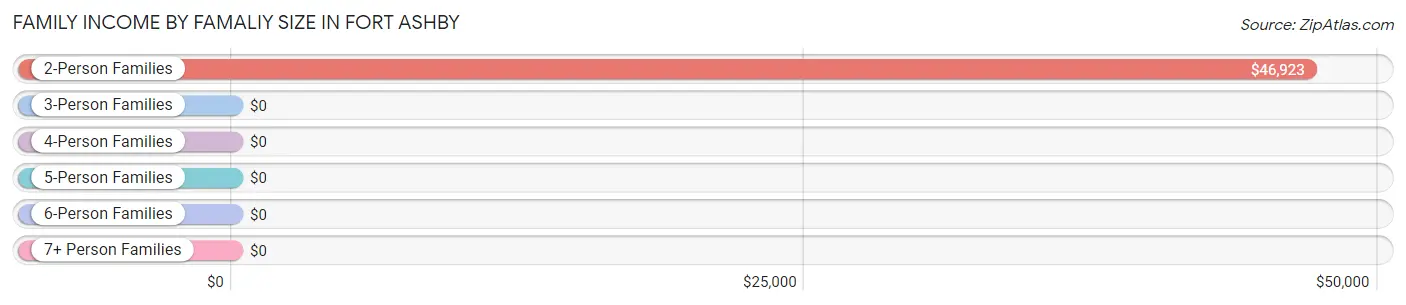
| Income Bracket | # Families | Median Income |
| 2-Person Families | 214 (66.2%) | $46,923 |
| 3-Person Families | 41 (12.7%) | $0 |
| 4-Person Families | 68 (21.0%) | $0 |
| 5-Person Families | 0 (0.0%) | $0 |
| 6-Person Families | 0 (0.0%) | $0 |
| 7+ Person Families | 0 (0.0%) | $0 |
| Total | 323 (100.0%) | $76,169 |
Family Income by Number of Earners in Fort Ashby
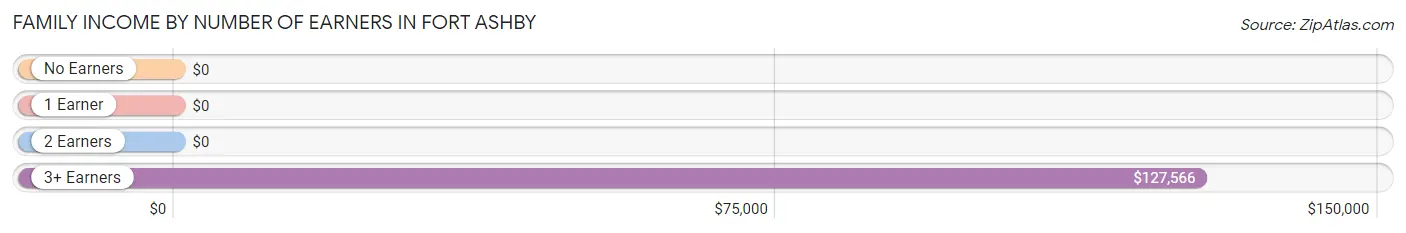
| Number of Earners | # Families | Median Income |
| No Earners | 114 (35.3%) | $0 |
| 1 Earner | 8 (2.5%) | $0 |
| 2 Earners | 120 (37.1%) | $0 |
| 3+ Earners | 81 (25.1%) | $127,566 |
| Total | 323 (100.0%) | $76,169 |
Household Income in Fort Ashby
Household Income Brackets in Fort Ashby
With 109 households falling in the category, the $10,000 to $14,999 income range is the most frequent in Fort Ashby, accounting for 18.3% of all households. In contrast, only 10 households (1.7%) fall into the less than $10,000 income bracket, making it the least populous group.
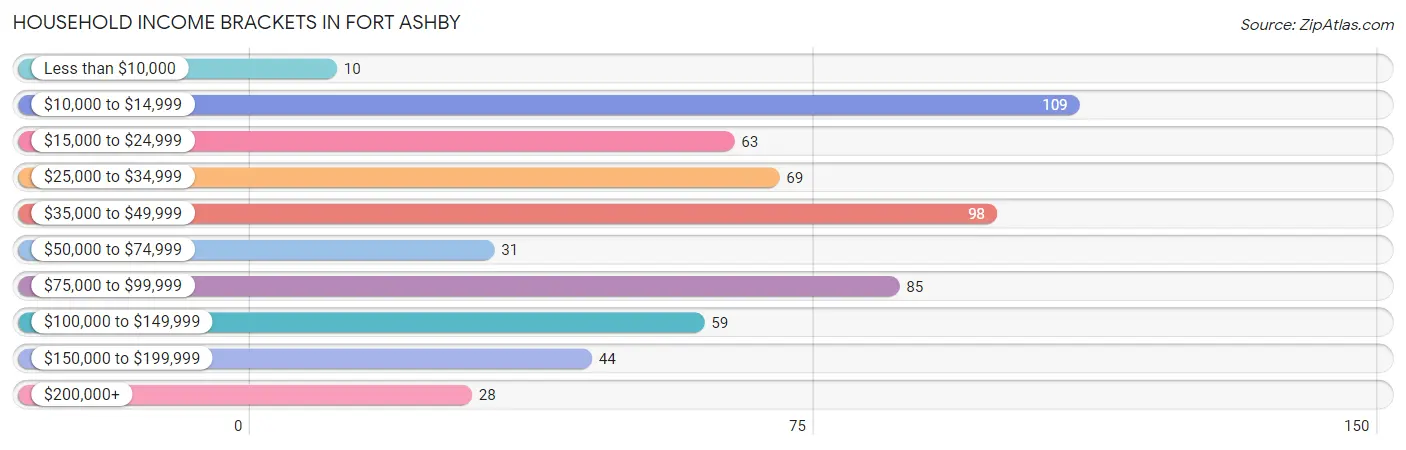
| Income Bracket | # Households | % Households |
| Less than $10,000 | 10 | 1.7% |
| $10,000 to $14,999 | 109 | 18.3% |
| $15,000 to $24,999 | 63 | 10.6% |
| $25,000 to $34,999 | 69 | 11.6% |
| $35,000 to $49,999 | 98 | 16.4% |
| $50,000 to $74,999 | 31 | 5.2% |
| $75,000 to $99,999 | 85 | 14.3% |
| $100,000 to $149,999 | 59 | 9.9% |
| $150,000 to $199,999 | 44 | 7.4% |
| $200,000+ | 28 | 4.7% |
Household Income by Householder Age in Fort Ashby
| Income Bracket | # Households | Median Income |
| 15 to 24 Years | 31 (5.2%) | $0 |
| 25 to 44 Years | 96 (16.1%) | $0 |
| 45 to 64 Years | 189 (31.7%) | $0 |
| 65+ Years | 280 (47.0%) | $0 |
| Total | 596 (100.0%) | $41,992 |
Poverty in Fort Ashby
Income Below Poverty by Sex and Age in Fort Ashby
With 6.0% poverty level for males and 18.7% for females among the residents of Fort Ashby, 55 to 64 year old males and 55 to 64 year old females are the most vulnerable to poverty, with 16 males (44.4%) and 37 females (66.1%) in their respective age groups living below the poverty level.
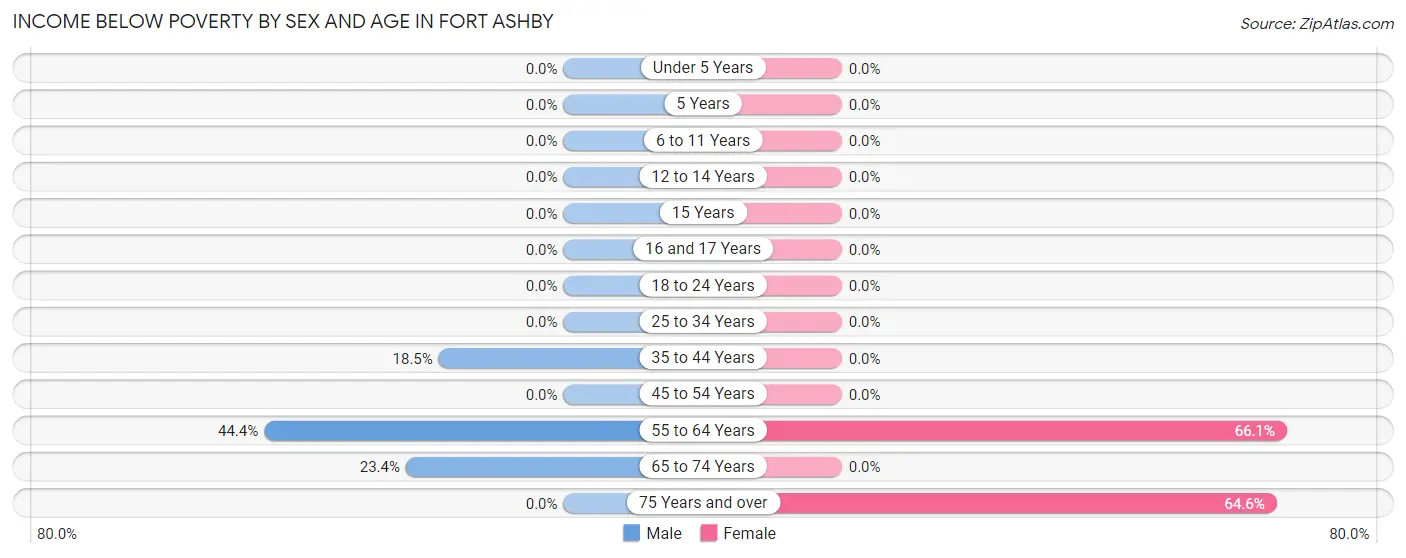
| Age Bracket | Male | Female |
| Under 5 Years | 0 (0.0%) | 0 (0.0%) |
| 5 Years | 0 (0.0%) | 0 (0.0%) |
| 6 to 11 Years | 0 (0.0%) | 0 (0.0%) |
| 12 to 14 Years | 0 (0.0%) | 0 (0.0%) |
| 15 Years | 0 (0.0%) | 0 (0.0%) |
| 16 and 17 Years | 0 (0.0%) | 0 (0.0%) |
| 18 to 24 Years | 0 (0.0%) | 0 (0.0%) |
| 25 to 34 Years | 0 (0.0%) | 0 (0.0%) |
| 35 to 44 Years | 5 (18.5%) | 0 (0.0%) |
| 45 to 54 Years | 0 (0.0%) | 0 (0.0%) |
| 55 to 64 Years | 16 (44.4%) | 37 (66.1%) |
| 65 to 74 Years | 11 (23.4%) | 0 (0.0%) |
| 75 Years and over | 0 (0.0%) | 82 (64.6%) |
| Total | 32 (6.0%) | 119 (18.7%) |
Income Above Poverty by Sex and Age in Fort Ashby
According to the poverty statistics in Fort Ashby, males aged 12 to 14 years and females aged 6 to 11 years are the age groups that are most secure financially, with 100.0% of males and 100.0% of females in these age groups living above the poverty line.
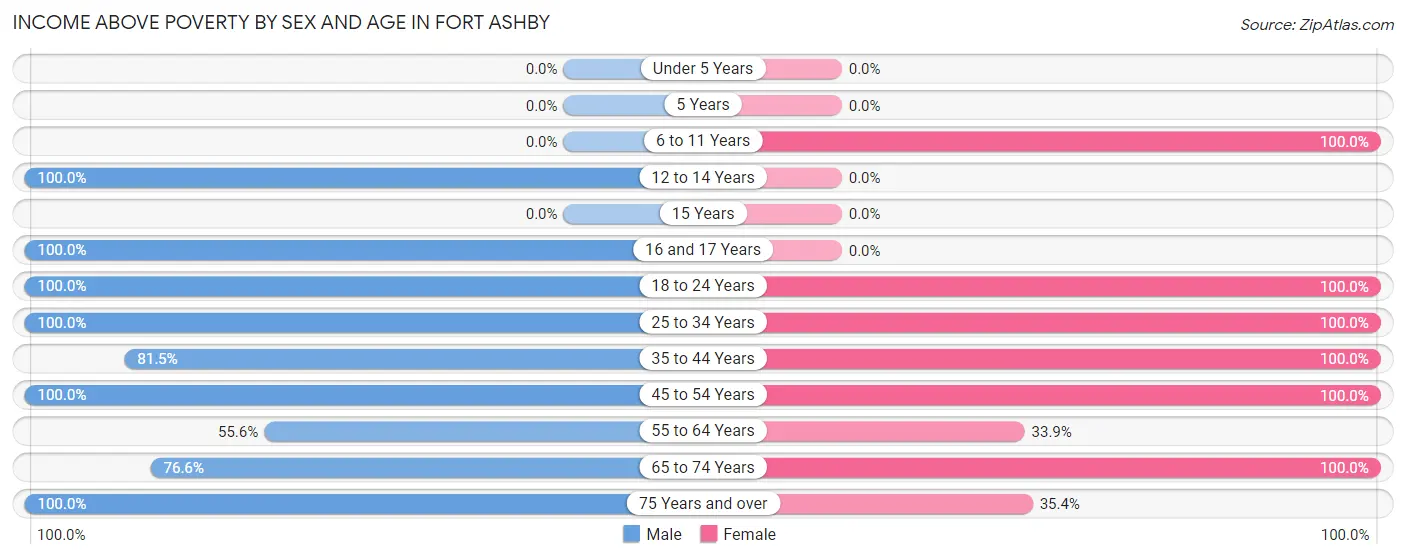
| Age Bracket | Male | Female |
| Under 5 Years | 0 (0.0%) | 0 (0.0%) |
| 5 Years | 0 (0.0%) | 0 (0.0%) |
| 6 to 11 Years | 0 (0.0%) | 8 (100.0%) |
| 12 to 14 Years | 30 (100.0%) | 0 (0.0%) |
| 15 Years | 0 (0.0%) | 0 (0.0%) |
| 16 and 17 Years | 30 (100.0%) | 0 (0.0%) |
| 18 to 24 Years | 54 (100.0%) | 142 (100.0%) |
| 25 to 34 Years | 64 (100.0%) | 79 (100.0%) |
| 35 to 44 Years | 22 (81.5%) | 21 (100.0%) |
| 45 to 54 Years | 125 (100.0%) | 122 (100.0%) |
| 55 to 64 Years | 20 (55.6%) | 19 (33.9%) |
| 65 to 74 Years | 36 (76.6%) | 82 (100.0%) |
| 75 Years and over | 124 (100.0%) | 45 (35.4%) |
| Total | 505 (94.0%) | 518 (81.3%) |
Income Below Poverty Among Married-Couple Families in Fort Ashby
The poverty statistics for married-couple families in Fort Ashby show that 3.2% or 10 of the total 315 families live below the poverty line. Families with no children have the highest poverty rate of 4.1%, comprising of 10 families. On the other hand, families with 1 or 2 children have the lowest poverty rate of 0.0%, which includes 0 families.
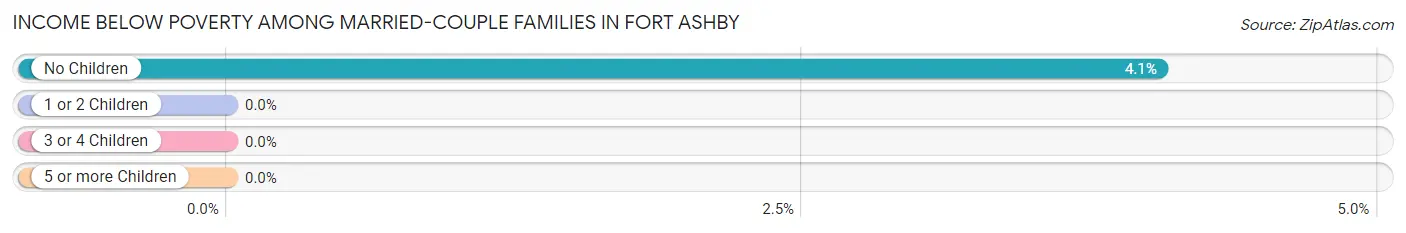
| Children | Above Poverty | Below Poverty |
| No Children | 237 (96.0%) | 10 (4.1%) |
| 1 or 2 Children | 68 (100.0%) | 0 (0.0%) |
| 3 or 4 Children | 0 (0.0%) | 0 (0.0%) |
| 5 or more Children | 0 (0.0%) | 0 (0.0%) |
| Total | 305 (96.8%) | 10 (3.2%) |
Income Below Poverty Among Single-Parent Households in Fort Ashby
| Children | Single Father | Single Mother |
| No Children | 0 (0.0%) | 0 (0.0%) |
| 1 or 2 Children | 0 (0.0%) | 0 (0.0%) |
| 3 or 4 Children | 0 (0.0%) | 0 (0.0%) |
| 5 or more Children | 0 (0.0%) | 0 (0.0%) |
| Total | 0 (0.0%) | 0 (0.0%) |
Income Below Poverty Among Married-Couple vs Single-Parent Households in Fort Ashby
| Children | Married-Couple Families | Single-Parent Households |
| No Children | 10 (4.1%) | 0 (0.0%) |
| 1 or 2 Children | 0 (0.0%) | 0 (0.0%) |
| 3 or 4 Children | 0 (0.0%) | 0 (0.0%) |
| 5 or more Children | 0 (0.0%) | 0 (0.0%) |
| Total | 10 (3.2%) | 0 (0.0%) |
Race in Fort Ashby
The most populous races in Fort Ashby are White / Caucasian (1,163 | 99.1%), Hispanic or Latino (11 | 0.9%), and Some other Race (11 | 0.9%).
| Race | # Population | % Population |
| Asian | 0 | 0.0% |
| Black / African American | 0 | 0.0% |
| Hawaiian / Pacific | 0 | 0.0% |
| Hispanic or Latino | 11 | 0.9% |
| Native / Alaskan | 0 | 0.0% |
| White / Caucasian | 1,163 | 99.1% |
| Two or more Races | 0 | 0.0% |
| Some other Race | 11 | 0.9% |
| Total | 1,174 | 100.0% |
Ancestry in Fort Ashby
The most populous ancestries reported in Fort Ashby are German (391 | 33.3%), English (76 | 6.5%), Dutch (55 | 4.7%), American (39 | 3.3%), and French (25 | 2.1%), together accounting for 49.9% of all Fort Ashby residents.
| Ancestry | # Population | % Population |
| American | 39 | 3.3% |
| Central American | 11 | 0.9% |
| Dutch | 55 | 4.7% |
| English | 76 | 6.5% |
| French | 25 | 2.1% |
| German | 391 | 33.3% |
| Irish | 21 | 1.8% |
| Panamanian | 11 | 0.9% | View All 8 Rows |
Immigrants in Fort Ashby
The most numerous immigrant groups reported in Fort Ashby came from Central America (11 | 0.9%), Latin America (11 | 0.9%), and Panama (11 | 0.9%), together accounting for 2.8% of all Fort Ashby residents.
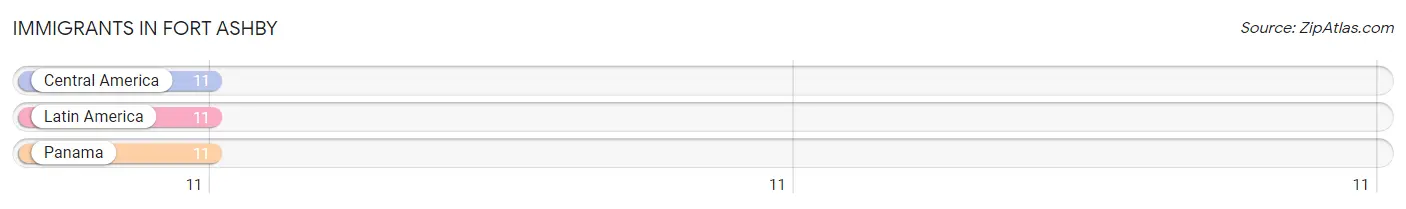
| Immigration Origin | # Population | % Population |
| Central America | 11 | 0.9% |
| Latin America | 11 | 0.9% |
| Panama | 11 | 0.9% | View All 3 Rows |
Sex and Age in Fort Ashby
Sex and Age in Fort Ashby
The most populous age groups in Fort Ashby are 80 to 84 Years (124 | 23.1%) for men and 20 to 24 Years (142 | 22.3%) for women.
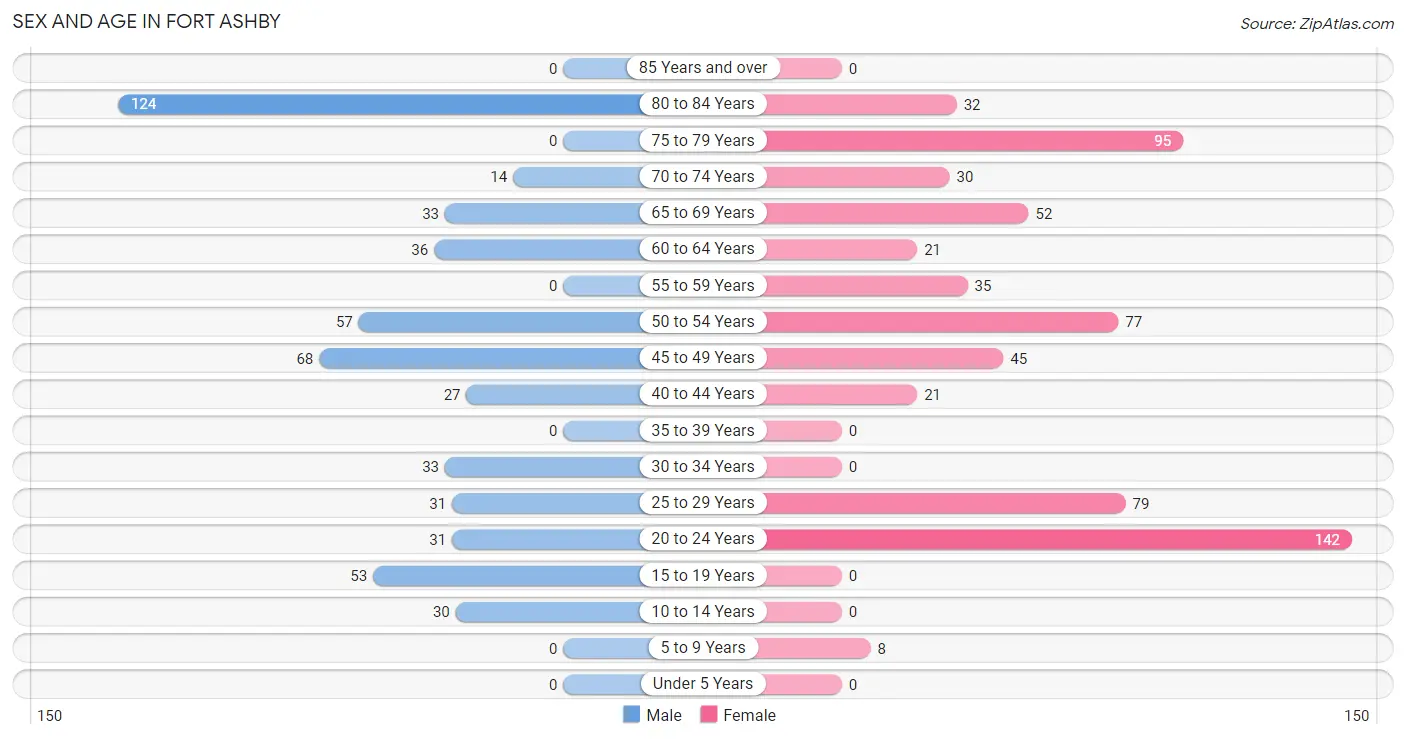
| Age Bracket | Male | Female |
| Under 5 Years | 0 (0.0%) | 0 (0.0%) |
| 5 to 9 Years | 0 (0.0%) | 8 (1.3%) |
| 10 to 14 Years | 30 (5.6%) | 0 (0.0%) |
| 15 to 19 Years | 53 (9.9%) | 0 (0.0%) |
| 20 to 24 Years | 31 (5.8%) | 142 (22.3%) |
| 25 to 29 Years | 31 (5.8%) | 79 (12.4%) |
| 30 to 34 Years | 33 (6.1%) | 0 (0.0%) |
| 35 to 39 Years | 0 (0.0%) | 0 (0.0%) |
| 40 to 44 Years | 27 (5.0%) | 21 (3.3%) |
| 45 to 49 Years | 68 (12.7%) | 45 (7.1%) |
| 50 to 54 Years | 57 (10.6%) | 77 (12.1%) |
| 55 to 59 Years | 0 (0.0%) | 35 (5.5%) |
| 60 to 64 Years | 36 (6.7%) | 21 (3.3%) |
| 65 to 69 Years | 33 (6.1%) | 52 (8.2%) |
| 70 to 74 Years | 14 (2.6%) | 30 (4.7%) |
| 75 to 79 Years | 0 (0.0%) | 95 (14.9%) |
| 80 to 84 Years | 124 (23.1%) | 32 (5.0%) |
| 85 Years and over | 0 (0.0%) | 0 (0.0%) |
| Total | 537 (100.0%) | 637 (100.0%) |
Families and Households in Fort Ashby
Median Family Size in Fort Ashby
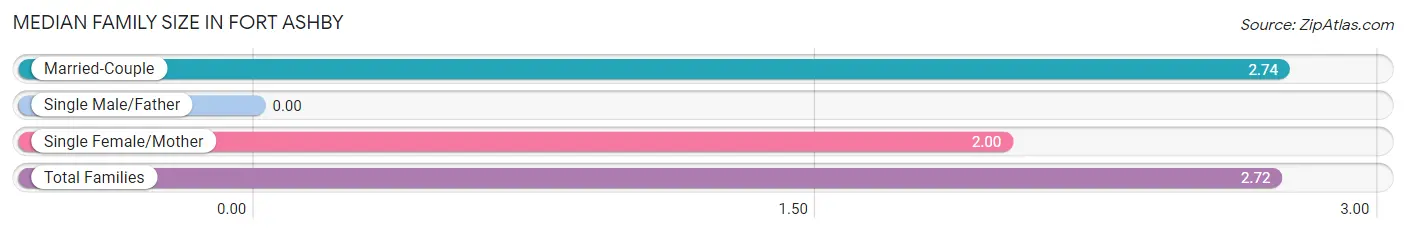
| Family Type | # Families | Family Size |
| Married-Couple | 315 (97.5%) | 2.74 |
| Single Male/Father | 0 (0.0%) | - |
| Single Female/Mother | 8 (2.5%) | 2.00 |
| Total Families | 323 (100.0%) | 2.72 |
Median Household Size in Fort Ashby
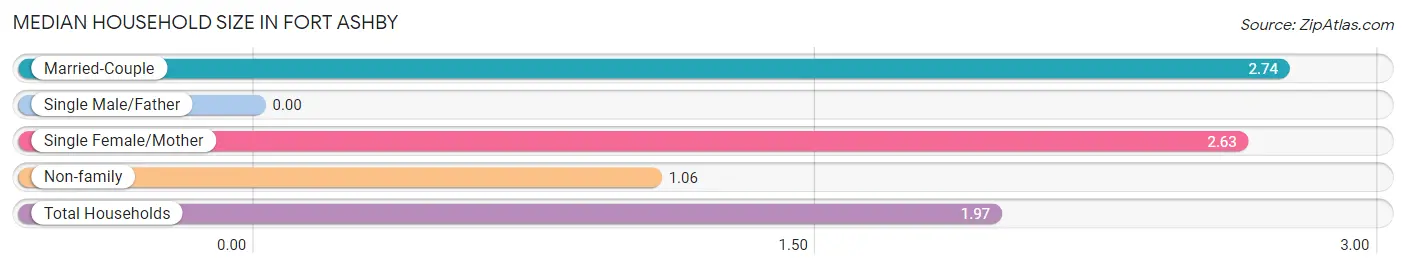
| Household Type | # Households | Household Size |
| Married-Couple | 315 (52.8%) | 2.74 |
| Single Male/Father | 0 (0.0%) | - |
| Single Female/Mother | 8 (1.3%) | 2.63 |
| Non-family | 273 (45.8%) | 1.06 |
| Total Households | 596 (100.0%) | 1.97 |
Household Size by Marriage Status in Fort Ashby
Out of a total of 596 households in Fort Ashby, 323 (54.2%) are family households, while 273 (45.8%) are nonfamily households. The most numerous type of family households are 2-person households, comprising 206, and the most common type of nonfamily households are 1-person households, comprising 260.
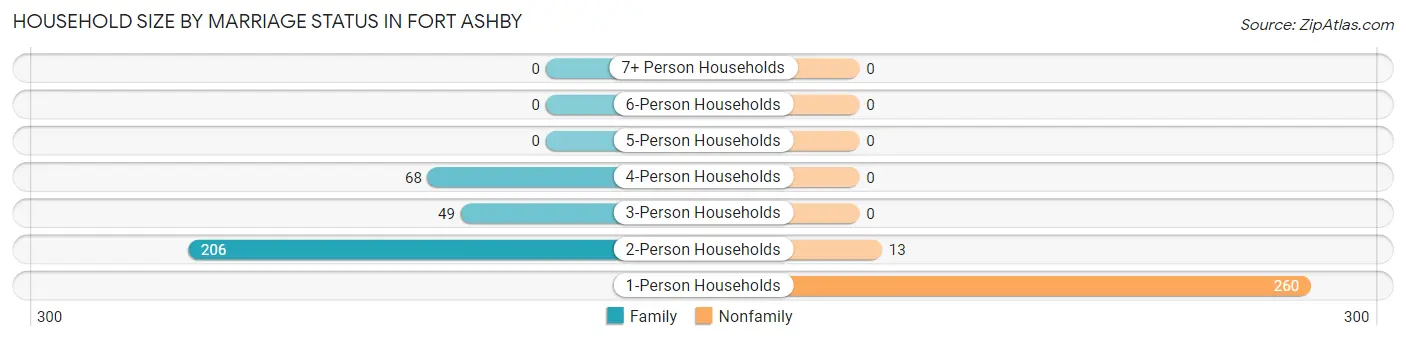
| Household Size | Family Households | Nonfamily Households |
| 1-Person Households | - | 260 (43.6%) |
| 2-Person Households | 206 (34.6%) | 13 (2.2%) |
| 3-Person Households | 49 (8.2%) | 0 (0.0%) |
| 4-Person Households | 68 (11.4%) | 0 (0.0%) |
| 5-Person Households | 0 (0.0%) | 0 (0.0%) |
| 6-Person Households | 0 (0.0%) | 0 (0.0%) |
| 7+ Person Households | 0 (0.0%) | 0 (0.0%) |
| Total | 323 (54.2%) | 273 (45.8%) |
Female Fertility in Fort Ashby
Fertility by Age in Fort Ashby
| Age Bracket | Women with Births | Births / 1,000 Women |
| 15 to 19 years | 0 (0.0%) | 0.0 |
| 20 to 34 years | 0 (0.0%) | 0.0 |
| 35 to 50 years | 0 (0.0%) | 0.0 |
| Total | 0 (0.0%) | 0.0 |
Fertility by Age by Marriage Status in Fort Ashby
| Age Bracket | Married | Unmarried |
| 15 to 19 years | 0 (0.0%) | 0 (0.0%) |
| 20 to 34 years | 0 (0.0%) | 0 (0.0%) |
| 35 to 50 years | 0 (0.0%) | 0 (0.0%) |
| Total | 0 (0.0%) | 0 (0.0%) |
Fertility by Education in Fort Ashby
| Educational Attainment | Women with Births | Births / 1,000 Women |
| Less than High School | 0 (0.0%) | 0.0 |
| High School Diploma | 0 (0.0%) | 0.0 |
| College or Associate's Degree | 0 (0.0%) | 0.0 |
| Bachelor's Degree | 0 (0.0%) | 0.0 |
| Graduate Degree | 0 (0.0%) | 0.0 |
| Total | 0 (0.0%) | 0.0 |
Fertility by Education by Marriage Status in Fort Ashby
| Educational Attainment | Married | Unmarried |
| Less than High School | 0 (0.0%) | 0 (0.0%) |
| High School Diploma | 0 (0.0%) | 0 (0.0%) |
| College or Associate's Degree | 0 (0.0%) | 0 (0.0%) |
| Bachelor's Degree | 0 (0.0%) | 0 (0.0%) |
| Graduate Degree | 0 (0.0%) | 0 (0.0%) |
| Total | 0 (0.0%) | 0 (0.0%) |
Employment Characteristics in Fort Ashby
Employment by Class of Employer in Fort Ashby
Among the 607 employed individuals in Fort Ashby, private company employees (511 | 84.2%), not-for-profit organizations (57 | 9.4%), and self-employed (incorporated) (39 | 6.4%) make up the most common classes of employment.
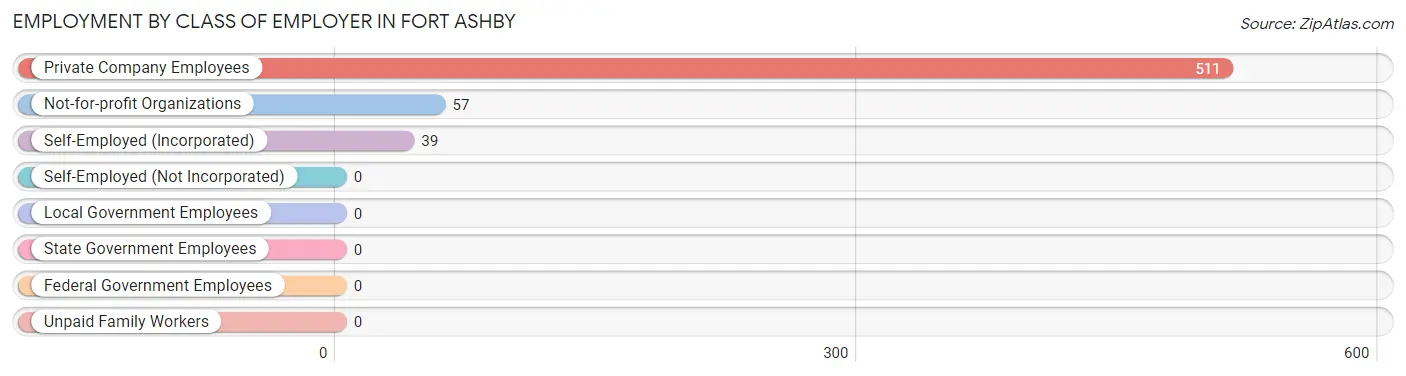
| Employer Class | # Employees | % Employees |
| Private Company Employees | 511 | 84.2% |
| Self-Employed (Incorporated) | 39 | 6.4% |
| Self-Employed (Not Incorporated) | 0 | 0.0% |
| Not-for-profit Organizations | 57 | 9.4% |
| Local Government Employees | 0 | 0.0% |
| State Government Employees | 0 | 0.0% |
| Federal Government Employees | 0 | 0.0% |
| Unpaid Family Workers | 0 | 0.0% |
| Total | 607 | 100.0% |
Employment Status by Age in Fort Ashby
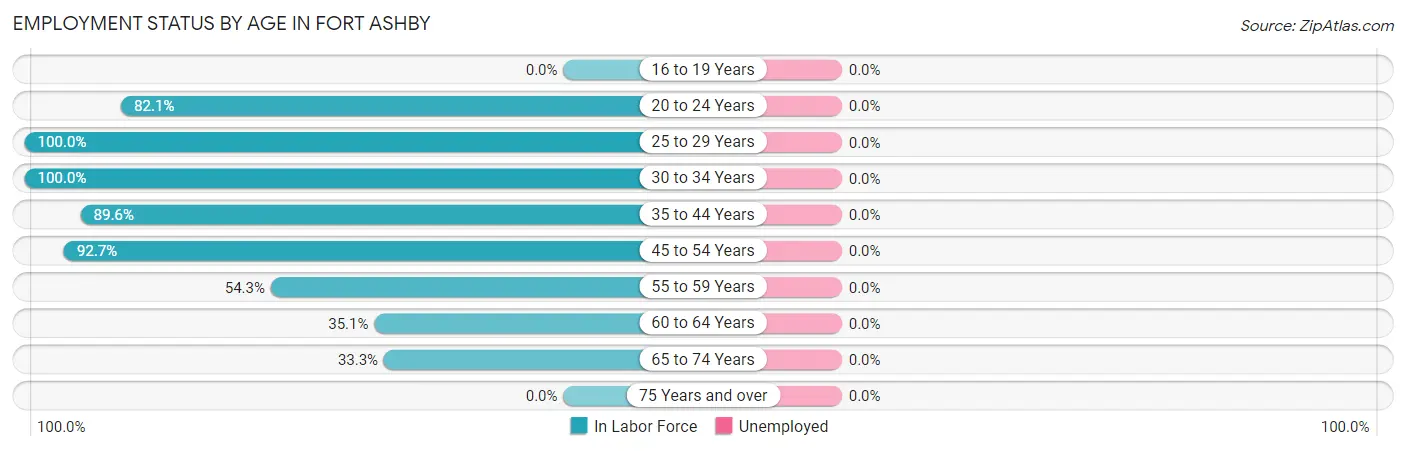
| Age Bracket | In Labor Force | Unemployed |
| 16 to 19 Years | 0 (0.0%) | 0 (0.0%) |
| 20 to 24 Years | 142 (82.1%) | 0 (0.0%) |
| 25 to 29 Years | 110 (100.0%) | 0 (0.0%) |
| 30 to 34 Years | 33 (100.0%) | 0 (0.0%) |
| 35 to 44 Years | 43 (89.6%) | 0 (0.0%) |
| 45 to 54 Years | 229 (92.7%) | 0 (0.0%) |
| 55 to 59 Years | 19 (54.3%) | 0 (0.0%) |
| 60 to 64 Years | 20 (35.1%) | 0 (0.0%) |
| 65 to 74 Years | 43 (33.3%) | 0 (0.0%) |
| 75 Years and over | 0 (0.0%) | 0 (0.0%) |
| Total | 640 (56.3%) | 0 (0.0%) |
Employment Status by Educational Attainment in Fort Ashby
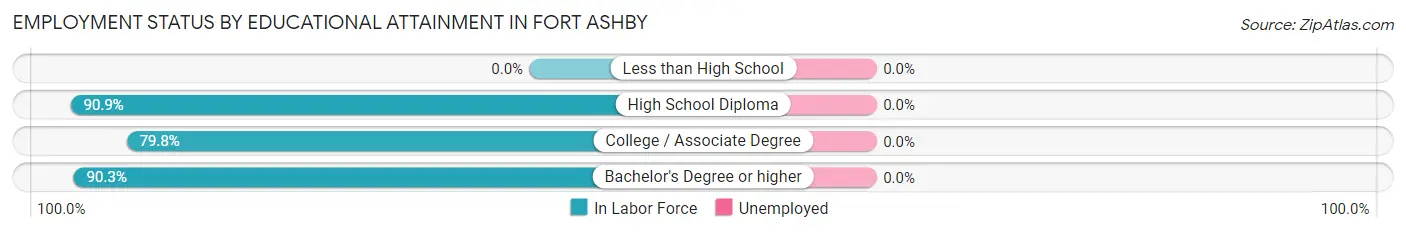
| Educational Attainment | In Labor Force | Unemployed |
| Less than High School | 0 (0.0%) | 0 (0.0%) |
| High School Diploma | 270 (90.9%) | 0 (0.0%) |
| College / Associate Degree | 91 (79.8%) | 0 (0.0%) |
| Bachelor's Degree or higher | 93 (90.3%) | 0 (0.0%) |
| Total | 454 (85.7%) | 0 (0.0%) |
Employment Occupations by Sex in Fort Ashby
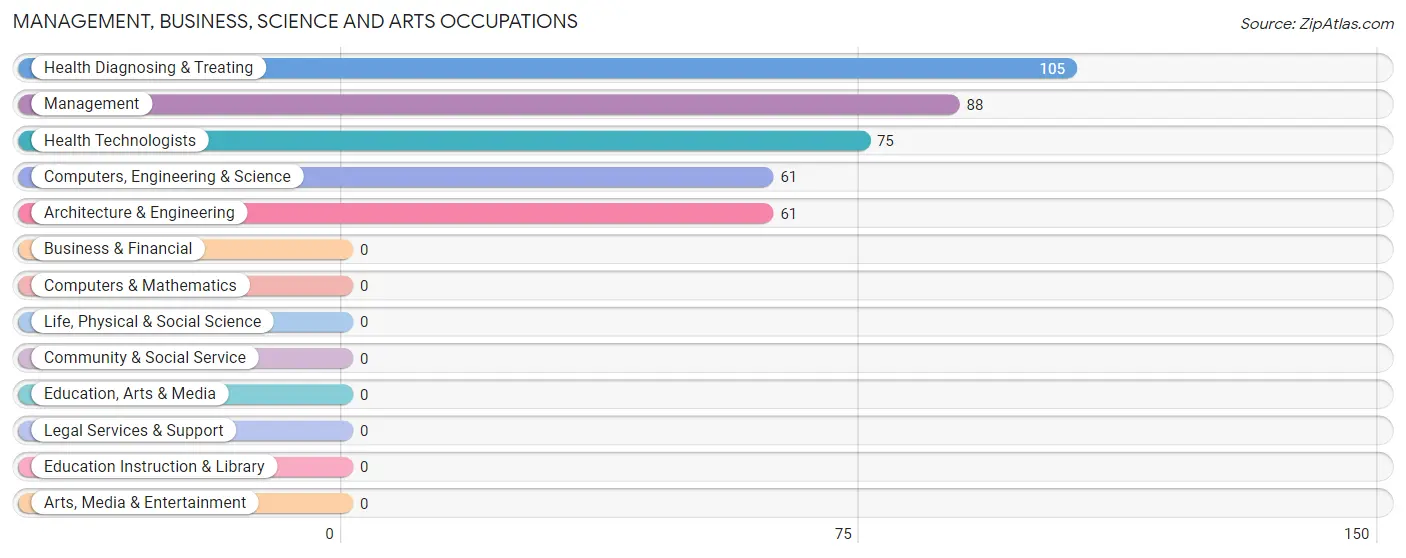
Management, Business, Science and Arts Occupations
The most common Management, Business, Science and Arts occupations in Fort Ashby are Health Diagnosing & Treating (105 | 16.4%), Management (88 | 13.8%), Health Technologists (75 | 11.7%), Computers, Engineering & Science (61 | 9.6%), and Architecture & Engineering (61 | 9.6%).
Management, Business, Science and Arts Occupations by Sex
Within the Management, Business, Science and Arts occupations in Fort Ashby, the most male-oriented occupations are Computers, Engineering & Science (100.0%), Architecture & Engineering (100.0%), and Management (58.0%), while the most female-oriented occupations are Health Technologists (70.7%), Health Diagnosing & Treating (58.1%), and Management (42.0%).
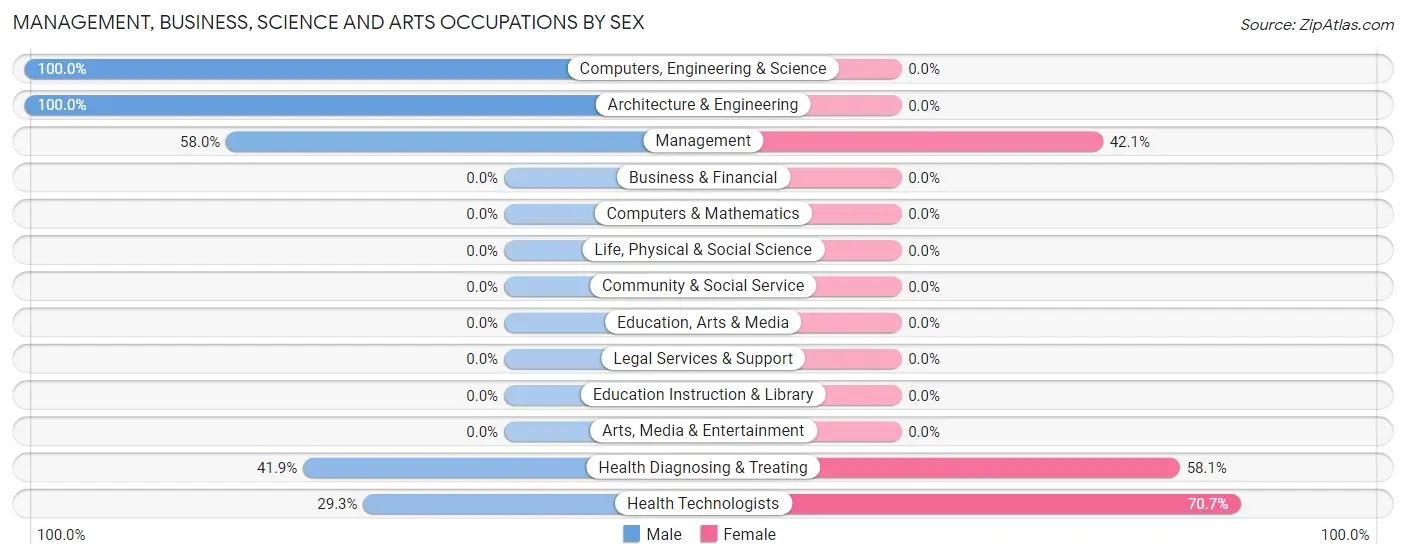
| Occupation | Male | Female |
| Management | 51 (58.0%) | 37 (42.0%) |
| Business & Financial | 0 (0.0%) | 0 (0.0%) |
| Computers, Engineering & Science | 61 (100.0%) | 0 (0.0%) |
| Computers & Mathematics | 0 (0.0%) | 0 (0.0%) |
| Architecture & Engineering | 61 (100.0%) | 0 (0.0%) |
| Life, Physical & Social Science | 0 (0.0%) | 0 (0.0%) |
| Community & Social Service | 0 (0.0%) | 0 (0.0%) |
| Education, Arts & Media | 0 (0.0%) | 0 (0.0%) |
| Legal Services & Support | 0 (0.0%) | 0 (0.0%) |
| Education Instruction & Library | 0 (0.0%) | 0 (0.0%) |
| Arts, Media & Entertainment | 0 (0.0%) | 0 (0.0%) |
| Health Diagnosing & Treating | 44 (41.9%) | 61 (58.1%) |
| Health Technologists | 22 (29.3%) | 53 (70.7%) |
| Total (Category) | 156 (61.4%) | 98 (38.6%) |
| Total (Overall) | 235 (36.8%) | 404 (63.2%) |
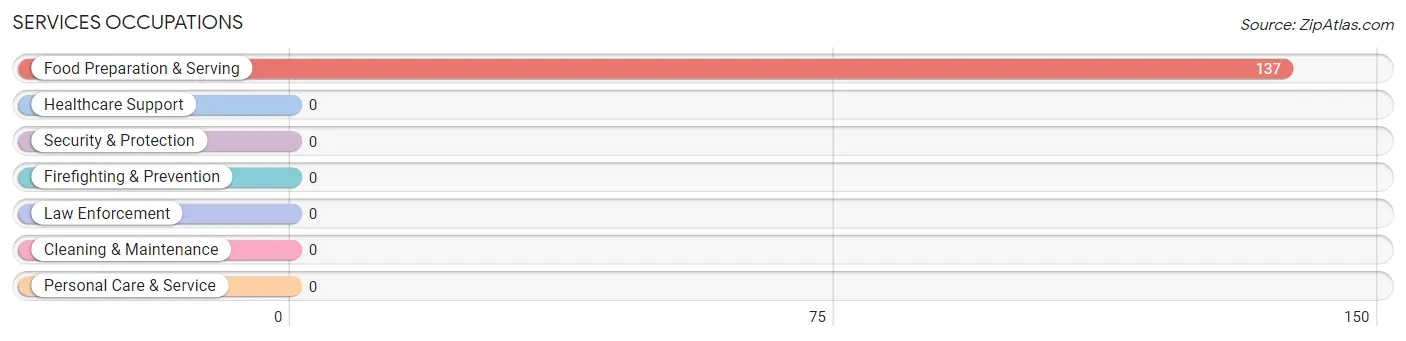
Services Occupations
The most common Services occupations in Fort Ashby are , and Food Preparation & Serving (137 | 21.4%).
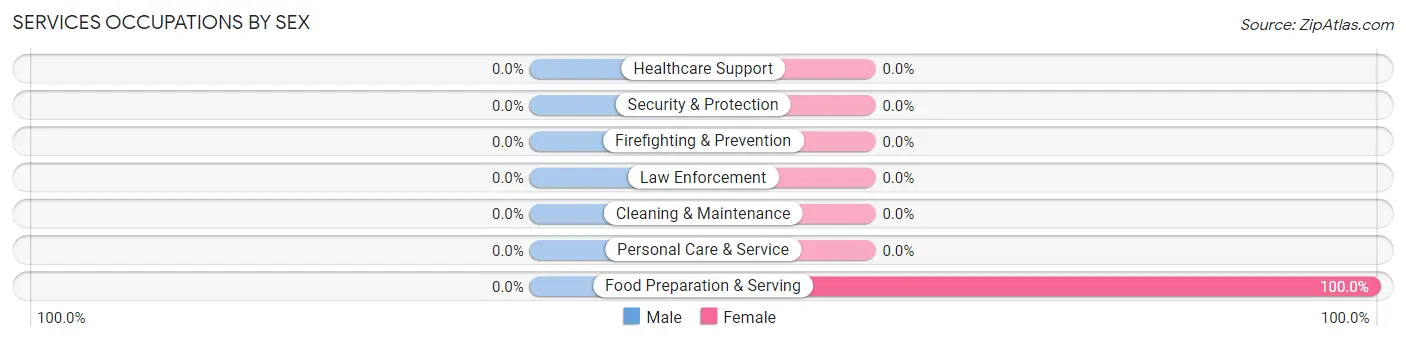
Services Occupations by Sex
| Occupation | Male | Female |
| Healthcare Support | 0 (0.0%) | 0 (0.0%) |
| Security & Protection | 0 (0.0%) | 0 (0.0%) |
| Firefighting & Prevention | 0 (0.0%) | 0 (0.0%) |
| Law Enforcement | 0 (0.0%) | 0 (0.0%) |
| Food Preparation & Serving | 0 (0.0%) | 137 (100.0%) |
| Cleaning & Maintenance | 0 (0.0%) | 0 (0.0%) |
| Personal Care & Service | 0 (0.0%) | 0 (0.0%) |
| Total (Category) | 0 (0.0%) | 137 (100.0%) |
| Total (Overall) | 235 (36.8%) | 404 (63.2%) |
Sales and Office Occupations
The most common Sales and Office occupations in Fort Ashby are , and Office & Administration (124 | 19.4%).
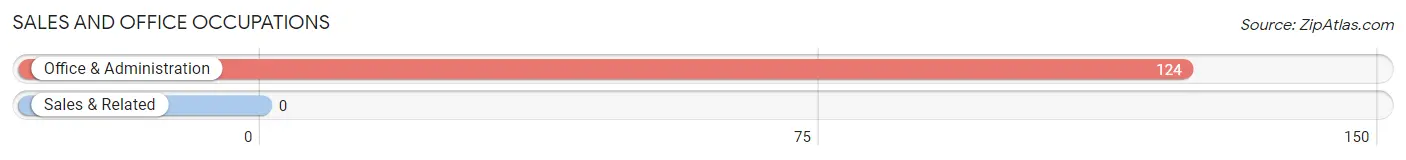
Sales and Office Occupations by Sex
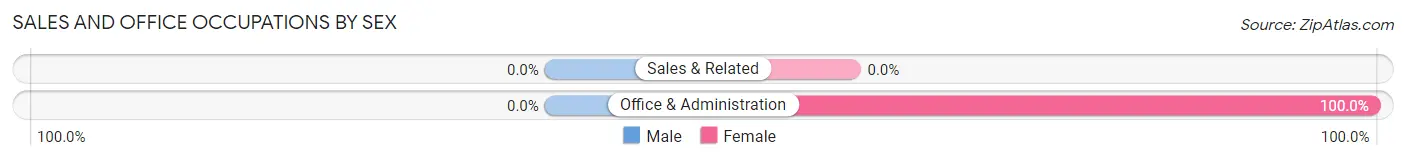
| Occupation | Male | Female |
| Sales & Related | 0 (0.0%) | 0 (0.0%) |
| Office & Administration | 0 (0.0%) | 124 (100.0%) |
| Total (Category) | 0 (0.0%) | 124 (100.0%) |
| Total (Overall) | 235 (36.8%) | 404 (63.2%) |
Natural Resources, Construction and Maintenance Occupations
The most common Natural Resources, Construction and Maintenance occupations in Fort Ashby are Farming, Fishing & Forestry (45 | 7.0%), and Construction & Extraction (39 | 6.1%).
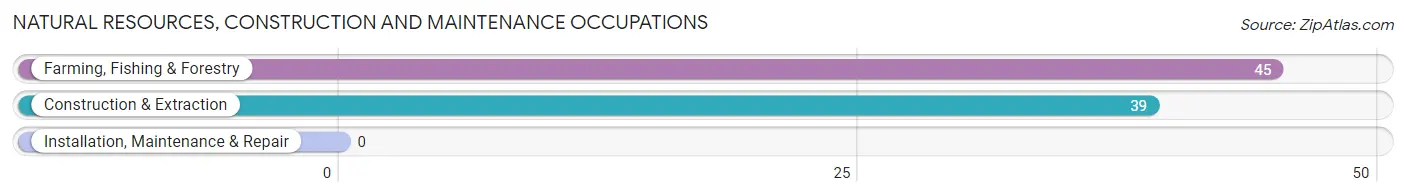
Natural Resources, Construction and Maintenance Occupations by Sex
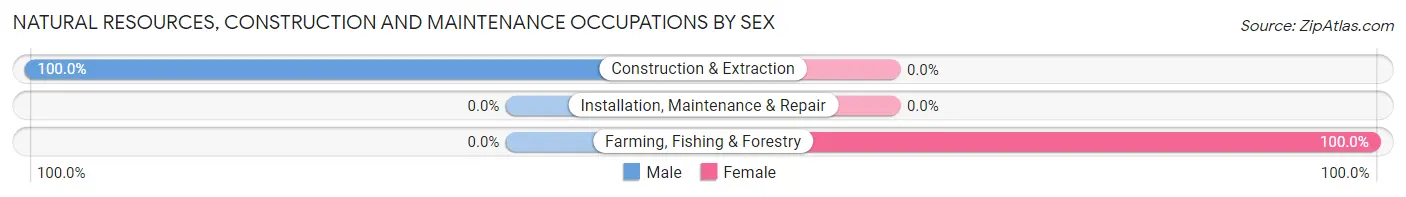
| Occupation | Male | Female |
| Farming, Fishing & Forestry | 0 (0.0%) | 45 (100.0%) |
| Construction & Extraction | 39 (100.0%) | 0 (0.0%) |
| Installation, Maintenance & Repair | 0 (0.0%) | 0 (0.0%) |
| Total (Category) | 39 (46.4%) | 45 (53.6%) |
| Total (Overall) | 235 (36.8%) | 404 (63.2%) |
Production, Transportation and Moving Occupations
The most common Production, Transportation and Moving occupations in Fort Ashby are , and Transportation (40 | 6.3%).
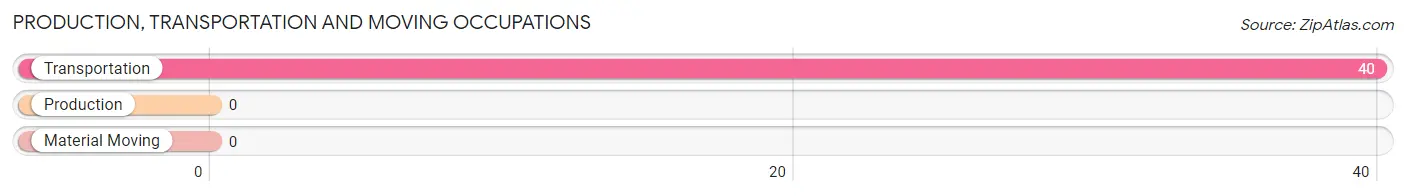
Production, Transportation and Moving Occupations by Sex
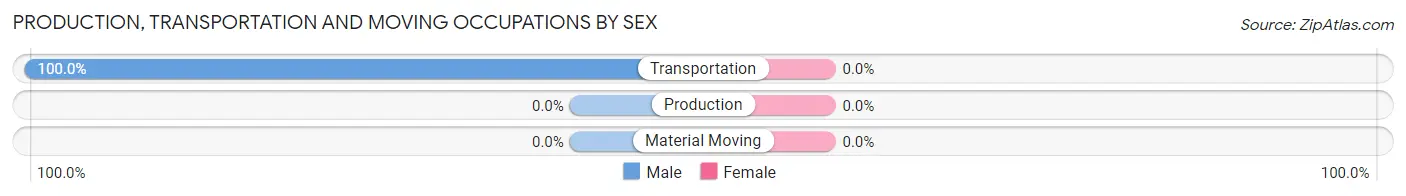
| Occupation | Male | Female |
| Production | 0 (0.0%) | 0 (0.0%) |
| Transportation | 40 (100.0%) | 0 (0.0%) |
| Material Moving | 0 (0.0%) | 0 (0.0%) |
| Total (Category) | 40 (100.0%) | 0 (0.0%) |
| Total (Overall) | 235 (36.8%) | 404 (63.2%) |
Employment Industries by Sex in Fort Ashby
Employment Industries in Fort Ashby
The major employment industries in Fort Ashby include Health Care & Social Assistance (177 | 27.7%), Accommodation & Food Services (137 | 21.4%), Manufacturing (67 | 10.5%), Agriculture, Fishing & Hunting (45 | 7.0%), and Finance & Insurance (43 | 6.7%).
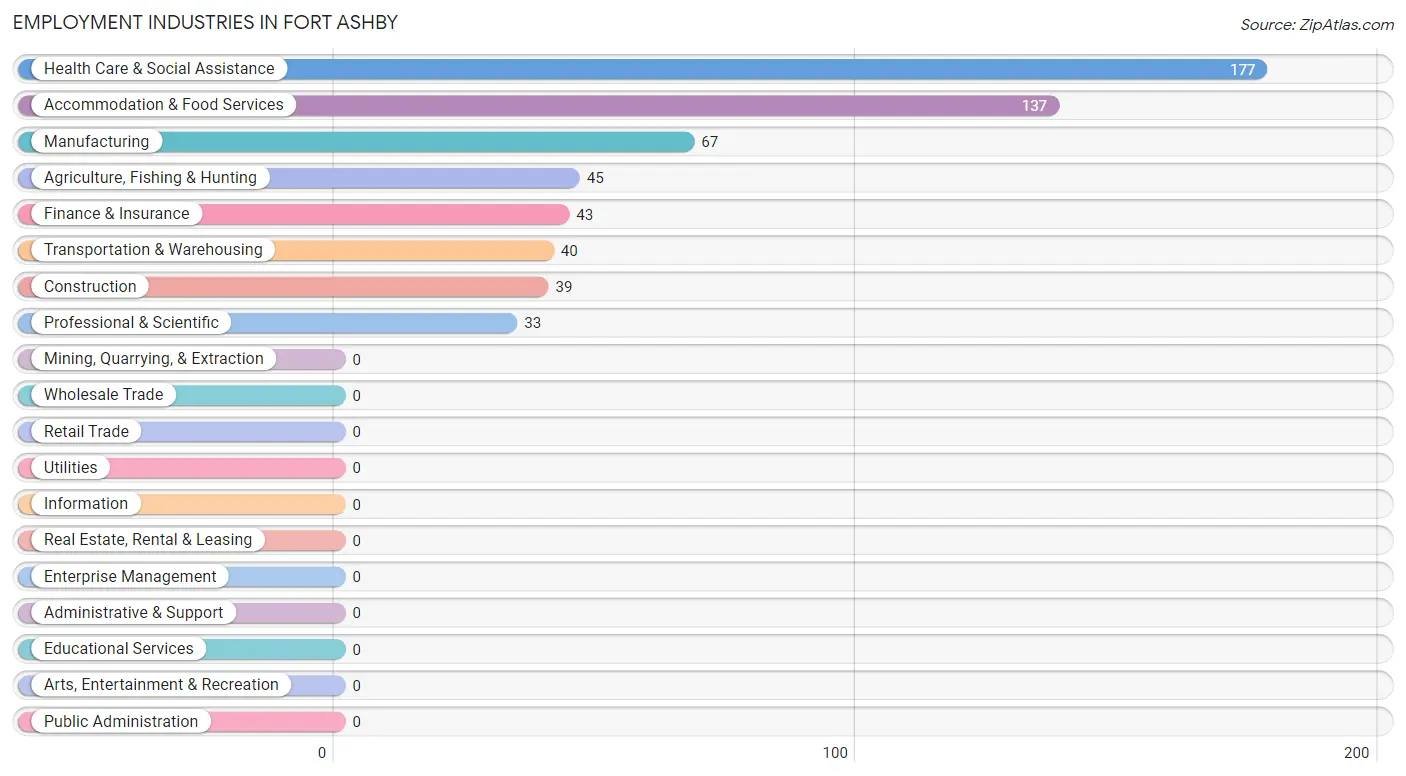
Employment Industries by Sex in Fort Ashby
The Fort Ashby industries that see more men than women are Construction (100.0%), Transportation & Warehousing (100.0%), and Professional & Scientific (100.0%), whereas the industries that tend to have a higher number of women are Agriculture, Fishing & Hunting (100.0%), Finance & Insurance (100.0%), and Accommodation & Food Services (100.0%).
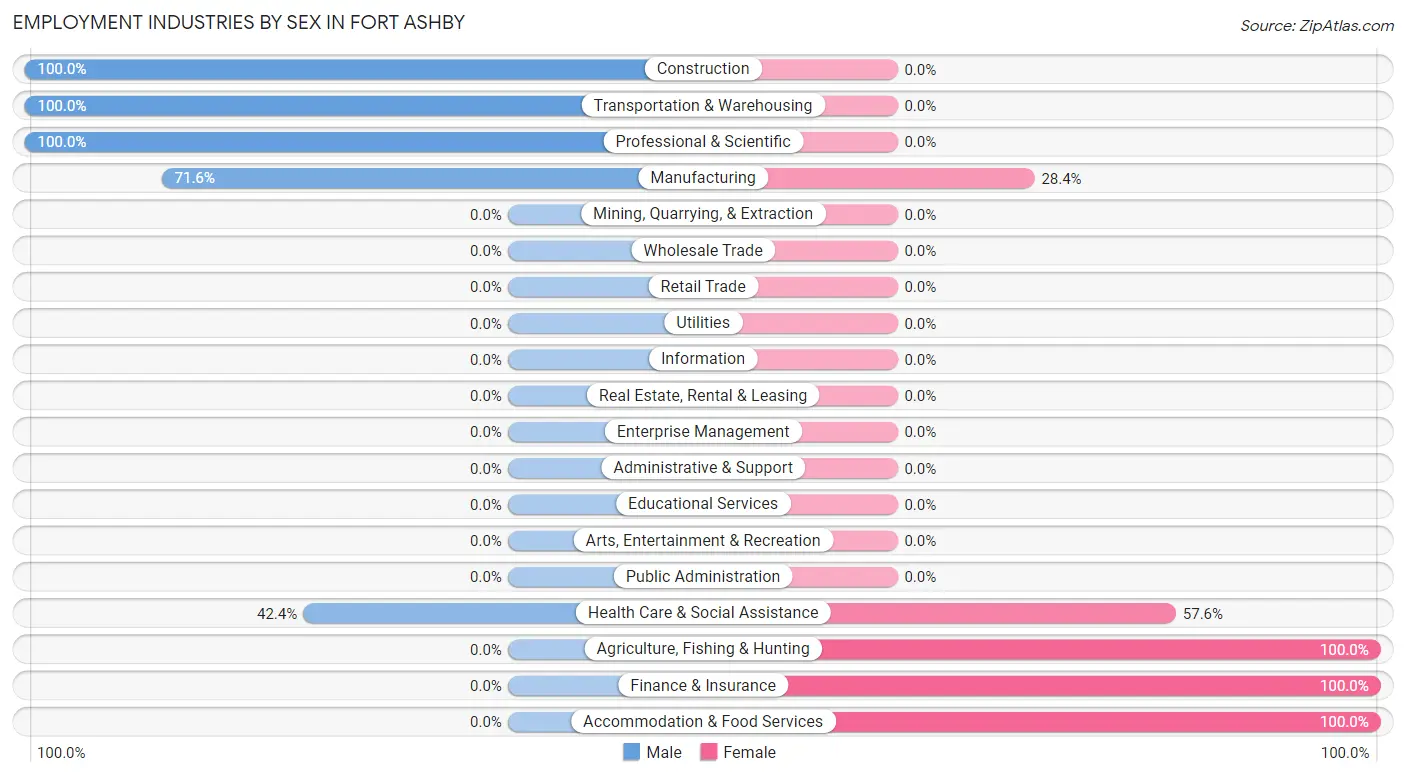
| Industry | Male | Female |
| Agriculture, Fishing & Hunting | 0 (0.0%) | 45 (100.0%) |
| Mining, Quarrying, & Extraction | 0 (0.0%) | 0 (0.0%) |
| Construction | 39 (100.0%) | 0 (0.0%) |
| Manufacturing | 48 (71.6%) | 19 (28.4%) |
| Wholesale Trade | 0 (0.0%) | 0 (0.0%) |
| Retail Trade | 0 (0.0%) | 0 (0.0%) |
| Transportation & Warehousing | 40 (100.0%) | 0 (0.0%) |
| Utilities | 0 (0.0%) | 0 (0.0%) |
| Information | 0 (0.0%) | 0 (0.0%) |
| Finance & Insurance | 0 (0.0%) | 43 (100.0%) |
| Real Estate, Rental & Leasing | 0 (0.0%) | 0 (0.0%) |
| Professional & Scientific | 33 (100.0%) | 0 (0.0%) |
| Enterprise Management | 0 (0.0%) | 0 (0.0%) |
| Administrative & Support | 0 (0.0%) | 0 (0.0%) |
| Educational Services | 0 (0.0%) | 0 (0.0%) |
| Health Care & Social Assistance | 75 (42.4%) | 102 (57.6%) |
| Arts, Entertainment & Recreation | 0 (0.0%) | 0 (0.0%) |
| Accommodation & Food Services | 0 (0.0%) | 137 (100.0%) |
| Public Administration | 0 (0.0%) | 0 (0.0%) |
| Total | 235 (36.8%) | 404 (63.2%) |
Education in Fort Ashby
School Enrollment in Fort Ashby
The most common levels of schooling among the 192 students in Fort Ashby are college / undergraduate (124 | 64.6%), middle school (30 | 15.6%), and high school (30 | 15.6%).
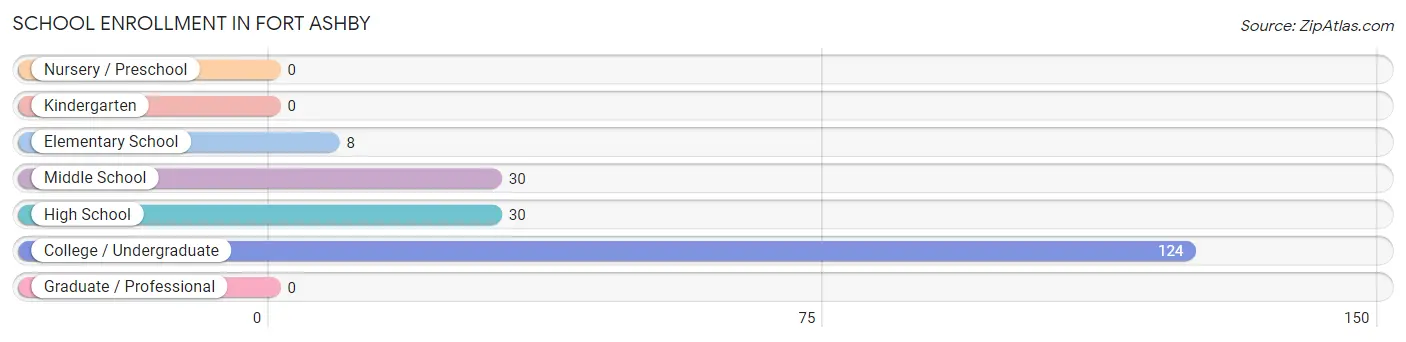
| School Level | # Students | % Students |
| Nursery / Preschool | 0 | 0.0% |
| Kindergarten | 0 | 0.0% |
| Elementary School | 8 | 4.2% |
| Middle School | 30 | 15.6% |
| High School | 30 | 15.6% |
| College / Undergraduate | 124 | 64.6% |
| Graduate / Professional | 0 | 0.0% |
| Total | 192 | 100.0% |
School Enrollment by Age by Funding Source in Fort Ashby
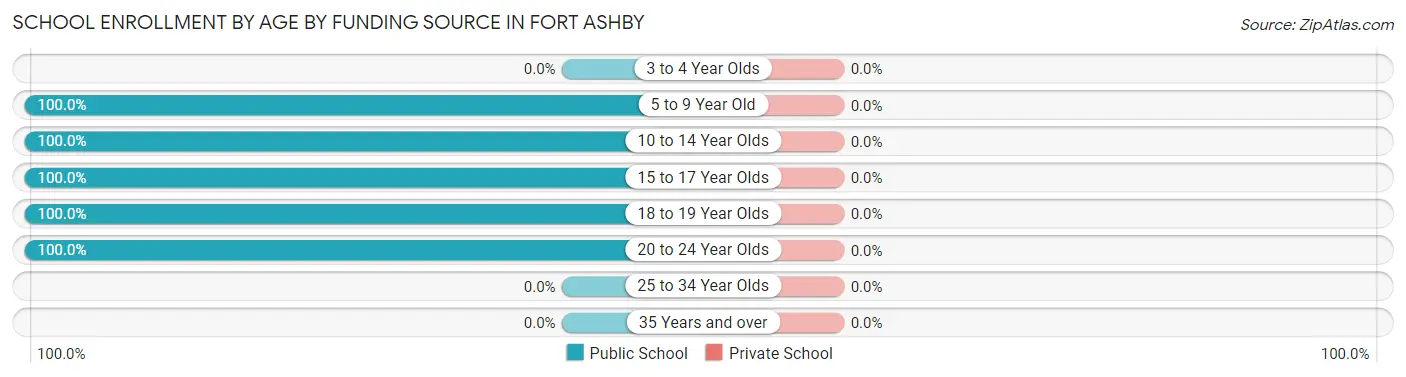
| Age Bracket | Public School | Private School |
| 3 to 4 Year Olds | 0 (0.0%) | 0 (0.0%) |
| 5 to 9 Year Old | 8 (100.0%) | 0 (0.0%) |
| 10 to 14 Year Olds | 30 (100.0%) | 0 (0.0%) |
| 15 to 17 Year Olds | 30 (100.0%) | 0 (0.0%) |
| 18 to 19 Year Olds | 23 (100.0%) | 0 (0.0%) |
| 20 to 24 Year Olds | 101 (100.0%) | 0 (0.0%) |
| 25 to 34 Year Olds | 0 (0.0%) | 0 (0.0%) |
| 35 Years and over | 0 (0.0%) | 0 (0.0%) |
| Total | 192 (100.0%) | 0 (0.0%) |
Educational Attainment by Field of Study in Fort Ashby
Engineering (61 | 59.2%), science & technology (32 | 31.1%), and liberal arts & history (10 | 9.7%) are the most common fields of study among 103 individuals in Fort Ashby who have obtained a bachelor's degree or higher.
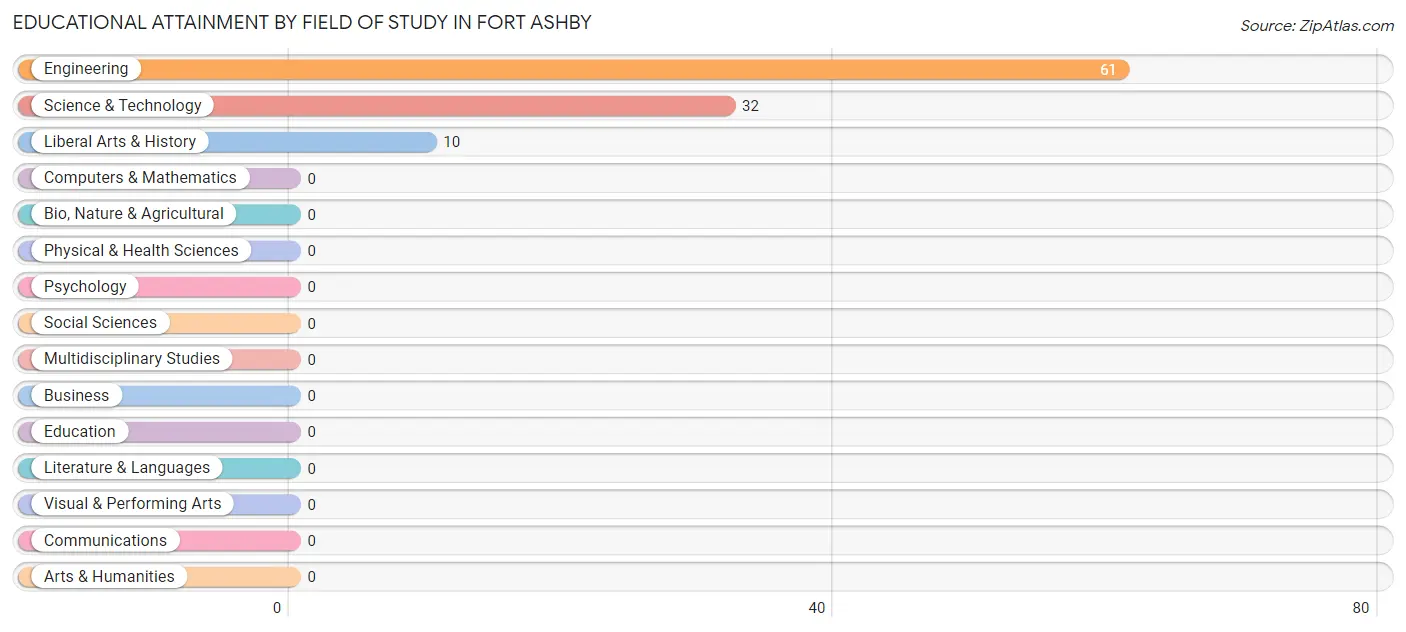
| Field of Study | # Graduates | % Graduates |
| Computers & Mathematics | 0 | 0.0% |
| Bio, Nature & Agricultural | 0 | 0.0% |
| Physical & Health Sciences | 0 | 0.0% |
| Psychology | 0 | 0.0% |
| Social Sciences | 0 | 0.0% |
| Engineering | 61 | 59.2% |
| Multidisciplinary Studies | 0 | 0.0% |
| Science & Technology | 32 | 31.1% |
| Business | 0 | 0.0% |
| Education | 0 | 0.0% |
| Literature & Languages | 0 | 0.0% |
| Liberal Arts & History | 10 | 9.7% |
| Visual & Performing Arts | 0 | 0.0% |
| Communications | 0 | 0.0% |
| Arts & Humanities | 0 | 0.0% |
| Total | 103 | 100.0% |
Transportation & Commute in Fort Ashby
Vehicle Availability by Sex in Fort Ashby
The most prevalent vehicle ownership categories in Fort Ashby are males with 3 vehicles (154, accounting for 65.5%) and females with 3 vehicles (259, making up 41.4%).
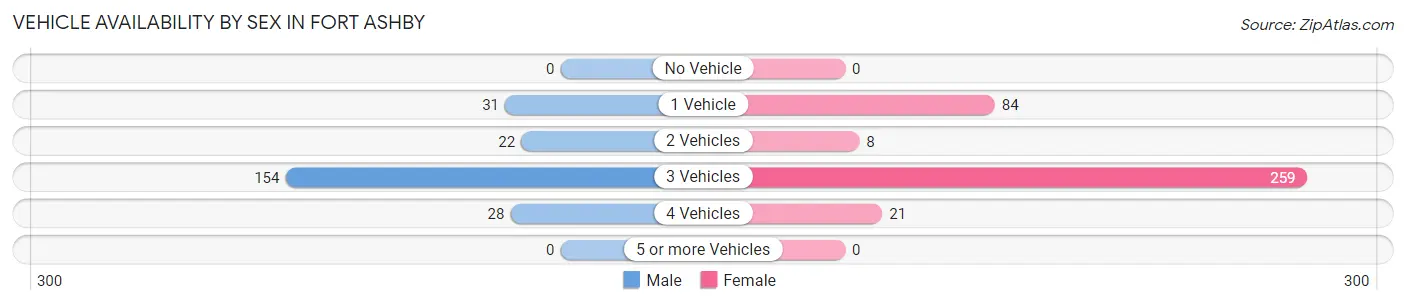
| Vehicles Available | Male | Female |
| No Vehicle | 0 (0.0%) | 0 (0.0%) |
| 1 Vehicle | 31 (13.2%) | 84 (22.6%) |
| 2 Vehicles | 22 (9.4%) | 8 (2.1%) |
| 3 Vehicles | 154 (65.5%) | 259 (69.6%) |
| 4 Vehicles | 28 (11.9%) | 21 (5.7%) |
| 5 or more Vehicles | 0 (0.0%) | 0 (0.0%) |
| Total | 235 (100.0%) | 372 (100.0%) |
Commute Time in Fort Ashby
The most frequently occuring commute durations in Fort Ashby are 20 to 24 minutes (172 commuters, 28.3%), 30 to 34 minutes (139 commuters, 22.9%), and 25 to 29 minutes (109 commuters, 18.0%).
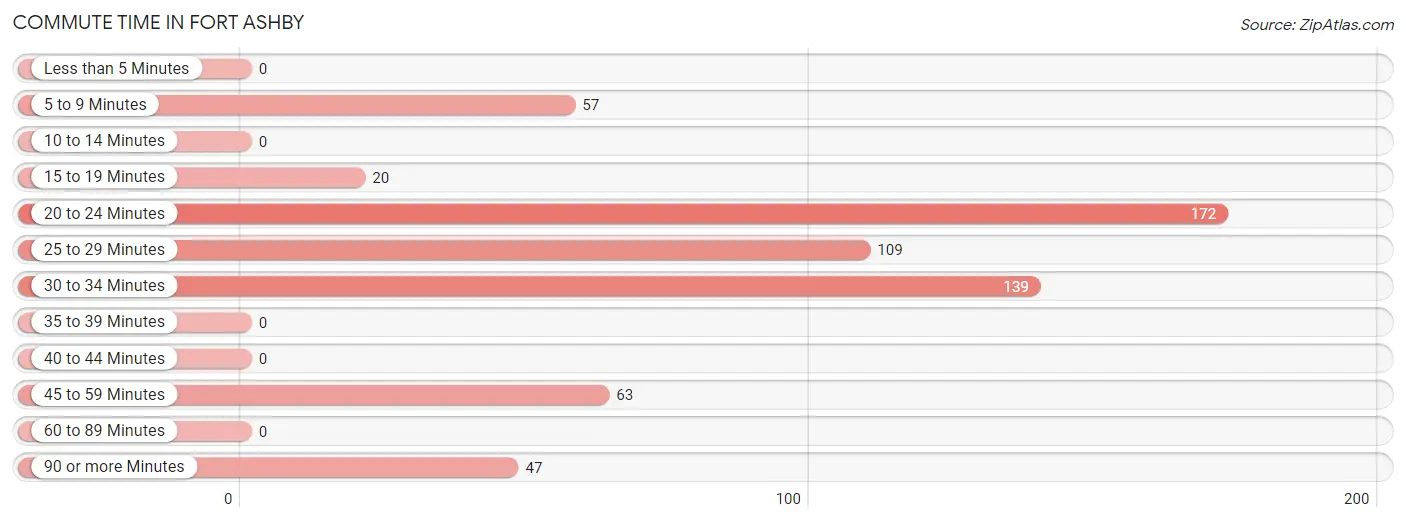
| Commute Time | # Commuters | % Commuters |
| Less than 5 Minutes | 0 | 0.0% |
| 5 to 9 Minutes | 57 | 9.4% |
| 10 to 14 Minutes | 0 | 0.0% |
| 15 to 19 Minutes | 20 | 3.3% |
| 20 to 24 Minutes | 172 | 28.3% |
| 25 to 29 Minutes | 109 | 18.0% |
| 30 to 34 Minutes | 139 | 22.9% |
| 35 to 39 Minutes | 0 | 0.0% |
| 40 to 44 Minutes | 0 | 0.0% |
| 45 to 59 Minutes | 63 | 10.4% |
| 60 to 89 Minutes | 0 | 0.0% |
| 90 or more Minutes | 47 | 7.7% |
Commute Time by Sex in Fort Ashby
The most common commute times in Fort Ashby are 25 to 29 minutes (72 commuters, 30.6%) for males and 30 to 34 minutes (117 commuters, 31.5%) for females.
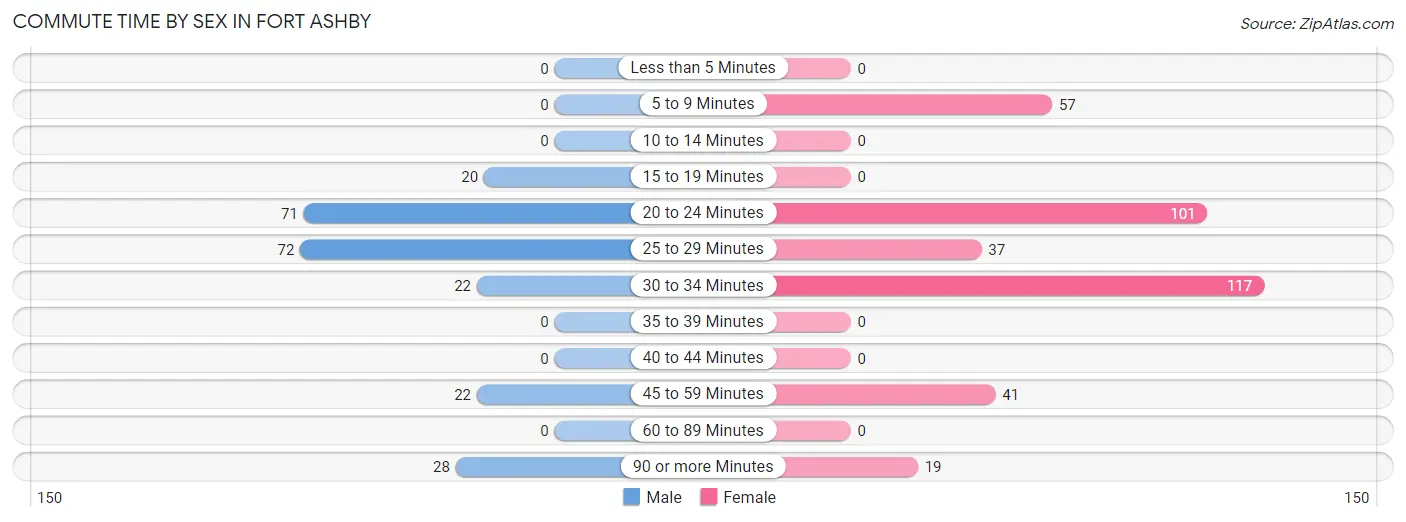
| Commute Time | Male | Female |
| Less than 5 Minutes | 0 (0.0%) | 0 (0.0%) |
| 5 to 9 Minutes | 0 (0.0%) | 57 (15.3%) |
| 10 to 14 Minutes | 0 (0.0%) | 0 (0.0%) |
| 15 to 19 Minutes | 20 (8.5%) | 0 (0.0%) |
| 20 to 24 Minutes | 71 (30.2%) | 101 (27.2%) |
| 25 to 29 Minutes | 72 (30.6%) | 37 (10.0%) |
| 30 to 34 Minutes | 22 (9.4%) | 117 (31.5%) |
| 35 to 39 Minutes | 0 (0.0%) | 0 (0.0%) |
| 40 to 44 Minutes | 0 (0.0%) | 0 (0.0%) |
| 45 to 59 Minutes | 22 (9.4%) | 41 (11.0%) |
| 60 to 89 Minutes | 0 (0.0%) | 0 (0.0%) |
| 90 or more Minutes | 28 (11.9%) | 19 (5.1%) |
Time of Departure to Work by Sex in Fort Ashby
The most frequent times of departure to work in Fort Ashby are 8:00 AM to 8:29 AM (91, 38.7%) for males and 12:00 PM to 3:59 PM (145, 39.0%) for females.
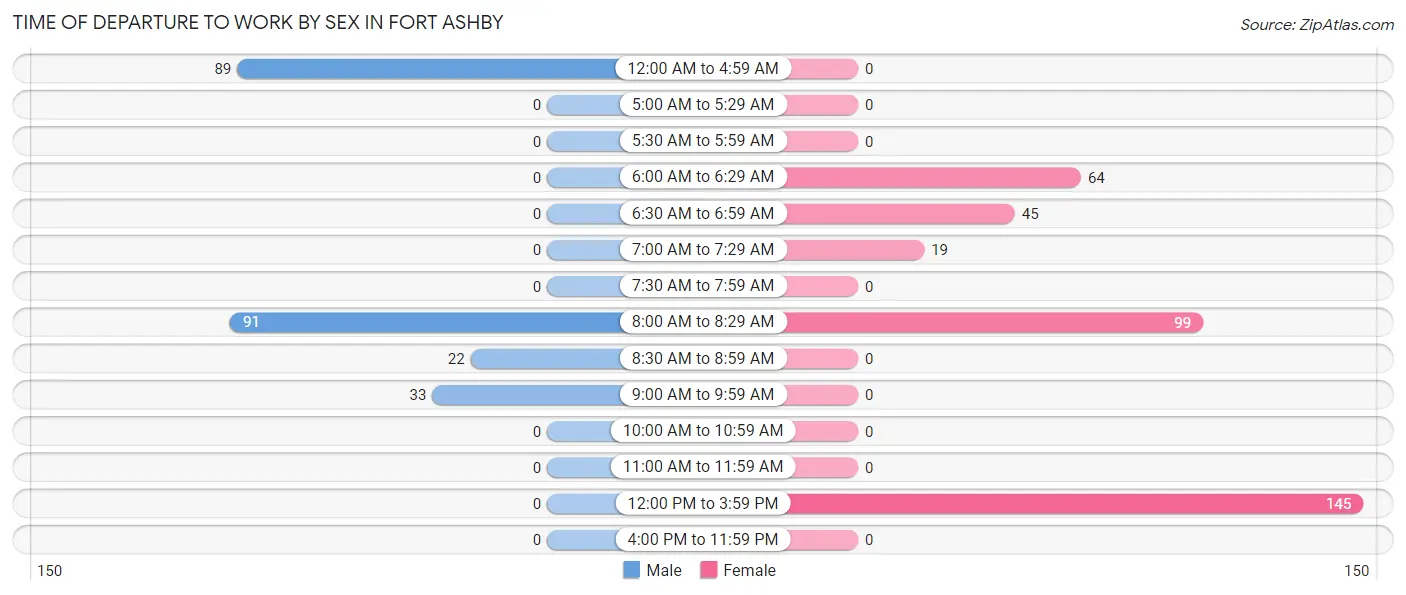
| Time of Departure | Male | Female |
| 12:00 AM to 4:59 AM | 89 (37.9%) | 0 (0.0%) |
| 5:00 AM to 5:29 AM | 0 (0.0%) | 0 (0.0%) |
| 5:30 AM to 5:59 AM | 0 (0.0%) | 0 (0.0%) |
| 6:00 AM to 6:29 AM | 0 (0.0%) | 64 (17.2%) |
| 6:30 AM to 6:59 AM | 0 (0.0%) | 45 (12.1%) |
| 7:00 AM to 7:29 AM | 0 (0.0%) | 19 (5.1%) |
| 7:30 AM to 7:59 AM | 0 (0.0%) | 0 (0.0%) |
| 8:00 AM to 8:29 AM | 91 (38.7%) | 99 (26.6%) |
| 8:30 AM to 8:59 AM | 22 (9.4%) | 0 (0.0%) |
| 9:00 AM to 9:59 AM | 33 (14.0%) | 0 (0.0%) |
| 10:00 AM to 10:59 AM | 0 (0.0%) | 0 (0.0%) |
| 11:00 AM to 11:59 AM | 0 (0.0%) | 0 (0.0%) |
| 12:00 PM to 3:59 PM | 0 (0.0%) | 145 (39.0%) |
| 4:00 PM to 11:59 PM | 0 (0.0%) | 0 (0.0%) |
| Total | 235 (100.0%) | 372 (100.0%) |
Housing Occupancy in Fort Ashby
Occupancy by Ownership in Fort Ashby
Of the total 596 dwellings in Fort Ashby, owner-occupied units account for 454 (76.2%), while renter-occupied units make up 142 (23.8%).
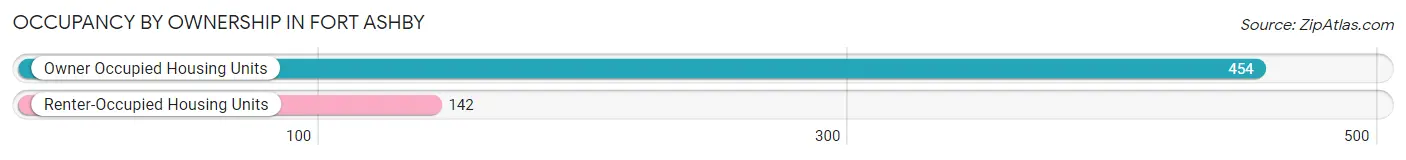
| Occupancy | # Housing Units | % Housing Units |
| Owner Occupied Housing Units | 454 | 76.2% |
| Renter-Occupied Housing Units | 142 | 23.8% |
| Total Occupied Housing Units | 596 | 100.0% |
Occupancy by Household Size in Fort Ashby
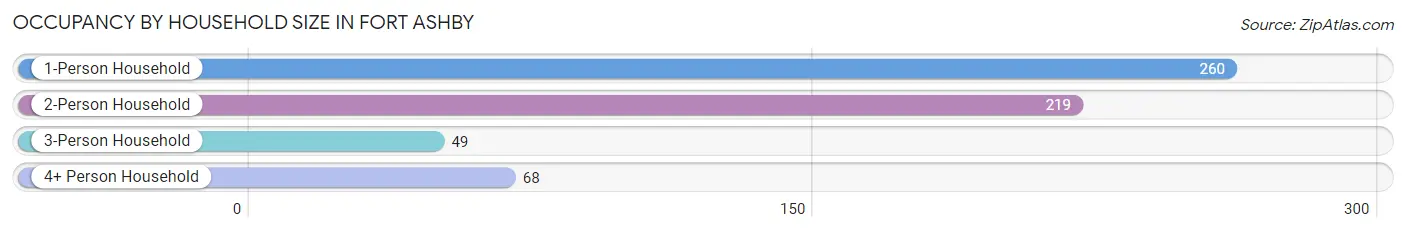
| Household Size | # Housing Units | % Housing Units |
| 1-Person Household | 260 | 43.6% |
| 2-Person Household | 219 | 36.7% |
| 3-Person Household | 49 | 8.2% |
| 4+ Person Household | 68 | 11.4% |
| Total Housing Units | 596 | 100.0% |
Occupancy by Ownership by Household Size in Fort Ashby
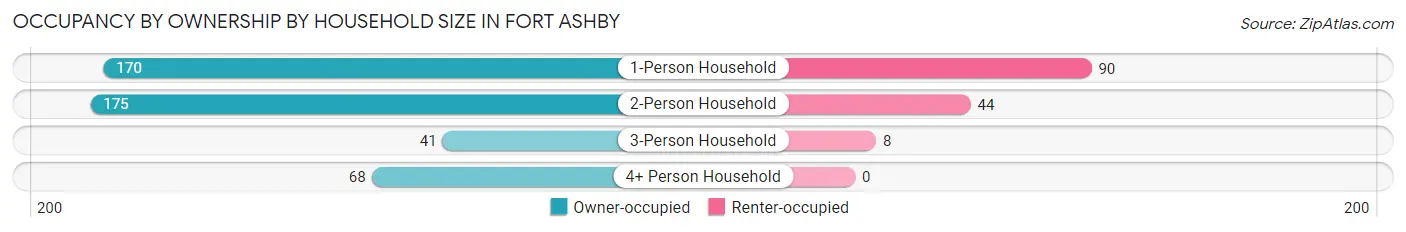
| Household Size | Owner-occupied | Renter-occupied |
| 1-Person Household | 170 (65.4%) | 90 (34.6%) |
| 2-Person Household | 175 (79.9%) | 44 (20.1%) |
| 3-Person Household | 41 (83.7%) | 8 (16.3%) |
| 4+ Person Household | 68 (100.0%) | 0 (0.0%) |
| Total Housing Units | 454 (76.2%) | 142 (23.8%) |
Occupancy by Educational Attainment in Fort Ashby
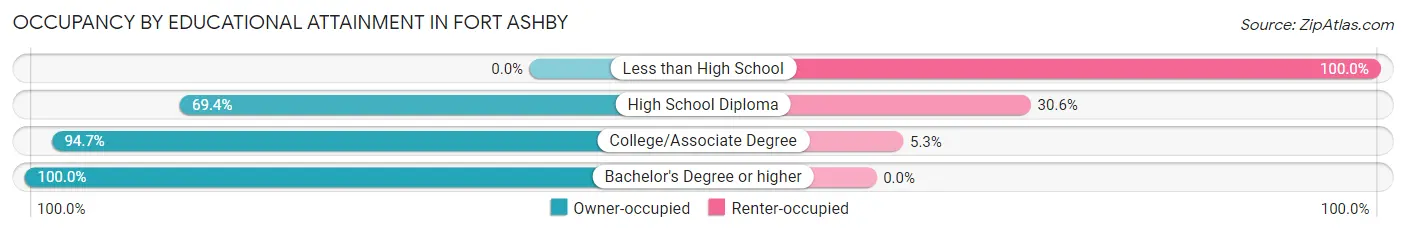
| Household Size | Owner-occupied | Renter-occupied |
| Less than High School | 0 (0.0%) | 13 (100.0%) |
| High School Diploma | 274 (69.4%) | 121 (30.6%) |
| College/Associate Degree | 142 (94.7%) | 8 (5.3%) |
| Bachelor's Degree or higher | 38 (100.0%) | 0 (0.0%) |
Occupancy by Age of Householder in Fort Ashby
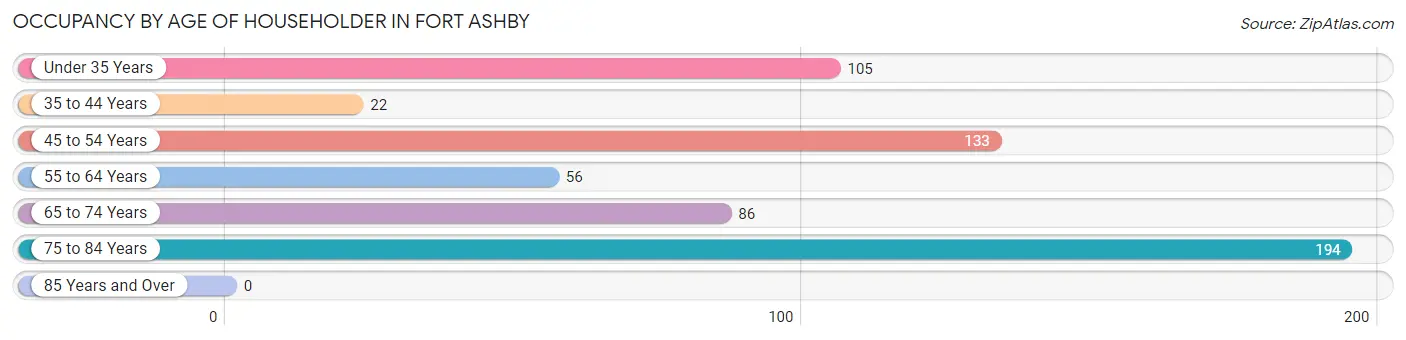
| Age Bracket | # Households | % Households |
| Under 35 Years | 105 | 17.6% |
| 35 to 44 Years | 22 | 3.7% |
| 45 to 54 Years | 133 | 22.3% |
| 55 to 64 Years | 56 | 9.4% |
| 65 to 74 Years | 86 | 14.4% |
| 75 to 84 Years | 194 | 32.6% |
| 85 Years and Over | 0 | 0.0% |
| Total | 596 | 100.0% |
Housing Finances in Fort Ashby
Median Income by Occupancy in Fort Ashby
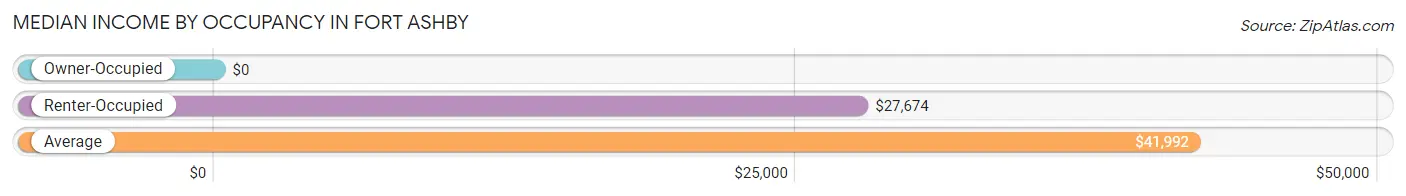
| Occupancy Type | # Households | Median Income |
| Owner-Occupied | 454 (76.2%) | $0 |
| Renter-Occupied | 142 (23.8%) | $27,674 |
| Average | 596 (100.0%) | $41,992 |
Occupancy by Householder Income Bracket in Fort Ashby
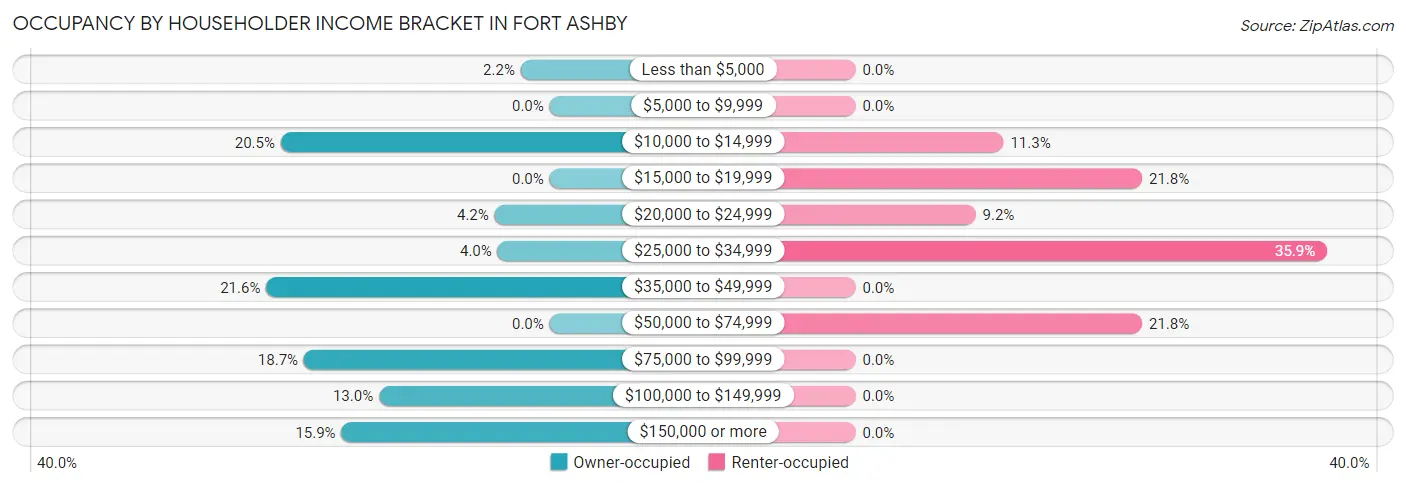
| Income Bracket | Owner-occupied | Renter-occupied |
| Less than $5,000 | 10 (2.2%) | 0 (0.0%) |
| $5,000 to $9,999 | 0 (0.0%) | 0 (0.0%) |
| $10,000 to $14,999 | 93 (20.5%) | 16 (11.3%) |
| $15,000 to $19,999 | 0 (0.0%) | 31 (21.8%) |
| $20,000 to $24,999 | 19 (4.2%) | 13 (9.1%) |
| $25,000 to $34,999 | 18 (4.0%) | 51 (35.9%) |
| $35,000 to $49,999 | 98 (21.6%) | 0 (0.0%) |
| $50,000 to $74,999 | 0 (0.0%) | 31 (21.8%) |
| $75,000 to $99,999 | 85 (18.7%) | 0 (0.0%) |
| $100,000 to $149,999 | 59 (13.0%) | 0 (0.0%) |
| $150,000 or more | 72 (15.9%) | 0 (0.0%) |
| Total | 454 (100.0%) | 142 (100.0%) |
Monthly Housing Cost Tiers in Fort Ashby
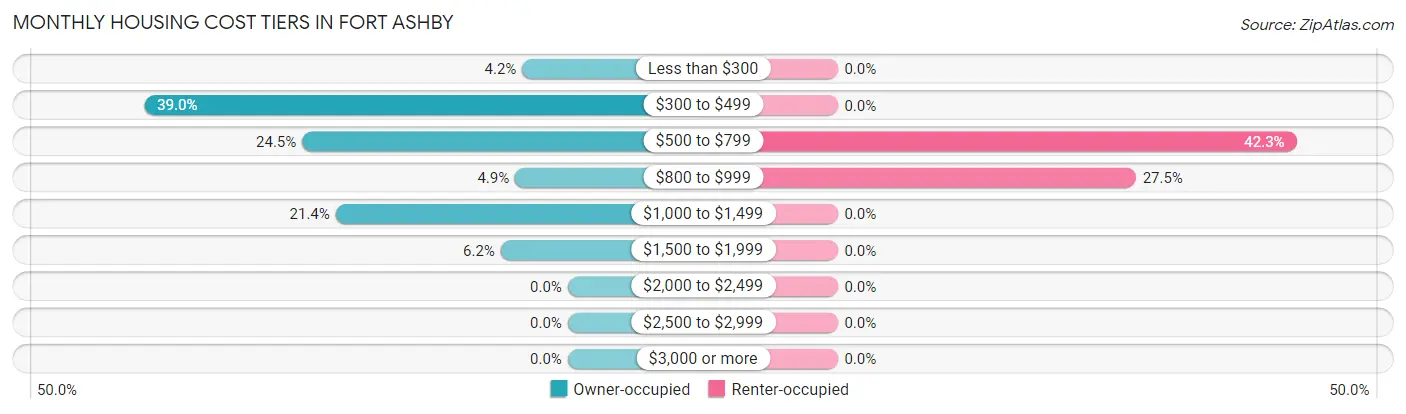
| Monthly Cost | Owner-occupied | Renter-occupied |
| Less than $300 | 19 (4.2%) | 0 (0.0%) |
| $300 to $499 | 177 (39.0%) | 0 (0.0%) |
| $500 to $799 | 111 (24.4%) | 60 (42.2%) |
| $800 to $999 | 22 (4.9%) | 39 (27.5%) |
| $1,000 to $1,499 | 97 (21.4%) | 0 (0.0%) |
| $1,500 to $1,999 | 28 (6.2%) | 0 (0.0%) |
| $2,000 to $2,499 | 0 (0.0%) | 0 (0.0%) |
| $2,500 to $2,999 | 0 (0.0%) | 0 (0.0%) |
| $3,000 or more | 0 (0.0%) | 0 (0.0%) |
| Total | 454 (100.0%) | 142 (100.0%) |
Physical Housing Characteristics in Fort Ashby
Housing Structures in Fort Ashby
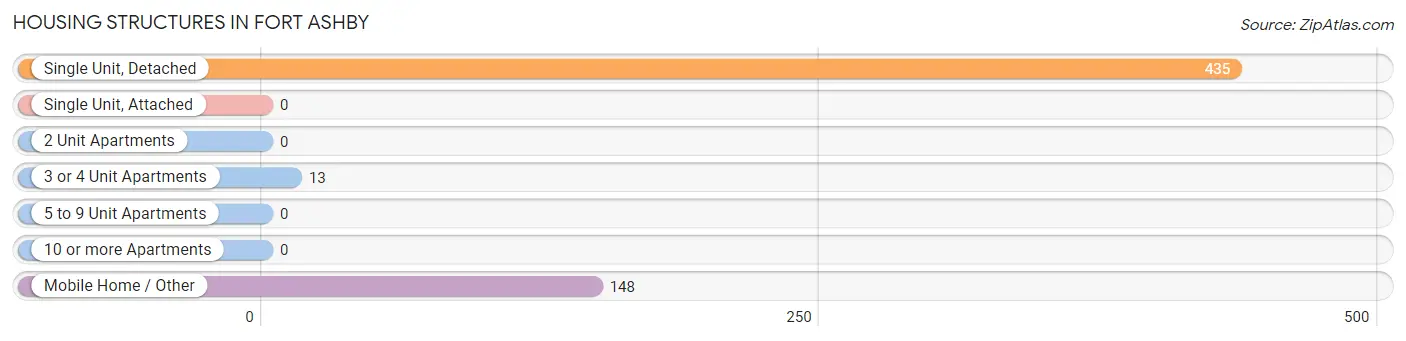
| Structure Type | # Housing Units | % Housing Units |
| Single Unit, Detached | 435 | 73.0% |
| Single Unit, Attached | 0 | 0.0% |
| 2 Unit Apartments | 0 | 0.0% |
| 3 or 4 Unit Apartments | 13 | 2.2% |
| 5 to 9 Unit Apartments | 0 | 0.0% |
| 10 or more Apartments | 0 | 0.0% |
| Mobile Home / Other | 148 | 24.8% |
| Total | 596 | 100.0% |
Housing Structures by Occupancy in Fort Ashby
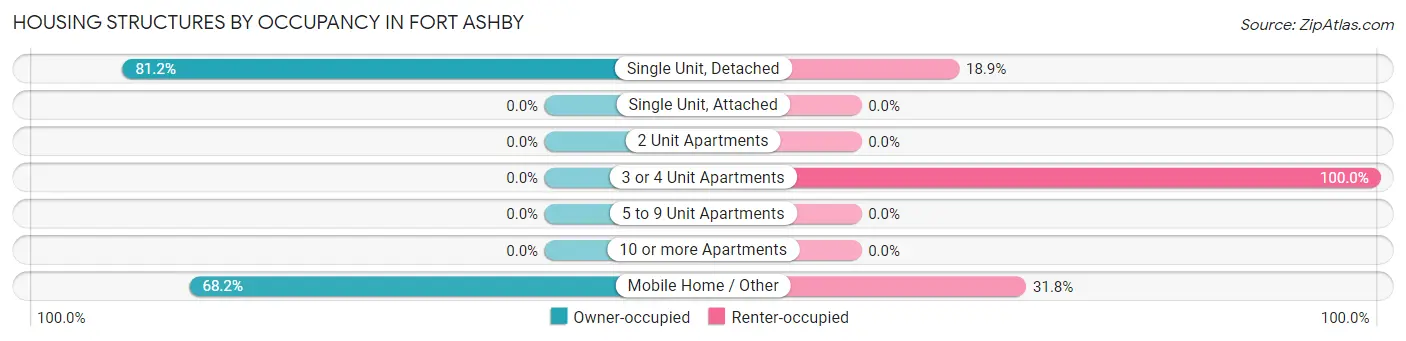
| Structure Type | Owner-occupied | Renter-occupied |
| Single Unit, Detached | 353 (81.1%) | 82 (18.9%) |
| Single Unit, Attached | 0 (0.0%) | 0 (0.0%) |
| 2 Unit Apartments | 0 (0.0%) | 0 (0.0%) |
| 3 or 4 Unit Apartments | 0 (0.0%) | 13 (100.0%) |
| 5 to 9 Unit Apartments | 0 (0.0%) | 0 (0.0%) |
| 10 or more Apartments | 0 (0.0%) | 0 (0.0%) |
| Mobile Home / Other | 101 (68.2%) | 47 (31.8%) |
| Total | 454 (76.2%) | 142 (23.8%) |
Housing Structures by Number of Rooms in Fort Ashby
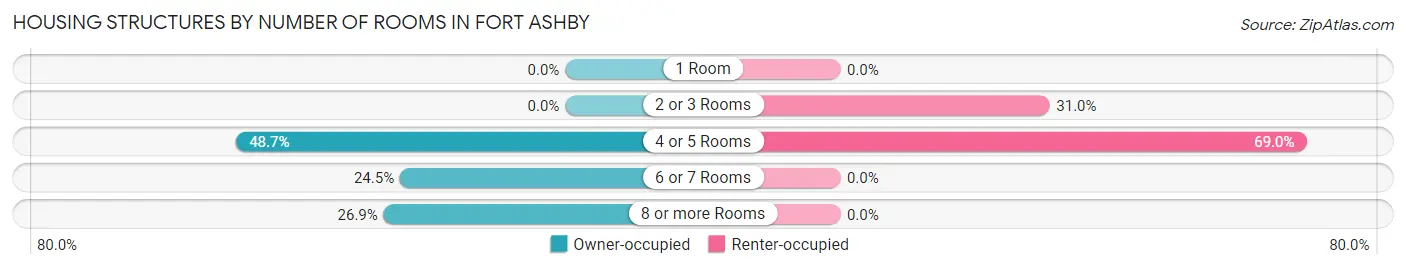
| Number of Rooms | Owner-occupied | Renter-occupied |
| 1 Room | 0 (0.0%) | 0 (0.0%) |
| 2 or 3 Rooms | 0 (0.0%) | 44 (31.0%) |
| 4 or 5 Rooms | 221 (48.7%) | 98 (69.0%) |
| 6 or 7 Rooms | 111 (24.4%) | 0 (0.0%) |
| 8 or more Rooms | 122 (26.9%) | 0 (0.0%) |
| Total | 454 (100.0%) | 142 (100.0%) |
Housing Structure by Heating Type in Fort Ashby
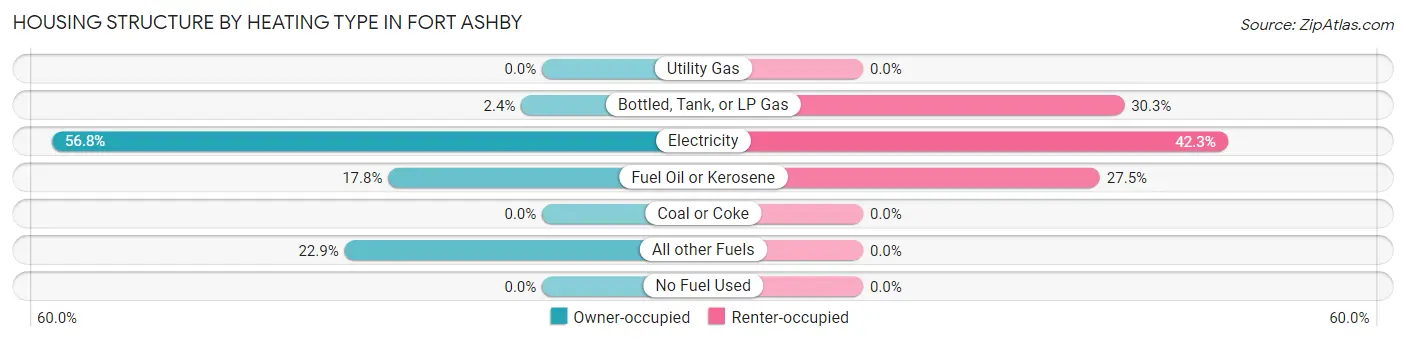
| Heating Type | Owner-occupied | Renter-occupied |
| Utility Gas | 0 (0.0%) | 0 (0.0%) |
| Bottled, Tank, or LP Gas | 11 (2.4%) | 43 (30.3%) |
| Electricity | 258 (56.8%) | 60 (42.2%) |
| Fuel Oil or Kerosene | 81 (17.8%) | 39 (27.5%) |
| Coal or Coke | 0 (0.0%) | 0 (0.0%) |
| All other Fuels | 104 (22.9%) | 0 (0.0%) |
| No Fuel Used | 0 (0.0%) | 0 (0.0%) |
| Total | 454 (100.0%) | 142 (100.0%) |
Household Vehicle Usage in Fort Ashby
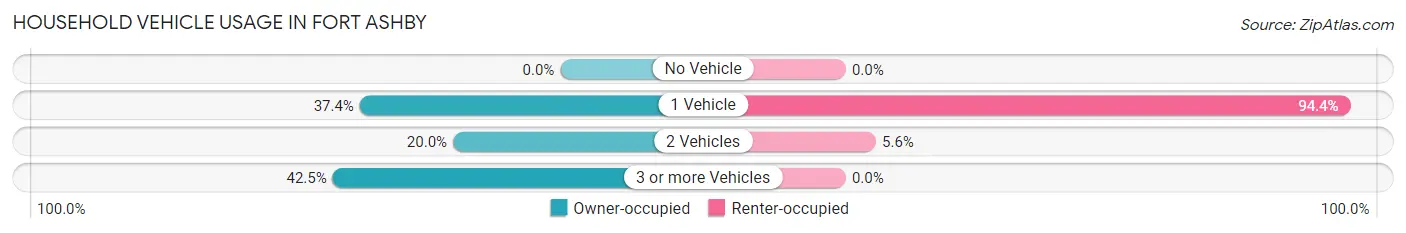
| Vehicles per Household | Owner-occupied | Renter-occupied |
| No Vehicle | 0 (0.0%) | 0 (0.0%) |
| 1 Vehicle | 170 (37.4%) | 134 (94.4%) |
| 2 Vehicles | 91 (20.0%) | 8 (5.6%) |
| 3 or more Vehicles | 193 (42.5%) | 0 (0.0%) |
| Total | 454 (100.0%) | 142 (100.0%) |
Real Estate & Mortgages in Fort Ashby
Real Estate and Mortgage Overview in Fort Ashby
| Characteristic | Without Mortgage | With Mortgage |
| Housing Units | 307 | 147 |
| Median Property Value | $146,200 | $182,800 |
| Median Household Income | - | - |
| Monthly Housing Costs | $456 | $0 |
| Real Estate Taxes | $905 | $0 |
Property Value by Mortgage Status in Fort Ashby
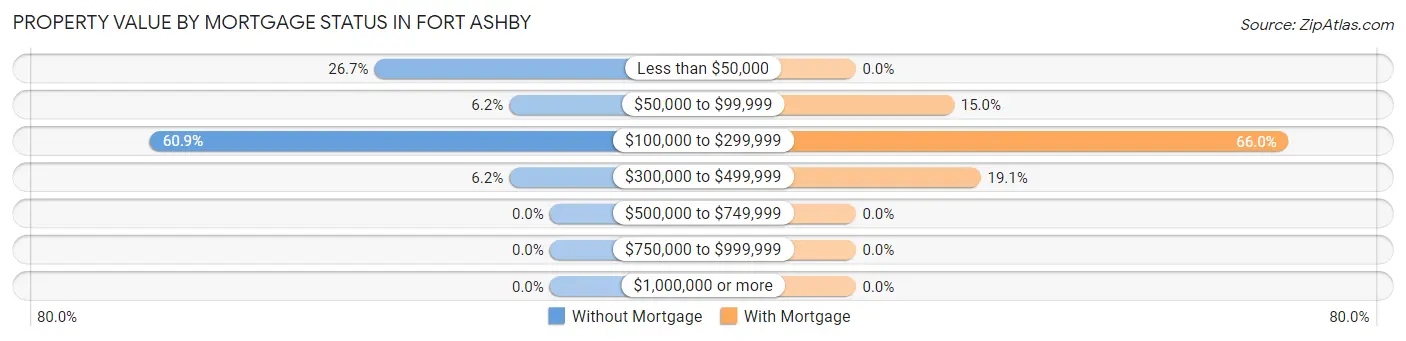
| Property Value | Without Mortgage | With Mortgage |
| Less than $50,000 | 82 (26.7%) | 0 (0.0%) |
| $50,000 to $99,999 | 19 (6.2%) | 22 (15.0%) |
| $100,000 to $299,999 | 187 (60.9%) | 97 (66.0%) |
| $300,000 to $499,999 | 19 (6.2%) | 28 (19.1%) |
| $500,000 to $749,999 | 0 (0.0%) | 0 (0.0%) |
| $750,000 to $999,999 | 0 (0.0%) | 0 (0.0%) |
| $1,000,000 or more | 0 (0.0%) | 0 (0.0%) |
| Total | 307 (100.0%) | 147 (100.0%) |
Household Income by Mortgage Status in Fort Ashby
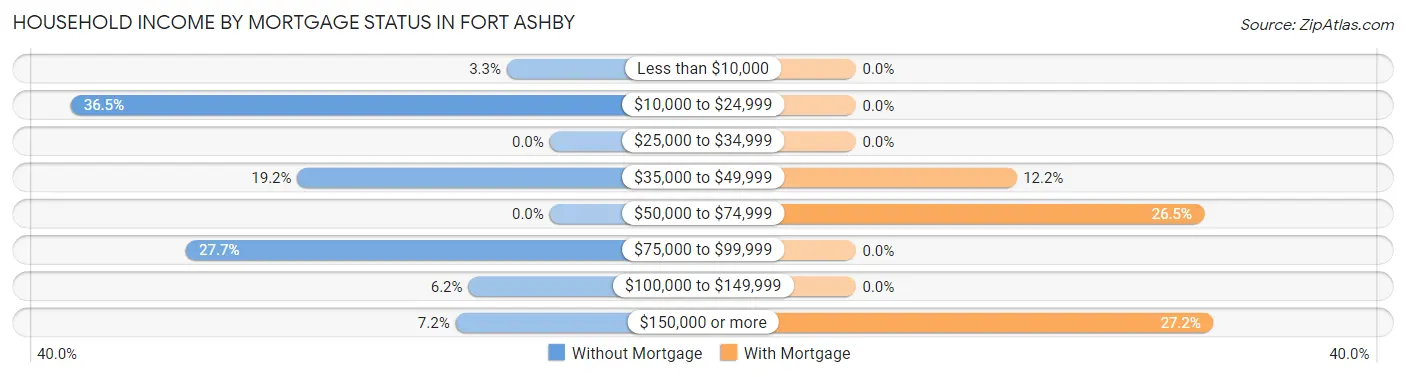
| Household Income | Without Mortgage | With Mortgage |
| Less than $10,000 | 10 (3.3%) | 0 (0.0%) |
| $10,000 to $24,999 | 112 (36.5%) | 0 (0.0%) |
| $25,000 to $34,999 | 0 (0.0%) | 0 (0.0%) |
| $35,000 to $49,999 | 59 (19.2%) | 18 (12.2%) |
| $50,000 to $74,999 | 0 (0.0%) | 39 (26.5%) |
| $75,000 to $99,999 | 85 (27.7%) | 0 (0.0%) |
| $100,000 to $149,999 | 19 (6.2%) | 0 (0.0%) |
| $150,000 or more | 22 (7.2%) | 40 (27.2%) |
| Total | 307 (100.0%) | 147 (100.0%) |
Property Value to Household Income Ratio in Fort Ashby
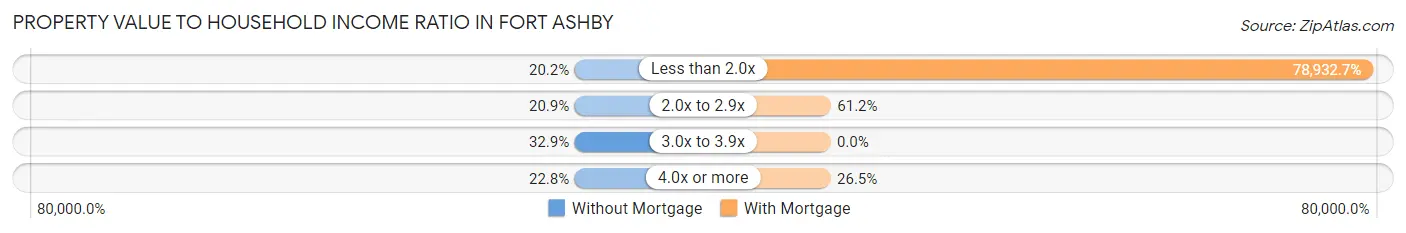
| Value-to-Income Ratio | Without Mortgage | With Mortgage |
| Less than 2.0x | 62 (20.2%) | 116,031 (78,932.7%) |
| 2.0x to 2.9x | 64 (20.8%) | 90 (61.2%) |
| 3.0x to 3.9x | 101 (32.9%) | 0 (0.0%) |
| 4.0x or more | 70 (22.8%) | 39 (26.5%) |
| Total | 307 (100.0%) | 147 (100.0%) |
Real Estate Taxes by Mortgage Status in Fort Ashby
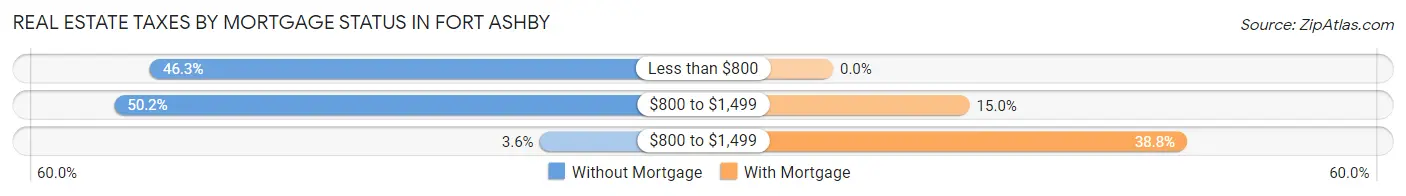
| Property Taxes | Without Mortgage | With Mortgage |
| Less than $800 | 142 (46.3%) | 0 (0.0%) |
| $800 to $1,499 | 154 (50.2%) | 22 (15.0%) |
| $800 to $1,499 | 11 (3.6%) | 57 (38.8%) |
| Total | 307 (100.0%) | 147 (100.0%) |
Health & Disability in Fort Ashby
Health Insurance Coverage by Age in Fort Ashby
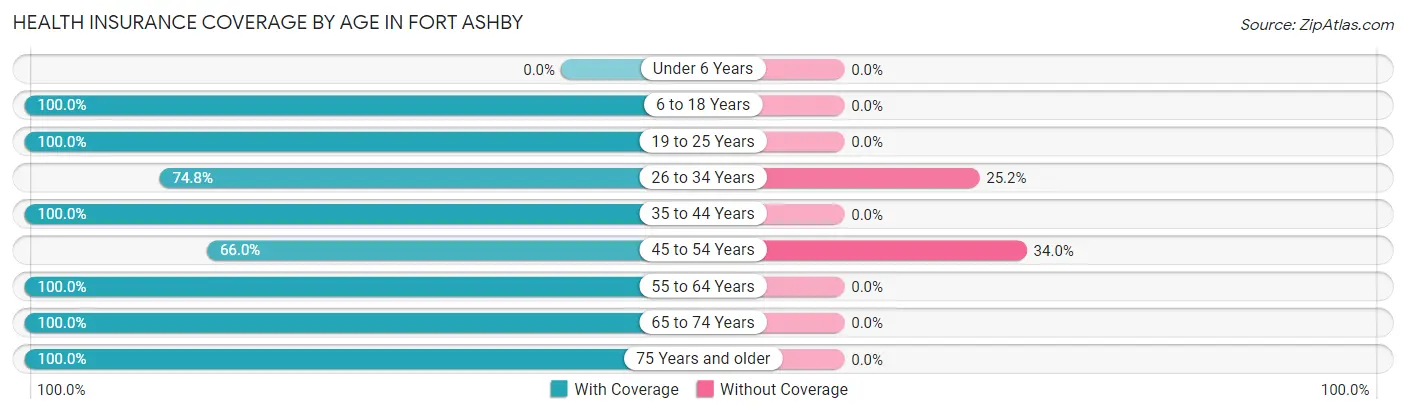
| Age Bracket | With Coverage | Without Coverage |
| Under 6 Years | 0 (0.0%) | 0 (0.0%) |
| 6 to 18 Years | 68 (100.0%) | 0 (0.0%) |
| 19 to 25 Years | 196 (100.0%) | 0 (0.0%) |
| 26 to 34 Years | 107 (74.8%) | 36 (25.2%) |
| 35 to 44 Years | 48 (100.0%) | 0 (0.0%) |
| 45 to 54 Years | 163 (66.0%) | 84 (34.0%) |
| 55 to 64 Years | 92 (100.0%) | 0 (0.0%) |
| 65 to 74 Years | 129 (100.0%) | 0 (0.0%) |
| 75 Years and older | 251 (100.0%) | 0 (0.0%) |
| Total | 1,054 (89.8%) | 120 (10.2%) |
Health Insurance Coverage by Citizenship Status in Fort Ashby
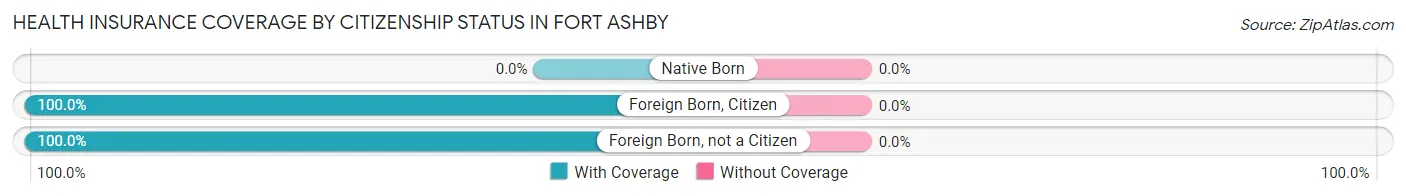
| Citizenship Status | With Coverage | Without Coverage |
| Native Born | 0 (0.0%) | 0 (0.0%) |
| Foreign Born, Citizen | 68 (100.0%) | 0 (0.0%) |
| Foreign Born, not a Citizen | 196 (100.0%) | 0 (0.0%) |
Health Insurance Coverage by Household Income in Fort Ashby
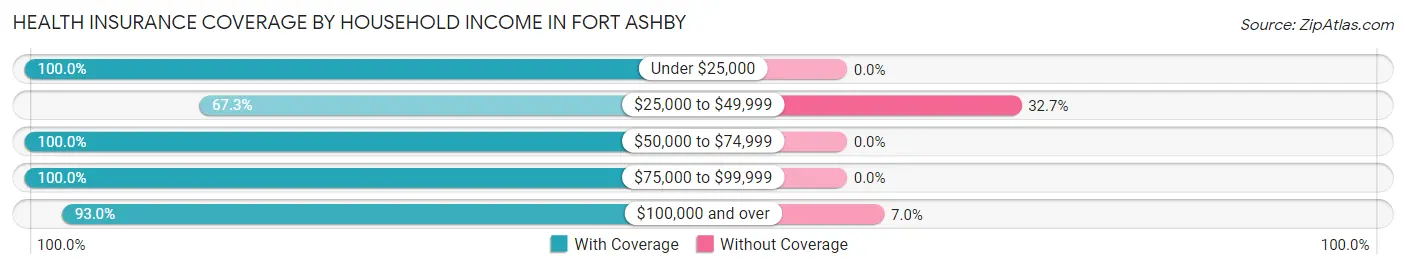
| Household Income | With Coverage | Without Coverage |
| Under $25,000 | 209 (100.0%) | 0 (0.0%) |
| $25,000 to $49,999 | 173 (67.3%) | 84 (32.7%) |
| $50,000 to $74,999 | 72 (100.0%) | 0 (0.0%) |
| $75,000 to $99,999 | 121 (100.0%) | 0 (0.0%) |
| $100,000 and over | 479 (93.0%) | 36 (7.0%) |
Public vs Private Health Insurance Coverage by Age in Fort Ashby
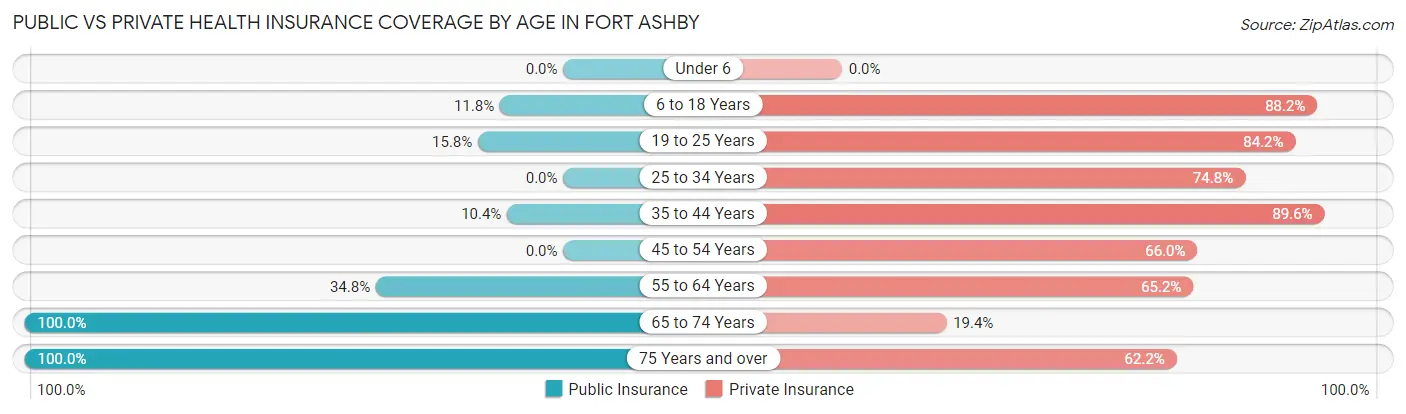
| Age Bracket | Public Insurance | Private Insurance |
| Under 6 | 0 (0.0%) | 0 (0.0%) |
| 6 to 18 Years | 8 (11.8%) | 60 (88.2%) |
| 19 to 25 Years | 31 (15.8%) | 165 (84.2%) |
| 25 to 34 Years | 0 (0.0%) | 107 (74.8%) |
| 35 to 44 Years | 5 (10.4%) | 43 (89.6%) |
| 45 to 54 Years | 0 (0.0%) | 163 (66.0%) |
| 55 to 64 Years | 32 (34.8%) | 60 (65.2%) |
| 65 to 74 Years | 129 (100.0%) | 25 (19.4%) |
| 75 Years and over | 251 (100.0%) | 156 (62.2%) |
| Total | 456 (38.8%) | 779 (66.3%) |
Disability Status by Sex by Age in Fort Ashby
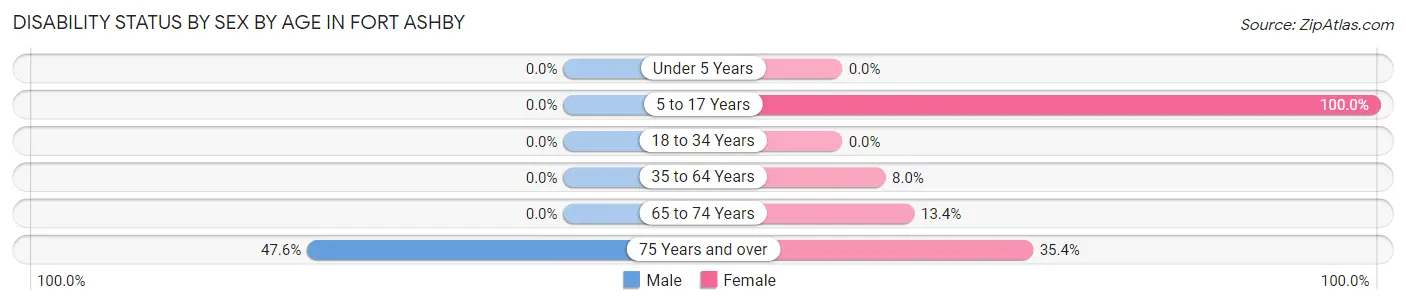
| Age Bracket | Male | Female |
| Under 5 Years | 0 (0.0%) | 0 (0.0%) |
| 5 to 17 Years | 0 (0.0%) | 8 (100.0%) |
| 18 to 34 Years | 0 (0.0%) | 0 (0.0%) |
| 35 to 64 Years | 0 (0.0%) | 16 (8.0%) |
| 65 to 74 Years | 0 (0.0%) | 11 (13.4%) |
| 75 Years and over | 59 (47.6%) | 45 (35.4%) |
Disability Class by Sex by Age in Fort Ashby
Disability Class: Hearing Difficulty
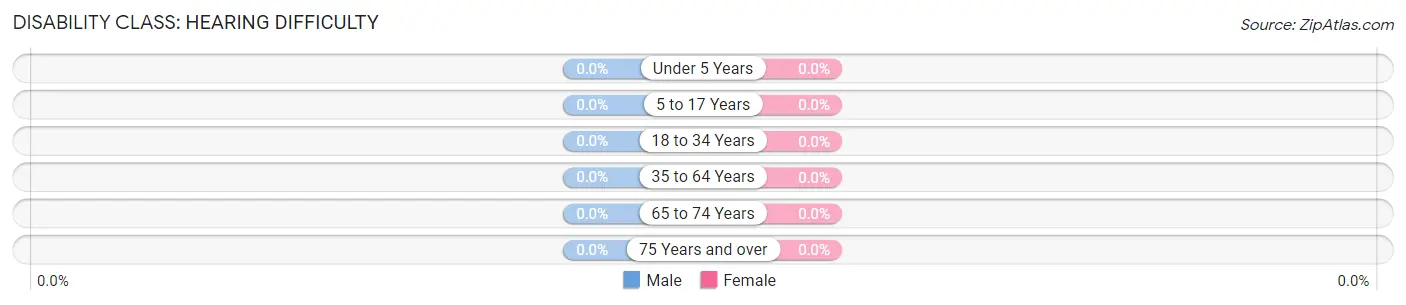
| Age Bracket | Male | Female |
| Under 5 Years | 0 (0.0%) | 0 (0.0%) |
| 5 to 17 Years | 0 (0.0%) | 0 (0.0%) |
| 18 to 34 Years | 0 (0.0%) | 0 (0.0%) |
| 35 to 64 Years | 0 (0.0%) | 0 (0.0%) |
| 65 to 74 Years | 0 (0.0%) | 0 (0.0%) |
| 75 Years and over | 0 (0.0%) | 0 (0.0%) |
Disability Class: Vision Difficulty
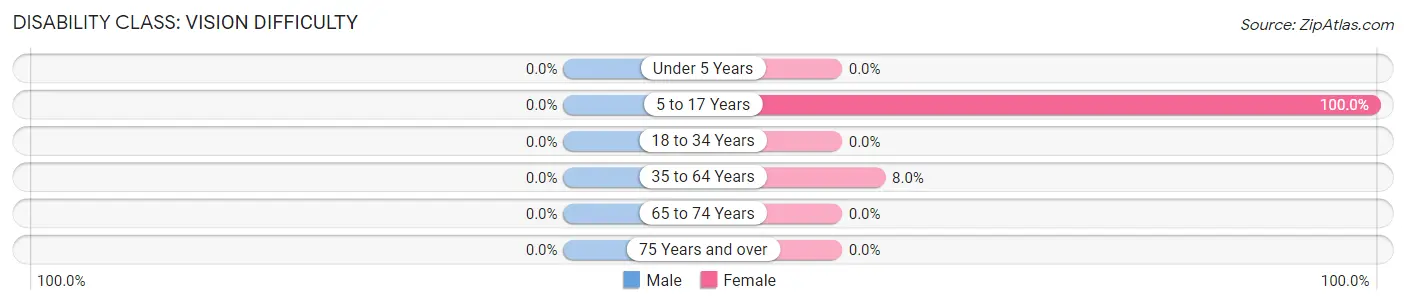
| Age Bracket | Male | Female |
| Under 5 Years | 0 (0.0%) | 0 (0.0%) |
| 5 to 17 Years | 0 (0.0%) | 8 (100.0%) |
| 18 to 34 Years | 0 (0.0%) | 0 (0.0%) |
| 35 to 64 Years | 0 (0.0%) | 16 (8.0%) |
| 65 to 74 Years | 0 (0.0%) | 0 (0.0%) |
| 75 Years and over | 0 (0.0%) | 0 (0.0%) |
Disability Class: Cognitive Difficulty
| Age Bracket | Male | Female |
| 5 to 17 Years | 0 (0.0%) | 0 (0.0%) |
| 18 to 34 Years | 0 (0.0%) | 0 (0.0%) |
| 35 to 64 Years | 0 (0.0%) | 0 (0.0%) |
| 65 to 74 Years | 0 (0.0%) | 0 (0.0%) |
| 75 Years and over | 0 (0.0%) | 0 (0.0%) |
Disability Class: Ambulatory Difficulty
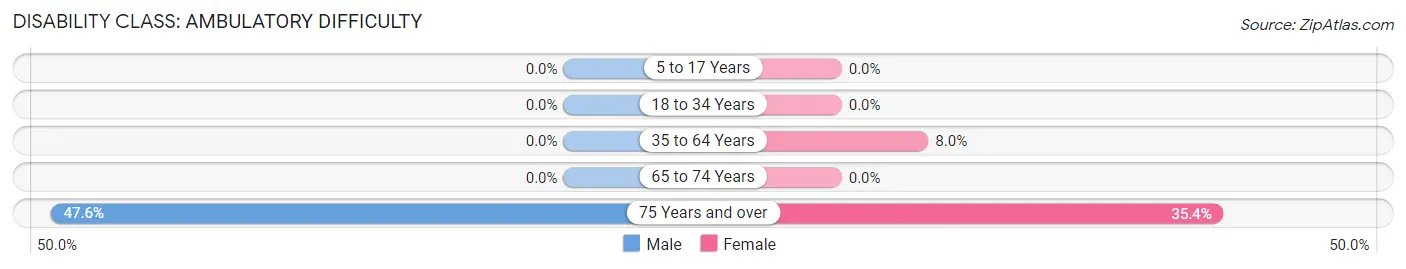
| Age Bracket | Male | Female |
| 5 to 17 Years | 0 (0.0%) | 0 (0.0%) |
| 18 to 34 Years | 0 (0.0%) | 0 (0.0%) |
| 35 to 64 Years | 0 (0.0%) | 16 (8.0%) |
| 65 to 74 Years | 0 (0.0%) | 0 (0.0%) |
| 75 Years and over | 59 (47.6%) | 45 (35.4%) |
Disability Class: Self-Care Difficulty
| Age Bracket | Male | Female |
| 5 to 17 Years | 0 (0.0%) | 0 (0.0%) |
| 18 to 34 Years | 0 (0.0%) | 0 (0.0%) |
| 35 to 64 Years | 0 (0.0%) | 0 (0.0%) |
| 65 to 74 Years | 0 (0.0%) | 0 (0.0%) |
| 75 Years and over | 0 (0.0%) | 0 (0.0%) |
Technology Access in Fort Ashby
Computing Device Access in Fort Ashby
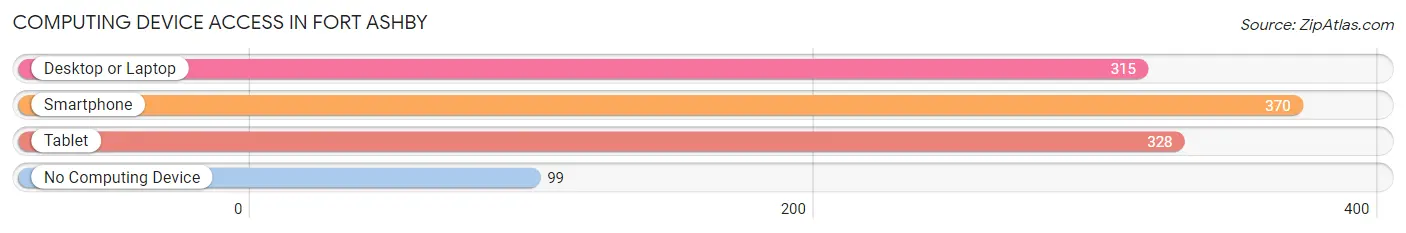
| Device Type | # Households | % Households |
| Desktop or Laptop | 315 | 52.8% |
| Smartphone | 370 | 62.1% |
| Tablet | 328 | 55.0% |
| No Computing Device | 99 | 16.6% |
| Total | 596 | 100.0% |
Internet Access in Fort Ashby
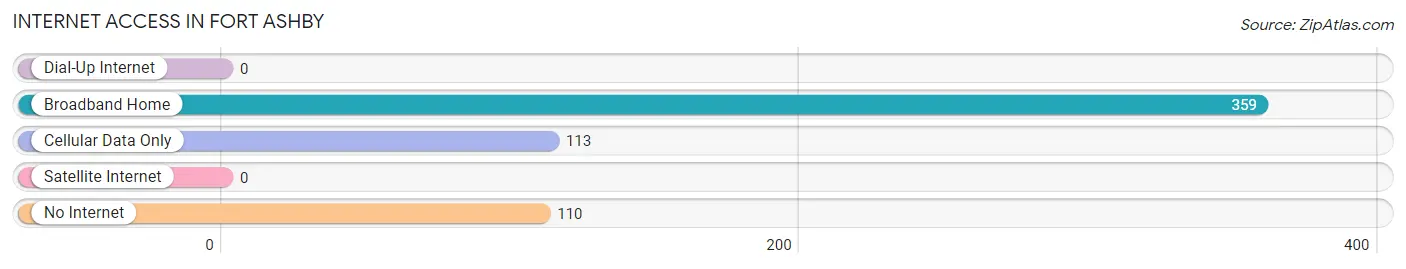
| Internet Type | # Households | % Households |
| Dial-Up Internet | 0 | 0.0% |
| Broadband Home | 359 | 60.2% |
| Cellular Data Only | 113 | 19.0% |
| Satellite Internet | 0 | 0.0% |
| No Internet | 110 | 18.5% |
| Total | 596 | 100.0% |
Fort Ashby Summary
Introduction
Fort Ashby is a census-designated place (CDP) located in Mineral County, West Virginia. It is situated along the Potomac River, near the Maryland border. The population of Fort Ashby was 1,717 at the 2010 census. The town is named after General Edward Braddock’s fort, which was built in 1755 during the French and Indian War.
History
Fort Ashby was first settled in 1755 by General Edward Braddock and his troops. The fort was built to protect the settlers from Native American attacks. The fort was abandoned in 1758, but the settlement remained. The town was officially established in 1790 and was named after the fort.
In the early 19th century, Fort Ashby was a major stop on the National Road, which connected the east coast to the Ohio River Valley. The town was also a major stop on the Baltimore and Ohio Railroad.
In the late 19th century, Fort Ashby became a major coal mining center. The town was home to several coal mines, including the Fort Ashby Coal Company, which operated from 1891 to 1921.
Geography
Fort Ashby is located at 39°30'25" North, 78°51'45" West (39.506944, -78.862500). The town is situated along the Potomac River, near the Maryland border.
According to the United States Census Bureau, the CDP has a total area of 4.2 square miles (10.8 km2), all of it land.
Economy
The economy of Fort Ashby is largely based on agriculture and tourism. The town is home to several farms, including the Fort Ashby Farm, which produces beef, pork, and poultry.
The town is also a popular tourist destination. The Fort Ashby Historic District is listed on the National Register of Historic Places and includes several historic buildings, including the Fort Ashby Hotel, which was built in 1820.
Demographics
As of the 2010 census, there were 1,717 people, 717 households, and 463 families residing in the CDP. The population density was 408.3 people per square mile (157.7/km2). There were 809 housing units at an average density of 193.3 per square mile (74.5/km2). The racial makeup of the CDP was 97.2% White, 0.9% African American, 0.2% Native American, 0.2% Asian, 0.1% Pacific Islander, 0.2% from other races, and 1.2% from two or more races. Hispanic or Latino of any race were 0.7% of the population.
There were 717 households, out of which 28.2% had children under the age of 18 living with them, 46.2% were married couples living together, 12.7% had a female householder with no husband present, and 36.2% were non-families. 32.2% of all households were made up of individuals, and 15.2% had someone living alone who was 65 years of age or older. The average household size was 2.37 and the average family size was 2.97.
In the CDP, the population was spread out, with 24.2% under the age of 18, 7.2% from 18 to 24, 27.2% from 25 to 44, 24.2% from 45 to 64, and 17.2% who were 65 years of age or older. The median age was 39 years. For every 100 females, there were 91.2 males. For every 100 females age 18 and over, there were 87.2 males.
The median income for a household in the CDP was $30,938, and the median income for a family was $37,500. Males had a median income of $30,000 versus $20,000 for females. The per capita income for the CDP was $15,945. About 11.2% of families and 14.2% of the population were below the poverty line, including 19.2% of those under age 18 and 8.2% of those age 65 or over.
Conclusion
Fort Ashby is a small town located in Mineral County, West Virginia. It is situated along the Potomac River, near the Maryland border. The town was first settled in 1755 and was officially established in 1790. The economy of Fort Ashby is largely based on agriculture and tourism. The population of Fort Ashby was 1,717 at the 2010 census.
Common Questions
What is Per Capita Income in Fort Ashby?
Per Capita income in Fort Ashby is $34,618.
What is the Median Family Income in Fort Ashby?
Median Family Income in Fort Ashby is $76,169.
What is the Median Household income in Fort Ashby?
Median Household Income in Fort Ashby is $41,992.
What is Income or Wage Gap in Fort Ashby?
Income or Wage Gap in Fort Ashby is 71.2%.
Women in Fort Ashby earn 28.8 cents for every dollar earned by a man.
What is Inequality or Gini Index in Fort Ashby?
Inequality or Gini Index in Fort Ashby is 0.49.
What is the Total Population of Fort Ashby?
Total Population of Fort Ashby is 1,174.
What is the Total Male Population of Fort Ashby?
Total Male Population of Fort Ashby is 537.
What is the Total Female Population of Fort Ashby?
Total Female Population of Fort Ashby is 637.
What is the Ratio of Males per 100 Females in Fort Ashby?
There are 84.30 Males per 100 Females in Fort Ashby.
What is the Ratio of Females per 100 Males in Fort Ashby?
There are 118.62 Females per 100 Males in Fort Ashby.
What is the Median Population Age in Fort Ashby?
Median Population Age in Fort Ashby is 50.5 Years.
What is the Average Family Size in Fort Ashby
Average Family Size in Fort Ashby is 2.7 People.
What is the Average Household Size in Fort Ashby
Average Household Size in Fort Ashby is 2.0 People.
How Large is the Labor Force in Fort Ashby?
There are 640 People in the Labor Forcein in Fort Ashby.
What is the Percentage of People in the Labor Force in Fort Ashby?
56.3% of People are in the Labor Force in Fort Ashby.