Thomas, WV Map & Demographics
Thomas Map
Thomas Overview
$30,881
PER CAPITA INCOME
$63,125
AVG FAMILY INCOME
$53,000
AVG HOUSEHOLD INCOME
39.8%
WAGE / INCOME GAP [ % ]
60.2¢/ $1
WAGE / INCOME GAP [ $ ]
0.39
INEQUALITY / GINI INDEX
624
TOTAL POPULATION
300
MALE POPULATION
324
FEMALE POPULATION
92.59
MALES / 100 FEMALES
108.00
FEMALES / 100 MALES
57.0
MEDIAN AGE
3.1
AVG FAMILY SIZE
2.3
AVG HOUSEHOLD SIZE
283
LABOR FORCE [ PEOPLE ]
52.5%
PERCENT IN LABOR FORCE
12.7%
UNEMPLOYMENT RATE
Thomas Zip Codes
Income in Thomas
Income Overview in Thomas
Per Capita Income in Thomas is $30,881, while median incomes of families and households are $63,125 and $53,000 respectively.
| Characteristic | Number | Measure |
| Per Capita Income | 624 | $30,881 |
| Median Family Income | 115 | $63,125 |
| Mean Family Income | 115 | $87,051 |
| Median Household Income | 236 | $53,000 |
| Mean Household Income | 236 | $69,044 |
| Income Deficit | 115 | $0 |
| Wage / Income Gap (%) | 624 | 39.76% |
| Wage / Income Gap ($) | 624 | 60.24¢ per $1 |
| Gini / Inequality Index | 624 | 0.39 |
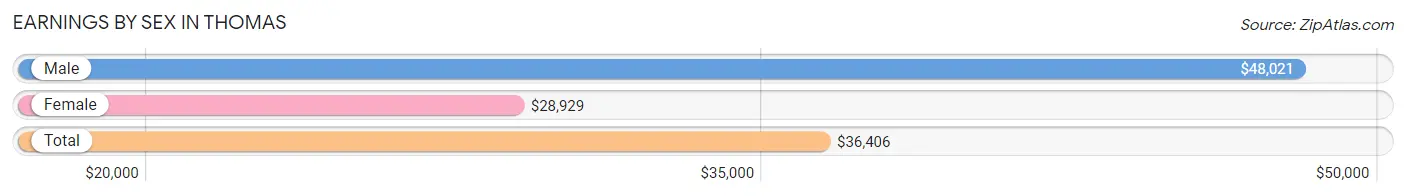
Earnings by Sex in Thomas
Average Earnings in Thomas are $36,406, $48,021 for men and $28,929 for women, a difference of 39.8%.
| Sex | Number | Average Earnings |
| Male | 122 (45.9%) | $48,021 |
| Female | 144 (54.1%) | $28,929 |
| Total | 266 (100.0%) | $36,406 |
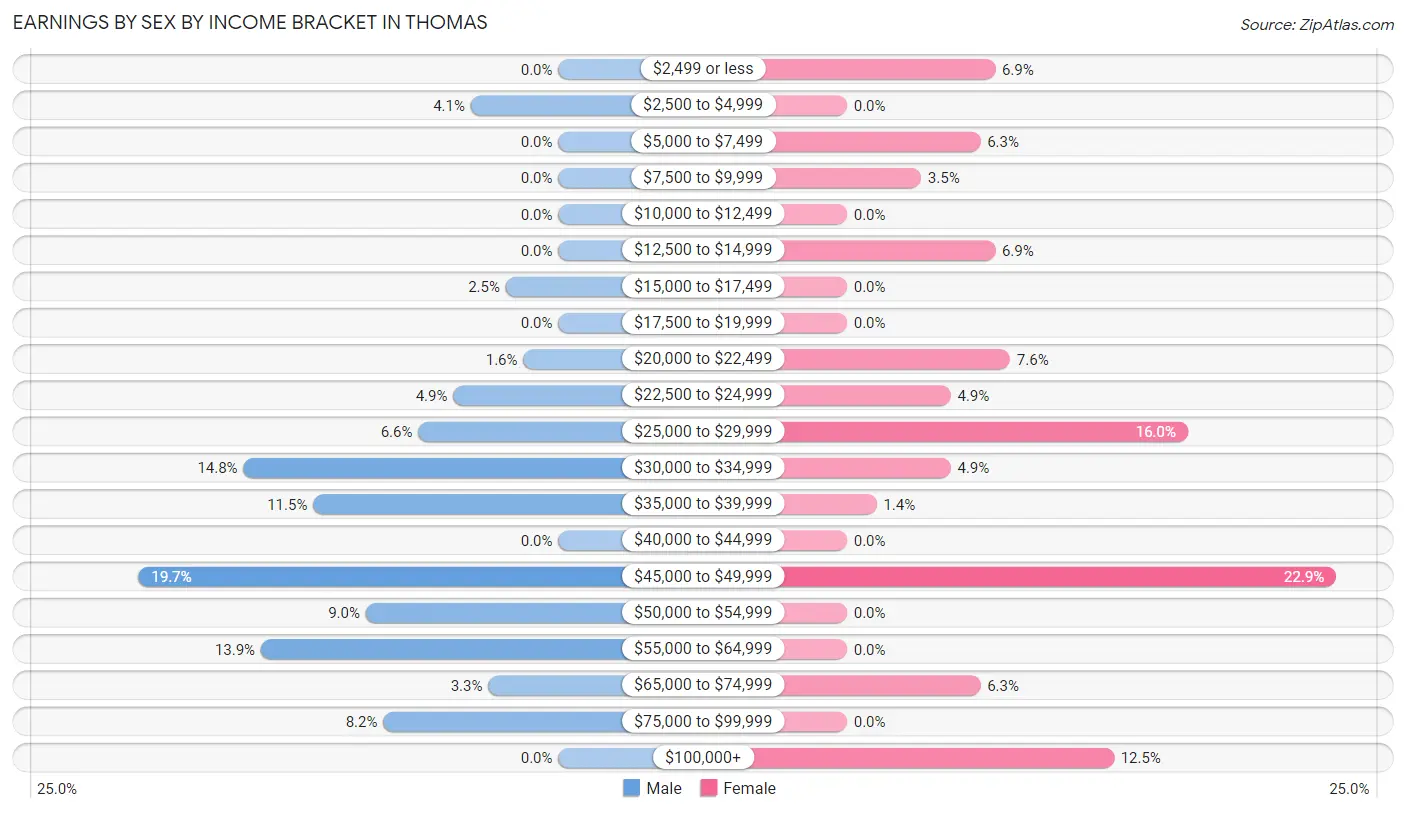
Earnings by Sex by Income Bracket in Thomas
The most common earnings brackets in Thomas are $45,000 to $49,999 for men (24 | 19.7%) and $45,000 to $49,999 for women (33 | 22.9%).
| Income | Male | Female |
| $2,499 or less | 0 (0.0%) | 10 (6.9%) |
| $2,500 to $4,999 | 5 (4.1%) | 0 (0.0%) |
| $5,000 to $7,499 | 0 (0.0%) | 9 (6.2%) |
| $7,500 to $9,999 | 0 (0.0%) | 5 (3.5%) |
| $10,000 to $12,499 | 0 (0.0%) | 0 (0.0%) |
| $12,500 to $14,999 | 0 (0.0%) | 10 (6.9%) |
| $15,000 to $17,499 | 3 (2.5%) | 0 (0.0%) |
| $17,500 to $19,999 | 0 (0.0%) | 0 (0.0%) |
| $20,000 to $22,499 | 2 (1.6%) | 11 (7.6%) |
| $22,500 to $24,999 | 6 (4.9%) | 7 (4.9%) |
| $25,000 to $29,999 | 8 (6.6%) | 23 (16.0%) |
| $30,000 to $34,999 | 18 (14.7%) | 7 (4.9%) |
| $35,000 to $39,999 | 14 (11.5%) | 2 (1.4%) |
| $40,000 to $44,999 | 0 (0.0%) | 0 (0.0%) |
| $45,000 to $49,999 | 24 (19.7%) | 33 (22.9%) |
| $50,000 to $54,999 | 11 (9.0%) | 0 (0.0%) |
| $55,000 to $64,999 | 17 (13.9%) | 0 (0.0%) |
| $65,000 to $74,999 | 4 (3.3%) | 9 (6.2%) |
| $75,000 to $99,999 | 10 (8.2%) | 0 (0.0%) |
| $100,000+ | 0 (0.0%) | 18 (12.5%) |
| Total | 122 (100.0%) | 144 (100.0%) |
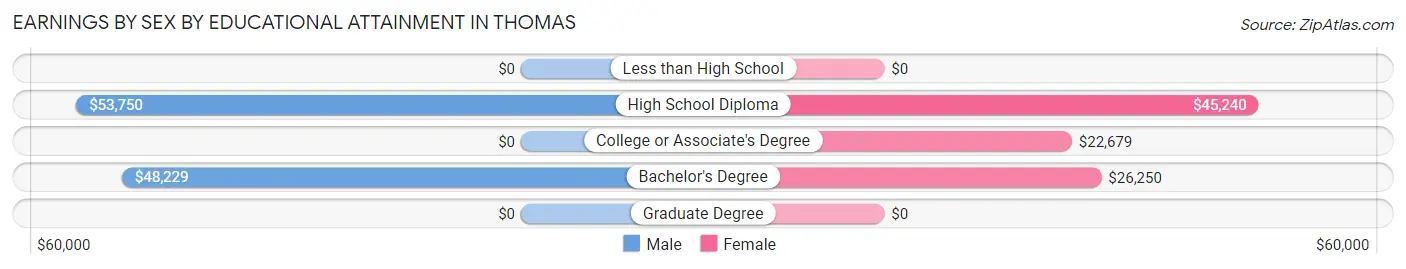
Earnings by Sex by Educational Attainment in Thomas
Average earnings in Thomas are $48,333 for men and $29,107 for women, a difference of 39.8%. Men with an educational attainment of high school diploma enjoy the highest average annual earnings of $53,750, while those with bachelor's degree education earn the least with $48,229. Women with an educational attainment of high school diploma earn the most with the average annual earnings of $45,240, while those with college or associate's degree education have the smallest earnings of $22,679.
| Educational Attainment | Male Income | Female Income |
| Less than High School | - | - |
| High School Diploma | $53,750 | $45,240 |
| College or Associate's Degree | - | - |
| Bachelor's Degree | $48,229 | $26,250 |
| Graduate Degree | - | - |
| Total | $48,333 | $29,107 |
Family Income in Thomas
Family Income Brackets in Thomas
According to the Thomas family income data, there are 41 families falling into the $50,000 to $74,999 income range, which is the most common income bracket and makes up 35.6% of all families.
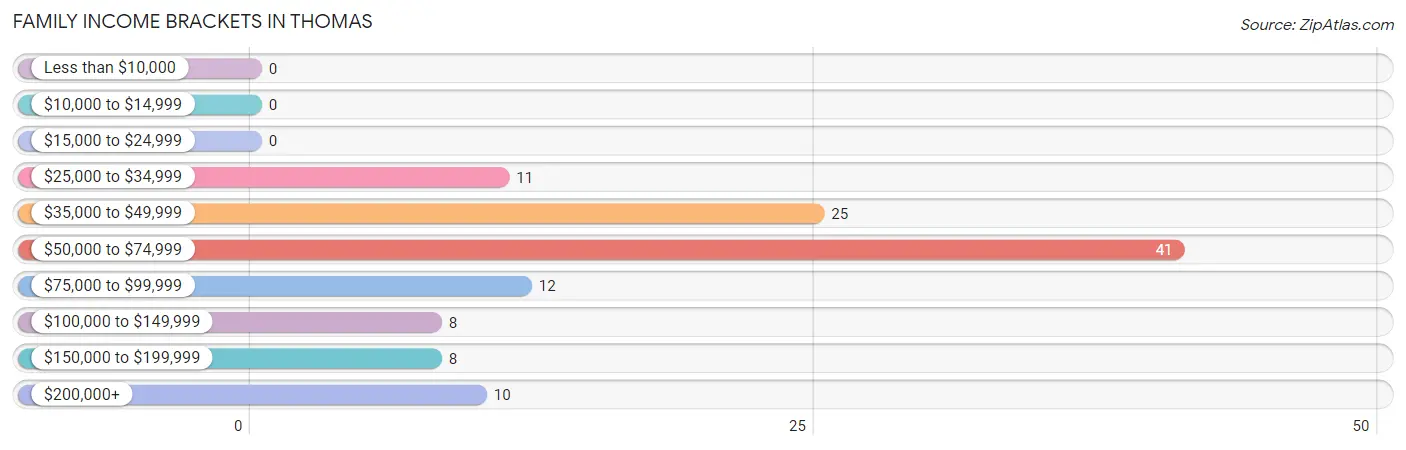
| Income Bracket | # Families | % Families |
| Less than $10,000 | 0 | 0.0% |
| $10,000 to $14,999 | 0 | 0.0% |
| $15,000 to $24,999 | 0 | 0.0% |
| $25,000 to $34,999 | 11 | 9.6% |
| $35,000 to $49,999 | 25 | 21.7% |
| $50,000 to $74,999 | 41 | 35.7% |
| $75,000 to $99,999 | 12 | 10.4% |
| $100,000 to $149,999 | 8 | 7.0% |
| $150,000 to $199,999 | 8 | 7.0% |
| $200,000+ | 10 | 8.7% |
Family Income by Famaliy Size in Thomas
4-person families (53 | 46.1%) account for the highest median family income in Thomas with $63,029 per family, while 2-person families (43 | 37.4%) have the highest median income of $30,375 per family member.
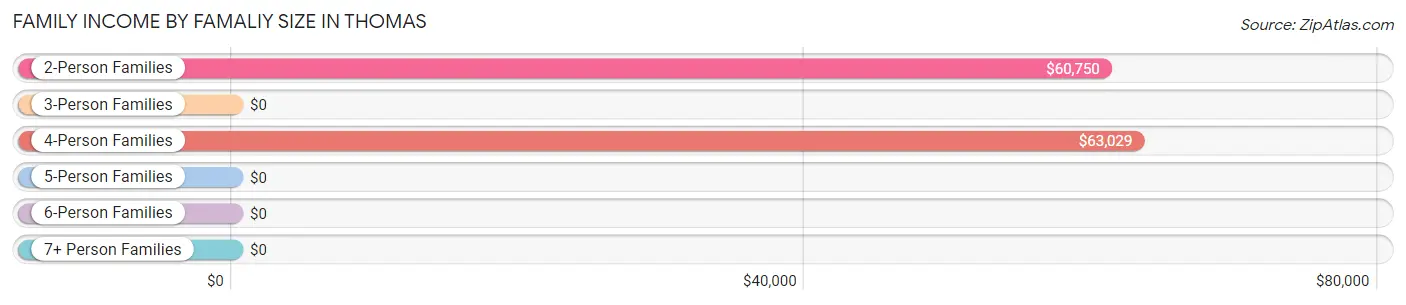
| Income Bracket | # Families | Median Income |
| 2-Person Families | 43 (37.4%) | $60,750 |
| 3-Person Families | 12 (10.4%) | $0 |
| 4-Person Families | 53 (46.1%) | $63,029 |
| 5-Person Families | 7 (6.1%) | $0 |
| 6-Person Families | 0 (0.0%) | $0 |
| 7+ Person Families | 0 (0.0%) | $0 |
| Total | 115 (100.0%) | $63,125 |
Family Income by Number of Earners in Thomas
The median family income in Thomas is $63,125, with families comprising 3+ earners (19) having the highest median family income of $176,042, while families with 2 earners (16) have the lowest median family income of $41,000, accounting for 16.5% and 13.9% of families, respectively.
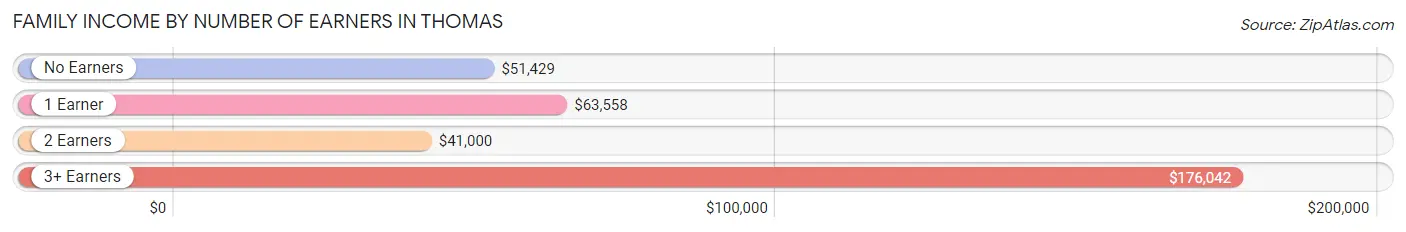
| Number of Earners | # Families | Median Income |
| No Earners | 34 (29.6%) | $51,429 |
| 1 Earner | 46 (40.0%) | $63,558 |
| 2 Earners | 16 (13.9%) | $41,000 |
| 3+ Earners | 19 (16.5%) | $176,042 |
| Total | 115 (100.0%) | $63,125 |
Household Income in Thomas
Household Income Brackets in Thomas
With 73 households falling in the category, the $50,000 to $74,999 income range is the most frequent in Thomas, accounting for 30.9% of all households. In contrast, only 3 households (1.3%) fall into the $10,000 to $14,999 income bracket, making it the least populous group.
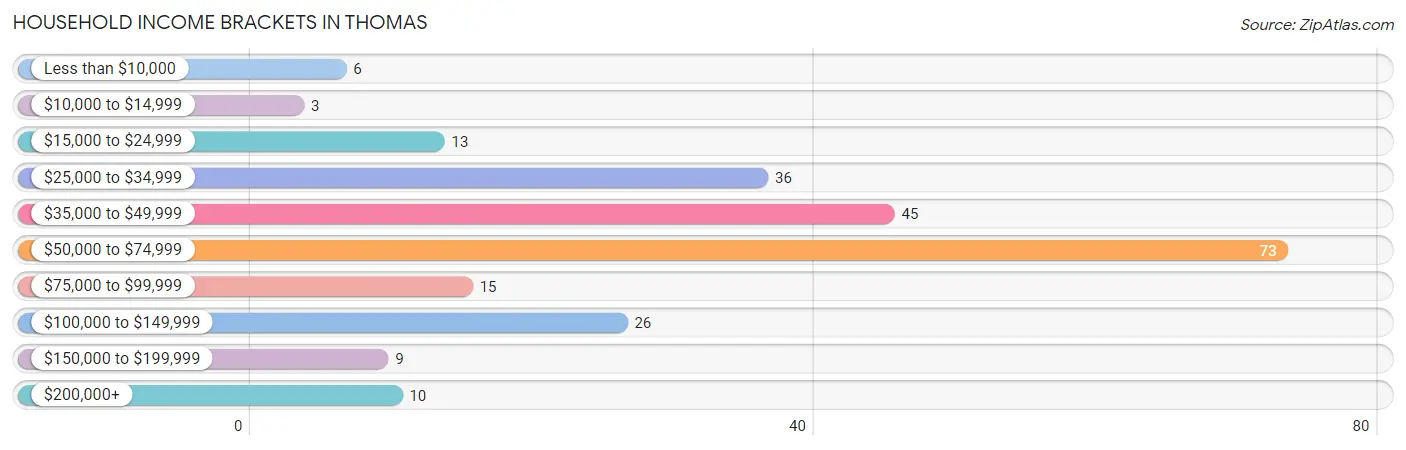
| Income Bracket | # Households | % Households |
| Less than $10,000 | 6 | 2.5% |
| $10,000 to $14,999 | 3 | 1.3% |
| $15,000 to $24,999 | 13 | 5.5% |
| $25,000 to $34,999 | 36 | 15.3% |
| $35,000 to $49,999 | 45 | 19.1% |
| $50,000 to $74,999 | 73 | 30.9% |
| $75,000 to $99,999 | 15 | 6.4% |
| $100,000 to $149,999 | 26 | 11.0% |
| $150,000 to $199,999 | 9 | 3.8% |
| $200,000+ | 10 | 4.2% |
Household Income by Householder Age in Thomas
The median household income in Thomas is $53,000, with the highest median household income of $63,894 found in the 45 to 64 years age bracket for the primary householder. A total of 67 households (28.4%) fall into this category.
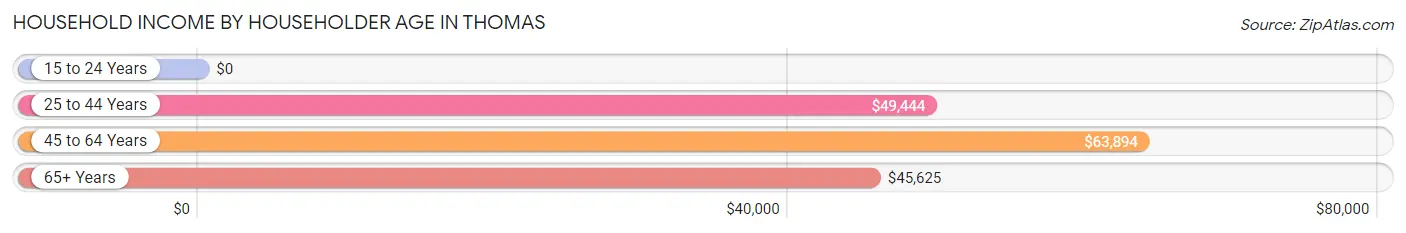
| Income Bracket | # Households | Median Income |
| 15 to 24 Years | 0 (0.0%) | $0 |
| 25 to 44 Years | 76 (32.2%) | $49,444 |
| 45 to 64 Years | 67 (28.4%) | $63,894 |
| 65+ Years | 93 (39.4%) | $45,625 |
| Total | 236 (100.0%) | $53,000 |
Poverty in Thomas
Income Below Poverty by Sex and Age in Thomas
With 4.0% poverty level for males and 5.0% for females among the residents of Thomas, 55 to 64 year old males and 15 year old females are the most vulnerable to poverty, with 3 males (12.5%) and 1 females (100.0%) in their respective age groups living below the poverty level.
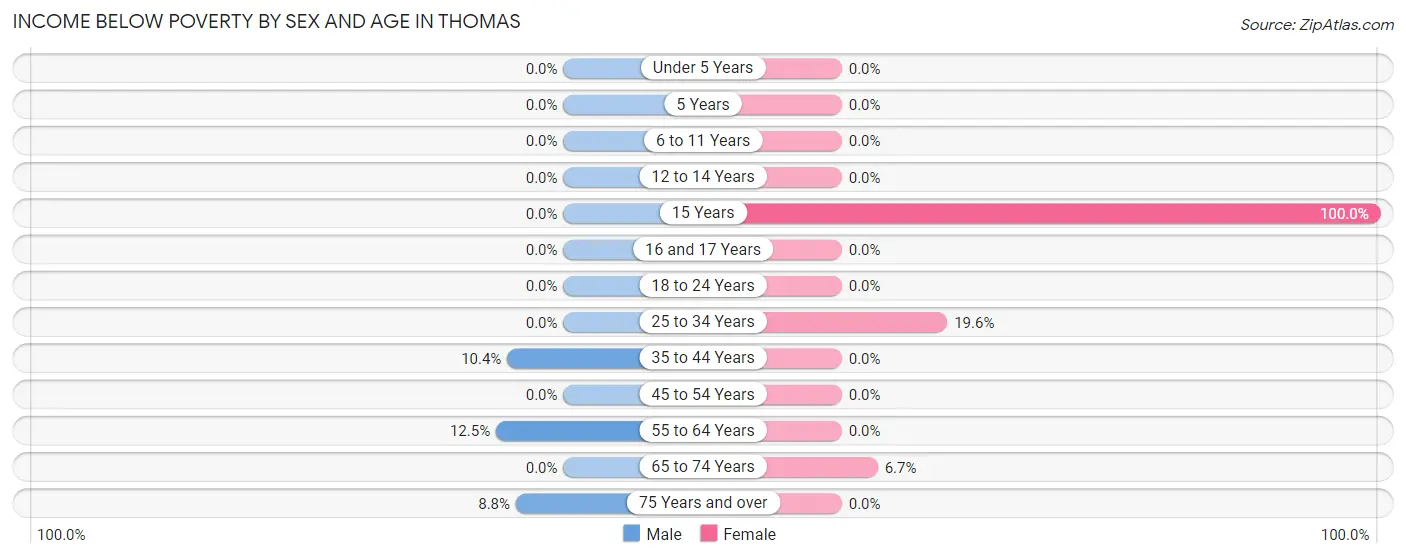
| Age Bracket | Male | Female |
| Under 5 Years | 0 (0.0%) | 0 (0.0%) |
| 5 Years | 0 (0.0%) | 0 (0.0%) |
| 6 to 11 Years | 0 (0.0%) | 0 (0.0%) |
| 12 to 14 Years | 0 (0.0%) | 0 (0.0%) |
| 15 Years | 0 (0.0%) | 1 (100.0%) |
| 16 and 17 Years | 0 (0.0%) | 0 (0.0%) |
| 18 to 24 Years | 0 (0.0%) | 0 (0.0%) |
| 25 to 34 Years | 0 (0.0%) | 9 (19.6%) |
| 35 to 44 Years | 5 (10.4%) | 0 (0.0%) |
| 45 to 54 Years | 0 (0.0%) | 0 (0.0%) |
| 55 to 64 Years | 3 (12.5%) | 0 (0.0%) |
| 65 to 74 Years | 0 (0.0%) | 3 (6.7%) |
| 75 Years and over | 3 (8.8%) | 0 (0.0%) |
| Total | 11 (4.0%) | 13 (5.0%) |
Income Above Poverty by Sex and Age in Thomas
According to the poverty statistics in Thomas, males aged 6 to 11 years and females aged under 5 years are the age groups that are most secure financially, with 100.0% of males and 100.0% of females in these age groups living above the poverty line.
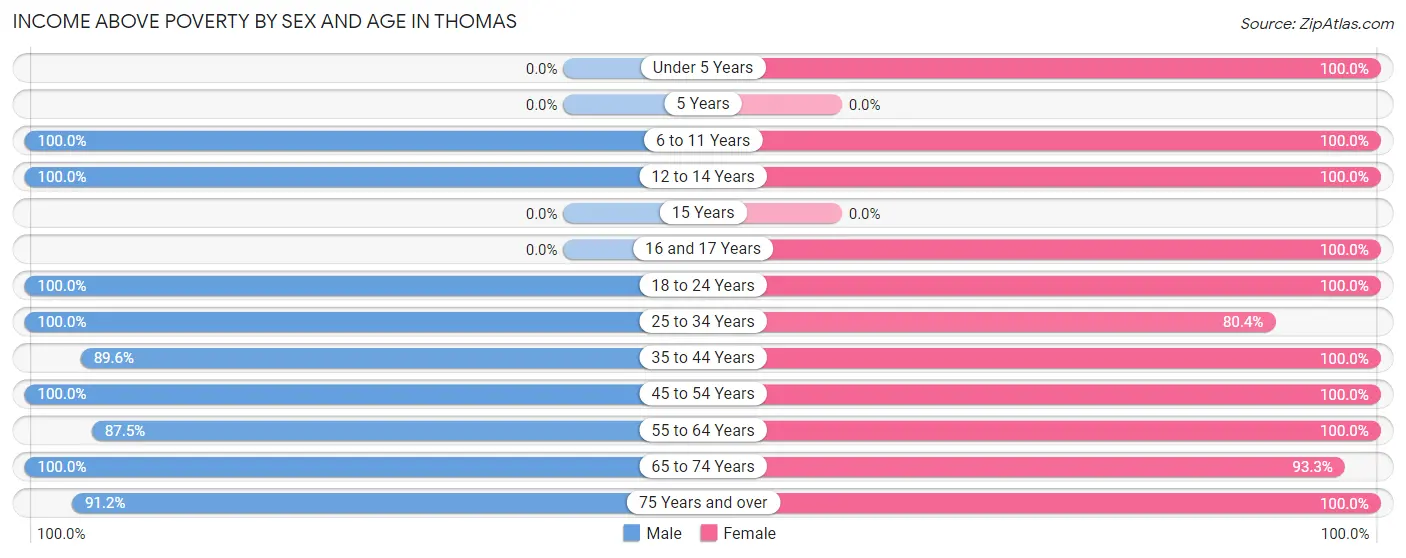
| Age Bracket | Male | Female |
| Under 5 Years | 0 (0.0%) | 32 (100.0%) |
| 5 Years | 0 (0.0%) | 0 (0.0%) |
| 6 to 11 Years | 23 (100.0%) | 11 (100.0%) |
| 12 to 14 Years | 11 (100.0%) | 7 (100.0%) |
| 15 Years | 0 (0.0%) | 0 (0.0%) |
| 16 and 17 Years | 0 (0.0%) | 17 (100.0%) |
| 18 to 24 Years | 14 (100.0%) | 5 (100.0%) |
| 25 to 34 Years | 38 (100.0%) | 37 (80.4%) |
| 35 to 44 Years | 43 (89.6%) | 24 (100.0%) |
| 45 to 54 Years | 19 (100.0%) | 9 (100.0%) |
| 55 to 64 Years | 21 (87.5%) | 39 (100.0%) |
| 65 to 74 Years | 62 (100.0%) | 42 (93.3%) |
| 75 Years and over | 31 (91.2%) | 24 (100.0%) |
| Total | 262 (96.0%) | 247 (95.0%) |
Income Below Poverty Among Married-Couple Families in Thomas
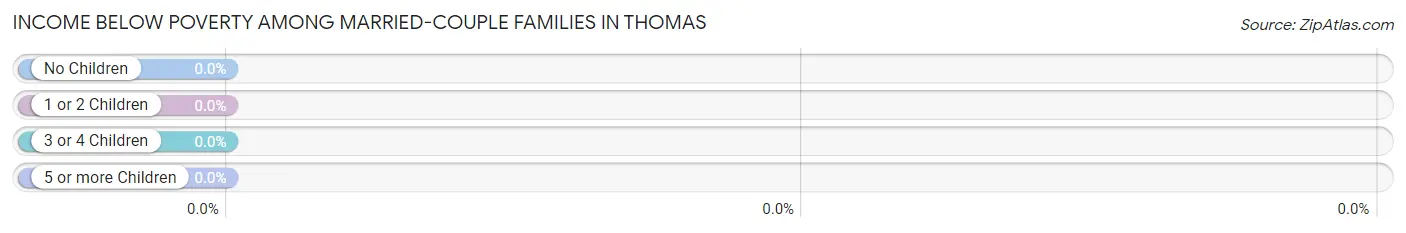
| Children | Above Poverty | Below Poverty |
| No Children | 49 (100.0%) | 0 (0.0%) |
| 1 or 2 Children | 46 (100.0%) | 0 (0.0%) |
| 3 or 4 Children | 7 (100.0%) | 0 (0.0%) |
| 5 or more Children | 0 (0.0%) | 0 (0.0%) |
| Total | 102 (100.0%) | 0 (0.0%) |
Income Below Poverty Among Single-Parent Households in Thomas
| Children | Single Father | Single Mother |
| No Children | 0 (0.0%) | 0 (0.0%) |
| 1 or 2 Children | 0 (0.0%) | 0 (0.0%) |
| 3 or 4 Children | 0 (0.0%) | 0 (0.0%) |
| 5 or more Children | 0 (0.0%) | 0 (0.0%) |
| Total | 0 (0.0%) | 0 (0.0%) |
Income Below Poverty Among Married-Couple vs Single-Parent Households in Thomas
| Children | Married-Couple Families | Single-Parent Households |
| No Children | 0 (0.0%) | 0 (0.0%) |
| 1 or 2 Children | 0 (0.0%) | 0 (0.0%) |
| 3 or 4 Children | 0 (0.0%) | 0 (0.0%) |
| 5 or more Children | 0 (0.0%) | 0 (0.0%) |
| Total | 0 (0.0%) | 0 (0.0%) |
Race in Thomas
The most populous races in Thomas are White / Caucasian (623 | 99.8%), and Asian (1 | 0.2%).
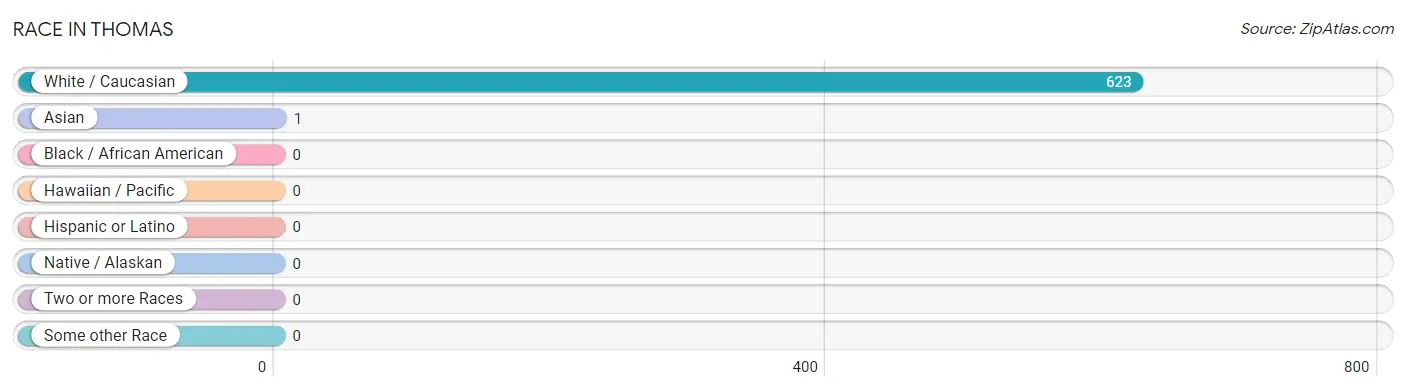
| Race | # Population | % Population |
| Asian | 1 | 0.2% |
| Black / African American | 0 | 0.0% |
| Hawaiian / Pacific | 0 | 0.0% |
| Hispanic or Latino | 0 | 0.0% |
| Native / Alaskan | 0 | 0.0% |
| White / Caucasian | 623 | 99.8% |
| Two or more Races | 0 | 0.0% |
| Some other Race | 0 | 0.0% |
| Total | 624 | 100.0% |
Ancestry in Thomas
The most populous ancestries reported in Thomas are German (161 | 25.8%), American (99 | 15.9%), English (78 | 12.5%), Italian (62 | 9.9%), and Scottish (53 | 8.5%), together accounting for 72.6% of all Thomas residents.
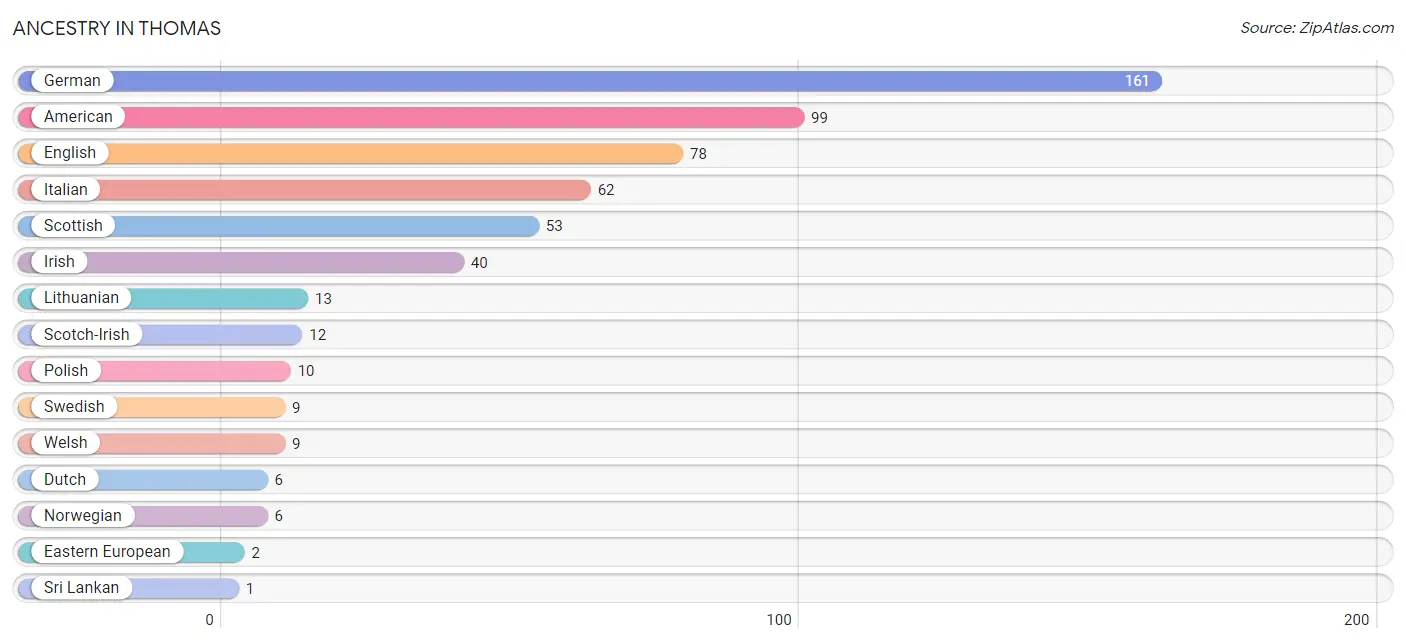
| Ancestry | # Population | % Population |
| American | 99 | 15.9% |
| Dutch | 6 | 1.0% |
| Eastern European | 2 | 0.3% |
| English | 78 | 12.5% |
| German | 161 | 25.8% |
| Irish | 40 | 6.4% |
| Italian | 62 | 9.9% |
| Lithuanian | 13 | 2.1% |
| Norwegian | 6 | 1.0% |
| Polish | 10 | 1.6% |
| Scotch-Irish | 12 | 1.9% |
| Scottish | 53 | 8.5% |
| Sri Lankan | 1 | 0.2% |
| Swedish | 9 | 1.4% |
| Welsh | 9 | 1.4% | View All 15 Rows |
Immigrants in Thomas

| Immigration Origin | # Population | % Population | View All 0 Rows |
Sex and Age in Thomas
Sex and Age in Thomas
The most populous age groups in Thomas are 70 to 74 Years (51 | 17.0%) for men and 30 to 34 Years (46 | 14.2%) for women.
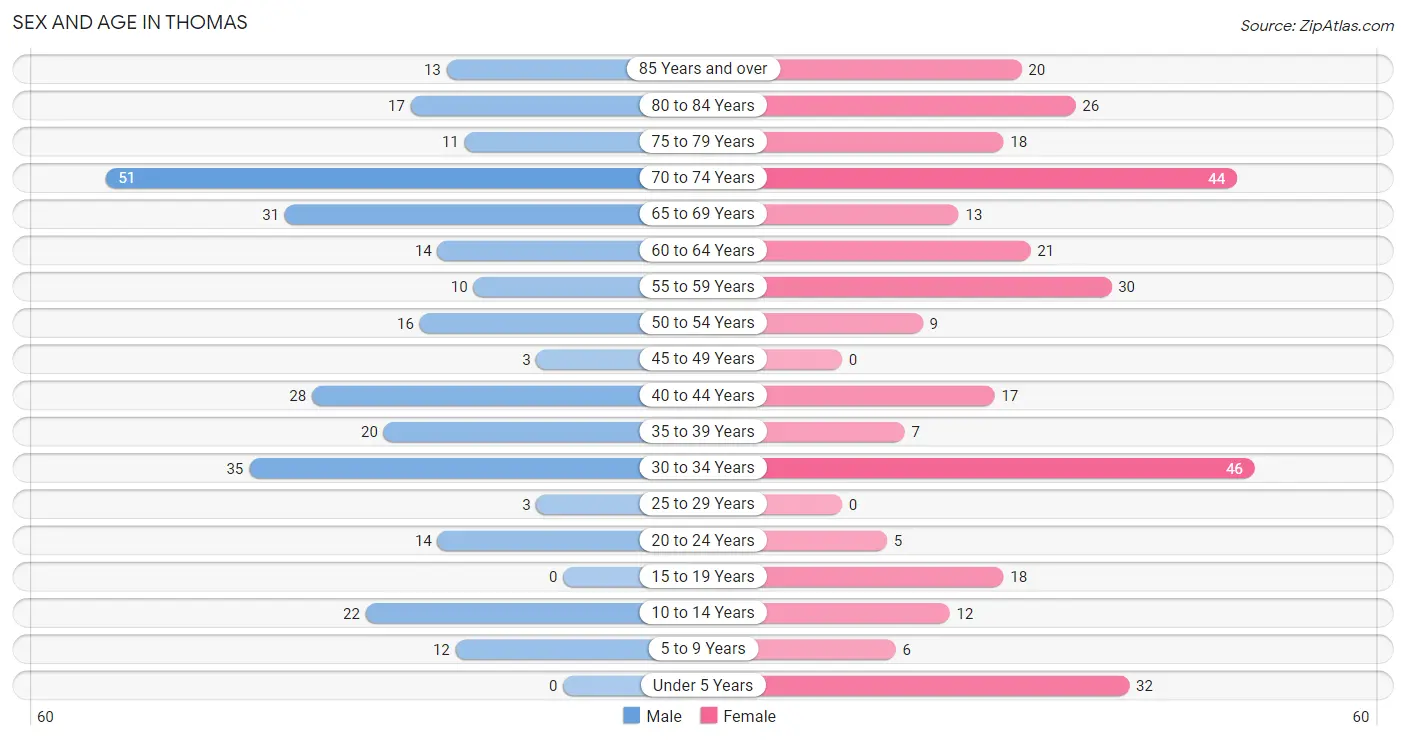
| Age Bracket | Male | Female |
| Under 5 Years | 0 (0.0%) | 32 (9.9%) |
| 5 to 9 Years | 12 (4.0%) | 6 (1.8%) |
| 10 to 14 Years | 22 (7.3%) | 12 (3.7%) |
| 15 to 19 Years | 0 (0.0%) | 18 (5.6%) |
| 20 to 24 Years | 14 (4.7%) | 5 (1.5%) |
| 25 to 29 Years | 3 (1.0%) | 0 (0.0%) |
| 30 to 34 Years | 35 (11.7%) | 46 (14.2%) |
| 35 to 39 Years | 20 (6.7%) | 7 (2.2%) |
| 40 to 44 Years | 28 (9.3%) | 17 (5.2%) |
| 45 to 49 Years | 3 (1.0%) | 0 (0.0%) |
| 50 to 54 Years | 16 (5.3%) | 9 (2.8%) |
| 55 to 59 Years | 10 (3.3%) | 30 (9.3%) |
| 60 to 64 Years | 14 (4.7%) | 21 (6.5%) |
| 65 to 69 Years | 31 (10.3%) | 13 (4.0%) |
| 70 to 74 Years | 51 (17.0%) | 44 (13.6%) |
| 75 to 79 Years | 11 (3.7%) | 18 (5.6%) |
| 80 to 84 Years | 17 (5.7%) | 26 (8.0%) |
| 85 Years and over | 13 (4.3%) | 20 (6.2%) |
| Total | 300 (100.0%) | 324 (100.0%) |
Families and Households in Thomas
Median Family Size in Thomas
The median family size in Thomas is 3.15 persons per family, with single female/mother families (10 | 8.7%) accounting for the largest median family size of 5.2 persons per family. On the other hand, single male/father families (3 | 2.6%) represent the smallest median family size with 2.00 persons per family.
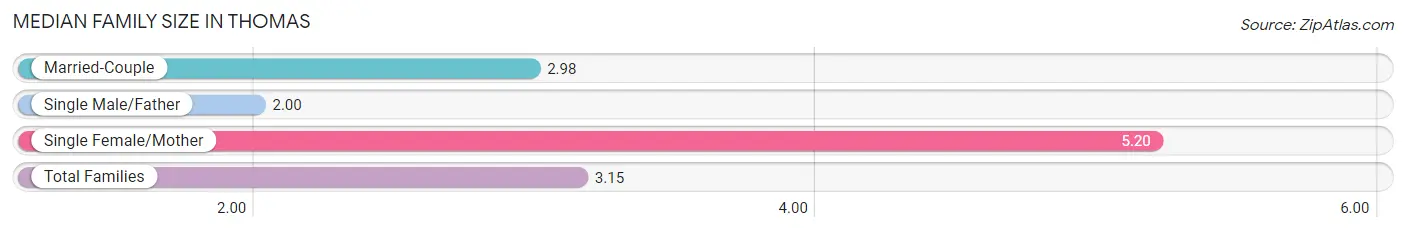
| Family Type | # Families | Family Size |
| Married-Couple | 102 (88.7%) | 2.98 |
| Single Male/Father | 3 (2.6%) | 2.00 |
| Single Female/Mother | 10 (8.7%) | 5.20 |
| Total Families | 115 (100.0%) | 3.15 |
Median Household Size in Thomas
The median household size in Thomas is 2.26 persons per household, with single female/mother households (10 | 4.2%) accounting for the largest median household size of 5.2 persons per household. non-family households (121 | 51.3%) represent the smallest median household size with 1.39 persons per household.
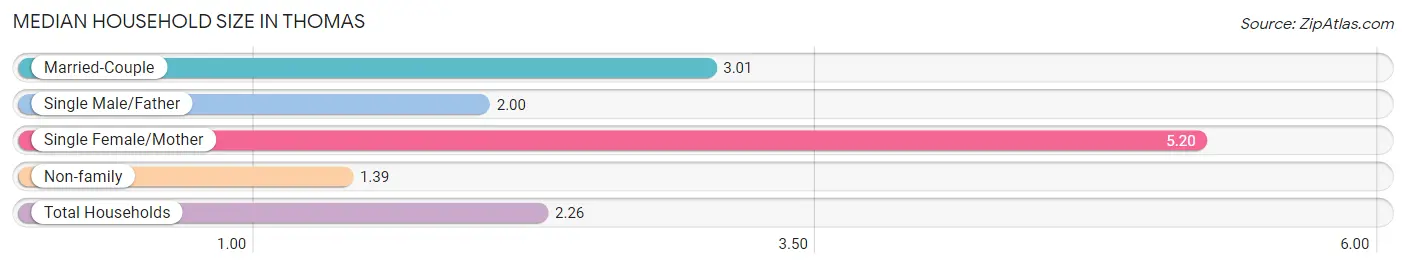
| Household Type | # Households | Household Size |
| Married-Couple | 102 (43.2%) | 3.01 |
| Single Male/Father | 3 (1.3%) | 2.00 |
| Single Female/Mother | 10 (4.2%) | 5.20 |
| Non-family | 121 (51.3%) | 1.39 |
| Total Households | 236 (100.0%) | 2.26 |
Household Size by Marriage Status in Thomas
Out of a total of 236 households in Thomas, 115 (48.7%) are family households, while 121 (51.3%) are nonfamily households. The most numerous type of family households are 4-person households, comprising 54, and the most common type of nonfamily households are 1-person households, comprising 94.
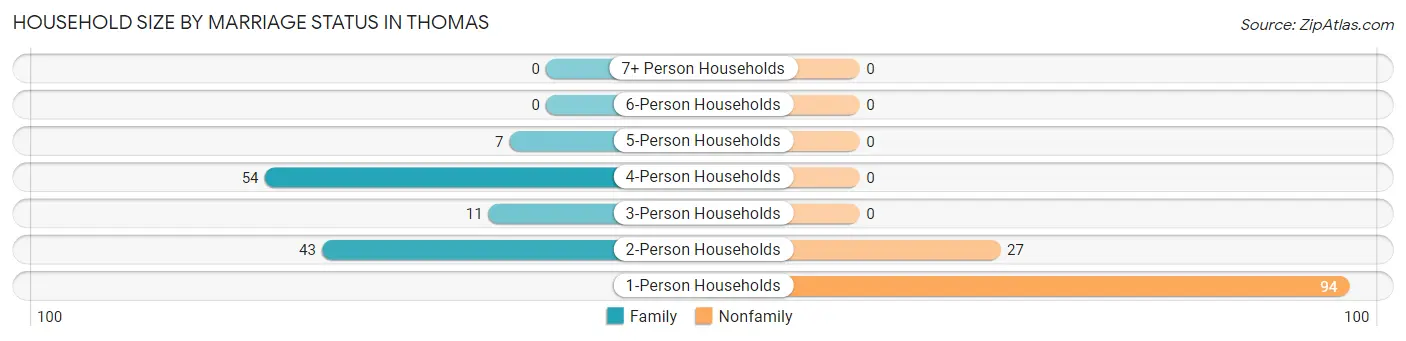
| Household Size | Family Households | Nonfamily Households |
| 1-Person Households | - | 94 (39.8%) |
| 2-Person Households | 43 (18.2%) | 27 (11.4%) |
| 3-Person Households | 11 (4.7%) | 0 (0.0%) |
| 4-Person Households | 54 (22.9%) | 0 (0.0%) |
| 5-Person Households | 7 (3.0%) | 0 (0.0%) |
| 6-Person Households | 0 (0.0%) | 0 (0.0%) |
| 7+ Person Households | 0 (0.0%) | 0 (0.0%) |
| Total | 115 (48.7%) | 121 (51.3%) |
Female Fertility in Thomas
Fertility by Age in Thomas
| Age Bracket | Women with Births | Births / 1,000 Women |
| 15 to 19 years | 0 (0.0%) | 0.0 |
| 20 to 34 years | 0 (0.0%) | 0.0 |
| 35 to 50 years | 0 (0.0%) | 0.0 |
| Total | 0 (0.0%) | 0.0 |
Fertility by Age by Marriage Status in Thomas
| Age Bracket | Married | Unmarried |
| 15 to 19 years | 0 (0.0%) | 0 (0.0%) |
| 20 to 34 years | 0 (0.0%) | 0 (0.0%) |
| 35 to 50 years | 0 (0.0%) | 0 (0.0%) |
| Total | 0 (0.0%) | 0 (0.0%) |
Fertility by Education in Thomas
| Educational Attainment | Women with Births | Births / 1,000 Women |
| Less than High School | 0 (0.0%) | 0.0 |
| High School Diploma | 0 (0.0%) | 0.0 |
| College or Associate's Degree | 0 (0.0%) | 0.0 |
| Bachelor's Degree | 0 (0.0%) | 0.0 |
| Graduate Degree | 0 (0.0%) | 0.0 |
| Total | 0 (0.0%) | 0.0 |
Fertility by Education by Marriage Status in Thomas
| Educational Attainment | Married | Unmarried |
| Less than High School | 0 (0.0%) | 0 (0.0%) |
| High School Diploma | 0 (0.0%) | 0 (0.0%) |
| College or Associate's Degree | 0 (0.0%) | 0 (0.0%) |
| Bachelor's Degree | 0 (0.0%) | 0 (0.0%) |
| Graduate Degree | 0 (0.0%) | 0 (0.0%) |
| Total | 0 (0.0%) | 0 (0.0%) |
Employment Characteristics in Thomas
Employment by Class of Employer in Thomas
Among the 241 employed individuals in Thomas, private company employees (135 | 56.0%), local government employees (39 | 16.2%), and self-employed (not incorporated) (24 | 10.0%) make up the most common classes of employment.
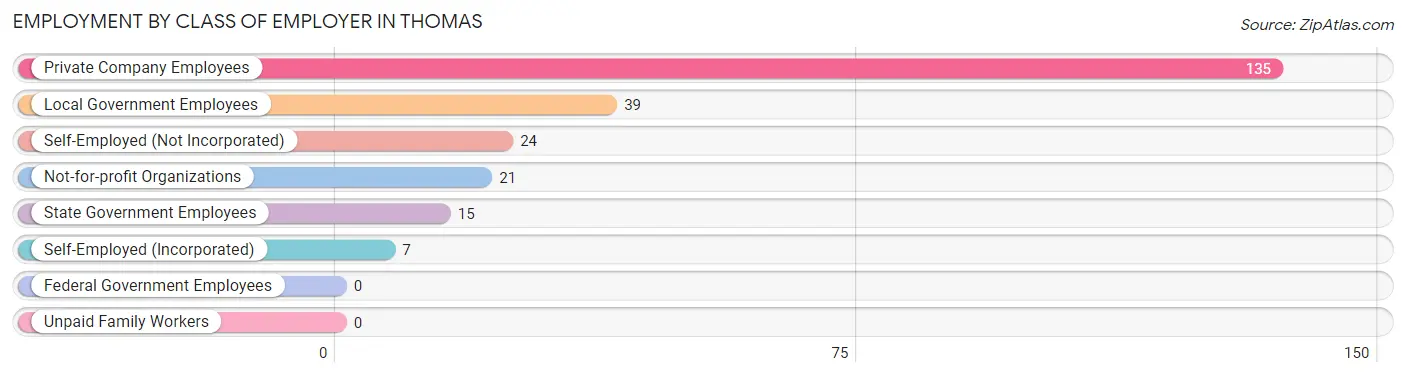
| Employer Class | # Employees | % Employees |
| Private Company Employees | 135 | 56.0% |
| Self-Employed (Incorporated) | 7 | 2.9% |
| Self-Employed (Not Incorporated) | 24 | 10.0% |
| Not-for-profit Organizations | 21 | 8.7% |
| Local Government Employees | 39 | 16.2% |
| State Government Employees | 15 | 6.2% |
| Federal Government Employees | 0 | 0.0% |
| Unpaid Family Workers | 0 | 0.0% |
| Total | 241 | 100.0% |
Employment Status by Age in Thomas
According to the labor force statistics for Thomas, out of the total population over 16 years of age (539), 52.5% or 283 individuals are in the labor force, with 12.7% or 36 of them unemployed. The age group with the highest labor force participation rate is 20 to 24 years, with 100.0% or 19 individuals in the labor force. Within the labor force, the 16 to 19 years age range has the highest percentage of unemployed individuals, with 33.3% or 3 of them being unemployed.
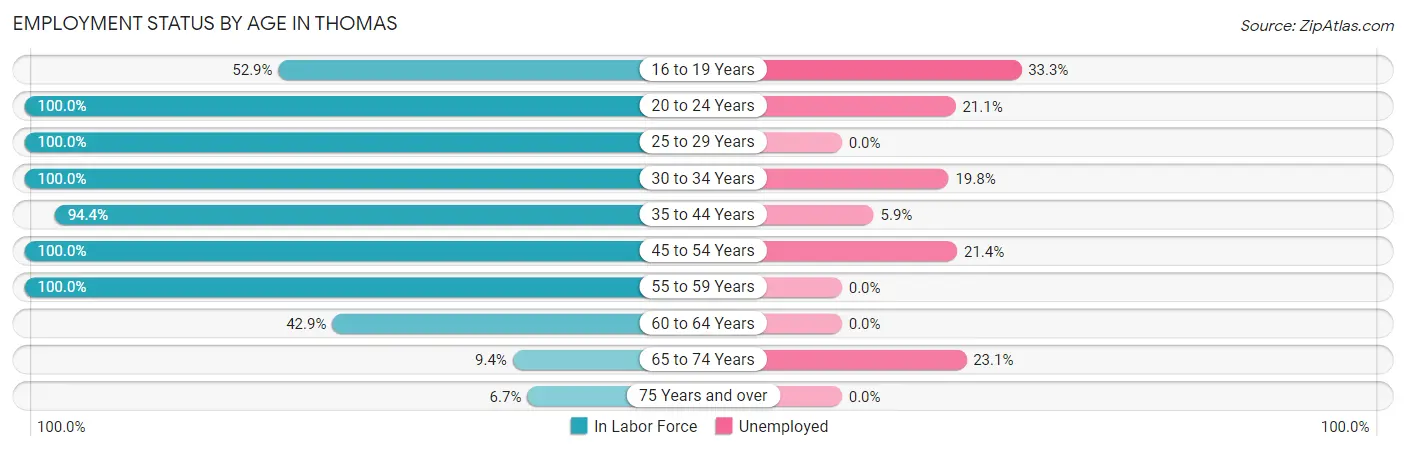
| Age Bracket | In Labor Force | Unemployed |
| 16 to 19 Years | 9 (52.9%) | 3 (33.3%) |
| 20 to 24 Years | 19 (100.0%) | 4 (21.1%) |
| 25 to 29 Years | 3 (100.0%) | 0 (0.0%) |
| 30 to 34 Years | 81 (100.0%) | 16 (19.8%) |
| 35 to 44 Years | 68 (94.4%) | 4 (5.9%) |
| 45 to 54 Years | 28 (100.0%) | 6 (21.4%) |
| 55 to 59 Years | 40 (100.0%) | 0 (0.0%) |
| 60 to 64 Years | 15 (42.9%) | 0 (0.0%) |
| 65 to 74 Years | 13 (9.4%) | 3 (23.1%) |
| 75 Years and over | 7 (6.7%) | 0 (0.0%) |
| Total | 283 (52.5%) | 36 (12.7%) |
Employment Status by Educational Attainment in Thomas
According to labor force statistics for Thomas, 90.7% of individuals (235) out of the total population between 25 and 64 years of age (259) are in the labor force, with 11.1% or 26 of them being unemployed. The group with the highest labor force participation rate are those with the educational attainment of bachelor's degree or higher, with 100.0% or 101 individuals in the labor force. Within the labor force, individuals with less than high school education have the highest percentage of unemployment, with 44.4% or 4 of them being unemployed.
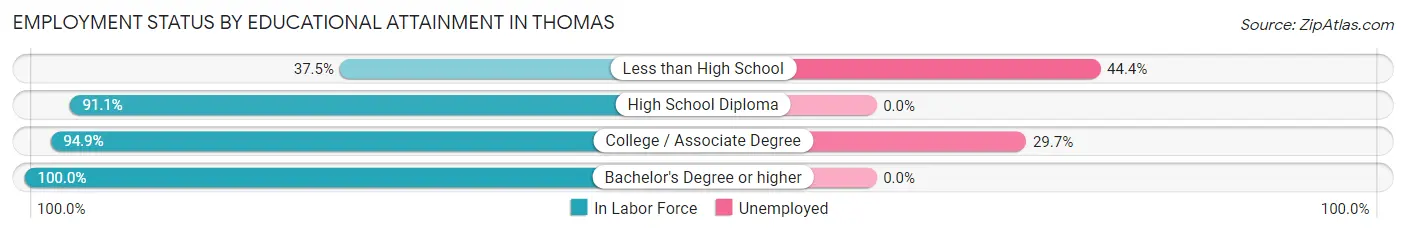
| Educational Attainment | In Labor Force | Unemployed |
| Less than High School | 9 (37.5%) | 11 (44.4%) |
| High School Diploma | 51 (91.1%) | 0 (0.0%) |
| College / Associate Degree | 74 (94.9%) | 23 (29.7%) |
| Bachelor's Degree or higher | 101 (100.0%) | 0 (0.0%) |
| Total | 235 (90.7%) | 29 (11.1%) |
Employment Occupations by Sex in Thomas
Management, Business, Science and Arts Occupations
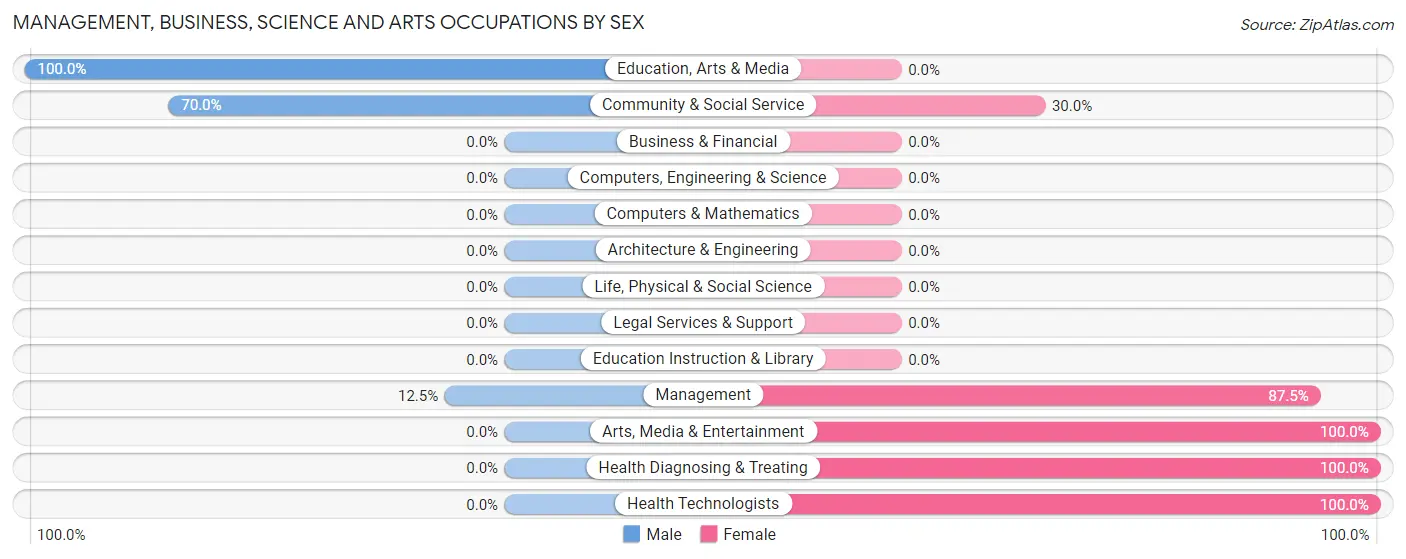
The most common Management, Business, Science and Arts occupations in Thomas are Management (24 | 9.7%), Health Diagnosing & Treating (21 | 8.5%), Health Technologists (12 | 4.9%), Community & Social Service (10 | 4.1%), and Education, Arts & Media (7 | 2.8%).
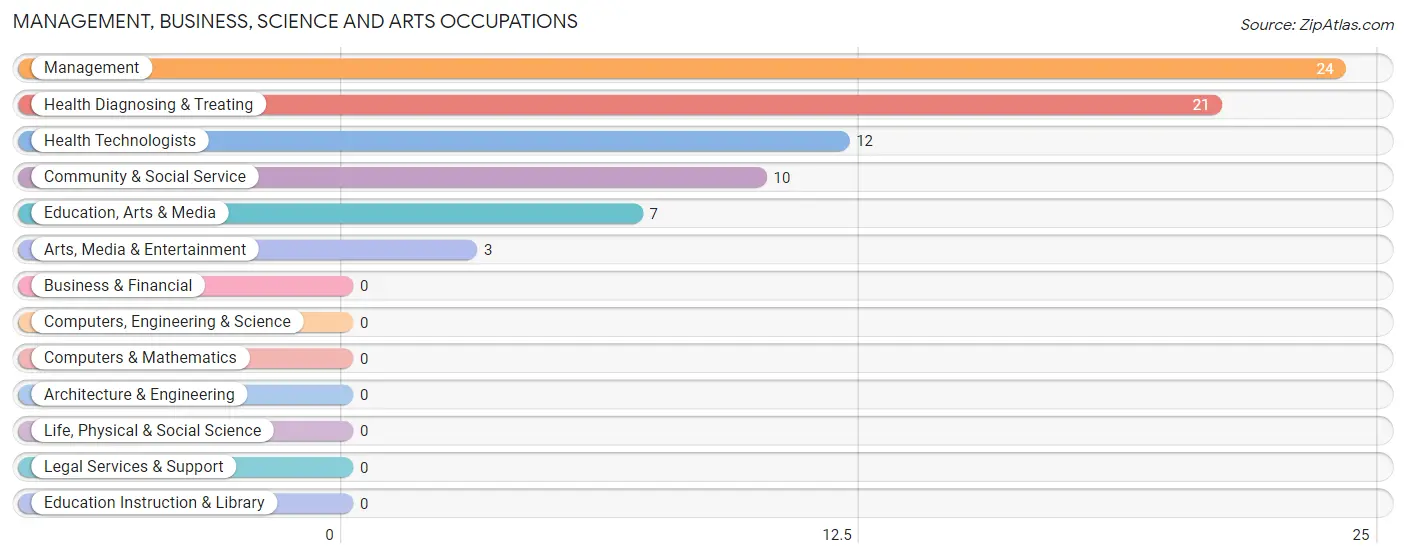
Management, Business, Science and Arts Occupations by Sex
Within the Management, Business, Science and Arts occupations in Thomas, the most male-oriented occupations are Education, Arts & Media (100.0%), Community & Social Service (70.0%), and Management (12.5%), while the most female-oriented occupations are Arts, Media & Entertainment (100.0%), Health Diagnosing & Treating (100.0%), and Health Technologists (100.0%).
| Occupation | Male | Female |
| Management | 3 (12.5%) | 21 (87.5%) |
| Business & Financial | 0 (0.0%) | 0 (0.0%) |
| Computers, Engineering & Science | 0 (0.0%) | 0 (0.0%) |
| Computers & Mathematics | 0 (0.0%) | 0 (0.0%) |
| Architecture & Engineering | 0 (0.0%) | 0 (0.0%) |
| Life, Physical & Social Science | 0 (0.0%) | 0 (0.0%) |
| Community & Social Service | 7 (70.0%) | 3 (30.0%) |
| Education, Arts & Media | 7 (100.0%) | 0 (0.0%) |
| Legal Services & Support | 0 (0.0%) | 0 (0.0%) |
| Education Instruction & Library | 0 (0.0%) | 0 (0.0%) |
| Arts, Media & Entertainment | 0 (0.0%) | 3 (100.0%) |
| Health Diagnosing & Treating | 0 (0.0%) | 21 (100.0%) |
| Health Technologists | 0 (0.0%) | 12 (100.0%) |
| Total (Category) | 10 (18.2%) | 45 (81.8%) |
| Total (Overall) | 109 (44.1%) | 138 (55.9%) |
Services Occupations
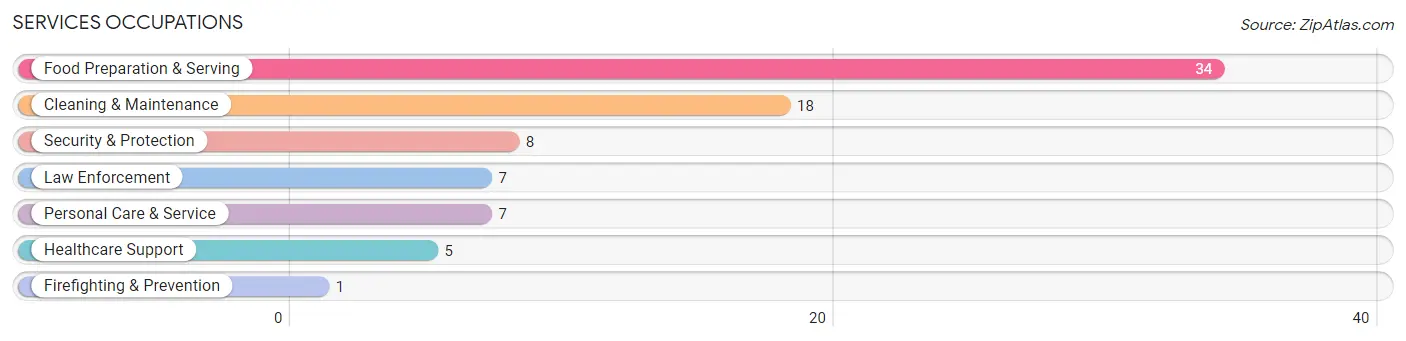
The most common Services occupations in Thomas are Food Preparation & Serving (34 | 13.8%), Cleaning & Maintenance (18 | 7.3%), Security & Protection (8 | 3.2%), Law Enforcement (7 | 2.8%), and Personal Care & Service (7 | 2.8%).
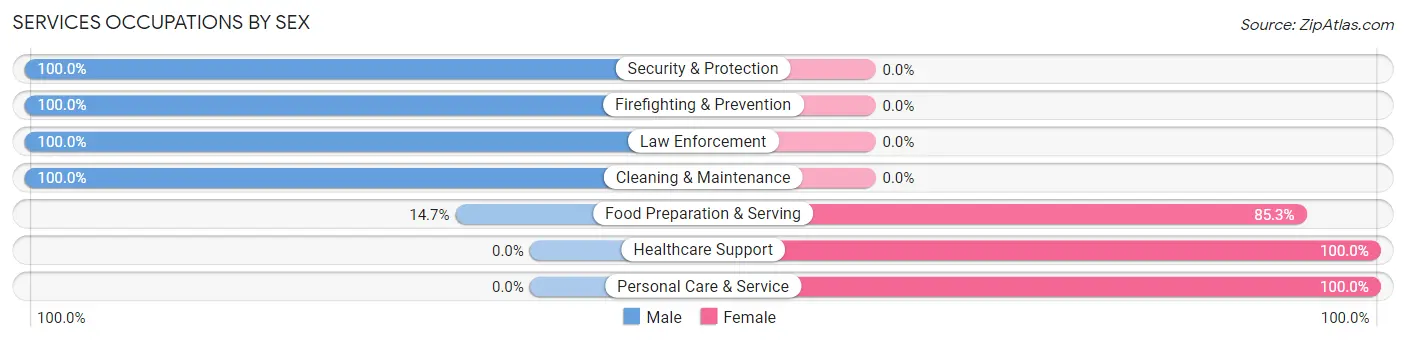
Services Occupations by Sex
Within the Services occupations in Thomas, the most male-oriented occupations are Security & Protection (100.0%), Firefighting & Prevention (100.0%), and Law Enforcement (100.0%), while the most female-oriented occupations are Healthcare Support (100.0%), Personal Care & Service (100.0%), and Food Preparation & Serving (85.3%).
| Occupation | Male | Female |
| Healthcare Support | 0 (0.0%) | 5 (100.0%) |
| Security & Protection | 8 (100.0%) | 0 (0.0%) |
| Firefighting & Prevention | 1 (100.0%) | 0 (0.0%) |
| Law Enforcement | 7 (100.0%) | 0 (0.0%) |
| Food Preparation & Serving | 5 (14.7%) | 29 (85.3%) |
| Cleaning & Maintenance | 18 (100.0%) | 0 (0.0%) |
| Personal Care & Service | 0 (0.0%) | 7 (100.0%) |
| Total (Category) | 31 (43.1%) | 41 (56.9%) |
| Total (Overall) | 109 (44.1%) | 138 (55.9%) |
Sales and Office Occupations
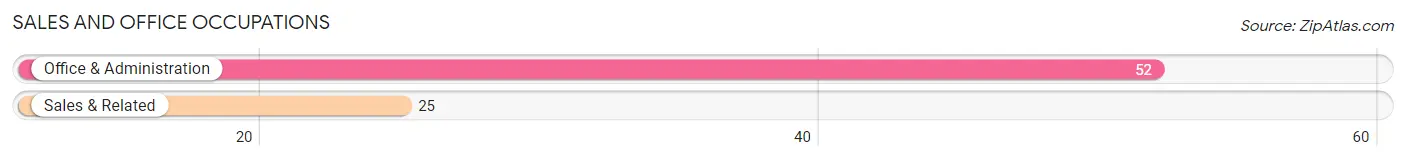
The most common Sales and Office occupations in Thomas are Office & Administration (52 | 21.0%), and Sales & Related (25 | 10.1%).
Sales and Office Occupations by Sex
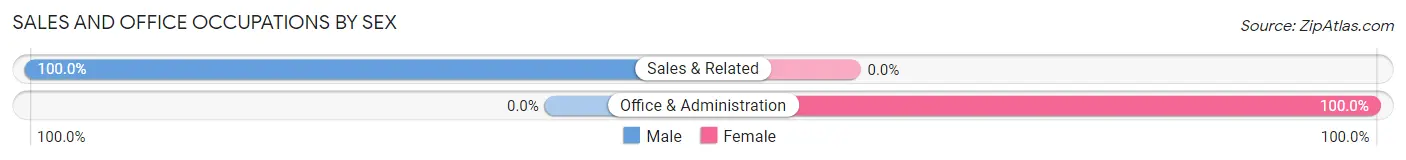
| Occupation | Male | Female |
| Sales & Related | 25 (100.0%) | 0 (0.0%) |
| Office & Administration | 0 (0.0%) | 52 (100.0%) |
| Total (Category) | 25 (32.5%) | 52 (67.5%) |
| Total (Overall) | 109 (44.1%) | 138 (55.9%) |
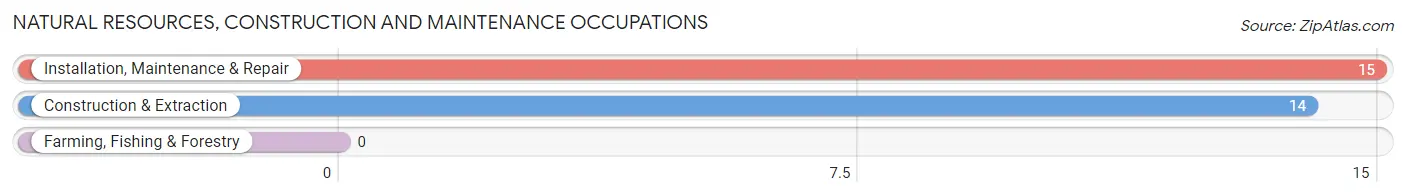
Natural Resources, Construction and Maintenance Occupations
The most common Natural Resources, Construction and Maintenance occupations in Thomas are Installation, Maintenance & Repair (15 | 6.1%), and Construction & Extraction (14 | 5.7%).
Natural Resources, Construction and Maintenance Occupations by Sex
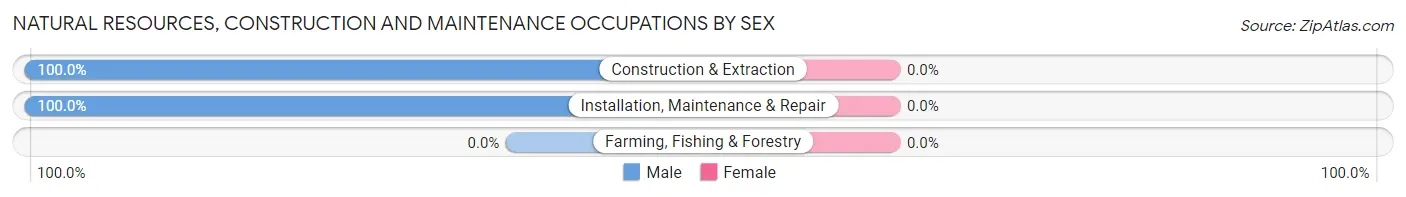
| Occupation | Male | Female |
| Farming, Fishing & Forestry | 0 (0.0%) | 0 (0.0%) |
| Construction & Extraction | 14 (100.0%) | 0 (0.0%) |
| Installation, Maintenance & Repair | 15 (100.0%) | 0 (0.0%) |
| Total (Category) | 29 (100.0%) | 0 (0.0%) |
| Total (Overall) | 109 (44.1%) | 138 (55.9%) |
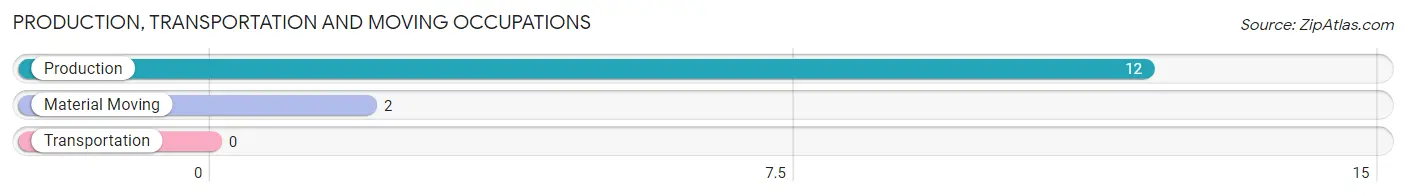
Production, Transportation and Moving Occupations
The most common Production, Transportation and Moving occupations in Thomas are Production (12 | 4.9%), and Material Moving (2 | 0.8%).
Production, Transportation and Moving Occupations by Sex
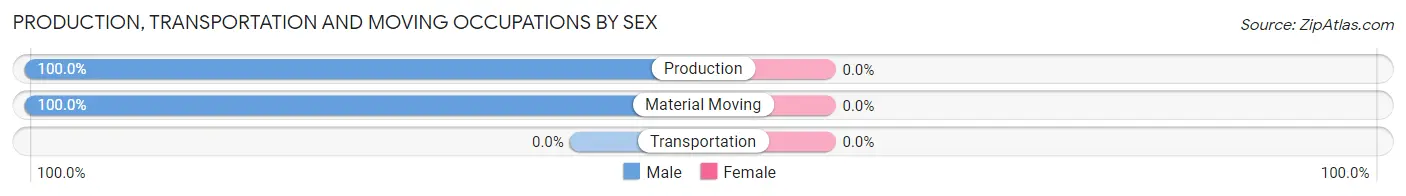
| Occupation | Male | Female |
| Production | 12 (100.0%) | 0 (0.0%) |
| Transportation | 0 (0.0%) | 0 (0.0%) |
| Material Moving | 2 (100.0%) | 0 (0.0%) |
| Total (Category) | 14 (100.0%) | 0 (0.0%) |
| Total (Overall) | 109 (44.1%) | 138 (55.9%) |
Employment Industries by Sex in Thomas
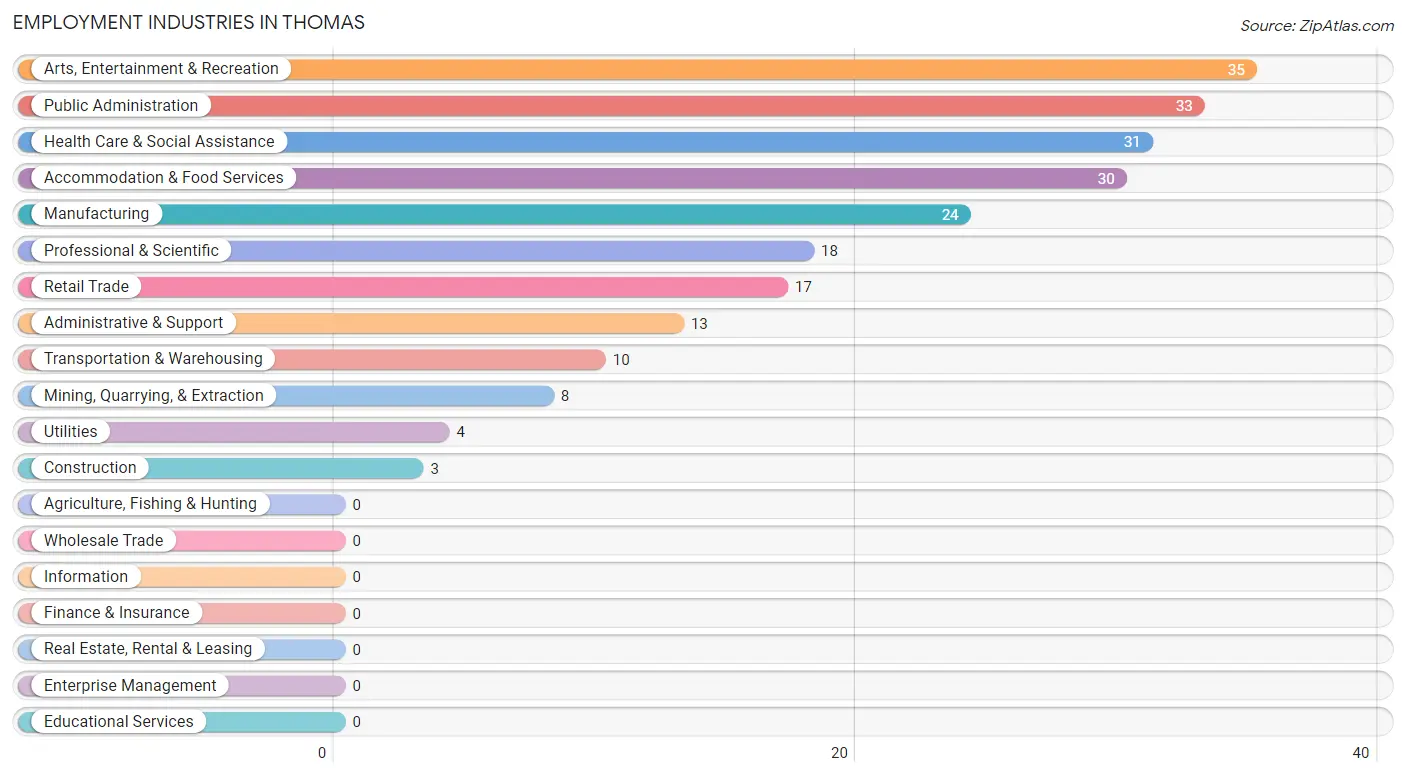
Employment Industries in Thomas
The major employment industries in Thomas include Arts, Entertainment & Recreation (35 | 14.2%), Public Administration (33 | 13.4%), Health Care & Social Assistance (31 | 12.6%), Accommodation & Food Services (30 | 12.1%), and Manufacturing (24 | 9.7%).
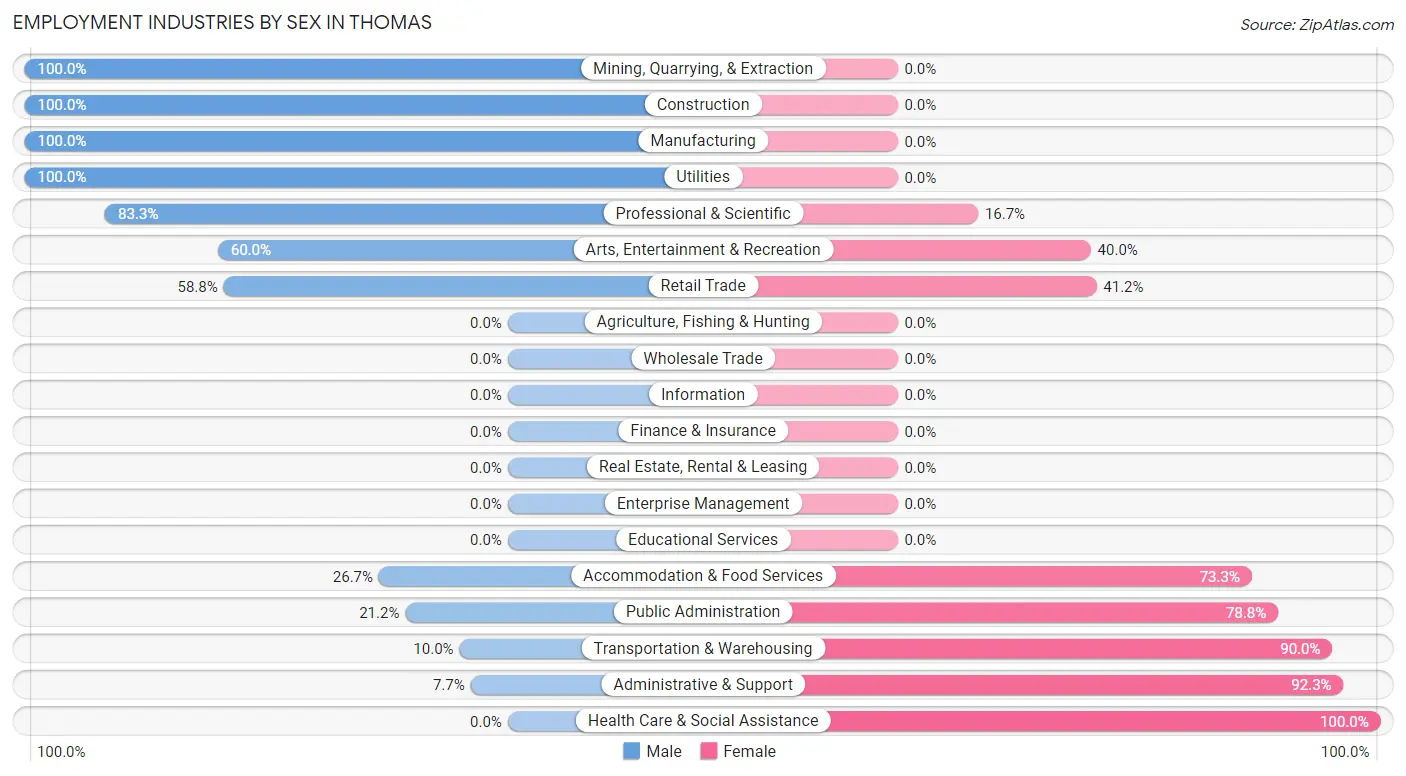
Employment Industries by Sex in Thomas
The Thomas industries that see more men than women are Mining, Quarrying, & Extraction (100.0%), Construction (100.0%), and Manufacturing (100.0%), whereas the industries that tend to have a higher number of women are Health Care & Social Assistance (100.0%), Administrative & Support (92.3%), and Transportation & Warehousing (90.0%).
| Industry | Male | Female |
| Agriculture, Fishing & Hunting | 0 (0.0%) | 0 (0.0%) |
| Mining, Quarrying, & Extraction | 8 (100.0%) | 0 (0.0%) |
| Construction | 3 (100.0%) | 0 (0.0%) |
| Manufacturing | 24 (100.0%) | 0 (0.0%) |
| Wholesale Trade | 0 (0.0%) | 0 (0.0%) |
| Retail Trade | 10 (58.8%) | 7 (41.2%) |
| Transportation & Warehousing | 1 (10.0%) | 9 (90.0%) |
| Utilities | 4 (100.0%) | 0 (0.0%) |
| Information | 0 (0.0%) | 0 (0.0%) |
| Finance & Insurance | 0 (0.0%) | 0 (0.0%) |
| Real Estate, Rental & Leasing | 0 (0.0%) | 0 (0.0%) |
| Professional & Scientific | 15 (83.3%) | 3 (16.7%) |
| Enterprise Management | 0 (0.0%) | 0 (0.0%) |
| Administrative & Support | 1 (7.7%) | 12 (92.3%) |
| Educational Services | 0 (0.0%) | 0 (0.0%) |
| Health Care & Social Assistance | 0 (0.0%) | 31 (100.0%) |
| Arts, Entertainment & Recreation | 21 (60.0%) | 14 (40.0%) |
| Accommodation & Food Services | 8 (26.7%) | 22 (73.3%) |
| Public Administration | 7 (21.2%) | 26 (78.8%) |
| Total | 109 (44.1%) | 138 (55.9%) |
Education in Thomas
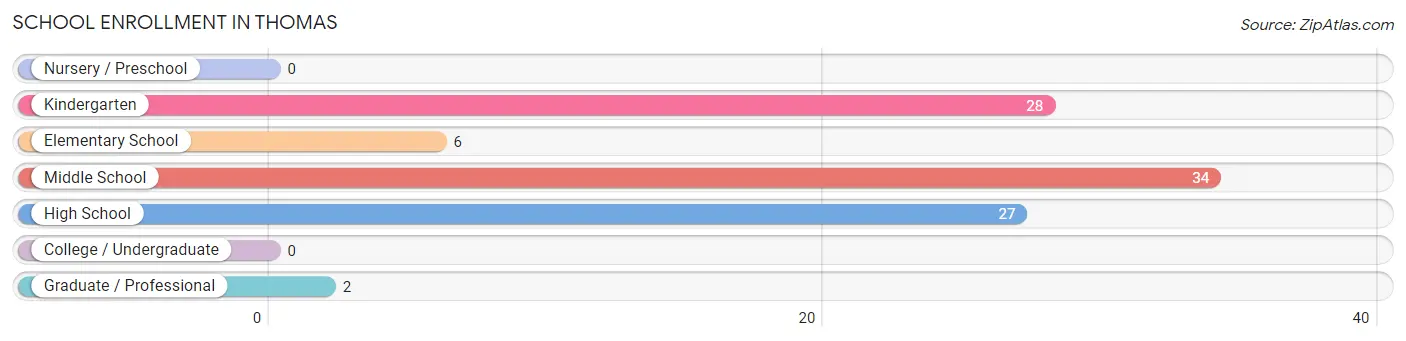
School Enrollment in Thomas
The most common levels of schooling among the 97 students in Thomas are middle school (34 | 35.0%), kindergarten (28 | 28.9%), and high school (27 | 27.8%).
| School Level | # Students | % Students |
| Nursery / Preschool | 0 | 0.0% |
| Kindergarten | 28 | 28.9% |
| Elementary School | 6 | 6.2% |
| Middle School | 34 | 35.0% |
| High School | 27 | 27.8% |
| College / Undergraduate | 0 | 0.0% |
| Graduate / Professional | 2 | 2.1% |
| Total | 97 | 100.0% |
School Enrollment by Age by Funding Source in Thomas
Out of a total of 97 students who are enrolled in schools in Thomas, 44 (45.4%) attend a private institution, while the remaining 53 (54.6%) are enrolled in public schools. The age group of 3 to 4 year olds has the highest likelihood of being enrolled in private schools, with 16 (100.0% in the age bracket) enrolled. Conversely, the age group of 15 to 17 year olds has the lowest likelihood of being enrolled in a private school, with 17 (94.4% in the age bracket) attending a public institution.
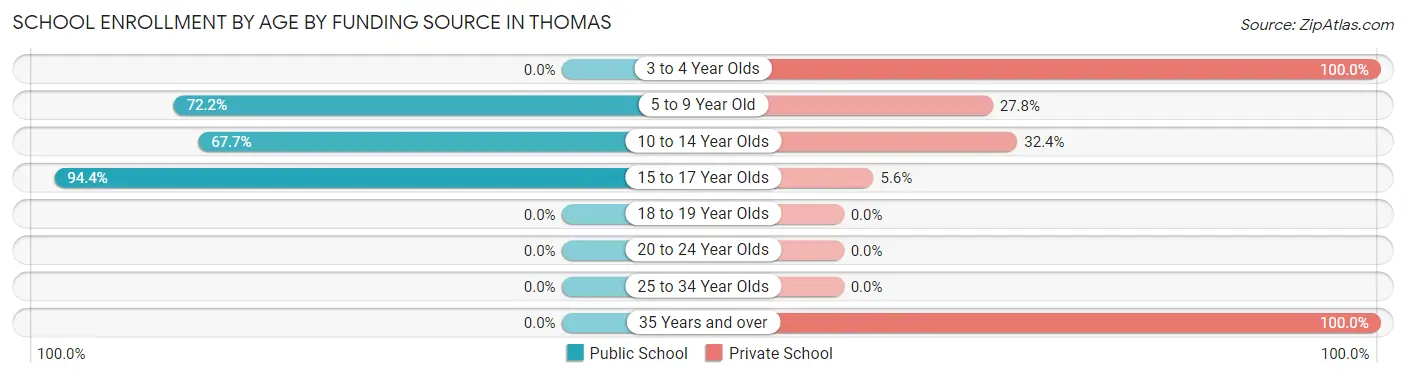
| Age Bracket | Public School | Private School |
| 3 to 4 Year Olds | 0 (0.0%) | 16 (100.0%) |
| 5 to 9 Year Old | 13 (72.2%) | 5 (27.8%) |
| 10 to 14 Year Olds | 23 (67.6%) | 11 (32.4%) |
| 15 to 17 Year Olds | 17 (94.4%) | 1 (5.6%) |
| 18 to 19 Year Olds | 0 (0.0%) | 0 (0.0%) |
| 20 to 24 Year Olds | 0 (0.0%) | 0 (0.0%) |
| 25 to 34 Year Olds | 0 (0.0%) | 0 (0.0%) |
| 35 Years and over | 0 (0.0%) | 11 (100.0%) |
| Total | 53 (54.6%) | 44 (45.4%) |
Educational Attainment by Field of Study in Thomas
Literature & languages (25 | 15.6%), bio, nature & agricultural (23 | 14.4%), visual & performing arts (23 | 14.4%), social sciences (21 | 13.1%), and arts & humanities (17 | 10.6%) are the most common fields of study among 160 individuals in Thomas who have obtained a bachelor's degree or higher.
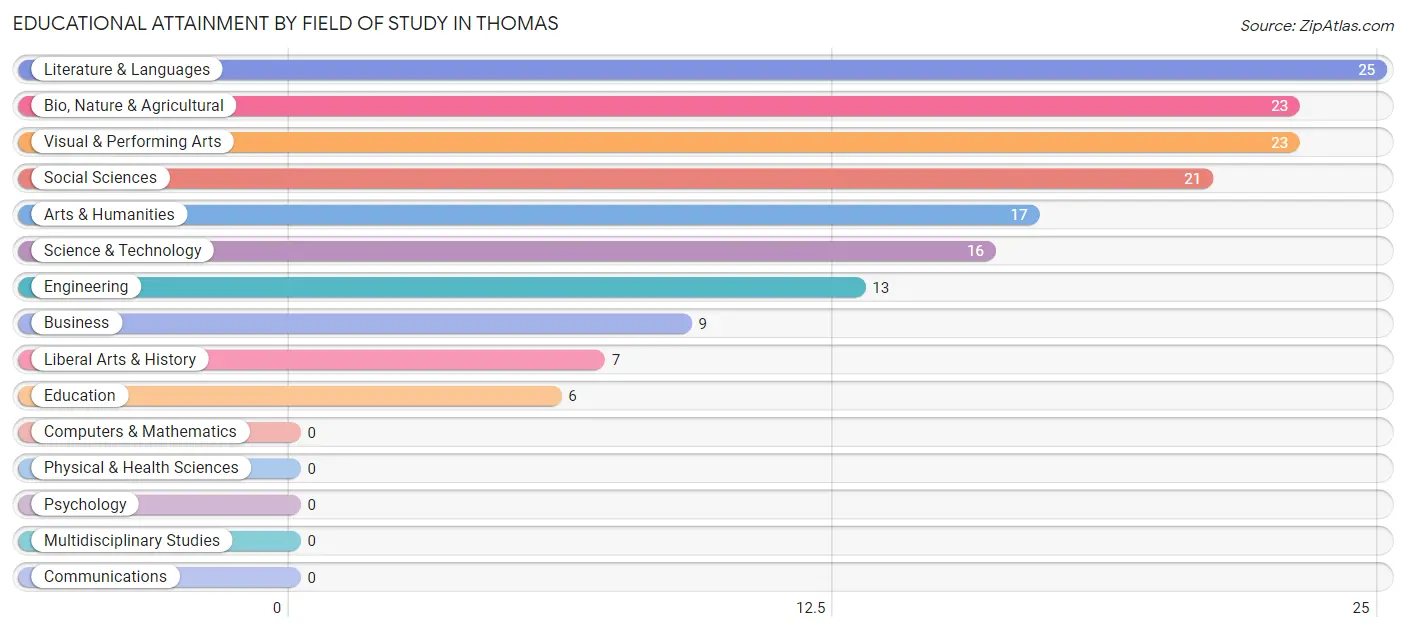
| Field of Study | # Graduates | % Graduates |
| Computers & Mathematics | 0 | 0.0% |
| Bio, Nature & Agricultural | 23 | 14.4% |
| Physical & Health Sciences | 0 | 0.0% |
| Psychology | 0 | 0.0% |
| Social Sciences | 21 | 13.1% |
| Engineering | 13 | 8.1% |
| Multidisciplinary Studies | 0 | 0.0% |
| Science & Technology | 16 | 10.0% |
| Business | 9 | 5.6% |
| Education | 6 | 3.7% |
| Literature & Languages | 25 | 15.6% |
| Liberal Arts & History | 7 | 4.4% |
| Visual & Performing Arts | 23 | 14.4% |
| Communications | 0 | 0.0% |
| Arts & Humanities | 17 | 10.6% |
| Total | 160 | 100.0% |
Transportation & Commute in Thomas
Vehicle Availability by Sex in Thomas
The most prevalent vehicle ownership categories in Thomas are males with 2 vehicles (38, accounting for 34.9%) and females with 2 vehicles (56, making up 28.8%).
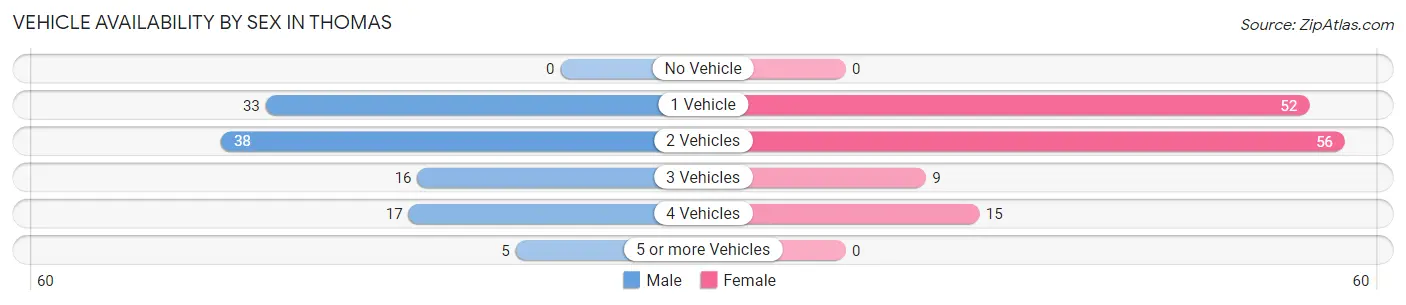
| Vehicles Available | Male | Female |
| No Vehicle | 0 (0.0%) | 0 (0.0%) |
| 1 Vehicle | 33 (30.3%) | 52 (39.4%) |
| 2 Vehicles | 38 (34.9%) | 56 (42.4%) |
| 3 Vehicles | 16 (14.7%) | 9 (6.8%) |
| 4 Vehicles | 17 (15.6%) | 15 (11.4%) |
| 5 or more Vehicles | 5 (4.6%) | 0 (0.0%) |
| Total | 109 (100.0%) | 132 (100.0%) |
Commute Time in Thomas
The most frequently occuring commute durations in Thomas are 5 to 9 minutes (47 commuters, 22.5%), less than 5 minutes (45 commuters, 21.5%), and 20 to 24 minutes (41 commuters, 19.6%).
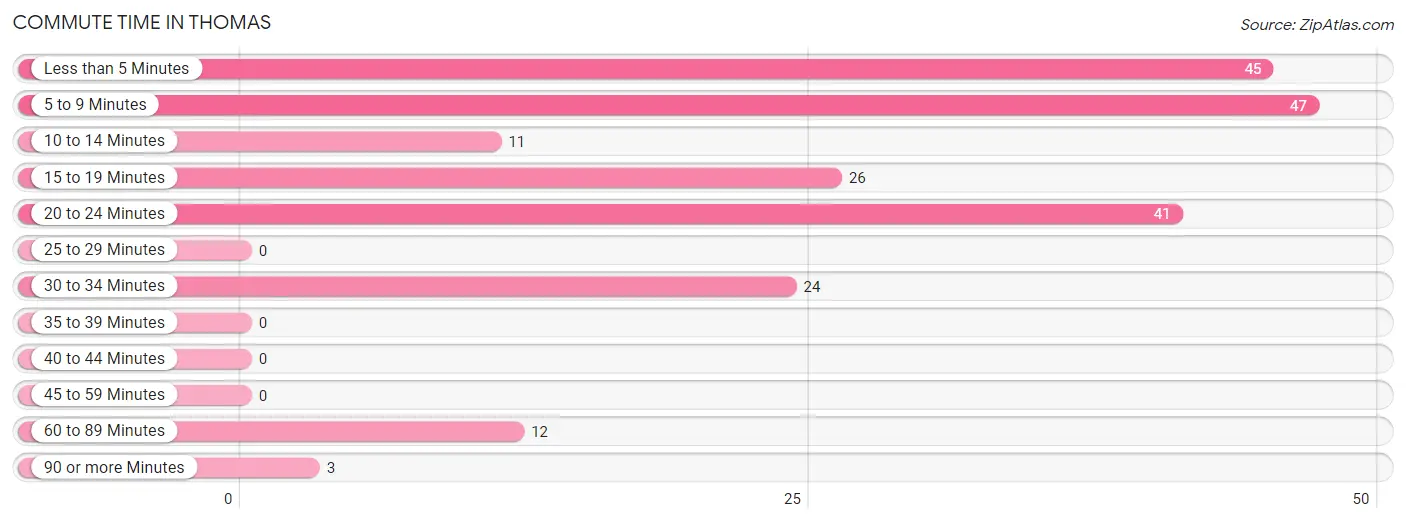
| Commute Time | # Commuters | % Commuters |
| Less than 5 Minutes | 45 | 21.5% |
| 5 to 9 Minutes | 47 | 22.5% |
| 10 to 14 Minutes | 11 | 5.3% |
| 15 to 19 Minutes | 26 | 12.4% |
| 20 to 24 Minutes | 41 | 19.6% |
| 25 to 29 Minutes | 0 | 0.0% |
| 30 to 34 Minutes | 24 | 11.5% |
| 35 to 39 Minutes | 0 | 0.0% |
| 40 to 44 Minutes | 0 | 0.0% |
| 45 to 59 Minutes | 0 | 0.0% |
| 60 to 89 Minutes | 12 | 5.7% |
| 90 or more Minutes | 3 | 1.4% |
Commute Time by Sex in Thomas
The most common commute times in Thomas are 15 to 19 minutes (26 commuters, 28.6%) for males and 5 to 9 minutes (40 commuters, 33.9%) for females.
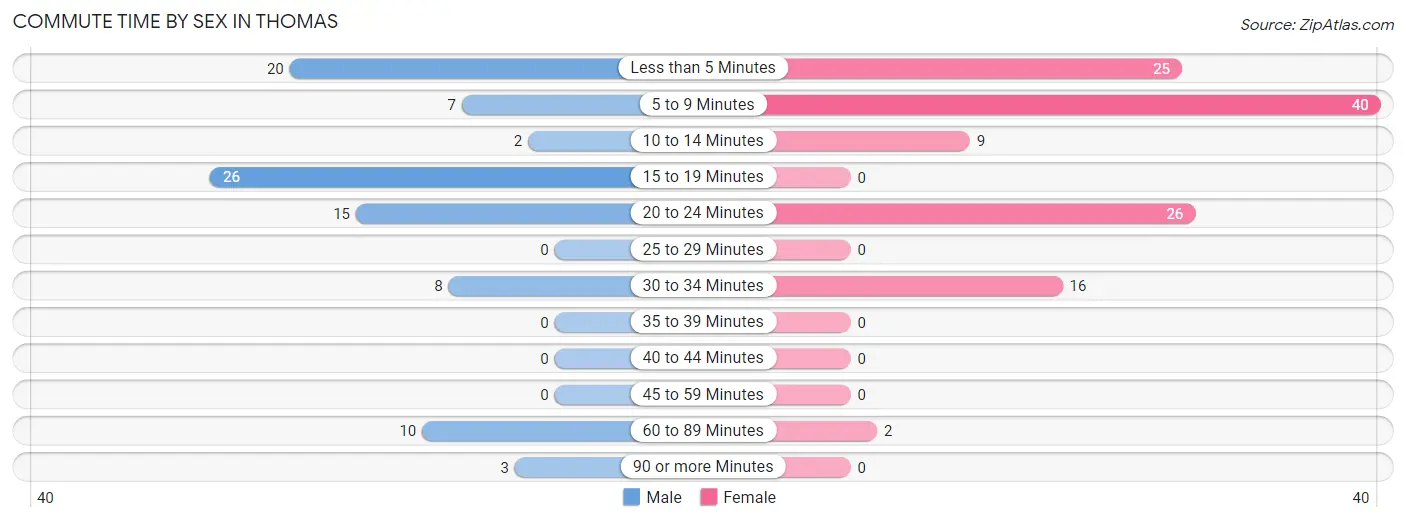
| Commute Time | Male | Female |
| Less than 5 Minutes | 20 (22.0%) | 25 (21.2%) |
| 5 to 9 Minutes | 7 (7.7%) | 40 (33.9%) |
| 10 to 14 Minutes | 2 (2.2%) | 9 (7.6%) |
| 15 to 19 Minutes | 26 (28.6%) | 0 (0.0%) |
| 20 to 24 Minutes | 15 (16.5%) | 26 (22.0%) |
| 25 to 29 Minutes | 0 (0.0%) | 0 (0.0%) |
| 30 to 34 Minutes | 8 (8.8%) | 16 (13.6%) |
| 35 to 39 Minutes | 0 (0.0%) | 0 (0.0%) |
| 40 to 44 Minutes | 0 (0.0%) | 0 (0.0%) |
| 45 to 59 Minutes | 0 (0.0%) | 0 (0.0%) |
| 60 to 89 Minutes | 10 (11.0%) | 2 (1.7%) |
| 90 or more Minutes | 3 (3.3%) | 0 (0.0%) |
Time of Departure to Work by Sex in Thomas
The most frequent times of departure to work in Thomas are 4:00 PM to 11:59 PM (19, 20.9%) for males and 4:00 PM to 11:59 PM (36, 30.5%) for females.
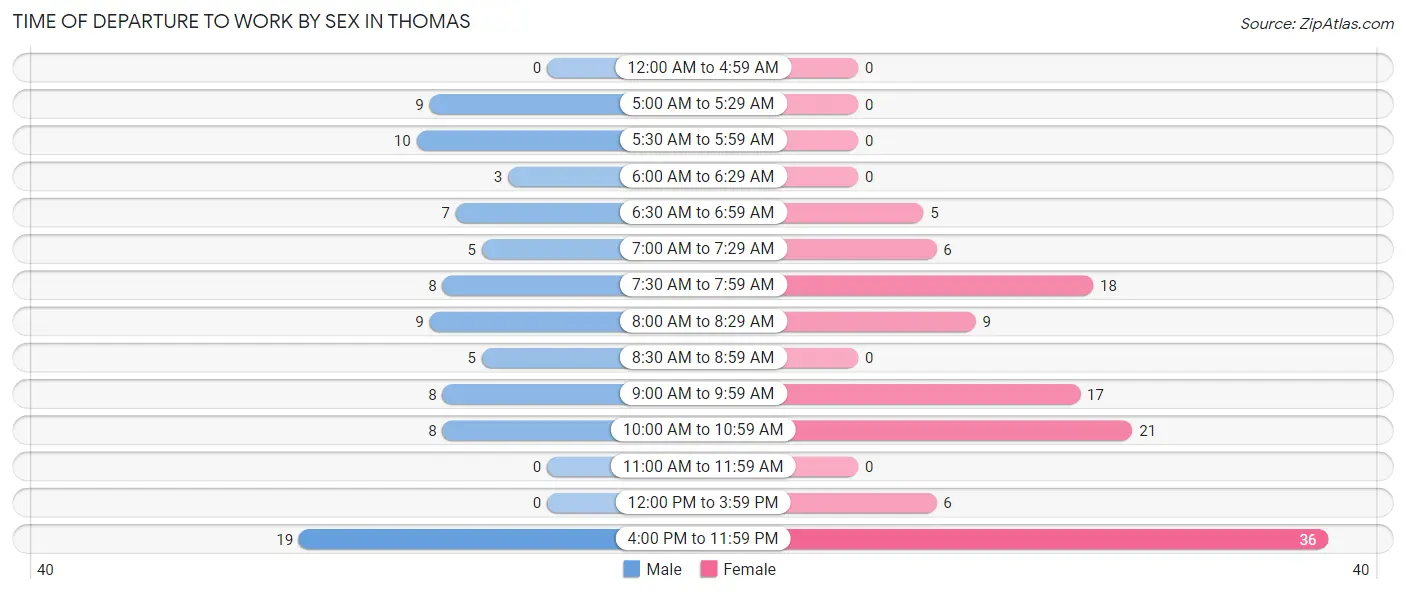
| Time of Departure | Male | Female |
| 12:00 AM to 4:59 AM | 0 (0.0%) | 0 (0.0%) |
| 5:00 AM to 5:29 AM | 9 (9.9%) | 0 (0.0%) |
| 5:30 AM to 5:59 AM | 10 (11.0%) | 0 (0.0%) |
| 6:00 AM to 6:29 AM | 3 (3.3%) | 0 (0.0%) |
| 6:30 AM to 6:59 AM | 7 (7.7%) | 5 (4.2%) |
| 7:00 AM to 7:29 AM | 5 (5.5%) | 6 (5.1%) |
| 7:30 AM to 7:59 AM | 8 (8.8%) | 18 (15.2%) |
| 8:00 AM to 8:29 AM | 9 (9.9%) | 9 (7.6%) |
| 8:30 AM to 8:59 AM | 5 (5.5%) | 0 (0.0%) |
| 9:00 AM to 9:59 AM | 8 (8.8%) | 17 (14.4%) |
| 10:00 AM to 10:59 AM | 8 (8.8%) | 21 (17.8%) |
| 11:00 AM to 11:59 AM | 0 (0.0%) | 0 (0.0%) |
| 12:00 PM to 3:59 PM | 0 (0.0%) | 6 (5.1%) |
| 4:00 PM to 11:59 PM | 19 (20.9%) | 36 (30.5%) |
| Total | 91 (100.0%) | 118 (100.0%) |
Housing Occupancy in Thomas
Occupancy by Ownership in Thomas
Of the total 236 dwellings in Thomas, owner-occupied units account for 150 (63.6%), while renter-occupied units make up 86 (36.4%).
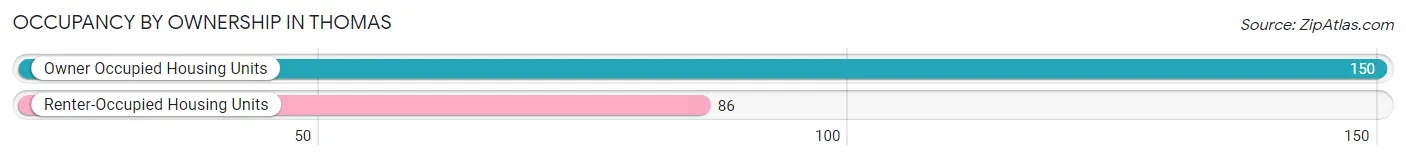
| Occupancy | # Housing Units | % Housing Units |
| Owner Occupied Housing Units | 150 | 63.6% |
| Renter-Occupied Housing Units | 86 | 36.4% |
| Total Occupied Housing Units | 236 | 100.0% |
Occupancy by Household Size in Thomas
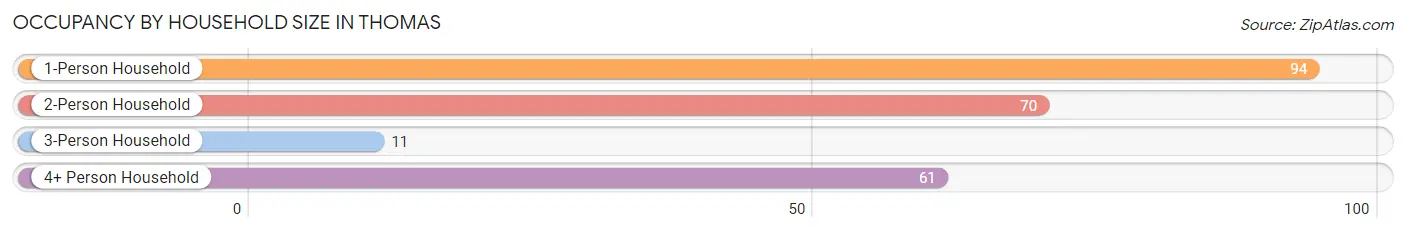
| Household Size | # Housing Units | % Housing Units |
| 1-Person Household | 94 | 39.8% |
| 2-Person Household | 70 | 29.7% |
| 3-Person Household | 11 | 4.7% |
| 4+ Person Household | 61 | 25.9% |
| Total Housing Units | 236 | 100.0% |
Occupancy by Ownership by Household Size in Thomas
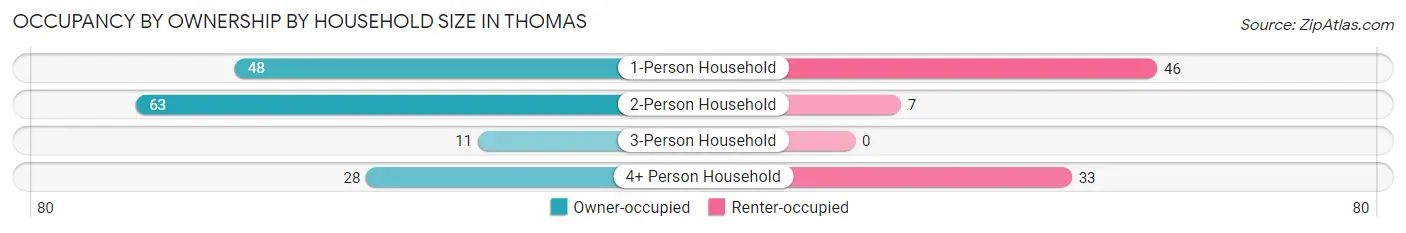
| Household Size | Owner-occupied | Renter-occupied |
| 1-Person Household | 48 (51.1%) | 46 (48.9%) |
| 2-Person Household | 63 (90.0%) | 7 (10.0%) |
| 3-Person Household | 11 (100.0%) | 0 (0.0%) |
| 4+ Person Household | 28 (45.9%) | 33 (54.1%) |
| Total Housing Units | 150 (63.6%) | 86 (36.4%) |
Occupancy by Educational Attainment in Thomas
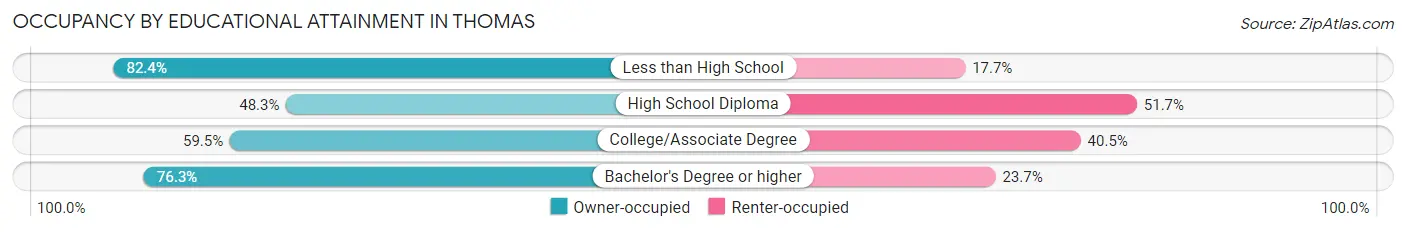
| Household Size | Owner-occupied | Renter-occupied |
| Less than High School | 14 (82.4%) | 3 (17.6%) |
| High School Diploma | 43 (48.3%) | 46 (51.7%) |
| College/Associate Degree | 22 (59.5%) | 15 (40.5%) |
| Bachelor's Degree or higher | 71 (76.3%) | 22 (23.7%) |
Occupancy by Age of Householder in Thomas
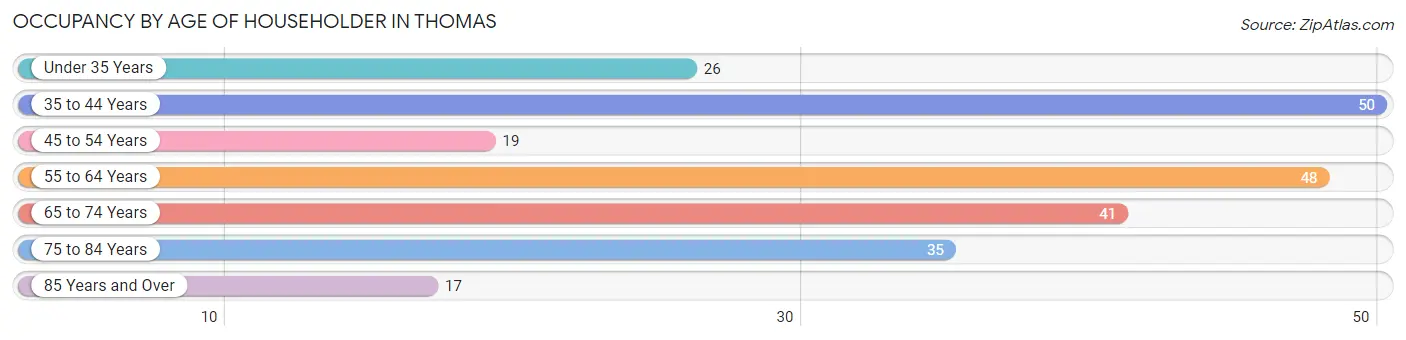
| Age Bracket | # Households | % Households |
| Under 35 Years | 26 | 11.0% |
| 35 to 44 Years | 50 | 21.2% |
| 45 to 54 Years | 19 | 8.1% |
| 55 to 64 Years | 48 | 20.3% |
| 65 to 74 Years | 41 | 17.4% |
| 75 to 84 Years | 35 | 14.8% |
| 85 Years and Over | 17 | 7.2% |
| Total | 236 | 100.0% |
Housing Finances in Thomas
Median Income by Occupancy in Thomas
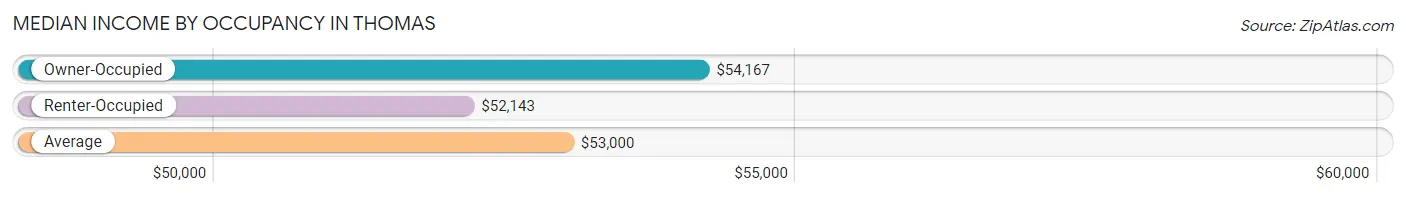
| Occupancy Type | # Households | Median Income |
| Owner-Occupied | 150 (63.6%) | $54,167 |
| Renter-Occupied | 86 (36.4%) | $52,143 |
| Average | 236 (100.0%) | $53,000 |
Occupancy by Householder Income Bracket in Thomas
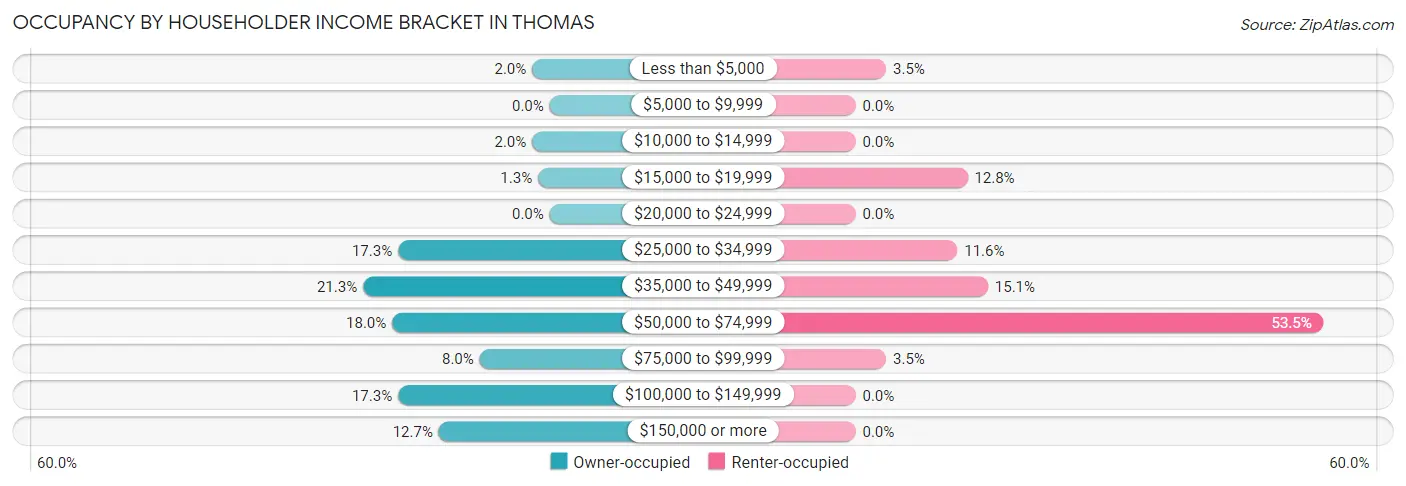
| Income Bracket | Owner-occupied | Renter-occupied |
| Less than $5,000 | 3 (2.0%) | 3 (3.5%) |
| $5,000 to $9,999 | 0 (0.0%) | 0 (0.0%) |
| $10,000 to $14,999 | 3 (2.0%) | 0 (0.0%) |
| $15,000 to $19,999 | 2 (1.3%) | 11 (12.8%) |
| $20,000 to $24,999 | 0 (0.0%) | 0 (0.0%) |
| $25,000 to $34,999 | 26 (17.3%) | 10 (11.6%) |
| $35,000 to $49,999 | 32 (21.3%) | 13 (15.1%) |
| $50,000 to $74,999 | 27 (18.0%) | 46 (53.5%) |
| $75,000 to $99,999 | 12 (8.0%) | 3 (3.5%) |
| $100,000 to $149,999 | 26 (17.3%) | 0 (0.0%) |
| $150,000 or more | 19 (12.7%) | 0 (0.0%) |
| Total | 150 (100.0%) | 86 (100.0%) |
Monthly Housing Cost Tiers in Thomas
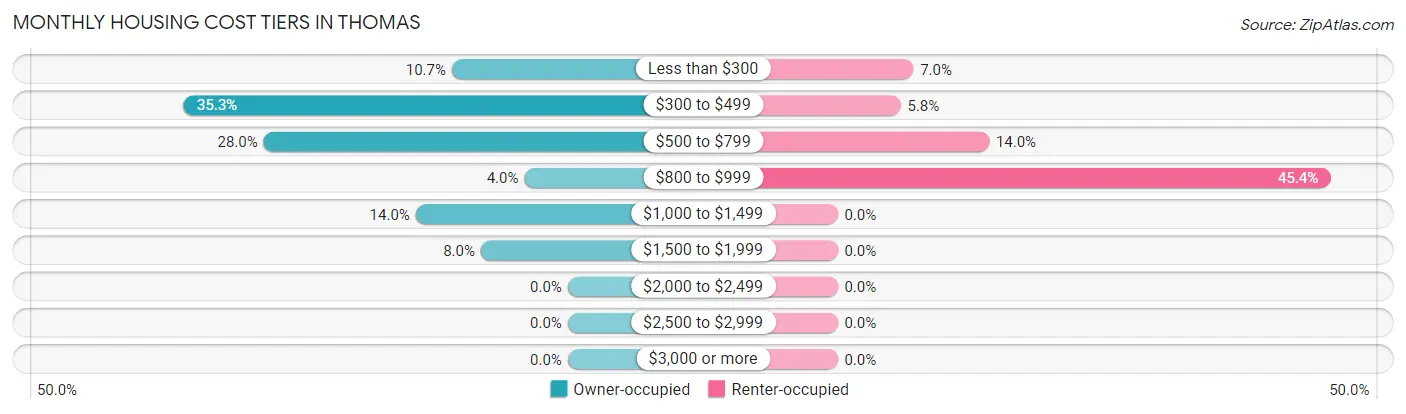
| Monthly Cost | Owner-occupied | Renter-occupied |
| Less than $300 | 16 (10.7%) | 6 (7.0%) |
| $300 to $499 | 53 (35.3%) | 5 (5.8%) |
| $500 to $799 | 42 (28.0%) | 12 (14.0%) |
| $800 to $999 | 6 (4.0%) | 39 (45.4%) |
| $1,000 to $1,499 | 21 (14.0%) | 0 (0.0%) |
| $1,500 to $1,999 | 12 (8.0%) | 0 (0.0%) |
| $2,000 to $2,499 | 0 (0.0%) | 0 (0.0%) |
| $2,500 to $2,999 | 0 (0.0%) | 0 (0.0%) |
| $3,000 or more | 0 (0.0%) | 0 (0.0%) |
| Total | 150 (100.0%) | 86 (100.0%) |
Physical Housing Characteristics in Thomas
Housing Structures in Thomas
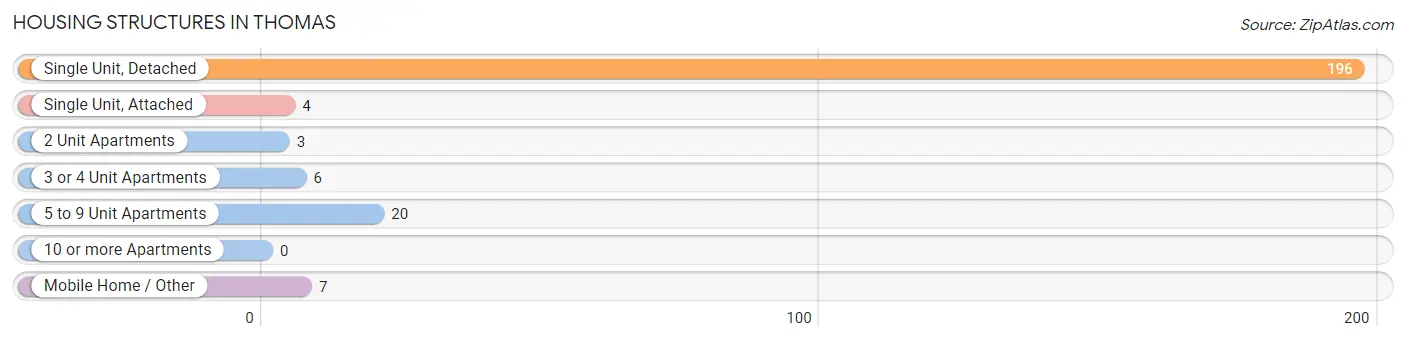
| Structure Type | # Housing Units | % Housing Units |
| Single Unit, Detached | 196 | 83.1% |
| Single Unit, Attached | 4 | 1.7% |
| 2 Unit Apartments | 3 | 1.3% |
| 3 or 4 Unit Apartments | 6 | 2.5% |
| 5 to 9 Unit Apartments | 20 | 8.5% |
| 10 or more Apartments | 0 | 0.0% |
| Mobile Home / Other | 7 | 3.0% |
| Total | 236 | 100.0% |
Housing Structures by Occupancy in Thomas
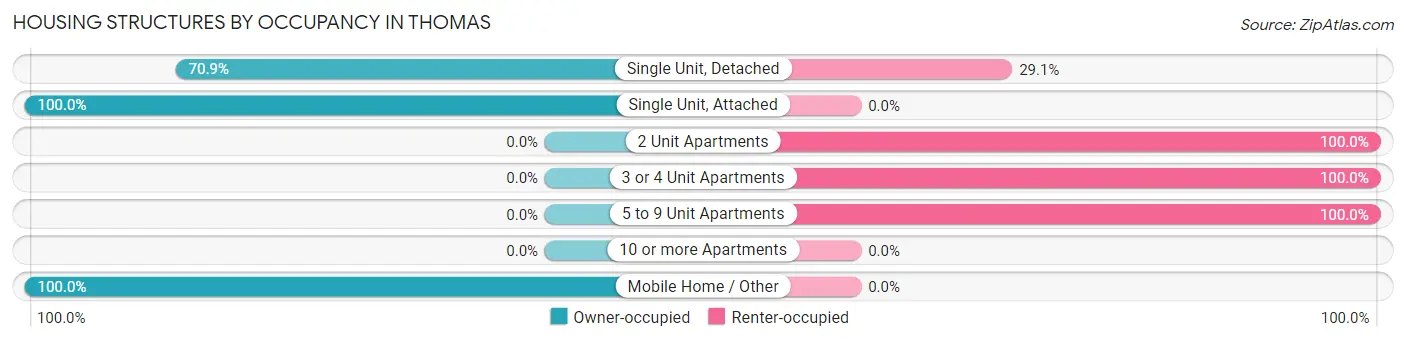
| Structure Type | Owner-occupied | Renter-occupied |
| Single Unit, Detached | 139 (70.9%) | 57 (29.1%) |
| Single Unit, Attached | 4 (100.0%) | 0 (0.0%) |
| 2 Unit Apartments | 0 (0.0%) | 3 (100.0%) |
| 3 or 4 Unit Apartments | 0 (0.0%) | 6 (100.0%) |
| 5 to 9 Unit Apartments | 0 (0.0%) | 20 (100.0%) |
| 10 or more Apartments | 0 (0.0%) | 0 (0.0%) |
| Mobile Home / Other | 7 (100.0%) | 0 (0.0%) |
| Total | 150 (63.6%) | 86 (36.4%) |
Housing Structures by Number of Rooms in Thomas
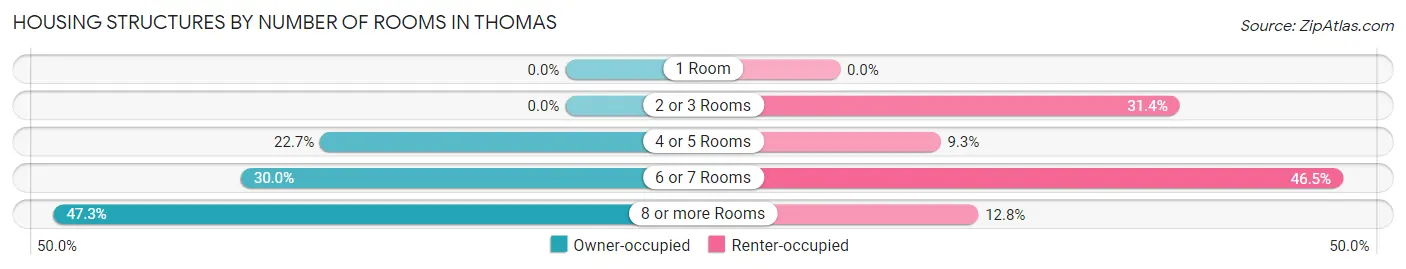
| Number of Rooms | Owner-occupied | Renter-occupied |
| 1 Room | 0 (0.0%) | 0 (0.0%) |
| 2 or 3 Rooms | 0 (0.0%) | 27 (31.4%) |
| 4 or 5 Rooms | 34 (22.7%) | 8 (9.3%) |
| 6 or 7 Rooms | 45 (30.0%) | 40 (46.5%) |
| 8 or more Rooms | 71 (47.3%) | 11 (12.8%) |
| Total | 150 (100.0%) | 86 (100.0%) |
Housing Structure by Heating Type in Thomas
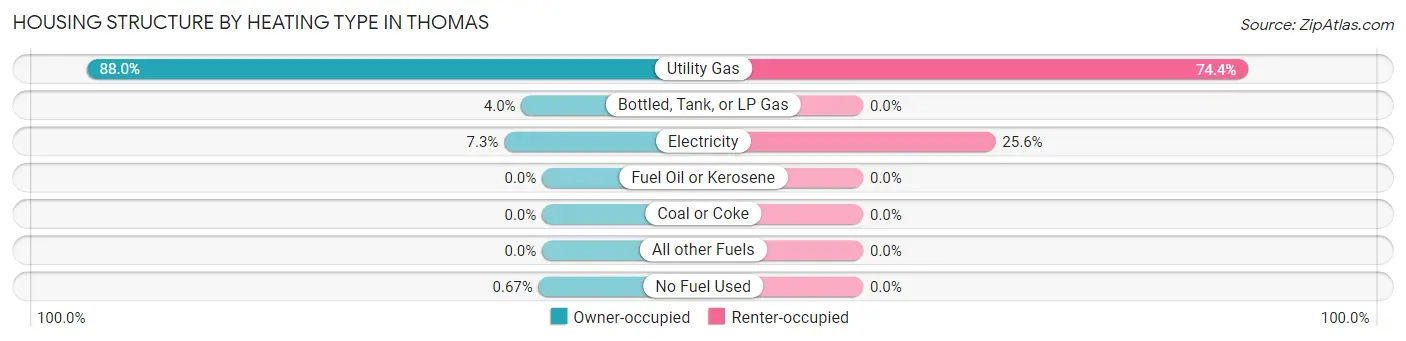
| Heating Type | Owner-occupied | Renter-occupied |
| Utility Gas | 132 (88.0%) | 64 (74.4%) |
| Bottled, Tank, or LP Gas | 6 (4.0%) | 0 (0.0%) |
| Electricity | 11 (7.3%) | 22 (25.6%) |
| Fuel Oil or Kerosene | 0 (0.0%) | 0 (0.0%) |
| Coal or Coke | 0 (0.0%) | 0 (0.0%) |
| All other Fuels | 0 (0.0%) | 0 (0.0%) |
| No Fuel Used | 1 (0.7%) | 0 (0.0%) |
| Total | 150 (100.0%) | 86 (100.0%) |
Household Vehicle Usage in Thomas
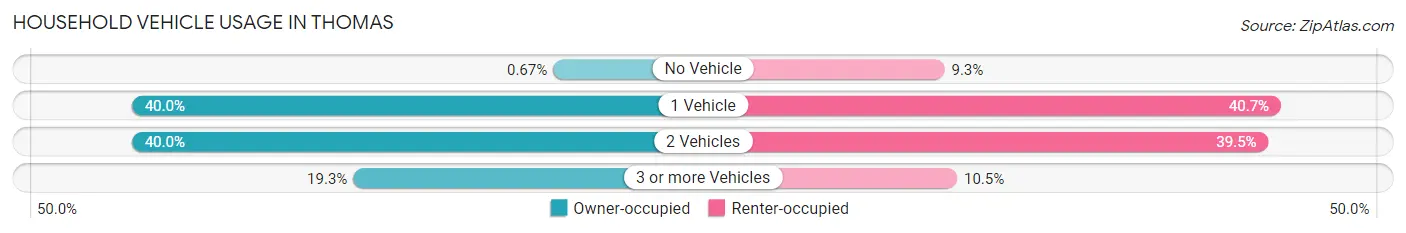
| Vehicles per Household | Owner-occupied | Renter-occupied |
| No Vehicle | 1 (0.7%) | 8 (9.3%) |
| 1 Vehicle | 60 (40.0%) | 35 (40.7%) |
| 2 Vehicles | 60 (40.0%) | 34 (39.5%) |
| 3 or more Vehicles | 29 (19.3%) | 9 (10.5%) |
| Total | 150 (100.0%) | 86 (100.0%) |
Real Estate & Mortgages in Thomas
Real Estate and Mortgage Overview in Thomas
| Characteristic | Without Mortgage | With Mortgage |
| Housing Units | 89 | 61 |
| Median Property Value | $119,400 | $183,600 |
| Median Household Income | $51,964 | $14 |
| Monthly Housing Costs | $393 | $0 |
| Real Estate Taxes | $600 | $0 |
Property Value by Mortgage Status in Thomas
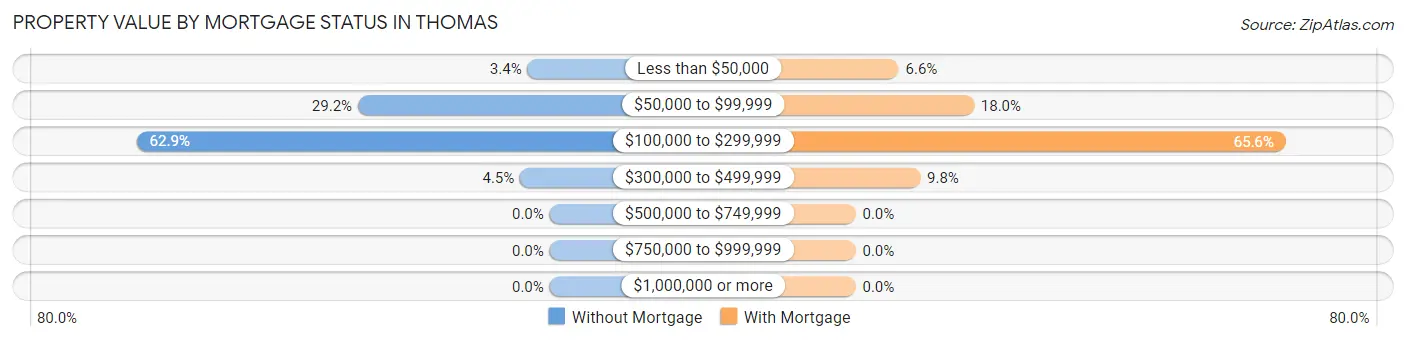
| Property Value | Without Mortgage | With Mortgage |
| Less than $50,000 | 3 (3.4%) | 4 (6.6%) |
| $50,000 to $99,999 | 26 (29.2%) | 11 (18.0%) |
| $100,000 to $299,999 | 56 (62.9%) | 40 (65.6%) |
| $300,000 to $499,999 | 4 (4.5%) | 6 (9.8%) |
| $500,000 to $749,999 | 0 (0.0%) | 0 (0.0%) |
| $750,000 to $999,999 | 0 (0.0%) | 0 (0.0%) |
| $1,000,000 or more | 0 (0.0%) | 0 (0.0%) |
| Total | 89 (100.0%) | 61 (100.0%) |
Household Income by Mortgage Status in Thomas
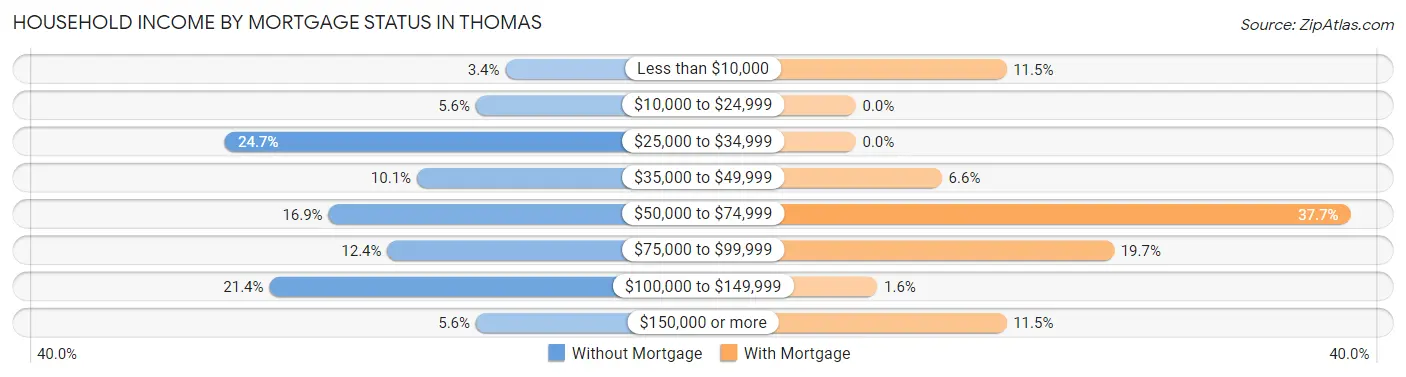
| Household Income | Without Mortgage | With Mortgage |
| Less than $10,000 | 3 (3.4%) | 7 (11.5%) |
| $10,000 to $24,999 | 5 (5.6%) | 0 (0.0%) |
| $25,000 to $34,999 | 22 (24.7%) | 0 (0.0%) |
| $35,000 to $49,999 | 9 (10.1%) | 4 (6.6%) |
| $50,000 to $74,999 | 15 (16.9%) | 23 (37.7%) |
| $75,000 to $99,999 | 11 (12.4%) | 12 (19.7%) |
| $100,000 to $149,999 | 19 (21.3%) | 1 (1.6%) |
| $150,000 or more | 5 (5.6%) | 7 (11.5%) |
| Total | 89 (100.0%) | 61 (100.0%) |
Property Value to Household Income Ratio in Thomas
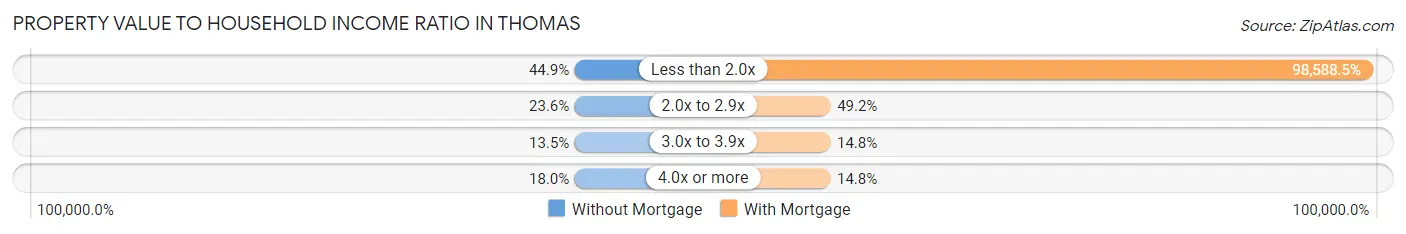
| Value-to-Income Ratio | Without Mortgage | With Mortgage |
| Less than 2.0x | 40 (44.9%) | 60,139 (98,588.5%) |
| 2.0x to 2.9x | 21 (23.6%) | 30 (49.2%) |
| 3.0x to 3.9x | 12 (13.5%) | 9 (14.7%) |
| 4.0x or more | 16 (18.0%) | 9 (14.7%) |
| Total | 89 (100.0%) | 61 (100.0%) |
Real Estate Taxes by Mortgage Status in Thomas
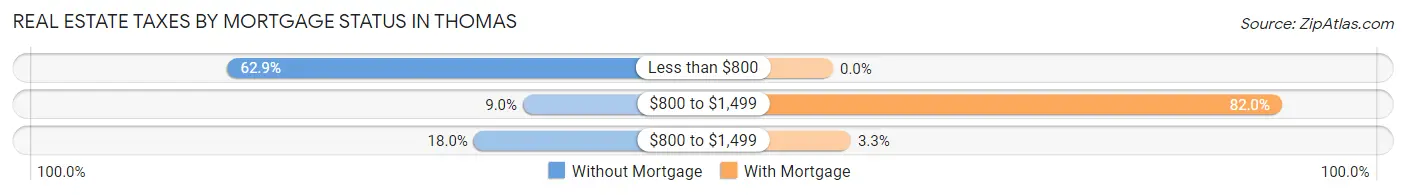
| Property Taxes | Without Mortgage | With Mortgage |
| Less than $800 | 56 (62.9%) | 0 (0.0%) |
| $800 to $1,499 | 8 (9.0%) | 50 (82.0%) |
| $800 to $1,499 | 16 (18.0%) | 2 (3.3%) |
| Total | 89 (100.0%) | 61 (100.0%) |
Health & Disability in Thomas
Health Insurance Coverage by Age in Thomas
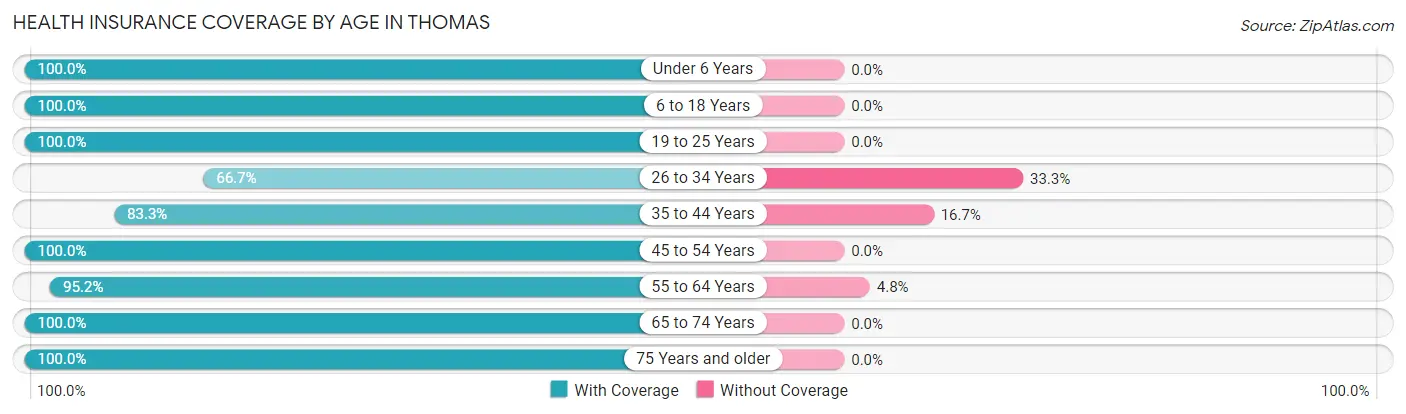
| Age Bracket | With Coverage | Without Coverage |
| Under 6 Years | 32 (100.0%) | 0 (0.0%) |
| 6 to 18 Years | 70 (100.0%) | 0 (0.0%) |
| 19 to 25 Years | 19 (100.0%) | 0 (0.0%) |
| 26 to 34 Years | 56 (66.7%) | 28 (33.3%) |
| 35 to 44 Years | 60 (83.3%) | 12 (16.7%) |
| 45 to 54 Years | 28 (100.0%) | 0 (0.0%) |
| 55 to 64 Years | 60 (95.2%) | 3 (4.8%) |
| 65 to 74 Years | 107 (100.0%) | 0 (0.0%) |
| 75 Years and older | 58 (100.0%) | 0 (0.0%) |
| Total | 490 (91.9%) | 43 (8.1%) |
Health Insurance Coverage by Citizenship Status in Thomas
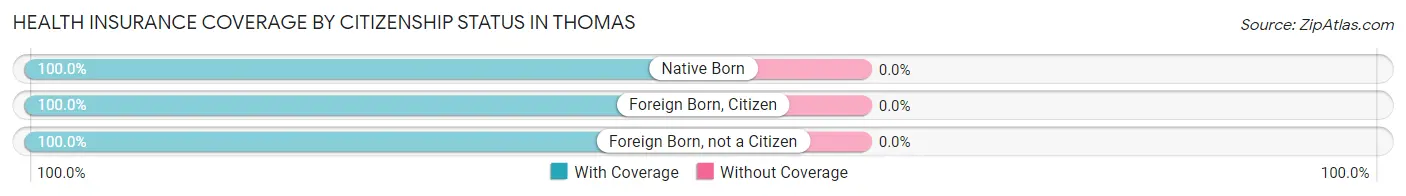
| Citizenship Status | With Coverage | Without Coverage |
| Native Born | 32 (100.0%) | 0 (0.0%) |
| Foreign Born, Citizen | 70 (100.0%) | 0 (0.0%) |
| Foreign Born, not a Citizen | 19 (100.0%) | 0 (0.0%) |
Health Insurance Coverage by Household Income in Thomas
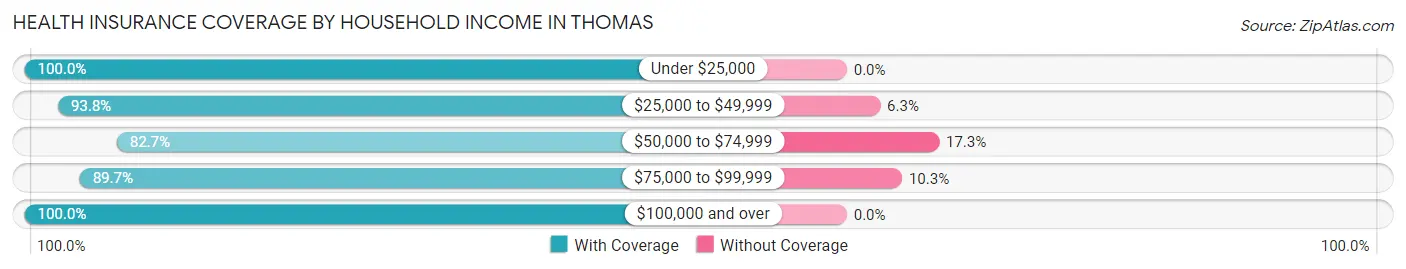
| Household Income | With Coverage | Without Coverage |
| Under $25,000 | 22 (100.0%) | 0 (0.0%) |
| $25,000 to $49,999 | 180 (93.8%) | 12 (6.2%) |
| $50,000 to $74,999 | 134 (82.7%) | 28 (17.3%) |
| $75,000 to $99,999 | 26 (89.7%) | 3 (10.3%) |
| $100,000 and over | 128 (100.0%) | 0 (0.0%) |
Public vs Private Health Insurance Coverage by Age in Thomas
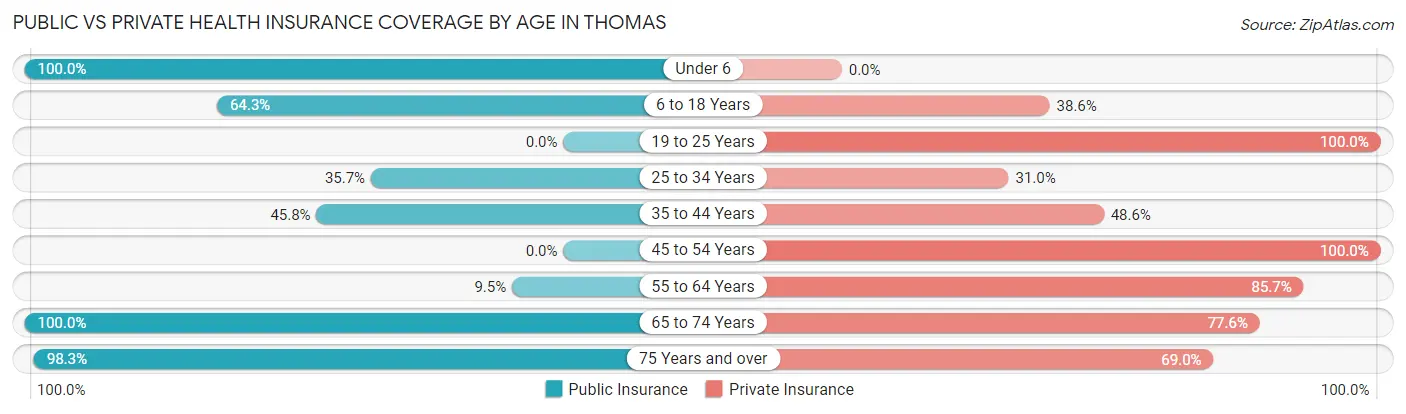
| Age Bracket | Public Insurance | Private Insurance |
| Under 6 | 32 (100.0%) | 0 (0.0%) |
| 6 to 18 Years | 45 (64.3%) | 27 (38.6%) |
| 19 to 25 Years | 0 (0.0%) | 19 (100.0%) |
| 25 to 34 Years | 30 (35.7%) | 26 (30.9%) |
| 35 to 44 Years | 33 (45.8%) | 35 (48.6%) |
| 45 to 54 Years | 0 (0.0%) | 28 (100.0%) |
| 55 to 64 Years | 6 (9.5%) | 54 (85.7%) |
| 65 to 74 Years | 107 (100.0%) | 83 (77.6%) |
| 75 Years and over | 57 (98.3%) | 40 (69.0%) |
| Total | 310 (58.2%) | 312 (58.5%) |
Disability Status by Sex by Age in Thomas
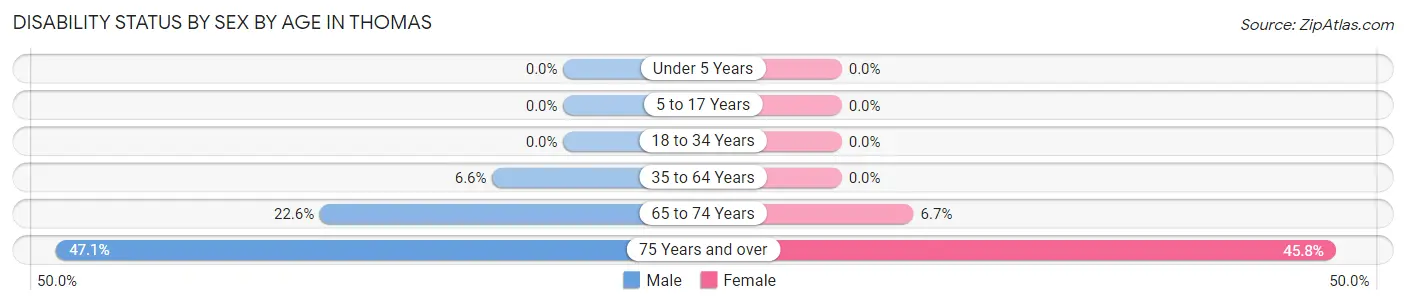
| Age Bracket | Male | Female |
| Under 5 Years | 0 (0.0%) | 0 (0.0%) |
| 5 to 17 Years | 0 (0.0%) | 0 (0.0%) |
| 18 to 34 Years | 0 (0.0%) | 0 (0.0%) |
| 35 to 64 Years | 6 (6.6%) | 0 (0.0%) |
| 65 to 74 Years | 14 (22.6%) | 3 (6.7%) |
| 75 Years and over | 16 (47.1%) | 11 (45.8%) |
Disability Class by Sex by Age in Thomas
Disability Class: Hearing Difficulty
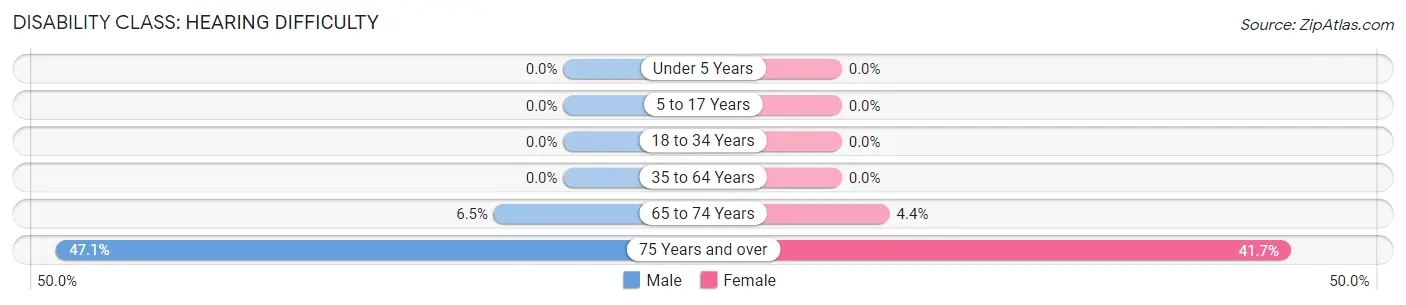
| Age Bracket | Male | Female |
| Under 5 Years | 0 (0.0%) | 0 (0.0%) |
| 5 to 17 Years | 0 (0.0%) | 0 (0.0%) |
| 18 to 34 Years | 0 (0.0%) | 0 (0.0%) |
| 35 to 64 Years | 0 (0.0%) | 0 (0.0%) |
| 65 to 74 Years | 4 (6.5%) | 2 (4.4%) |
| 75 Years and over | 16 (47.1%) | 10 (41.7%) |
Disability Class: Vision Difficulty
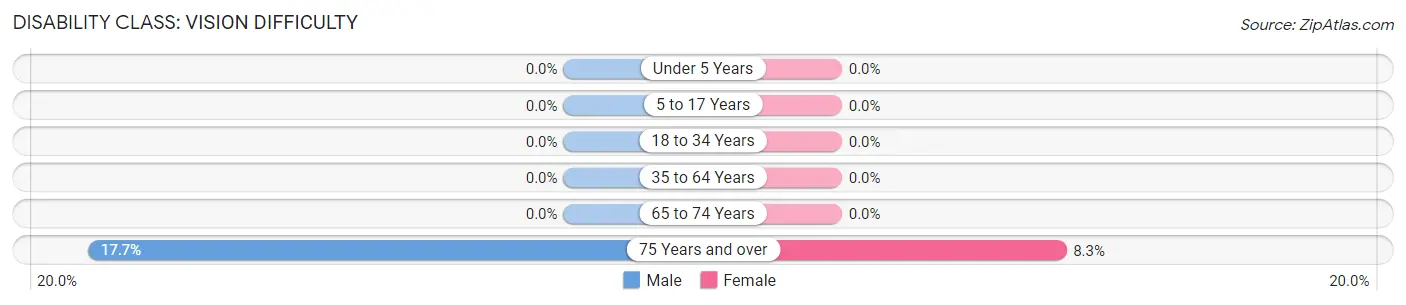
| Age Bracket | Male | Female |
| Under 5 Years | 0 (0.0%) | 0 (0.0%) |
| 5 to 17 Years | 0 (0.0%) | 0 (0.0%) |
| 18 to 34 Years | 0 (0.0%) | 0 (0.0%) |
| 35 to 64 Years | 0 (0.0%) | 0 (0.0%) |
| 65 to 74 Years | 0 (0.0%) | 0 (0.0%) |
| 75 Years and over | 6 (17.6%) | 2 (8.3%) |
Disability Class: Cognitive Difficulty
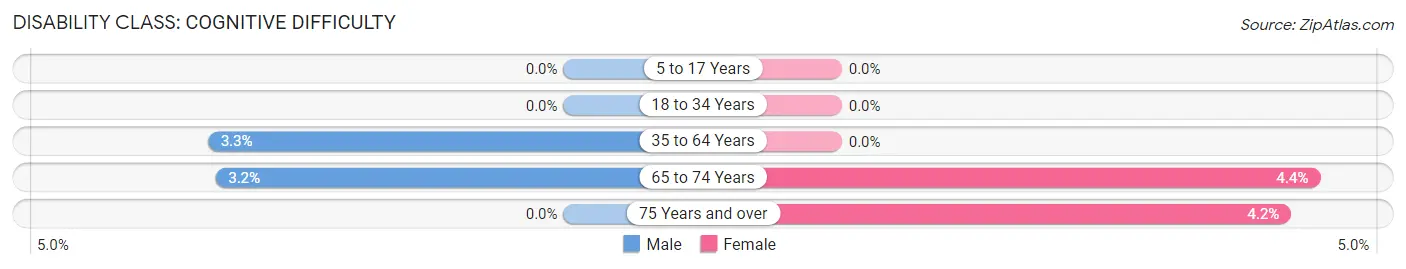
| Age Bracket | Male | Female |
| 5 to 17 Years | 0 (0.0%) | 0 (0.0%) |
| 18 to 34 Years | 0 (0.0%) | 0 (0.0%) |
| 35 to 64 Years | 3 (3.3%) | 0 (0.0%) |
| 65 to 74 Years | 2 (3.2%) | 2 (4.4%) |
| 75 Years and over | 0 (0.0%) | 1 (4.2%) |
Disability Class: Ambulatory Difficulty
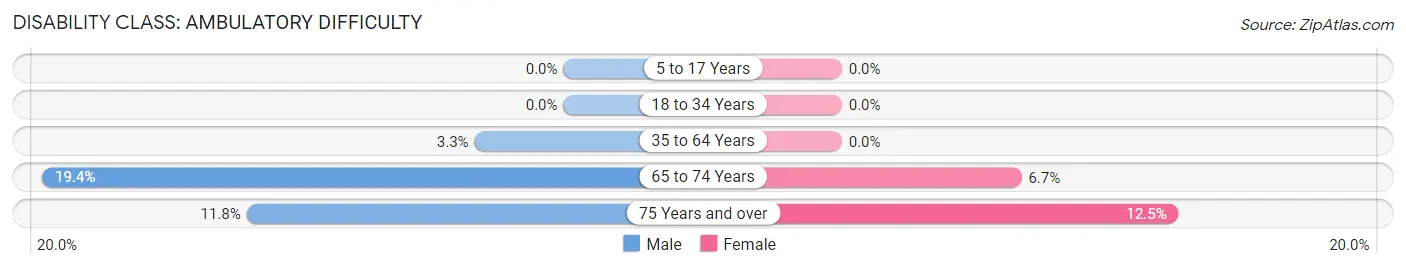
| Age Bracket | Male | Female |
| 5 to 17 Years | 0 (0.0%) | 0 (0.0%) |
| 18 to 34 Years | 0 (0.0%) | 0 (0.0%) |
| 35 to 64 Years | 3 (3.3%) | 0 (0.0%) |
| 65 to 74 Years | 12 (19.4%) | 3 (6.7%) |
| 75 Years and over | 4 (11.8%) | 3 (12.5%) |
Disability Class: Self-Care Difficulty
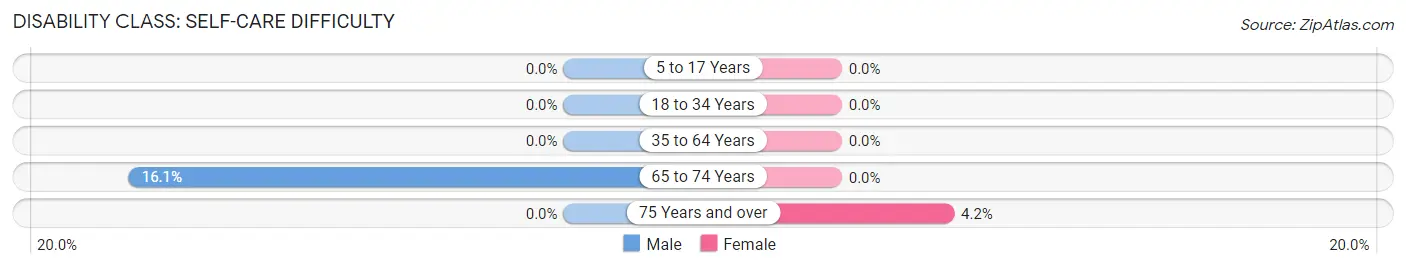
| Age Bracket | Male | Female |
| 5 to 17 Years | 0 (0.0%) | 0 (0.0%) |
| 18 to 34 Years | 0 (0.0%) | 0 (0.0%) |
| 35 to 64 Years | 0 (0.0%) | 0 (0.0%) |
| 65 to 74 Years | 10 (16.1%) | 0 (0.0%) |
| 75 Years and over | 0 (0.0%) | 1 (4.2%) |
Technology Access in Thomas
Computing Device Access in Thomas
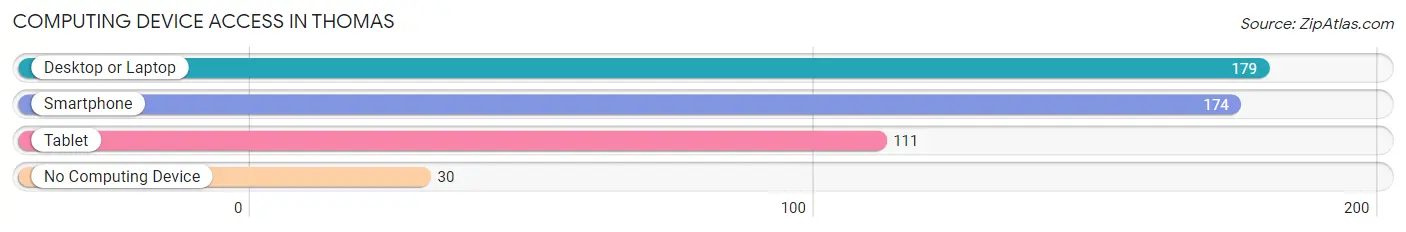
| Device Type | # Households | % Households |
| Desktop or Laptop | 179 | 75.8% |
| Smartphone | 174 | 73.7% |
| Tablet | 111 | 47.0% |
| No Computing Device | 30 | 12.7% |
| Total | 236 | 100.0% |
Internet Access in Thomas
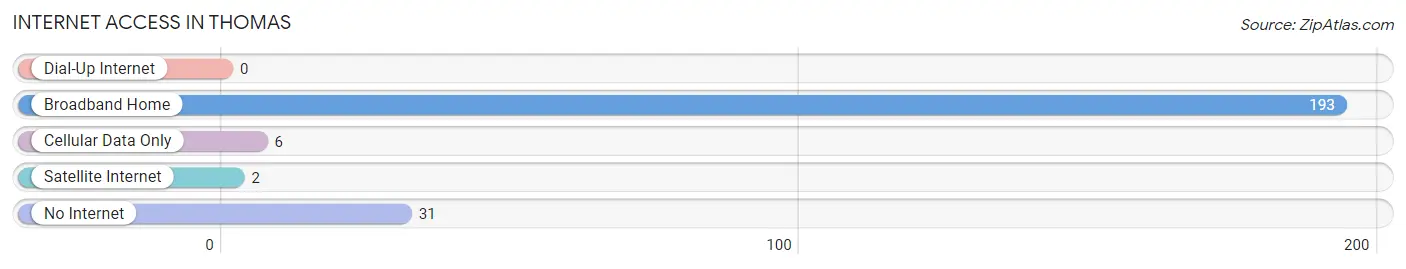
| Internet Type | # Households | % Households |
| Dial-Up Internet | 0 | 0.0% |
| Broadband Home | 193 | 81.8% |
| Cellular Data Only | 6 | 2.5% |
| Satellite Internet | 2 | 0.9% |
| No Internet | 31 | 13.1% |
| Total | 236 | 100.0% |
Thomas Summary
Thomas, West Virginia is a small town located in Tucker County, in the Appalachian Mountains of West Virginia. It is situated along the Cheat River, and is the county seat of Tucker County. The town was founded in 1856 and was named after Thomas B. Davis, a prominent local businessman.
History
Thomas was founded in 1856 by Thomas B. Davis, a prominent local businessman. Davis had purchased the land from the heirs of the original owner, John Thomas, and named the town after himself. The town was incorporated in 1871 and was the first town in Tucker County to be incorporated.
The town was originally a small farming community, but in the late 19th century, the railroad came to town, bringing with it a new industry and a new population. The railroad brought in coal miners and other workers, and the town began to grow. By the early 20th century, Thomas had become a bustling town with a variety of businesses, including a hotel, a bank, a post office, and several stores.
Geography
Thomas is located in the Appalachian Mountains of West Virginia, in Tucker County. It is situated along the Cheat River, and is the county seat of Tucker County. The town is surrounded by mountains and forests, and is located at an elevation of 2,400 feet. The climate is humid continental, with cold winters and hot summers.
Economy
The economy of Thomas is largely based on tourism and outdoor recreation. The town is a popular destination for hikers, campers, and other outdoor enthusiasts, and there are several nearby state parks and forests. The town is also home to several small businesses, including restaurants, shops, and galleries.
Demographics
As of the 2010 census, the population of Thomas was 545. The racial makeup of the town was 97.3% White, 0.7% African American, 0.2% Native American, 0.2% Asian, and 1.6% from other races. The median household income was $30,000, and the median family income was $35,000. The per capita income was $17,000. The town has a poverty rate of 17.3%.
Conclusion
Thomas, West Virginia is a small town located in Tucker County, in the Appalachian Mountains of West Virginia. It was founded in 1856 and was named after Thomas B. Davis, a prominent local businessman. The town is largely based on tourism and outdoor recreation, and is a popular destination for hikers, campers, and other outdoor enthusiasts. The population of Thomas was 545 as of the 2010 census, and the median household income was $30,000.
Common Questions
What is Per Capita Income in Thomas?
Per Capita income in Thomas is $30,881.
What is the Median Family Income in Thomas?
Median Family Income in Thomas is $63,125.
What is the Median Household income in Thomas?
Median Household Income in Thomas is $53,000.
What is Income or Wage Gap in Thomas?
Income or Wage Gap in Thomas is 39.8%.
Women in Thomas earn 60.2 cents for every dollar earned by a man.
What is Inequality or Gini Index in Thomas?
Inequality or Gini Index in Thomas is 0.39.
What is the Total Population of Thomas?
Total Population of Thomas is 624.
What is the Total Male Population of Thomas?
Total Male Population of Thomas is 300.
What is the Total Female Population of Thomas?
Total Female Population of Thomas is 324.
What is the Ratio of Males per 100 Females in Thomas?
There are 92.59 Males per 100 Females in Thomas.
What is the Ratio of Females per 100 Males in Thomas?
There are 108.00 Females per 100 Males in Thomas.
What is the Median Population Age in Thomas?
Median Population Age in Thomas is 57.0 Years.
What is the Average Family Size in Thomas
Average Family Size in Thomas is 3.1 People.
What is the Average Household Size in Thomas
Average Household Size in Thomas is 2.3 People.
How Large is the Labor Force in Thomas?
There are 283 People in the Labor Forcein in Thomas.
What is the Percentage of People in the Labor Force in Thomas?
52.5% of People are in the Labor Force in Thomas.
What is the Unemployment Rate in Thomas?
Unemployment Rate in Thomas is 12.7%.