Mcmechen, WV Map & Demographics
Mcmechen Map
Mcmechen Overview
$27,164
PER CAPITA INCOME
$61,818
AVG FAMILY INCOME
$51,389
AVG HOUSEHOLD INCOME
36.8%
WAGE / INCOME GAP [ % ]
63.2¢/ $1
WAGE / INCOME GAP [ $ ]
0.46
INEQUALITY / GINI INDEX
1,812
TOTAL POPULATION
1,088
MALE POPULATION
724
FEMALE POPULATION
150.28
MALES / 100 FEMALES
66.54
FEMALES / 100 MALES
34.3
MEDIAN AGE
3.4
AVG FAMILY SIZE
2.8
AVG HOUSEHOLD SIZE
856
LABOR FORCE [ PEOPLE ]
61.3%
PERCENT IN LABOR FORCE
5.3%
UNEMPLOYMENT RATE
Mcmechen Zip Codes
Mcmechen Area Codes
Income in Mcmechen
Income Overview in Mcmechen
Per Capita Income in Mcmechen is $27,164, while median incomes of families and households are $61,818 and $51,389 respectively.
| Characteristic | Number | Measure |
| Per Capita Income | 1,812 | $27,164 |
| Median Family Income | 380 | $61,818 |
| Mean Family Income | 380 | $73,321 |
| Median Household Income | 640 | $51,389 |
| Mean Household Income | 640 | $68,354 |
| Income Deficit | 380 | $0 |
| Wage / Income Gap (%) | 1,812 | 36.78% |
| Wage / Income Gap ($) | 1,812 | 63.22¢ per $1 |
| Gini / Inequality Index | 1,812 | 0.46 |
Earnings by Sex in Mcmechen
Average Earnings in Mcmechen are $35,156, $37,850 for men and $23,929 for women, a difference of 36.8%.
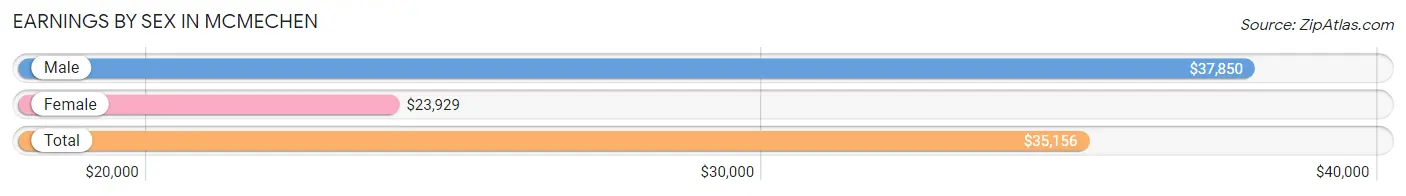
| Sex | Number | Average Earnings |
| Male | 521 (58.9%) | $37,850 |
| Female | 364 (41.1%) | $23,929 |
| Total | 885 (100.0%) | $35,156 |
Earnings by Sex by Income Bracket in Mcmechen
The most common earnings brackets in Mcmechen are $100,000+ for men (85 | 16.3%) and $45,000 to $49,999 for women (41 | 11.3%).
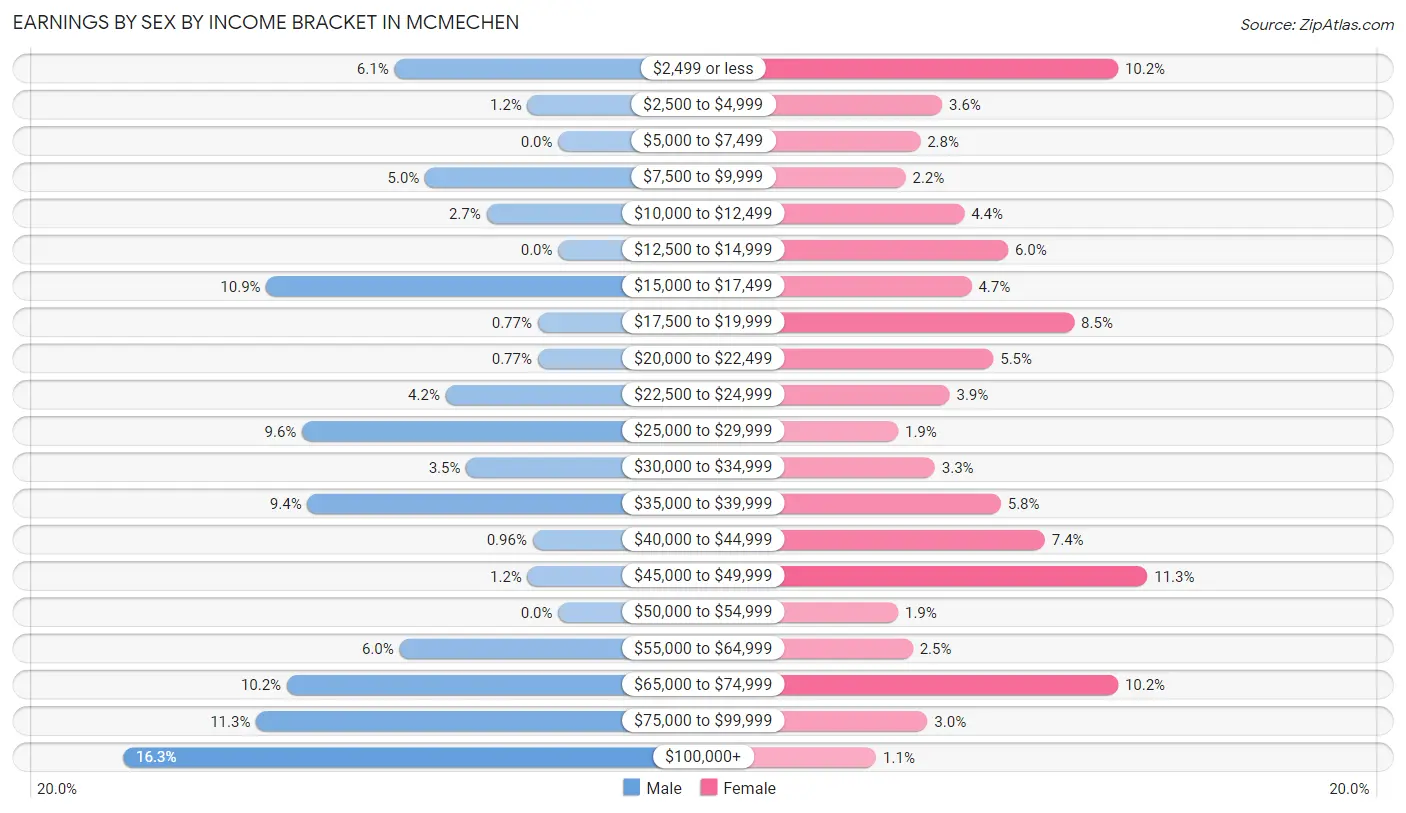
| Income | Male | Female |
| $2,499 or less | 32 (6.1%) | 37 (10.2%) |
| $2,500 to $4,999 | 6 (1.1%) | 13 (3.6%) |
| $5,000 to $7,499 | 0 (0.0%) | 10 (2.8%) |
| $7,500 to $9,999 | 26 (5.0%) | 8 (2.2%) |
| $10,000 to $12,499 | 14 (2.7%) | 16 (4.4%) |
| $12,500 to $14,999 | 0 (0.0%) | 22 (6.0%) |
| $15,000 to $17,499 | 57 (10.9%) | 17 (4.7%) |
| $17,500 to $19,999 | 4 (0.8%) | 31 (8.5%) |
| $20,000 to $22,499 | 4 (0.8%) | 20 (5.5%) |
| $22,500 to $24,999 | 22 (4.2%) | 14 (3.8%) |
| $25,000 to $29,999 | 50 (9.6%) | 7 (1.9%) |
| $30,000 to $34,999 | 18 (3.5%) | 12 (3.3%) |
| $35,000 to $39,999 | 49 (9.4%) | 21 (5.8%) |
| $40,000 to $44,999 | 5 (1.0%) | 27 (7.4%) |
| $45,000 to $49,999 | 6 (1.1%) | 41 (11.3%) |
| $50,000 to $54,999 | 0 (0.0%) | 7 (1.9%) |
| $55,000 to $64,999 | 31 (5.9%) | 9 (2.5%) |
| $65,000 to $74,999 | 53 (10.2%) | 37 (10.2%) |
| $75,000 to $99,999 | 59 (11.3%) | 11 (3.0%) |
| $100,000+ | 85 (16.3%) | 4 (1.1%) |
| Total | 521 (100.0%) | 364 (100.0%) |
Earnings by Sex by Educational Attainment in Mcmechen
Average earnings in Mcmechen are $39,550 for men and $29,000 for women, a difference of 26.7%. Men with an educational attainment of graduate degree enjoy the highest average annual earnings of $137,857, while those with college or associate's degree education earn the least with $30,125. Women with an educational attainment of bachelor's degree earn the most with the average annual earnings of $42,639, while those with high school diploma education have the smallest earnings of $22,917.
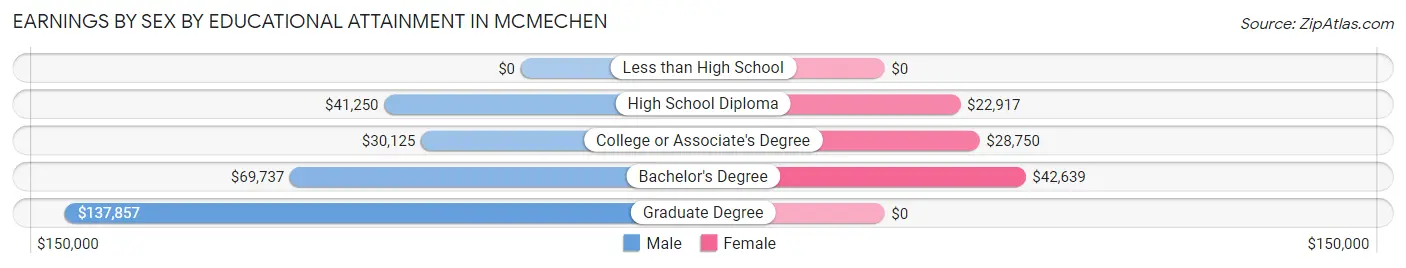
| Educational Attainment | Male Income | Female Income |
| Less than High School | - | - |
| High School Diploma | $41,250 | $22,917 |
| College or Associate's Degree | $30,125 | $28,750 |
| Bachelor's Degree | $69,737 | $42,639 |
| Graduate Degree | $137,857 | $0 |
| Total | $39,550 | $29,000 |
Family Income in Mcmechen
Family Income Brackets in Mcmechen
According to the Mcmechen family income data, there are 83 families falling into the $50,000 to $74,999 income range, which is the most common income bracket and makes up 21.8% of all families. Conversely, the $150,000 to $199,999 income bracket is the least frequent group with only 3 families (0.8%) belonging to this category.
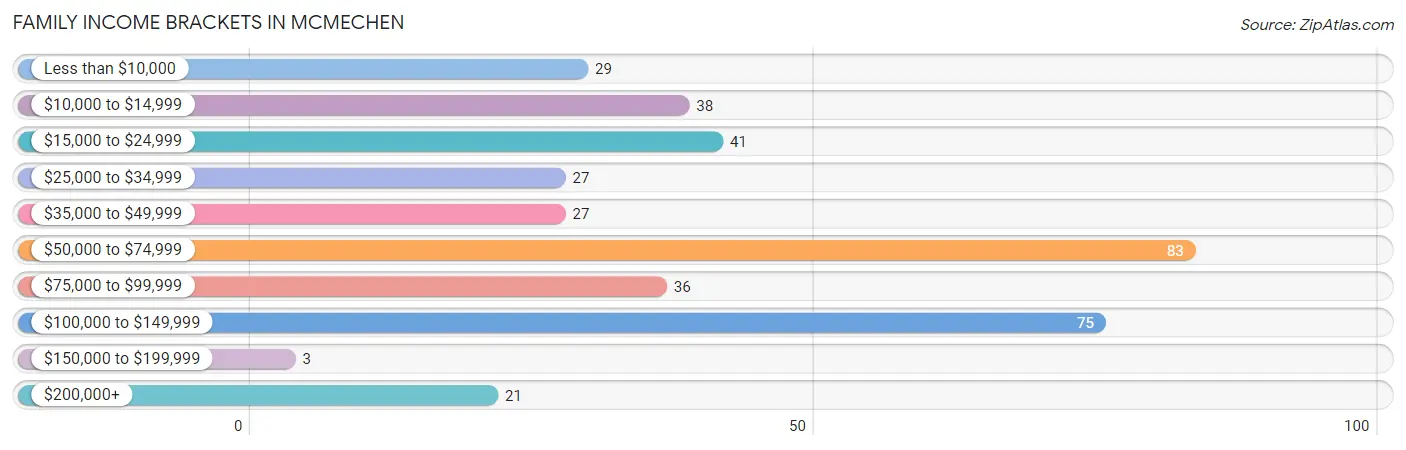
| Income Bracket | # Families | % Families |
| Less than $10,000 | 29 | 7.6% |
| $10,000 to $14,999 | 38 | 10.0% |
| $15,000 to $24,999 | 41 | 10.8% |
| $25,000 to $34,999 | 27 | 7.1% |
| $35,000 to $49,999 | 27 | 7.1% |
| $50,000 to $74,999 | 83 | 21.8% |
| $75,000 to $99,999 | 36 | 9.5% |
| $100,000 to $149,999 | 75 | 19.7% |
| $150,000 to $199,999 | 3 | 0.8% |
| $200,000+ | 21 | 5.5% |
Family Income by Famaliy Size in Mcmechen
2-person families (205 | 53.9%) account for the highest median family income in Mcmechen with $60,568 per family, while 2-person families (205 | 53.9%) have the highest median income of $30,284 per family member.
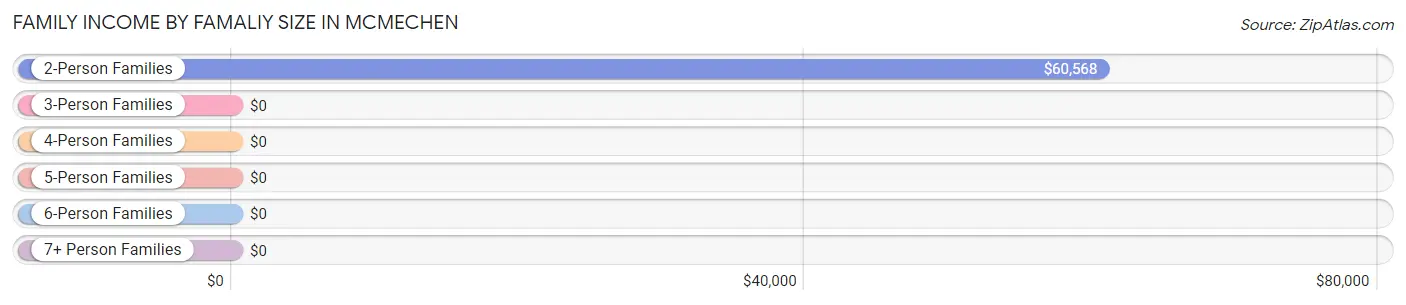
| Income Bracket | # Families | Median Income |
| 2-Person Families | 205 (53.9%) | $60,568 |
| 3-Person Families | 92 (24.2%) | $0 |
| 4-Person Families | 80 (21.0%) | $0 |
| 5-Person Families | 0 (0.0%) | $0 |
| 6-Person Families | 3 (0.8%) | $0 |
| 7+ Person Families | 0 (0.0%) | $0 |
| Total | 380 (100.0%) | $61,818 |
Family Income by Number of Earners in Mcmechen
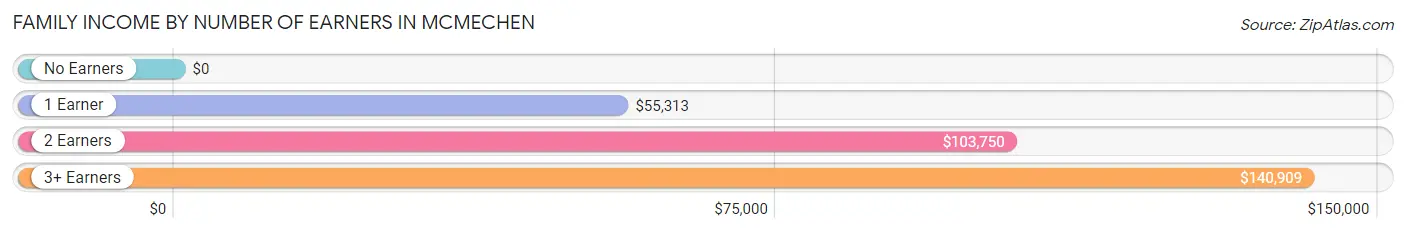
| Number of Earners | # Families | Median Income |
| No Earners | 102 (26.8%) | $0 |
| 1 Earner | 136 (35.8%) | $55,313 |
| 2 Earners | 80 (21.0%) | $103,750 |
| 3+ Earners | 62 (16.3%) | $140,909 |
| Total | 380 (100.0%) | $61,818 |
Household Income in Mcmechen
Household Income Brackets in Mcmechen
With 112 households falling in the category, the $50,000 to $74,999 income range is the most frequent in Mcmechen, accounting for 17.5% of all households. In contrast, only 21 households (3.3%) fall into the $200,000+ income bracket, making it the least populous group.
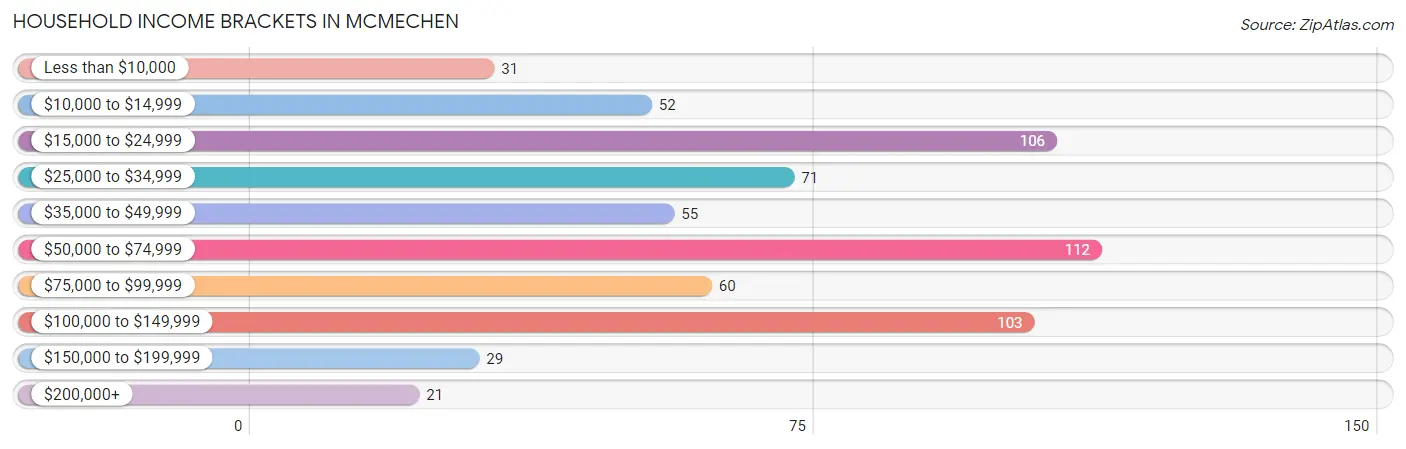
| Income Bracket | # Households | % Households |
| Less than $10,000 | 31 | 4.8% |
| $10,000 to $14,999 | 52 | 8.1% |
| $15,000 to $24,999 | 106 | 16.6% |
| $25,000 to $34,999 | 71 | 11.1% |
| $35,000 to $49,999 | 55 | 8.6% |
| $50,000 to $74,999 | 112 | 17.5% |
| $75,000 to $99,999 | 60 | 9.4% |
| $100,000 to $149,999 | 103 | 16.1% |
| $150,000 to $199,999 | 29 | 4.5% |
| $200,000+ | 21 | 3.3% |
Household Income by Householder Age in Mcmechen
The median household income in Mcmechen is $51,389, with the highest median household income of $73,603 found in the 45 to 64 years age bracket for the primary householder. A total of 231 households (36.1%) fall into this category. Meanwhile, the 15 to 24 years age bracket for the primary householder has the lowest median household income of $0, with 3 households (0.5%) in this group.
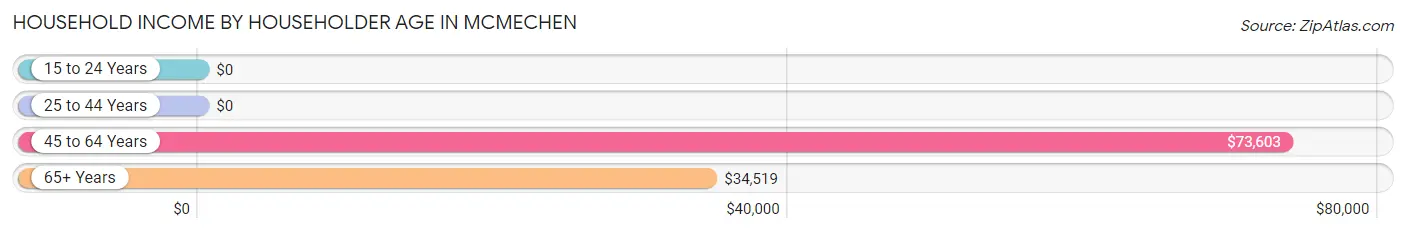
| Income Bracket | # Households | Median Income |
| 15 to 24 Years | 3 (0.5%) | $0 |
| 25 to 44 Years | 229 (35.8%) | $0 |
| 45 to 64 Years | 231 (36.1%) | $73,603 |
| 65+ Years | 177 (27.7%) | $34,519 |
| Total | 640 (100.0%) | $51,389 |
Poverty in Mcmechen
Income Below Poverty by Sex and Age in Mcmechen
With 29.4% poverty level for males and 31.1% for females among the residents of Mcmechen, 5 year old males and 12 to 14 year old females are the most vulnerable to poverty, with 39 males (100.0%) and 29 females (100.0%) in their respective age groups living below the poverty level.
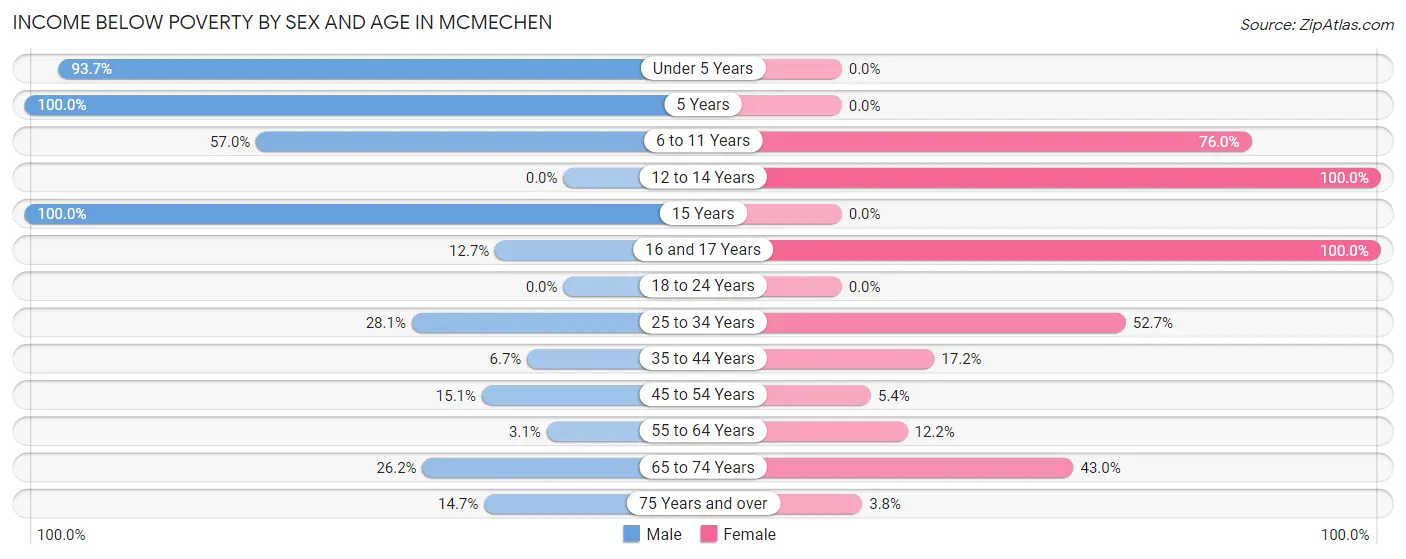
| Age Bracket | Male | Female |
| Under 5 Years | 74 (93.7%) | 0 (0.0%) |
| 5 Years | 39 (100.0%) | 0 (0.0%) |
| 6 to 11 Years | 65 (57.0%) | 38 (76.0%) |
| 12 to 14 Years | 0 (0.0%) | 29 (100.0%) |
| 15 Years | 9 (100.0%) | 0 (0.0%) |
| 16 and 17 Years | 10 (12.7%) | 10 (100.0%) |
| 18 to 24 Years | 0 (0.0%) | 0 (0.0%) |
| 25 to 34 Years | 56 (28.1%) | 68 (52.7%) |
| 35 to 44 Years | 8 (6.7%) | 11 (17.2%) |
| 45 to 54 Years | 23 (15.1%) | 5 (5.4%) |
| 55 to 64 Years | 3 (3.1%) | 11 (12.2%) |
| 65 to 74 Years | 17 (26.2%) | 37 (43.0%) |
| 75 Years and over | 5 (14.7%) | 3 (3.8%) |
| Total | 309 (29.4%) | 212 (31.1%) |
Income Above Poverty by Sex and Age in Mcmechen
According to the poverty statistics in Mcmechen, males aged 18 to 24 years and females aged 15 years are the age groups that are most secure financially, with 100.0% of males and 100.0% of females in these age groups living above the poverty line.
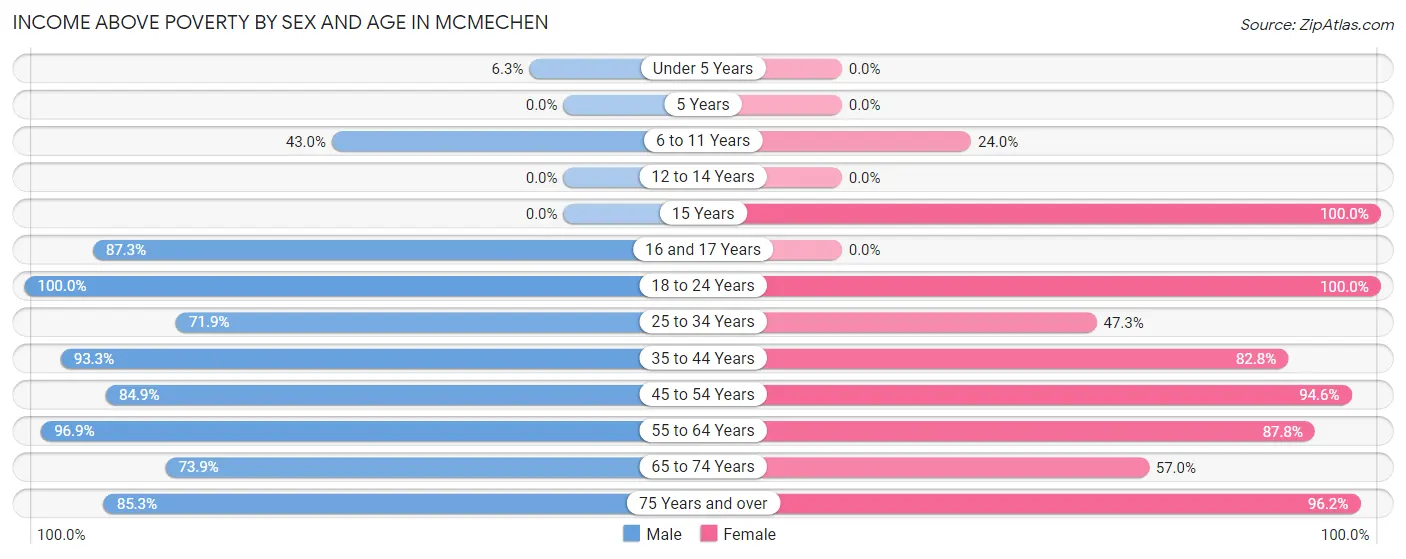
| Age Bracket | Male | Female |
| Under 5 Years | 5 (6.3%) | 0 (0.0%) |
| 5 Years | 0 (0.0%) | 0 (0.0%) |
| 6 to 11 Years | 49 (43.0%) | 12 (24.0%) |
| 12 to 14 Years | 0 (0.0%) | 0 (0.0%) |
| 15 Years | 0 (0.0%) | 16 (100.0%) |
| 16 and 17 Years | 69 (87.3%) | 0 (0.0%) |
| 18 to 24 Years | 66 (100.0%) | 36 (100.0%) |
| 25 to 34 Years | 143 (71.9%) | 61 (47.3%) |
| 35 to 44 Years | 111 (93.3%) | 53 (82.8%) |
| 45 to 54 Years | 129 (84.9%) | 87 (94.6%) |
| 55 to 64 Years | 94 (96.9%) | 79 (87.8%) |
| 65 to 74 Years | 48 (73.9%) | 49 (57.0%) |
| 75 Years and over | 29 (85.3%) | 76 (96.2%) |
| Total | 743 (70.6%) | 469 (68.9%) |
Income Below Poverty Among Married-Couple Families in Mcmechen
The poverty statistics for married-couple families in Mcmechen show that 14.0% or 31 of the total 221 families live below the poverty line. Families with 1 or 2 children have the highest poverty rate of 23.3%, comprising of 14 families. On the other hand, families with no children have the lowest poverty rate of 10.6%, which includes 17 families.
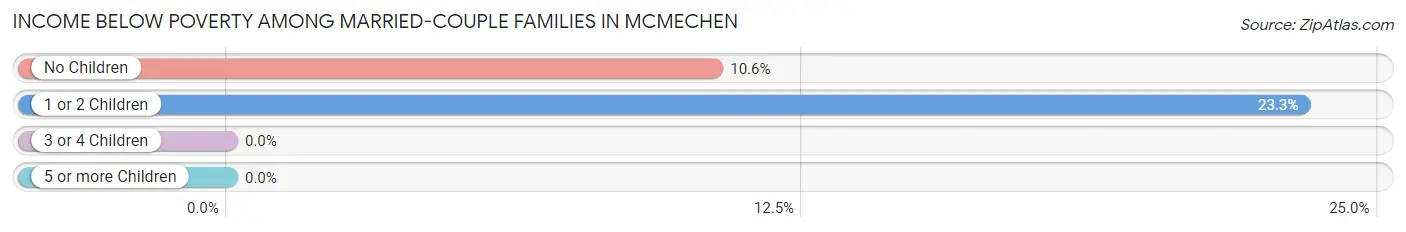
| Children | Above Poverty | Below Poverty |
| No Children | 144 (89.4%) | 17 (10.6%) |
| 1 or 2 Children | 46 (76.7%) | 14 (23.3%) |
| 3 or 4 Children | 0 (0.0%) | 0 (0.0%) |
| 5 or more Children | 0 (0.0%) | 0 (0.0%) |
| Total | 190 (86.0%) | 31 (14.0%) |
Income Below Poverty Among Single-Parent Households in Mcmechen
According to the poverty data in Mcmechen, 55.4% or 36 single-father households and 34.0% or 32 single-mother households are living below the poverty line. Among single-father households, those with 1 or 2 children have the highest poverty rate, with 36 households (100.0%) experiencing poverty. Likewise, among single-mother households, those with 3 or 4 children have the highest poverty rate, with 20 households (100.0%) falling below the poverty line.
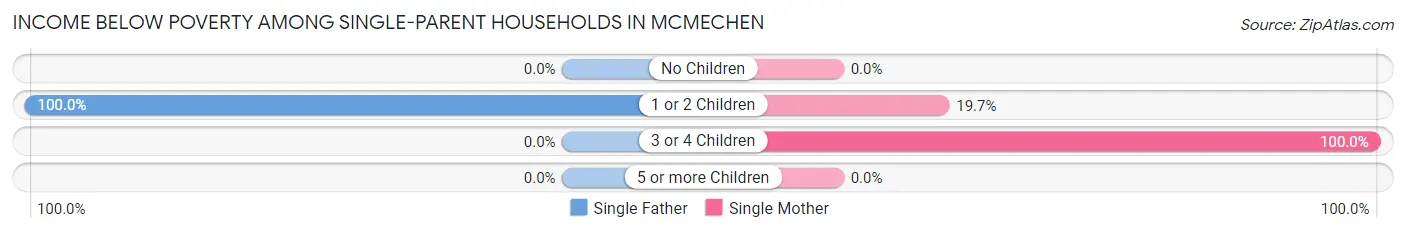
| Children | Single Father | Single Mother |
| No Children | 0 (0.0%) | 0 (0.0%) |
| 1 or 2 Children | 36 (100.0%) | 12 (19.7%) |
| 3 or 4 Children | 0 (0.0%) | 20 (100.0%) |
| 5 or more Children | 0 (0.0%) | 0 (0.0%) |
| Total | 36 (55.4%) | 32 (34.0%) |
Income Below Poverty Among Married-Couple vs Single-Parent Households in Mcmechen
The poverty data for Mcmechen shows that 31 of the married-couple family households (14.0%) and 68 of the single-parent households (42.8%) are living below the poverty level. Within the married-couple family households, those with 1 or 2 children have the highest poverty rate, with 14 households (23.3%) falling below the poverty line. Among the single-parent households, those with 3 or 4 children have the highest poverty rate, with 20 household (100.0%) living below poverty.
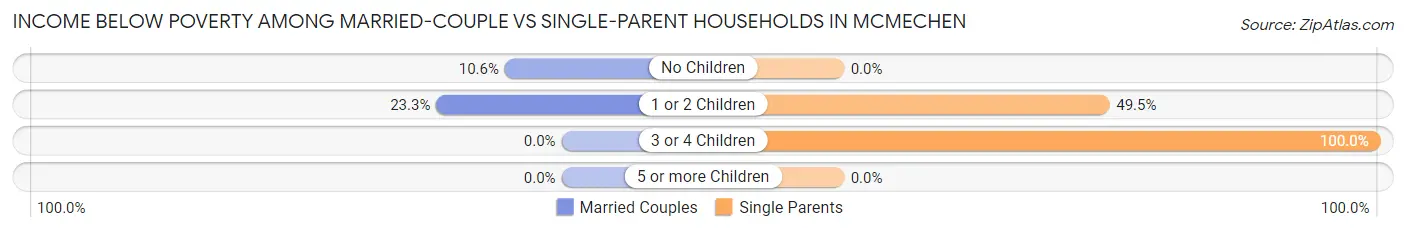
| Children | Married-Couple Families | Single-Parent Households |
| No Children | 17 (10.6%) | 0 (0.0%) |
| 1 or 2 Children | 14 (23.3%) | 48 (49.5%) |
| 3 or 4 Children | 0 (0.0%) | 20 (100.0%) |
| 5 or more Children | 0 (0.0%) | 0 (0.0%) |
| Total | 31 (14.0%) | 68 (42.8%) |
Race in Mcmechen
The most populous races in Mcmechen are White / Caucasian (1,560 | 86.1%), Two or more Races (224 | 12.4%), and Hispanic or Latino (25 | 1.4%).
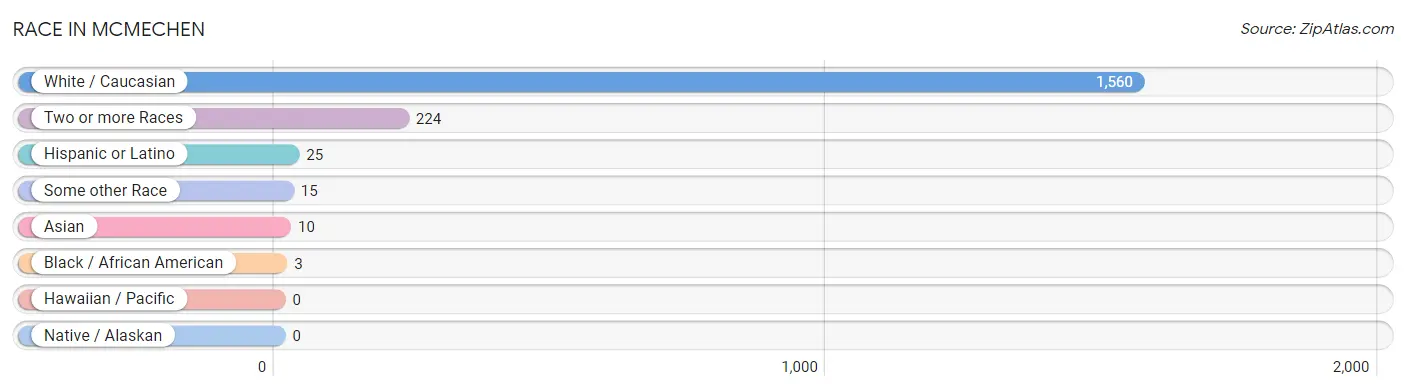
| Race | # Population | % Population |
| Asian | 10 | 0.5% |
| Black / African American | 3 | 0.2% |
| Hawaiian / Pacific | 0 | 0.0% |
| Hispanic or Latino | 25 | 1.4% |
| Native / Alaskan | 0 | 0.0% |
| White / Caucasian | 1,560 | 86.1% |
| Two or more Races | 224 | 12.4% |
| Some other Race | 15 | 0.8% |
| Total | 1,812 | 100.0% |
Ancestry in Mcmechen
The most populous ancestries reported in Mcmechen are German (445 | 24.6%), Irish (328 | 18.1%), English (309 | 17.1%), Italian (183 | 10.1%), and Scottish (137 | 7.6%), together accounting for 77.4% of all Mcmechen residents.
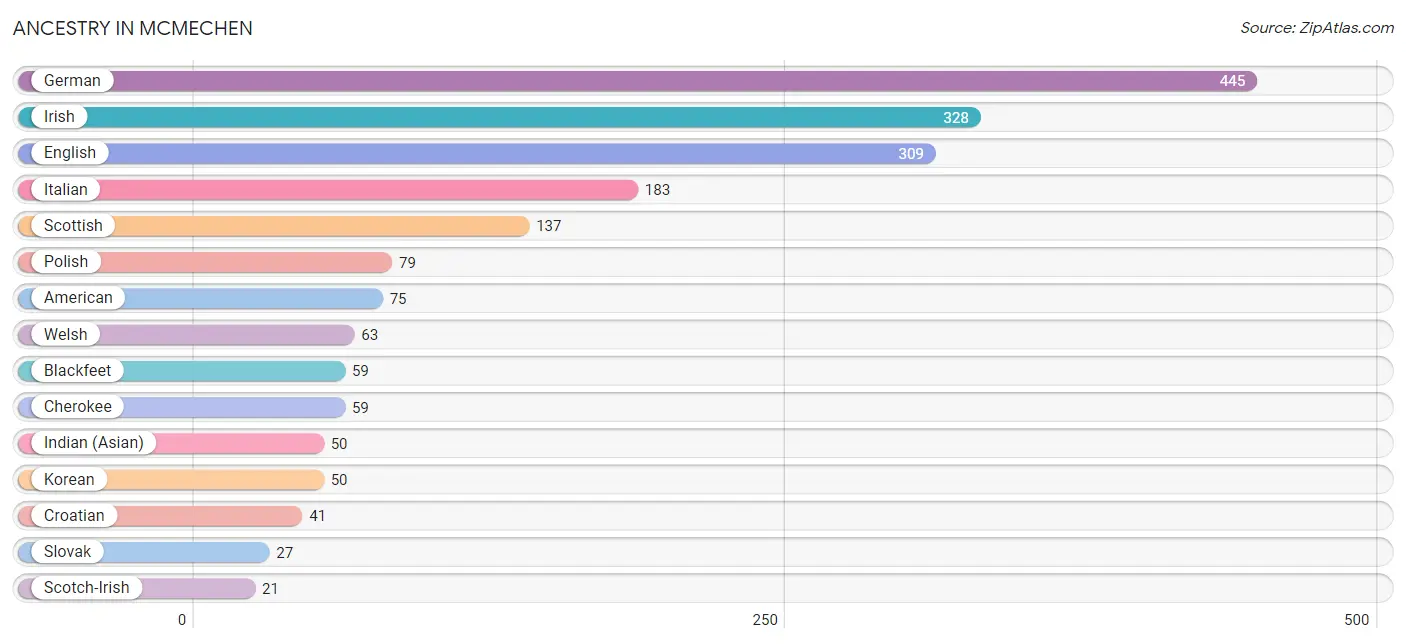
| Ancestry | # Population | % Population |
| American | 75 | 4.1% |
| Arab | 12 | 0.7% |
| Austrian | 3 | 0.2% |
| Blackfeet | 59 | 3.3% |
| British | 14 | 0.8% |
| Cherokee | 59 | 3.3% |
| Croatian | 41 | 2.3% |
| Dutch | 8 | 0.4% |
| English | 309 | 17.1% |
| European | 4 | 0.2% |
| German | 445 | 24.6% |
| Greek | 6 | 0.3% |
| Indian (Asian) | 50 | 2.8% |
| Irish | 328 | 18.1% |
| Italian | 183 | 10.1% |
| Korean | 50 | 2.8% |
| Lebanese | 12 | 0.7% |
| Mexican | 1 | 0.1% |
| Peruvian | 4 | 0.2% |
| Polish | 79 | 4.4% |
| Russian | 14 | 0.8% |
| Scotch-Irish | 21 | 1.2% |
| Scottish | 137 | 7.6% |
| Slavic | 1 | 0.1% |
| Slovak | 27 | 1.5% |
| South American | 4 | 0.2% |
| Spanish | 20 | 1.1% |
| Thai | 2 | 0.1% |
| Welsh | 63 | 3.5% | View All 29 Rows |
Immigrants in Mcmechen
The most numerous immigrant groups reported in Mcmechen came from Europe (17 | 0.9%), Southern Europe (14 | 0.8%), Spain (14 | 0.8%), Latin America (4 | 0.2%), and Peru (4 | 0.2%), together accounting for 2.9% of all Mcmechen residents.
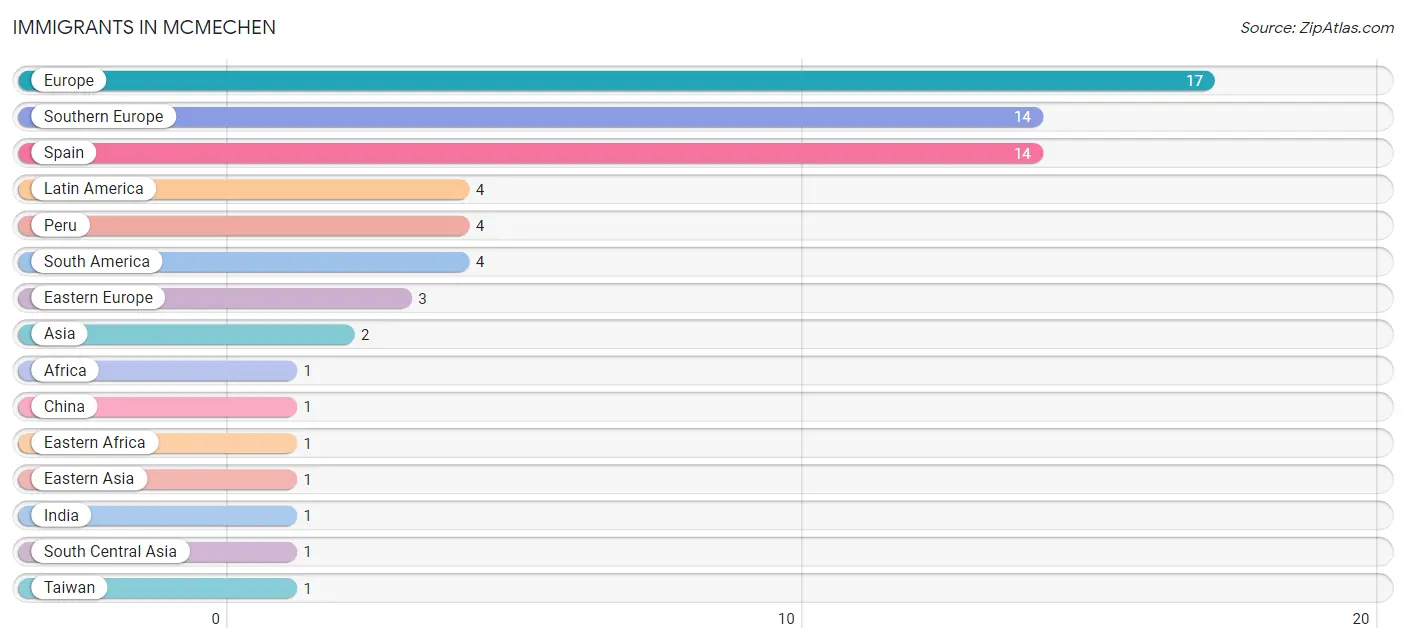
| Immigration Origin | # Population | % Population |
| Africa | 1 | 0.1% |
| Asia | 2 | 0.1% |
| China | 1 | 0.1% |
| Eastern Africa | 1 | 0.1% |
| Eastern Asia | 1 | 0.1% |
| Eastern Europe | 3 | 0.2% |
| Europe | 17 | 0.9% |
| India | 1 | 0.1% |
| Latin America | 4 | 0.2% |
| Peru | 4 | 0.2% |
| South America | 4 | 0.2% |
| South Central Asia | 1 | 0.1% |
| Southern Europe | 14 | 0.8% |
| Spain | 14 | 0.8% |
| Taiwan | 1 | 0.1% | View All 15 Rows |
Sex and Age in Mcmechen
Sex and Age in Mcmechen
The most populous age groups in Mcmechen are 30 to 34 Years (137 | 12.6%) for men and 25 to 29 Years (116 | 16.0%) for women.
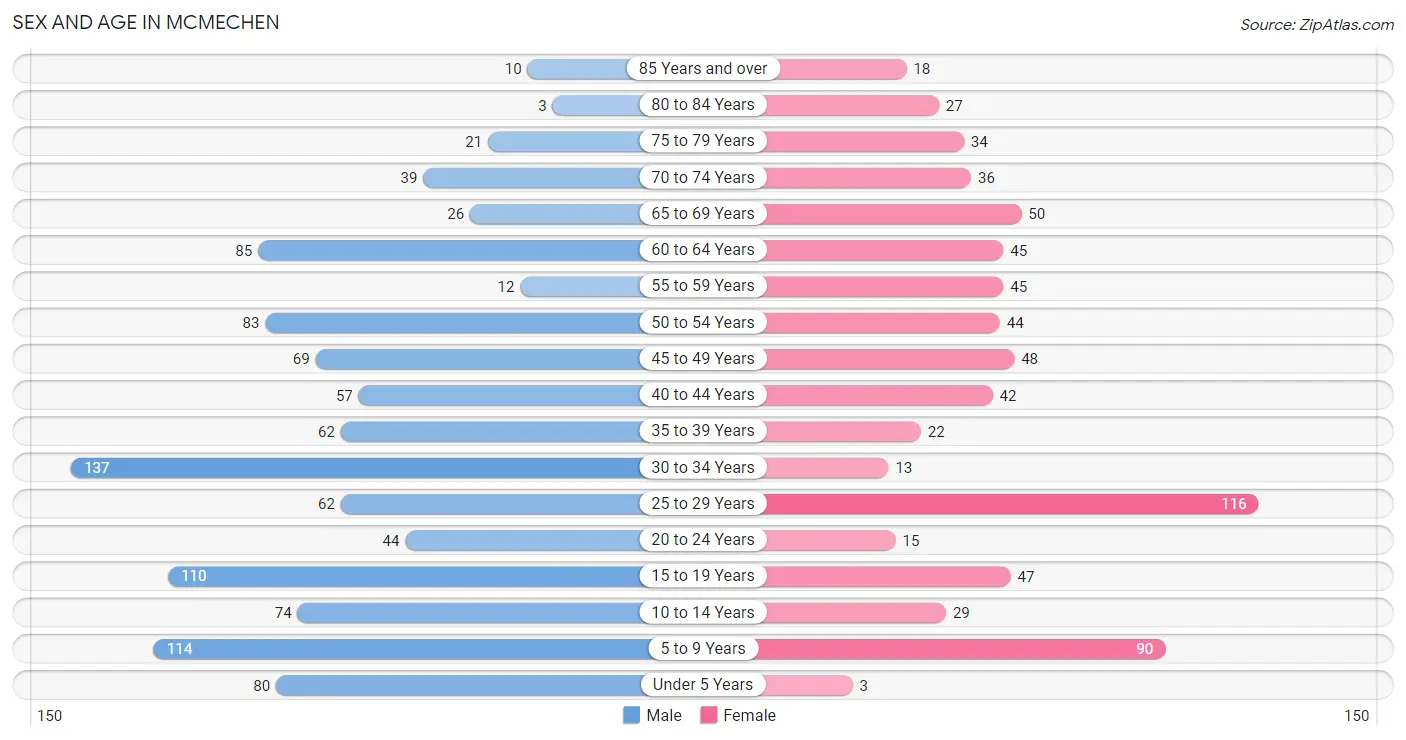
| Age Bracket | Male | Female |
| Under 5 Years | 80 (7.3%) | 3 (0.4%) |
| 5 to 9 Years | 114 (10.5%) | 90 (12.4%) |
| 10 to 14 Years | 74 (6.8%) | 29 (4.0%) |
| 15 to 19 Years | 110 (10.1%) | 47 (6.5%) |
| 20 to 24 Years | 44 (4.0%) | 15 (2.1%) |
| 25 to 29 Years | 62 (5.7%) | 116 (16.0%) |
| 30 to 34 Years | 137 (12.6%) | 13 (1.8%) |
| 35 to 39 Years | 62 (5.7%) | 22 (3.0%) |
| 40 to 44 Years | 57 (5.2%) | 42 (5.8%) |
| 45 to 49 Years | 69 (6.3%) | 48 (6.6%) |
| 50 to 54 Years | 83 (7.6%) | 44 (6.1%) |
| 55 to 59 Years | 12 (1.1%) | 45 (6.2%) |
| 60 to 64 Years | 85 (7.8%) | 45 (6.2%) |
| 65 to 69 Years | 26 (2.4%) | 50 (6.9%) |
| 70 to 74 Years | 39 (3.6%) | 36 (5.0%) |
| 75 to 79 Years | 21 (1.9%) | 34 (4.7%) |
| 80 to 84 Years | 3 (0.3%) | 27 (3.7%) |
| 85 Years and over | 10 (0.9%) | 18 (2.5%) |
| Total | 1,088 (100.0%) | 724 (100.0%) |
Families and Households in Mcmechen
Median Family Size in Mcmechen
The median family size in Mcmechen is 3.43 persons per family, with single female/mother families (94 | 24.7%) accounting for the largest median family size of 4.26 persons per family. On the other hand, single male/father families (65 | 17.1%) represent the smallest median family size with 2.31 persons per family.
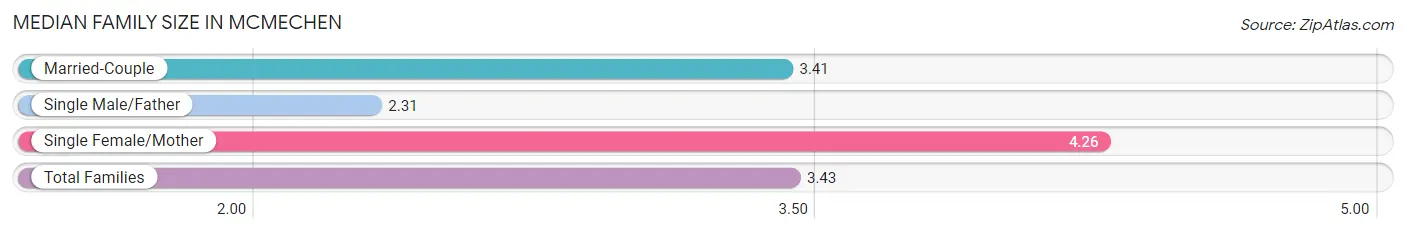
| Family Type | # Families | Family Size |
| Married-Couple | 221 (58.2%) | 3.41 |
| Single Male/Father | 65 (17.1%) | 2.31 |
| Single Female/Mother | 94 (24.7%) | 4.26 |
| Total Families | 380 (100.0%) | 3.43 |
Median Household Size in Mcmechen
The median household size in Mcmechen is 2.82 persons per household, with single female/mother households (94 | 14.7%) accounting for the largest median household size of 4.69 persons per household. non-family households (260 | 40.6%) represent the smallest median household size with 1.56 persons per household.
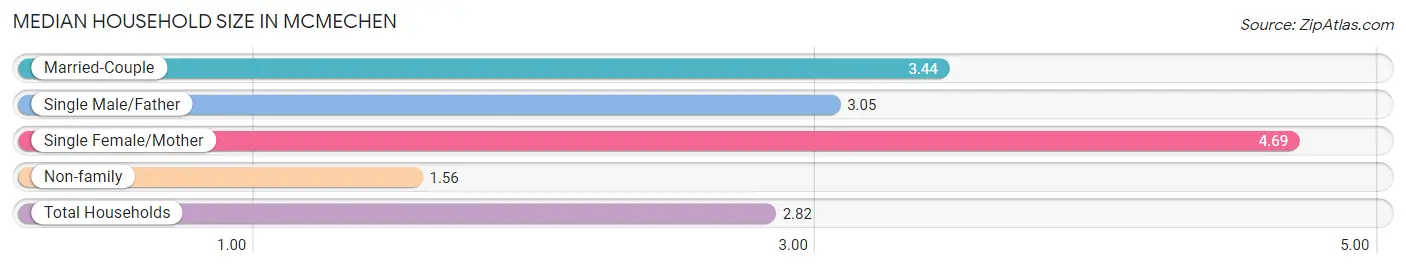
| Household Type | # Households | Household Size |
| Married-Couple | 221 (34.5%) | 3.44 |
| Single Male/Father | 65 (10.2%) | 3.05 |
| Single Female/Mother | 94 (14.7%) | 4.69 |
| Non-family | 260 (40.6%) | 1.56 |
| Total Households | 640 (100.0%) | 2.82 |
Household Size by Marriage Status in Mcmechen
Out of a total of 640 households in Mcmechen, 380 (59.4%) are family households, while 260 (40.6%) are nonfamily households. The most numerous type of family households are 2-person households, comprising 179, and the most common type of nonfamily households are 1-person households, comprising 181.
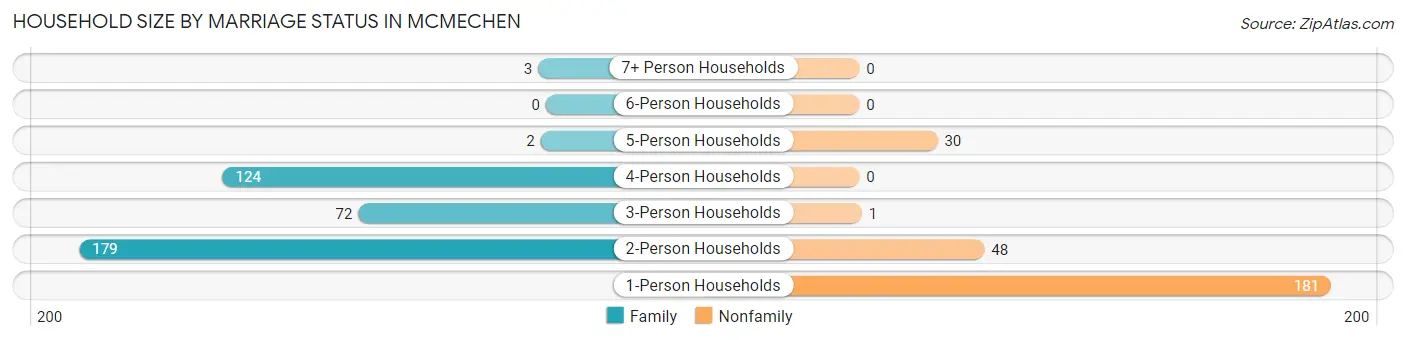
| Household Size | Family Households | Nonfamily Households |
| 1-Person Households | - | 181 (28.3%) |
| 2-Person Households | 179 (28.0%) | 48 (7.5%) |
| 3-Person Households | 72 (11.3%) | 1 (0.2%) |
| 4-Person Households | 124 (19.4%) | 0 (0.0%) |
| 5-Person Households | 2 (0.3%) | 30 (4.7%) |
| 6-Person Households | 0 (0.0%) | 0 (0.0%) |
| 7+ Person Households | 3 (0.5%) | 0 (0.0%) |
| Total | 380 (59.4%) | 260 (40.6%) |
Female Fertility in Mcmechen
Fertility by Age in Mcmechen
Average fertility rate in Mcmechen is 44.0 births per 1,000 women. Women in the age bracket of 20 to 34 years have the highest fertility rate with 69.0 births per 1,000 women. Women in the age bracket of 20 to 34 years acount for 71.4% of all women with births.
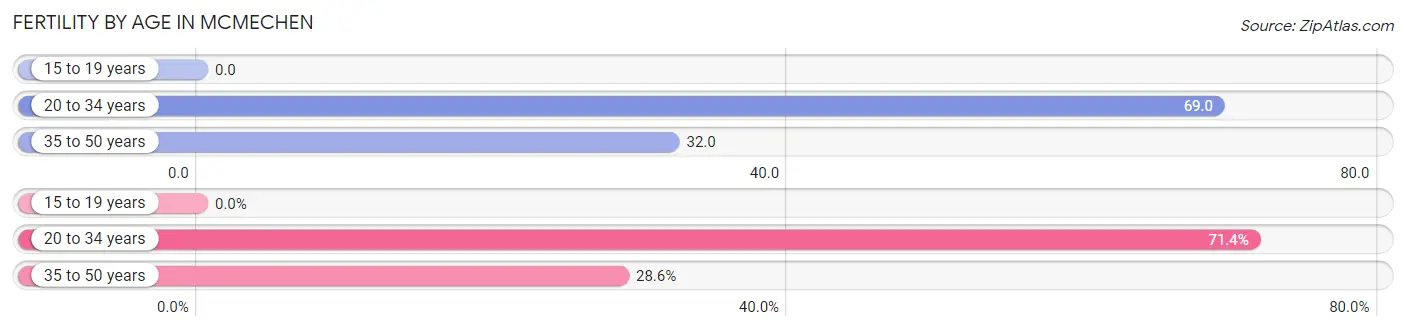
| Age Bracket | Women with Births | Births / 1,000 Women |
| 15 to 19 years | 0 (0.0%) | 0.0 |
| 20 to 34 years | 10 (71.4%) | 69.0 |
| 35 to 50 years | 4 (28.6%) | 32.0 |
| Total | 14 (100.0%) | 44.0 |
Fertility by Age by Marriage Status in Mcmechen
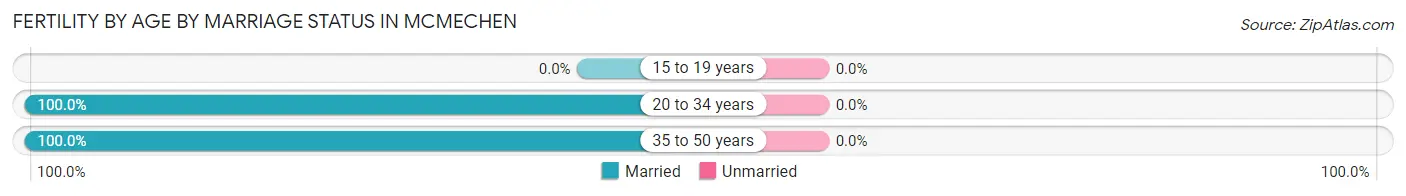
| Age Bracket | Married | Unmarried |
| 15 to 19 years | 0 (0.0%) | 0 (0.0%) |
| 20 to 34 years | 10 (100.0%) | 0 (0.0%) |
| 35 to 50 years | 4 (100.0%) | 0 (0.0%) |
| Total | 14 (100.0%) | 0 (0.0%) |
Fertility by Education in Mcmechen
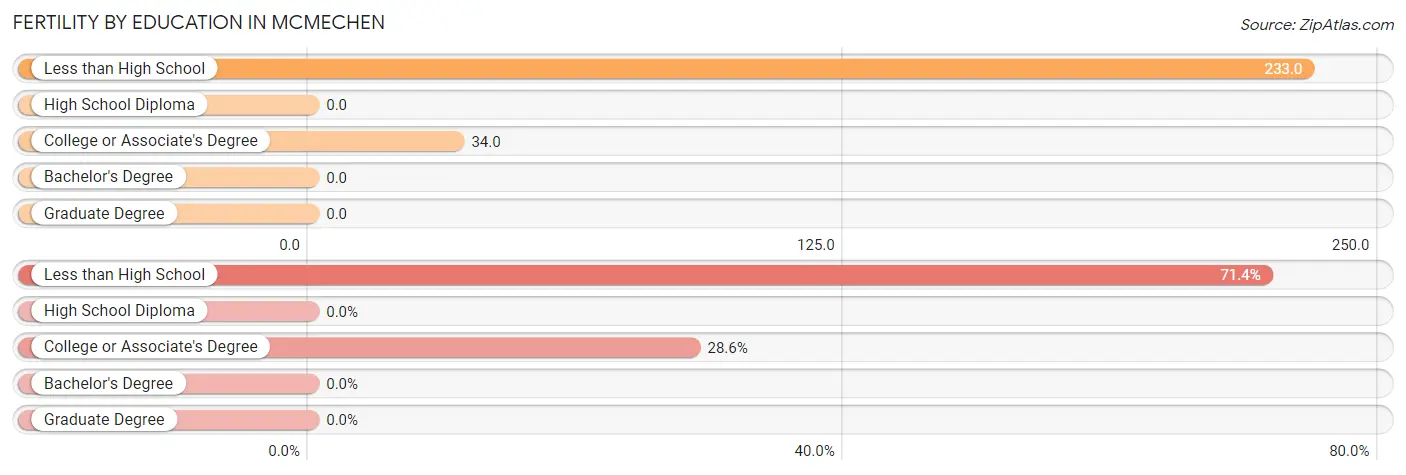
| Educational Attainment | Women with Births | Births / 1,000 Women |
| Less than High School | 10 (71.4%) | 233.0 |
| High School Diploma | 0 (0.0%) | 0.0 |
| College or Associate's Degree | 4 (28.6%) | 34.0 |
| Bachelor's Degree | 0 (0.0%) | 0.0 |
| Graduate Degree | 0 (0.0%) | 0.0 |
| Total | 14 (100.0%) | 44.0 |
Fertility by Education by Marriage Status in Mcmechen
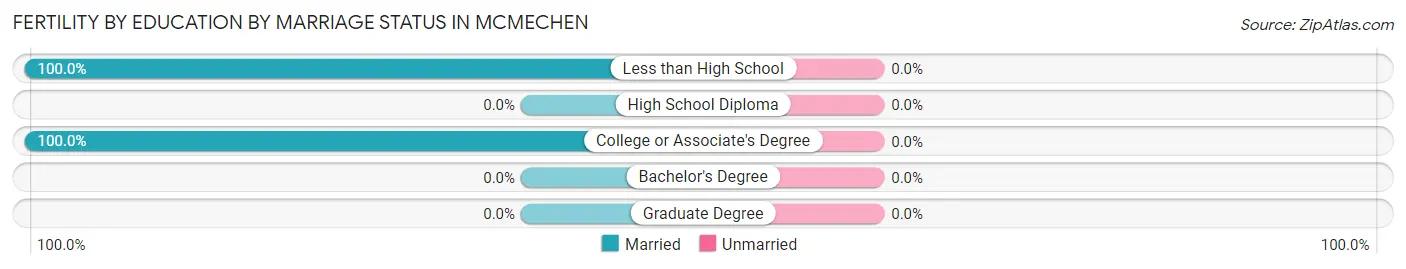
| Educational Attainment | Married | Unmarried |
| Less than High School | 10 (100.0%) | 0 (0.0%) |
| High School Diploma | 0 (0.0%) | 0 (0.0%) |
| College or Associate's Degree | 4 (100.0%) | 0 (0.0%) |
| Bachelor's Degree | 0 (0.0%) | 0 (0.0%) |
| Graduate Degree | 0 (0.0%) | 0 (0.0%) |
| Total | 14 (100.0%) | 0 (0.0%) |
Employment Characteristics in Mcmechen
Employment by Class of Employer in Mcmechen
Among the 798 employed individuals in Mcmechen, private company employees (574 | 71.9%), not-for-profit organizations (127 | 15.9%), and state government employees (56 | 7.0%) make up the most common classes of employment.
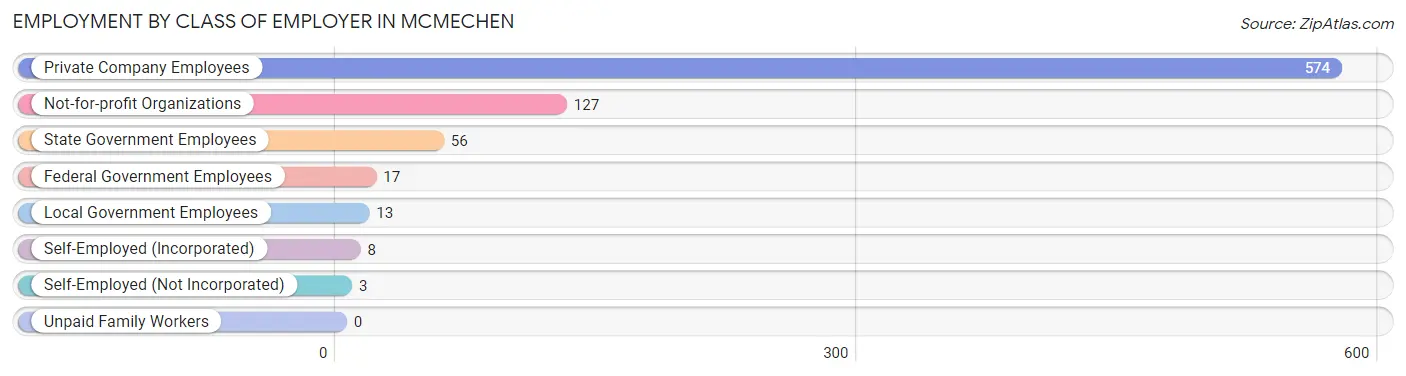
| Employer Class | # Employees | % Employees |
| Private Company Employees | 574 | 71.9% |
| Self-Employed (Incorporated) | 8 | 1.0% |
| Self-Employed (Not Incorporated) | 3 | 0.4% |
| Not-for-profit Organizations | 127 | 15.9% |
| Local Government Employees | 13 | 1.6% |
| State Government Employees | 56 | 7.0% |
| Federal Government Employees | 17 | 2.1% |
| Unpaid Family Workers | 0 | 0.0% |
| Total | 798 | 100.0% |
Employment Status by Age in Mcmechen
According to the labor force statistics for Mcmechen, out of the total population over 16 years of age (1,397), 61.3% or 856 individuals are in the labor force, with 5.3% or 45 of them unemployed. The age group with the highest labor force participation rate is 35 to 44 years, with 93.4% or 171 individuals in the labor force. Within the labor force, the 25 to 29 years age range has the highest percentage of unemployed individuals, with 22.9% or 33 of them being unemployed.
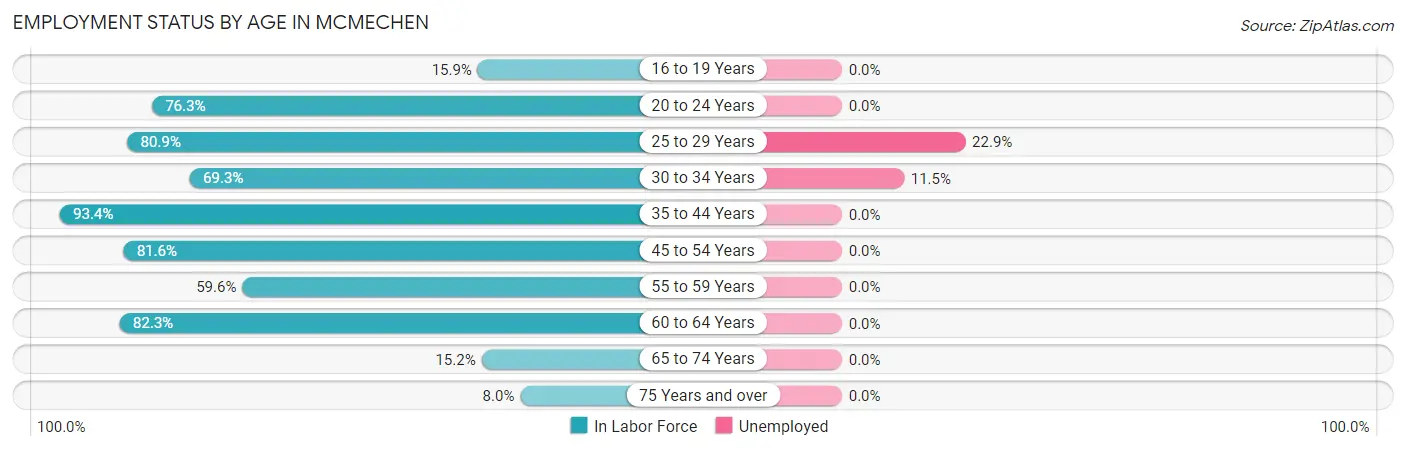
| Age Bracket | In Labor Force | Unemployed |
| 16 to 19 Years | 21 (15.9%) | 0 (0.0%) |
| 20 to 24 Years | 45 (76.3%) | 0 (0.0%) |
| 25 to 29 Years | 144 (80.9%) | 33 (22.9%) |
| 30 to 34 Years | 104 (69.3%) | 12 (11.5%) |
| 35 to 44 Years | 171 (93.4%) | 0 (0.0%) |
| 45 to 54 Years | 199 (81.6%) | 0 (0.0%) |
| 55 to 59 Years | 34 (59.6%) | 0 (0.0%) |
| 60 to 64 Years | 107 (82.3%) | 0 (0.0%) |
| 65 to 74 Years | 23 (15.2%) | 0 (0.0%) |
| 75 Years and over | 9 (8.0%) | 0 (0.0%) |
| Total | 856 (61.3%) | 45 (5.3%) |
Employment Status by Educational Attainment in Mcmechen
According to labor force statistics for Mcmechen, 80.6% of individuals (759) out of the total population between 25 and 64 years of age (942) are in the labor force, with 5.9% or 45 of them being unemployed. The group with the highest labor force participation rate are those with the educational attainment of bachelor's degree or higher, with 96.4% or 188 individuals in the labor force. Within the labor force, individuals with bachelor's degree or higher education have the highest percentage of unemployment, with 16.5% or 31 of them being unemployed.
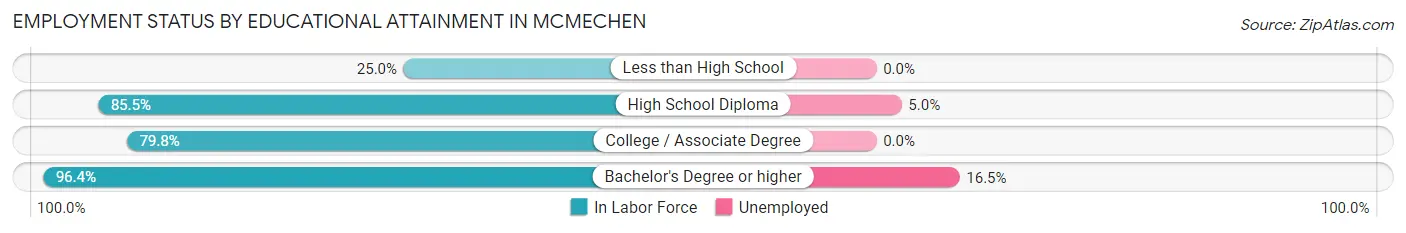
| Educational Attainment | In Labor Force | Unemployed |
| Less than High School | 20 (25.0%) | 0 (0.0%) |
| High School Diploma | 278 (85.5%) | 16 (5.0%) |
| College / Associate Degree | 273 (79.8%) | 0 (0.0%) |
| Bachelor's Degree or higher | 188 (96.4%) | 32 (16.5%) |
| Total | 759 (80.6%) | 56 (5.9%) |
Employment Occupations by Sex in Mcmechen
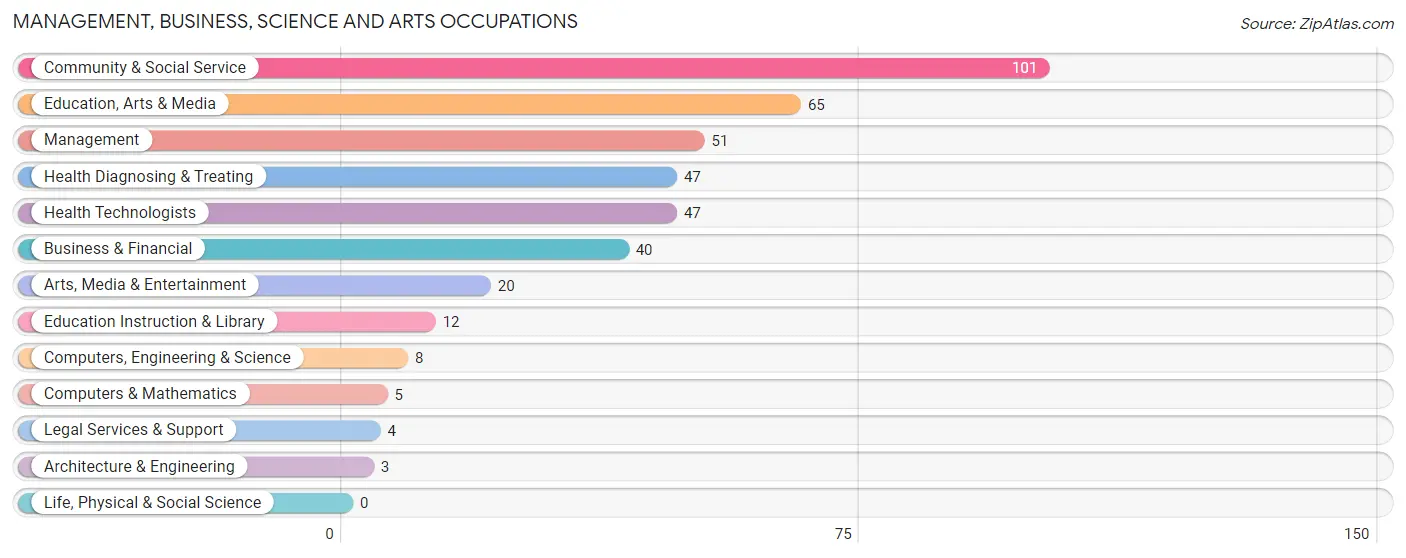
Management, Business, Science and Arts Occupations
The most common Management, Business, Science and Arts occupations in Mcmechen are Community & Social Service (101 | 12.4%), Education, Arts & Media (65 | 8.0%), Management (51 | 6.3%), Health Diagnosing & Treating (47 | 5.8%), and Health Technologists (47 | 5.8%).
Management, Business, Science and Arts Occupations by Sex
Within the Management, Business, Science and Arts occupations in Mcmechen, the most male-oriented occupations are Architecture & Engineering (100.0%), Legal Services & Support (100.0%), and Business & Financial (97.5%), while the most female-oriented occupations are Computers & Mathematics (100.0%), Arts, Media & Entertainment (85.0%), and Management (82.4%).
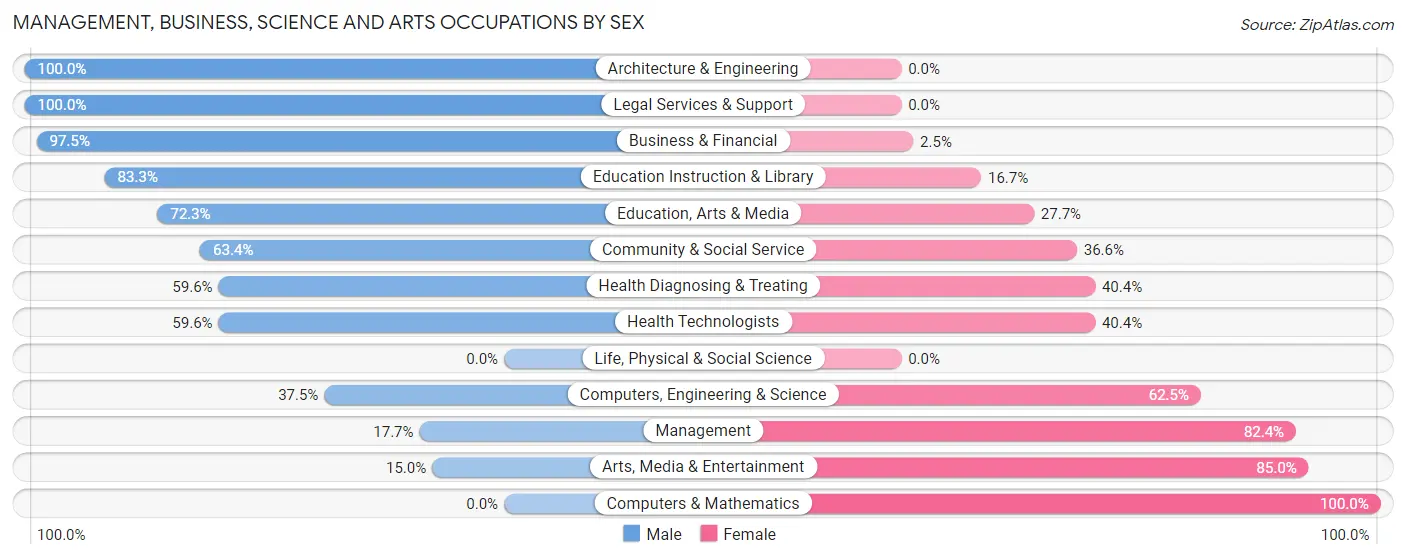
| Occupation | Male | Female |
| Management | 9 (17.6%) | 42 (82.4%) |
| Business & Financial | 39 (97.5%) | 1 (2.5%) |
| Computers, Engineering & Science | 3 (37.5%) | 5 (62.5%) |
| Computers & Mathematics | 0 (0.0%) | 5 (100.0%) |
| Architecture & Engineering | 3 (100.0%) | 0 (0.0%) |
| Life, Physical & Social Science | 0 (0.0%) | 0 (0.0%) |
| Community & Social Service | 64 (63.4%) | 37 (36.6%) |
| Education, Arts & Media | 47 (72.3%) | 18 (27.7%) |
| Legal Services & Support | 4 (100.0%) | 0 (0.0%) |
| Education Instruction & Library | 10 (83.3%) | 2 (16.7%) |
| Arts, Media & Entertainment | 3 (15.0%) | 17 (85.0%) |
| Health Diagnosing & Treating | 28 (59.6%) | 19 (40.4%) |
| Health Technologists | 28 (59.6%) | 19 (40.4%) |
| Total (Category) | 143 (57.9%) | 104 (42.1%) |
| Total (Overall) | 508 (62.6%) | 304 (37.4%) |
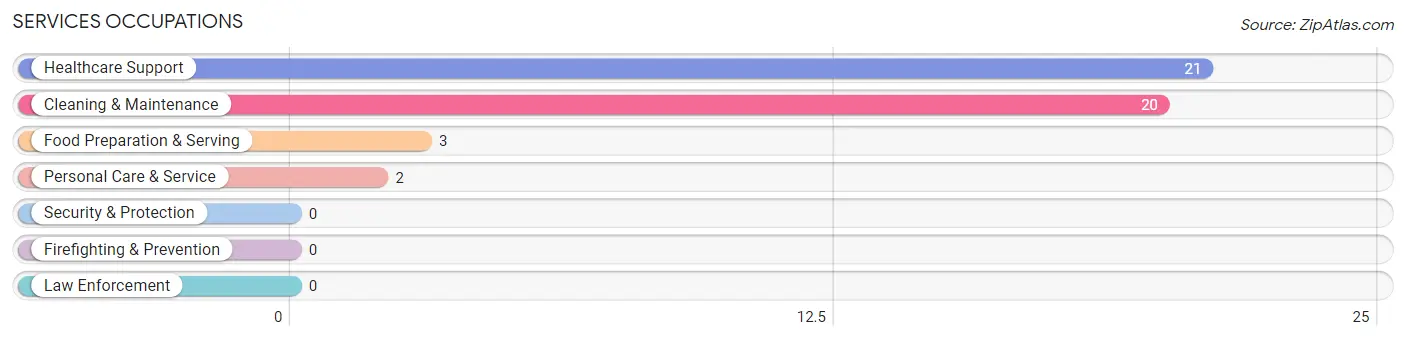
Services Occupations
The most common Services occupations in Mcmechen are Healthcare Support (21 | 2.6%), Cleaning & Maintenance (20 | 2.5%), Food Preparation & Serving (3 | 0.4%), and Personal Care & Service (2 | 0.3%).
Services Occupations by Sex
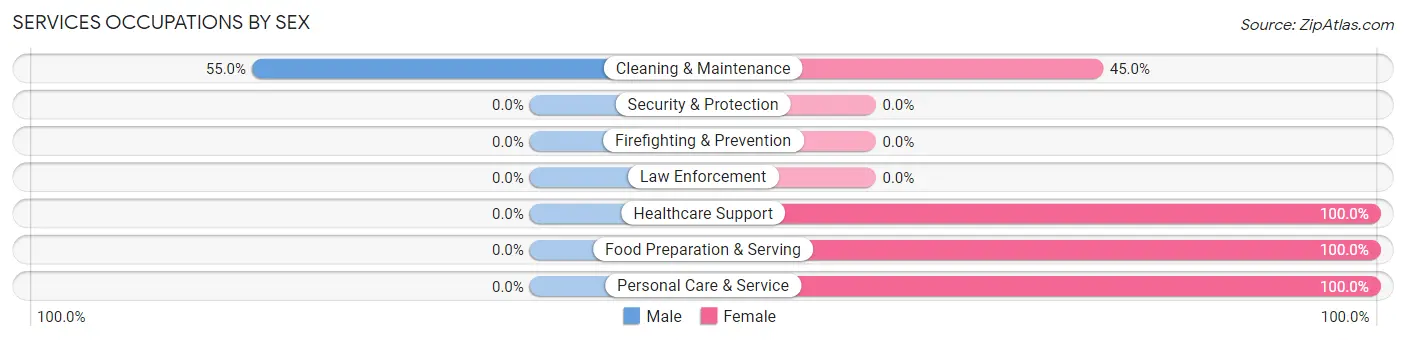
| Occupation | Male | Female |
| Healthcare Support | 0 (0.0%) | 21 (100.0%) |
| Security & Protection | 0 (0.0%) | 0 (0.0%) |
| Firefighting & Prevention | 0 (0.0%) | 0 (0.0%) |
| Law Enforcement | 0 (0.0%) | 0 (0.0%) |
| Food Preparation & Serving | 0 (0.0%) | 3 (100.0%) |
| Cleaning & Maintenance | 11 (55.0%) | 9 (45.0%) |
| Personal Care & Service | 0 (0.0%) | 2 (100.0%) |
| Total (Category) | 11 (23.9%) | 35 (76.1%) |
| Total (Overall) | 508 (62.6%) | 304 (37.4%) |
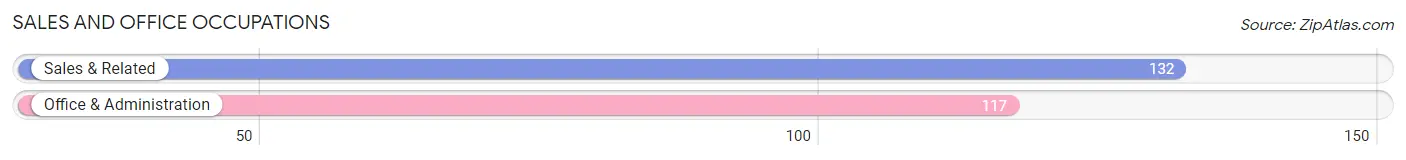
Sales and Office Occupations
The most common Sales and Office occupations in Mcmechen are Sales & Related (132 | 16.3%), and Office & Administration (117 | 14.4%).
Sales and Office Occupations by Sex
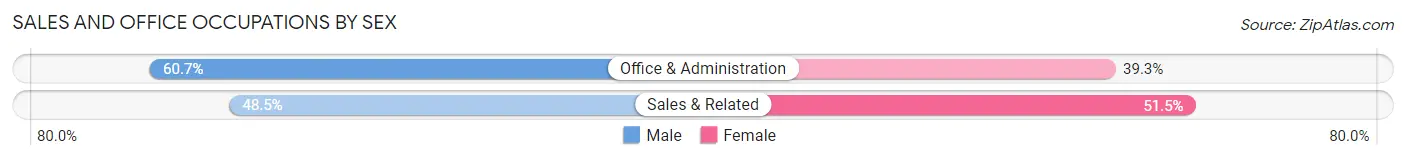
| Occupation | Male | Female |
| Sales & Related | 64 (48.5%) | 68 (51.5%) |
| Office & Administration | 71 (60.7%) | 46 (39.3%) |
| Total (Category) | 135 (54.2%) | 114 (45.8%) |
| Total (Overall) | 508 (62.6%) | 304 (37.4%) |
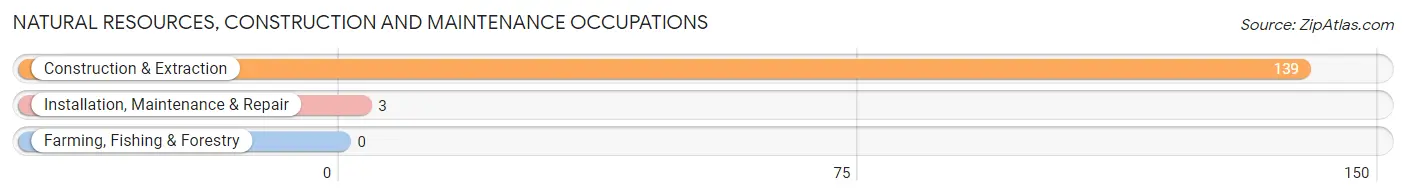
Natural Resources, Construction and Maintenance Occupations
The most common Natural Resources, Construction and Maintenance occupations in Mcmechen are Construction & Extraction (139 | 17.1%), and Installation, Maintenance & Repair (3 | 0.4%).
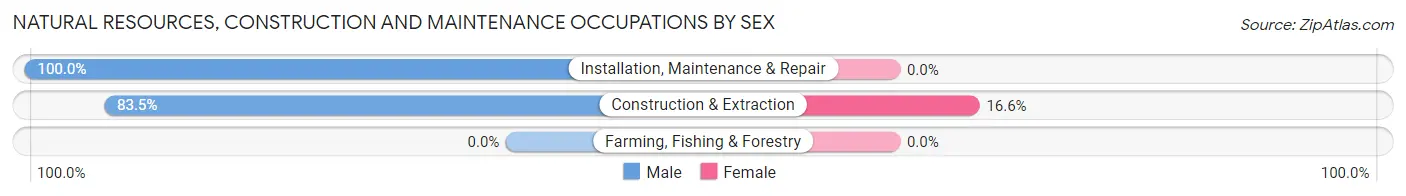
Natural Resources, Construction and Maintenance Occupations by Sex
| Occupation | Male | Female |
| Farming, Fishing & Forestry | 0 (0.0%) | 0 (0.0%) |
| Construction & Extraction | 116 (83.5%) | 23 (16.6%) |
| Installation, Maintenance & Repair | 3 (100.0%) | 0 (0.0%) |
| Total (Category) | 119 (83.8%) | 23 (16.2%) |
| Total (Overall) | 508 (62.6%) | 304 (37.4%) |
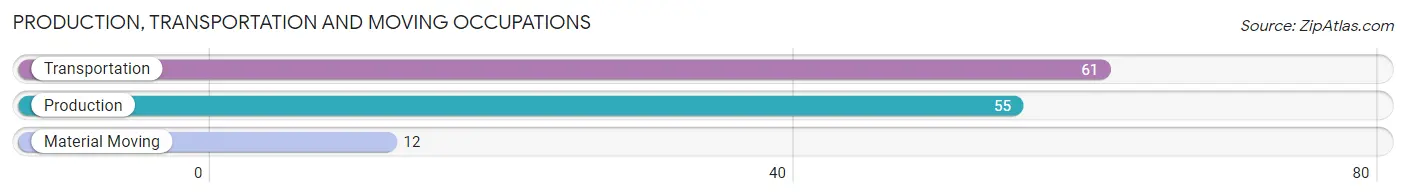
Production, Transportation and Moving Occupations
The most common Production, Transportation and Moving occupations in Mcmechen are Transportation (61 | 7.5%), Production (55 | 6.8%), and Material Moving (12 | 1.5%).
Production, Transportation and Moving Occupations by Sex
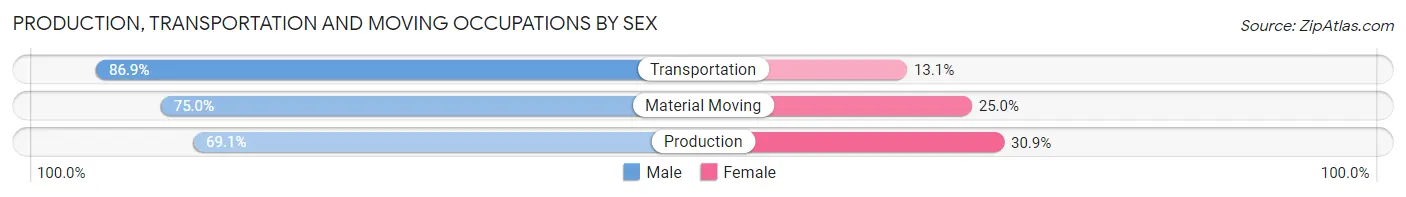
| Occupation | Male | Female |
| Production | 38 (69.1%) | 17 (30.9%) |
| Transportation | 53 (86.9%) | 8 (13.1%) |
| Material Moving | 9 (75.0%) | 3 (25.0%) |
| Total (Category) | 100 (78.1%) | 28 (21.9%) |
| Total (Overall) | 508 (62.6%) | 304 (37.4%) |
Employment Industries by Sex in Mcmechen
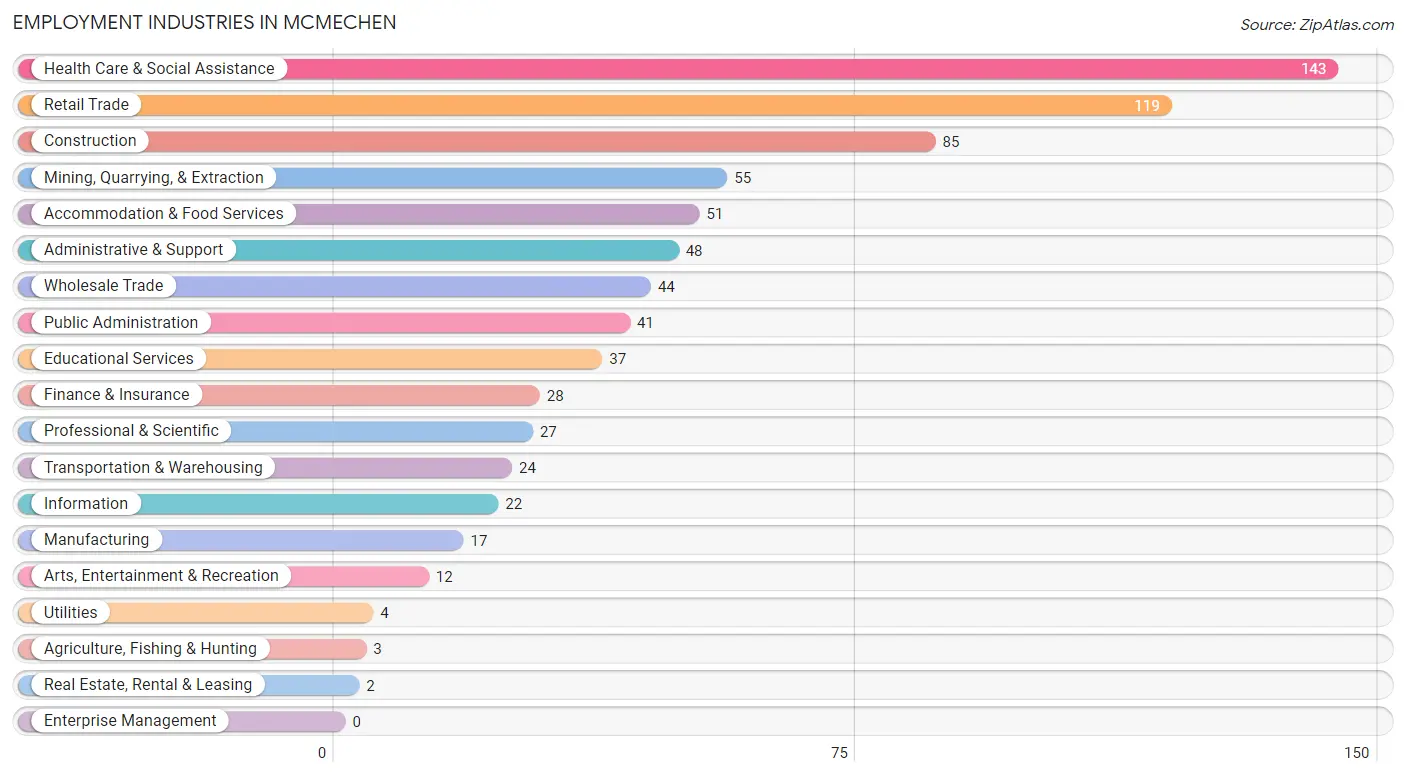
Employment Industries in Mcmechen
The major employment industries in Mcmechen include Health Care & Social Assistance (143 | 17.6%), Retail Trade (119 | 14.7%), Construction (85 | 10.5%), Mining, Quarrying, & Extraction (55 | 6.8%), and Accommodation & Food Services (51 | 6.3%).
Employment Industries by Sex in Mcmechen
The Mcmechen industries that see more men than women are Agriculture, Fishing & Hunting (100.0%), Mining, Quarrying, & Extraction (100.0%), and Utilities (100.0%), whereas the industries that tend to have a higher number of women are Real Estate, Rental & Leasing (100.0%), Arts, Entertainment & Recreation (100.0%), and Health Care & Social Assistance (72.0%).
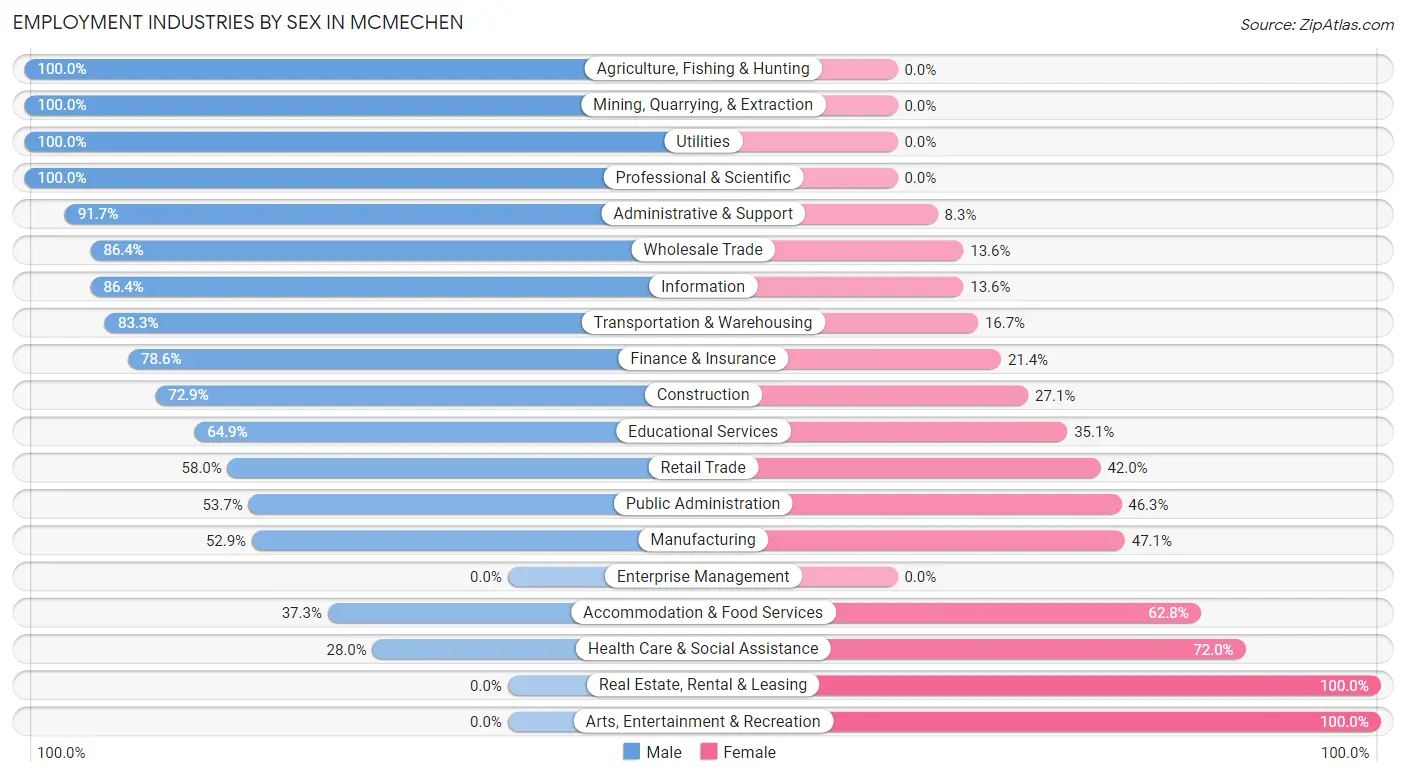
| Industry | Male | Female |
| Agriculture, Fishing & Hunting | 3 (100.0%) | 0 (0.0%) |
| Mining, Quarrying, & Extraction | 55 (100.0%) | 0 (0.0%) |
| Construction | 62 (72.9%) | 23 (27.1%) |
| Manufacturing | 9 (52.9%) | 8 (47.1%) |
| Wholesale Trade | 38 (86.4%) | 6 (13.6%) |
| Retail Trade | 69 (58.0%) | 50 (42.0%) |
| Transportation & Warehousing | 20 (83.3%) | 4 (16.7%) |
| Utilities | 4 (100.0%) | 0 (0.0%) |
| Information | 19 (86.4%) | 3 (13.6%) |
| Finance & Insurance | 22 (78.6%) | 6 (21.4%) |
| Real Estate, Rental & Leasing | 0 (0.0%) | 2 (100.0%) |
| Professional & Scientific | 27 (100.0%) | 0 (0.0%) |
| Enterprise Management | 0 (0.0%) | 0 (0.0%) |
| Administrative & Support | 44 (91.7%) | 4 (8.3%) |
| Educational Services | 24 (64.9%) | 13 (35.1%) |
| Health Care & Social Assistance | 40 (28.0%) | 103 (72.0%) |
| Arts, Entertainment & Recreation | 0 (0.0%) | 12 (100.0%) |
| Accommodation & Food Services | 19 (37.2%) | 32 (62.7%) |
| Public Administration | 22 (53.7%) | 19 (46.3%) |
| Total | 508 (62.6%) | 304 (37.4%) |
Education in Mcmechen
School Enrollment in Mcmechen
The most common levels of schooling among the 513 students in Mcmechen are elementary school (167 | 32.6%), high school (136 | 26.5%), and middle school (64 | 12.5%).
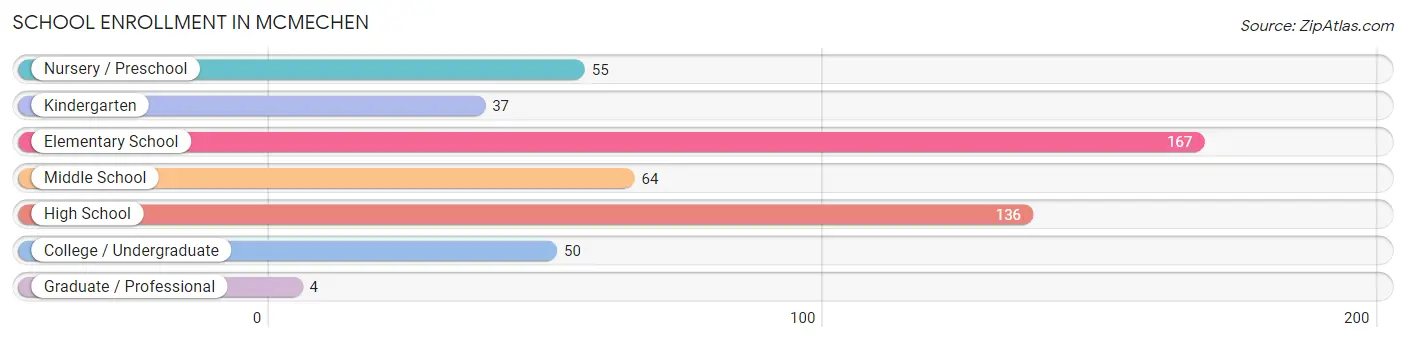
| School Level | # Students | % Students |
| Nursery / Preschool | 55 | 10.7% |
| Kindergarten | 37 | 7.2% |
| Elementary School | 167 | 32.6% |
| Middle School | 64 | 12.5% |
| High School | 136 | 26.5% |
| College / Undergraduate | 50 | 9.8% |
| Graduate / Professional | 4 | 0.8% |
| Total | 513 | 100.0% |
School Enrollment by Age by Funding Source in Mcmechen
Out of a total of 513 students who are enrolled in schools in Mcmechen, 64 (12.5%) attend a private institution, while the remaining 449 (87.5%) are enrolled in public schools. The age group of 20 to 24 year olds has the highest likelihood of being enrolled in private schools, with 21 (100.0% in the age bracket) enrolled. Conversely, the age group of 3 to 4 year olds has the lowest likelihood of being enrolled in a private school, with 16 (100.0% in the age bracket) attending a public institution.
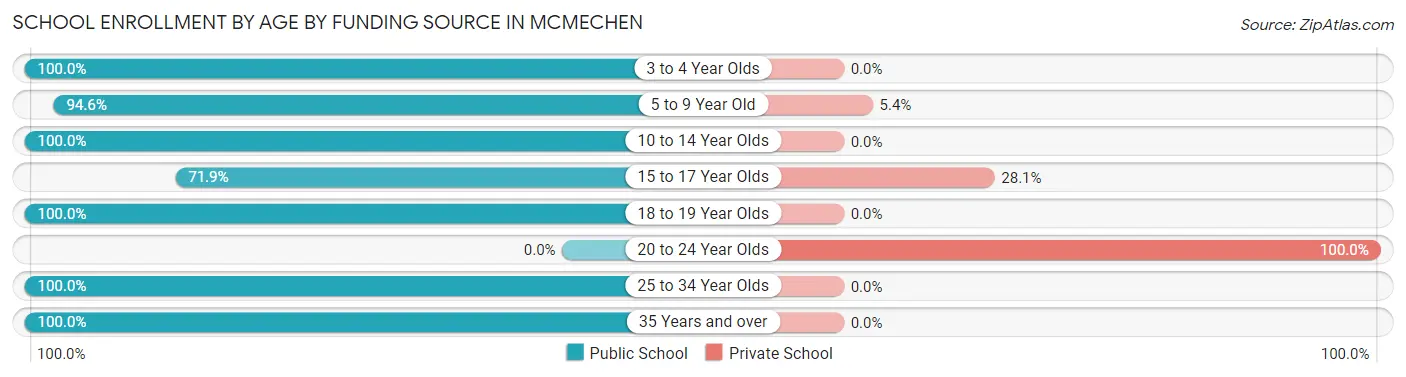
| Age Bracket | Public School | Private School |
| 3 to 4 Year Olds | 16 (100.0%) | 0 (0.0%) |
| 5 to 9 Year Old | 193 (94.6%) | 11 (5.4%) |
| 10 to 14 Year Olds | 103 (100.0%) | 0 (0.0%) |
| 15 to 17 Year Olds | 82 (71.9%) | 32 (28.1%) |
| 18 to 19 Year Olds | 43 (100.0%) | 0 (0.0%) |
| 20 to 24 Year Olds | 0 (0.0%) | 21 (100.0%) |
| 25 to 34 Year Olds | 8 (100.0%) | 0 (0.0%) |
| 35 Years and over | 4 (100.0%) | 0 (0.0%) |
| Total | 449 (87.5%) | 64 (12.5%) |
Educational Attainment by Field of Study in Mcmechen
Science & technology (58 | 25.7%), business (39 | 17.3%), visual & performing arts (31 | 13.7%), bio, nature & agricultural (28 | 12.4%), and education (25 | 11.1%) are the most common fields of study among 226 individuals in Mcmechen who have obtained a bachelor's degree or higher.
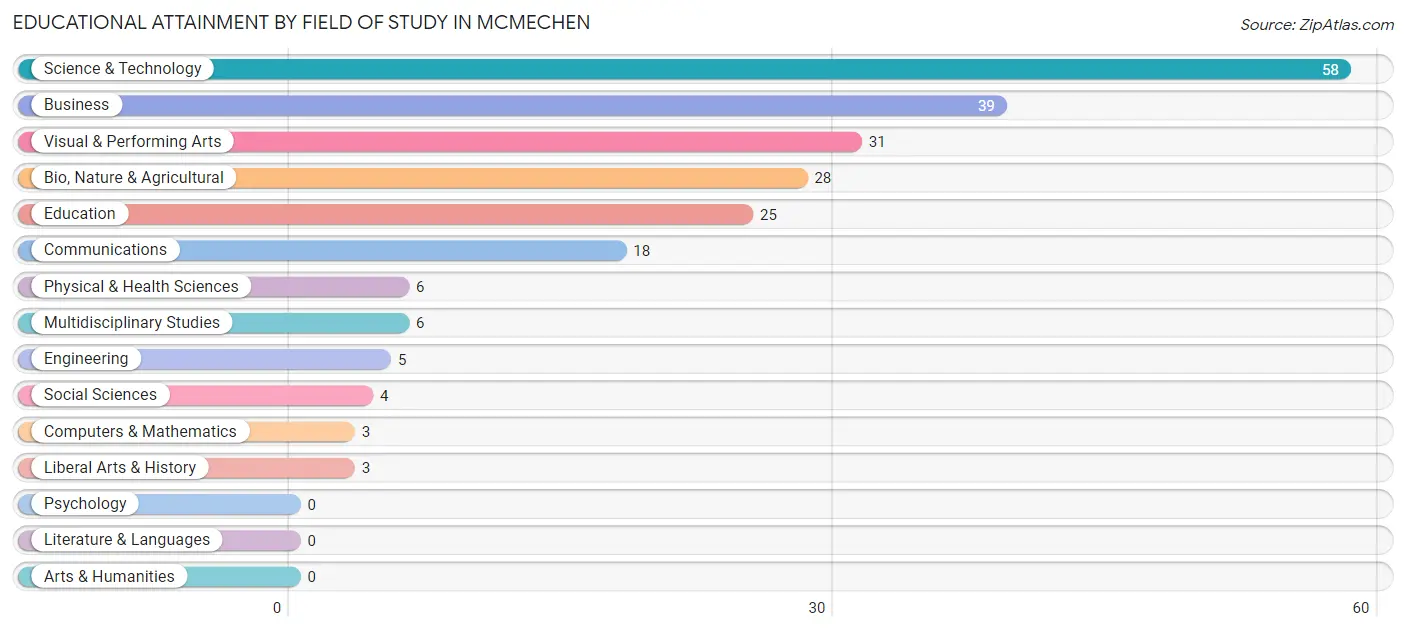
| Field of Study | # Graduates | % Graduates |
| Computers & Mathematics | 3 | 1.3% |
| Bio, Nature & Agricultural | 28 | 12.4% |
| Physical & Health Sciences | 6 | 2.6% |
| Psychology | 0 | 0.0% |
| Social Sciences | 4 | 1.8% |
| Engineering | 5 | 2.2% |
| Multidisciplinary Studies | 6 | 2.6% |
| Science & Technology | 58 | 25.7% |
| Business | 39 | 17.3% |
| Education | 25 | 11.1% |
| Literature & Languages | 0 | 0.0% |
| Liberal Arts & History | 3 | 1.3% |
| Visual & Performing Arts | 31 | 13.7% |
| Communications | 18 | 8.0% |
| Arts & Humanities | 0 | 0.0% |
| Total | 226 | 100.0% |
Transportation & Commute in Mcmechen
Vehicle Availability by Sex in Mcmechen
The most prevalent vehicle ownership categories in Mcmechen are males with 2 vehicles (232, accounting for 45.7%) and females with 2 vehicles (78, making up 80.0%).
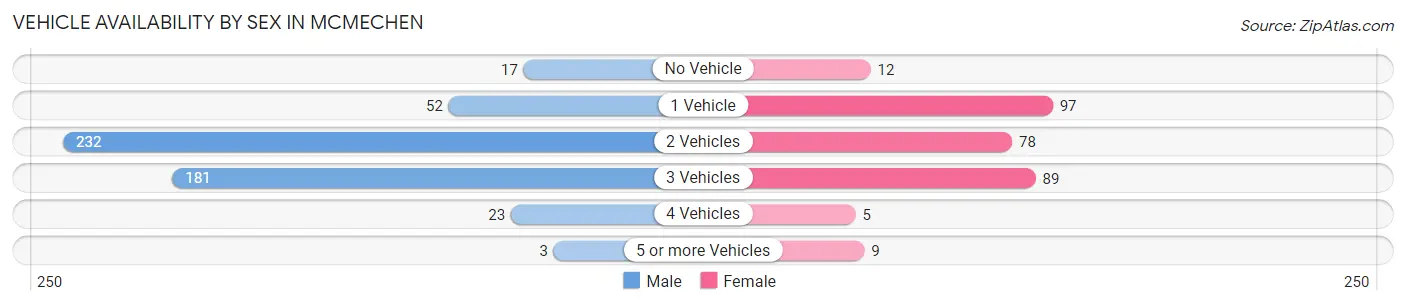
| Vehicles Available | Male | Female |
| No Vehicle | 17 (3.4%) | 12 (4.1%) |
| 1 Vehicle | 52 (10.2%) | 97 (33.5%) |
| 2 Vehicles | 232 (45.7%) | 78 (26.9%) |
| 3 Vehicles | 181 (35.6%) | 89 (30.7%) |
| 4 Vehicles | 23 (4.5%) | 5 (1.7%) |
| 5 or more Vehicles | 3 (0.6%) | 9 (3.1%) |
| Total | 508 (100.0%) | 290 (100.0%) |
Commute Time in Mcmechen
The most frequently occuring commute durations in Mcmechen are 10 to 14 minutes (162 commuters, 20.7%), 15 to 19 minutes (145 commuters, 18.6%), and 20 to 24 minutes (130 commuters, 16.7%).
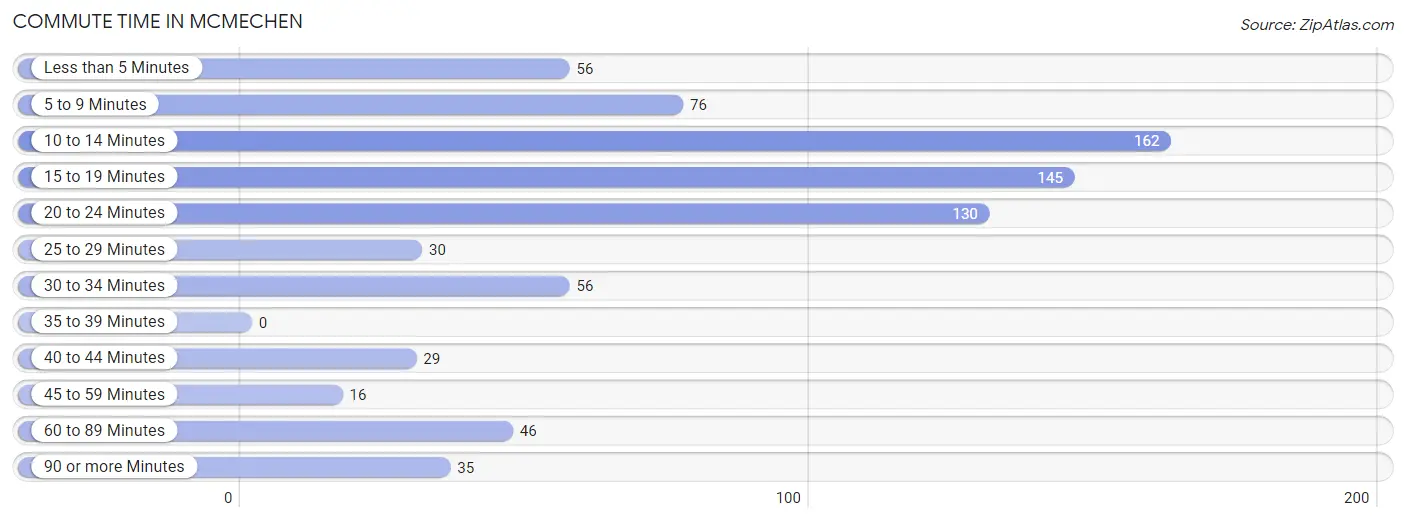
| Commute Time | # Commuters | % Commuters |
| Less than 5 Minutes | 56 | 7.2% |
| 5 to 9 Minutes | 76 | 9.7% |
| 10 to 14 Minutes | 162 | 20.7% |
| 15 to 19 Minutes | 145 | 18.6% |
| 20 to 24 Minutes | 130 | 16.7% |
| 25 to 29 Minutes | 30 | 3.8% |
| 30 to 34 Minutes | 56 | 7.2% |
| 35 to 39 Minutes | 0 | 0.0% |
| 40 to 44 Minutes | 29 | 3.7% |
| 45 to 59 Minutes | 16 | 2.1% |
| 60 to 89 Minutes | 46 | 5.9% |
| 90 or more Minutes | 35 | 4.5% |
Commute Time by Sex in Mcmechen
The most common commute times in Mcmechen are 10 to 14 minutes (139 commuters, 28.1%) for males and 15 to 19 minutes (83 commuters, 28.9%) for females.
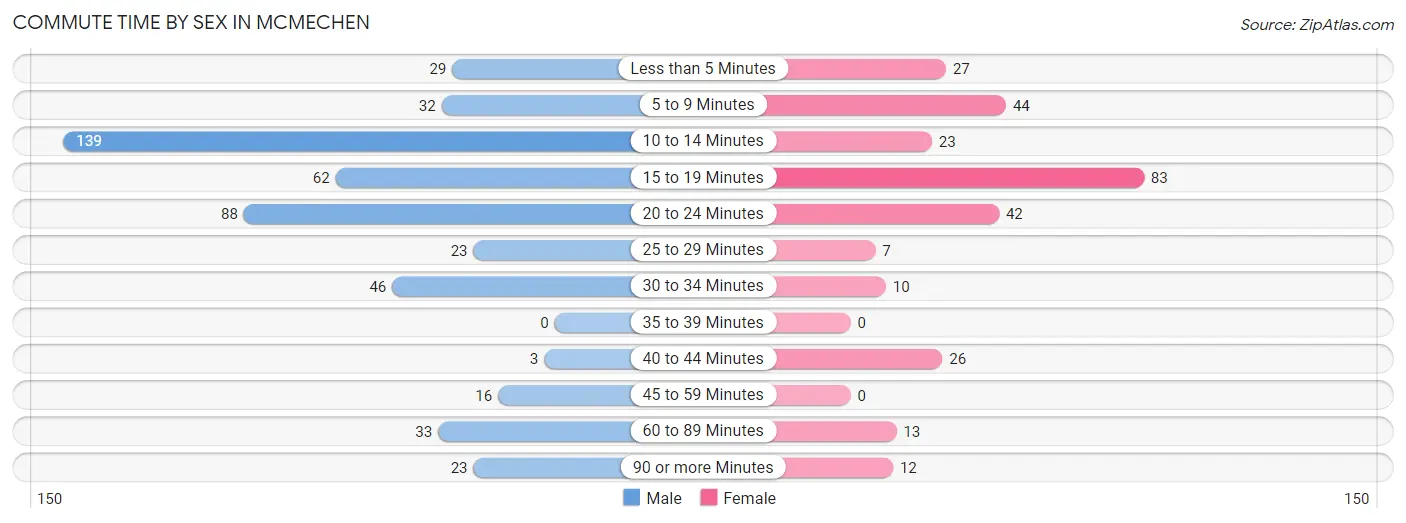
| Commute Time | Male | Female |
| Less than 5 Minutes | 29 (5.9%) | 27 (9.4%) |
| 5 to 9 Minutes | 32 (6.5%) | 44 (15.3%) |
| 10 to 14 Minutes | 139 (28.1%) | 23 (8.0%) |
| 15 to 19 Minutes | 62 (12.6%) | 83 (28.9%) |
| 20 to 24 Minutes | 88 (17.8%) | 42 (14.6%) |
| 25 to 29 Minutes | 23 (4.7%) | 7 (2.4%) |
| 30 to 34 Minutes | 46 (9.3%) | 10 (3.5%) |
| 35 to 39 Minutes | 0 (0.0%) | 0 (0.0%) |
| 40 to 44 Minutes | 3 (0.6%) | 26 (9.1%) |
| 45 to 59 Minutes | 16 (3.2%) | 0 (0.0%) |
| 60 to 89 Minutes | 33 (6.7%) | 13 (4.5%) |
| 90 or more Minutes | 23 (4.7%) | 12 (4.2%) |
Time of Departure to Work by Sex in Mcmechen
The most frequent times of departure to work in Mcmechen are 4:00 PM to 11:59 PM (95, 19.2%) for males and 12:00 PM to 3:59 PM (58, 20.2%) for females.
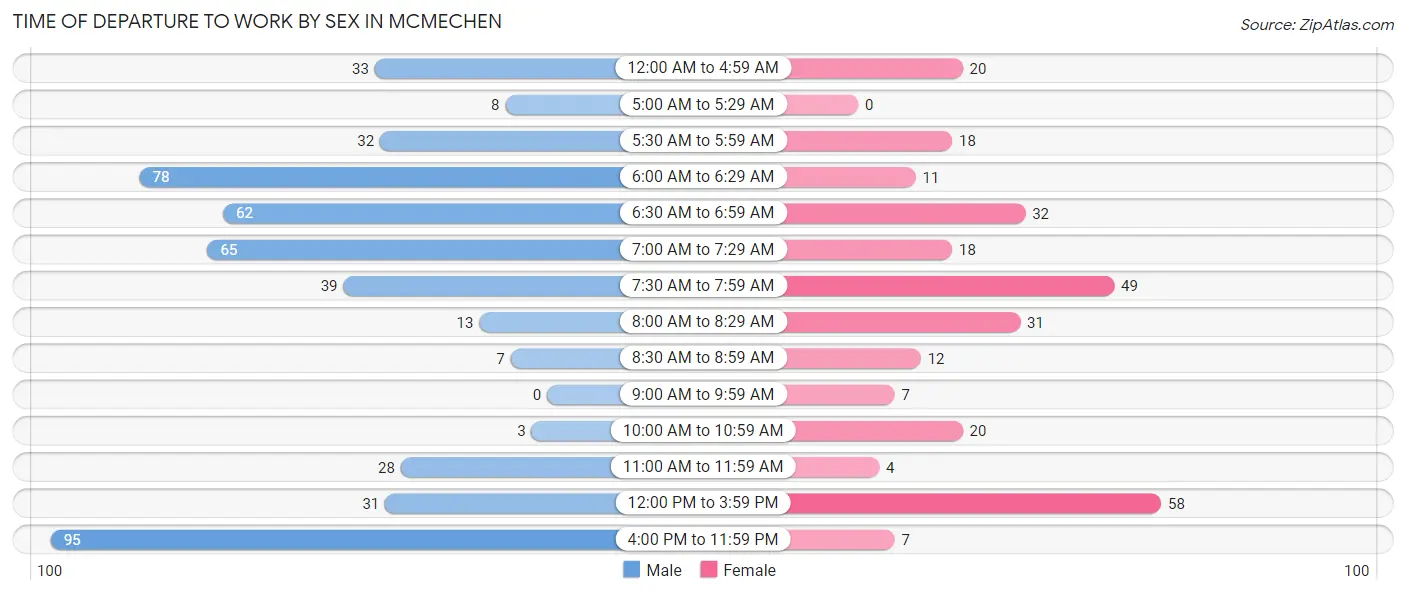
| Time of Departure | Male | Female |
| 12:00 AM to 4:59 AM | 33 (6.7%) | 20 (7.0%) |
| 5:00 AM to 5:29 AM | 8 (1.6%) | 0 (0.0%) |
| 5:30 AM to 5:59 AM | 32 (6.5%) | 18 (6.3%) |
| 6:00 AM to 6:29 AM | 78 (15.8%) | 11 (3.8%) |
| 6:30 AM to 6:59 AM | 62 (12.6%) | 32 (11.2%) |
| 7:00 AM to 7:29 AM | 65 (13.2%) | 18 (6.3%) |
| 7:30 AM to 7:59 AM | 39 (7.9%) | 49 (17.1%) |
| 8:00 AM to 8:29 AM | 13 (2.6%) | 31 (10.8%) |
| 8:30 AM to 8:59 AM | 7 (1.4%) | 12 (4.2%) |
| 9:00 AM to 9:59 AM | 0 (0.0%) | 7 (2.4%) |
| 10:00 AM to 10:59 AM | 3 (0.6%) | 20 (7.0%) |
| 11:00 AM to 11:59 AM | 28 (5.7%) | 4 (1.4%) |
| 12:00 PM to 3:59 PM | 31 (6.3%) | 58 (20.2%) |
| 4:00 PM to 11:59 PM | 95 (19.2%) | 7 (2.4%) |
| Total | 494 (100.0%) | 287 (100.0%) |
Housing Occupancy in Mcmechen
Occupancy by Ownership in Mcmechen
Of the total 640 dwellings in Mcmechen, owner-occupied units account for 456 (71.3%), while renter-occupied units make up 184 (28.7%).
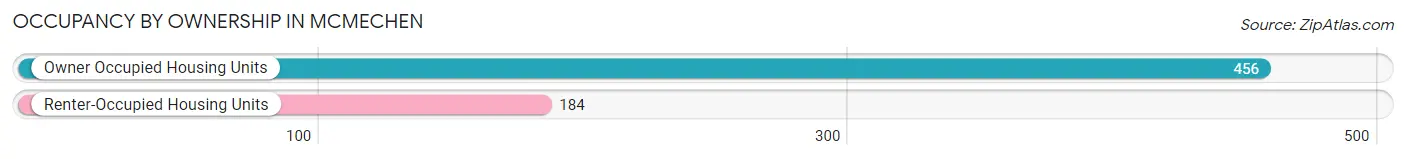
| Occupancy | # Housing Units | % Housing Units |
| Owner Occupied Housing Units | 456 | 71.3% |
| Renter-Occupied Housing Units | 184 | 28.7% |
| Total Occupied Housing Units | 640 | 100.0% |
Occupancy by Household Size in Mcmechen
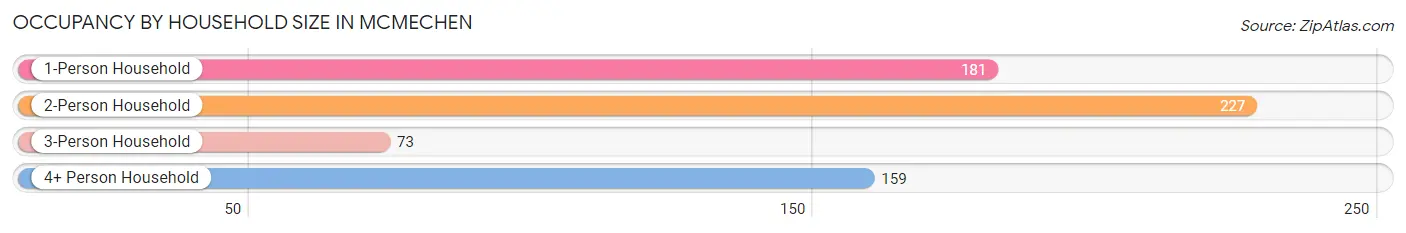
| Household Size | # Housing Units | % Housing Units |
| 1-Person Household | 181 | 28.3% |
| 2-Person Household | 227 | 35.5% |
| 3-Person Household | 73 | 11.4% |
| 4+ Person Household | 159 | 24.8% |
| Total Housing Units | 640 | 100.0% |
Occupancy by Ownership by Household Size in Mcmechen
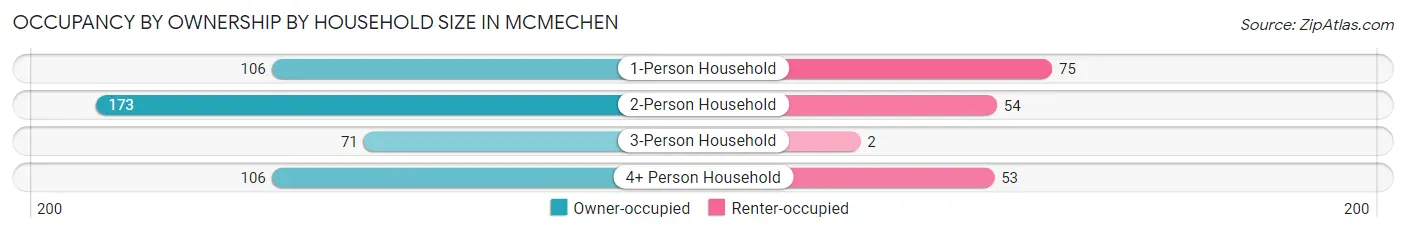
| Household Size | Owner-occupied | Renter-occupied |
| 1-Person Household | 106 (58.6%) | 75 (41.4%) |
| 2-Person Household | 173 (76.2%) | 54 (23.8%) |
| 3-Person Household | 71 (97.3%) | 2 (2.7%) |
| 4+ Person Household | 106 (66.7%) | 53 (33.3%) |
| Total Housing Units | 456 (71.3%) | 184 (28.7%) |
Occupancy by Educational Attainment in Mcmechen
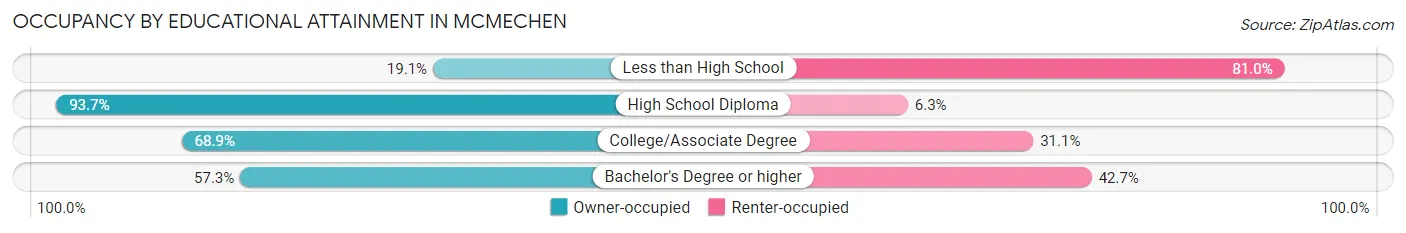
| Household Size | Owner-occupied | Renter-occupied |
| Less than High School | 12 (19.1%) | 51 (80.9%) |
| High School Diploma | 224 (93.7%) | 15 (6.3%) |
| College/Associate Degree | 157 (68.9%) | 71 (31.1%) |
| Bachelor's Degree or higher | 63 (57.3%) | 47 (42.7%) |
Occupancy by Age of Householder in Mcmechen
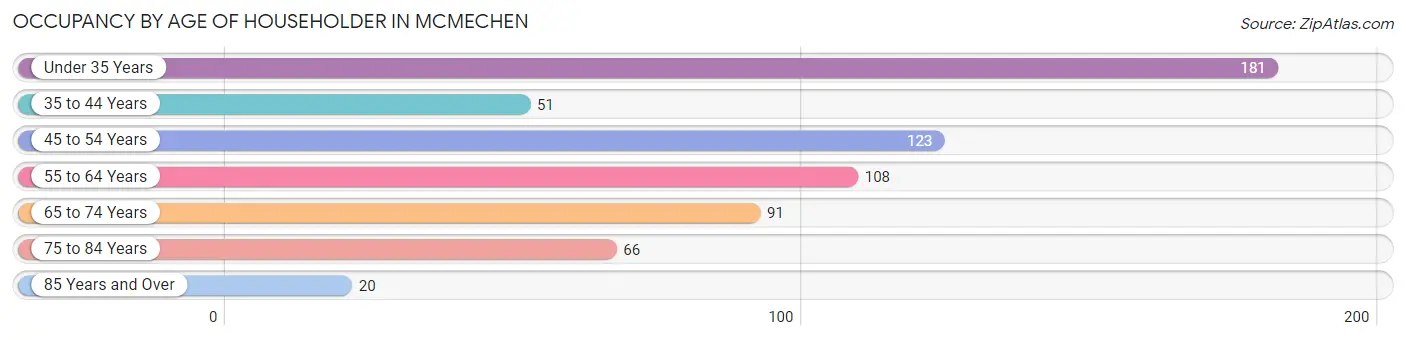
| Age Bracket | # Households | % Households |
| Under 35 Years | 181 | 28.3% |
| 35 to 44 Years | 51 | 8.0% |
| 45 to 54 Years | 123 | 19.2% |
| 55 to 64 Years | 108 | 16.9% |
| 65 to 74 Years | 91 | 14.2% |
| 75 to 84 Years | 66 | 10.3% |
| 85 Years and Over | 20 | 3.1% |
| Total | 640 | 100.0% |
Housing Finances in Mcmechen
Median Income by Occupancy in Mcmechen
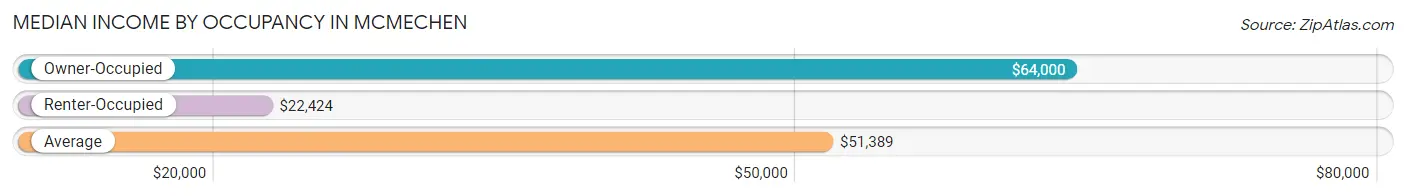
| Occupancy Type | # Households | Median Income |
| Owner-Occupied | 456 (71.3%) | $64,000 |
| Renter-Occupied | 184 (28.7%) | $22,424 |
| Average | 640 (100.0%) | $51,389 |
Occupancy by Householder Income Bracket in Mcmechen
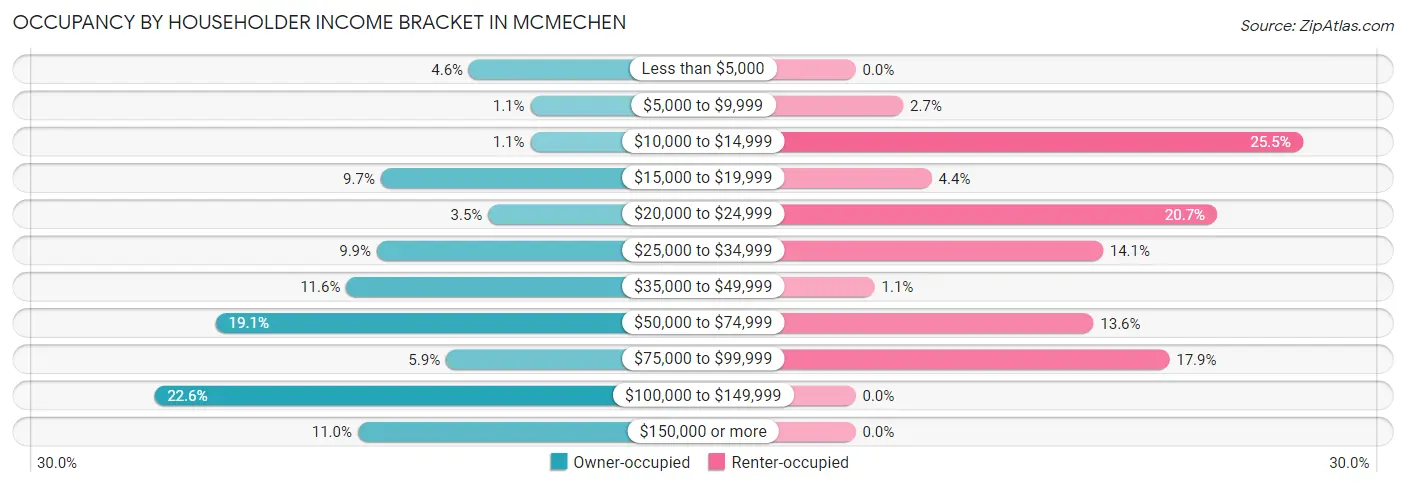
| Income Bracket | Owner-occupied | Renter-occupied |
| Less than $5,000 | 21 (4.6%) | 0 (0.0%) |
| $5,000 to $9,999 | 5 (1.1%) | 5 (2.7%) |
| $10,000 to $14,999 | 5 (1.1%) | 47 (25.5%) |
| $15,000 to $19,999 | 44 (9.7%) | 8 (4.3%) |
| $20,000 to $24,999 | 16 (3.5%) | 38 (20.6%) |
| $25,000 to $34,999 | 45 (9.9%) | 26 (14.1%) |
| $35,000 to $49,999 | 53 (11.6%) | 2 (1.1%) |
| $50,000 to $74,999 | 87 (19.1%) | 25 (13.6%) |
| $75,000 to $99,999 | 27 (5.9%) | 33 (17.9%) |
| $100,000 to $149,999 | 103 (22.6%) | 0 (0.0%) |
| $150,000 or more | 50 (11.0%) | 0 (0.0%) |
| Total | 456 (100.0%) | 184 (100.0%) |
Monthly Housing Cost Tiers in Mcmechen
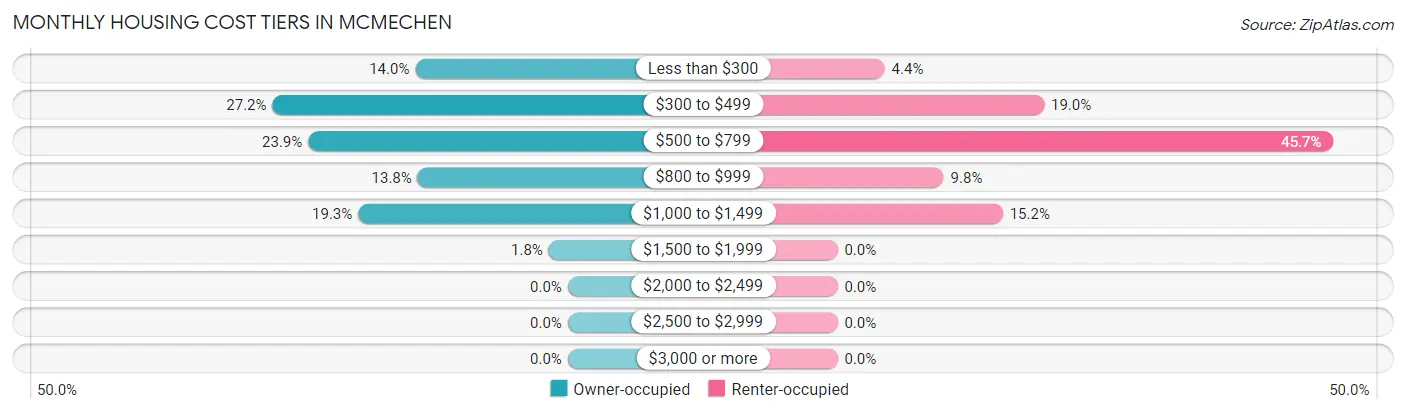
| Monthly Cost | Owner-occupied | Renter-occupied |
| Less than $300 | 64 (14.0%) | 8 (4.3%) |
| $300 to $499 | 124 (27.2%) | 35 (19.0%) |
| $500 to $799 | 109 (23.9%) | 84 (45.7%) |
| $800 to $999 | 63 (13.8%) | 18 (9.8%) |
| $1,000 to $1,499 | 88 (19.3%) | 28 (15.2%) |
| $1,500 to $1,999 | 8 (1.8%) | 0 (0.0%) |
| $2,000 to $2,499 | 0 (0.0%) | 0 (0.0%) |
| $2,500 to $2,999 | 0 (0.0%) | 0 (0.0%) |
| $3,000 or more | 0 (0.0%) | 0 (0.0%) |
| Total | 456 (100.0%) | 184 (100.0%) |
Physical Housing Characteristics in Mcmechen
Housing Structures in Mcmechen
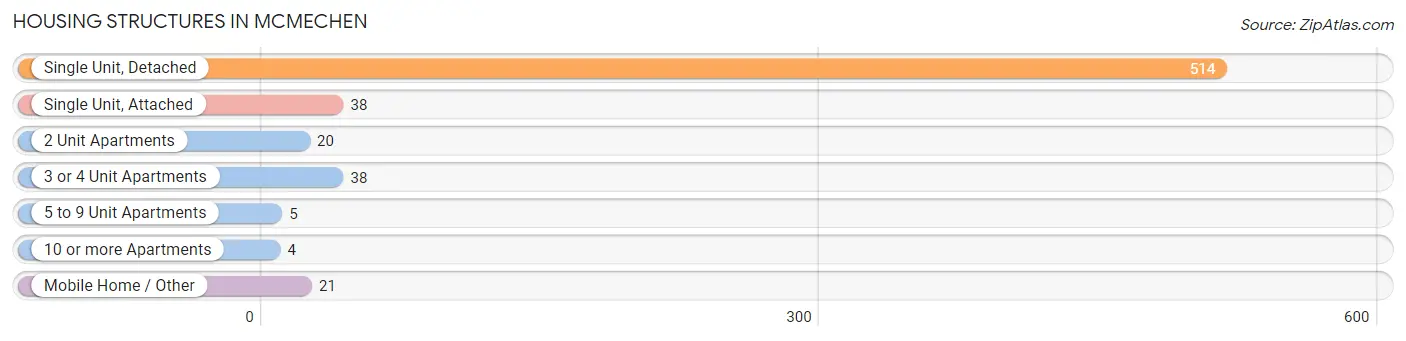
| Structure Type | # Housing Units | % Housing Units |
| Single Unit, Detached | 514 | 80.3% |
| Single Unit, Attached | 38 | 5.9% |
| 2 Unit Apartments | 20 | 3.1% |
| 3 or 4 Unit Apartments | 38 | 5.9% |
| 5 to 9 Unit Apartments | 5 | 0.8% |
| 10 or more Apartments | 4 | 0.6% |
| Mobile Home / Other | 21 | 3.3% |
| Total | 640 | 100.0% |
Housing Structures by Occupancy in Mcmechen
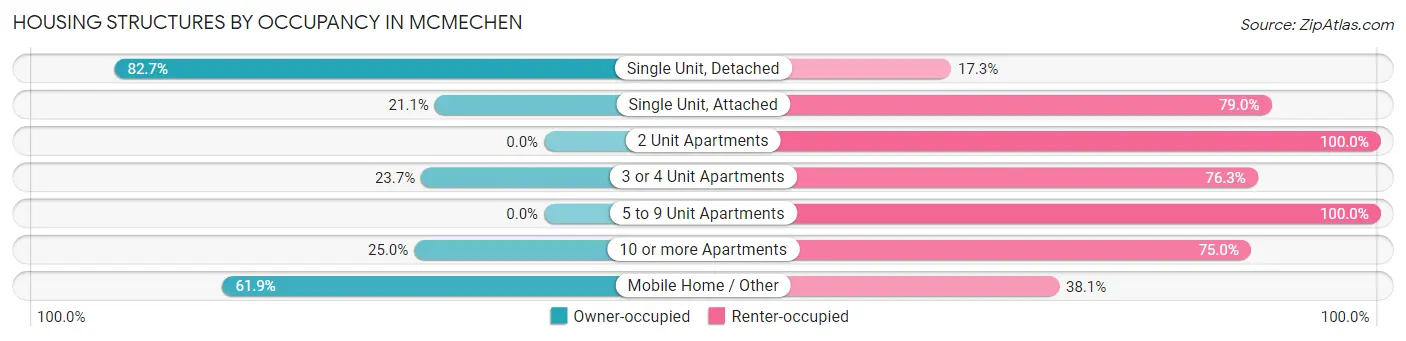
| Structure Type | Owner-occupied | Renter-occupied |
| Single Unit, Detached | 425 (82.7%) | 89 (17.3%) |
| Single Unit, Attached | 8 (21.0%) | 30 (78.9%) |
| 2 Unit Apartments | 0 (0.0%) | 20 (100.0%) |
| 3 or 4 Unit Apartments | 9 (23.7%) | 29 (76.3%) |
| 5 to 9 Unit Apartments | 0 (0.0%) | 5 (100.0%) |
| 10 or more Apartments | 1 (25.0%) | 3 (75.0%) |
| Mobile Home / Other | 13 (61.9%) | 8 (38.1%) |
| Total | 456 (71.3%) | 184 (28.7%) |
Housing Structures by Number of Rooms in Mcmechen
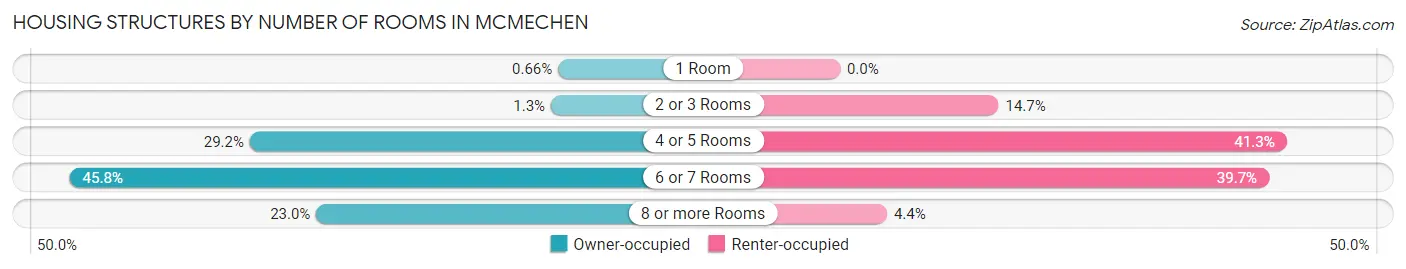
| Number of Rooms | Owner-occupied | Renter-occupied |
| 1 Room | 3 (0.7%) | 0 (0.0%) |
| 2 or 3 Rooms | 6 (1.3%) | 27 (14.7%) |
| 4 or 5 Rooms | 133 (29.2%) | 76 (41.3%) |
| 6 or 7 Rooms | 209 (45.8%) | 73 (39.7%) |
| 8 or more Rooms | 105 (23.0%) | 8 (4.3%) |
| Total | 456 (100.0%) | 184 (100.0%) |
Housing Structure by Heating Type in Mcmechen
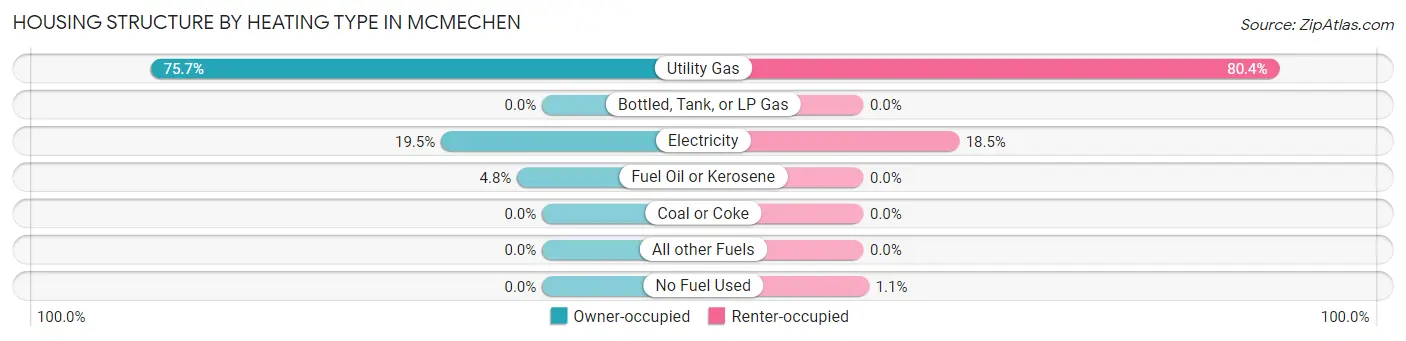
| Heating Type | Owner-occupied | Renter-occupied |
| Utility Gas | 345 (75.7%) | 148 (80.4%) |
| Bottled, Tank, or LP Gas | 0 (0.0%) | 0 (0.0%) |
| Electricity | 89 (19.5%) | 34 (18.5%) |
| Fuel Oil or Kerosene | 22 (4.8%) | 0 (0.0%) |
| Coal or Coke | 0 (0.0%) | 0 (0.0%) |
| All other Fuels | 0 (0.0%) | 0 (0.0%) |
| No Fuel Used | 0 (0.0%) | 2 (1.1%) |
| Total | 456 (100.0%) | 184 (100.0%) |
Household Vehicle Usage in Mcmechen
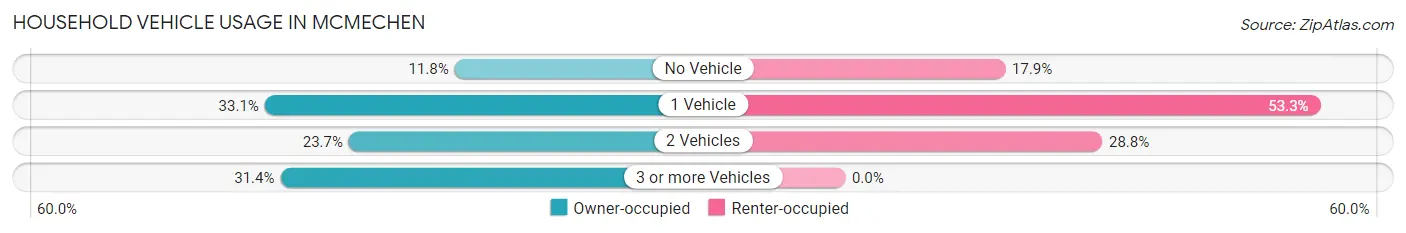
| Vehicles per Household | Owner-occupied | Renter-occupied |
| No Vehicle | 54 (11.8%) | 33 (17.9%) |
| 1 Vehicle | 151 (33.1%) | 98 (53.3%) |
| 2 Vehicles | 108 (23.7%) | 53 (28.8%) |
| 3 or more Vehicles | 143 (31.4%) | 0 (0.0%) |
| Total | 456 (100.0%) | 184 (100.0%) |
Real Estate & Mortgages in Mcmechen
Real Estate and Mortgage Overview in Mcmechen
| Characteristic | Without Mortgage | With Mortgage |
| Housing Units | 224 | 232 |
| Median Property Value | $80,000 | $95,700 |
| Median Household Income | $41,875 | $47 |
| Monthly Housing Costs | $361 | $0 |
| Real Estate Taxes | $422 | $14 |
Property Value by Mortgage Status in Mcmechen
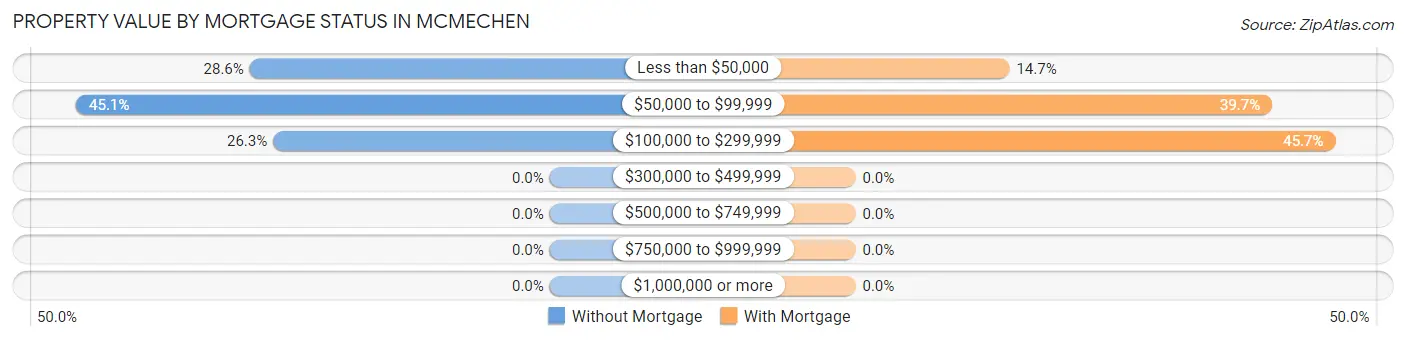
| Property Value | Without Mortgage | With Mortgage |
| Less than $50,000 | 64 (28.6%) | 34 (14.7%) |
| $50,000 to $99,999 | 101 (45.1%) | 92 (39.7%) |
| $100,000 to $299,999 | 59 (26.3%) | 106 (45.7%) |
| $300,000 to $499,999 | 0 (0.0%) | 0 (0.0%) |
| $500,000 to $749,999 | 0 (0.0%) | 0 (0.0%) |
| $750,000 to $999,999 | 0 (0.0%) | 0 (0.0%) |
| $1,000,000 or more | 0 (0.0%) | 0 (0.0%) |
| Total | 224 (100.0%) | 232 (100.0%) |
Household Income by Mortgage Status in Mcmechen
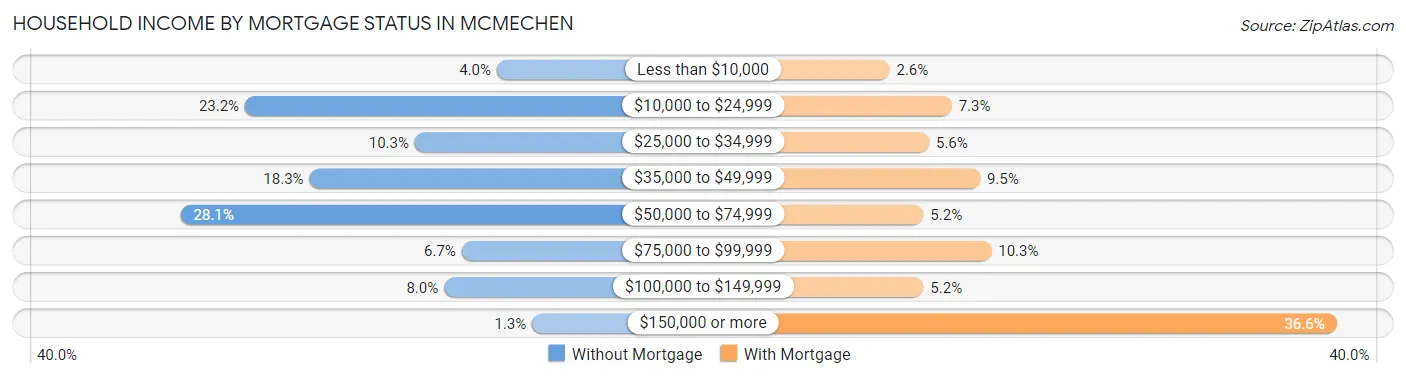
| Household Income | Without Mortgage | With Mortgage |
| Less than $10,000 | 9 (4.0%) | 6 (2.6%) |
| $10,000 to $24,999 | 52 (23.2%) | 17 (7.3%) |
| $25,000 to $34,999 | 23 (10.3%) | 13 (5.6%) |
| $35,000 to $49,999 | 41 (18.3%) | 22 (9.5%) |
| $50,000 to $74,999 | 63 (28.1%) | 12 (5.2%) |
| $75,000 to $99,999 | 15 (6.7%) | 24 (10.3%) |
| $100,000 to $149,999 | 18 (8.0%) | 12 (5.2%) |
| $150,000 or more | 3 (1.3%) | 85 (36.6%) |
| Total | 224 (100.0%) | 232 (100.0%) |
Property Value to Household Income Ratio in Mcmechen
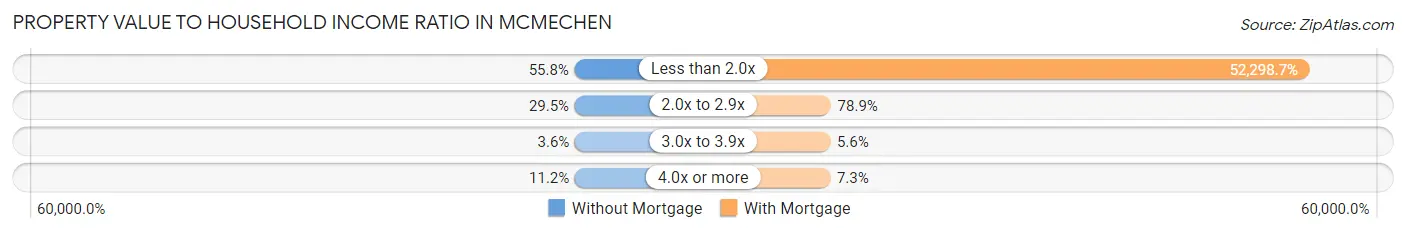
| Value-to-Income Ratio | Without Mortgage | With Mortgage |
| Less than 2.0x | 125 (55.8%) | 121,333 (52,298.7%) |
| 2.0x to 2.9x | 66 (29.5%) | 183 (78.9%) |
| 3.0x to 3.9x | 8 (3.6%) | 13 (5.6%) |
| 4.0x or more | 25 (11.2%) | 17 (7.3%) |
| Total | 224 (100.0%) | 232 (100.0%) |
Real Estate Taxes by Mortgage Status in Mcmechen
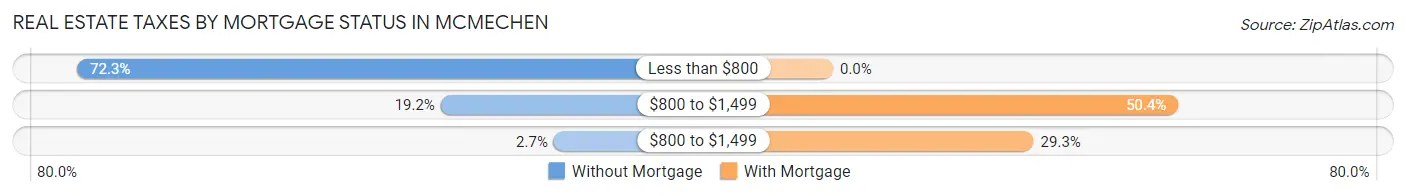
| Property Taxes | Without Mortgage | With Mortgage |
| Less than $800 | 162 (72.3%) | 0 (0.0%) |
| $800 to $1,499 | 43 (19.2%) | 117 (50.4%) |
| $800 to $1,499 | 6 (2.7%) | 68 (29.3%) |
| Total | 224 (100.0%) | 232 (100.0%) |
Health & Disability in Mcmechen
Health Insurance Coverage by Age in Mcmechen
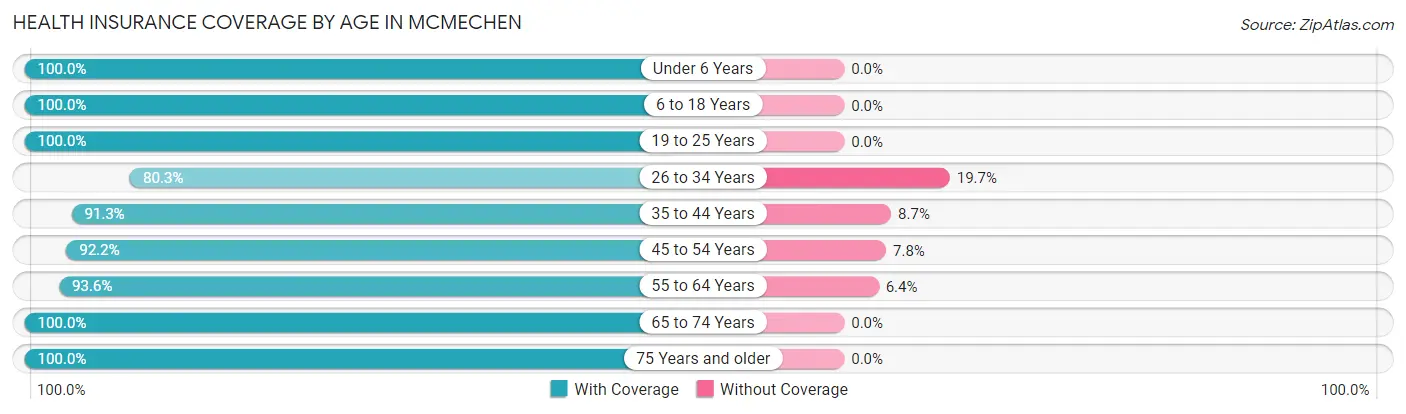
| Age Bracket | With Coverage | Without Coverage |
| Under 6 Years | 122 (100.0%) | 0 (0.0%) |
| 6 to 18 Years | 425 (100.0%) | 0 (0.0%) |
| 19 to 25 Years | 72 (100.0%) | 0 (0.0%) |
| 26 to 34 Years | 253 (80.3%) | 62 (19.7%) |
| 35 to 44 Years | 167 (91.3%) | 16 (8.7%) |
| 45 to 54 Years | 225 (92.2%) | 19 (7.8%) |
| 55 to 64 Years | 175 (93.6%) | 12 (6.4%) |
| 65 to 74 Years | 151 (100.0%) | 0 (0.0%) |
| 75 Years and older | 113 (100.0%) | 0 (0.0%) |
| Total | 1,703 (94.0%) | 109 (6.0%) |
Health Insurance Coverage by Citizenship Status in Mcmechen
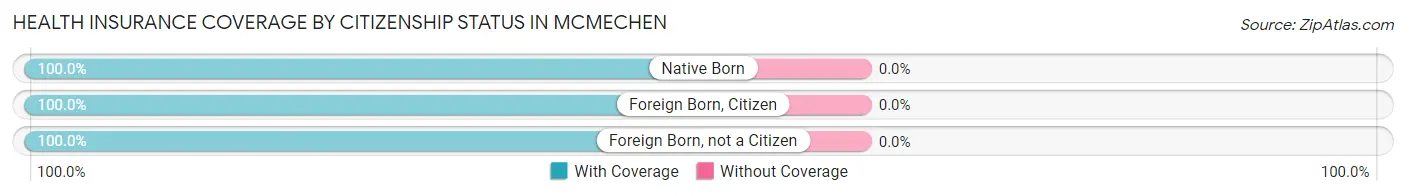
| Citizenship Status | With Coverage | Without Coverage |
| Native Born | 122 (100.0%) | 0 (0.0%) |
| Foreign Born, Citizen | 425 (100.0%) | 0 (0.0%) |
| Foreign Born, not a Citizen | 72 (100.0%) | 0 (0.0%) |
Health Insurance Coverage by Household Income in Mcmechen
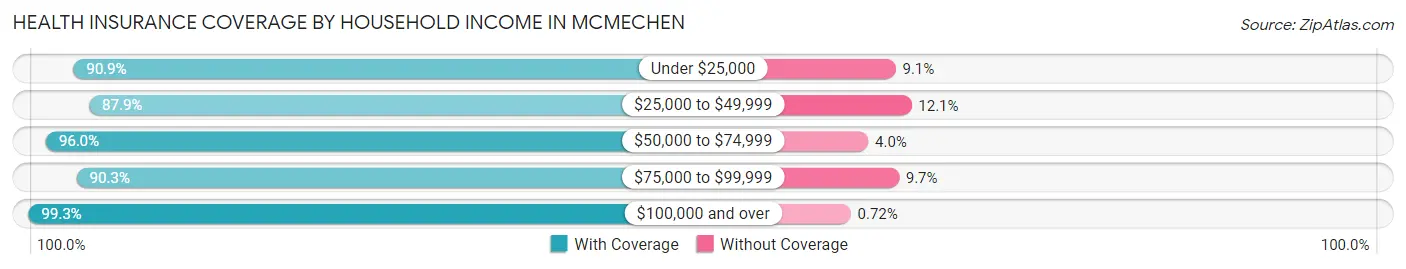
| Household Income | With Coverage | Without Coverage |
| Under $25,000 | 418 (90.9%) | 42 (9.1%) |
| $25,000 to $49,999 | 247 (87.9%) | 34 (12.1%) |
| $50,000 to $74,999 | 337 (96.0%) | 14 (4.0%) |
| $75,000 to $99,999 | 139 (90.3%) | 15 (9.7%) |
| $100,000 and over | 554 (99.3%) | 4 (0.7%) |
Public vs Private Health Insurance Coverage by Age in Mcmechen
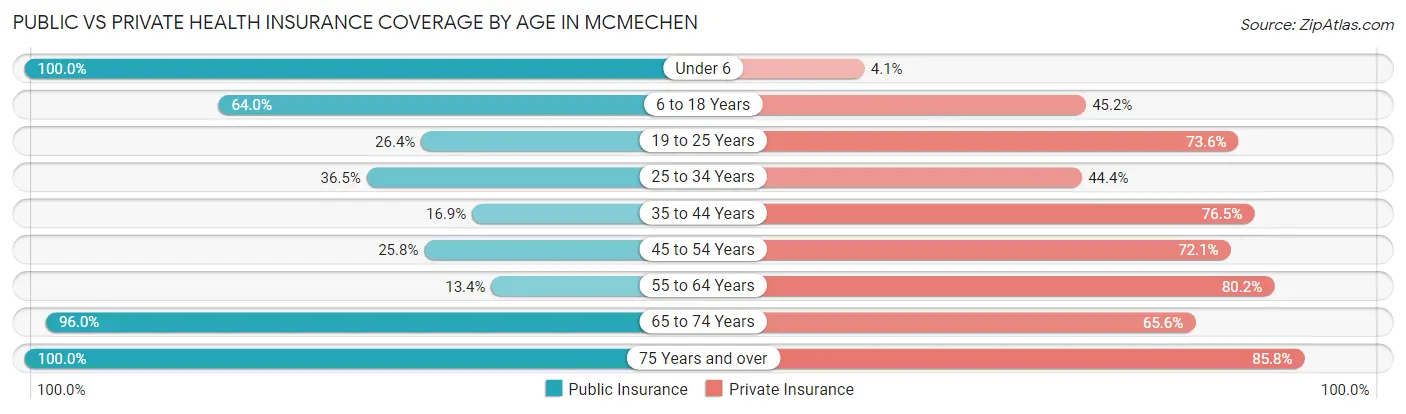
| Age Bracket | Public Insurance | Private Insurance |
| Under 6 | 122 (100.0%) | 5 (4.1%) |
| 6 to 18 Years | 272 (64.0%) | 192 (45.2%) |
| 19 to 25 Years | 19 (26.4%) | 53 (73.6%) |
| 25 to 34 Years | 115 (36.5%) | 140 (44.4%) |
| 35 to 44 Years | 31 (16.9%) | 140 (76.5%) |
| 45 to 54 Years | 63 (25.8%) | 176 (72.1%) |
| 55 to 64 Years | 25 (13.4%) | 150 (80.2%) |
| 65 to 74 Years | 145 (96.0%) | 99 (65.6%) |
| 75 Years and over | 113 (100.0%) | 97 (85.8%) |
| Total | 905 (49.9%) | 1,052 (58.1%) |
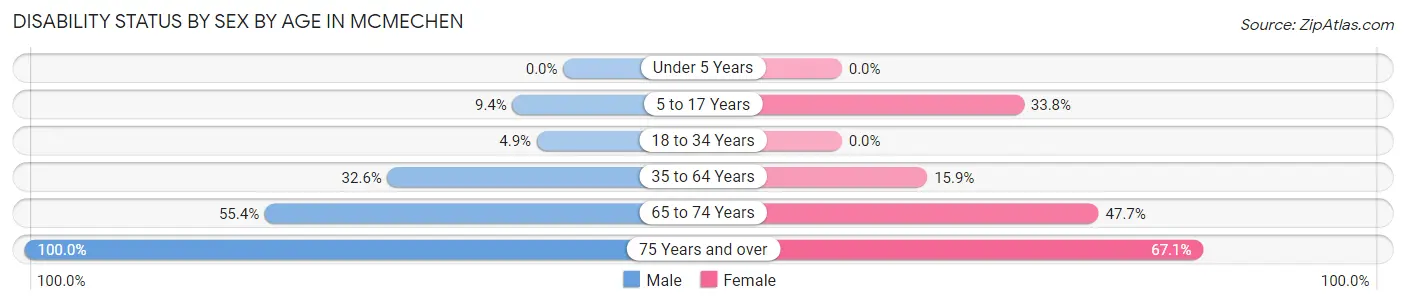
Disability Status by Sex by Age in Mcmechen
| Age Bracket | Male | Female |
| Under 5 Years | 0 (0.0%) | 0 (0.0%) |
| 5 to 17 Years | 26 (9.4%) | 49 (33.8%) |
| 18 to 34 Years | 13 (4.9%) | 0 (0.0%) |
| 35 to 64 Years | 120 (32.6%) | 39 (15.9%) |
| 65 to 74 Years | 36 (55.4%) | 41 (47.7%) |
| 75 Years and over | 34 (100.0%) | 53 (67.1%) |
Disability Class by Sex by Age in Mcmechen
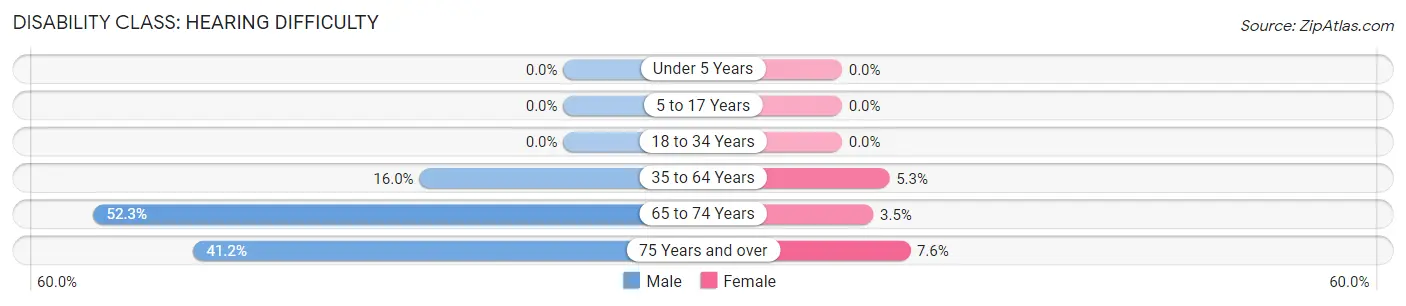
Disability Class: Hearing Difficulty
| Age Bracket | Male | Female |
| Under 5 Years | 0 (0.0%) | 0 (0.0%) |
| 5 to 17 Years | 0 (0.0%) | 0 (0.0%) |
| 18 to 34 Years | 0 (0.0%) | 0 (0.0%) |
| 35 to 64 Years | 59 (16.0%) | 13 (5.3%) |
| 65 to 74 Years | 34 (52.3%) | 3 (3.5%) |
| 75 Years and over | 14 (41.2%) | 6 (7.6%) |
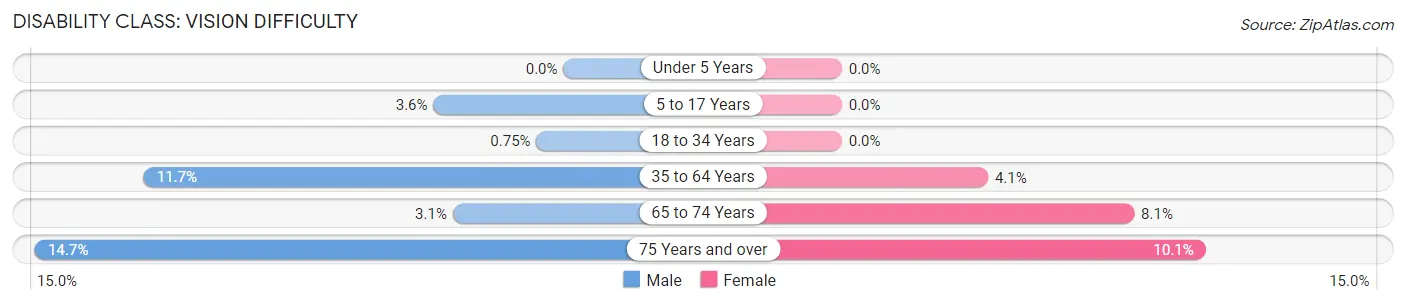
Disability Class: Vision Difficulty
| Age Bracket | Male | Female |
| Under 5 Years | 0 (0.0%) | 0 (0.0%) |
| 5 to 17 Years | 10 (3.6%) | 0 (0.0%) |
| 18 to 34 Years | 2 (0.7%) | 0 (0.0%) |
| 35 to 64 Years | 43 (11.7%) | 10 (4.1%) |
| 65 to 74 Years | 2 (3.1%) | 7 (8.1%) |
| 75 Years and over | 5 (14.7%) | 8 (10.1%) |
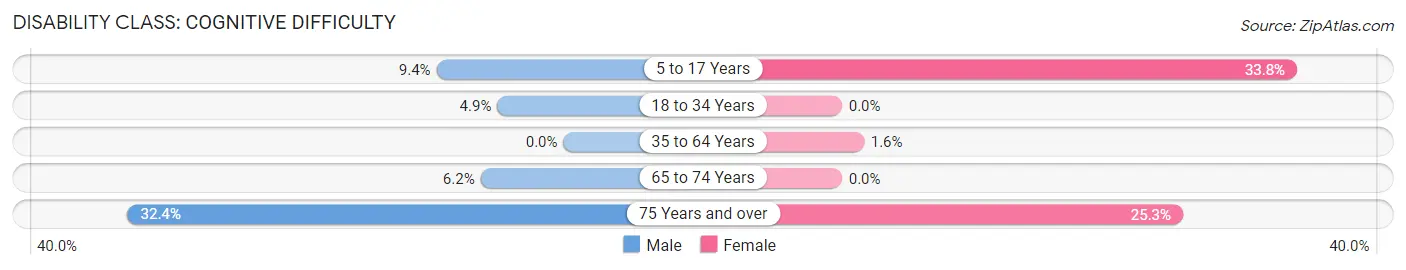
Disability Class: Cognitive Difficulty
| Age Bracket | Male | Female |
| 5 to 17 Years | 26 (9.4%) | 49 (33.8%) |
| 18 to 34 Years | 13 (4.9%) | 0 (0.0%) |
| 35 to 64 Years | 0 (0.0%) | 4 (1.6%) |
| 65 to 74 Years | 4 (6.1%) | 0 (0.0%) |
| 75 Years and over | 11 (32.4%) | 20 (25.3%) |
Disability Class: Ambulatory Difficulty
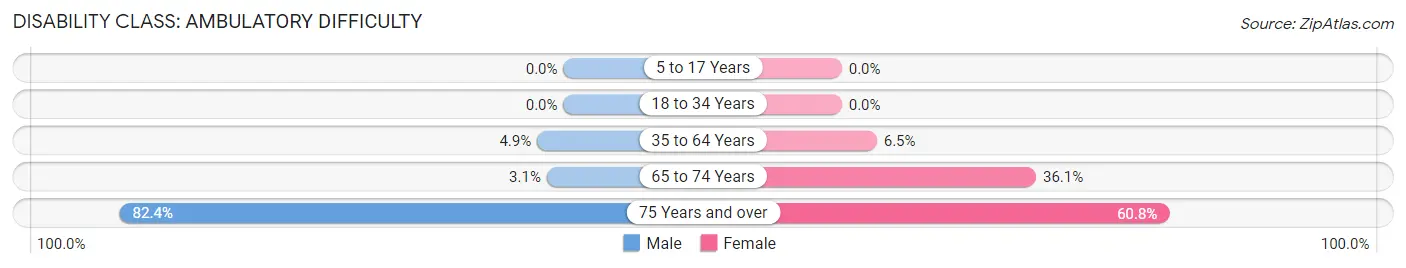
| Age Bracket | Male | Female |
| 5 to 17 Years | 0 (0.0%) | 0 (0.0%) |
| 18 to 34 Years | 0 (0.0%) | 0 (0.0%) |
| 35 to 64 Years | 18 (4.9%) | 16 (6.5%) |
| 65 to 74 Years | 2 (3.1%) | 31 (36.0%) |
| 75 Years and over | 28 (82.4%) | 48 (60.8%) |
Disability Class: Self-Care Difficulty
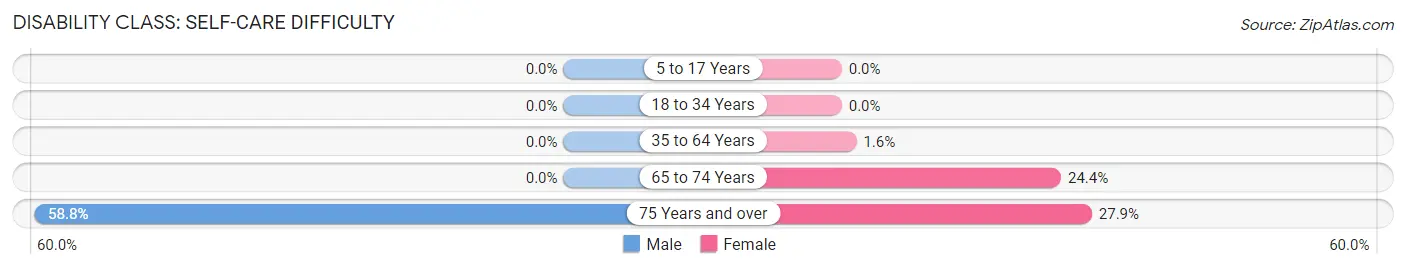
| Age Bracket | Male | Female |
| 5 to 17 Years | 0 (0.0%) | 0 (0.0%) |
| 18 to 34 Years | 0 (0.0%) | 0 (0.0%) |
| 35 to 64 Years | 0 (0.0%) | 4 (1.6%) |
| 65 to 74 Years | 0 (0.0%) | 21 (24.4%) |
| 75 Years and over | 20 (58.8%) | 22 (27.9%) |
Technology Access in Mcmechen
Computing Device Access in Mcmechen
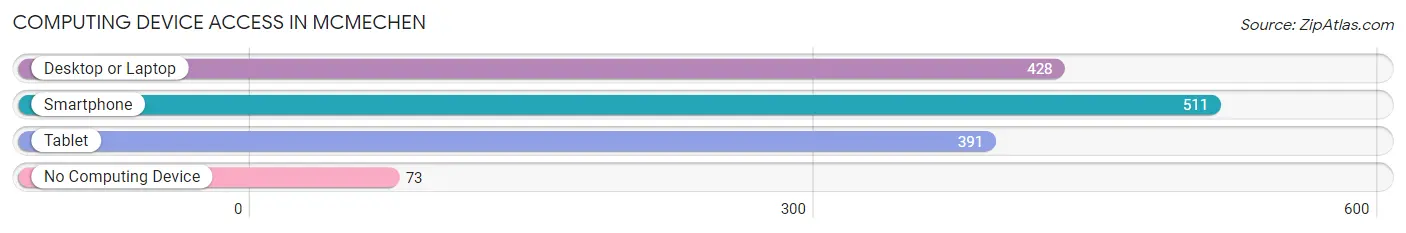
| Device Type | # Households | % Households |
| Desktop or Laptop | 428 | 66.9% |
| Smartphone | 511 | 79.8% |
| Tablet | 391 | 61.1% |
| No Computing Device | 73 | 11.4% |
| Total | 640 | 100.0% |
Internet Access in Mcmechen
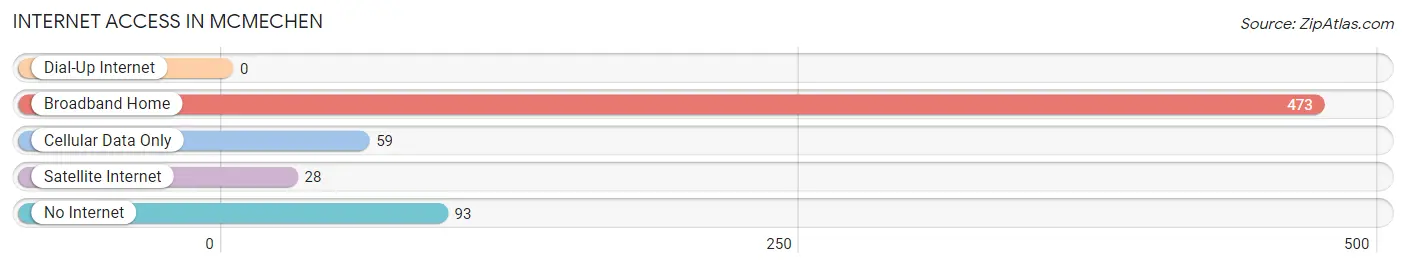
| Internet Type | # Households | % Households |
| Dial-Up Internet | 0 | 0.0% |
| Broadband Home | 473 | 73.9% |
| Cellular Data Only | 59 | 9.2% |
| Satellite Internet | 28 | 4.4% |
| No Internet | 93 | 14.5% |
| Total | 640 | 100.0% |
Mcmechen Summary
Mcmechen is a small city located in the northern panhandle of West Virginia, United States. It is situated in Marshall County, along the Ohio River. The city has a population of 1,717 as of the 2010 census.
History
Mcmechen was founded in 1853 by John McMechen, a Scottish immigrant. He purchased the land from the heirs of the original owner, John McMechen, and named the town after himself. The town was incorporated in 1871.
Mcmechen was a major hub for the coal and steel industries in the late 19th and early 20th centuries. The city was home to several steel mills, including the Wheeling Steel Corporation, which was the largest steel mill in the world at the time. The city was also home to several coal mines, which provided employment for many of the city’s residents.
The city was also home to several notable figures, including the first African-American mayor of a West Virginia city, William E. “Bill” Davis, who served from 1966 to 1970.
Geography
Mcmechen is located at 39°27′N 80°45′W (39.45, -80.75). The city is situated along the Ohio River, and is bordered by the cities of Benwood and Moundsville to the north, and Wheeling to the south.
The city has a total area of 1.2 square miles (3.2 km2), all of which is land. The city is located in the Appalachian Plateau region of West Virginia.
Economy
Mcmechen’s economy is largely based on the steel and coal industries. The city is home to several steel mills, including the Wheeling Steel Corporation, which is the largest steel mill in the world. The city is also home to several coal mines, which provide employment for many of the city’s residents.
The city is also home to several small businesses, including restaurants, retail stores, and other services.
Demographics
As of the 2010 census, Mcmechen had a population of 1,717. The racial makeup of the city was 97.2% White, 0.9% African American, 0.2% Native American, 0.2% Asian, 0.1% from other races, and 1.4% from two or more races. Hispanic or Latino of any race were 0.7% of the population.
The median income for a household in the city was $30,938, and the median income for a family was $37,500. Males had a median income of $30,000 versus $21,250 for females. The per capita income for the city was $15,945. About 11.2% of families and 14.2% of the population were below the poverty line, including 19.2% of those under age 18 and 8.3% of those age 65 or over.
Common Questions
What is Per Capita Income in Mcmechen?
Per Capita income in Mcmechen is $27,164.
What is the Median Family Income in Mcmechen?
Median Family Income in Mcmechen is $61,818.
What is the Median Household income in Mcmechen?
Median Household Income in Mcmechen is $51,389.
What is Income or Wage Gap in Mcmechen?
Income or Wage Gap in Mcmechen is 36.8%.
Women in Mcmechen earn 63.2 cents for every dollar earned by a man.
What is Inequality or Gini Index in Mcmechen?
Inequality or Gini Index in Mcmechen is 0.46.
What is the Total Population of Mcmechen?
Total Population of Mcmechen is 1,812.
What is the Total Male Population of Mcmechen?
Total Male Population of Mcmechen is 1,088.
What is the Total Female Population of Mcmechen?
Total Female Population of Mcmechen is 724.
What is the Ratio of Males per 100 Females in Mcmechen?
There are 150.28 Males per 100 Females in Mcmechen.
What is the Ratio of Females per 100 Males in Mcmechen?
There are 66.54 Females per 100 Males in Mcmechen.
What is the Median Population Age in Mcmechen?
Median Population Age in Mcmechen is 34.3 Years.
What is the Average Family Size in Mcmechen
Average Family Size in Mcmechen is 3.4 People.
What is the Average Household Size in Mcmechen
Average Household Size in Mcmechen is 2.8 People.
How Large is the Labor Force in Mcmechen?
There are 856 People in the Labor Forcein in Mcmechen.
What is the Percentage of People in the Labor Force in Mcmechen?
61.3% of People are in the Labor Force in Mcmechen.
What is the Unemployment Rate in Mcmechen?
Unemployment Rate in Mcmechen is 5.3%.