Bramwell, WV Map & Demographics
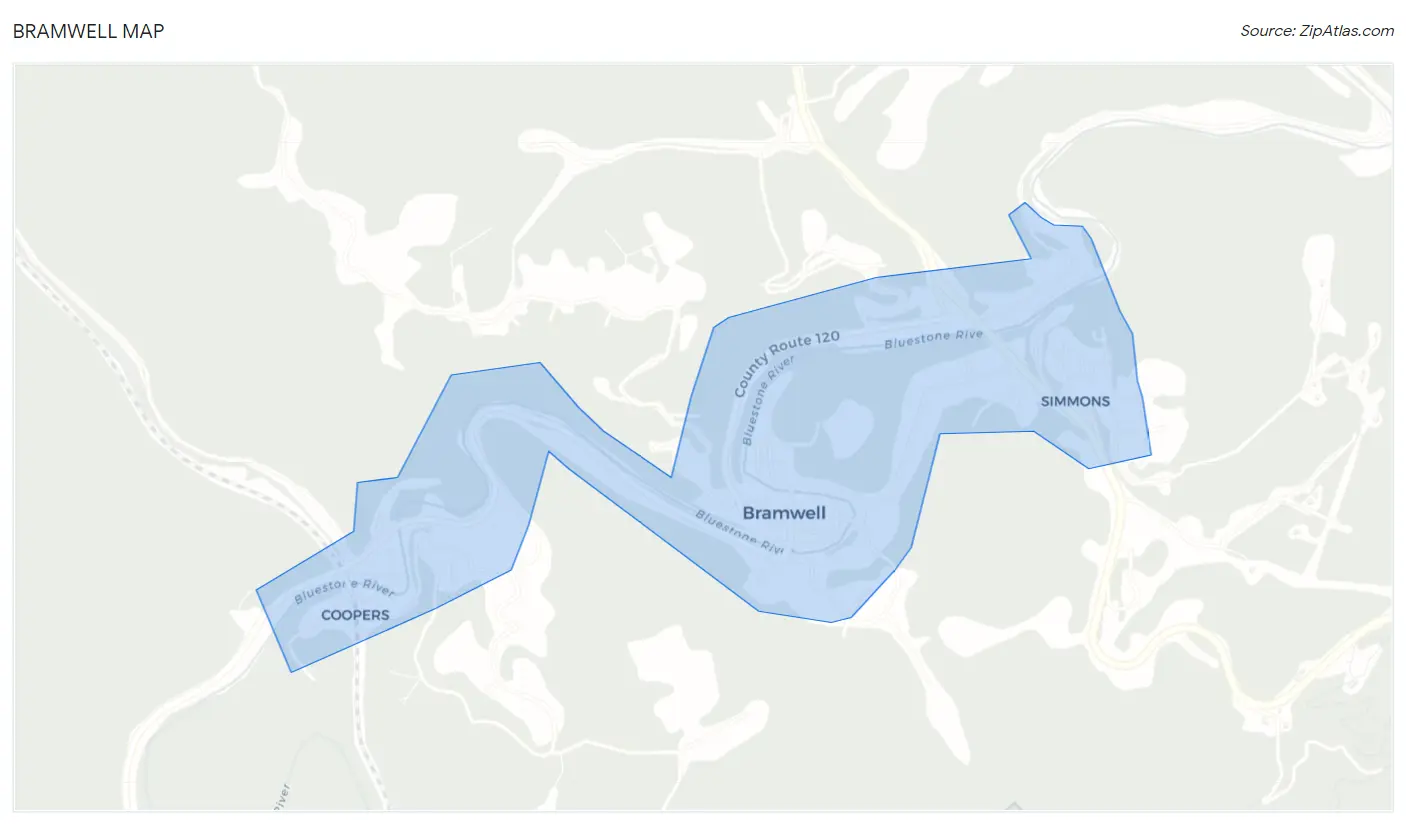
Bramwell Map
Bramwell Overview
$26,281
PER CAPITA INCOME
$56,667
AVG FAMILY INCOME
$48,750
AVG HOUSEHOLD INCOME
0.45
INEQUALITY / GINI INDEX
180
TOTAL POPULATION
102
MALE POPULATION
78
FEMALE POPULATION
130.77
MALES / 100 FEMALES
76.47
FEMALES / 100 MALES
62.0
MEDIAN AGE
2.4
AVG FAMILY SIZE
2.1
AVG HOUSEHOLD SIZE
61
LABOR FORCE [ PEOPLE ]
37.2%
PERCENT IN LABOR FORCE
24.6%
UNEMPLOYMENT RATE
Bramwell Zip Codes
Bramwell Area Codes
Income in Bramwell
Income Overview in Bramwell
Per Capita Income in Bramwell is $26,281, while median incomes of families and households are $56,667 and $48,750 respectively.
| Characteristic | Number | Measure |
| Per Capita Income | 180 | $26,281 |
| Median Family Income | 68 | $56,667 |
| Mean Family Income | 68 | $64,918 |
| Median Household Income | 85 | $48,750 |
| Mean Household Income | 85 | $57,267 |
| Income Deficit | 68 | $0 |
| Wage / Income Gap (%) | 180 | 0.00% |
| Wage / Income Gap ($) | 180 | 100.00¢ per $1 |
| Gini / Inequality Index | 180 | 0.45 |
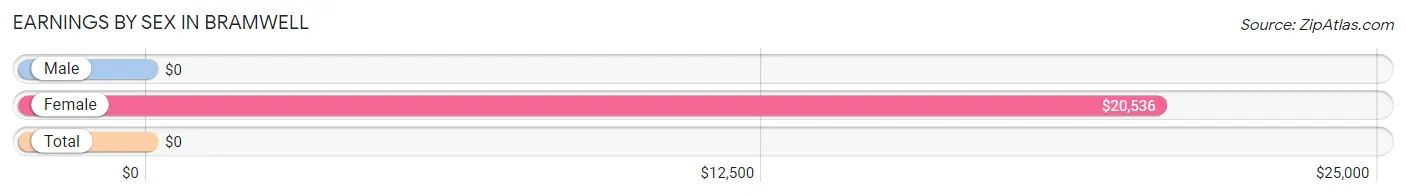
Earnings by Sex in Bramwell
| Sex | Number | Average Earnings |
| Male | 24 (39.3%) | $0 |
| Female | 37 (60.7%) | $20,536 |
| Total | 61 (100.0%) | $0 |
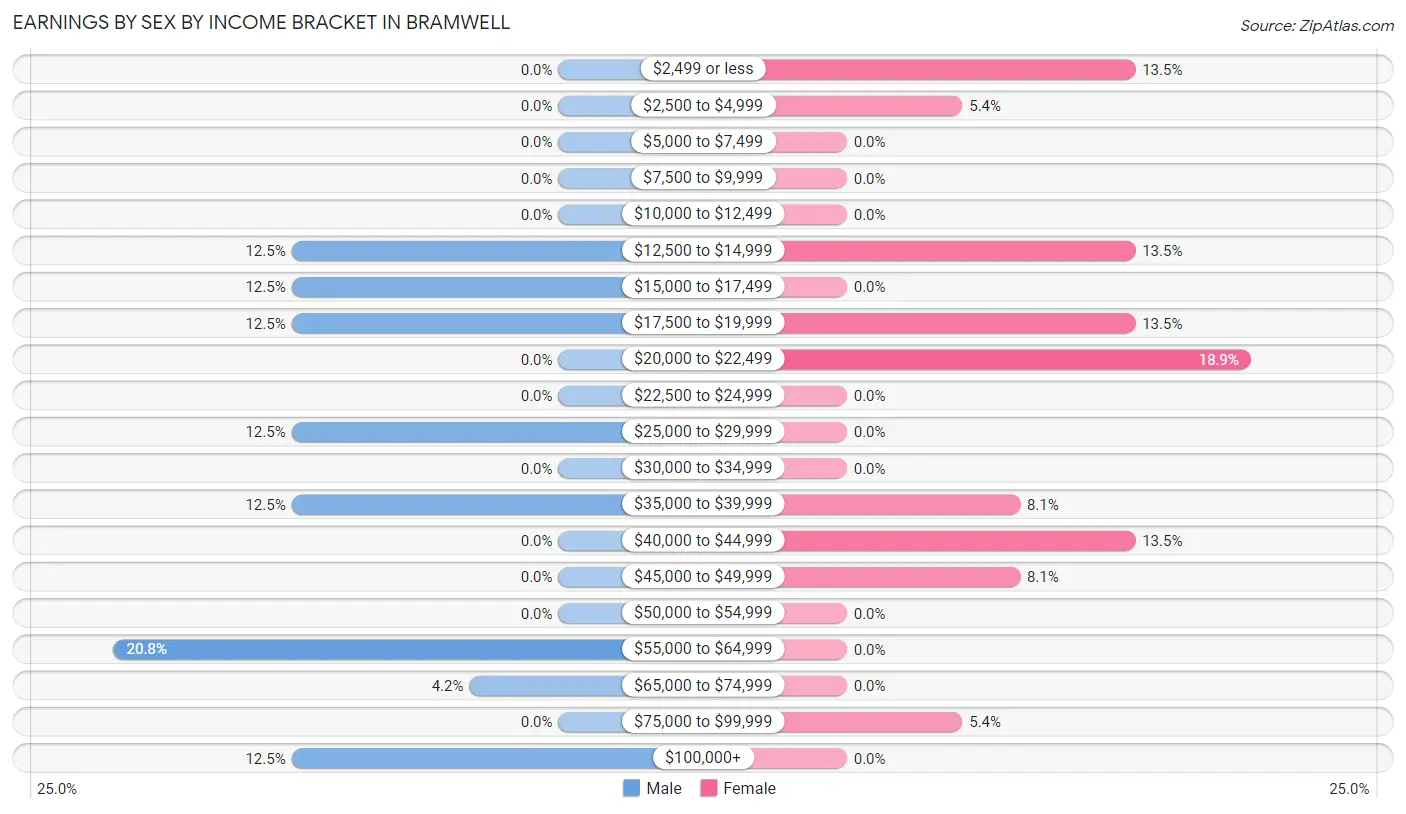
Earnings by Sex by Income Bracket in Bramwell
The most common earnings brackets in Bramwell are $55,000 to $64,999 for men (5 | 20.8%) and $20,000 to $22,499 for women (7 | 18.9%).
| Income | Male | Female |
| $2,499 or less | 0 (0.0%) | 5 (13.5%) |
| $2,500 to $4,999 | 0 (0.0%) | 2 (5.4%) |
| $5,000 to $7,499 | 0 (0.0%) | 0 (0.0%) |
| $7,500 to $9,999 | 0 (0.0%) | 0 (0.0%) |
| $10,000 to $12,499 | 0 (0.0%) | 0 (0.0%) |
| $12,500 to $14,999 | 3 (12.5%) | 5 (13.5%) |
| $15,000 to $17,499 | 3 (12.5%) | 0 (0.0%) |
| $17,500 to $19,999 | 3 (12.5%) | 5 (13.5%) |
| $20,000 to $22,499 | 0 (0.0%) | 7 (18.9%) |
| $22,500 to $24,999 | 0 (0.0%) | 0 (0.0%) |
| $25,000 to $29,999 | 3 (12.5%) | 0 (0.0%) |
| $30,000 to $34,999 | 0 (0.0%) | 0 (0.0%) |
| $35,000 to $39,999 | 3 (12.5%) | 3 (8.1%) |
| $40,000 to $44,999 | 0 (0.0%) | 5 (13.5%) |
| $45,000 to $49,999 | 0 (0.0%) | 3 (8.1%) |
| $50,000 to $54,999 | 0 (0.0%) | 0 (0.0%) |
| $55,000 to $64,999 | 5 (20.8%) | 0 (0.0%) |
| $65,000 to $74,999 | 1 (4.2%) | 0 (0.0%) |
| $75,000 to $99,999 | 0 (0.0%) | 2 (5.4%) |
| $100,000+ | 3 (12.5%) | 0 (0.0%) |
| Total | 24 (100.0%) | 37 (100.0%) |
Earnings by Sex by Educational Attainment in Bramwell
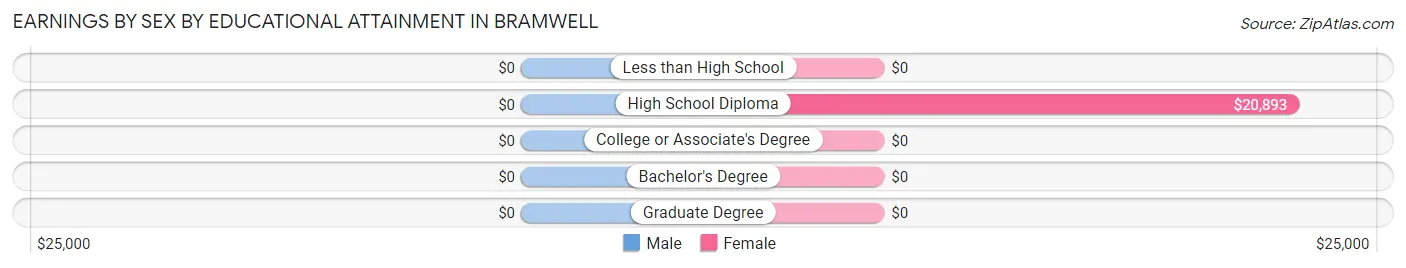
| Educational Attainment | Male Income | Female Income |
| Less than High School | - | - |
| High School Diploma | - | - |
| College or Associate's Degree | - | - |
| Bachelor's Degree | - | - |
| Graduate Degree | - | - |
| Total | - | - |
Family Income in Bramwell
Family Income Brackets in Bramwell
According to the Bramwell family income data, there are 20 families falling into the $50,000 to $74,999 income range, which is the most common income bracket and makes up 29.4% of all families.
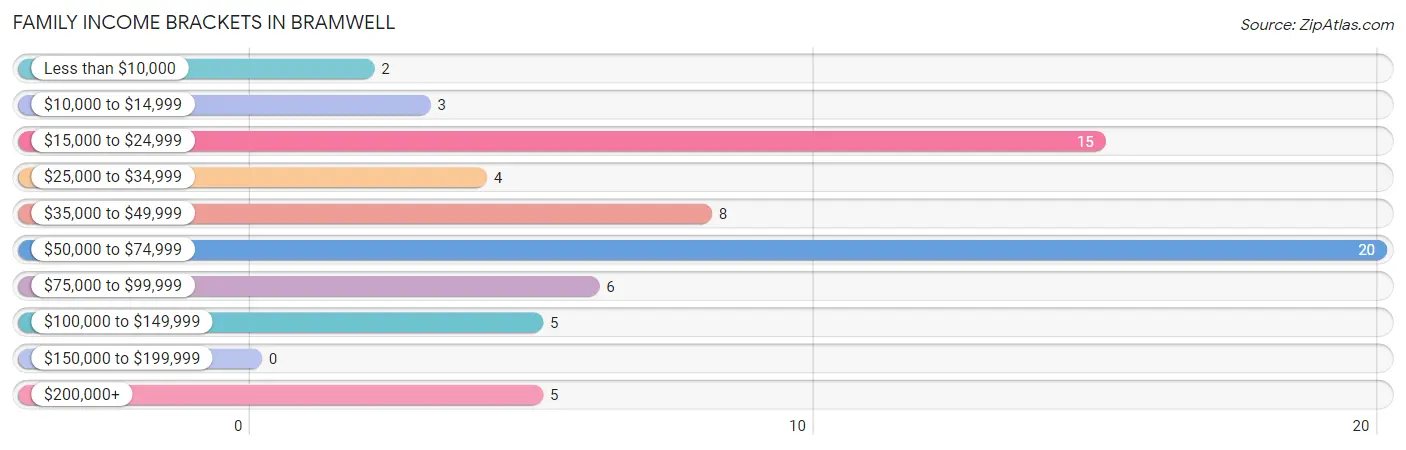
| Income Bracket | # Families | % Families |
| Less than $10,000 | 2 | 2.9% |
| $10,000 to $14,999 | 3 | 4.4% |
| $15,000 to $24,999 | 15 | 22.1% |
| $25,000 to $34,999 | 4 | 5.9% |
| $35,000 to $49,999 | 8 | 11.8% |
| $50,000 to $74,999 | 20 | 29.4% |
| $75,000 to $99,999 | 6 | 8.8% |
| $100,000 to $149,999 | 5 | 7.4% |
| $150,000 to $199,999 | 0 | 0.0% |
| $200,000+ | 5 | 7.4% |
Family Income by Famaliy Size in Bramwell
3-person families (15 | 22.1%) account for the highest median family income in Bramwell with $60,469 per family, while 3-person families (15 | 22.1%) have the highest median income of $20,156 per family member.
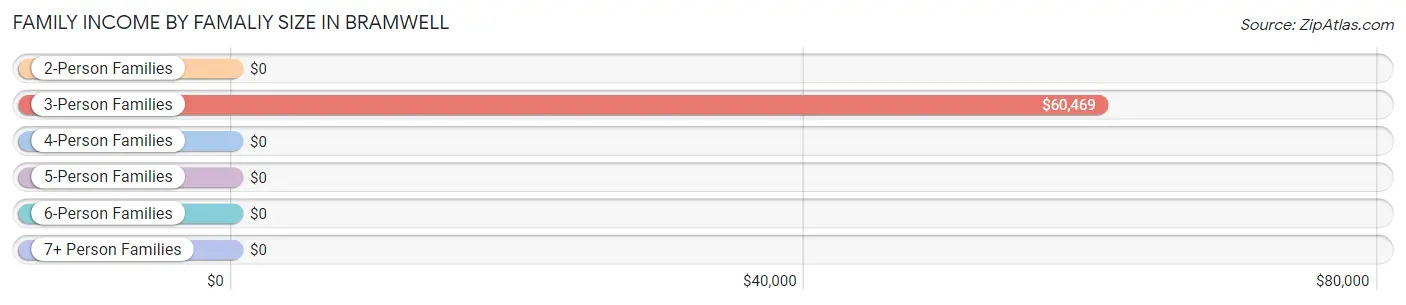
| Income Bracket | # Families | Median Income |
| 2-Person Families | 46 (67.6%) | $0 |
| 3-Person Families | 15 (22.1%) | $60,469 |
| 4-Person Families | 7 (10.3%) | $0 |
| 5-Person Families | 0 (0.0%) | $0 |
| 6-Person Families | 0 (0.0%) | $0 |
| 7+ Person Families | 0 (0.0%) | $0 |
| Total | 68 (100.0%) | $56,667 |
Family Income by Number of Earners in Bramwell
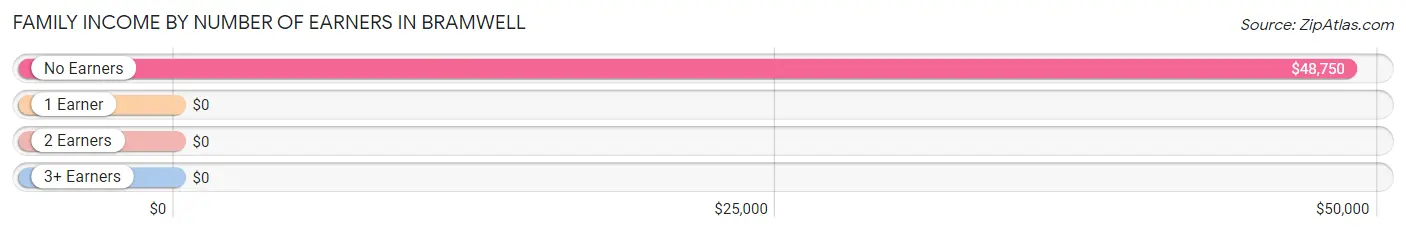
| Number of Earners | # Families | Median Income |
| No Earners | 23 (33.8%) | $48,750 |
| 1 Earner | 25 (36.8%) | $0 |
| 2 Earners | 20 (29.4%) | $0 |
| 3+ Earners | 0 (0.0%) | $0 |
| Total | 68 (100.0%) | $56,667 |
Household Income in Bramwell
Household Income Brackets in Bramwell
With 24 households falling in the category, the $50,000 to $74,999 income range is the most frequent in Bramwell, accounting for 28.2% of all households.
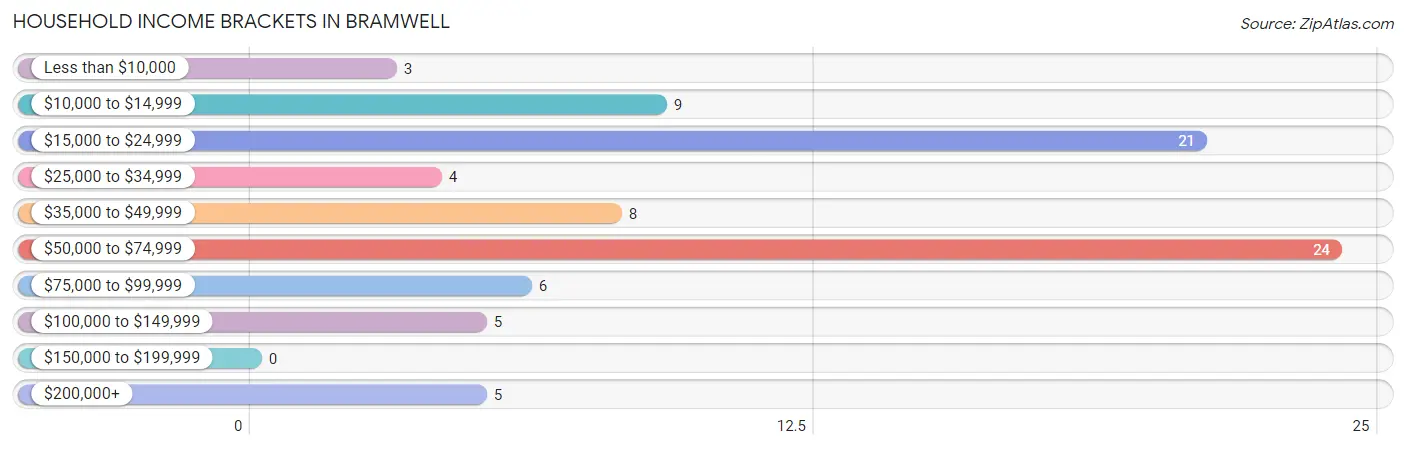
| Income Bracket | # Households | % Households |
| Less than $10,000 | 3 | 3.5% |
| $10,000 to $14,999 | 9 | 10.6% |
| $15,000 to $24,999 | 21 | 24.7% |
| $25,000 to $34,999 | 4 | 4.7% |
| $35,000 to $49,999 | 8 | 9.4% |
| $50,000 to $74,999 | 24 | 28.2% |
| $75,000 to $99,999 | 6 | 7.1% |
| $100,000 to $149,999 | 5 | 5.9% |
| $150,000 to $199,999 | 0 | 0.0% |
| $200,000+ | 5 | 5.9% |
Household Income by Householder Age in Bramwell
The median household income in Bramwell is $48,750, with the highest median household income of $60,156 found in the 65+ years age bracket for the primary householder. A total of 47 households (55.3%) fall into this category.
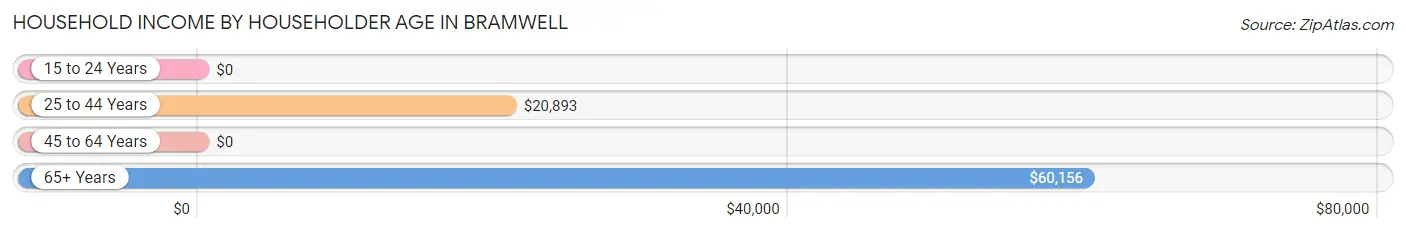
| Income Bracket | # Households | Median Income |
| 15 to 24 Years | 0 (0.0%) | $0 |
| 25 to 44 Years | 15 (17.6%) | $20,893 |
| 45 to 64 Years | 23 (27.1%) | $0 |
| 65+ Years | 47 (55.3%) | $60,156 |
| Total | 85 (100.0%) | $48,750 |
Poverty in Bramwell
Income Below Poverty by Sex and Age in Bramwell
With 29.4% poverty level for males and 19.2% for females among the residents of Bramwell, 12 to 14 year old males and 75 year old and over females are the most vulnerable to poverty, with 6 males (100.0%) and 7 females (35.0%) in their respective age groups living below the poverty level.
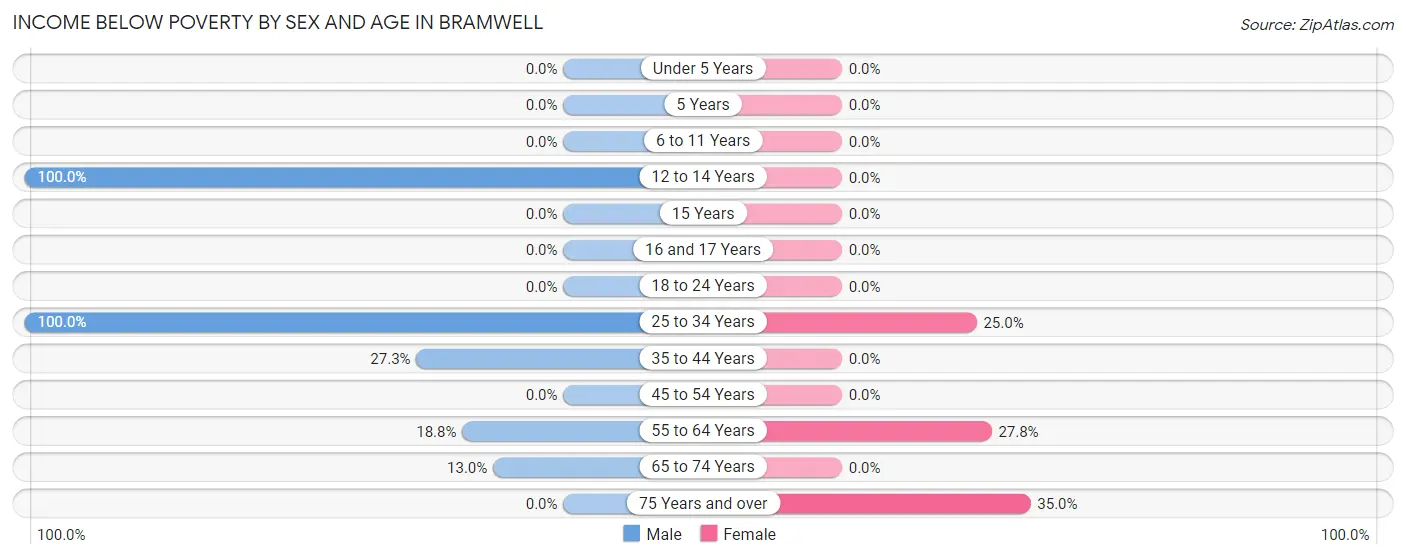
| Age Bracket | Male | Female |
| Under 5 Years | 0 (0.0%) | 0 (0.0%) |
| 5 Years | 0 (0.0%) | 0 (0.0%) |
| 6 to 11 Years | 0 (0.0%) | 0 (0.0%) |
| 12 to 14 Years | 6 (100.0%) | 0 (0.0%) |
| 15 Years | 0 (0.0%) | 0 (0.0%) |
| 16 and 17 Years | 0 (0.0%) | 0 (0.0%) |
| 18 to 24 Years | 0 (0.0%) | 0 (0.0%) |
| 25 to 34 Years | 15 (100.0%) | 3 (25.0%) |
| 35 to 44 Years | 3 (27.3%) | 0 (0.0%) |
| 45 to 54 Years | 0 (0.0%) | 0 (0.0%) |
| 55 to 64 Years | 3 (18.8%) | 5 (27.8%) |
| 65 to 74 Years | 3 (13.0%) | 0 (0.0%) |
| 75 Years and over | 0 (0.0%) | 7 (35.0%) |
| Total | 30 (29.4%) | 15 (19.2%) |
Income Above Poverty by Sex and Age in Bramwell
According to the poverty statistics in Bramwell, males aged under 5 years and females aged 6 to 11 years are the age groups that are most secure financially, with 100.0% of males and 100.0% of females in these age groups living above the poverty line.
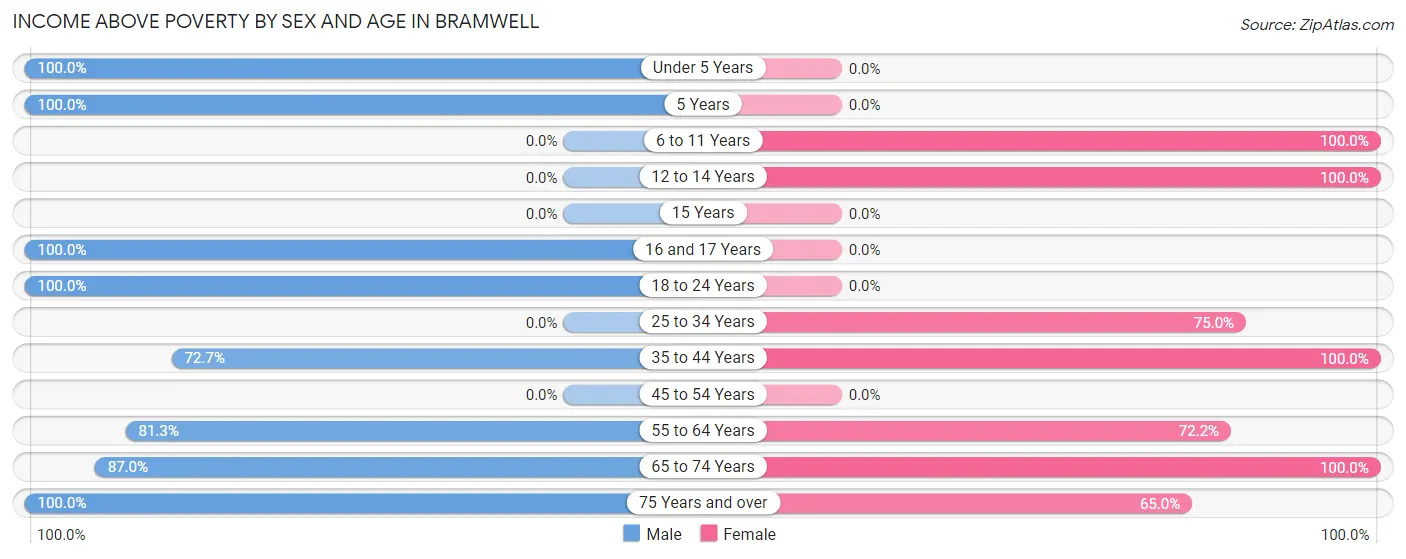
| Age Bracket | Male | Female |
| Under 5 Years | 3 (100.0%) | 0 (0.0%) |
| 5 Years | 3 (100.0%) | 0 (0.0%) |
| 6 to 11 Years | 0 (0.0%) | 3 (100.0%) |
| 12 to 14 Years | 0 (0.0%) | 1 (100.0%) |
| 15 Years | 0 (0.0%) | 0 (0.0%) |
| 16 and 17 Years | 5 (100.0%) | 0 (0.0%) |
| 18 to 24 Years | 3 (100.0%) | 0 (0.0%) |
| 25 to 34 Years | 0 (0.0%) | 9 (75.0%) |
| 35 to 44 Years | 8 (72.7%) | 8 (100.0%) |
| 45 to 54 Years | 0 (0.0%) | 0 (0.0%) |
| 55 to 64 Years | 13 (81.2%) | 13 (72.2%) |
| 65 to 74 Years | 20 (87.0%) | 16 (100.0%) |
| 75 Years and over | 17 (100.0%) | 13 (65.0%) |
| Total | 72 (70.6%) | 63 (80.8%) |
Income Below Poverty Among Married-Couple Families in Bramwell
The poverty statistics for married-couple families in Bramwell show that 10.0% or 5 of the total 50 families live below the poverty line. Families with no children have the highest poverty rate of 11.1%, comprising of 5 families. On the other hand, families with 1 or 2 children have the lowest poverty rate of 0.0%, which includes 0 families.
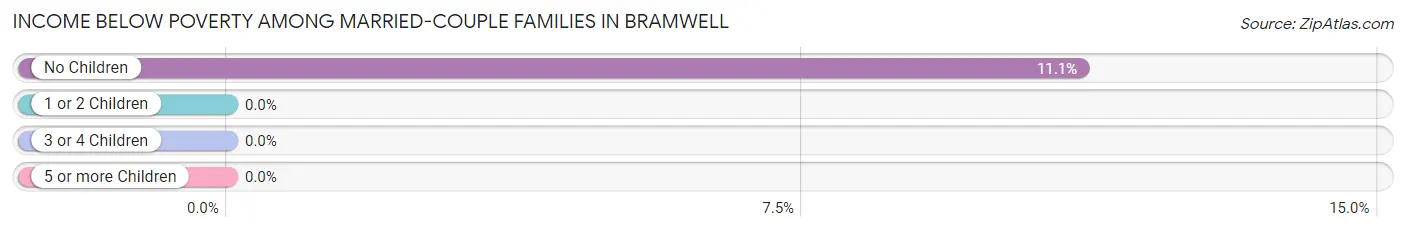
| Children | Above Poverty | Below Poverty |
| No Children | 40 (88.9%) | 5 (11.1%) |
| 1 or 2 Children | 5 (100.0%) | 0 (0.0%) |
| 3 or 4 Children | 0 (0.0%) | 0 (0.0%) |
| 5 or more Children | 0 (0.0%) | 0 (0.0%) |
| Total | 45 (90.0%) | 5 (10.0%) |
Income Below Poverty Among Single-Parent Households in Bramwell
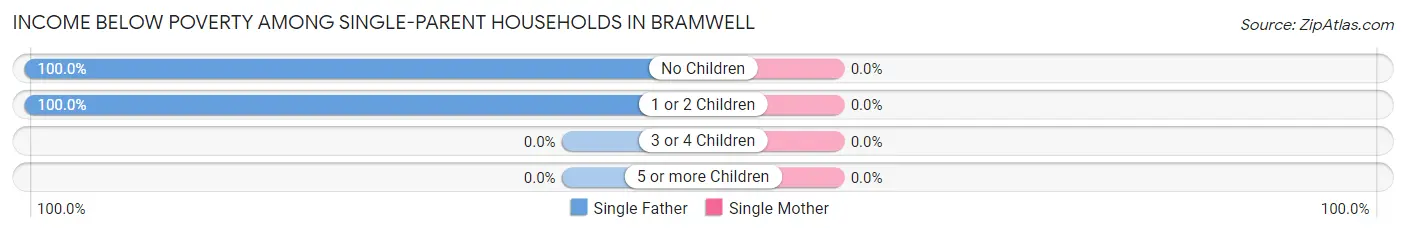
| Children | Single Father | Single Mother |
| No Children | 3 (100.0%) | 0 (0.0%) |
| 1 or 2 Children | 5 (100.0%) | 0 (0.0%) |
| 3 or 4 Children | 0 (0.0%) | 0 (0.0%) |
| 5 or more Children | 0 (0.0%) | 0 (0.0%) |
| Total | 8 (100.0%) | 0 (0.0%) |
Income Below Poverty Among Married-Couple vs Single-Parent Households in Bramwell
The poverty data for Bramwell shows that 5 of the married-couple family households (10.0%) and 8 of the single-parent households (44.4%) are living below the poverty level. Within the married-couple family households, those with no children have the highest poverty rate, with 5 households (11.1%) falling below the poverty line. Among the single-parent households, those with no children have the highest poverty rate, with 3 household (100.0%) living below poverty.
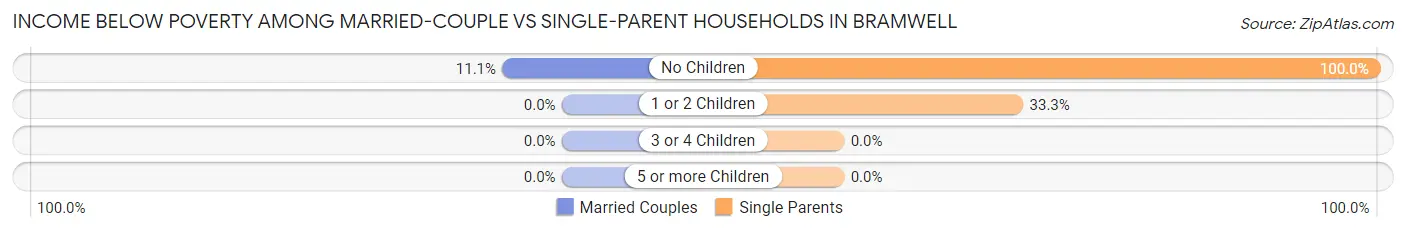
| Children | Married-Couple Families | Single-Parent Households |
| No Children | 5 (11.1%) | 3 (100.0%) |
| 1 or 2 Children | 0 (0.0%) | 5 (33.3%) |
| 3 or 4 Children | 0 (0.0%) | 0 (0.0%) |
| 5 or more Children | 0 (0.0%) | 0 (0.0%) |
| Total | 5 (10.0%) | 8 (44.4%) |
Race in Bramwell
The most populous races in Bramwell are White / Caucasian (136 | 75.6%), Black / African American (44 | 24.4%), and Hispanic or Latino (5 | 2.8%).
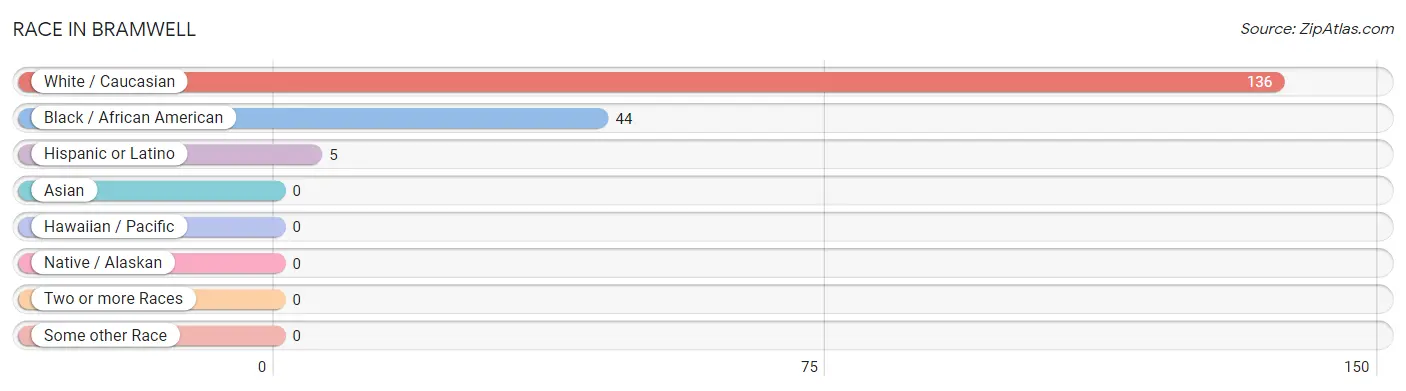
| Race | # Population | % Population |
| Asian | 0 | 0.0% |
| Black / African American | 44 | 24.4% |
| Hawaiian / Pacific | 0 | 0.0% |
| Hispanic or Latino | 5 | 2.8% |
| Native / Alaskan | 0 | 0.0% |
| White / Caucasian | 136 | 75.6% |
| Two or more Races | 0 | 0.0% |
| Some other Race | 0 | 0.0% |
| Total | 180 | 100.0% |
Ancestry in Bramwell
The most populous ancestries reported in Bramwell are Irish (27 | 15.0%), German (24 | 13.3%), English (15 | 8.3%), Italian (15 | 8.3%), and European (10 | 5.6%), together accounting for 50.5% of all Bramwell residents.
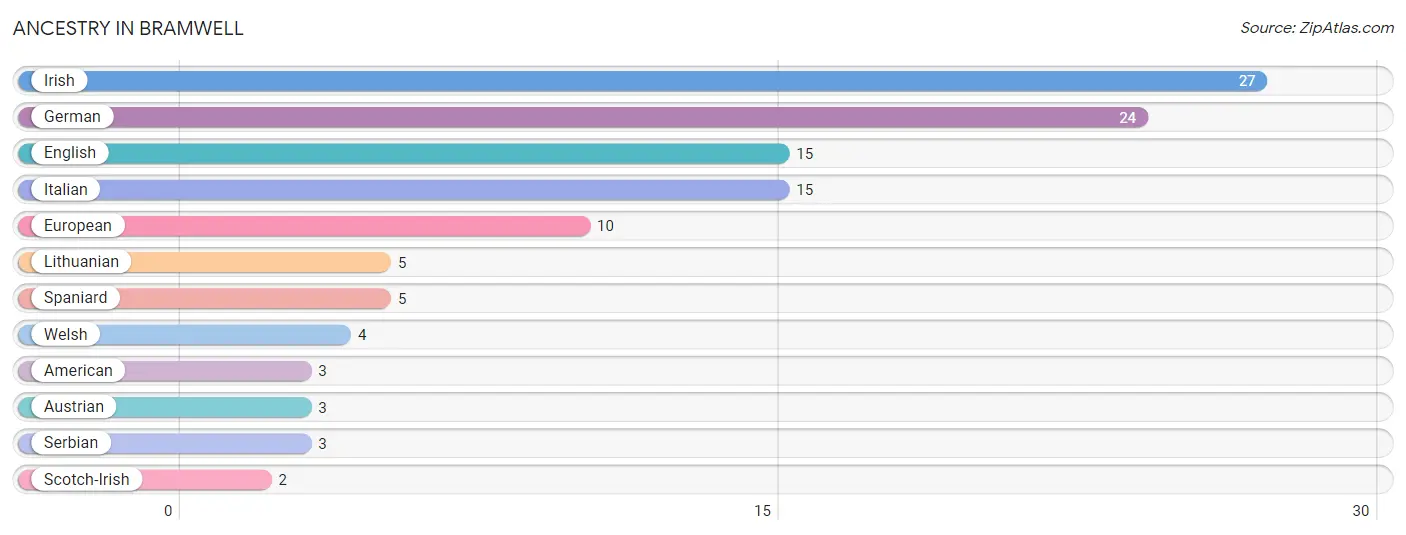
| Ancestry | # Population | % Population |
| American | 3 | 1.7% |
| Austrian | 3 | 1.7% |
| English | 15 | 8.3% |
| European | 10 | 5.6% |
| German | 24 | 13.3% |
| Irish | 27 | 15.0% |
| Italian | 15 | 8.3% |
| Lithuanian | 5 | 2.8% |
| Scotch-Irish | 2 | 1.1% |
| Serbian | 3 | 1.7% |
| Spaniard | 5 | 2.8% |
| Welsh | 4 | 2.2% | View All 12 Rows |
Immigrants in Bramwell

| Immigration Origin | # Population | % Population | View All 0 Rows |
Sex and Age in Bramwell
Sex and Age in Bramwell
The most populous age groups in Bramwell are 70 to 74 Years (20 | 19.6%) for men and 85 Years and over (14 | 17.9%) for women.
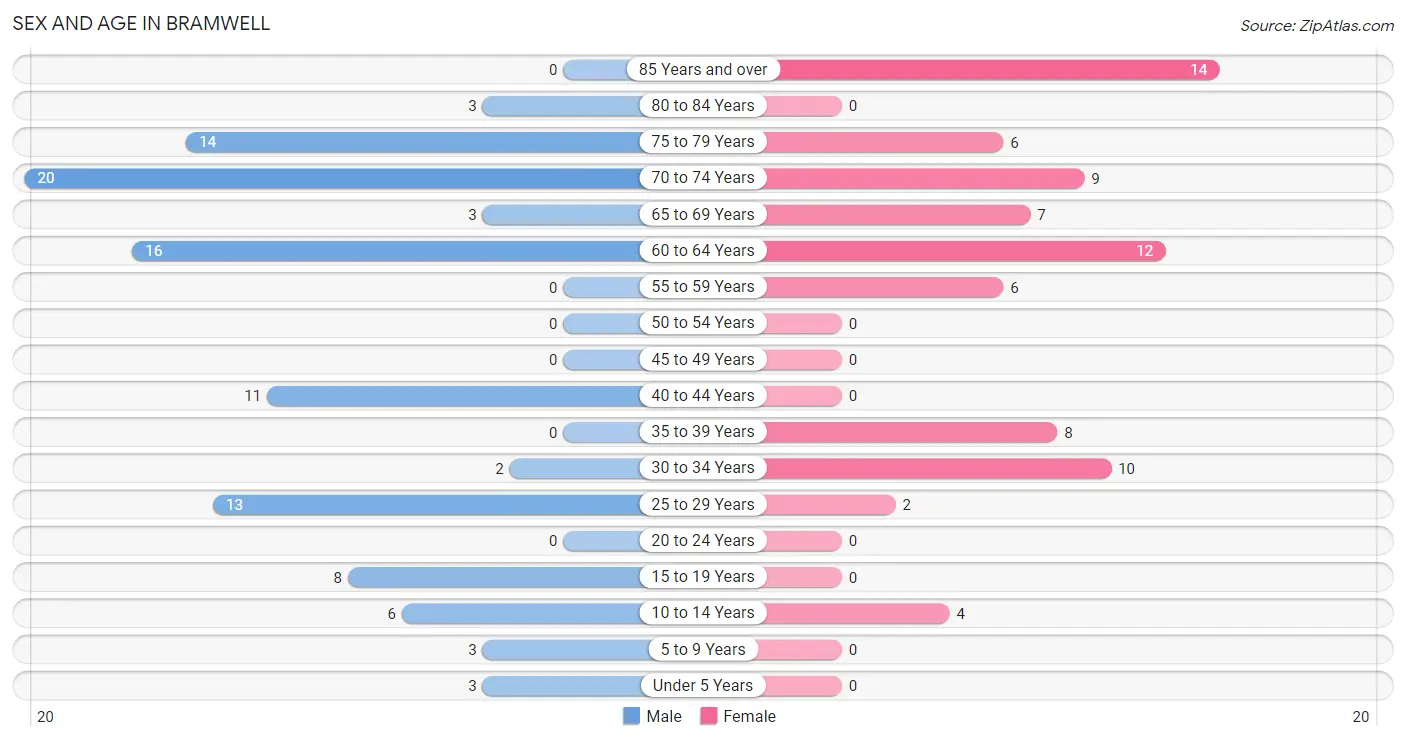
| Age Bracket | Male | Female |
| Under 5 Years | 3 (2.9%) | 0 (0.0%) |
| 5 to 9 Years | 3 (2.9%) | 0 (0.0%) |
| 10 to 14 Years | 6 (5.9%) | 4 (5.1%) |
| 15 to 19 Years | 8 (7.8%) | 0 (0.0%) |
| 20 to 24 Years | 0 (0.0%) | 0 (0.0%) |
| 25 to 29 Years | 13 (12.8%) | 2 (2.6%) |
| 30 to 34 Years | 2 (2.0%) | 10 (12.8%) |
| 35 to 39 Years | 0 (0.0%) | 8 (10.3%) |
| 40 to 44 Years | 11 (10.8%) | 0 (0.0%) |
| 45 to 49 Years | 0 (0.0%) | 0 (0.0%) |
| 50 to 54 Years | 0 (0.0%) | 0 (0.0%) |
| 55 to 59 Years | 0 (0.0%) | 6 (7.7%) |
| 60 to 64 Years | 16 (15.7%) | 12 (15.4%) |
| 65 to 69 Years | 3 (2.9%) | 7 (9.0%) |
| 70 to 74 Years | 20 (19.6%) | 9 (11.5%) |
| 75 to 79 Years | 14 (13.7%) | 6 (7.7%) |
| 80 to 84 Years | 3 (2.9%) | 0 (0.0%) |
| 85 Years and over | 0 (0.0%) | 14 (17.9%) |
| Total | 102 (100.0%) | 78 (100.0%) |
Families and Households in Bramwell
Median Family Size in Bramwell
The median family size in Bramwell is 2.35 persons per family, with single male/father families (8 | 11.8%) accounting for the largest median family size of 3.38 persons per family. On the other hand, single female/mother families (10 | 14.7%) represent the smallest median family size with 2.10 persons per family.
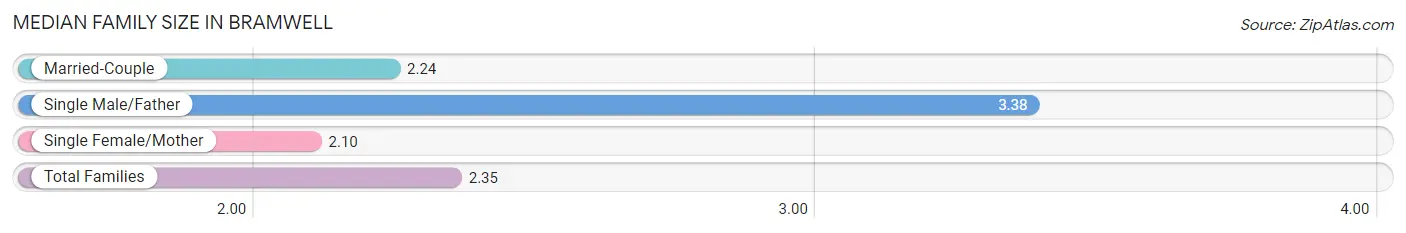
| Family Type | # Families | Family Size |
| Married-Couple | 50 (73.5%) | 2.24 |
| Single Male/Father | 8 (11.8%) | 3.38 |
| Single Female/Mother | 10 (14.7%) | 2.10 |
| Total Families | 68 (100.0%) | 2.35 |
Median Household Size in Bramwell
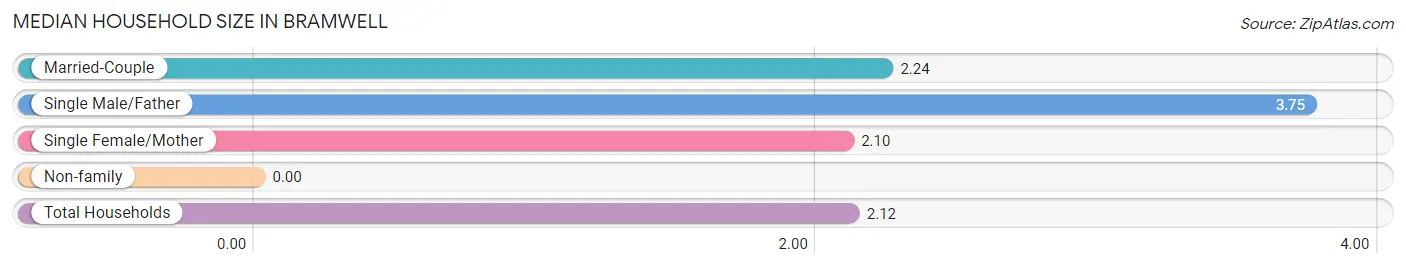
| Household Type | # Households | Household Size |
| Married-Couple | 50 (58.8%) | 2.24 |
| Single Male/Father | 8 (9.4%) | 3.75 |
| Single Female/Mother | 10 (11.8%) | 2.10 |
| Non-family | 17 (20.0%) | - |
| Total Households | 85 (100.0%) | 2.12 |
Household Size by Marriage Status in Bramwell
Out of a total of 85 households in Bramwell, 68 (80.0%) are family households, while 17 (20.0%) are nonfamily households. The most numerous type of family households are 2-person households, comprising 44, and the most common type of nonfamily households are 1-person households, comprising 17.
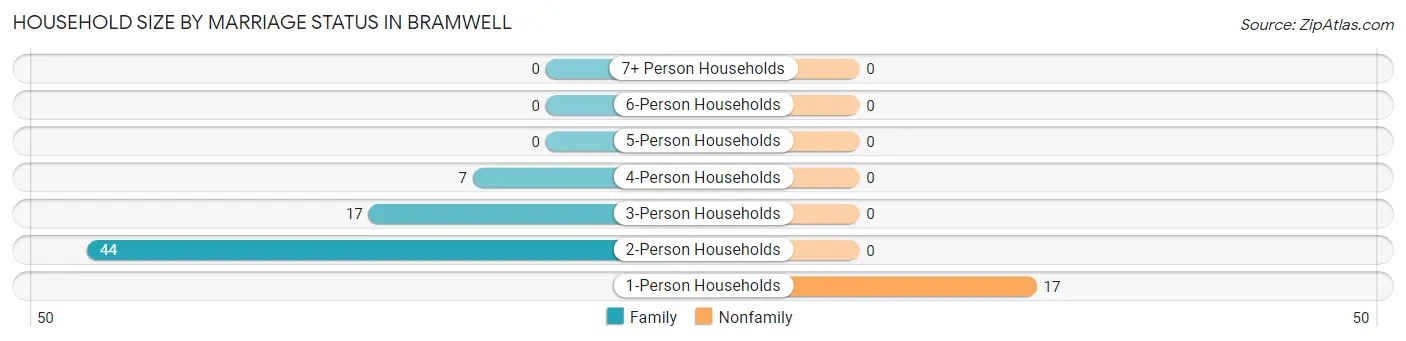
| Household Size | Family Households | Nonfamily Households |
| 1-Person Households | - | 17 (20.0%) |
| 2-Person Households | 44 (51.8%) | 0 (0.0%) |
| 3-Person Households | 17 (20.0%) | 0 (0.0%) |
| 4-Person Households | 7 (8.2%) | 0 (0.0%) |
| 5-Person Households | 0 (0.0%) | 0 (0.0%) |
| 6-Person Households | 0 (0.0%) | 0 (0.0%) |
| 7+ Person Households | 0 (0.0%) | 0 (0.0%) |
| Total | 68 (80.0%) | 17 (20.0%) |
Female Fertility in Bramwell
Fertility by Age in Bramwell
| Age Bracket | Women with Births | Births / 1,000 Women |
| 15 to 19 years | 0 (0.0%) | 0.0 |
| 20 to 34 years | 0 (0.0%) | 0.0 |
| 35 to 50 years | 0 (0.0%) | 0.0 |
| Total | 0 (0.0%) | 0.0 |
Fertility by Age by Marriage Status in Bramwell
| Age Bracket | Married | Unmarried |
| 15 to 19 years | 0 (0.0%) | 0 (0.0%) |
| 20 to 34 years | 0 (0.0%) | 0 (0.0%) |
| 35 to 50 years | 0 (0.0%) | 0 (0.0%) |
| Total | 0 (0.0%) | 0 (0.0%) |
Fertility by Education in Bramwell
| Educational Attainment | Women with Births | Births / 1,000 Women |
| Less than High School | 0 (0.0%) | 0.0 |
| High School Diploma | 0 (0.0%) | 0.0 |
| College or Associate's Degree | 0 (0.0%) | 0.0 |
| Bachelor's Degree | 0 (0.0%) | 0.0 |
| Graduate Degree | 0 (0.0%) | 0.0 |
| Total | 0 (0.0%) | 0.0 |
Fertility by Education by Marriage Status in Bramwell
| Educational Attainment | Married | Unmarried |
| Less than High School | 0 (0.0%) | 0 (0.0%) |
| High School Diploma | 0 (0.0%) | 0 (0.0%) |
| College or Associate's Degree | 0 (0.0%) | 0 (0.0%) |
| Bachelor's Degree | 0 (0.0%) | 0 (0.0%) |
| Graduate Degree | 0 (0.0%) | 0 (0.0%) |
| Total | 0 (0.0%) | 0 (0.0%) |
Employment Characteristics in Bramwell
Employment by Class of Employer in Bramwell
Among the 46 employed individuals in Bramwell, private company employees (20 | 43.5%), not-for-profit organizations (15 | 32.6%), and self-employed (incorporated) (6 | 13.0%) make up the most common classes of employment.
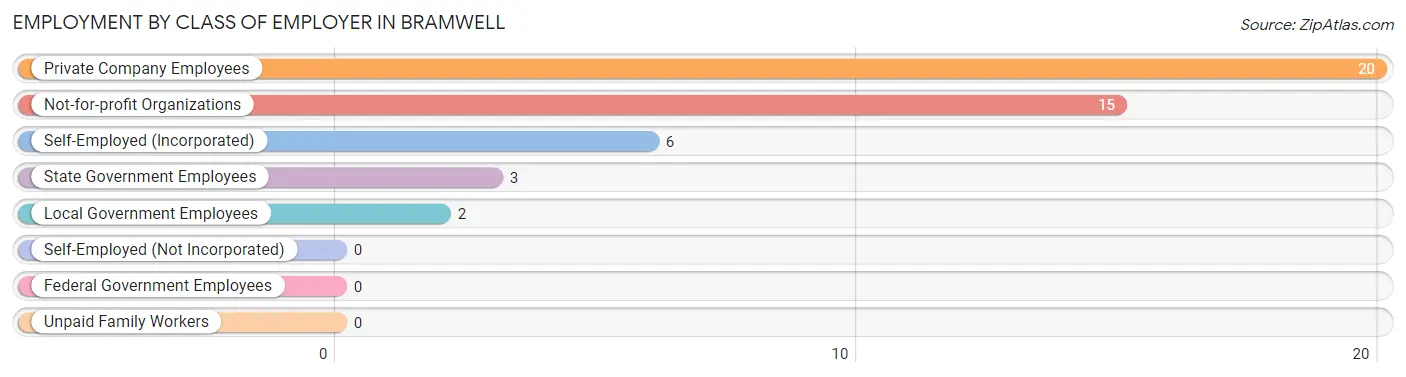
| Employer Class | # Employees | % Employees |
| Private Company Employees | 20 | 43.5% |
| Self-Employed (Incorporated) | 6 | 13.0% |
| Self-Employed (Not Incorporated) | 0 | 0.0% |
| Not-for-profit Organizations | 15 | 32.6% |
| Local Government Employees | 2 | 4.3% |
| State Government Employees | 3 | 6.5% |
| Federal Government Employees | 0 | 0.0% |
| Unpaid Family Workers | 0 | 0.0% |
| Total | 46 | 100.0% |
Employment Status by Age in Bramwell
According to the labor force statistics for Bramwell, out of the total population over 16 years of age (164), 37.2% or 61 individuals are in the labor force, with 24.6% or 15 of them unemployed. The age group with the highest labor force participation rate is 35 to 44 years, with 100.0% or 19 individuals in the labor force. Within the labor force, the 16 to 19 years age range has the highest percentage of unemployed individuals, with 100.0% or 5 of them being unemployed.
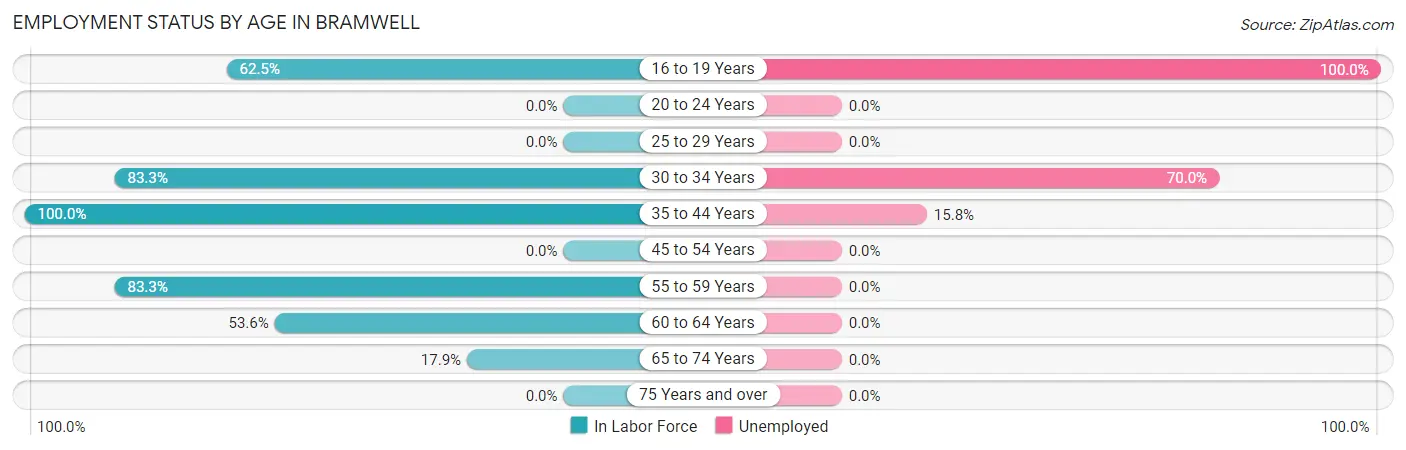
| Age Bracket | In Labor Force | Unemployed |
| 16 to 19 Years | 5 (62.5%) | 5 (100.0%) |
| 20 to 24 Years | 0 (0.0%) | 0 (0.0%) |
| 25 to 29 Years | 0 (0.0%) | 0 (0.0%) |
| 30 to 34 Years | 10 (83.3%) | 7 (70.0%) |
| 35 to 44 Years | 19 (100.0%) | 3 (15.8%) |
| 45 to 54 Years | 0 (0.0%) | 0 (0.0%) |
| 55 to 59 Years | 5 (83.3%) | 0 (0.0%) |
| 60 to 64 Years | 15 (53.6%) | 0 (0.0%) |
| 65 to 74 Years | 7 (17.9%) | 0 (0.0%) |
| 75 Years and over | 0 (0.0%) | 0 (0.0%) |
| Total | 61 (37.2%) | 15 (24.6%) |
Employment Status by Educational Attainment in Bramwell
According to labor force statistics for Bramwell, 61.3% of individuals (49) out of the total population between 25 and 64 years of age (80) are in the labor force, with 20.4% or 10 of them being unemployed. The group with the highest labor force participation rate are those with the educational attainment of bachelor's degree or higher, with 94.7% or 18 individuals in the labor force. Within the labor force, individuals with high school diploma education have the highest percentage of unemployment, with 62.5% or 10 of them being unemployed.
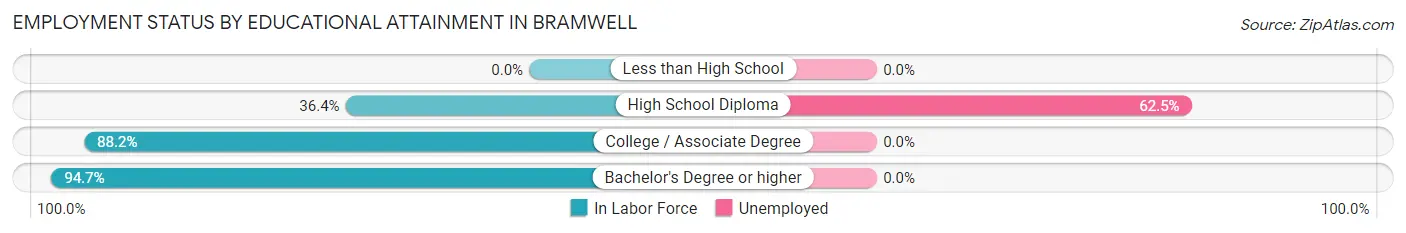
| Educational Attainment | In Labor Force | Unemployed |
| Less than High School | 0 (0.0%) | 0 (0.0%) |
| High School Diploma | 16 (36.4%) | 28 (62.5%) |
| College / Associate Degree | 15 (88.2%) | 0 (0.0%) |
| Bachelor's Degree or higher | 18 (94.7%) | 0 (0.0%) |
| Total | 49 (61.3%) | 16 (20.4%) |
Employment Occupations by Sex in Bramwell
Management, Business, Science and Arts Occupations
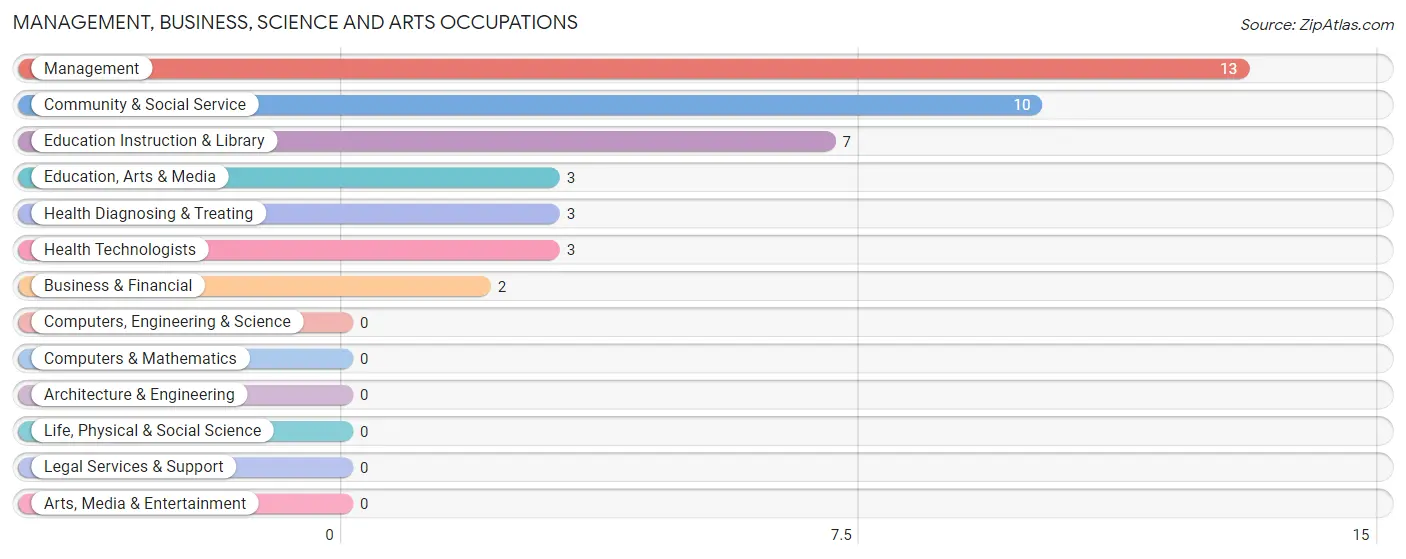
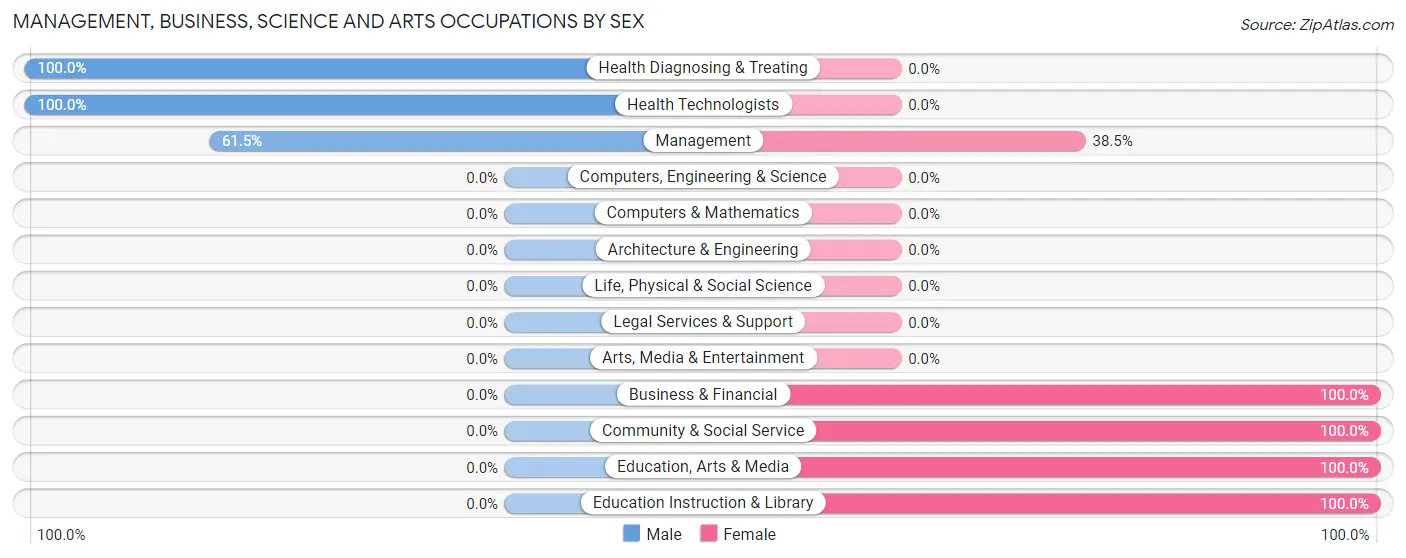
The most common Management, Business, Science and Arts occupations in Bramwell are Management (13 | 28.3%), Community & Social Service (10 | 21.7%), Education Instruction & Library (7 | 15.2%), Education, Arts & Media (3 | 6.5%), and Health Diagnosing & Treating (3 | 6.5%).
Management, Business, Science and Arts Occupations by Sex
Within the Management, Business, Science and Arts occupations in Bramwell, the most male-oriented occupations are Health Diagnosing & Treating (100.0%), Health Technologists (100.0%), and Management (61.5%), while the most female-oriented occupations are Business & Financial (100.0%), Community & Social Service (100.0%), and Education, Arts & Media (100.0%).
| Occupation | Male | Female |
| Management | 8 (61.5%) | 5 (38.5%) |
| Business & Financial | 0 (0.0%) | 2 (100.0%) |
| Computers, Engineering & Science | 0 (0.0%) | 0 (0.0%) |
| Computers & Mathematics | 0 (0.0%) | 0 (0.0%) |
| Architecture & Engineering | 0 (0.0%) | 0 (0.0%) |
| Life, Physical & Social Science | 0 (0.0%) | 0 (0.0%) |
| Community & Social Service | 0 (0.0%) | 10 (100.0%) |
| Education, Arts & Media | 0 (0.0%) | 3 (100.0%) |
| Legal Services & Support | 0 (0.0%) | 0 (0.0%) |
| Education Instruction & Library | 0 (0.0%) | 7 (100.0%) |
| Arts, Media & Entertainment | 0 (0.0%) | 0 (0.0%) |
| Health Diagnosing & Treating | 3 (100.0%) | 0 (0.0%) |
| Health Technologists | 3 (100.0%) | 0 (0.0%) |
| Total (Category) | 11 (39.3%) | 17 (60.7%) |
| Total (Overall) | 18 (39.1%) | 28 (60.9%) |
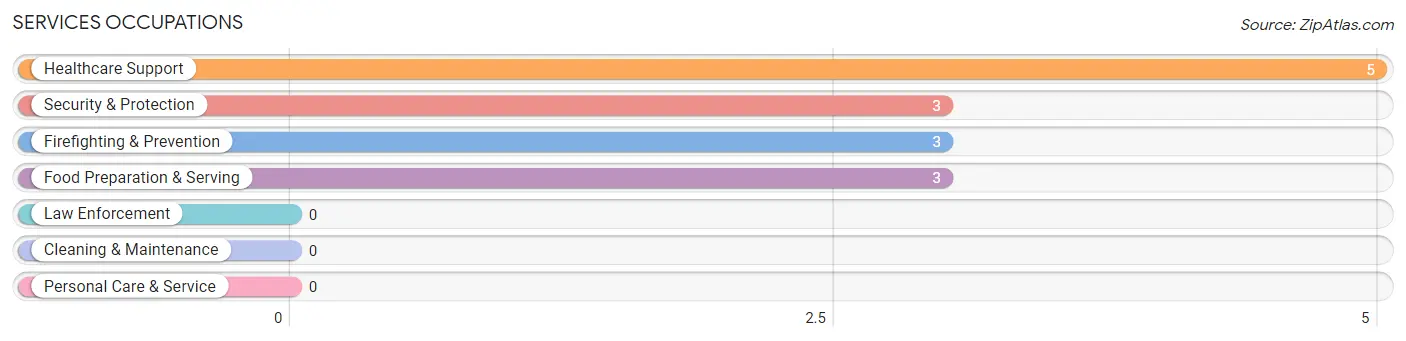
Services Occupations
The most common Services occupations in Bramwell are Healthcare Support (5 | 10.9%), Security & Protection (3 | 6.5%), Firefighting & Prevention (3 | 6.5%), and Food Preparation & Serving (3 | 6.5%).
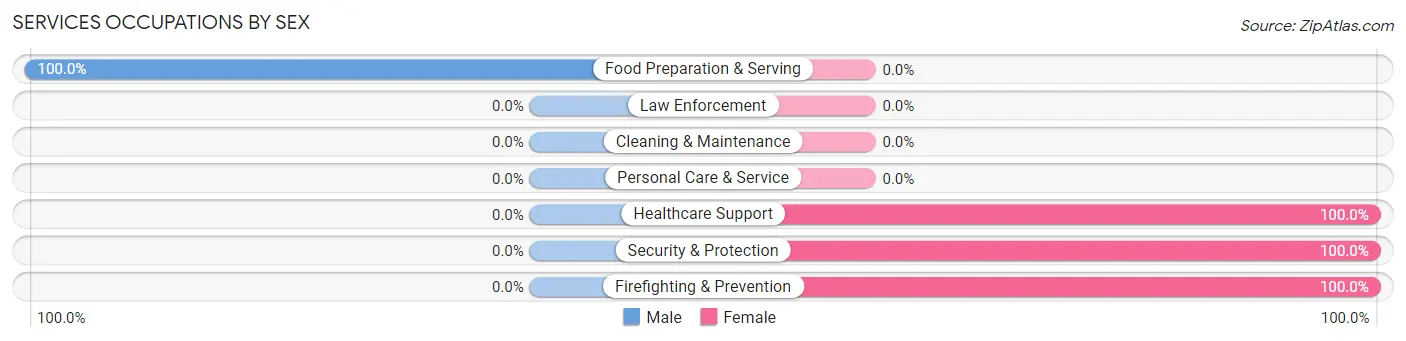
Services Occupations by Sex
| Occupation | Male | Female |
| Healthcare Support | 0 (0.0%) | 5 (100.0%) |
| Security & Protection | 0 (0.0%) | 3 (100.0%) |
| Firefighting & Prevention | 0 (0.0%) | 3 (100.0%) |
| Law Enforcement | 0 (0.0%) | 0 (0.0%) |
| Food Preparation & Serving | 3 (100.0%) | 0 (0.0%) |
| Cleaning & Maintenance | 0 (0.0%) | 0 (0.0%) |
| Personal Care & Service | 0 (0.0%) | 0 (0.0%) |
| Total (Category) | 3 (27.3%) | 8 (72.7%) |
| Total (Overall) | 18 (39.1%) | 28 (60.9%) |
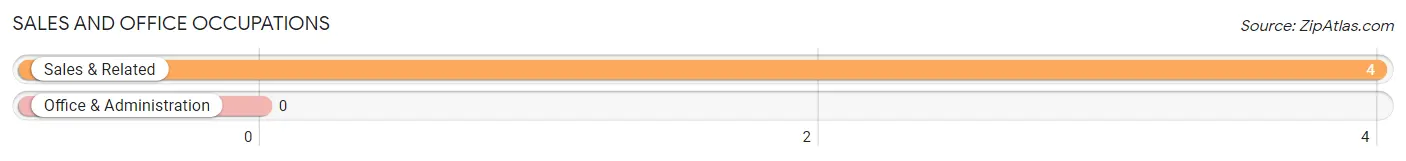
Sales and Office Occupations
The most common Sales and Office occupations in Bramwell are , and Sales & Related (4 | 8.7%).
Sales and Office Occupations by Sex
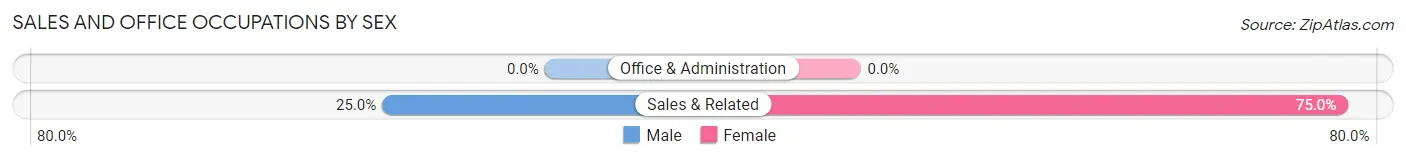
| Occupation | Male | Female |
| Sales & Related | 1 (25.0%) | 3 (75.0%) |
| Office & Administration | 0 (0.0%) | 0 (0.0%) |
| Total (Category) | 1 (25.0%) | 3 (75.0%) |
| Total (Overall) | 18 (39.1%) | 28 (60.9%) |
Natural Resources, Construction and Maintenance Occupations
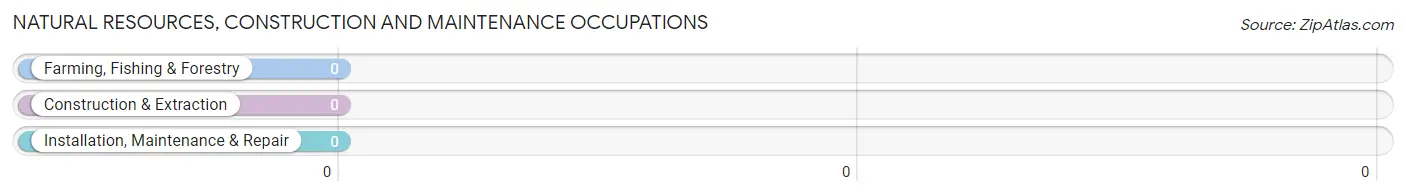
Natural Resources, Construction and Maintenance Occupations by Sex
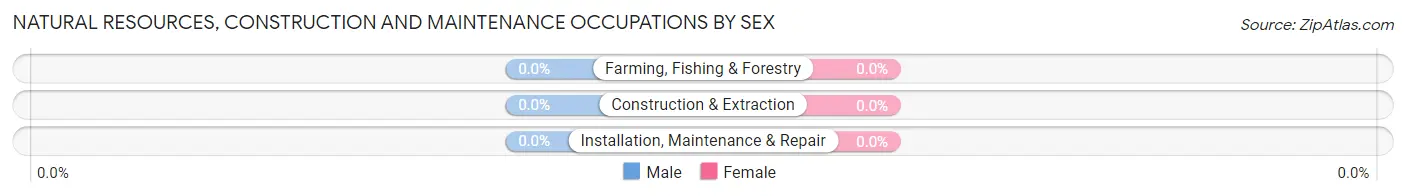
| Occupation | Male | Female |
| Farming, Fishing & Forestry | 0 (0.0%) | 0 (0.0%) |
| Construction & Extraction | 0 (0.0%) | 0 (0.0%) |
| Installation, Maintenance & Repair | 0 (0.0%) | 0 (0.0%) |
| Total (Category) | 0 (0.0%) | 0 (0.0%) |
| Total (Overall) | 18 (39.1%) | 28 (60.9%) |
Production, Transportation and Moving Occupations
The most common Production, Transportation and Moving occupations in Bramwell are , and Production (3 | 6.5%).
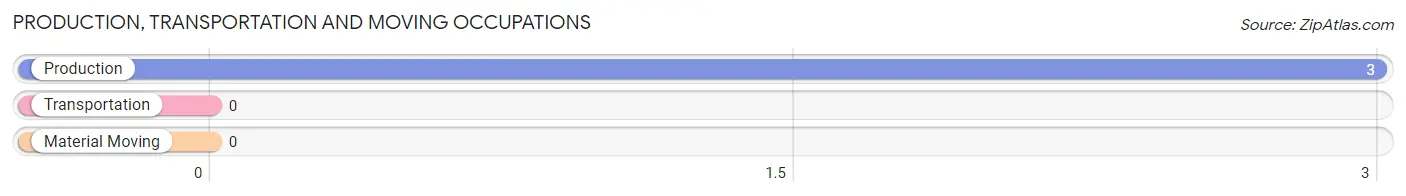
Production, Transportation and Moving Occupations by Sex
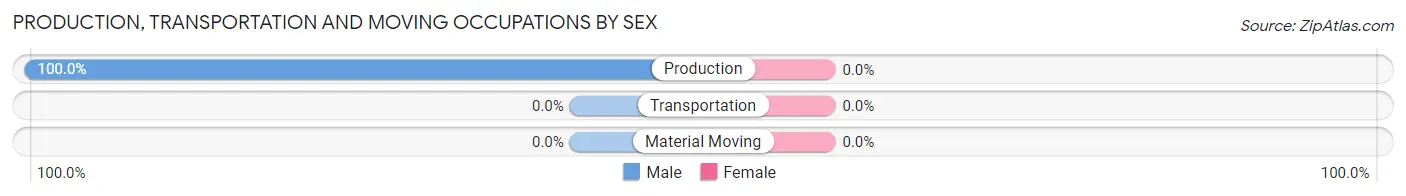
| Occupation | Male | Female |
| Production | 3 (100.0%) | 0 (0.0%) |
| Transportation | 0 (0.0%) | 0 (0.0%) |
| Material Moving | 0 (0.0%) | 0 (0.0%) |
| Total (Category) | 3 (100.0%) | 0 (0.0%) |
| Total (Overall) | 18 (39.1%) | 28 (60.9%) |
Employment Industries by Sex in Bramwell
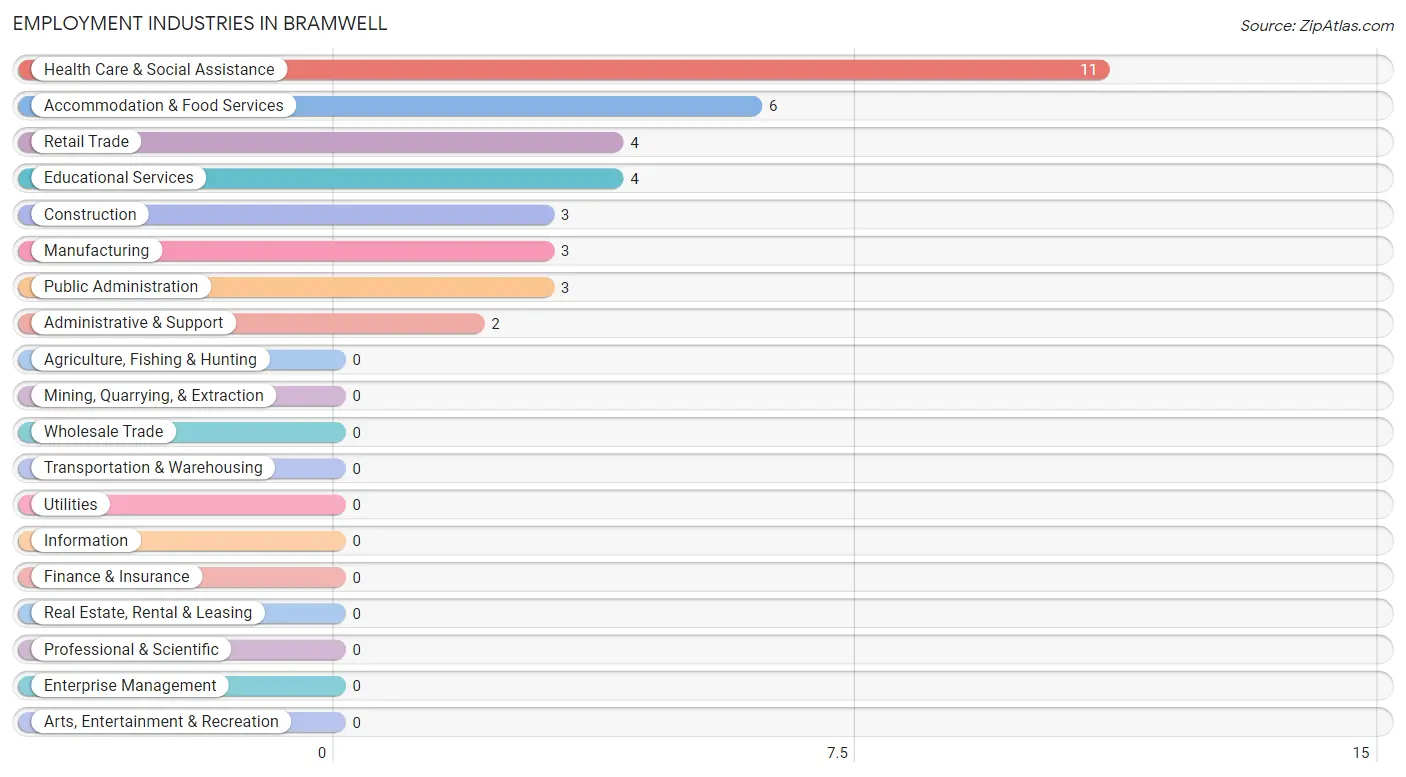
Employment Industries in Bramwell
The major employment industries in Bramwell include Health Care & Social Assistance (11 | 23.9%), Accommodation & Food Services (6 | 13.0%), Retail Trade (4 | 8.7%), Educational Services (4 | 8.7%), and Construction (3 | 6.5%).
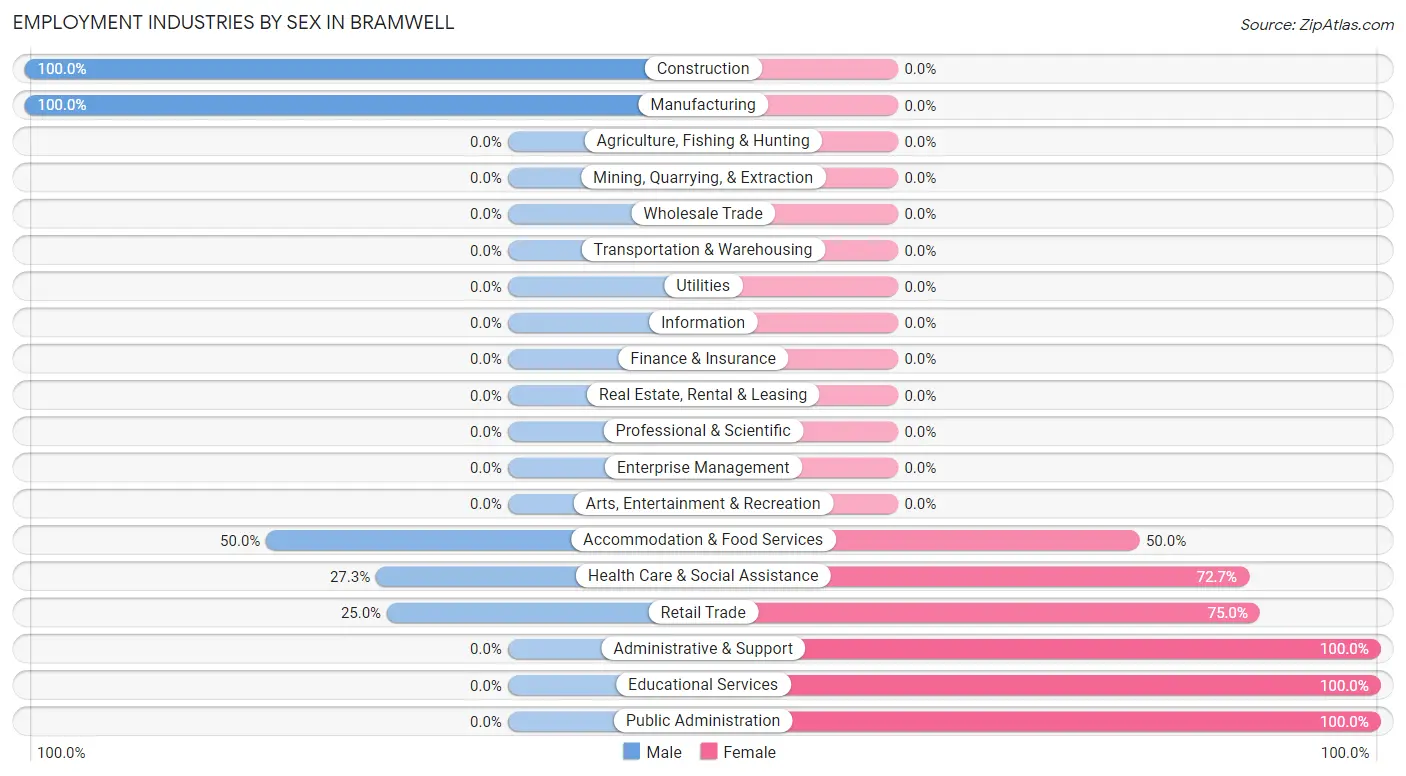
Employment Industries by Sex in Bramwell
The Bramwell industries that see more men than women are Construction (100.0%), Manufacturing (100.0%), and Accommodation & Food Services (50.0%), whereas the industries that tend to have a higher number of women are Administrative & Support (100.0%), Educational Services (100.0%), and Public Administration (100.0%).
| Industry | Male | Female |
| Agriculture, Fishing & Hunting | 0 (0.0%) | 0 (0.0%) |
| Mining, Quarrying, & Extraction | 0 (0.0%) | 0 (0.0%) |
| Construction | 3 (100.0%) | 0 (0.0%) |
| Manufacturing | 3 (100.0%) | 0 (0.0%) |
| Wholesale Trade | 0 (0.0%) | 0 (0.0%) |
| Retail Trade | 1 (25.0%) | 3 (75.0%) |
| Transportation & Warehousing | 0 (0.0%) | 0 (0.0%) |
| Utilities | 0 (0.0%) | 0 (0.0%) |
| Information | 0 (0.0%) | 0 (0.0%) |
| Finance & Insurance | 0 (0.0%) | 0 (0.0%) |
| Real Estate, Rental & Leasing | 0 (0.0%) | 0 (0.0%) |
| Professional & Scientific | 0 (0.0%) | 0 (0.0%) |
| Enterprise Management | 0 (0.0%) | 0 (0.0%) |
| Administrative & Support | 0 (0.0%) | 2 (100.0%) |
| Educational Services | 0 (0.0%) | 4 (100.0%) |
| Health Care & Social Assistance | 3 (27.3%) | 8 (72.7%) |
| Arts, Entertainment & Recreation | 0 (0.0%) | 0 (0.0%) |
| Accommodation & Food Services | 3 (50.0%) | 3 (50.0%) |
| Public Administration | 0 (0.0%) | 3 (100.0%) |
| Total | 18 (39.1%) | 28 (60.9%) |
Education in Bramwell
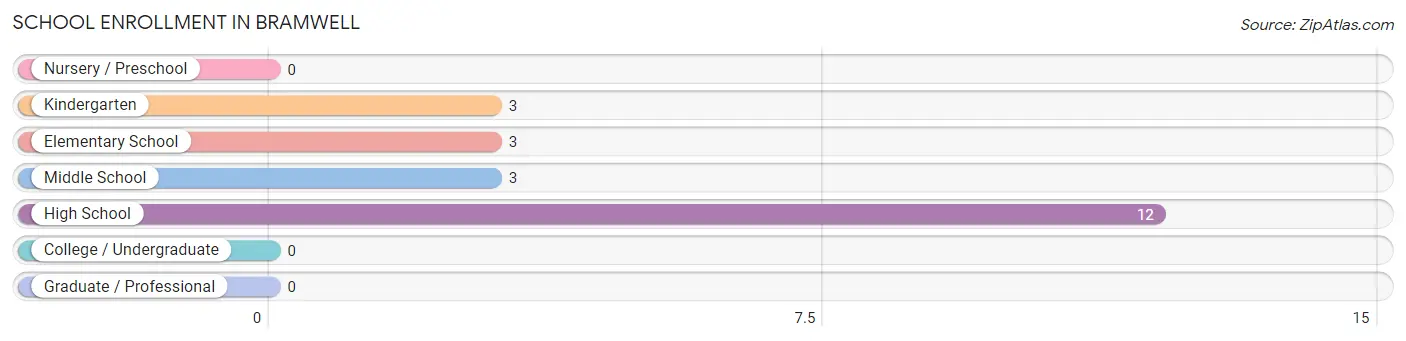
School Enrollment in Bramwell
The most common levels of schooling among the 21 students in Bramwell are high school (12 | 57.1%), kindergarten (3 | 14.3%), and elementary school (3 | 14.3%).
| School Level | # Students | % Students |
| Nursery / Preschool | 0 | 0.0% |
| Kindergarten | 3 | 14.3% |
| Elementary School | 3 | 14.3% |
| Middle School | 3 | 14.3% |
| High School | 12 | 57.1% |
| College / Undergraduate | 0 | 0.0% |
| Graduate / Professional | 0 | 0.0% |
| Total | 21 | 100.0% |
School Enrollment by Age by Funding Source in Bramwell
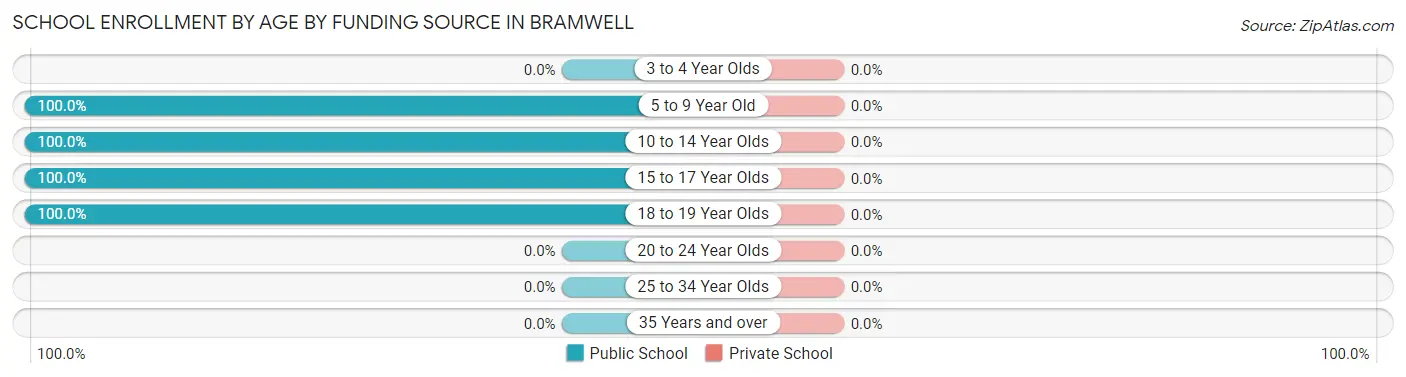
| Age Bracket | Public School | Private School |
| 3 to 4 Year Olds | 0 (0.0%) | 0 (0.0%) |
| 5 to 9 Year Old | 3 (100.0%) | 0 (0.0%) |
| 10 to 14 Year Olds | 10 (100.0%) | 0 (0.0%) |
| 15 to 17 Year Olds | 5 (100.0%) | 0 (0.0%) |
| 18 to 19 Year Olds | 3 (100.0%) | 0 (0.0%) |
| 20 to 24 Year Olds | 0 (0.0%) | 0 (0.0%) |
| 25 to 34 Year Olds | 0 (0.0%) | 0 (0.0%) |
| 35 Years and over | 0 (0.0%) | 0 (0.0%) |
| Total | 21 (100.0%) | 0 (0.0%) |
Educational Attainment by Field of Study in Bramwell
Business (9 | 21.4%), education (8 | 19.1%), liberal arts & history (6 | 14.3%), computers & mathematics (5 | 11.9%), and social sciences (4 | 9.5%) are the most common fields of study among 42 individuals in Bramwell who have obtained a bachelor's degree or higher.
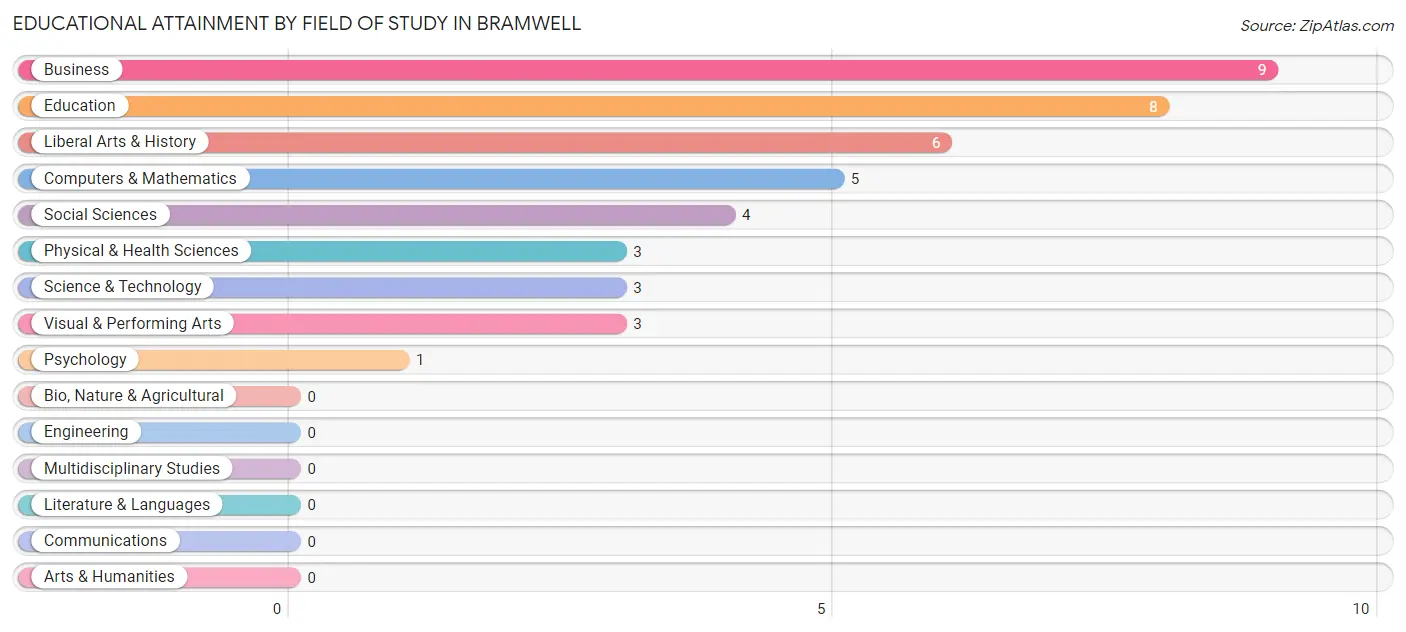
| Field of Study | # Graduates | % Graduates |
| Computers & Mathematics | 5 | 11.9% |
| Bio, Nature & Agricultural | 0 | 0.0% |
| Physical & Health Sciences | 3 | 7.1% |
| Psychology | 1 | 2.4% |
| Social Sciences | 4 | 9.5% |
| Engineering | 0 | 0.0% |
| Multidisciplinary Studies | 0 | 0.0% |
| Science & Technology | 3 | 7.1% |
| Business | 9 | 21.4% |
| Education | 8 | 19.1% |
| Literature & Languages | 0 | 0.0% |
| Liberal Arts & History | 6 | 14.3% |
| Visual & Performing Arts | 3 | 7.1% |
| Communications | 0 | 0.0% |
| Arts & Humanities | 0 | 0.0% |
| Total | 42 | 100.0% |
Transportation & Commute in Bramwell
Vehicle Availability by Sex in Bramwell
The most prevalent vehicle ownership categories in Bramwell are males with 1 vehicle (11, accounting for 61.1%) and females with 1 vehicle (6, making up 39.3%).
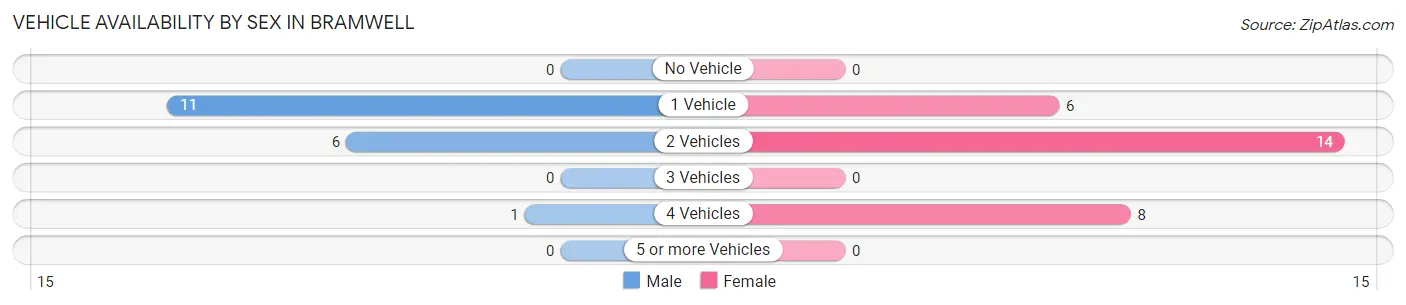
| Vehicles Available | Male | Female |
| No Vehicle | 0 (0.0%) | 0 (0.0%) |
| 1 Vehicle | 11 (61.1%) | 6 (21.4%) |
| 2 Vehicles | 6 (33.3%) | 14 (50.0%) |
| 3 Vehicles | 0 (0.0%) | 0 (0.0%) |
| 4 Vehicles | 1 (5.6%) | 8 (28.6%) |
| 5 or more Vehicles | 0 (0.0%) | 0 (0.0%) |
| Total | 18 (100.0%) | 28 (100.0%) |
Commute Time in Bramwell
The most frequently occuring commute durations in Bramwell are 30 to 34 minutes (15 commuters, 34.9%), less than 5 minutes (11 commuters, 25.6%), and 20 to 24 minutes (8 commuters, 18.6%).
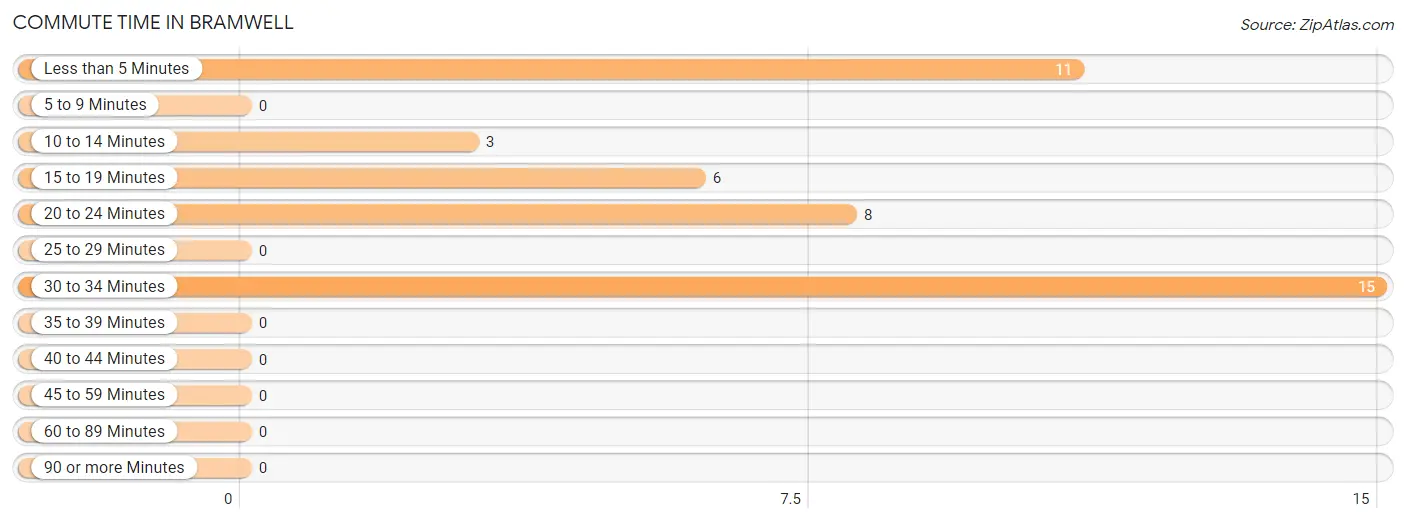
| Commute Time | # Commuters | % Commuters |
| Less than 5 Minutes | 11 | 25.6% |
| 5 to 9 Minutes | 0 | 0.0% |
| 10 to 14 Minutes | 3 | 7.0% |
| 15 to 19 Minutes | 6 | 14.0% |
| 20 to 24 Minutes | 8 | 18.6% |
| 25 to 29 Minutes | 0 | 0.0% |
| 30 to 34 Minutes | 15 | 34.9% |
| 35 to 39 Minutes | 0 | 0.0% |
| 40 to 44 Minutes | 0 | 0.0% |
| 45 to 59 Minutes | 0 | 0.0% |
| 60 to 89 Minutes | 0 | 0.0% |
| 90 or more Minutes | 0 | 0.0% |
Commute Time by Sex in Bramwell
The most common commute times in Bramwell are 30 to 34 minutes (5 commuters, 33.3%) for males and 30 to 34 minutes (10 commuters, 35.7%) for females.
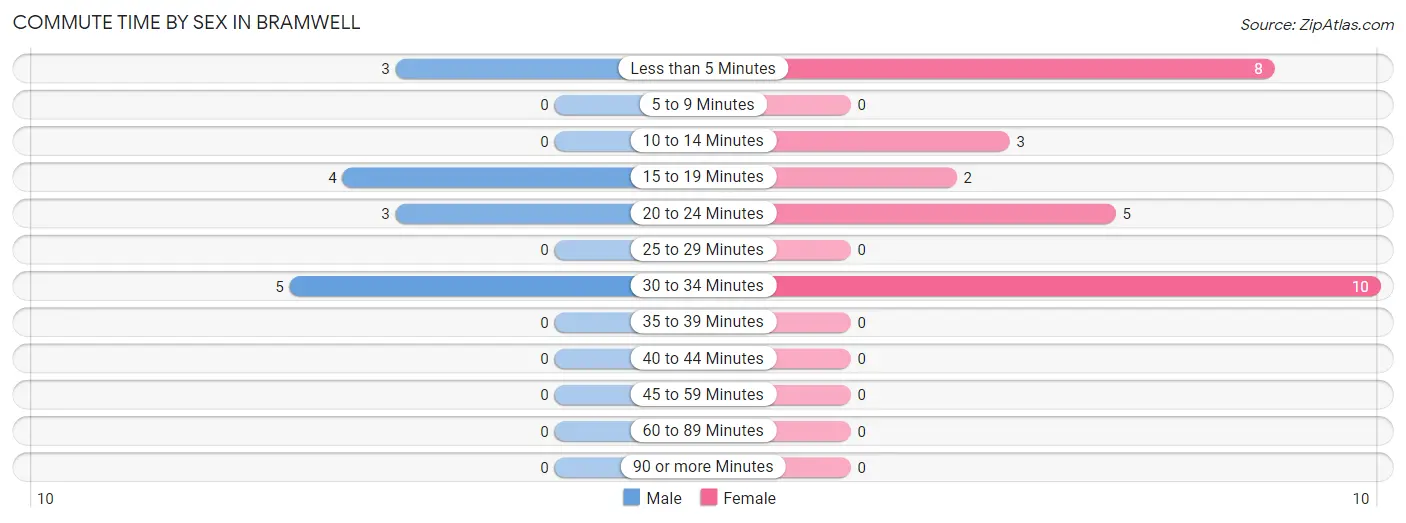
| Commute Time | Male | Female |
| Less than 5 Minutes | 3 (20.0%) | 8 (28.6%) |
| 5 to 9 Minutes | 0 (0.0%) | 0 (0.0%) |
| 10 to 14 Minutes | 0 (0.0%) | 3 (10.7%) |
| 15 to 19 Minutes | 4 (26.7%) | 2 (7.1%) |
| 20 to 24 Minutes | 3 (20.0%) | 5 (17.9%) |
| 25 to 29 Minutes | 0 (0.0%) | 0 (0.0%) |
| 30 to 34 Minutes | 5 (33.3%) | 10 (35.7%) |
| 35 to 39 Minutes | 0 (0.0%) | 0 (0.0%) |
| 40 to 44 Minutes | 0 (0.0%) | 0 (0.0%) |
| 45 to 59 Minutes | 0 (0.0%) | 0 (0.0%) |
| 60 to 89 Minutes | 0 (0.0%) | 0 (0.0%) |
| 90 or more Minutes | 0 (0.0%) | 0 (0.0%) |
Time of Departure to Work by Sex in Bramwell
The most frequent times of departure to work in Bramwell are 8:00 AM to 8:29 AM (8, 53.3%) for males and 8:30 AM to 8:59 AM (8, 28.6%) for females.
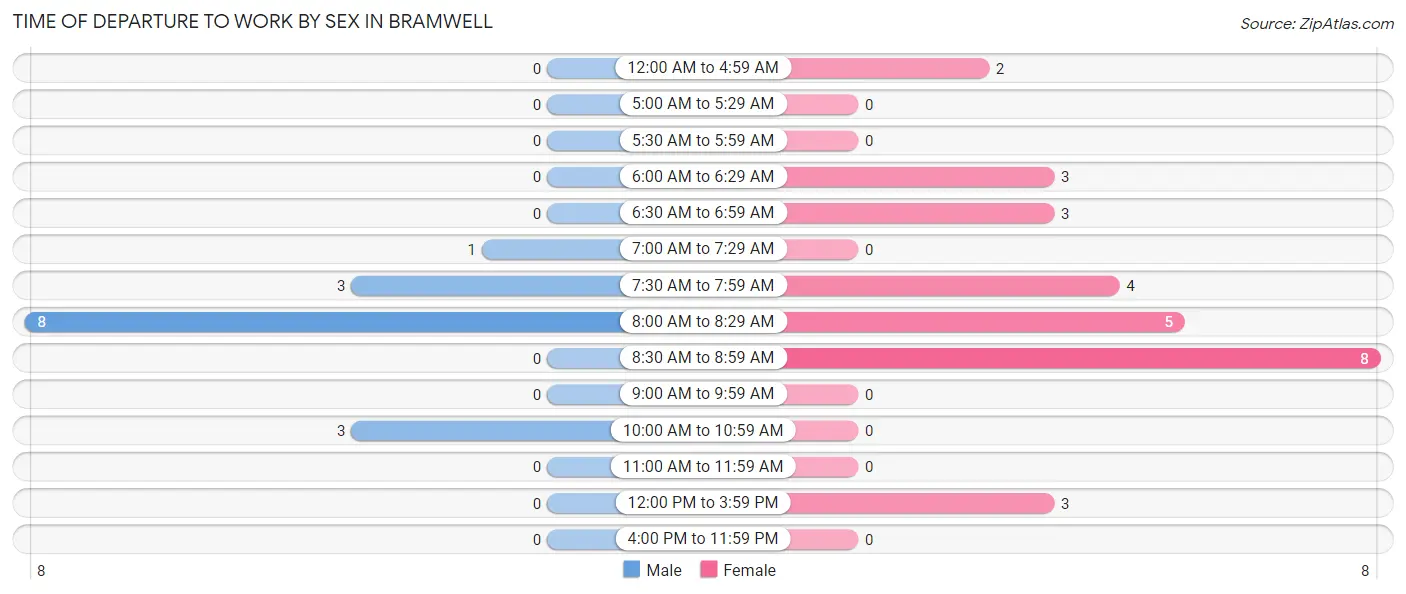
| Time of Departure | Male | Female |
| 12:00 AM to 4:59 AM | 0 (0.0%) | 2 (7.1%) |
| 5:00 AM to 5:29 AM | 0 (0.0%) | 0 (0.0%) |
| 5:30 AM to 5:59 AM | 0 (0.0%) | 0 (0.0%) |
| 6:00 AM to 6:29 AM | 0 (0.0%) | 3 (10.7%) |
| 6:30 AM to 6:59 AM | 0 (0.0%) | 3 (10.7%) |
| 7:00 AM to 7:29 AM | 1 (6.7%) | 0 (0.0%) |
| 7:30 AM to 7:59 AM | 3 (20.0%) | 4 (14.3%) |
| 8:00 AM to 8:29 AM | 8 (53.3%) | 5 (17.9%) |
| 8:30 AM to 8:59 AM | 0 (0.0%) | 8 (28.6%) |
| 9:00 AM to 9:59 AM | 0 (0.0%) | 0 (0.0%) |
| 10:00 AM to 10:59 AM | 3 (20.0%) | 0 (0.0%) |
| 11:00 AM to 11:59 AM | 0 (0.0%) | 0 (0.0%) |
| 12:00 PM to 3:59 PM | 0 (0.0%) | 3 (10.7%) |
| 4:00 PM to 11:59 PM | 0 (0.0%) | 0 (0.0%) |
| Total | 15 (100.0%) | 28 (100.0%) |
Housing Occupancy in Bramwell
Occupancy by Ownership in Bramwell
Of the total 85 dwellings in Bramwell, owner-occupied units account for 70 (82.4%), while renter-occupied units make up 15 (17.6%).
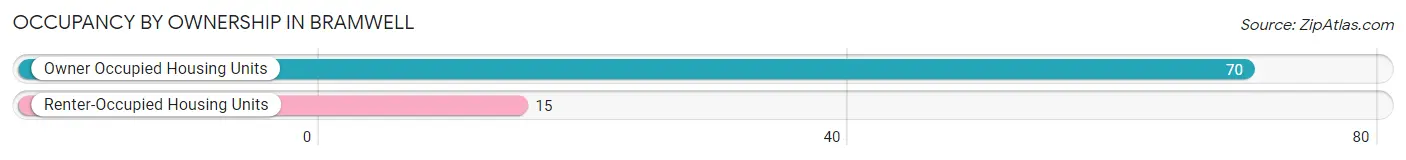
| Occupancy | # Housing Units | % Housing Units |
| Owner Occupied Housing Units | 70 | 82.4% |
| Renter-Occupied Housing Units | 15 | 17.6% |
| Total Occupied Housing Units | 85 | 100.0% |
Occupancy by Household Size in Bramwell
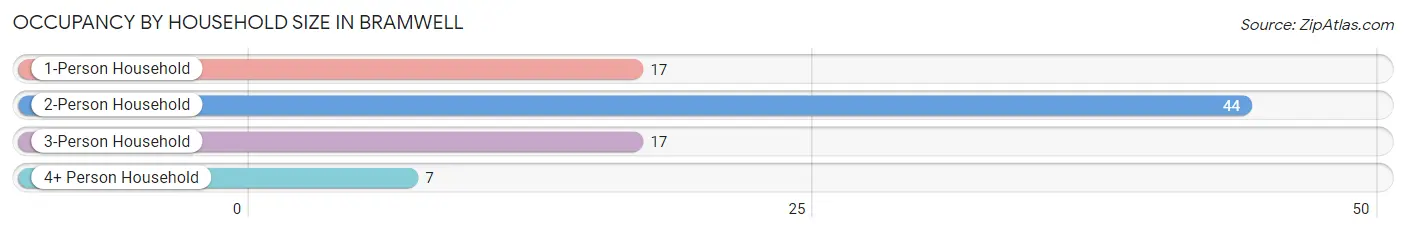
| Household Size | # Housing Units | % Housing Units |
| 1-Person Household | 17 | 20.0% |
| 2-Person Household | 44 | 51.8% |
| 3-Person Household | 17 | 20.0% |
| 4+ Person Household | 7 | 8.2% |
| Total Housing Units | 85 | 100.0% |
Occupancy by Ownership by Household Size in Bramwell
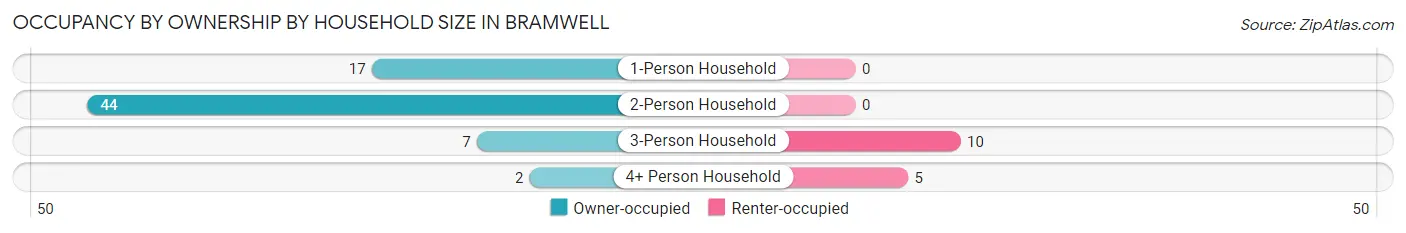
| Household Size | Owner-occupied | Renter-occupied |
| 1-Person Household | 17 (100.0%) | 0 (0.0%) |
| 2-Person Household | 44 (100.0%) | 0 (0.0%) |
| 3-Person Household | 7 (41.2%) | 10 (58.8%) |
| 4+ Person Household | 2 (28.6%) | 5 (71.4%) |
| Total Housing Units | 70 (82.4%) | 15 (17.6%) |
Occupancy by Educational Attainment in Bramwell
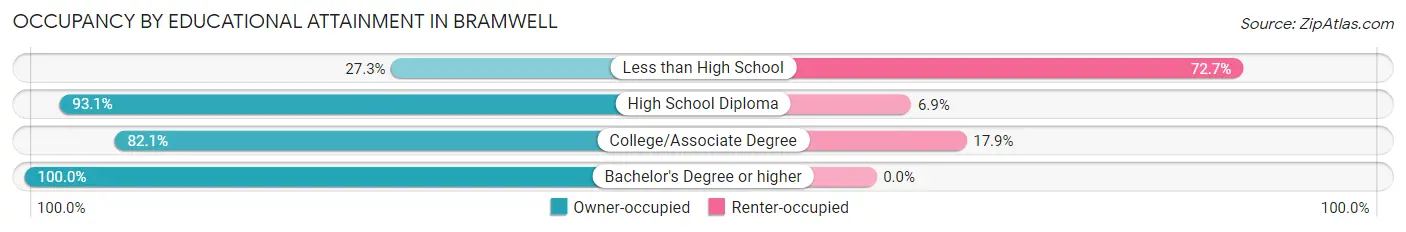
| Household Size | Owner-occupied | Renter-occupied |
| Less than High School | 3 (27.3%) | 8 (72.7%) |
| High School Diploma | 27 (93.1%) | 2 (6.9%) |
| College/Associate Degree | 23 (82.1%) | 5 (17.9%) |
| Bachelor's Degree or higher | 17 (100.0%) | 0 (0.0%) |
Occupancy by Age of Householder in Bramwell
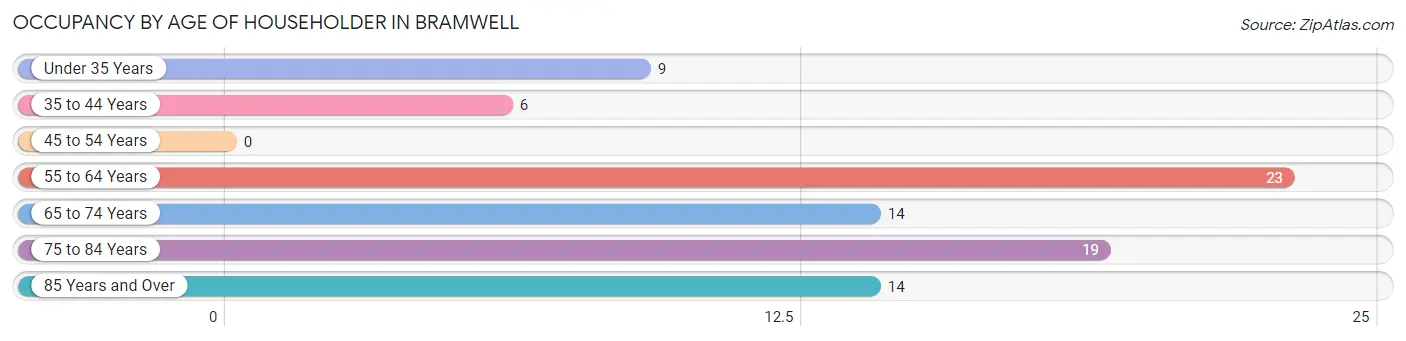
| Age Bracket | # Households | % Households |
| Under 35 Years | 9 | 10.6% |
| 35 to 44 Years | 6 | 7.1% |
| 45 to 54 Years | 0 | 0.0% |
| 55 to 64 Years | 23 | 27.1% |
| 65 to 74 Years | 14 | 16.5% |
| 75 to 84 Years | 19 | 22.4% |
| 85 Years and Over | 14 | 16.5% |
| Total | 85 | 100.0% |
Housing Finances in Bramwell
Median Income by Occupancy in Bramwell
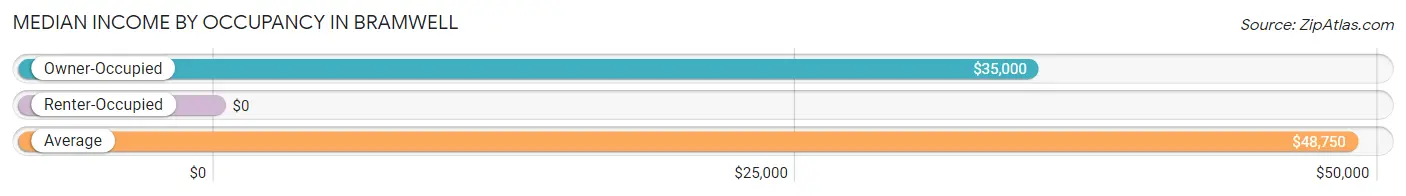
| Occupancy Type | # Households | Median Income |
| Owner-Occupied | 70 (82.4%) | $35,000 |
| Renter-Occupied | 15 (17.6%) | $0 |
| Average | 85 (100.0%) | $48,750 |
Occupancy by Householder Income Bracket in Bramwell
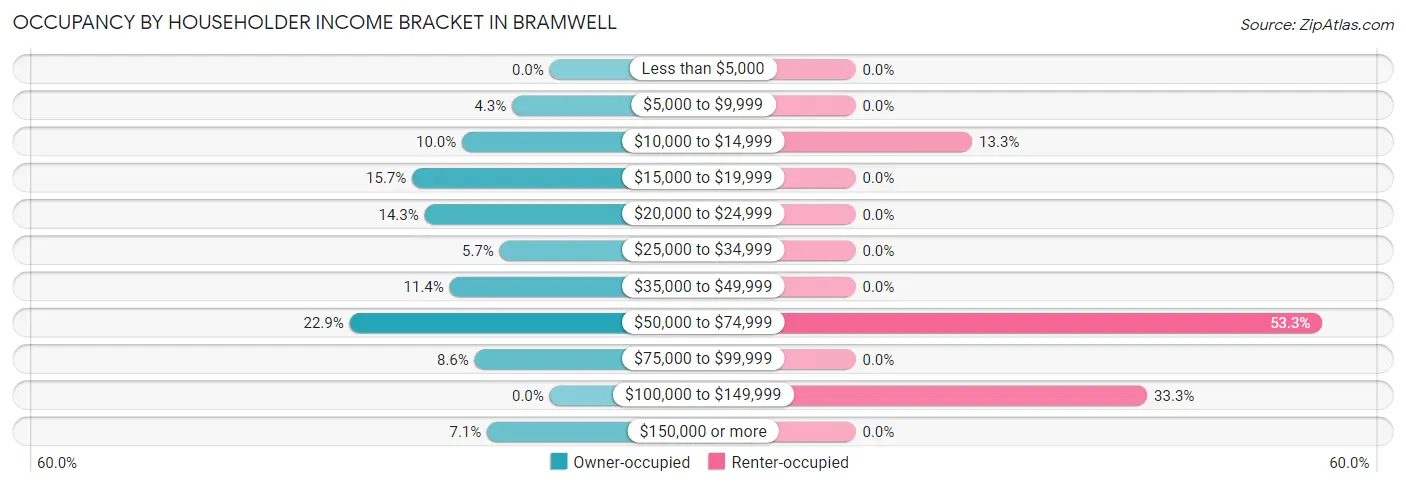
| Income Bracket | Owner-occupied | Renter-occupied |
| Less than $5,000 | 0 (0.0%) | 0 (0.0%) |
| $5,000 to $9,999 | 3 (4.3%) | 0 (0.0%) |
| $10,000 to $14,999 | 7 (10.0%) | 2 (13.3%) |
| $15,000 to $19,999 | 11 (15.7%) | 0 (0.0%) |
| $20,000 to $24,999 | 10 (14.3%) | 0 (0.0%) |
| $25,000 to $34,999 | 4 (5.7%) | 0 (0.0%) |
| $35,000 to $49,999 | 8 (11.4%) | 0 (0.0%) |
| $50,000 to $74,999 | 16 (22.9%) | 8 (53.3%) |
| $75,000 to $99,999 | 6 (8.6%) | 0 (0.0%) |
| $100,000 to $149,999 | 0 (0.0%) | 5 (33.3%) |
| $150,000 or more | 5 (7.1%) | 0 (0.0%) |
| Total | 70 (100.0%) | 15 (100.0%) |
Monthly Housing Cost Tiers in Bramwell
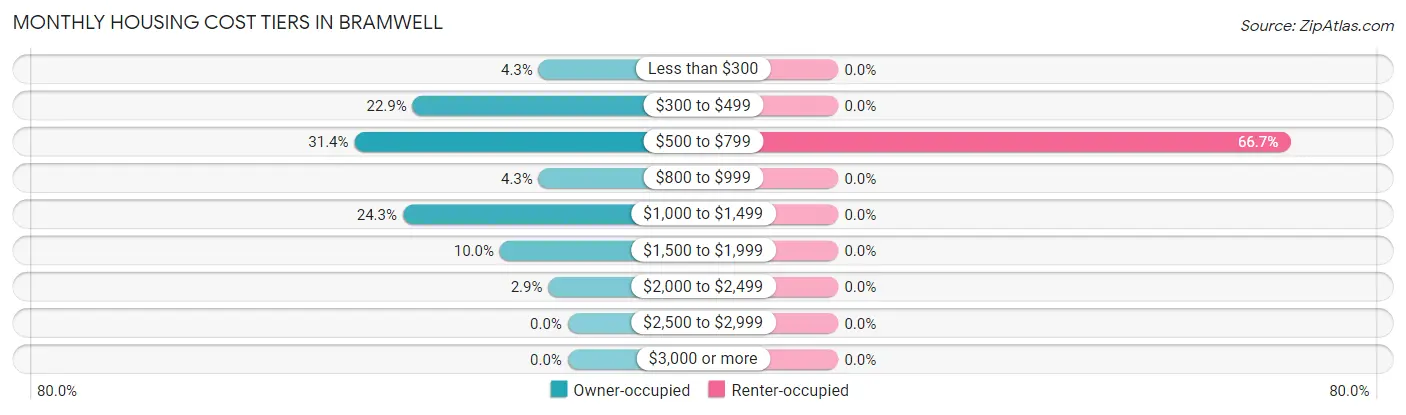
| Monthly Cost | Owner-occupied | Renter-occupied |
| Less than $300 | 3 (4.3%) | 0 (0.0%) |
| $300 to $499 | 16 (22.9%) | 0 (0.0%) |
| $500 to $799 | 22 (31.4%) | 10 (66.7%) |
| $800 to $999 | 3 (4.3%) | 0 (0.0%) |
| $1,000 to $1,499 | 17 (24.3%) | 0 (0.0%) |
| $1,500 to $1,999 | 7 (10.0%) | 0 (0.0%) |
| $2,000 to $2,499 | 2 (2.9%) | 0 (0.0%) |
| $2,500 to $2,999 | 0 (0.0%) | 0 (0.0%) |
| $3,000 or more | 0 (0.0%) | 0 (0.0%) |
| Total | 70 (100.0%) | 15 (100.0%) |
Physical Housing Characteristics in Bramwell
Housing Structures in Bramwell
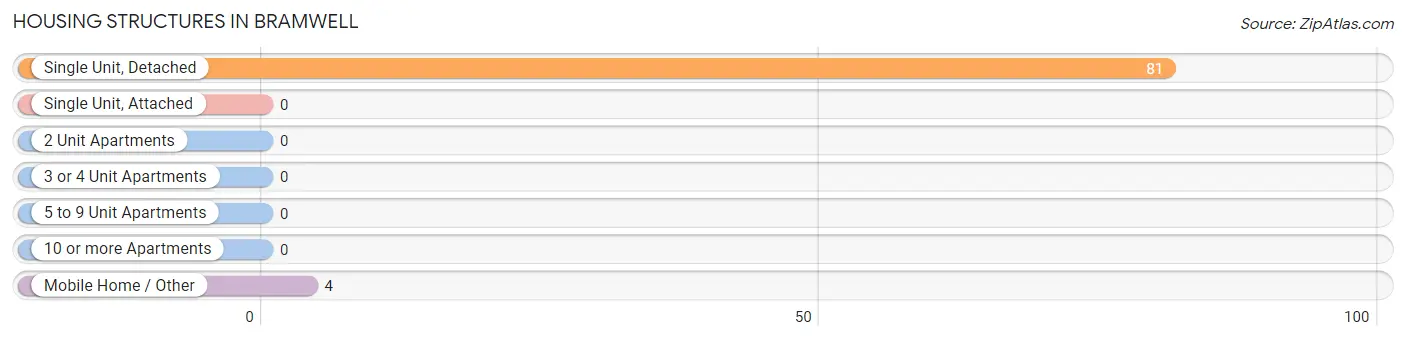
| Structure Type | # Housing Units | % Housing Units |
| Single Unit, Detached | 81 | 95.3% |
| Single Unit, Attached | 0 | 0.0% |
| 2 Unit Apartments | 0 | 0.0% |
| 3 or 4 Unit Apartments | 0 | 0.0% |
| 5 to 9 Unit Apartments | 0 | 0.0% |
| 10 or more Apartments | 0 | 0.0% |
| Mobile Home / Other | 4 | 4.7% |
| Total | 85 | 100.0% |
Housing Structures by Occupancy in Bramwell
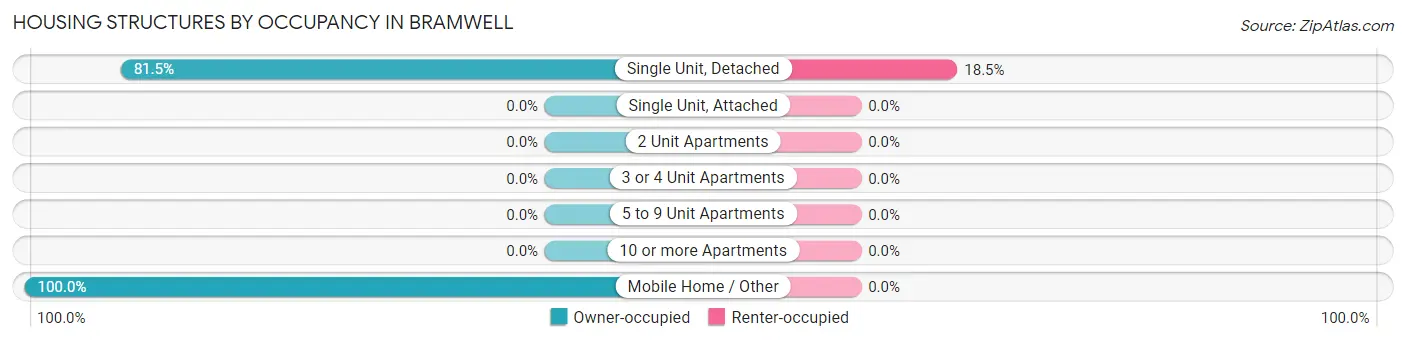
| Structure Type | Owner-occupied | Renter-occupied |
| Single Unit, Detached | 66 (81.5%) | 15 (18.5%) |
| Single Unit, Attached | 0 (0.0%) | 0 (0.0%) |
| 2 Unit Apartments | 0 (0.0%) | 0 (0.0%) |
| 3 or 4 Unit Apartments | 0 (0.0%) | 0 (0.0%) |
| 5 to 9 Unit Apartments | 0 (0.0%) | 0 (0.0%) |
| 10 or more Apartments | 0 (0.0%) | 0 (0.0%) |
| Mobile Home / Other | 4 (100.0%) | 0 (0.0%) |
| Total | 70 (82.4%) | 15 (17.6%) |
Housing Structures by Number of Rooms in Bramwell
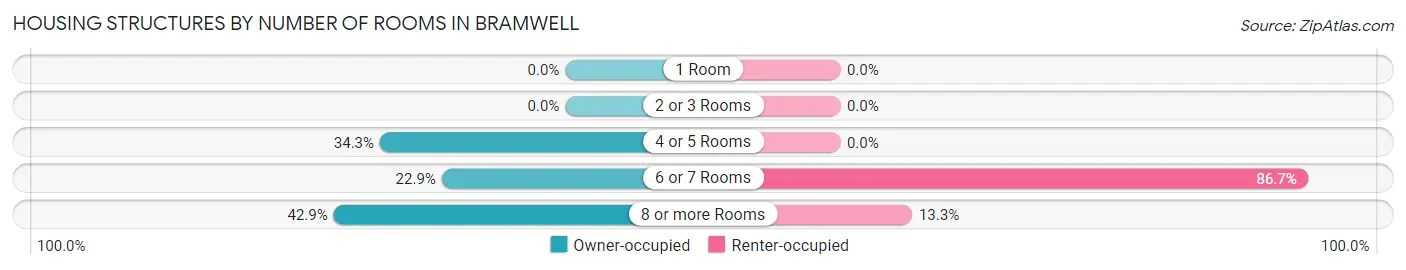
| Number of Rooms | Owner-occupied | Renter-occupied |
| 1 Room | 0 (0.0%) | 0 (0.0%) |
| 2 or 3 Rooms | 0 (0.0%) | 0 (0.0%) |
| 4 or 5 Rooms | 24 (34.3%) | 0 (0.0%) |
| 6 or 7 Rooms | 16 (22.9%) | 13 (86.7%) |
| 8 or more Rooms | 30 (42.9%) | 2 (13.3%) |
| Total | 70 (100.0%) | 15 (100.0%) |
Housing Structure by Heating Type in Bramwell
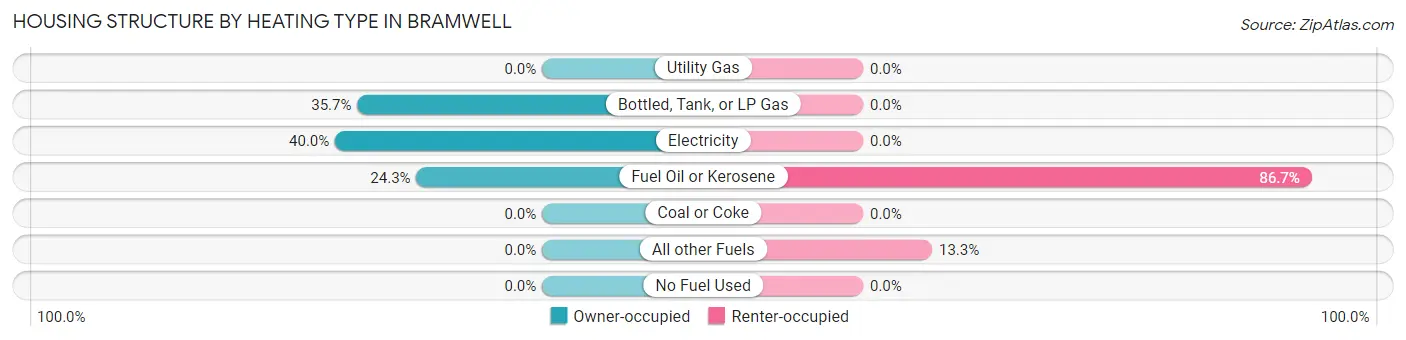
| Heating Type | Owner-occupied | Renter-occupied |
| Utility Gas | 0 (0.0%) | 0 (0.0%) |
| Bottled, Tank, or LP Gas | 25 (35.7%) | 0 (0.0%) |
| Electricity | 28 (40.0%) | 0 (0.0%) |
| Fuel Oil or Kerosene | 17 (24.3%) | 13 (86.7%) |
| Coal or Coke | 0 (0.0%) | 0 (0.0%) |
| All other Fuels | 0 (0.0%) | 2 (13.3%) |
| No Fuel Used | 0 (0.0%) | 0 (0.0%) |
| Total | 70 (100.0%) | 15 (100.0%) |
Household Vehicle Usage in Bramwell
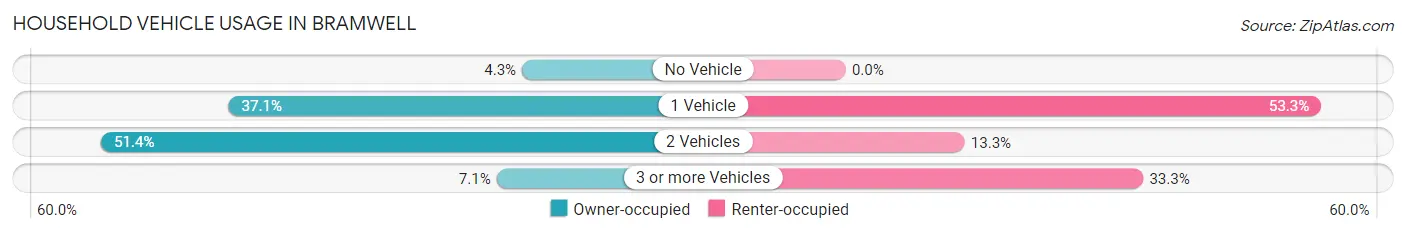
| Vehicles per Household | Owner-occupied | Renter-occupied |
| No Vehicle | 3 (4.3%) | 0 (0.0%) |
| 1 Vehicle | 26 (37.1%) | 8 (53.3%) |
| 2 Vehicles | 36 (51.4%) | 2 (13.3%) |
| 3 or more Vehicles | 5 (7.1%) | 5 (33.3%) |
| Total | 70 (100.0%) | 15 (100.0%) |
Real Estate & Mortgages in Bramwell
Real Estate and Mortgage Overview in Bramwell
| Characteristic | Without Mortgage | With Mortgage |
| Housing Units | 37 | 33 |
| Median Property Value | - | - |
| Median Household Income | - | - |
| Monthly Housing Costs | $483 | $0 |
| Real Estate Taxes | - | - |
Property Value by Mortgage Status in Bramwell
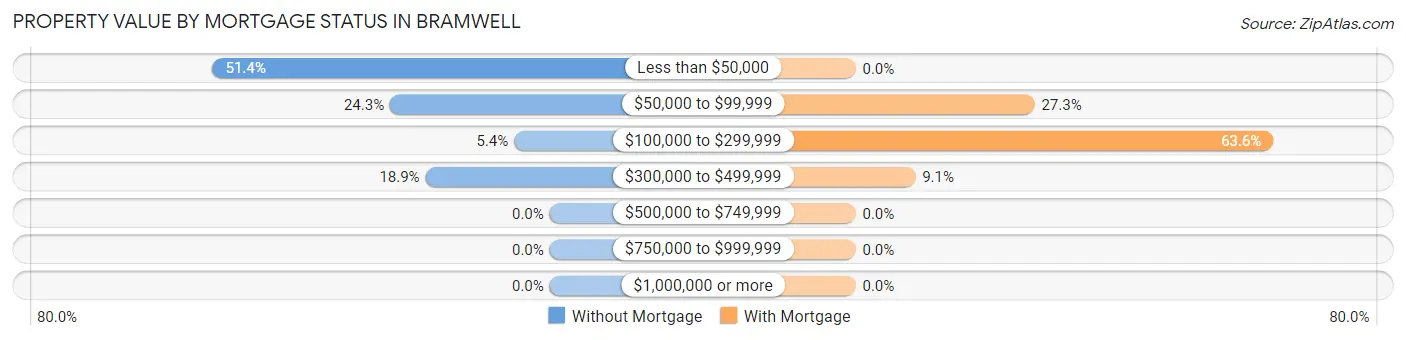
| Property Value | Without Mortgage | With Mortgage |
| Less than $50,000 | 19 (51.3%) | 0 (0.0%) |
| $50,000 to $99,999 | 9 (24.3%) | 9 (27.3%) |
| $100,000 to $299,999 | 2 (5.4%) | 21 (63.6%) |
| $300,000 to $499,999 | 7 (18.9%) | 3 (9.1%) |
| $500,000 to $749,999 | 0 (0.0%) | 0 (0.0%) |
| $750,000 to $999,999 | 0 (0.0%) | 0 (0.0%) |
| $1,000,000 or more | 0 (0.0%) | 0 (0.0%) |
| Total | 37 (100.0%) | 33 (100.0%) |
Household Income by Mortgage Status in Bramwell
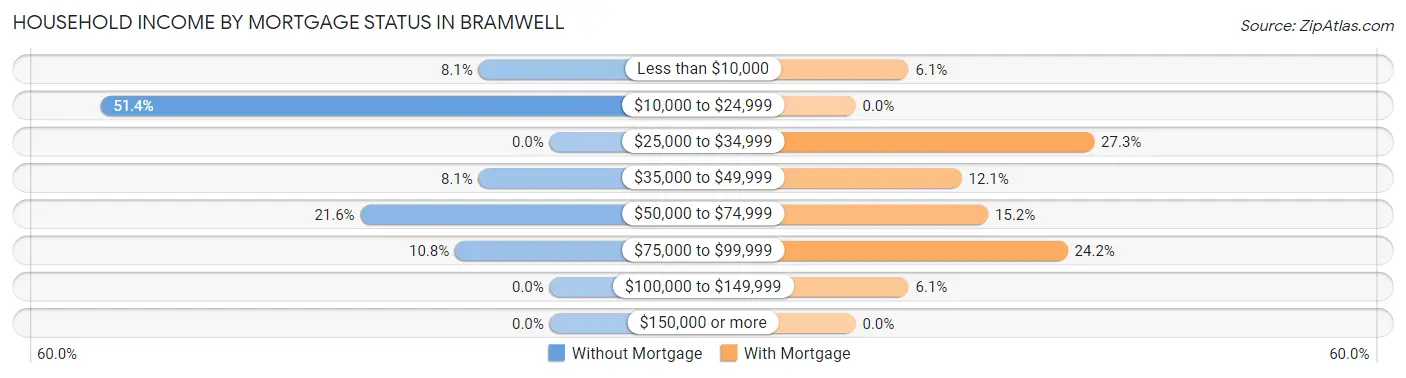
| Household Income | Without Mortgage | With Mortgage |
| Less than $10,000 | 3 (8.1%) | 2 (6.1%) |
| $10,000 to $24,999 | 19 (51.3%) | 0 (0.0%) |
| $25,000 to $34,999 | 0 (0.0%) | 9 (27.3%) |
| $35,000 to $49,999 | 3 (8.1%) | 4 (12.1%) |
| $50,000 to $74,999 | 8 (21.6%) | 5 (15.1%) |
| $75,000 to $99,999 | 4 (10.8%) | 8 (24.2%) |
| $100,000 to $149,999 | 0 (0.0%) | 2 (6.1%) |
| $150,000 or more | 0 (0.0%) | 0 (0.0%) |
| Total | 37 (100.0%) | 33 (100.0%) |
Property Value to Household Income Ratio in Bramwell
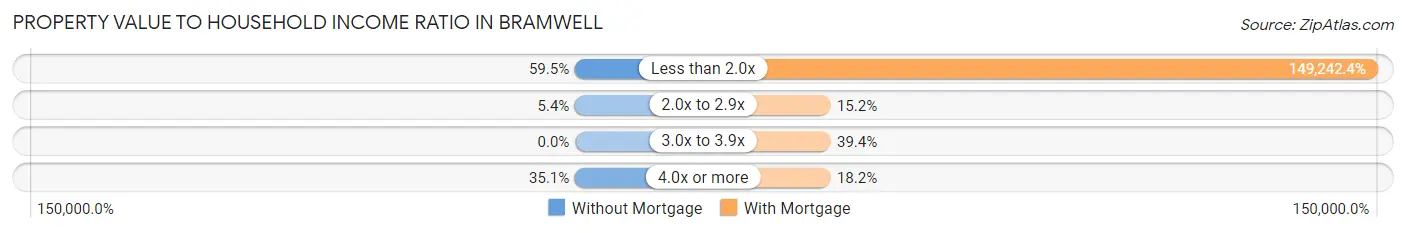
| Value-to-Income Ratio | Without Mortgage | With Mortgage |
| Less than 2.0x | 22 (59.5%) | 49,250 (149,242.4%) |
| 2.0x to 2.9x | 2 (5.4%) | 5 (15.1%) |
| 3.0x to 3.9x | 0 (0.0%) | 13 (39.4%) |
| 4.0x or more | 13 (35.1%) | 6 (18.2%) |
| Total | 37 (100.0%) | 33 (100.0%) |
Real Estate Taxes by Mortgage Status in Bramwell
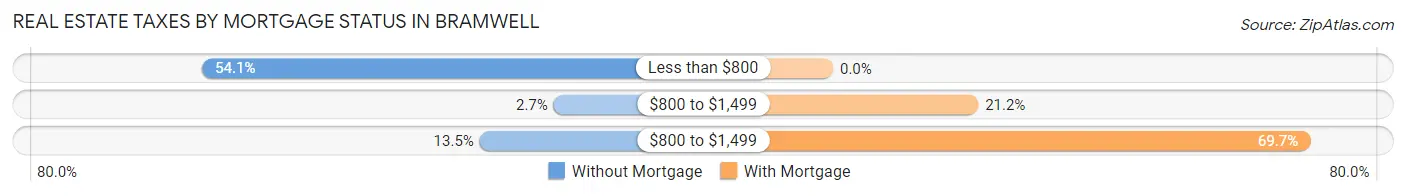
| Property Taxes | Without Mortgage | With Mortgage |
| Less than $800 | 20 (54.0%) | 0 (0.0%) |
| $800 to $1,499 | 1 (2.7%) | 7 (21.2%) |
| $800 to $1,499 | 5 (13.5%) | 23 (69.7%) |
| Total | 37 (100.0%) | 33 (100.0%) |
Health & Disability in Bramwell
Health Insurance Coverage by Age in Bramwell
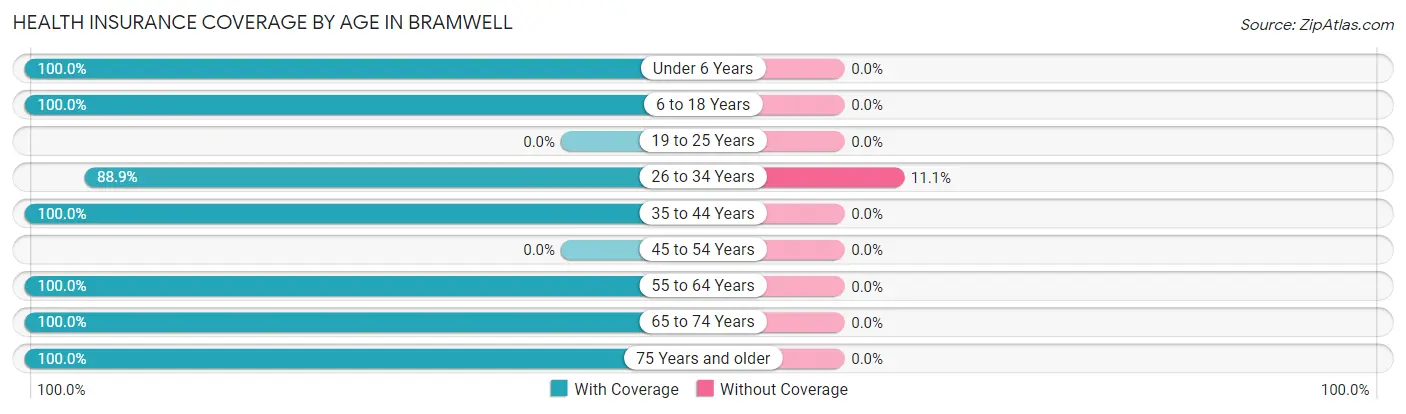
| Age Bracket | With Coverage | Without Coverage |
| Under 6 Years | 6 (100.0%) | 0 (0.0%) |
| 6 to 18 Years | 18 (100.0%) | 0 (0.0%) |
| 19 to 25 Years | 0 (0.0%) | 0 (0.0%) |
| 26 to 34 Years | 24 (88.9%) | 3 (11.1%) |
| 35 to 44 Years | 19 (100.0%) | 0 (0.0%) |
| 45 to 54 Years | 0 (0.0%) | 0 (0.0%) |
| 55 to 64 Years | 34 (100.0%) | 0 (0.0%) |
| 65 to 74 Years | 39 (100.0%) | 0 (0.0%) |
| 75 Years and older | 37 (100.0%) | 0 (0.0%) |
| Total | 177 (98.3%) | 3 (1.7%) |
Health Insurance Coverage by Citizenship Status in Bramwell
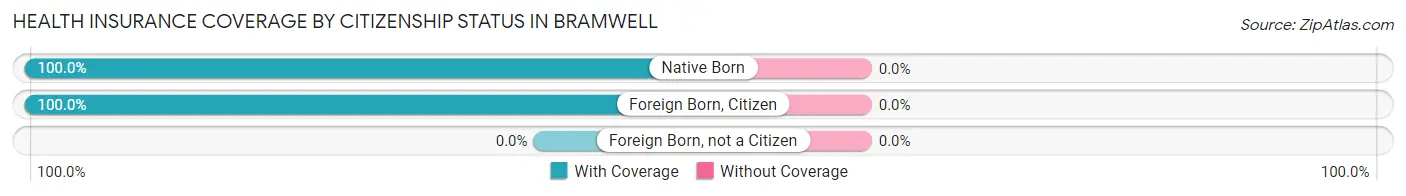
| Citizenship Status | With Coverage | Without Coverage |
| Native Born | 6 (100.0%) | 0 (0.0%) |
| Foreign Born, Citizen | 18 (100.0%) | 0 (0.0%) |
| Foreign Born, not a Citizen | 0 (0.0%) | 0 (0.0%) |
Health Insurance Coverage by Household Income in Bramwell
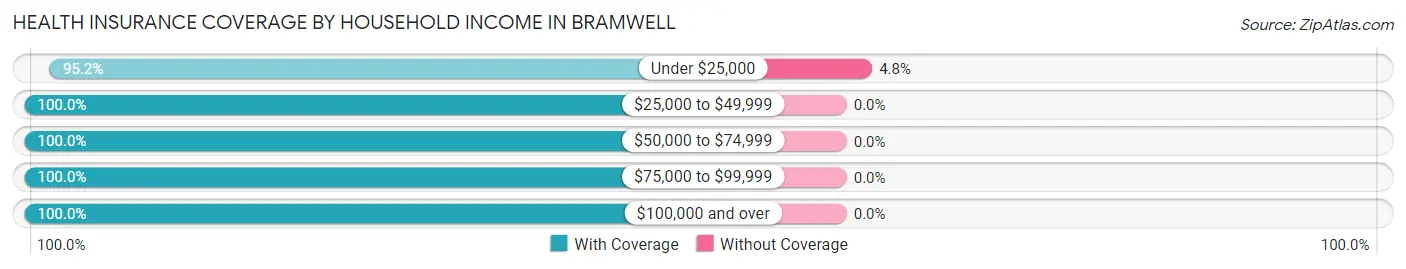
| Household Income | With Coverage | Without Coverage |
| Under $25,000 | 60 (95.2%) | 3 (4.8%) |
| $25,000 to $49,999 | 28 (100.0%) | 0 (0.0%) |
| $50,000 to $74,999 | 46 (100.0%) | 0 (0.0%) |
| $75,000 to $99,999 | 17 (100.0%) | 0 (0.0%) |
| $100,000 and over | 26 (100.0%) | 0 (0.0%) |
Public vs Private Health Insurance Coverage by Age in Bramwell
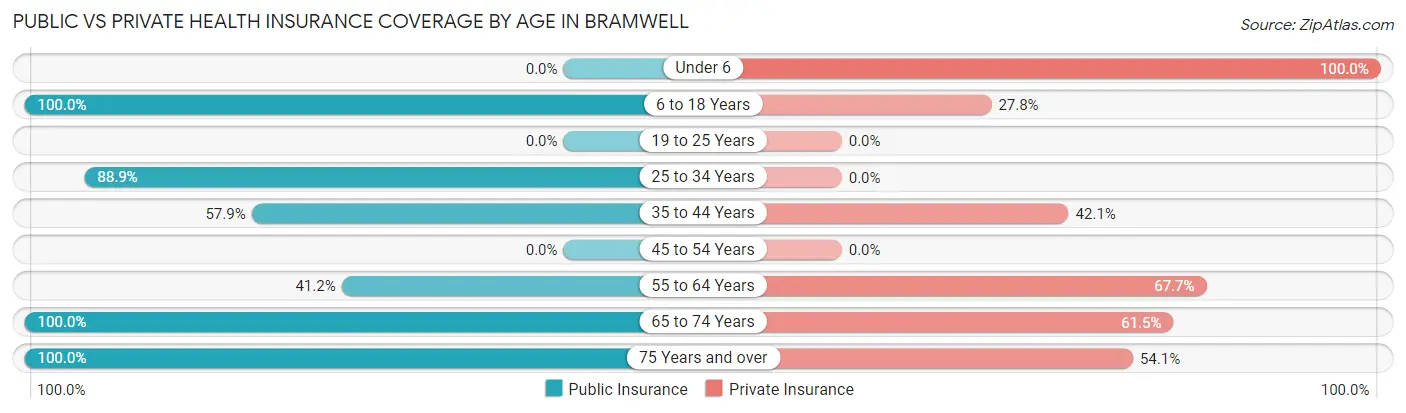
| Age Bracket | Public Insurance | Private Insurance |
| Under 6 | 0 (0.0%) | 6 (100.0%) |
| 6 to 18 Years | 18 (100.0%) | 5 (27.8%) |
| 19 to 25 Years | 0 (0.0%) | 0 (0.0%) |
| 25 to 34 Years | 24 (88.9%) | 0 (0.0%) |
| 35 to 44 Years | 11 (57.9%) | 8 (42.1%) |
| 45 to 54 Years | 0 (0.0%) | 0 (0.0%) |
| 55 to 64 Years | 14 (41.2%) | 23 (67.6%) |
| 65 to 74 Years | 39 (100.0%) | 24 (61.5%) |
| 75 Years and over | 37 (100.0%) | 20 (54.0%) |
| Total | 143 (79.4%) | 86 (47.8%) |
Disability Status by Sex by Age in Bramwell
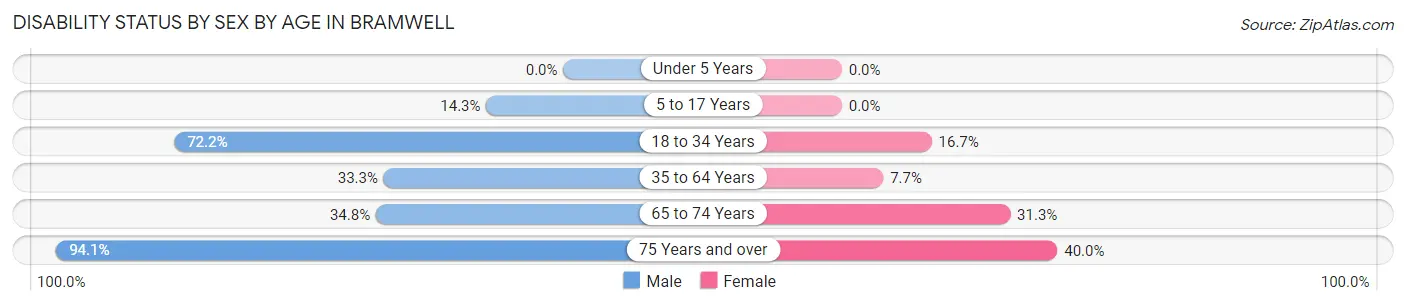
| Age Bracket | Male | Female |
| Under 5 Years | 0 (0.0%) | 0 (0.0%) |
| 5 to 17 Years | 2 (14.3%) | 0 (0.0%) |
| 18 to 34 Years | 13 (72.2%) | 2 (16.7%) |
| 35 to 64 Years | 9 (33.3%) | 2 (7.7%) |
| 65 to 74 Years | 8 (34.8%) | 5 (31.2%) |
| 75 Years and over | 16 (94.1%) | 8 (40.0%) |
Disability Class by Sex by Age in Bramwell
Disability Class: Hearing Difficulty
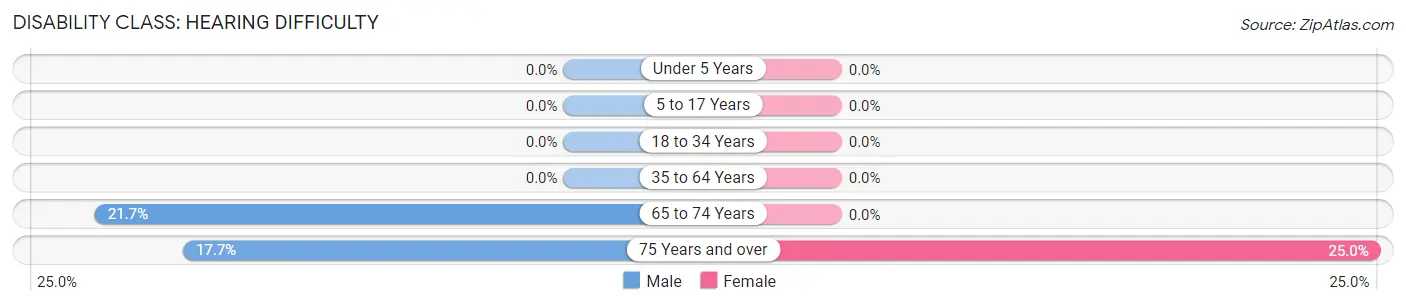
| Age Bracket | Male | Female |
| Under 5 Years | 0 (0.0%) | 0 (0.0%) |
| 5 to 17 Years | 0 (0.0%) | 0 (0.0%) |
| 18 to 34 Years | 0 (0.0%) | 0 (0.0%) |
| 35 to 64 Years | 0 (0.0%) | 0 (0.0%) |
| 65 to 74 Years | 5 (21.7%) | 0 (0.0%) |
| 75 Years and over | 3 (17.6%) | 5 (25.0%) |
Disability Class: Vision Difficulty
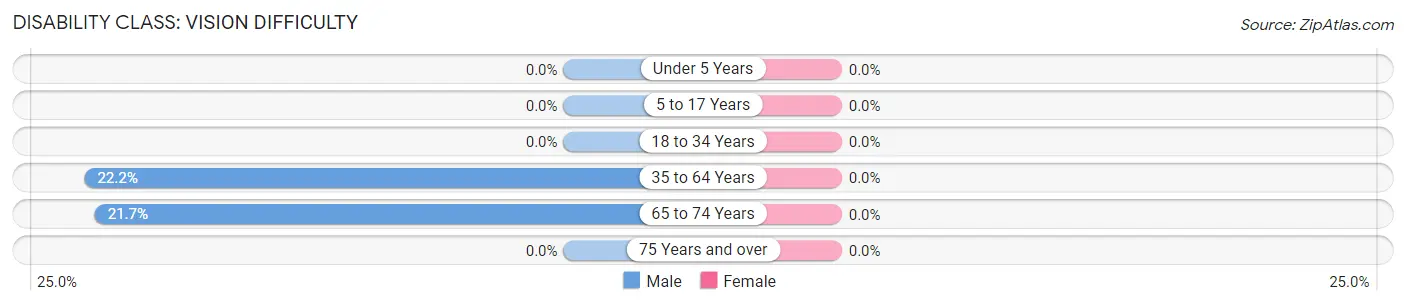
| Age Bracket | Male | Female |
| Under 5 Years | 0 (0.0%) | 0 (0.0%) |
| 5 to 17 Years | 0 (0.0%) | 0 (0.0%) |
| 18 to 34 Years | 0 (0.0%) | 0 (0.0%) |
| 35 to 64 Years | 6 (22.2%) | 0 (0.0%) |
| 65 to 74 Years | 5 (21.7%) | 0 (0.0%) |
| 75 Years and over | 0 (0.0%) | 0 (0.0%) |
Disability Class: Cognitive Difficulty
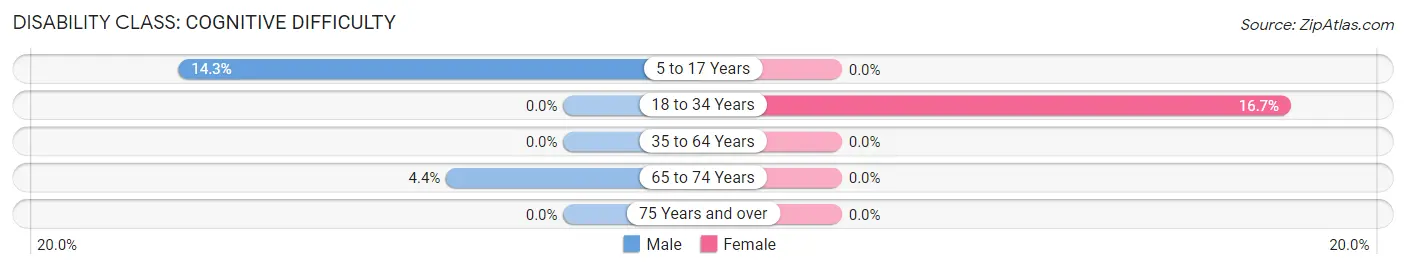
| Age Bracket | Male | Female |
| 5 to 17 Years | 2 (14.3%) | 0 (0.0%) |
| 18 to 34 Years | 0 (0.0%) | 2 (16.7%) |
| 35 to 64 Years | 0 (0.0%) | 0 (0.0%) |
| 65 to 74 Years | 1 (4.3%) | 0 (0.0%) |
| 75 Years and over | 0 (0.0%) | 0 (0.0%) |
Disability Class: Ambulatory Difficulty
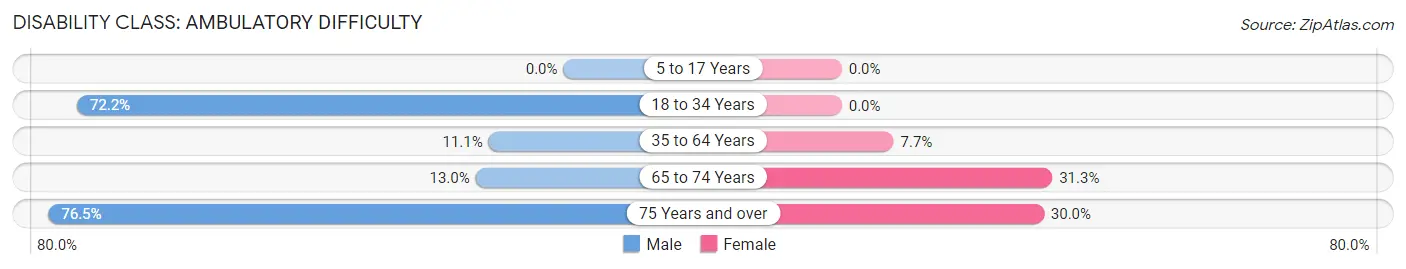
| Age Bracket | Male | Female |
| 5 to 17 Years | 0 (0.0%) | 0 (0.0%) |
| 18 to 34 Years | 13 (72.2%) | 0 (0.0%) |
| 35 to 64 Years | 3 (11.1%) | 2 (7.7%) |
| 65 to 74 Years | 3 (13.0%) | 5 (31.2%) |
| 75 Years and over | 13 (76.5%) | 6 (30.0%) |
Disability Class: Self-Care Difficulty
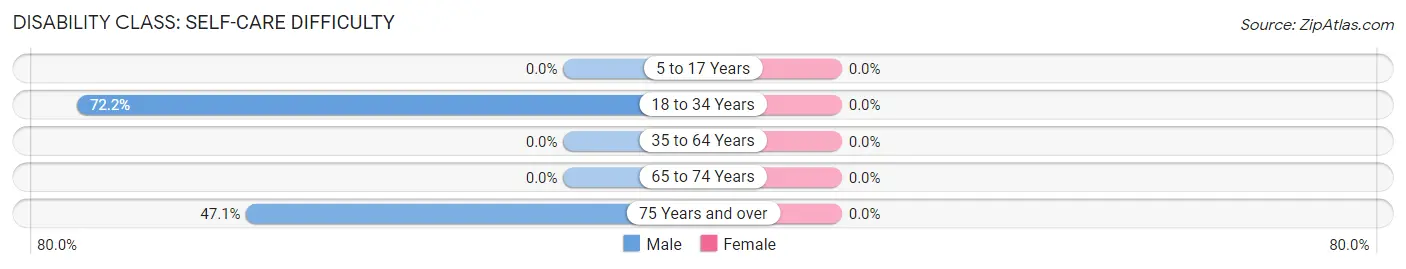
| Age Bracket | Male | Female |
| 5 to 17 Years | 0 (0.0%) | 0 (0.0%) |
| 18 to 34 Years | 13 (72.2%) | 0 (0.0%) |
| 35 to 64 Years | 0 (0.0%) | 0 (0.0%) |
| 65 to 74 Years | 0 (0.0%) | 0 (0.0%) |
| 75 Years and over | 8 (47.1%) | 0 (0.0%) |
Technology Access in Bramwell
Computing Device Access in Bramwell
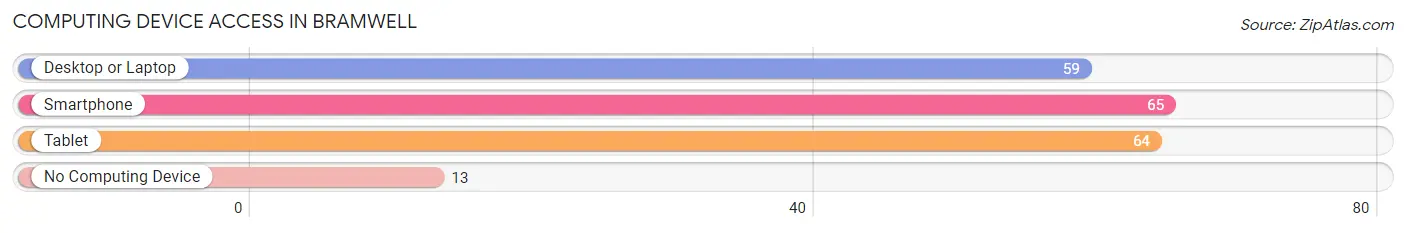
| Device Type | # Households | % Households |
| Desktop or Laptop | 59 | 69.4% |
| Smartphone | 65 | 76.5% |
| Tablet | 64 | 75.3% |
| No Computing Device | 13 | 15.3% |
| Total | 85 | 100.0% |
Internet Access in Bramwell
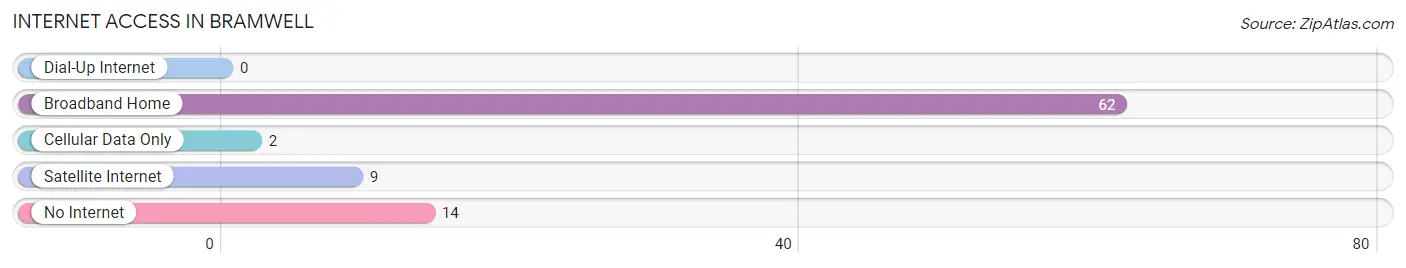
| Internet Type | # Households | % Households |
| Dial-Up Internet | 0 | 0.0% |
| Broadband Home | 62 | 72.9% |
| Cellular Data Only | 2 | 2.4% |
| Satellite Internet | 9 | 10.6% |
| No Internet | 14 | 16.5% |
| Total | 85 | 100.0% |
Bramwell Summary
Bramwell, West Virginia is a small town located in Mercer County, West Virginia. It is situated in the Appalachian Mountains and is part of the Bluefield, WV-VA Metropolitan Statistical Area. The town was founded in 1883 by coal baron William Bramwell and is known for its Victorian-style homes and its historic downtown.
History
Bramwell was founded in 1883 by coal baron William Bramwell. Bramwell was a wealthy industrialist who had made his fortune in the coal industry. He purchased the land that would become Bramwell and built a large mansion on the property. He also built a number of other homes in the area, which were designed in the Victorian style. The town was named after him and was incorporated in 1891.
Bramwell quickly became a prosperous town due to its location in the Appalachian Mountains. The town was home to a number of coal mines, which provided jobs for many of the town’s residents. The town also had a number of other businesses, including a bank, a hotel, and a number of stores.
In the early 1900s, Bramwell was a popular tourist destination. The town was known for its Victorian-style homes and its historic downtown. The town also had a number of parks and recreational areas, which attracted visitors from all over the region.
In the late 1900s, the coal industry began to decline and many of the town’s businesses closed. The town’s population also began to decline as people moved away in search of better opportunities. Despite this, Bramwell has managed to remain a vibrant community and is still a popular tourist destination.
Geography
Bramwell is located in Mercer County, West Virginia. It is situated in the Appalachian Mountains and is part of the Bluefield, WV-VA Metropolitan Statistical Area. The town is located at an elevation of 1,845 feet and has a total area of 0.7 square miles.
The town is located near the Bluestone River, which is a tributary of the New River. The town is also located near the Bluestone National Scenic River, which is a protected area of the National Park Service.
Economy
Bramwell’s economy is largely based on tourism. The town is known for its Victorian-style homes and its historic downtown. The town also has a number of parks and recreational areas, which attract visitors from all over the region.
The town also has a number of businesses, including a bank, a hotel, and a number of stores. The town is also home to a number of small manufacturing companies.
Demographics
As of the 2010 census, Bramwell had a population of 517. The town has a median household income of $31,250 and a median family income of $37,500. The town’s population is largely white (94.3%) and the town has a high rate of poverty (25.3%).
Conclusion
Bramwell, West Virginia is a small town located in Mercer County, West Virginia. It is situated in the Appalachian Mountains and is part of the Bluefield, WV-VA Metropolitan Statistical Area. The town was founded in 1883 by coal baron William Bramwell and is known for its Victorian-style homes and its historic downtown. The town’s economy is largely based on tourism and it has a number of businesses, including a bank, a hotel, and a number of stores. The town’s population is largely white (94.3%) and the town has a high rate of poverty (25.3%). Despite this, Bramwell has managed to remain a vibrant community and is still a popular tourist destination.
Common Questions
What is Per Capita Income in Bramwell?
Per Capita income in Bramwell is $26,281.
What is the Median Family Income in Bramwell?
Median Family Income in Bramwell is $56,667.
What is the Median Household income in Bramwell?
Median Household Income in Bramwell is $48,750.
What is Inequality or Gini Index in Bramwell?
Inequality or Gini Index in Bramwell is 0.45.
What is the Total Population of Bramwell?
Total Population of Bramwell is 180.
What is the Total Male Population of Bramwell?
Total Male Population of Bramwell is 102.
What is the Total Female Population of Bramwell?
Total Female Population of Bramwell is 78.
What is the Ratio of Males per 100 Females in Bramwell?
There are 130.77 Males per 100 Females in Bramwell.
What is the Ratio of Females per 100 Males in Bramwell?
There are 76.47 Females per 100 Males in Bramwell.
What is the Median Population Age in Bramwell?
Median Population Age in Bramwell is 62.0 Years.
What is the Average Family Size in Bramwell
Average Family Size in Bramwell is 2.4 People.
What is the Average Household Size in Bramwell
Average Household Size in Bramwell is 2.1 People.
How Large is the Labor Force in Bramwell?
There are 61 People in the Labor Forcein in Bramwell.
What is the Percentage of People in the Labor Force in Bramwell?
37.2% of People are in the Labor Force in Bramwell.
What is the Unemployment Rate in Bramwell?
Unemployment Rate in Bramwell is 24.6%.