Waitsfield, VT Map & Demographics
Waitsfield Map
Waitsfield Overview
$52,930
PER CAPITA INCOME
$155,625
AVG FAMILY INCOME
$33,558
AVG HOUSEHOLD INCOME
0.58
INEQUALITY / GINI INDEX
228
TOTAL POPULATION
111
MALE POPULATION
117
FEMALE POPULATION
94.87
MALES / 100 FEMALES
105.41
FEMALES / 100 MALES
62.9
MEDIAN AGE
3.2
AVG FAMILY SIZE
1.2
AVG HOUSEHOLD SIZE
116
LABOR FORCE [ PEOPLE ]
53.7%
PERCENT IN LABOR FORCE
Waitsfield Zip Codes
Waitsfield Area Codes
Income in Waitsfield
Income Overview in Waitsfield
Per Capita Income in Waitsfield is $52,930, while median incomes of families and households are $155,625 and $33,558 respectively.
| Characteristic | Number | Measure |
| Per Capita Income | 228 | $52,930 |
| Median Family Income | 20 | $155,625 |
| Mean Family Income | 20 | $240,270 |
| Median Household Income | 183 | $33,558 |
| Mean Household Income | 183 | $62,993 |
| Income Deficit | 20 | $0 |
| Wage / Income Gap (%) | 228 | 0.00% |
| Wage / Income Gap ($) | 228 | 100.00¢ per $1 |
| Gini / Inequality Index | 228 | 0.58 |
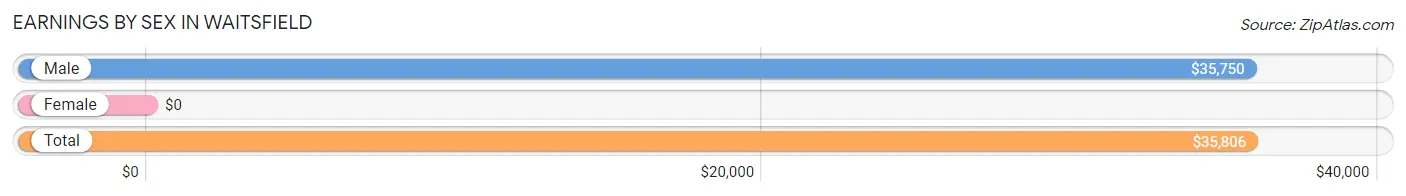
Earnings by Sex in Waitsfield
| Sex | Number | Average Earnings |
| Male | 81 (69.8%) | $35,750 |
| Female | 35 (30.2%) | $0 |
| Total | 116 (100.0%) | $35,806 |
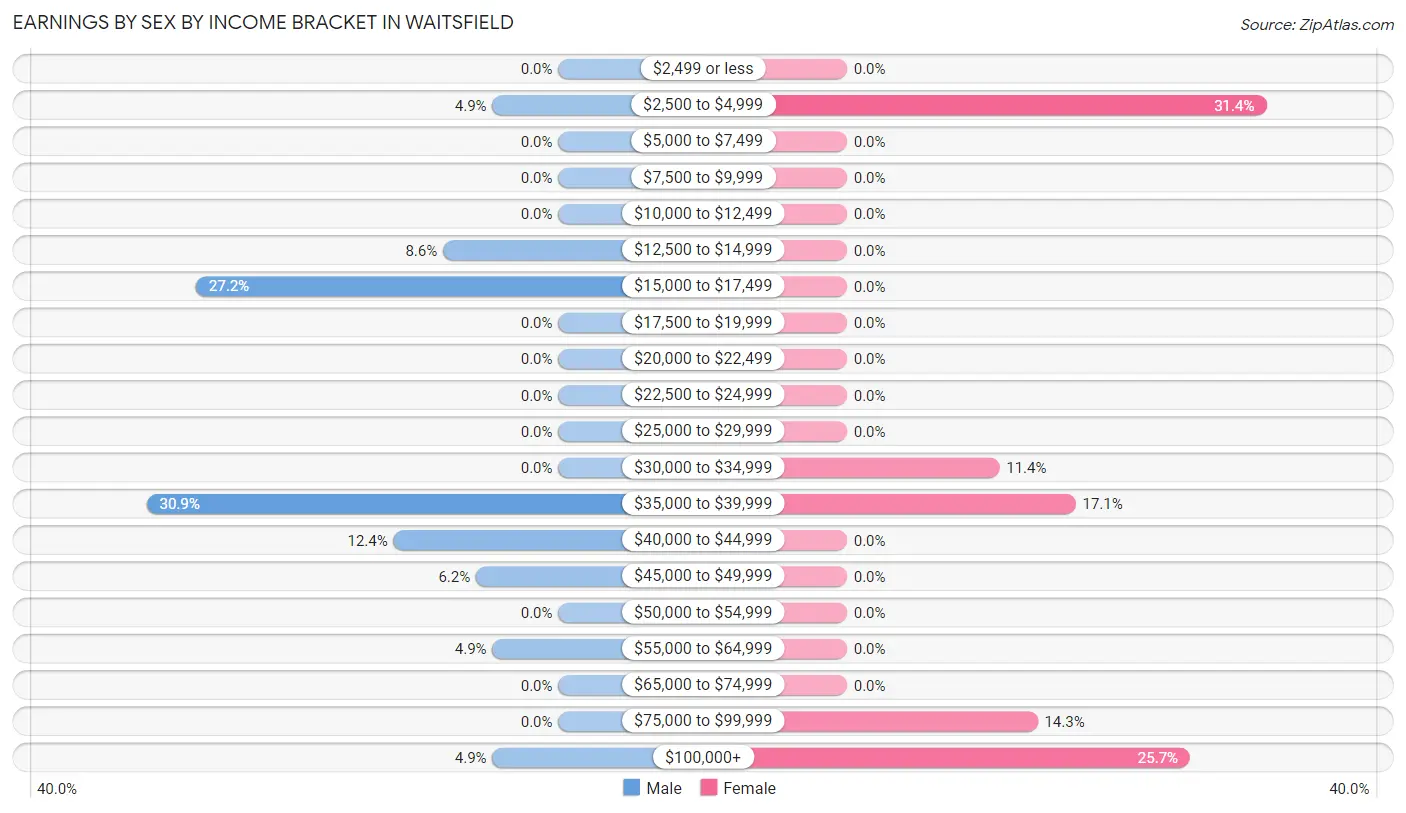
Earnings by Sex by Income Bracket in Waitsfield
The most common earnings brackets in Waitsfield are $35,000 to $39,999 for men (25 | 30.9%) and $2,500 to $4,999 for women (11 | 31.4%).
| Income | Male | Female |
| $2,499 or less | 0 (0.0%) | 0 (0.0%) |
| $2,500 to $4,999 | 4 (4.9%) | 11 (31.4%) |
| $5,000 to $7,499 | 0 (0.0%) | 0 (0.0%) |
| $7,500 to $9,999 | 0 (0.0%) | 0 (0.0%) |
| $10,000 to $12,499 | 0 (0.0%) | 0 (0.0%) |
| $12,500 to $14,999 | 7 (8.6%) | 0 (0.0%) |
| $15,000 to $17,499 | 22 (27.2%) | 0 (0.0%) |
| $17,500 to $19,999 | 0 (0.0%) | 0 (0.0%) |
| $20,000 to $22,499 | 0 (0.0%) | 0 (0.0%) |
| $22,500 to $24,999 | 0 (0.0%) | 0 (0.0%) |
| $25,000 to $29,999 | 0 (0.0%) | 0 (0.0%) |
| $30,000 to $34,999 | 0 (0.0%) | 4 (11.4%) |
| $35,000 to $39,999 | 25 (30.9%) | 6 (17.1%) |
| $40,000 to $44,999 | 10 (12.3%) | 0 (0.0%) |
| $45,000 to $49,999 | 5 (6.2%) | 0 (0.0%) |
| $50,000 to $54,999 | 0 (0.0%) | 0 (0.0%) |
| $55,000 to $64,999 | 4 (4.9%) | 0 (0.0%) |
| $65,000 to $74,999 | 0 (0.0%) | 0 (0.0%) |
| $75,000 to $99,999 | 0 (0.0%) | 5 (14.3%) |
| $100,000+ | 4 (4.9%) | 9 (25.7%) |
| Total | 81 (100.0%) | 35 (100.0%) |
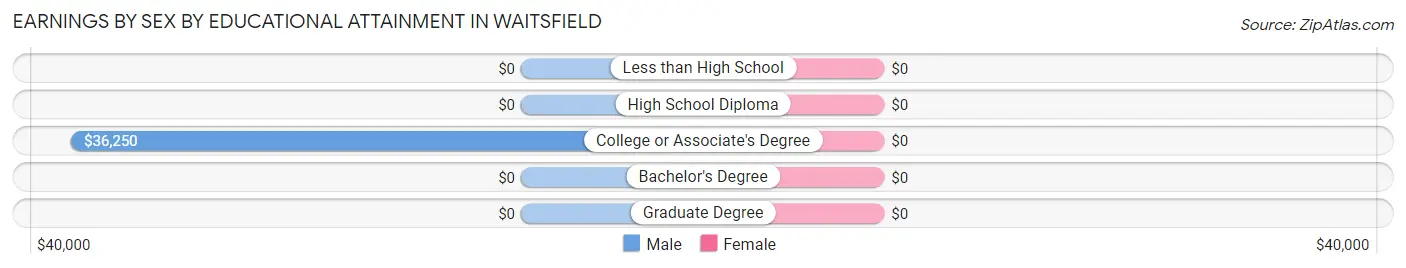
Earnings by Sex by Educational Attainment in Waitsfield
| Educational Attainment | Male Income | Female Income |
| Less than High School | - | - |
| High School Diploma | - | - |
| College or Associate's Degree | $36,250 | $0 |
| Bachelor's Degree | - | - |
| Graduate Degree | - | - |
| Total | $35,750 | $0 |
Family Income in Waitsfield
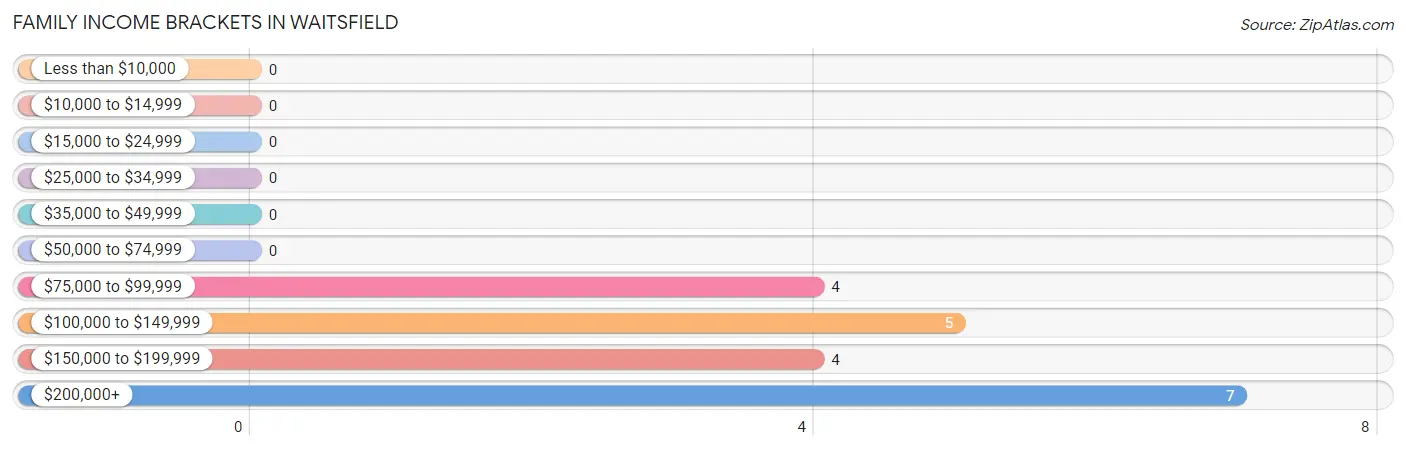
Family Income Brackets in Waitsfield
According to the Waitsfield family income data, there are 7 families falling into the $200,000+ income range, which is the most common income bracket and makes up 35.0% of all families.
| Income Bracket | # Families | % Families |
| Less than $10,000 | 0 | 0.0% |
| $10,000 to $14,999 | 0 | 0.0% |
| $15,000 to $24,999 | 0 | 0.0% |
| $25,000 to $34,999 | 0 | 0.0% |
| $35,000 to $49,999 | 0 | 0.0% |
| $50,000 to $74,999 | 0 | 0.0% |
| $75,000 to $99,999 | 4 | 20.0% |
| $100,000 to $149,999 | 5 | 25.0% |
| $150,000 to $199,999 | 4 | 20.0% |
| $200,000+ | 7 | 35.0% |
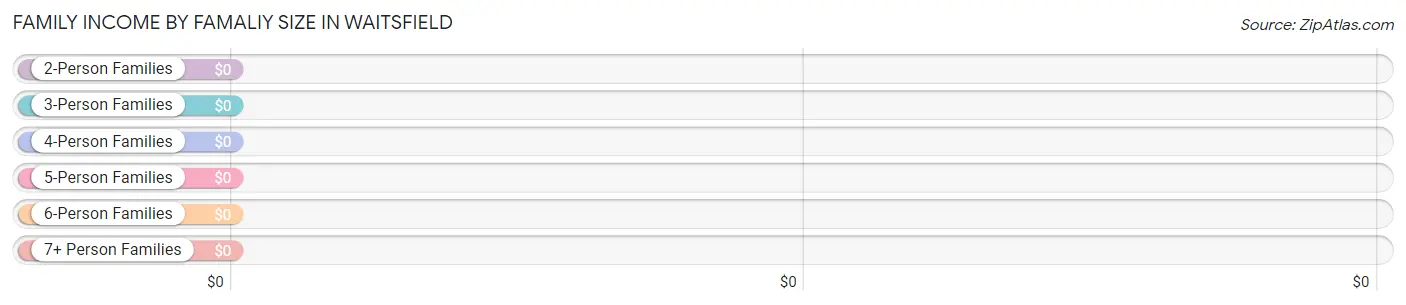
Family Income by Famaliy Size in Waitsfield
| Income Bracket | # Families | Median Income |
| 2-Person Families | 7 (35.0%) | $0 |
| 3-Person Families | 9 (45.0%) | $0 |
| 4-Person Families | 0 (0.0%) | $0 |
| 5-Person Families | 0 (0.0%) | $0 |
| 6-Person Families | 0 (0.0%) | $0 |
| 7+ Person Families | 4 (20.0%) | $0 |
| Total | 20 (100.0%) | $155,625 |
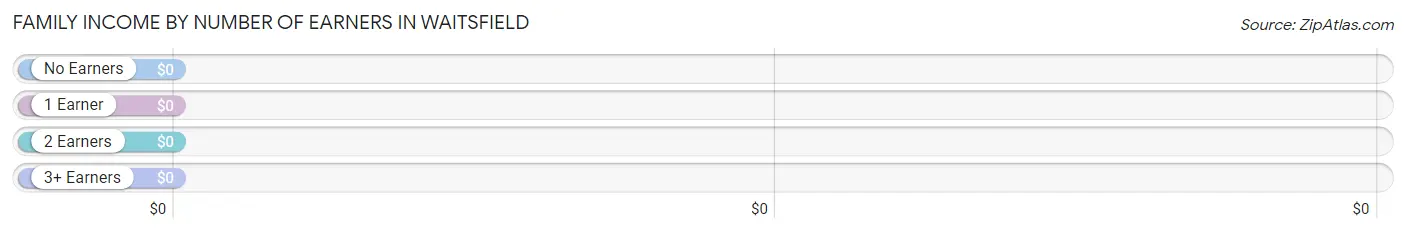
Family Income by Number of Earners in Waitsfield
| Number of Earners | # Families | Median Income |
| No Earners | 0 (0.0%) | $0 |
| 1 Earner | 11 (55.0%) | $0 |
| 2 Earners | 5 (25.0%) | $0 |
| 3+ Earners | 4 (20.0%) | $0 |
| Total | 20 (100.0%) | $155,625 |
Household Income in Waitsfield
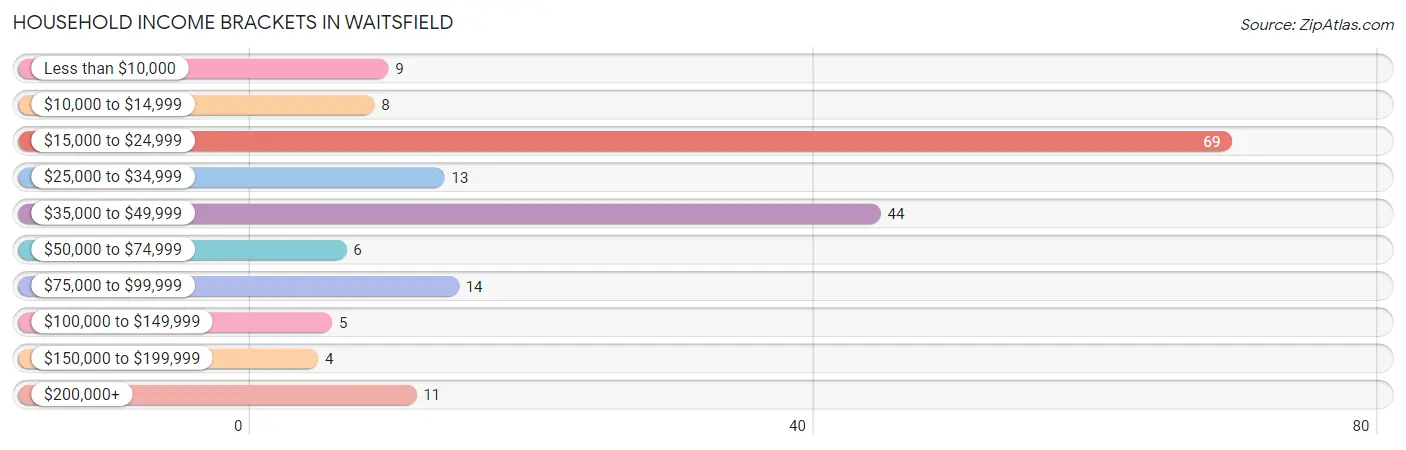
Household Income Brackets in Waitsfield
With 69 households falling in the category, the $15,000 to $24,999 income range is the most frequent in Waitsfield, accounting for 37.7% of all households. In contrast, only 4 households (2.2%) fall into the $150,000 to $199,999 income bracket, making it the least populous group.
| Income Bracket | # Households | % Households |
| Less than $10,000 | 9 | 4.9% |
| $10,000 to $14,999 | 8 | 4.4% |
| $15,000 to $24,999 | 69 | 37.7% |
| $25,000 to $34,999 | 13 | 7.1% |
| $35,000 to $49,999 | 44 | 24.0% |
| $50,000 to $74,999 | 6 | 3.3% |
| $75,000 to $99,999 | 14 | 7.7% |
| $100,000 to $149,999 | 5 | 2.7% |
| $150,000 to $199,999 | 4 | 2.2% |
| $200,000+ | 11 | 6.0% |
Household Income by Householder Age in Waitsfield
The median household income in Waitsfield is $33,558, with the highest median household income of $37,050 found in the 25 to 44 years age bracket for the primary householder. A total of 55 households (30.0%) fall into this category.
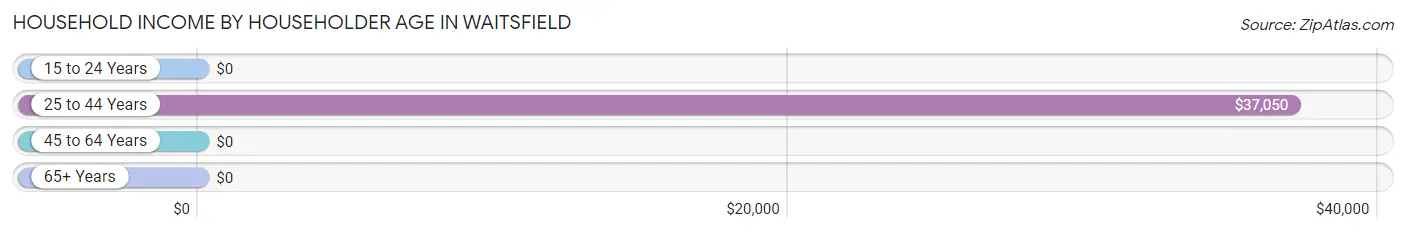
| Income Bracket | # Households | Median Income |
| 15 to 24 Years | 0 (0.0%) | $0 |
| 25 to 44 Years | 55 (30.0%) | $37,050 |
| 45 to 64 Years | 32 (17.5%) | $0 |
| 65+ Years | 96 (52.5%) | $0 |
| Total | 183 (100.0%) | $33,558 |
Poverty in Waitsfield
Income Below Poverty by Sex and Age in Waitsfield
With 7.2% poverty level for males and 7.7% for females among the residents of Waitsfield, 75 year old and over males and 75 year old and over females are the most vulnerable to poverty, with 8 males (42.1%) and 9 females (16.4%) in their respective age groups living below the poverty level.
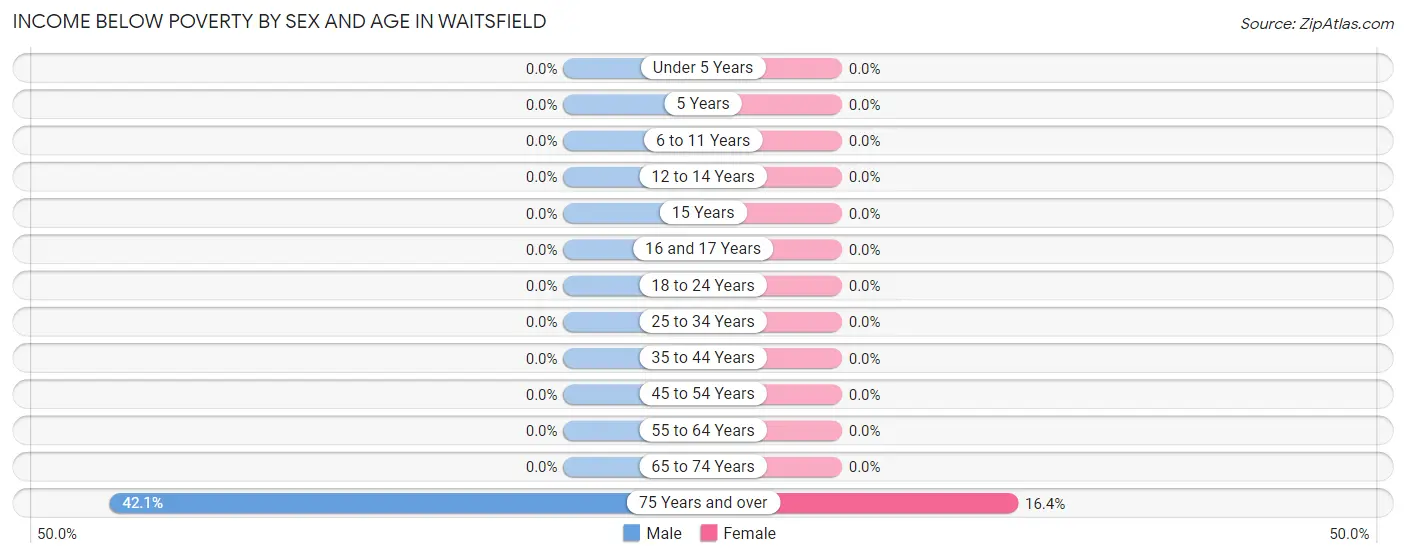
| Age Bracket | Male | Female |
| Under 5 Years | 0 (0.0%) | 0 (0.0%) |
| 5 Years | 0 (0.0%) | 0 (0.0%) |
| 6 to 11 Years | 0 (0.0%) | 0 (0.0%) |
| 12 to 14 Years | 0 (0.0%) | 0 (0.0%) |
| 15 Years | 0 (0.0%) | 0 (0.0%) |
| 16 and 17 Years | 0 (0.0%) | 0 (0.0%) |
| 18 to 24 Years | 0 (0.0%) | 0 (0.0%) |
| 25 to 34 Years | 0 (0.0%) | 0 (0.0%) |
| 35 to 44 Years | 0 (0.0%) | 0 (0.0%) |
| 45 to 54 Years | 0 (0.0%) | 0 (0.0%) |
| 55 to 64 Years | 0 (0.0%) | 0 (0.0%) |
| 65 to 74 Years | 0 (0.0%) | 0 (0.0%) |
| 75 Years and over | 8 (42.1%) | 9 (16.4%) |
| Total | 8 (7.2%) | 9 (7.7%) |
Income Above Poverty by Sex and Age in Waitsfield
According to the poverty statistics in Waitsfield, males aged under 5 years and females aged under 5 years are the age groups that are most secure financially, with 100.0% of males and 100.0% of females in these age groups living above the poverty line.
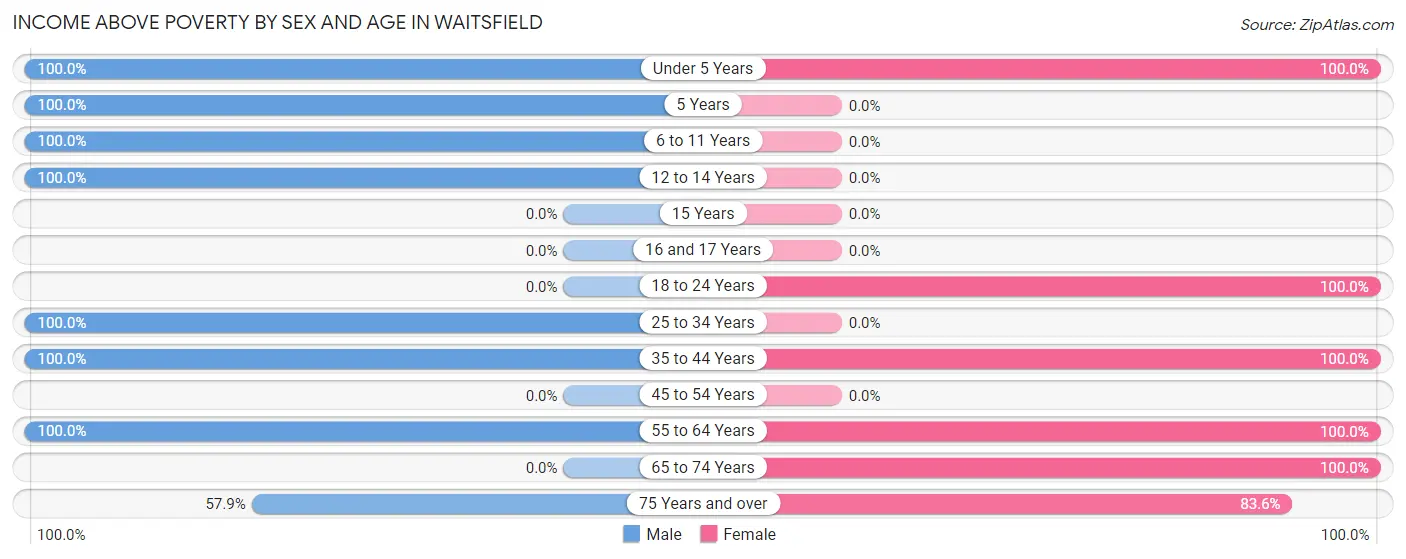
| Age Bracket | Male | Female |
| Under 5 Years | 3 (100.0%) | 1 (100.0%) |
| 5 Years | 5 (100.0%) | 0 (0.0%) |
| 6 to 11 Years | 2 (100.0%) | 0 (0.0%) |
| 12 to 14 Years | 1 (100.0%) | 0 (0.0%) |
| 15 Years | 0 (0.0%) | 0 (0.0%) |
| 16 and 17 Years | 0 (0.0%) | 0 (0.0%) |
| 18 to 24 Years | 0 (0.0%) | 11 (100.0%) |
| 25 to 34 Years | 10 (100.0%) | 0 (0.0%) |
| 35 to 44 Years | 45 (100.0%) | 9 (100.0%) |
| 45 to 54 Years | 0 (0.0%) | 0 (0.0%) |
| 55 to 64 Years | 26 (100.0%) | 10 (100.0%) |
| 65 to 74 Years | 0 (0.0%) | 31 (100.0%) |
| 75 Years and over | 11 (57.9%) | 46 (83.6%) |
| Total | 103 (92.8%) | 108 (92.3%) |
Income Below Poverty Among Married-Couple Families in Waitsfield
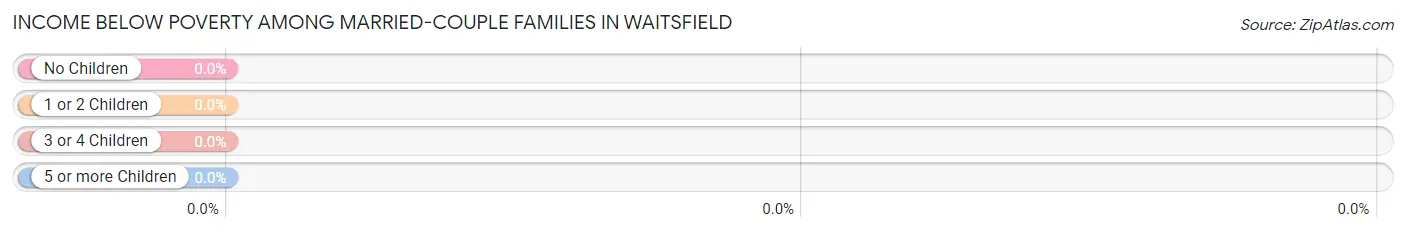
| Children | Above Poverty | Below Poverty |
| No Children | 11 (100.0%) | 0 (0.0%) |
| 1 or 2 Children | 5 (100.0%) | 0 (0.0%) |
| 3 or 4 Children | 0 (0.0%) | 0 (0.0%) |
| 5 or more Children | 4 (100.0%) | 0 (0.0%) |
| Total | 20 (100.0%) | 0 (0.0%) |
Income Below Poverty Among Single-Parent Households in Waitsfield
| Children | Single Father | Single Mother |
| No Children | 0 (0.0%) | 0 (0.0%) |
| 1 or 2 Children | 0 (0.0%) | 0 (0.0%) |
| 3 or 4 Children | 0 (0.0%) | 0 (0.0%) |
| 5 or more Children | 0 (0.0%) | 0 (0.0%) |
| Total | 0 (0.0%) | 0 (0.0%) |
Income Below Poverty Among Married-Couple vs Single-Parent Households in Waitsfield
| Children | Married-Couple Families | Single-Parent Households |
| No Children | 0 (0.0%) | 0 (0.0%) |
| 1 or 2 Children | 0 (0.0%) | 0 (0.0%) |
| 3 or 4 Children | 0 (0.0%) | 0 (0.0%) |
| 5 or more Children | 0 (0.0%) | 0 (0.0%) |
| Total | 0 (0.0%) | 0 (0.0%) |
Race in Waitsfield
The most populous races in Waitsfield are White / Caucasian (211 | 92.5%), Hispanic or Latino (20 | 8.8%), and Two or more Races (13 | 5.7%).
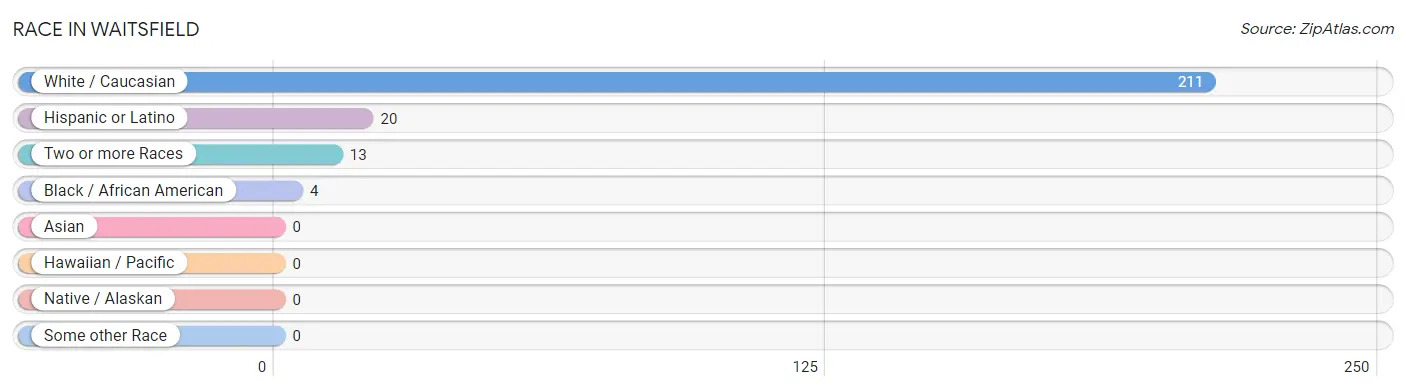
| Race | # Population | % Population |
| Asian | 0 | 0.0% |
| Black / African American | 4 | 1.8% |
| Hawaiian / Pacific | 0 | 0.0% |
| Hispanic or Latino | 20 | 8.8% |
| Native / Alaskan | 0 | 0.0% |
| White / Caucasian | 211 | 92.5% |
| Two or more Races | 13 | 5.7% |
| Some other Race | 0 | 0.0% |
| Total | 228 | 100.0% |
Ancestry in Waitsfield
The most populous ancestries reported in Waitsfield are English (59 | 25.9%), French (49 | 21.5%), Irish (47 | 20.6%), French Canadian (23 | 10.1%), and German (21 | 9.2%), together accounting for 87.3% of all Waitsfield residents.
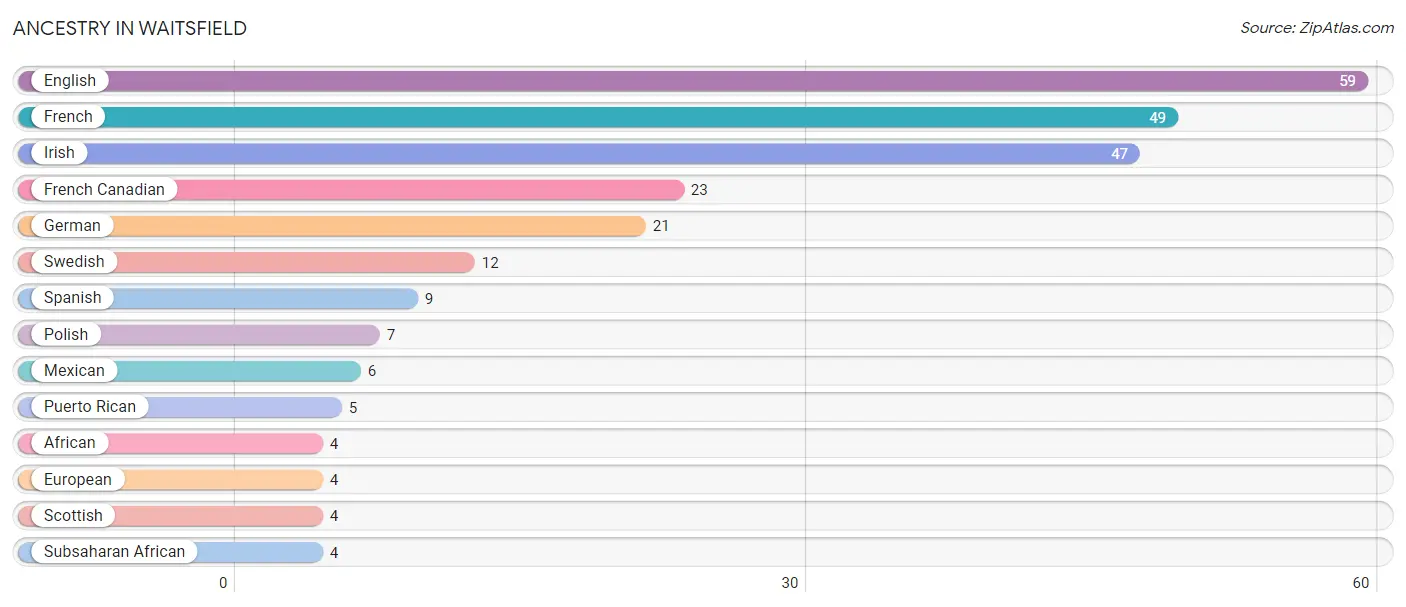
| Ancestry | # Population | % Population |
| African | 4 | 1.8% |
| English | 59 | 25.9% |
| European | 4 | 1.8% |
| French | 49 | 21.5% |
| French Canadian | 23 | 10.1% |
| German | 21 | 9.2% |
| Irish | 47 | 20.6% |
| Mexican | 6 | 2.6% |
| Polish | 7 | 3.1% |
| Puerto Rican | 5 | 2.2% |
| Scottish | 4 | 1.8% |
| Spanish | 9 | 4.0% |
| Subsaharan African | 4 | 1.8% |
| Swedish | 12 | 5.3% | View All 14 Rows |
Immigrants in Waitsfield

| Immigration Origin | # Population | % Population | View All 0 Rows |
Sex and Age in Waitsfield
Sex and Age in Waitsfield
The most populous age groups in Waitsfield are 35 to 39 Years (38 | 34.2%) for men and 85 Years and over (37 | 31.6%) for women.
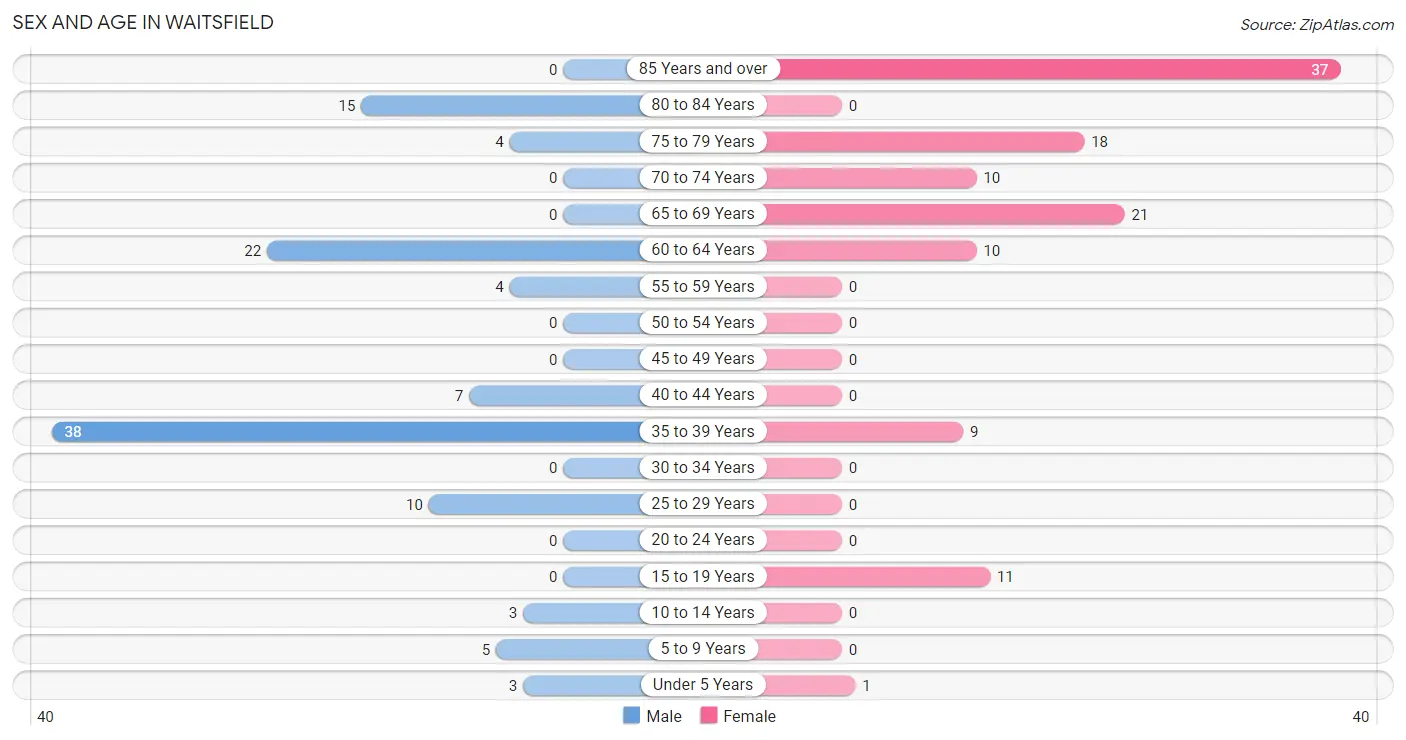
| Age Bracket | Male | Female |
| Under 5 Years | 3 (2.7%) | 1 (0.9%) |
| 5 to 9 Years | 5 (4.5%) | 0 (0.0%) |
| 10 to 14 Years | 3 (2.7%) | 0 (0.0%) |
| 15 to 19 Years | 0 (0.0%) | 11 (9.4%) |
| 20 to 24 Years | 0 (0.0%) | 0 (0.0%) |
| 25 to 29 Years | 10 (9.0%) | 0 (0.0%) |
| 30 to 34 Years | 0 (0.0%) | 0 (0.0%) |
| 35 to 39 Years | 38 (34.2%) | 9 (7.7%) |
| 40 to 44 Years | 7 (6.3%) | 0 (0.0%) |
| 45 to 49 Years | 0 (0.0%) | 0 (0.0%) |
| 50 to 54 Years | 0 (0.0%) | 0 (0.0%) |
| 55 to 59 Years | 4 (3.6%) | 0 (0.0%) |
| 60 to 64 Years | 22 (19.8%) | 10 (8.6%) |
| 65 to 69 Years | 0 (0.0%) | 21 (17.9%) |
| 70 to 74 Years | 0 (0.0%) | 10 (8.6%) |
| 75 to 79 Years | 4 (3.6%) | 18 (15.4%) |
| 80 to 84 Years | 15 (13.5%) | 0 (0.0%) |
| 85 Years and over | 0 (0.0%) | 37 (31.6%) |
| Total | 111 (100.0%) | 117 (100.0%) |
Families and Households in Waitsfield
Median Family Size in Waitsfield
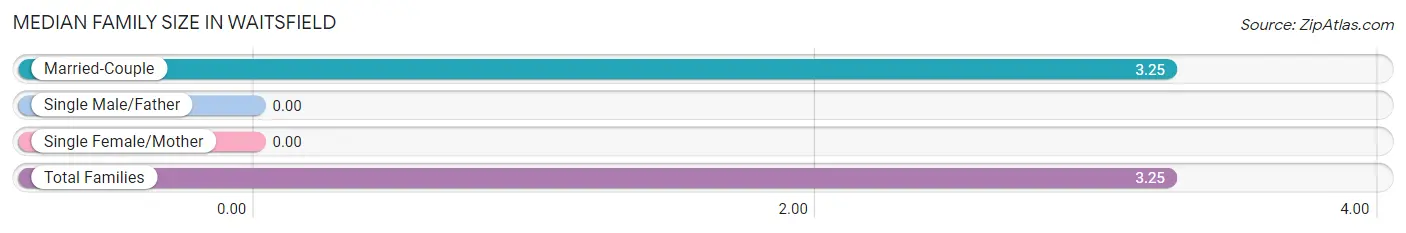
| Family Type | # Families | Family Size |
| Married-Couple | 20 (100.0%) | 3.25 |
| Single Male/Father | 0 (0.0%) | - |
| Single Female/Mother | 0 (0.0%) | - |
| Total Families | 20 (100.0%) | 3.25 |
Median Household Size in Waitsfield
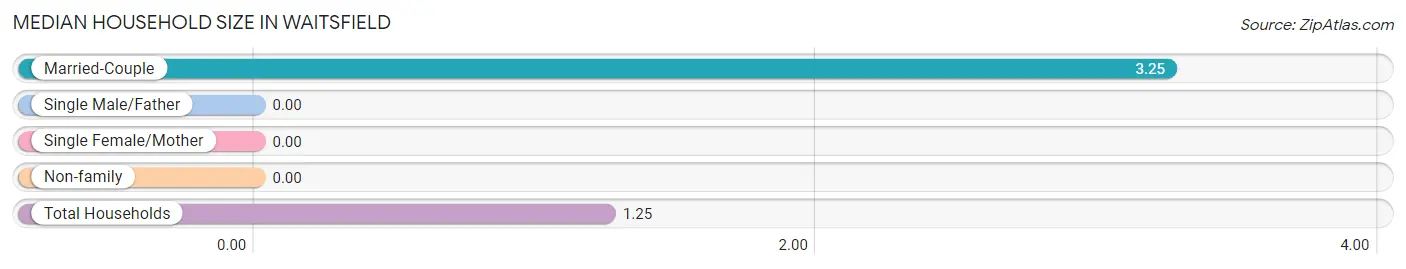
| Household Type | # Households | Household Size |
| Married-Couple | 20 (10.9%) | 3.25 |
| Single Male/Father | 0 (0.0%) | - |
| Single Female/Mother | 0 (0.0%) | - |
| Non-family | 163 (89.1%) | - |
| Total Households | 183 (100.0%) | 1.25 |
Household Size by Marriage Status in Waitsfield
Out of a total of 183 households in Waitsfield, 20 (10.9%) are family households, while 163 (89.1%) are nonfamily households. The most numerous type of family households are 3-person households, comprising 9, and the most common type of nonfamily households are 1-person households, comprising 163.
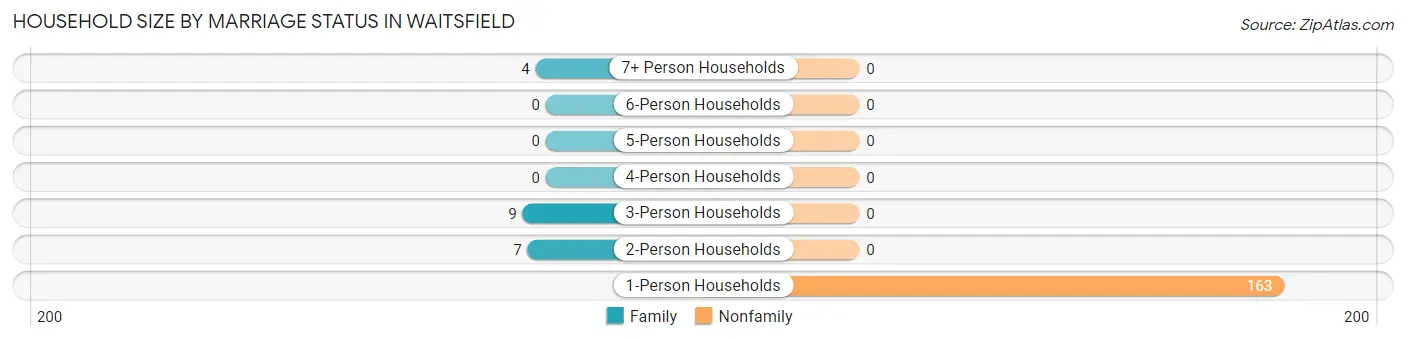
| Household Size | Family Households | Nonfamily Households |
| 1-Person Households | - | 163 (89.1%) |
| 2-Person Households | 7 (3.8%) | 0 (0.0%) |
| 3-Person Households | 9 (4.9%) | 0 (0.0%) |
| 4-Person Households | 0 (0.0%) | 0 (0.0%) |
| 5-Person Households | 0 (0.0%) | 0 (0.0%) |
| 6-Person Households | 0 (0.0%) | 0 (0.0%) |
| 7+ Person Households | 4 (2.2%) | 0 (0.0%) |
| Total | 20 (10.9%) | 163 (89.1%) |
Female Fertility in Waitsfield
Fertility by Age in Waitsfield
| Age Bracket | Women with Births | Births / 1,000 Women |
| 15 to 19 years | 0 (0.0%) | 0.0 |
| 20 to 34 years | 0 (0.0%) | 0.0 |
| 35 to 50 years | 0 (0.0%) | 0.0 |
| Total | 0 (0.0%) | 0.0 |
Fertility by Age by Marriage Status in Waitsfield
| Age Bracket | Married | Unmarried |
| 15 to 19 years | 0 (0.0%) | 0 (0.0%) |
| 20 to 34 years | 0 (0.0%) | 0 (0.0%) |
| 35 to 50 years | 0 (0.0%) | 0 (0.0%) |
| Total | 0 (0.0%) | 0 (0.0%) |
Fertility by Education in Waitsfield
| Educational Attainment | Women with Births | Births / 1,000 Women |
| Less than High School | 0 (0.0%) | 0.0 |
| High School Diploma | 0 (0.0%) | 0.0 |
| College or Associate's Degree | 0 (0.0%) | 0.0 |
| Bachelor's Degree | 0 (0.0%) | 0.0 |
| Graduate Degree | 0 (0.0%) | 0.0 |
| Total | 0 (0.0%) | 0.0 |
Fertility by Education by Marriage Status in Waitsfield
| Educational Attainment | Married | Unmarried |
| Less than High School | 0 (0.0%) | 0 (0.0%) |
| High School Diploma | 0 (0.0%) | 0 (0.0%) |
| College or Associate's Degree | 0 (0.0%) | 0 (0.0%) |
| Bachelor's Degree | 0 (0.0%) | 0 (0.0%) |
| Graduate Degree | 0 (0.0%) | 0 (0.0%) |
| Total | 0 (0.0%) | 0 (0.0%) |
Employment Characteristics in Waitsfield
Employment by Class of Employer in Waitsfield
Among the 94 employed individuals in Waitsfield, private company employees (66 | 70.2%), self-employed (not incorporated) (9 | 9.6%), and self-employed (incorporated) (8 | 8.5%) make up the most common classes of employment.
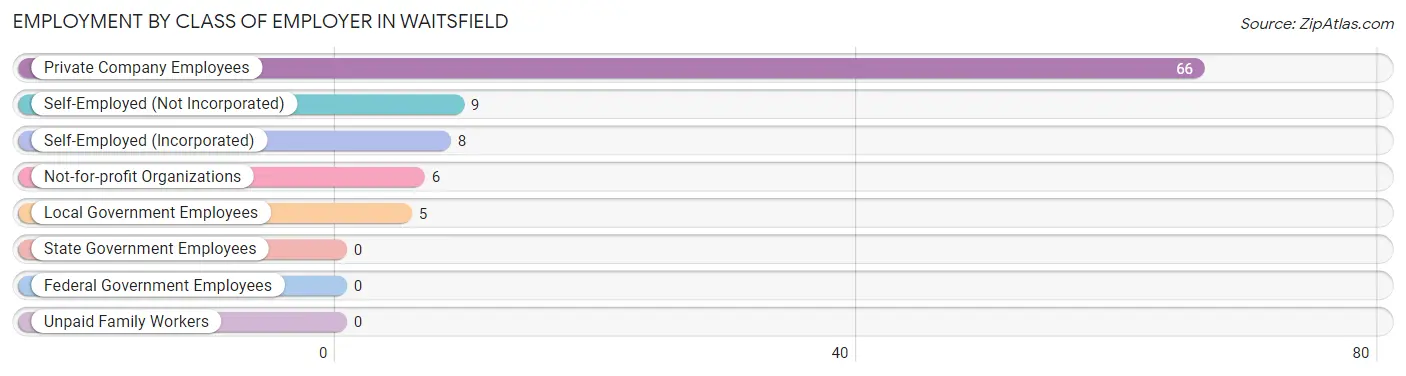
| Employer Class | # Employees | % Employees |
| Private Company Employees | 66 | 70.2% |
| Self-Employed (Incorporated) | 8 | 8.5% |
| Self-Employed (Not Incorporated) | 9 | 9.6% |
| Not-for-profit Organizations | 6 | 6.4% |
| Local Government Employees | 5 | 5.3% |
| State Government Employees | 0 | 0.0% |
| Federal Government Employees | 0 | 0.0% |
| Unpaid Family Workers | 0 | 0.0% |
| Total | 94 | 100.0% |
Employment Status by Age in Waitsfield
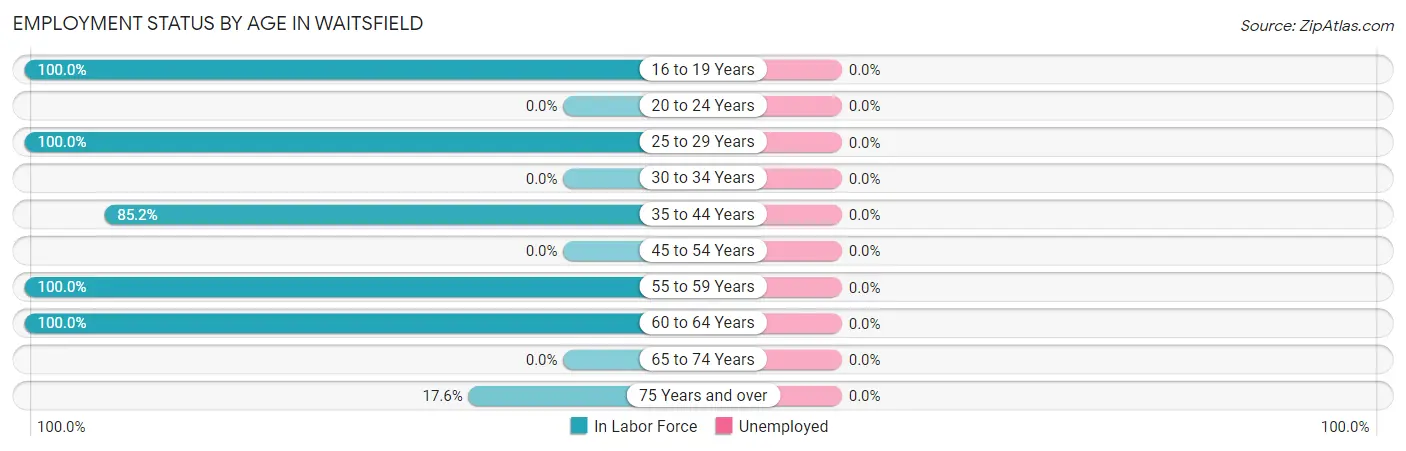
| Age Bracket | In Labor Force | Unemployed |
| 16 to 19 Years | 11 (100.0%) | 0 (0.0%) |
| 20 to 24 Years | 0 (0.0%) | 0 (0.0%) |
| 25 to 29 Years | 10 (100.0%) | 0 (0.0%) |
| 30 to 34 Years | 0 (0.0%) | 0 (0.0%) |
| 35 to 44 Years | 46 (85.2%) | 0 (0.0%) |
| 45 to 54 Years | 0 (0.0%) | 0 (0.0%) |
| 55 to 59 Years | 4 (100.0%) | 0 (0.0%) |
| 60 to 64 Years | 32 (100.0%) | 0 (0.0%) |
| 65 to 74 Years | 0 (0.0%) | 0 (0.0%) |
| 75 Years and over | 13 (17.6%) | 0 (0.0%) |
| Total | 116 (53.7%) | 0 (0.0%) |
Employment Status by Educational Attainment in Waitsfield
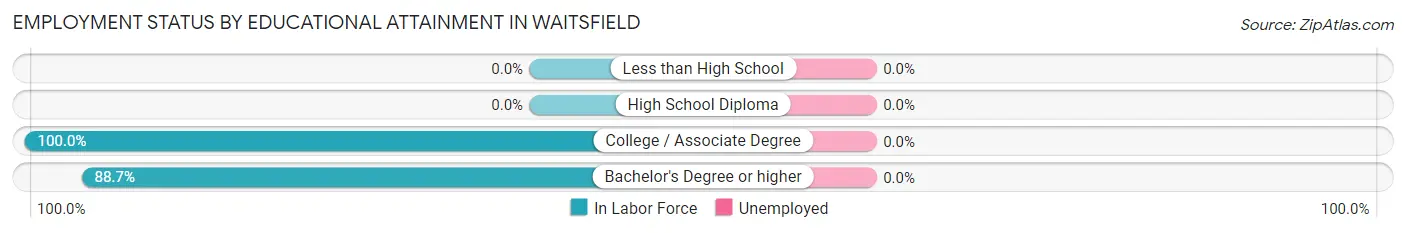
| Educational Attainment | In Labor Force | Unemployed |
| Less than High School | 0 (0.0%) | 0 (0.0%) |
| High School Diploma | 0 (0.0%) | 0 (0.0%) |
| College / Associate Degree | 29 (100.0%) | 0 (0.0%) |
| Bachelor's Degree or higher | 63 (88.7%) | 0 (0.0%) |
| Total | 92 (92.0%) | 0 (0.0%) |
Employment Occupations by Sex in Waitsfield
Management, Business, Science and Arts Occupations
The most common Management, Business, Science and Arts occupations in Waitsfield are Computers, Engineering & Science (18 | 15.5%), Management (9 | 7.8%), Architecture & Engineering (8 | 6.9%), Life, Physical & Social Science (6 | 5.2%), and Community & Social Service (5 | 4.3%).
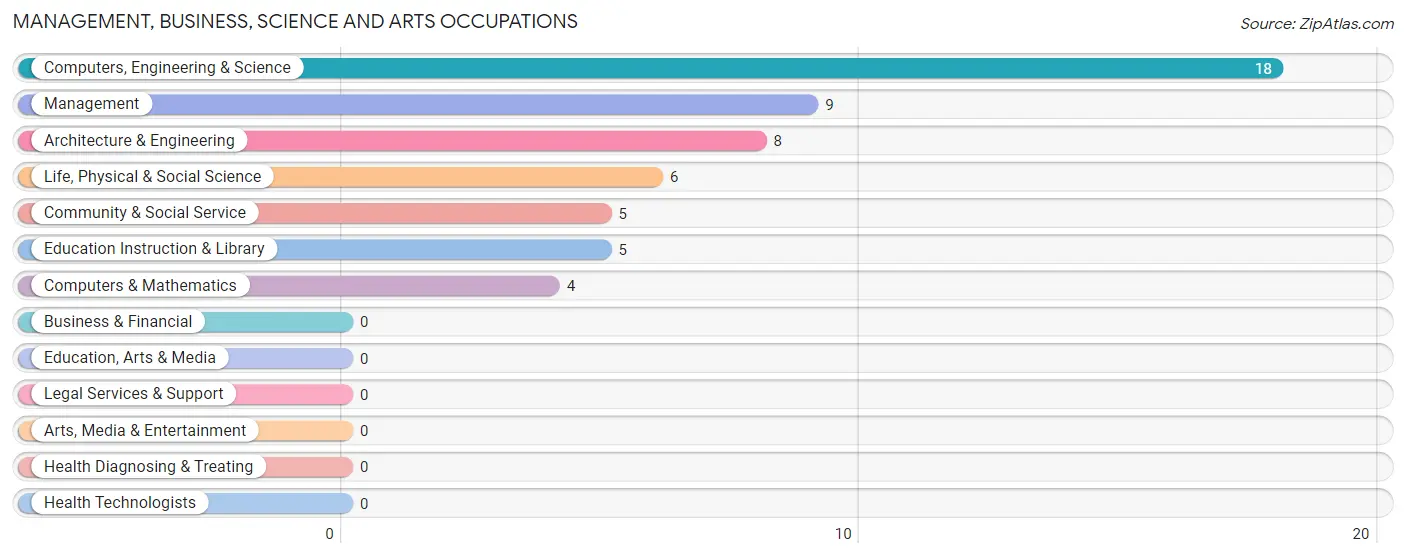
Management, Business, Science and Arts Occupations by Sex
Within the Management, Business, Science and Arts occupations in Waitsfield, the most male-oriented occupations are Computers & Mathematics (100.0%), Community & Social Service (100.0%), and Education Instruction & Library (100.0%), while the most female-oriented occupations are Management (100.0%), Life, Physical & Social Science (100.0%), and Computers, Engineering & Science (55.6%).
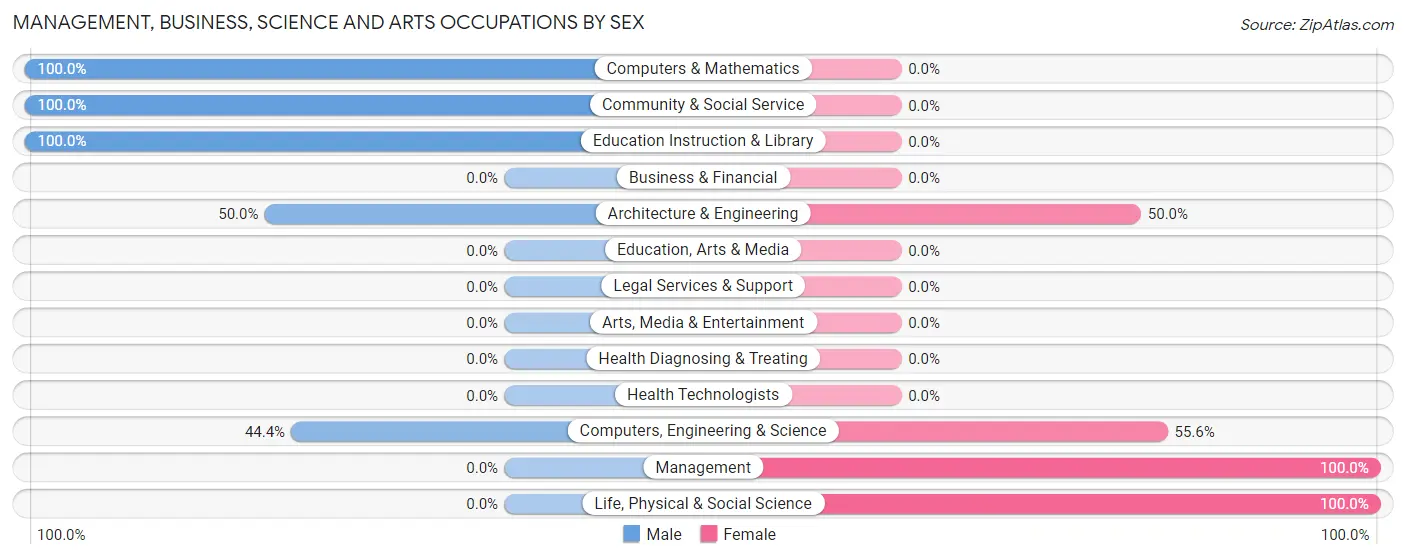
| Occupation | Male | Female |
| Management | 0 (0.0%) | 9 (100.0%) |
| Business & Financial | 0 (0.0%) | 0 (0.0%) |
| Computers, Engineering & Science | 8 (44.4%) | 10 (55.6%) |
| Computers & Mathematics | 4 (100.0%) | 0 (0.0%) |
| Architecture & Engineering | 4 (50.0%) | 4 (50.0%) |
| Life, Physical & Social Science | 0 (0.0%) | 6 (100.0%) |
| Community & Social Service | 5 (100.0%) | 0 (0.0%) |
| Education, Arts & Media | 0 (0.0%) | 0 (0.0%) |
| Legal Services & Support | 0 (0.0%) | 0 (0.0%) |
| Education Instruction & Library | 5 (100.0%) | 0 (0.0%) |
| Arts, Media & Entertainment | 0 (0.0%) | 0 (0.0%) |
| Health Diagnosing & Treating | 0 (0.0%) | 0 (0.0%) |
| Health Technologists | 0 (0.0%) | 0 (0.0%) |
| Total (Category) | 13 (40.6%) | 19 (59.4%) |
| Total (Overall) | 81 (69.8%) | 35 (30.2%) |
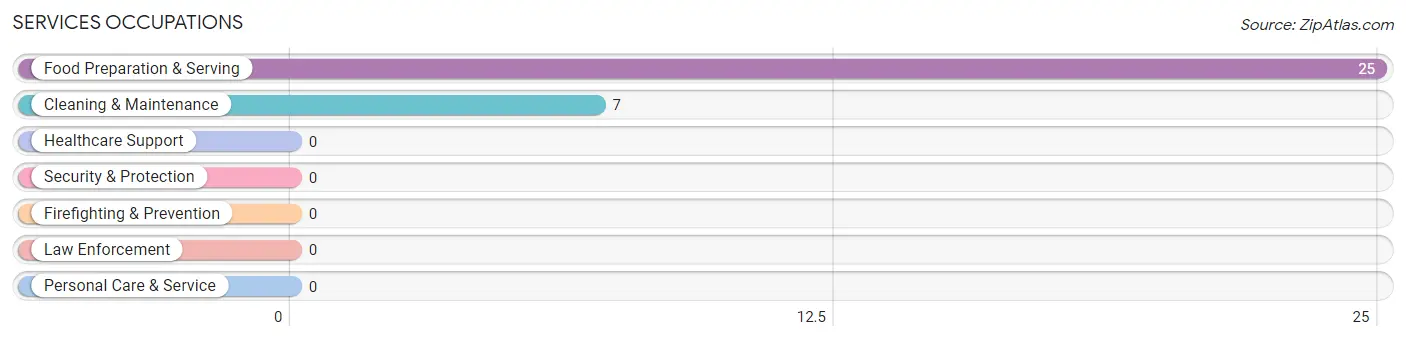
Services Occupations
The most common Services occupations in Waitsfield are Food Preparation & Serving (25 | 21.5%), and Cleaning & Maintenance (7 | 6.0%).
Services Occupations by Sex
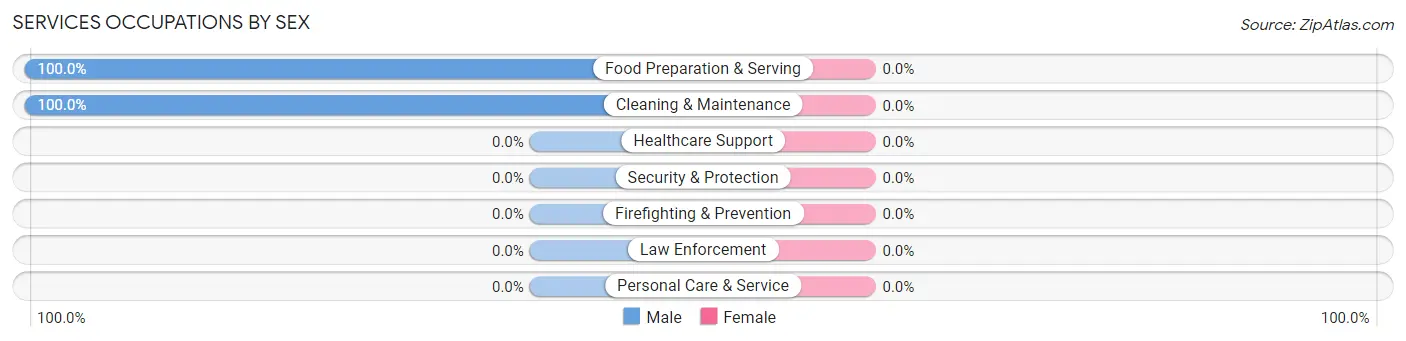
| Occupation | Male | Female |
| Healthcare Support | 0 (0.0%) | 0 (0.0%) |
| Security & Protection | 0 (0.0%) | 0 (0.0%) |
| Firefighting & Prevention | 0 (0.0%) | 0 (0.0%) |
| Law Enforcement | 0 (0.0%) | 0 (0.0%) |
| Food Preparation & Serving | 25 (100.0%) | 0 (0.0%) |
| Cleaning & Maintenance | 7 (100.0%) | 0 (0.0%) |
| Personal Care & Service | 0 (0.0%) | 0 (0.0%) |
| Total (Category) | 32 (100.0%) | 0 (0.0%) |
| Total (Overall) | 81 (69.8%) | 35 (30.2%) |
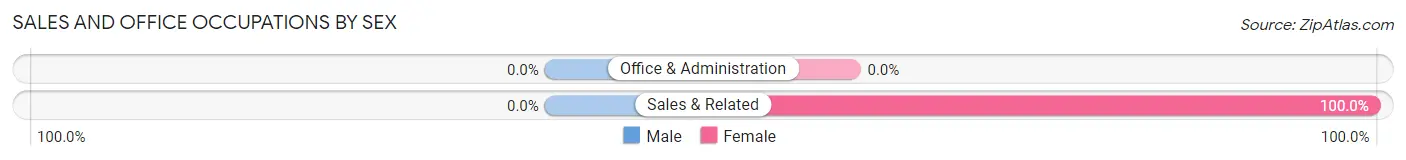
Sales and Office Occupations
The most common Sales and Office occupations in Waitsfield are , and Sales & Related (5 | 4.3%).
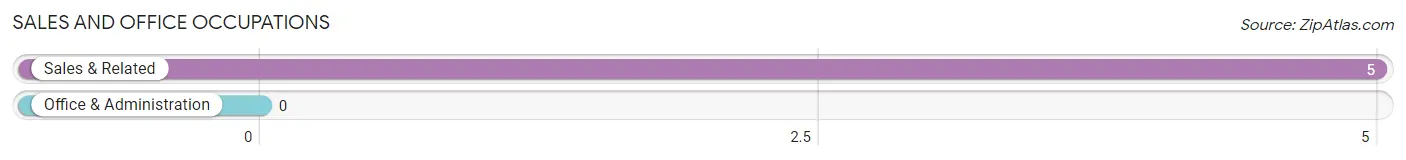
Sales and Office Occupations by Sex
| Occupation | Male | Female |
| Sales & Related | 0 (0.0%) | 5 (100.0%) |
| Office & Administration | 0 (0.0%) | 0 (0.0%) |
| Total (Category) | 0 (0.0%) | 5 (100.0%) |
| Total (Overall) | 81 (69.8%) | 35 (30.2%) |
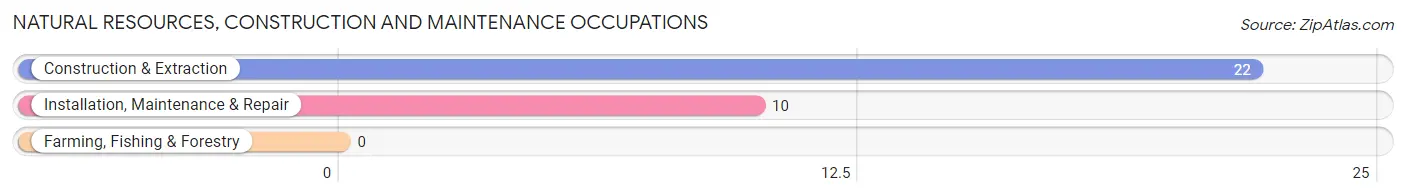
Natural Resources, Construction and Maintenance Occupations
The most common Natural Resources, Construction and Maintenance occupations in Waitsfield are Construction & Extraction (22 | 19.0%), and Installation, Maintenance & Repair (10 | 8.6%).
Natural Resources, Construction and Maintenance Occupations by Sex
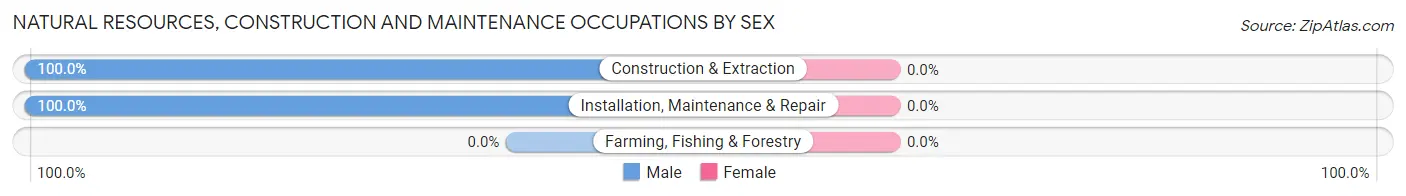
| Occupation | Male | Female |
| Farming, Fishing & Forestry | 0 (0.0%) | 0 (0.0%) |
| Construction & Extraction | 22 (100.0%) | 0 (0.0%) |
| Installation, Maintenance & Repair | 10 (100.0%) | 0 (0.0%) |
| Total (Category) | 32 (100.0%) | 0 (0.0%) |
| Total (Overall) | 81 (69.8%) | 35 (30.2%) |
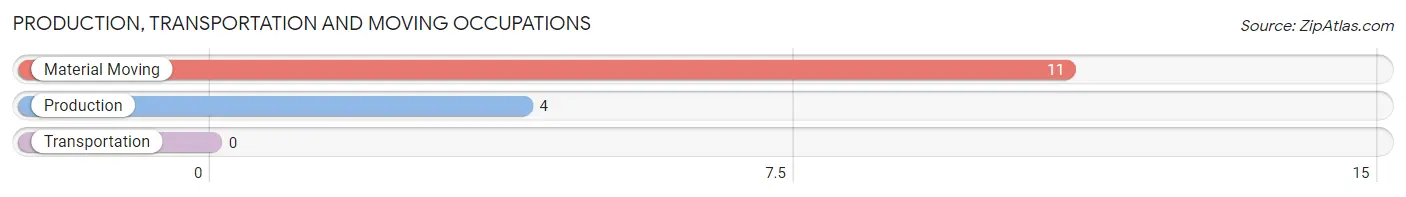
Production, Transportation and Moving Occupations
The most common Production, Transportation and Moving occupations in Waitsfield are Material Moving (11 | 9.5%), and Production (4 | 3.5%).
Production, Transportation and Moving Occupations by Sex
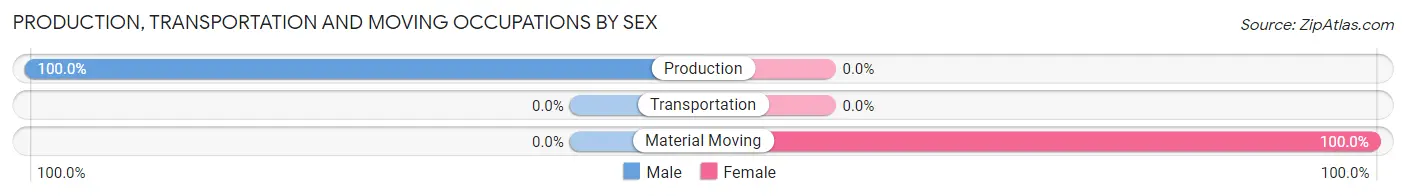
| Occupation | Male | Female |
| Production | 4 (100.0%) | 0 (0.0%) |
| Transportation | 0 (0.0%) | 0 (0.0%) |
| Material Moving | 0 (0.0%) | 11 (100.0%) |
| Total (Category) | 4 (26.7%) | 11 (73.3%) |
| Total (Overall) | 81 (69.8%) | 35 (30.2%) |
Employment Industries by Sex in Waitsfield
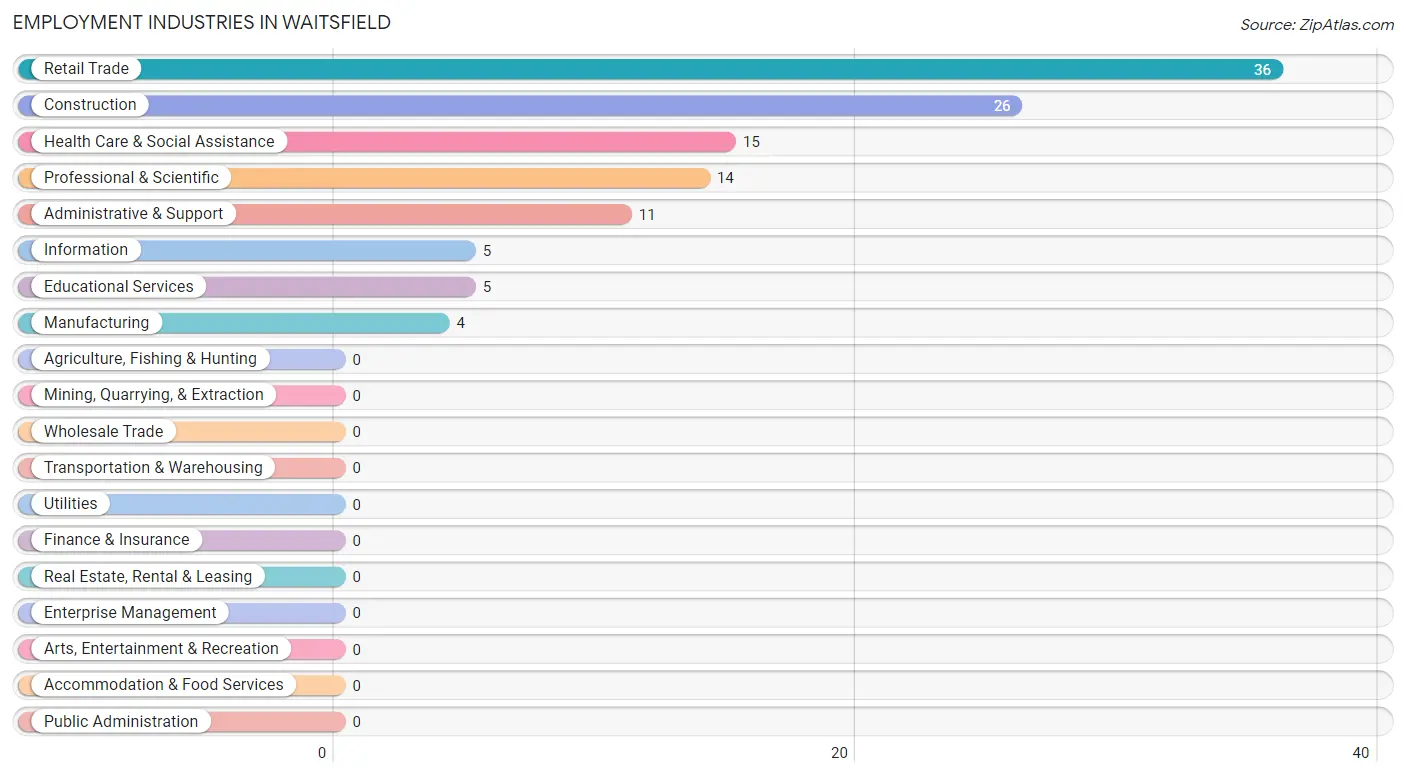
Employment Industries in Waitsfield
The major employment industries in Waitsfield include Retail Trade (36 | 31.0%), Construction (26 | 22.4%), Health Care & Social Assistance (15 | 12.9%), Professional & Scientific (14 | 12.1%), and Administrative & Support (11 | 9.5%).
Employment Industries by Sex in Waitsfield
The Waitsfield industries that see more men than women are Construction (100.0%), Manufacturing (100.0%), and Administrative & Support (100.0%), whereas the industries that tend to have a higher number of women are Information (100.0%), Health Care & Social Assistance (100.0%), and Retail Trade (30.6%).
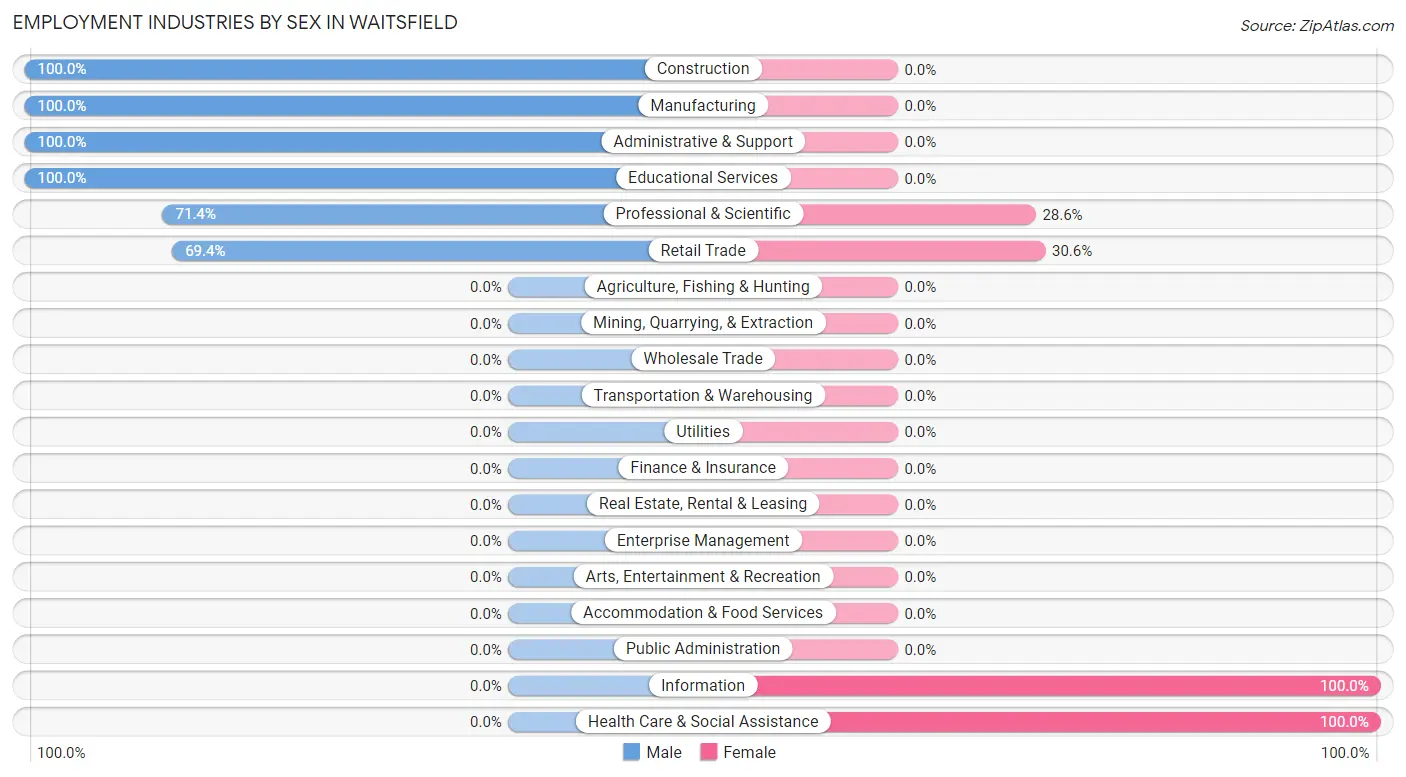
| Industry | Male | Female |
| Agriculture, Fishing & Hunting | 0 (0.0%) | 0 (0.0%) |
| Mining, Quarrying, & Extraction | 0 (0.0%) | 0 (0.0%) |
| Construction | 26 (100.0%) | 0 (0.0%) |
| Manufacturing | 4 (100.0%) | 0 (0.0%) |
| Wholesale Trade | 0 (0.0%) | 0 (0.0%) |
| Retail Trade | 25 (69.4%) | 11 (30.6%) |
| Transportation & Warehousing | 0 (0.0%) | 0 (0.0%) |
| Utilities | 0 (0.0%) | 0 (0.0%) |
| Information | 0 (0.0%) | 5 (100.0%) |
| Finance & Insurance | 0 (0.0%) | 0 (0.0%) |
| Real Estate, Rental & Leasing | 0 (0.0%) | 0 (0.0%) |
| Professional & Scientific | 10 (71.4%) | 4 (28.6%) |
| Enterprise Management | 0 (0.0%) | 0 (0.0%) |
| Administrative & Support | 11 (100.0%) | 0 (0.0%) |
| Educational Services | 5 (100.0%) | 0 (0.0%) |
| Health Care & Social Assistance | 0 (0.0%) | 15 (100.0%) |
| Arts, Entertainment & Recreation | 0 (0.0%) | 0 (0.0%) |
| Accommodation & Food Services | 0 (0.0%) | 0 (0.0%) |
| Public Administration | 0 (0.0%) | 0 (0.0%) |
| Total | 81 (69.8%) | 35 (30.2%) |
Education in Waitsfield
School Enrollment in Waitsfield
The most common levels of schooling among the 20 students in Waitsfield are high school (11 | 55.0%), kindergarten (5 | 25.0%), and elementary school (2 | 10.0%).
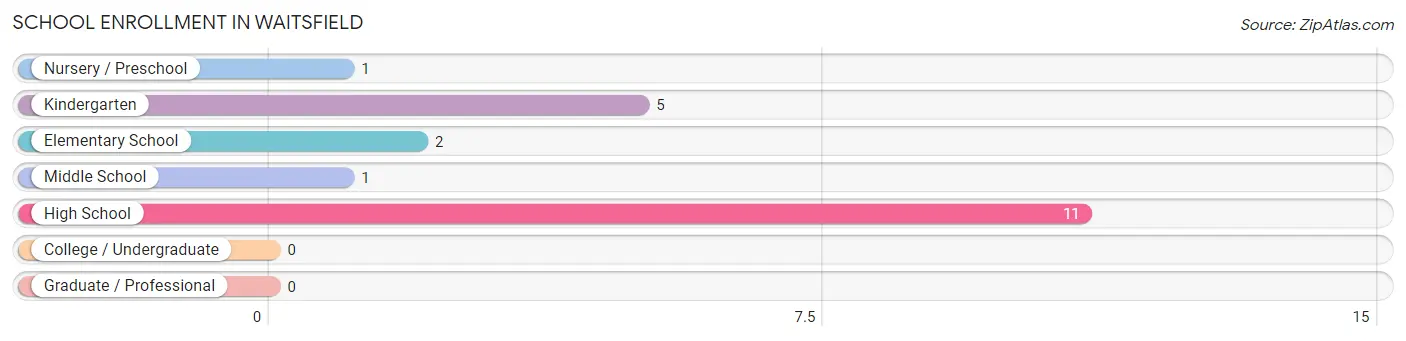
| School Level | # Students | % Students |
| Nursery / Preschool | 1 | 5.0% |
| Kindergarten | 5 | 25.0% |
| Elementary School | 2 | 10.0% |
| Middle School | 1 | 5.0% |
| High School | 11 | 55.0% |
| College / Undergraduate | 0 | 0.0% |
| Graduate / Professional | 0 | 0.0% |
| Total | 20 | 100.0% |
School Enrollment by Age by Funding Source in Waitsfield
Out of a total of 20 students who are enrolled in schools in Waitsfield, 11 (55.0%) attend a private institution, while the remaining 9 (45.0%) are enrolled in public schools. The age group of 18 to 19 year olds has the highest likelihood of being enrolled in private schools, with 11 (100.0% in the age bracket) enrolled. Conversely, the age group of 3 to 4 year olds has the lowest likelihood of being enrolled in a private school, with 1 (100.0% in the age bracket) attending a public institution.
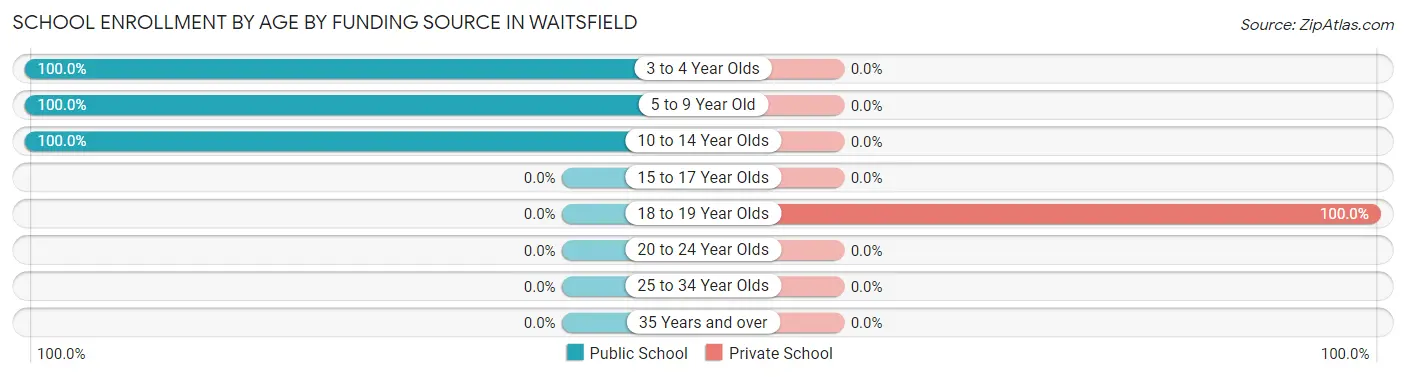
| Age Bracket | Public School | Private School |
| 3 to 4 Year Olds | 1 (100.0%) | 0 (0.0%) |
| 5 to 9 Year Old | 5 (100.0%) | 0 (0.0%) |
| 10 to 14 Year Olds | 3 (100.0%) | 0 (0.0%) |
| 15 to 17 Year Olds | 0 (0.0%) | 0 (0.0%) |
| 18 to 19 Year Olds | 0 (0.0%) | 11 (100.0%) |
| 20 to 24 Year Olds | 0 (0.0%) | 0 (0.0%) |
| 25 to 34 Year Olds | 0 (0.0%) | 0 (0.0%) |
| 35 Years and over | 0 (0.0%) | 0 (0.0%) |
| Total | 9 (45.0%) | 11 (55.0%) |
Educational Attainment by Field of Study in Waitsfield
Arts & humanities (32 | 19.2%), social sciences (28 | 16.8%), business (23 | 13.8%), education (20 | 12.0%), and visual & performing arts (11 | 6.6%) are the most common fields of study among 167 individuals in Waitsfield who have obtained a bachelor's degree or higher.
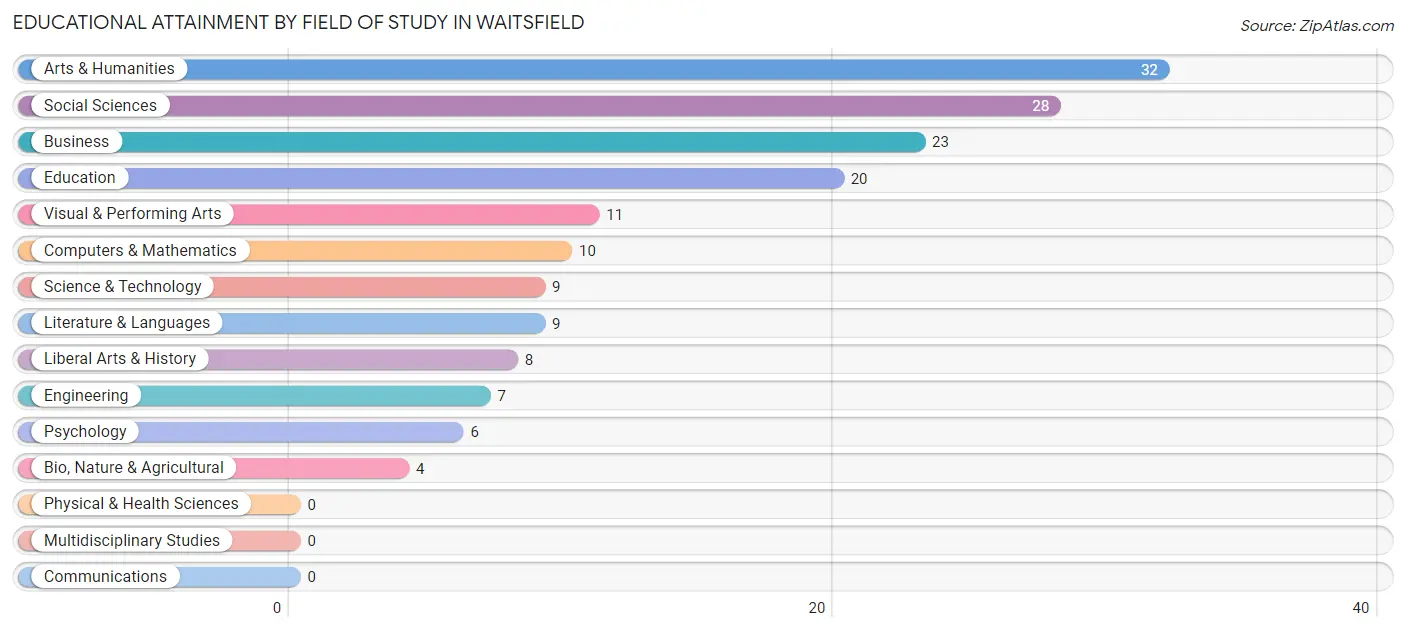
| Field of Study | # Graduates | % Graduates |
| Computers & Mathematics | 10 | 6.0% |
| Bio, Nature & Agricultural | 4 | 2.4% |
| Physical & Health Sciences | 0 | 0.0% |
| Psychology | 6 | 3.6% |
| Social Sciences | 28 | 16.8% |
| Engineering | 7 | 4.2% |
| Multidisciplinary Studies | 0 | 0.0% |
| Science & Technology | 9 | 5.4% |
| Business | 23 | 13.8% |
| Education | 20 | 12.0% |
| Literature & Languages | 9 | 5.4% |
| Liberal Arts & History | 8 | 4.8% |
| Visual & Performing Arts | 11 | 6.6% |
| Communications | 0 | 0.0% |
| Arts & Humanities | 32 | 19.2% |
| Total | 167 | 100.0% |
Transportation & Commute in Waitsfield
Vehicle Availability by Sex in Waitsfield
The most prevalent vehicle ownership categories in Waitsfield are males with 1 vehicle (46, accounting for 78.0%) and females with 1 vehicle (6, making up 131.4%).
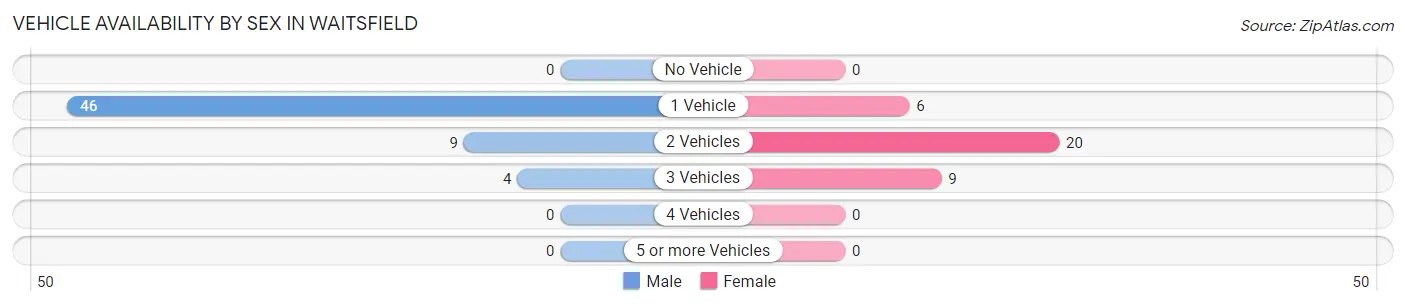
| Vehicles Available | Male | Female |
| No Vehicle | 0 (0.0%) | 0 (0.0%) |
| 1 Vehicle | 46 (78.0%) | 6 (17.1%) |
| 2 Vehicles | 9 (15.2%) | 20 (57.1%) |
| 3 Vehicles | 4 (6.8%) | 9 (25.7%) |
| 4 Vehicles | 0 (0.0%) | 0 (0.0%) |
| 5 or more Vehicles | 0 (0.0%) | 0 (0.0%) |
| Total | 59 (100.0%) | 35 (100.0%) |
Commute Time in Waitsfield
The most frequently occuring commute durations in Waitsfield are 5 to 9 minutes (29 commuters, 35.8%), 10 to 14 minutes (15 commuters, 18.5%), and 60 to 89 minutes (13 commuters, 16.1%).
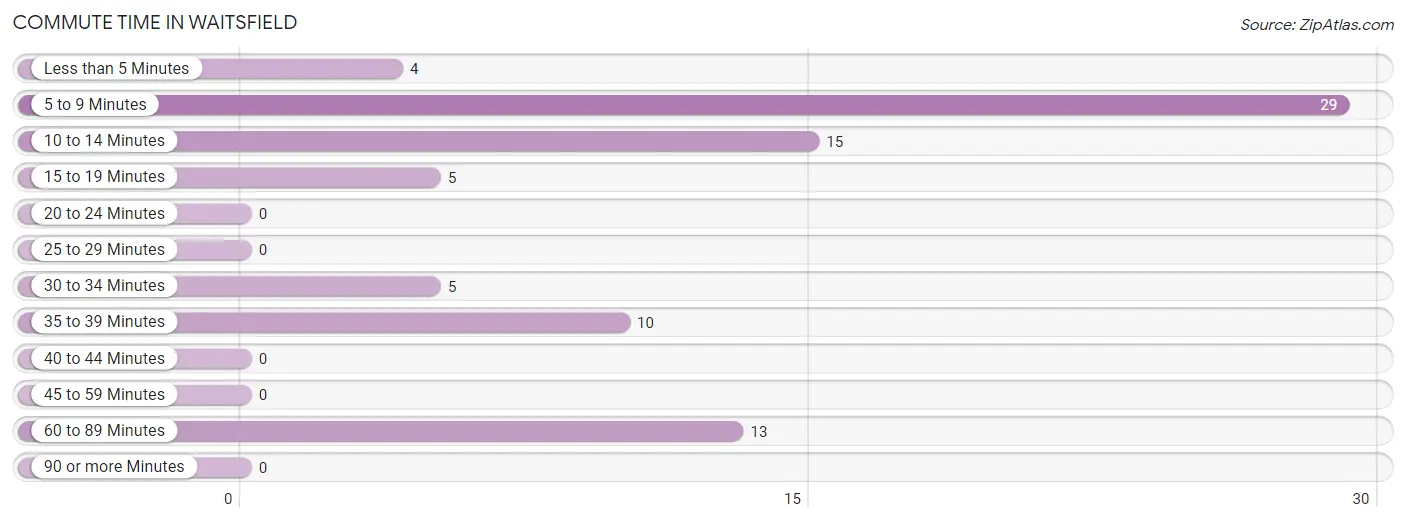
| Commute Time | # Commuters | % Commuters |
| Less than 5 Minutes | 4 | 4.9% |
| 5 to 9 Minutes | 29 | 35.8% |
| 10 to 14 Minutes | 15 | 18.5% |
| 15 to 19 Minutes | 5 | 6.2% |
| 20 to 24 Minutes | 0 | 0.0% |
| 25 to 29 Minutes | 0 | 0.0% |
| 30 to 34 Minutes | 5 | 6.2% |
| 35 to 39 Minutes | 10 | 12.3% |
| 40 to 44 Minutes | 0 | 0.0% |
| 45 to 59 Minutes | 0 | 0.0% |
| 60 to 89 Minutes | 13 | 16.1% |
| 90 or more Minutes | 0 | 0.0% |
Commute Time by Sex in Waitsfield
The most common commute times in Waitsfield are 5 to 9 minutes (25 commuters, 45.5%) for males and 10 to 14 minutes (11 commuters, 42.3%) for females.
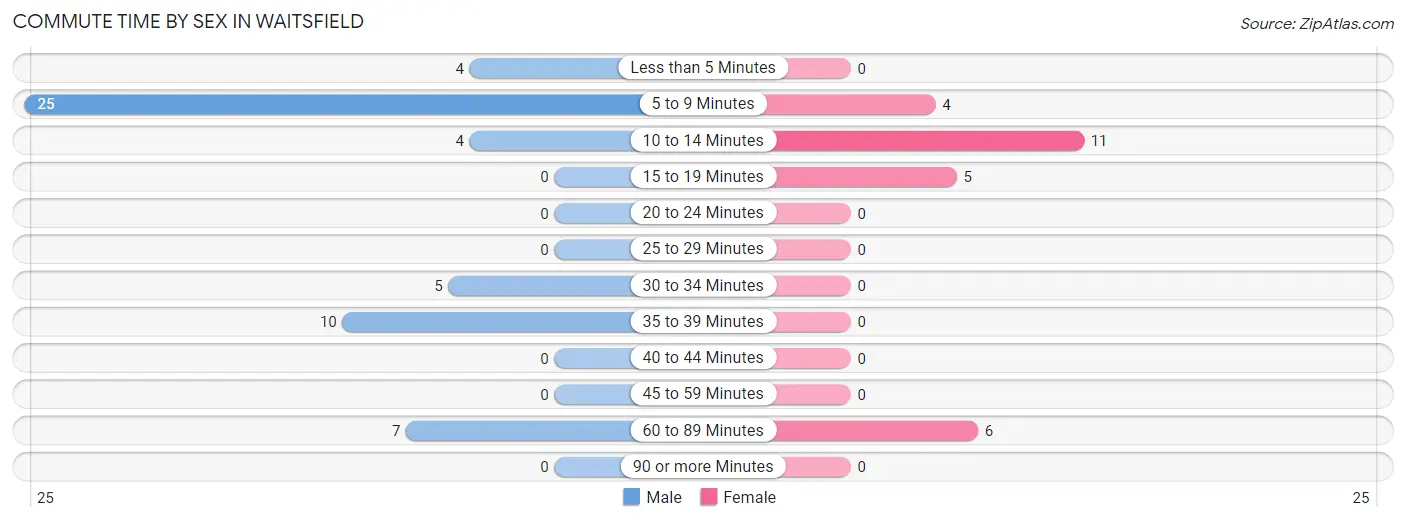
| Commute Time | Male | Female |
| Less than 5 Minutes | 4 (7.3%) | 0 (0.0%) |
| 5 to 9 Minutes | 25 (45.5%) | 4 (15.4%) |
| 10 to 14 Minutes | 4 (7.3%) | 11 (42.3%) |
| 15 to 19 Minutes | 0 (0.0%) | 5 (19.2%) |
| 20 to 24 Minutes | 0 (0.0%) | 0 (0.0%) |
| 25 to 29 Minutes | 0 (0.0%) | 0 (0.0%) |
| 30 to 34 Minutes | 5 (9.1%) | 0 (0.0%) |
| 35 to 39 Minutes | 10 (18.2%) | 0 (0.0%) |
| 40 to 44 Minutes | 0 (0.0%) | 0 (0.0%) |
| 45 to 59 Minutes | 0 (0.0%) | 0 (0.0%) |
| 60 to 89 Minutes | 7 (12.7%) | 6 (23.1%) |
| 90 or more Minutes | 0 (0.0%) | 0 (0.0%) |
Time of Departure to Work by Sex in Waitsfield
The most frequent times of departure to work in Waitsfield are 7:00 AM to 7:29 AM (30, 54.5%) for males and 6:00 AM to 6:29 AM (11, 42.3%) for females.
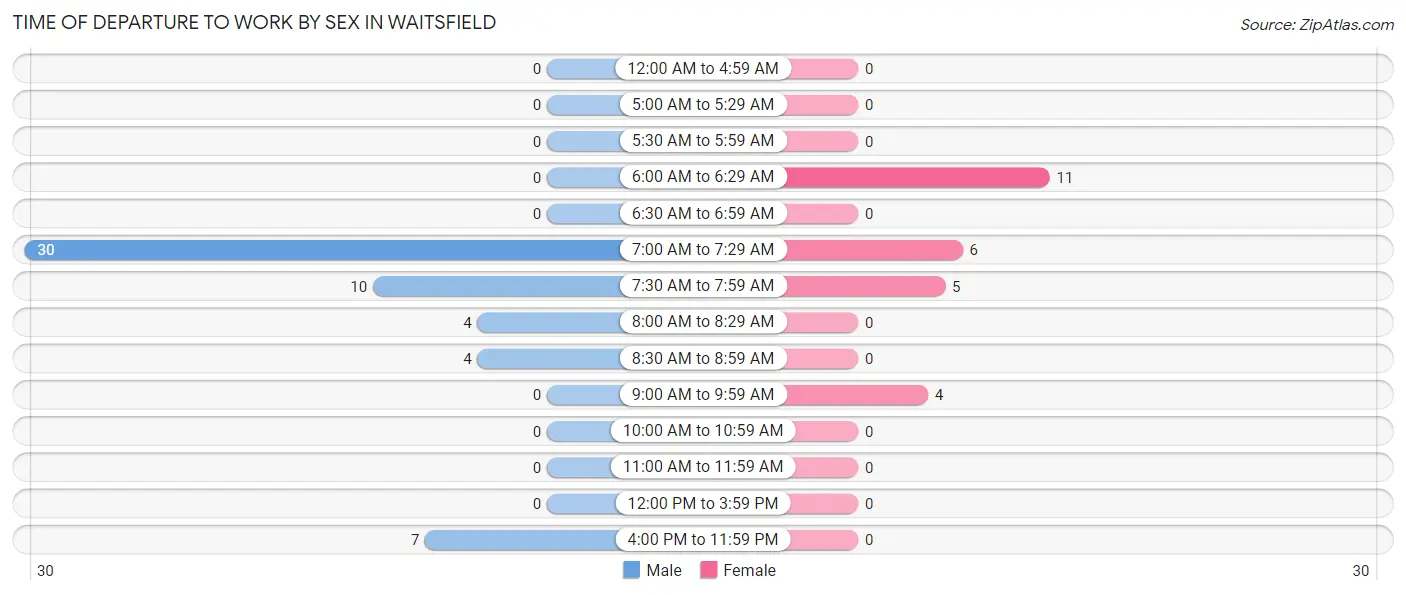
| Time of Departure | Male | Female |
| 12:00 AM to 4:59 AM | 0 (0.0%) | 0 (0.0%) |
| 5:00 AM to 5:29 AM | 0 (0.0%) | 0 (0.0%) |
| 5:30 AM to 5:59 AM | 0 (0.0%) | 0 (0.0%) |
| 6:00 AM to 6:29 AM | 0 (0.0%) | 11 (42.3%) |
| 6:30 AM to 6:59 AM | 0 (0.0%) | 0 (0.0%) |
| 7:00 AM to 7:29 AM | 30 (54.5%) | 6 (23.1%) |
| 7:30 AM to 7:59 AM | 10 (18.2%) | 5 (19.2%) |
| 8:00 AM to 8:29 AM | 4 (7.3%) | 0 (0.0%) |
| 8:30 AM to 8:59 AM | 4 (7.3%) | 0 (0.0%) |
| 9:00 AM to 9:59 AM | 0 (0.0%) | 4 (15.4%) |
| 10:00 AM to 10:59 AM | 0 (0.0%) | 0 (0.0%) |
| 11:00 AM to 11:59 AM | 0 (0.0%) | 0 (0.0%) |
| 12:00 PM to 3:59 PM | 0 (0.0%) | 0 (0.0%) |
| 4:00 PM to 11:59 PM | 7 (12.7%) | 0 (0.0%) |
| Total | 55 (100.0%) | 26 (100.0%) |
Housing Occupancy in Waitsfield
Occupancy by Ownership in Waitsfield
Of the total 183 dwellings in Waitsfield, owner-occupied units account for 57 (31.1%), while renter-occupied units make up 126 (68.9%).
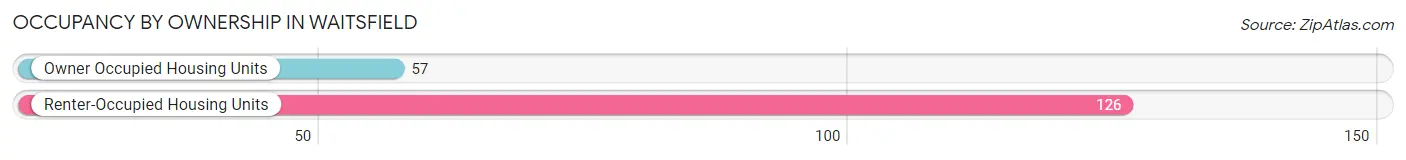
| Occupancy | # Housing Units | % Housing Units |
| Owner Occupied Housing Units | 57 | 31.1% |
| Renter-Occupied Housing Units | 126 | 68.9% |
| Total Occupied Housing Units | 183 | 100.0% |
Occupancy by Household Size in Waitsfield
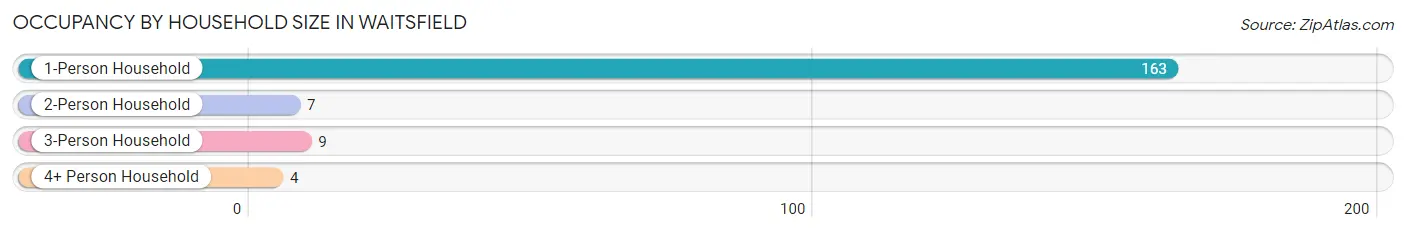
| Household Size | # Housing Units | % Housing Units |
| 1-Person Household | 163 | 89.1% |
| 2-Person Household | 7 | 3.8% |
| 3-Person Household | 9 | 4.9% |
| 4+ Person Household | 4 | 2.2% |
| Total Housing Units | 183 | 100.0% |
Occupancy by Ownership by Household Size in Waitsfield
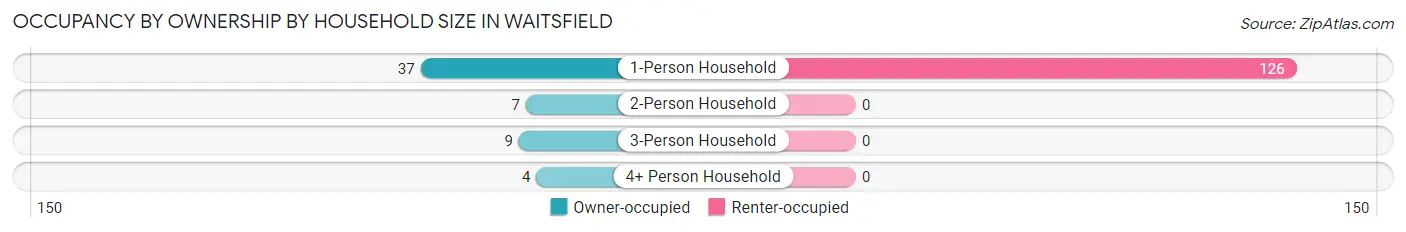
| Household Size | Owner-occupied | Renter-occupied |
| 1-Person Household | 37 (22.7%) | 126 (77.3%) |
| 2-Person Household | 7 (100.0%) | 0 (0.0%) |
| 3-Person Household | 9 (100.0%) | 0 (0.0%) |
| 4+ Person Household | 4 (100.0%) | 0 (0.0%) |
| Total Housing Units | 57 (31.1%) | 126 (68.9%) |
Occupancy by Educational Attainment in Waitsfield
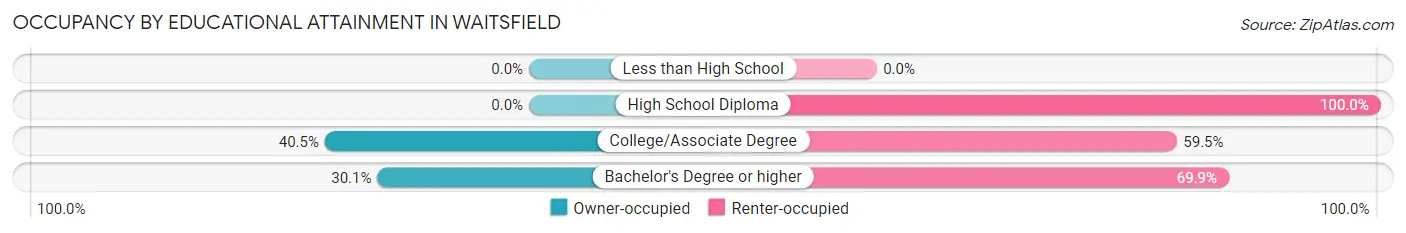
| Household Size | Owner-occupied | Renter-occupied |
| Less than High School | 0 (0.0%) | 0 (0.0%) |
| High School Diploma | 0 (0.0%) | 8 (100.0%) |
| College/Associate Degree | 17 (40.5%) | 25 (59.5%) |
| Bachelor's Degree or higher | 40 (30.1%) | 93 (69.9%) |
Occupancy by Age of Householder in Waitsfield
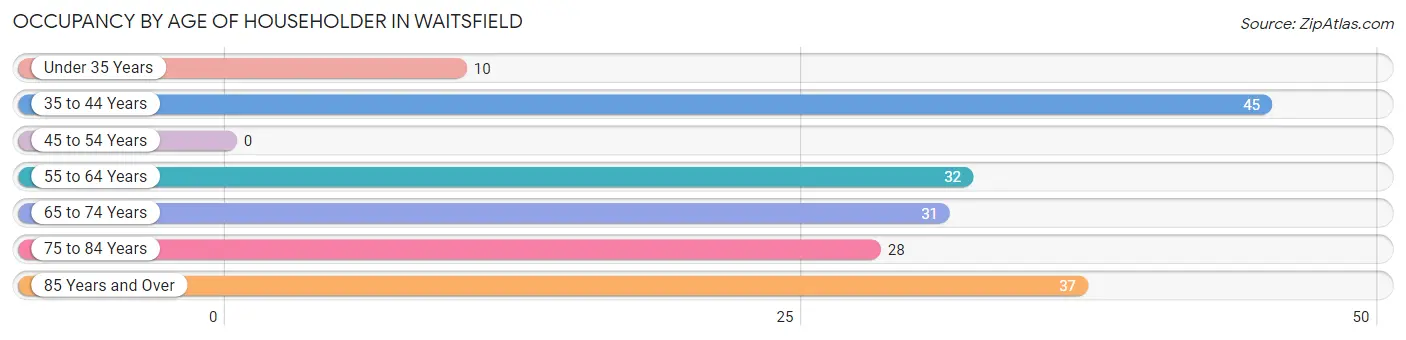
| Age Bracket | # Households | % Households |
| Under 35 Years | 10 | 5.5% |
| 35 to 44 Years | 45 | 24.6% |
| 45 to 54 Years | 0 | 0.0% |
| 55 to 64 Years | 32 | 17.5% |
| 65 to 74 Years | 31 | 16.9% |
| 75 to 84 Years | 28 | 15.3% |
| 85 Years and Over | 37 | 20.2% |
| Total | 183 | 100.0% |
Housing Finances in Waitsfield
Median Income by Occupancy in Waitsfield
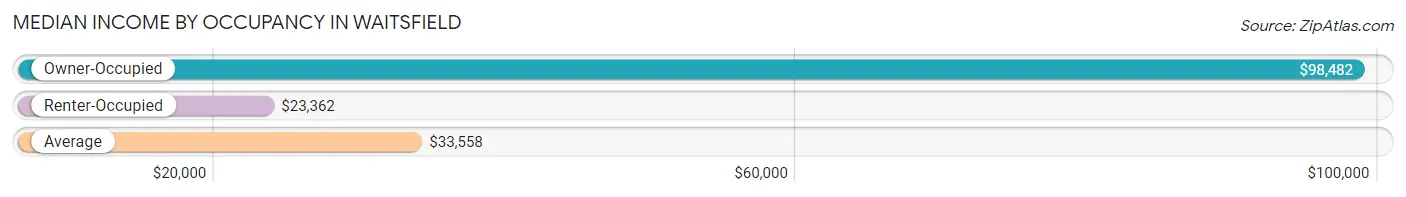
| Occupancy Type | # Households | Median Income |
| Owner-Occupied | 57 (31.1%) | $98,482 |
| Renter-Occupied | 126 (68.9%) | $23,362 |
| Average | 183 (100.0%) | $33,558 |
Occupancy by Householder Income Bracket in Waitsfield
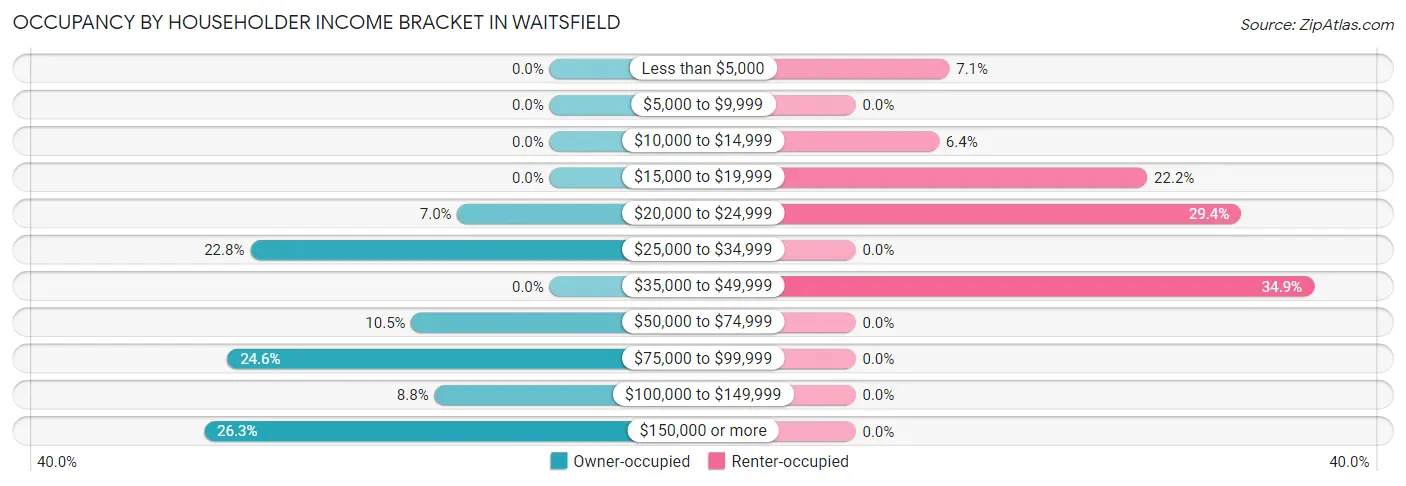
| Income Bracket | Owner-occupied | Renter-occupied |
| Less than $5,000 | 0 (0.0%) | 9 (7.1%) |
| $5,000 to $9,999 | 0 (0.0%) | 0 (0.0%) |
| $10,000 to $14,999 | 0 (0.0%) | 8 (6.4%) |
| $15,000 to $19,999 | 0 (0.0%) | 28 (22.2%) |
| $20,000 to $24,999 | 4 (7.0%) | 37 (29.4%) |
| $25,000 to $34,999 | 13 (22.8%) | 0 (0.0%) |
| $35,000 to $49,999 | 0 (0.0%) | 44 (34.9%) |
| $50,000 to $74,999 | 6 (10.5%) | 0 (0.0%) |
| $75,000 to $99,999 | 14 (24.6%) | 0 (0.0%) |
| $100,000 to $149,999 | 5 (8.8%) | 0 (0.0%) |
| $150,000 or more | 15 (26.3%) | 0 (0.0%) |
| Total | 57 (100.0%) | 126 (100.0%) |
Monthly Housing Cost Tiers in Waitsfield
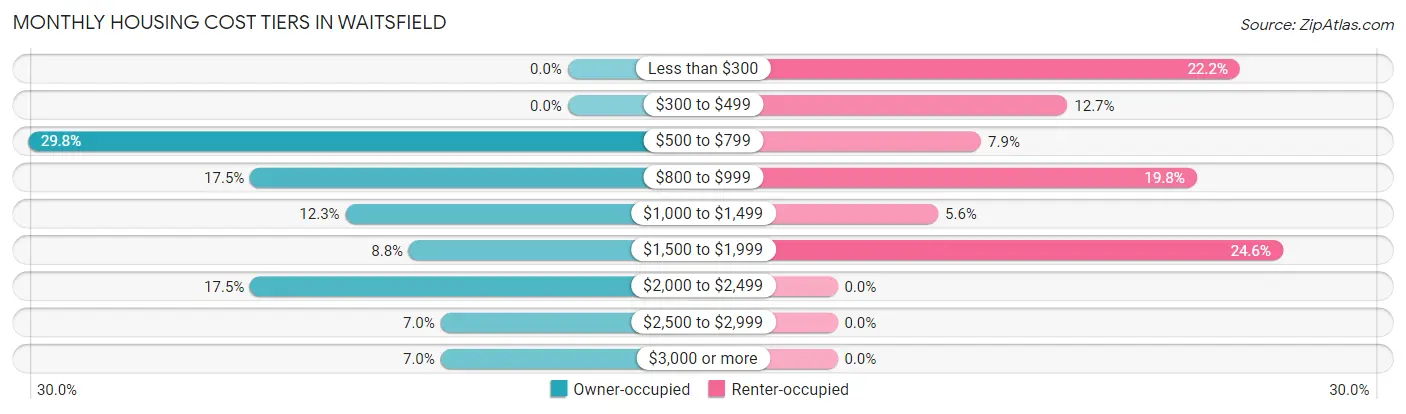
| Monthly Cost | Owner-occupied | Renter-occupied |
| Less than $300 | 0 (0.0%) | 28 (22.2%) |
| $300 to $499 | 0 (0.0%) | 16 (12.7%) |
| $500 to $799 | 17 (29.8%) | 10 (7.9%) |
| $800 to $999 | 10 (17.5%) | 25 (19.8%) |
| $1,000 to $1,499 | 7 (12.3%) | 7 (5.6%) |
| $1,500 to $1,999 | 5 (8.8%) | 31 (24.6%) |
| $2,000 to $2,499 | 10 (17.5%) | 0 (0.0%) |
| $2,500 to $2,999 | 4 (7.0%) | 0 (0.0%) |
| $3,000 or more | 4 (7.0%) | 0 (0.0%) |
| Total | 57 (100.0%) | 126 (100.0%) |
Physical Housing Characteristics in Waitsfield
Housing Structures in Waitsfield
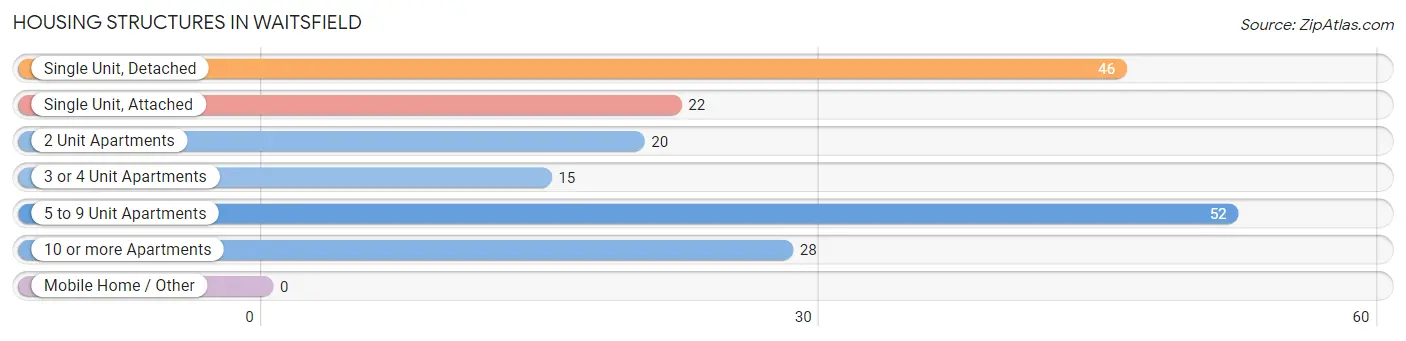
| Structure Type | # Housing Units | % Housing Units |
| Single Unit, Detached | 46 | 25.1% |
| Single Unit, Attached | 22 | 12.0% |
| 2 Unit Apartments | 20 | 10.9% |
| 3 or 4 Unit Apartments | 15 | 8.2% |
| 5 to 9 Unit Apartments | 52 | 28.4% |
| 10 or more Apartments | 28 | 15.3% |
| Mobile Home / Other | 0 | 0.0% |
| Total | 183 | 100.0% |
Housing Structures by Occupancy in Waitsfield
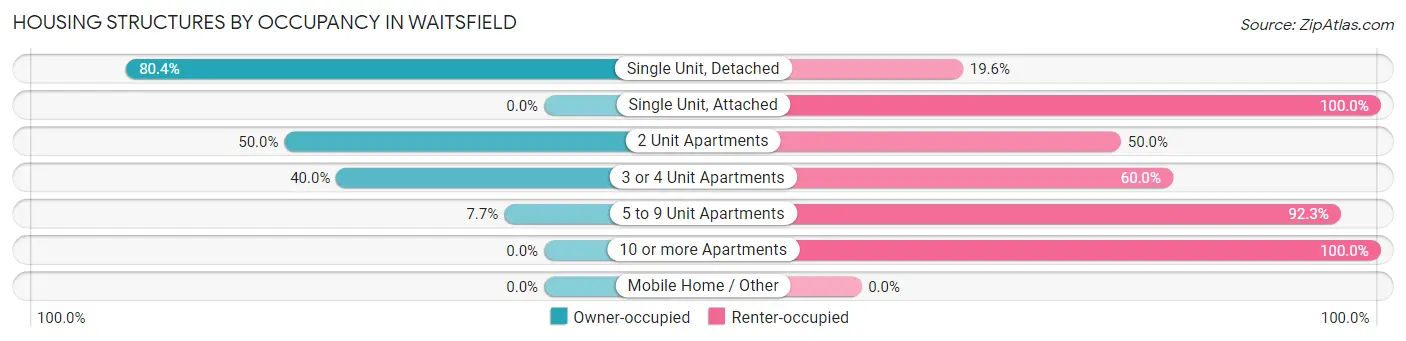
| Structure Type | Owner-occupied | Renter-occupied |
| Single Unit, Detached | 37 (80.4%) | 9 (19.6%) |
| Single Unit, Attached | 0 (0.0%) | 22 (100.0%) |
| 2 Unit Apartments | 10 (50.0%) | 10 (50.0%) |
| 3 or 4 Unit Apartments | 6 (40.0%) | 9 (60.0%) |
| 5 to 9 Unit Apartments | 4 (7.7%) | 48 (92.3%) |
| 10 or more Apartments | 0 (0.0%) | 28 (100.0%) |
| Mobile Home / Other | 0 (0.0%) | 0 (0.0%) |
| Total | 57 (31.1%) | 126 (68.9%) |
Housing Structures by Number of Rooms in Waitsfield
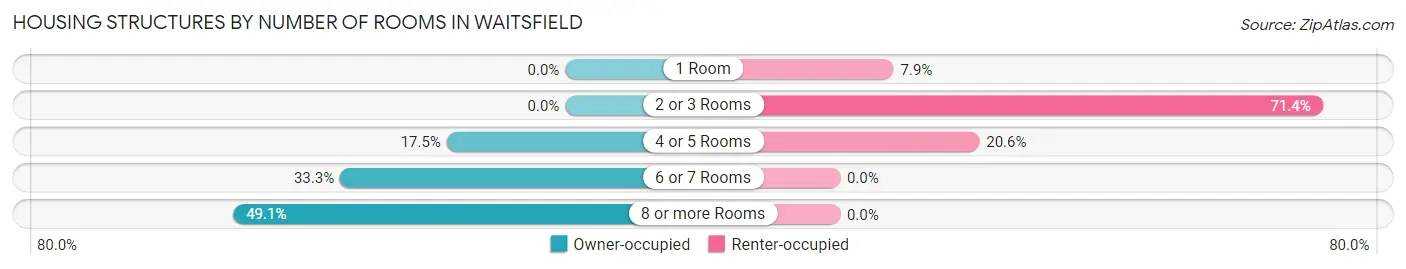
| Number of Rooms | Owner-occupied | Renter-occupied |
| 1 Room | 0 (0.0%) | 10 (7.9%) |
| 2 or 3 Rooms | 0 (0.0%) | 90 (71.4%) |
| 4 or 5 Rooms | 10 (17.5%) | 26 (20.6%) |
| 6 or 7 Rooms | 19 (33.3%) | 0 (0.0%) |
| 8 or more Rooms | 28 (49.1%) | 0 (0.0%) |
| Total | 57 (100.0%) | 126 (100.0%) |
Housing Structure by Heating Type in Waitsfield
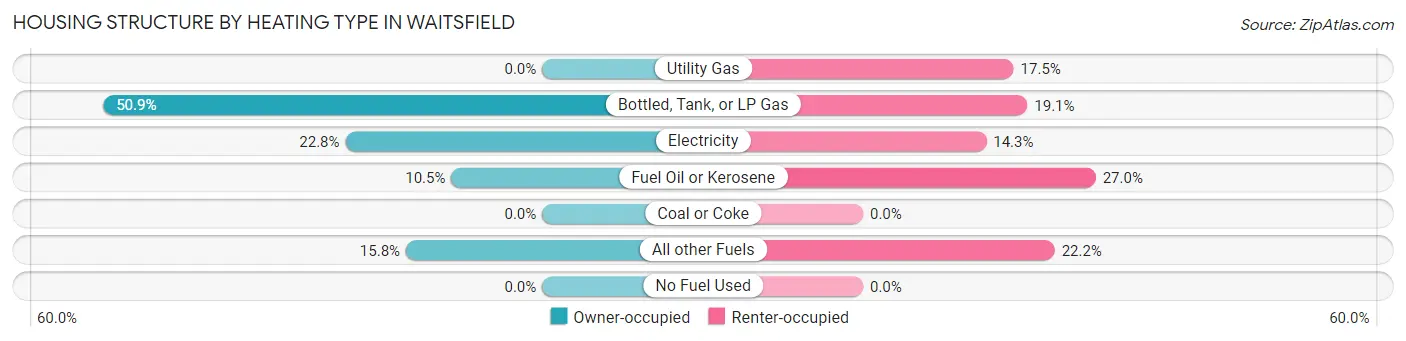
| Heating Type | Owner-occupied | Renter-occupied |
| Utility Gas | 0 (0.0%) | 22 (17.5%) |
| Bottled, Tank, or LP Gas | 29 (50.9%) | 24 (19.1%) |
| Electricity | 13 (22.8%) | 18 (14.3%) |
| Fuel Oil or Kerosene | 6 (10.5%) | 34 (27.0%) |
| Coal or Coke | 0 (0.0%) | 0 (0.0%) |
| All other Fuels | 9 (15.8%) | 28 (22.2%) |
| No Fuel Used | 0 (0.0%) | 0 (0.0%) |
| Total | 57 (100.0%) | 126 (100.0%) |
Household Vehicle Usage in Waitsfield
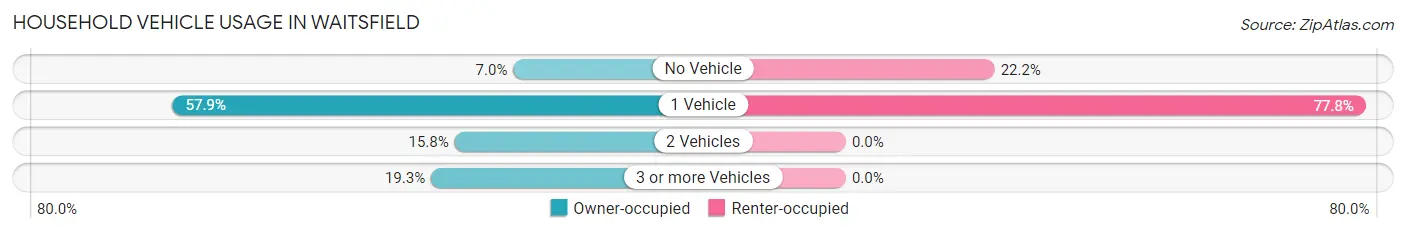
| Vehicles per Household | Owner-occupied | Renter-occupied |
| No Vehicle | 4 (7.0%) | 28 (22.2%) |
| 1 Vehicle | 33 (57.9%) | 98 (77.8%) |
| 2 Vehicles | 9 (15.8%) | 0 (0.0%) |
| 3 or more Vehicles | 11 (19.3%) | 0 (0.0%) |
| Total | 57 (100.0%) | 126 (100.0%) |
Real Estate & Mortgages in Waitsfield
Real Estate and Mortgage Overview in Waitsfield
| Characteristic | Without Mortgage | With Mortgage |
| Housing Units | 28 | 29 |
| Median Property Value | $376,900 | $425,000 |
| Median Household Income | - | - |
| Monthly Housing Costs | $625 | $4 |
| Real Estate Taxes | $4,588 | $4 |
Property Value by Mortgage Status in Waitsfield
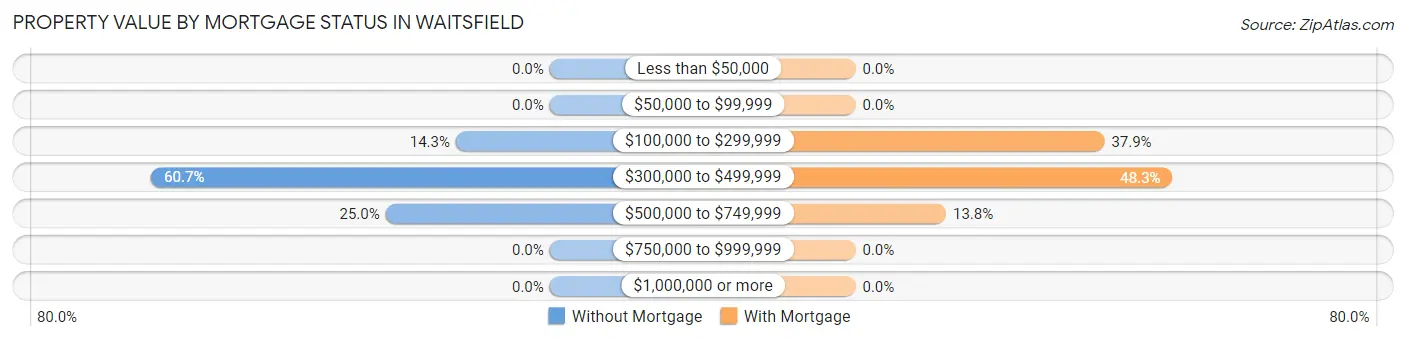
| Property Value | Without Mortgage | With Mortgage |
| Less than $50,000 | 0 (0.0%) | 0 (0.0%) |
| $50,000 to $99,999 | 0 (0.0%) | 0 (0.0%) |
| $100,000 to $299,999 | 4 (14.3%) | 11 (37.9%) |
| $300,000 to $499,999 | 17 (60.7%) | 14 (48.3%) |
| $500,000 to $749,999 | 7 (25.0%) | 4 (13.8%) |
| $750,000 to $999,999 | 0 (0.0%) | 0 (0.0%) |
| $1,000,000 or more | 0 (0.0%) | 0 (0.0%) |
| Total | 28 (100.0%) | 29 (100.0%) |
Household Income by Mortgage Status in Waitsfield
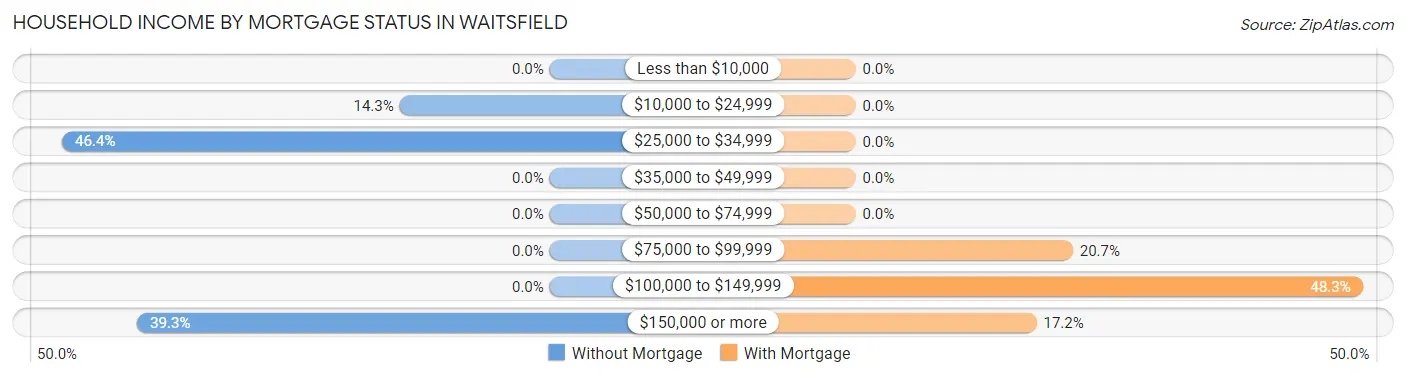
| Household Income | Without Mortgage | With Mortgage |
| Less than $10,000 | 0 (0.0%) | 0 (0.0%) |
| $10,000 to $24,999 | 4 (14.3%) | 0 (0.0%) |
| $25,000 to $34,999 | 13 (46.4%) | 0 (0.0%) |
| $35,000 to $49,999 | 0 (0.0%) | 0 (0.0%) |
| $50,000 to $74,999 | 0 (0.0%) | 0 (0.0%) |
| $75,000 to $99,999 | 0 (0.0%) | 6 (20.7%) |
| $100,000 to $149,999 | 0 (0.0%) | 14 (48.3%) |
| $150,000 or more | 11 (39.3%) | 5 (17.2%) |
| Total | 28 (100.0%) | 29 (100.0%) |
Property Value to Household Income Ratio in Waitsfield
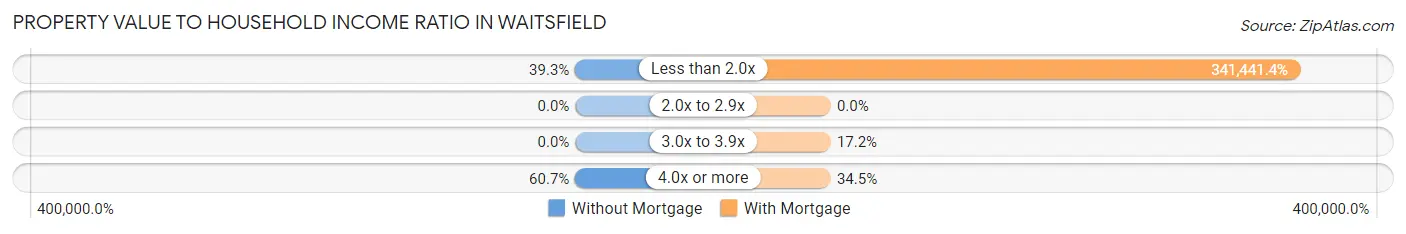
| Value-to-Income Ratio | Without Mortgage | With Mortgage |
| Less than 2.0x | 11 (39.3%) | 99,018 (341,441.4%) |
| 2.0x to 2.9x | 0 (0.0%) | 0 (0.0%) |
| 3.0x to 3.9x | 0 (0.0%) | 5 (17.2%) |
| 4.0x or more | 17 (60.7%) | 10 (34.5%) |
| Total | 28 (100.0%) | 29 (100.0%) |
Real Estate Taxes by Mortgage Status in Waitsfield
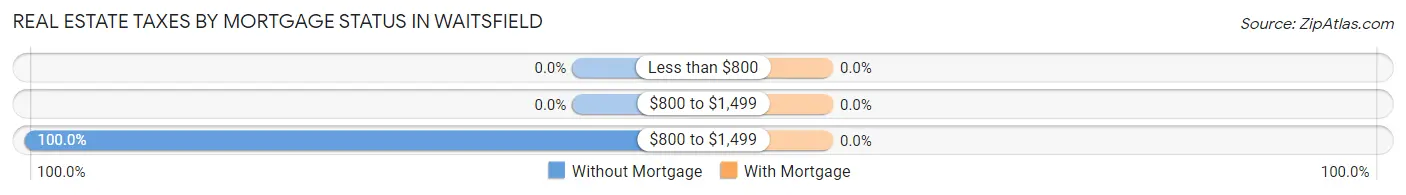
| Property Taxes | Without Mortgage | With Mortgage |
| Less than $800 | 0 (0.0%) | 0 (0.0%) |
| $800 to $1,499 | 0 (0.0%) | 0 (0.0%) |
| $800 to $1,499 | 28 (100.0%) | 0 (0.0%) |
| Total | 28 (100.0%) | 29 (100.0%) |
Health & Disability in Waitsfield
Health Insurance Coverage by Age in Waitsfield
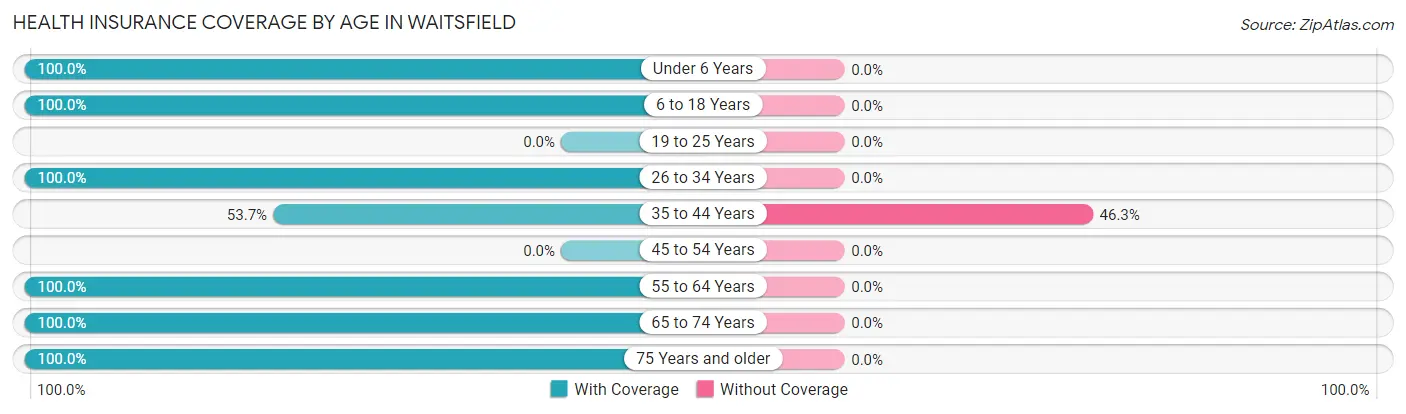
| Age Bracket | With Coverage | Without Coverage |
| Under 6 Years | 9 (100.0%) | 0 (0.0%) |
| 6 to 18 Years | 14 (100.0%) | 0 (0.0%) |
| 19 to 25 Years | 0 (0.0%) | 0 (0.0%) |
| 26 to 34 Years | 10 (100.0%) | 0 (0.0%) |
| 35 to 44 Years | 29 (53.7%) | 25 (46.3%) |
| 45 to 54 Years | 0 (0.0%) | 0 (0.0%) |
| 55 to 64 Years | 36 (100.0%) | 0 (0.0%) |
| 65 to 74 Years | 31 (100.0%) | 0 (0.0%) |
| 75 Years and older | 74 (100.0%) | 0 (0.0%) |
| Total | 203 (89.0%) | 25 (11.0%) |
Health Insurance Coverage by Citizenship Status in Waitsfield
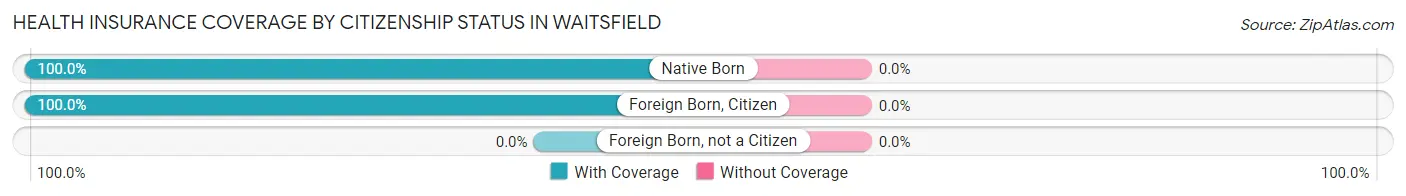
| Citizenship Status | With Coverage | Without Coverage |
| Native Born | 9 (100.0%) | 0 (0.0%) |
| Foreign Born, Citizen | 14 (100.0%) | 0 (0.0%) |
| Foreign Born, not a Citizen | 0 (0.0%) | 0 (0.0%) |
Health Insurance Coverage by Household Income in Waitsfield
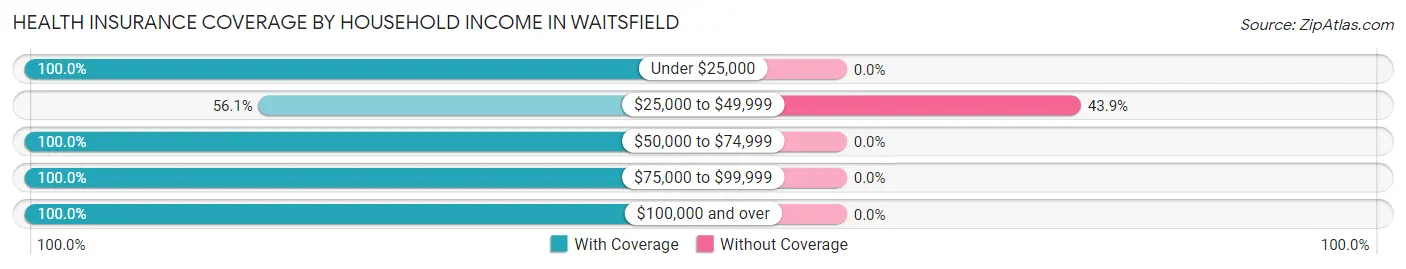
| Household Income | With Coverage | Without Coverage |
| Under $25,000 | 86 (100.0%) | 0 (0.0%) |
| $25,000 to $49,999 | 32 (56.1%) | 25 (43.9%) |
| $50,000 to $74,999 | 6 (100.0%) | 0 (0.0%) |
| $75,000 to $99,999 | 29 (100.0%) | 0 (0.0%) |
| $100,000 and over | 50 (100.0%) | 0 (0.0%) |
Public vs Private Health Insurance Coverage by Age in Waitsfield
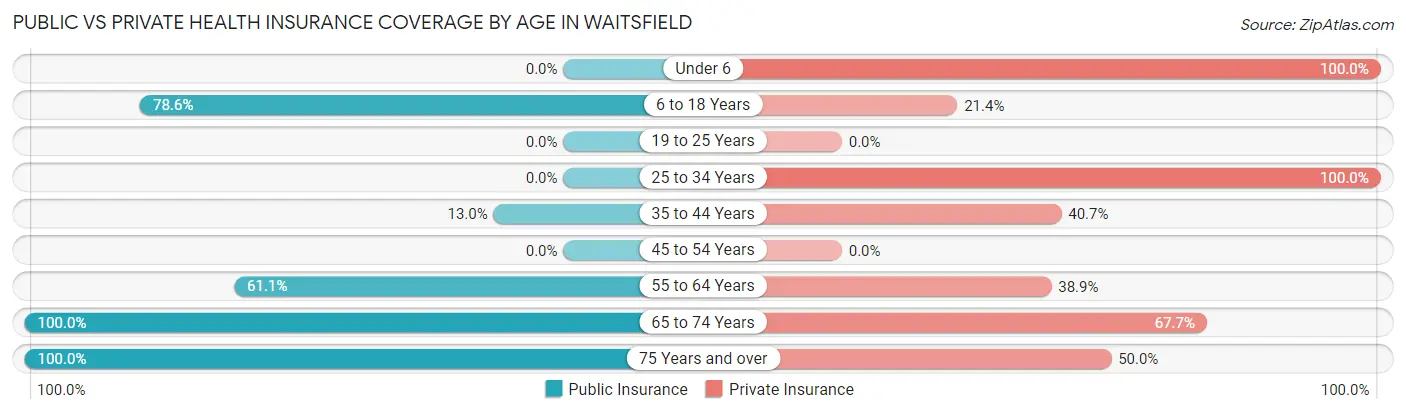
| Age Bracket | Public Insurance | Private Insurance |
| Under 6 | 0 (0.0%) | 9 (100.0%) |
| 6 to 18 Years | 11 (78.6%) | 3 (21.4%) |
| 19 to 25 Years | 0 (0.0%) | 0 (0.0%) |
| 25 to 34 Years | 0 (0.0%) | 10 (100.0%) |
| 35 to 44 Years | 7 (13.0%) | 22 (40.7%) |
| 45 to 54 Years | 0 (0.0%) | 0 (0.0%) |
| 55 to 64 Years | 22 (61.1%) | 14 (38.9%) |
| 65 to 74 Years | 31 (100.0%) | 21 (67.7%) |
| 75 Years and over | 74 (100.0%) | 37 (50.0%) |
| Total | 145 (63.6%) | 116 (50.9%) |
Disability Status by Sex by Age in Waitsfield
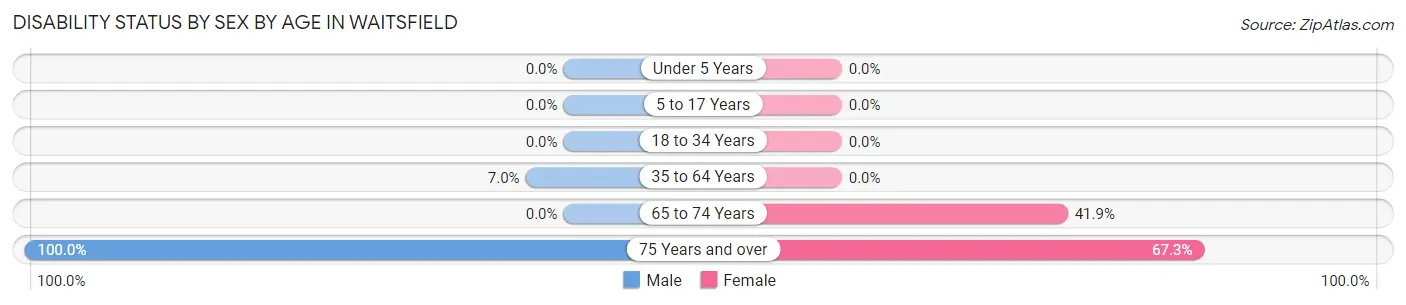
| Age Bracket | Male | Female |
| Under 5 Years | 0 (0.0%) | 0 (0.0%) |
| 5 to 17 Years | 0 (0.0%) | 0 (0.0%) |
| 18 to 34 Years | 0 (0.0%) | 0 (0.0%) |
| 35 to 64 Years | 5 (7.0%) | 0 (0.0%) |
| 65 to 74 Years | 0 (0.0%) | 13 (41.9%) |
| 75 Years and over | 19 (100.0%) | 37 (67.3%) |
Disability Class by Sex by Age in Waitsfield
Disability Class: Hearing Difficulty
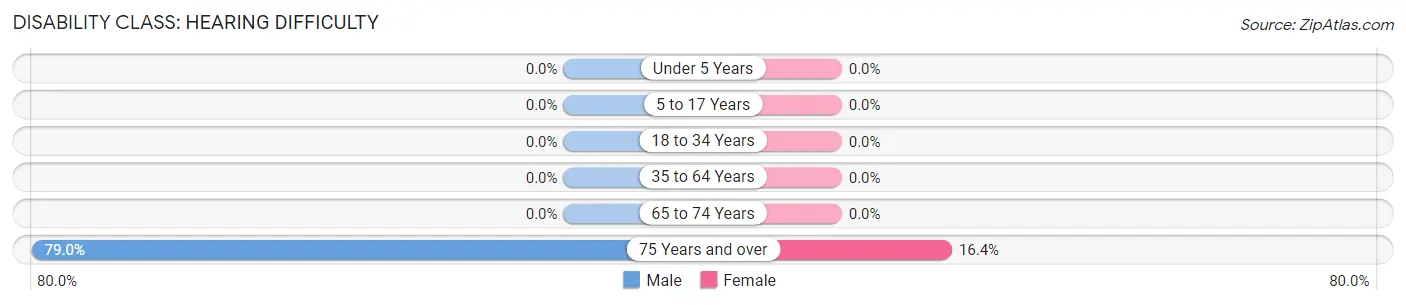
| Age Bracket | Male | Female |
| Under 5 Years | 0 (0.0%) | 0 (0.0%) |
| 5 to 17 Years | 0 (0.0%) | 0 (0.0%) |
| 18 to 34 Years | 0 (0.0%) | 0 (0.0%) |
| 35 to 64 Years | 0 (0.0%) | 0 (0.0%) |
| 65 to 74 Years | 0 (0.0%) | 0 (0.0%) |
| 75 Years and over | 15 (78.9%) | 9 (16.4%) |
Disability Class: Vision Difficulty
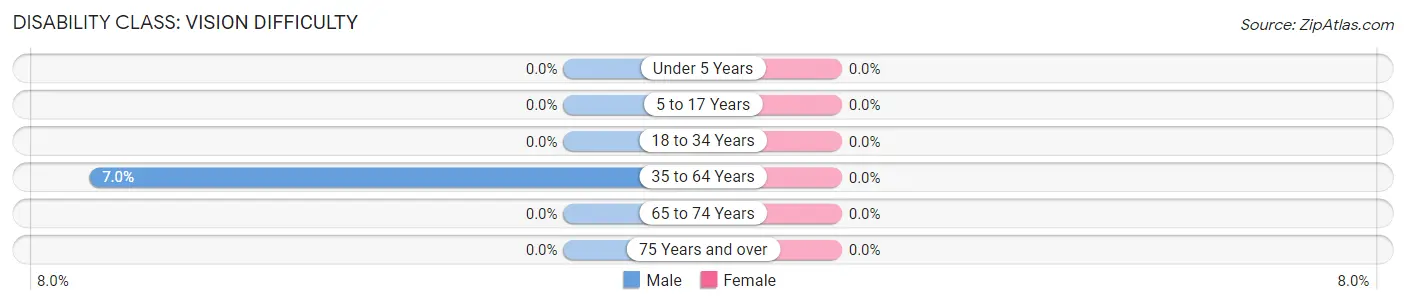
| Age Bracket | Male | Female |
| Under 5 Years | 0 (0.0%) | 0 (0.0%) |
| 5 to 17 Years | 0 (0.0%) | 0 (0.0%) |
| 18 to 34 Years | 0 (0.0%) | 0 (0.0%) |
| 35 to 64 Years | 5 (7.0%) | 0 (0.0%) |
| 65 to 74 Years | 0 (0.0%) | 0 (0.0%) |
| 75 Years and over | 0 (0.0%) | 0 (0.0%) |
Disability Class: Cognitive Difficulty
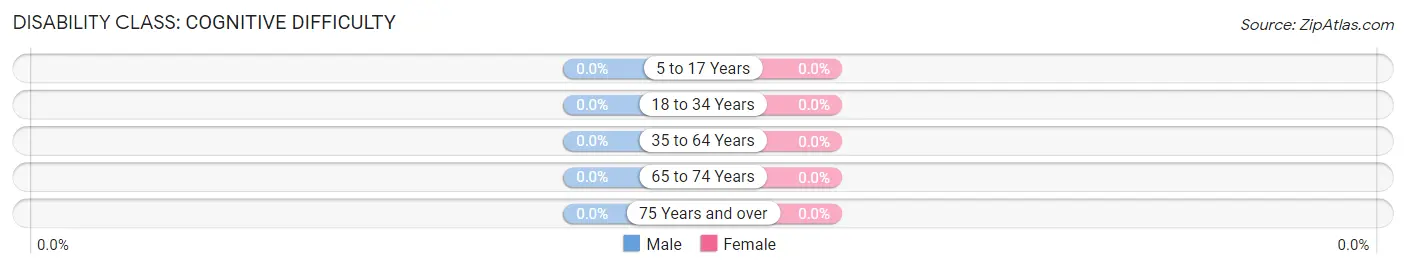
| Age Bracket | Male | Female |
| 5 to 17 Years | 0 (0.0%) | 0 (0.0%) |
| 18 to 34 Years | 0 (0.0%) | 0 (0.0%) |
| 35 to 64 Years | 0 (0.0%) | 0 (0.0%) |
| 65 to 74 Years | 0 (0.0%) | 0 (0.0%) |
| 75 Years and over | 0 (0.0%) | 0 (0.0%) |
Disability Class: Ambulatory Difficulty
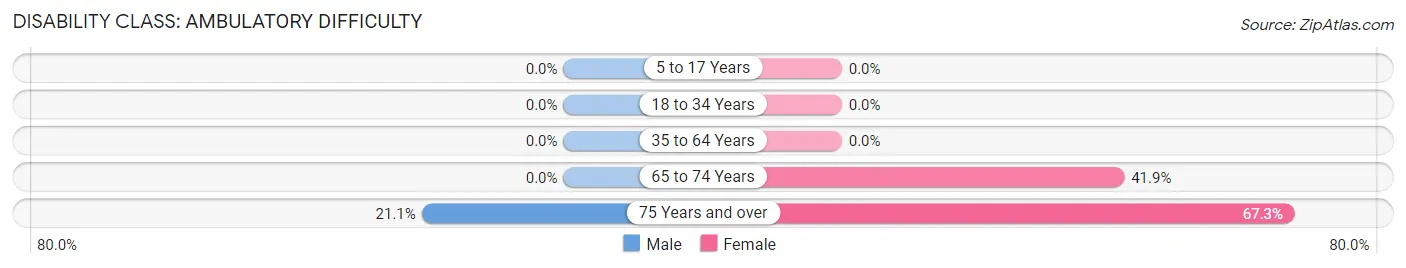
| Age Bracket | Male | Female |
| 5 to 17 Years | 0 (0.0%) | 0 (0.0%) |
| 18 to 34 Years | 0 (0.0%) | 0 (0.0%) |
| 35 to 64 Years | 0 (0.0%) | 0 (0.0%) |
| 65 to 74 Years | 0 (0.0%) | 13 (41.9%) |
| 75 Years and over | 4 (21.0%) | 37 (67.3%) |
Disability Class: Self-Care Difficulty
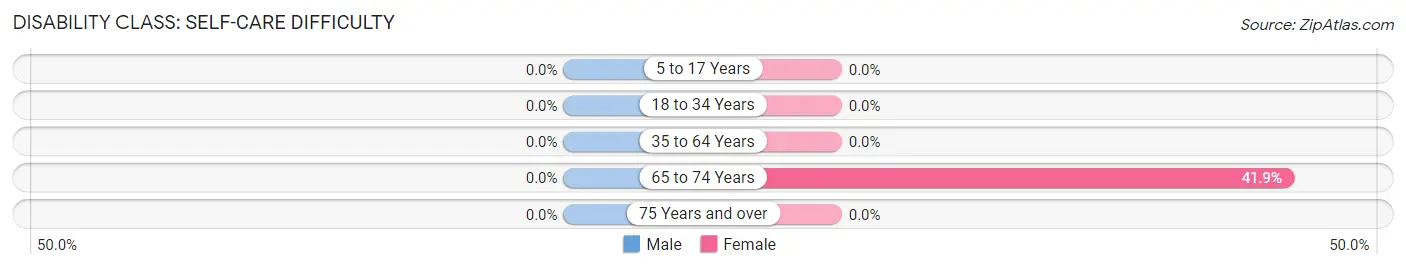
| Age Bracket | Male | Female |
| 5 to 17 Years | 0 (0.0%) | 0 (0.0%) |
| 18 to 34 Years | 0 (0.0%) | 0 (0.0%) |
| 35 to 64 Years | 0 (0.0%) | 0 (0.0%) |
| 65 to 74 Years | 0 (0.0%) | 13 (41.9%) |
| 75 Years and over | 0 (0.0%) | 0 (0.0%) |
Technology Access in Waitsfield
Computing Device Access in Waitsfield
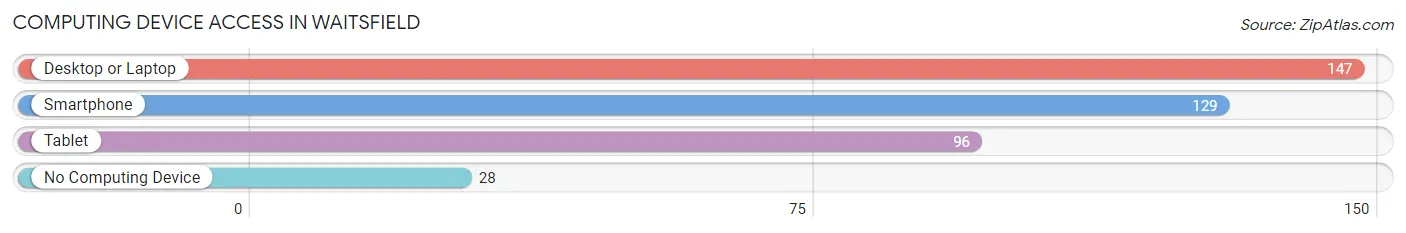
| Device Type | # Households | % Households |
| Desktop or Laptop | 147 | 80.3% |
| Smartphone | 129 | 70.5% |
| Tablet | 96 | 52.5% |
| No Computing Device | 28 | 15.3% |
| Total | 183 | 100.0% |
Internet Access in Waitsfield
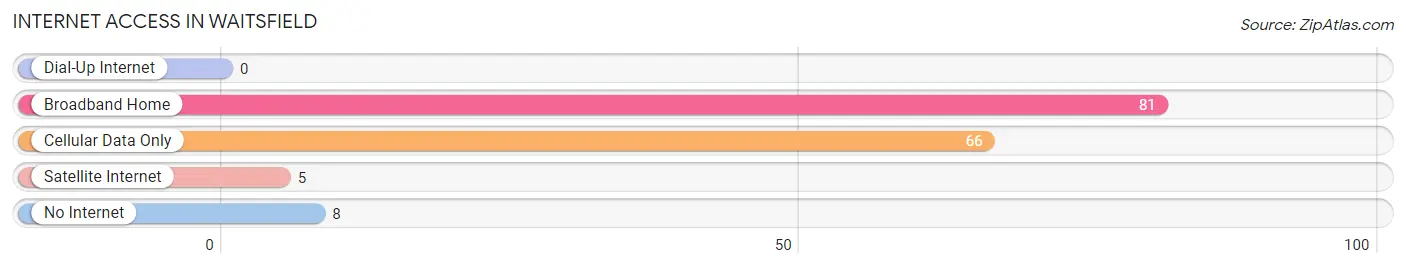
| Internet Type | # Households | % Households |
| Dial-Up Internet | 0 | 0.0% |
| Broadband Home | 81 | 44.3% |
| Cellular Data Only | 66 | 36.1% |
| Satellite Internet | 5 | 2.7% |
| No Internet | 8 | 4.4% |
| Total | 183 | 100.0% |
Waitsfield Summary
Waitsfield, Vermont is a small town located in the Mad River Valley of Washington County, Vermont. It is situated in the Green Mountains and is part of the Mad River Valley region. The town has a population of 1,731 people as of the 2010 census.
History
Waitsfield was first settled in 1782 by a group of settlers from Massachusetts. The town was named after the first settler, John Wait, who was a Revolutionary War veteran. The town was incorporated in 1794 and was originally part of the town of Warren. In 1820, Waitsfield was separated from Warren and became its own town.
The town was primarily an agricultural community until the late 19th century when the Mad River Railroad was built. This allowed for the development of the town’s tourism industry, which is still a major part of the local economy today.
Geography
Waitsfield is located in the Mad River Valley of Washington County, Vermont. The town is situated in the Green Mountains and is part of the Mad River Valley region. The town is bordered by the towns of Warren, Moretown, Fayston, and Duxbury. The town is located at an elevation of 1,000 feet and has a total area of 24.2 square miles.
The Mad River runs through the town and is a popular destination for fishing, swimming, and kayaking. The town is also home to several ski resorts, including Sugarbush Resort and Mad River Glen.
Economy
The economy of Waitsfield is largely based on tourism and agriculture. The town is home to several ski resorts, which attract visitors from all over the world. The town is also home to several farms, which produce a variety of products, including dairy, vegetables, and maple syrup.
The town is also home to several small businesses, including restaurants, shops, and galleries. The town is also home to several technology companies, including Mad River Technologies and Mad River Software.
Demographics
As of the 2010 census, the population of Waitsfield was 1,731 people. The racial makeup of the town was 97.3% White, 0.3% African American, 0.2% Native American, 0.7% Asian, 0.1% Pacific Islander, 0.2% from other races, and 1.2% from two or more races. Hispanic or Latino of any race were 1.2% of the population.
The median income for a household in the town was $50,938 and the median income for a family was $60,000. The per capita income for the town was $27,945. About 8.2% of families and 10.2% of the population were below the poverty line, including 11.2% of those under age 18 and 8.2% of those age 65 or over.
Common Questions
What is Per Capita Income in Waitsfield?
Per Capita income in Waitsfield is $52,930.
What is the Median Family Income in Waitsfield?
Median Family Income in Waitsfield is $155,625.
What is the Median Household income in Waitsfield?
Median Household Income in Waitsfield is $33,558.
What is Inequality or Gini Index in Waitsfield?
Inequality or Gini Index in Waitsfield is 0.58.
What is the Total Population of Waitsfield?
Total Population of Waitsfield is 228.
What is the Total Male Population of Waitsfield?
Total Male Population of Waitsfield is 111.
What is the Total Female Population of Waitsfield?
Total Female Population of Waitsfield is 117.
What is the Ratio of Males per 100 Females in Waitsfield?
There are 94.87 Males per 100 Females in Waitsfield.
What is the Ratio of Females per 100 Males in Waitsfield?
There are 105.41 Females per 100 Males in Waitsfield.
What is the Median Population Age in Waitsfield?
Median Population Age in Waitsfield is 62.9 Years.
What is the Average Family Size in Waitsfield
Average Family Size in Waitsfield is 3.2 People.
What is the Average Household Size in Waitsfield
Average Household Size in Waitsfield is 1.2 People.
How Large is the Labor Force in Waitsfield?
There are 116 People in the Labor Forcein in Waitsfield.
What is the Percentage of People in the Labor Force in Waitsfield?
53.7% of People are in the Labor Force in Waitsfield.