Newfane, VT Map & Demographics
Newfane Map
Newfane Overview
$44,010
PER CAPITA INCOME
$141,250
AVG FAMILY INCOME
1.5%
WAGE / INCOME GAP [ % ]
98.5¢/ $1
WAGE / INCOME GAP [ $ ]
0.40
INEQUALITY / GINI INDEX
135
TOTAL POPULATION
66
MALE POPULATION
69
FEMALE POPULATION
95.65
MALES / 100 FEMALES
104.55
FEMALES / 100 MALES
25.1
MEDIAN AGE
2.7
AVG FAMILY SIZE
2.6
AVG HOUSEHOLD SIZE
114
LABOR FORCE [ PEOPLE ]
96.6%
PERCENT IN LABOR FORCE
Newfane Zip Codes
Newfane Area Codes
Income in Newfane
Income Overview in Newfane
| Characteristic | Number | Measure |
| Per Capita Income | 135 | $44,010 |
| Median Family Income | 22 | $141,250 |
| Mean Family Income | 22 | $135,445 |
| Median Household Income | 51 | $0 |
| Mean Household Income | 51 | $101,563 |
| Income Deficit | 22 | $0 |
| Wage / Income Gap (%) | 135 | 1.47% |
| Wage / Income Gap ($) | 135 | 98.53¢ per $1 |
| Gini / Inequality Index | 135 | 0.40 |
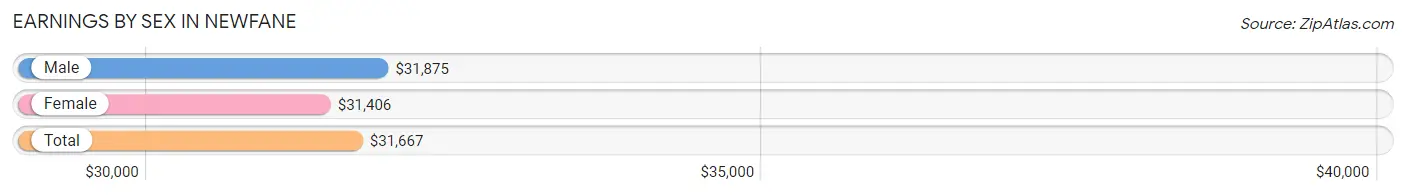
Earnings by Sex in Newfane
Average Earnings in Newfane are $31,667, $31,875 for men and $31,406 for women, a difference of 1.5%.
| Sex | Number | Average Earnings |
| Male | 61 (53.5%) | $31,875 |
| Female | 53 (46.5%) | $31,406 |
| Total | 114 (100.0%) | $31,667 |
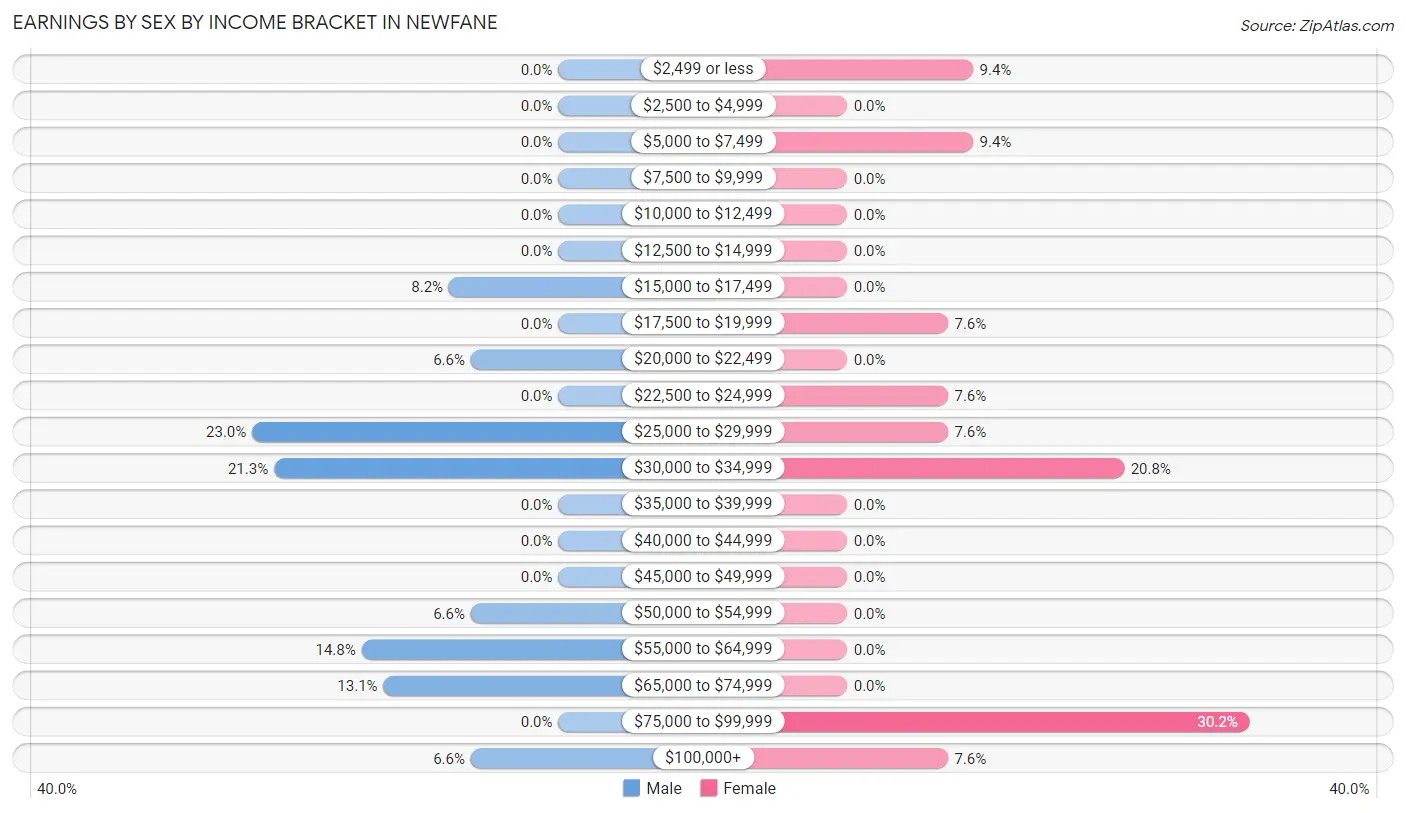
Earnings by Sex by Income Bracket in Newfane
The most common earnings brackets in Newfane are $25,000 to $29,999 for men (14 | 23.0%) and $75,000 to $99,999 for women (16 | 30.2%).
| Income | Male | Female |
| $2,499 or less | 0 (0.0%) | 5 (9.4%) |
| $2,500 to $4,999 | 0 (0.0%) | 0 (0.0%) |
| $5,000 to $7,499 | 0 (0.0%) | 5 (9.4%) |
| $7,500 to $9,999 | 0 (0.0%) | 0 (0.0%) |
| $10,000 to $12,499 | 0 (0.0%) | 0 (0.0%) |
| $12,500 to $14,999 | 0 (0.0%) | 0 (0.0%) |
| $15,000 to $17,499 | 5 (8.2%) | 0 (0.0%) |
| $17,500 to $19,999 | 0 (0.0%) | 4 (7.5%) |
| $20,000 to $22,499 | 4 (6.6%) | 0 (0.0%) |
| $22,500 to $24,999 | 0 (0.0%) | 4 (7.5%) |
| $25,000 to $29,999 | 14 (23.0%) | 4 (7.5%) |
| $30,000 to $34,999 | 13 (21.3%) | 11 (20.7%) |
| $35,000 to $39,999 | 0 (0.0%) | 0 (0.0%) |
| $40,000 to $44,999 | 0 (0.0%) | 0 (0.0%) |
| $45,000 to $49,999 | 0 (0.0%) | 0 (0.0%) |
| $50,000 to $54,999 | 4 (6.6%) | 0 (0.0%) |
| $55,000 to $64,999 | 9 (14.7%) | 0 (0.0%) |
| $65,000 to $74,999 | 8 (13.1%) | 0 (0.0%) |
| $75,000 to $99,999 | 0 (0.0%) | 16 (30.2%) |
| $100,000+ | 4 (6.6%) | 4 (7.5%) |
| Total | 61 (100.0%) | 53 (100.0%) |
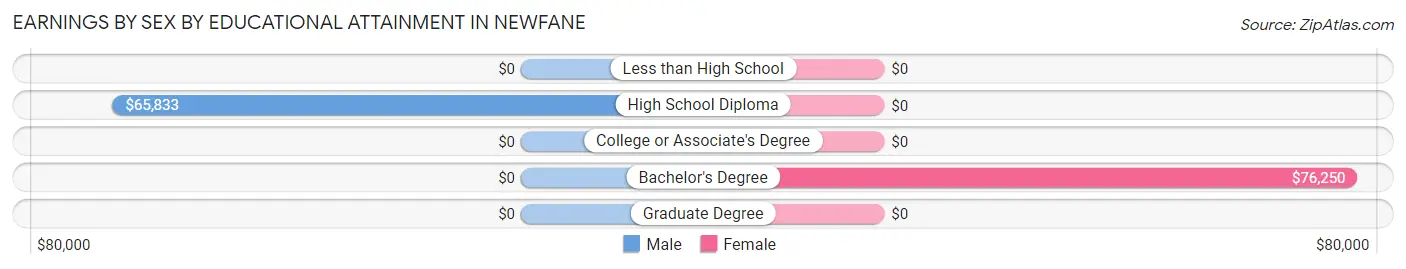
Earnings by Sex by Educational Attainment in Newfane
| Educational Attainment | Male Income | Female Income |
| Less than High School | - | - |
| High School Diploma | $65,833 | $0 |
| College or Associate's Degree | - | - |
| Bachelor's Degree | - | - |
| Graduate Degree | - | - |
| Total | $65,208 | $0 |
Family Income in Newfane
Family Income Brackets in Newfane
According to the Newfane family income data, there are 10 families falling into the $100,000 to $149,999 income range, which is the most common income bracket and makes up 45.5% of all families.
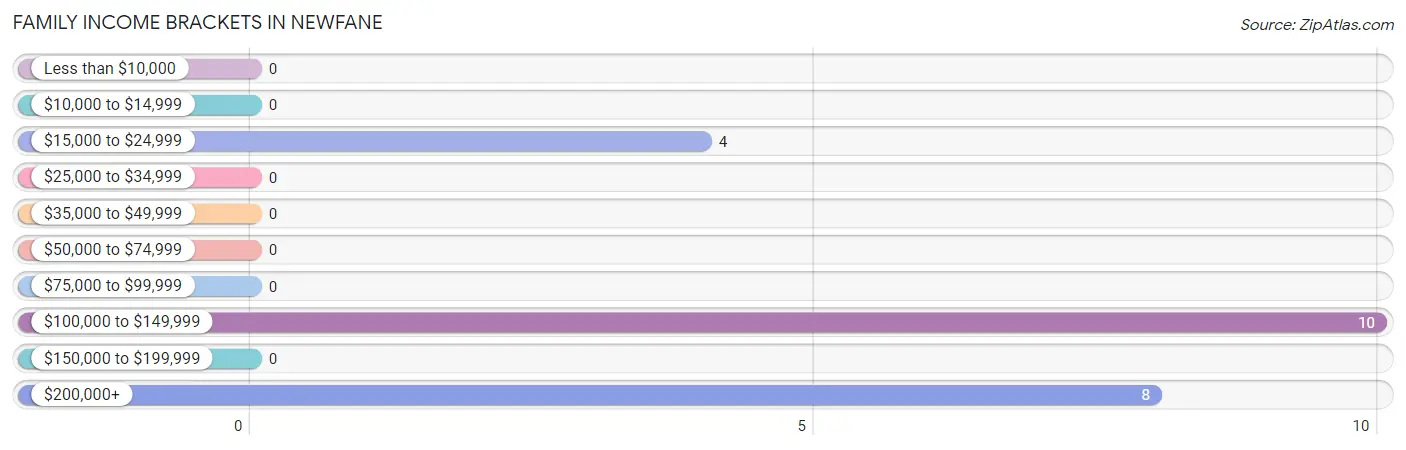
| Income Bracket | # Families | % Families |
| Less than $10,000 | 0 | 0.0% |
| $10,000 to $14,999 | 0 | 0.0% |
| $15,000 to $24,999 | 4 | 18.2% |
| $25,000 to $34,999 | 0 | 0.0% |
| $35,000 to $49,999 | 0 | 0.0% |
| $50,000 to $74,999 | 0 | 0.0% |
| $75,000 to $99,999 | 0 | 0.0% |
| $100,000 to $149,999 | 10 | 45.5% |
| $150,000 to $199,999 | 0 | 0.0% |
| $200,000+ | 8 | 36.4% |
Family Income by Famaliy Size in Newfane
3-person families (14 | 63.6%) account for the highest median family income in Newfane with $141,250 per family, while 3-person families (14 | 63.6%) have the highest median income of $47,083 per family member.
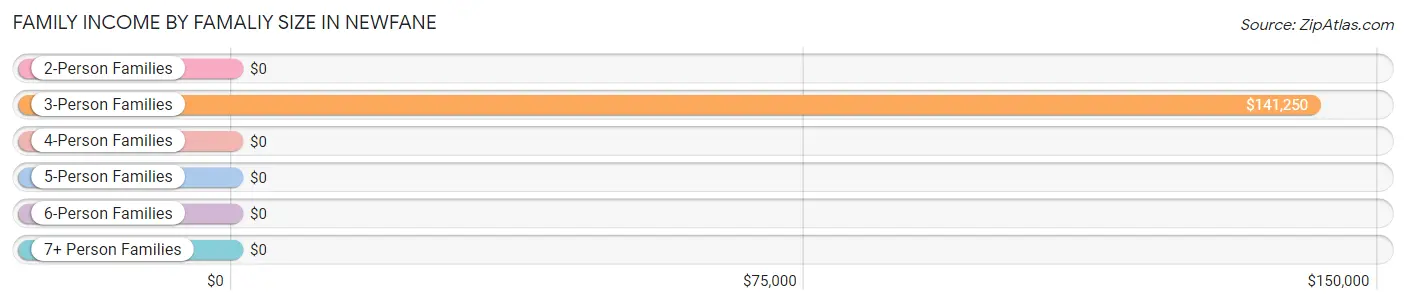
| Income Bracket | # Families | Median Income |
| 2-Person Families | 8 (36.4%) | $0 |
| 3-Person Families | 14 (63.6%) | $141,250 |
| 4-Person Families | 0 (0.0%) | $0 |
| 5-Person Families | 0 (0.0%) | $0 |
| 6-Person Families | 0 (0.0%) | $0 |
| 7+ Person Families | 0 (0.0%) | $0 |
| Total | 22 (100.0%) | $141,250 |
Family Income by Number of Earners in Newfane
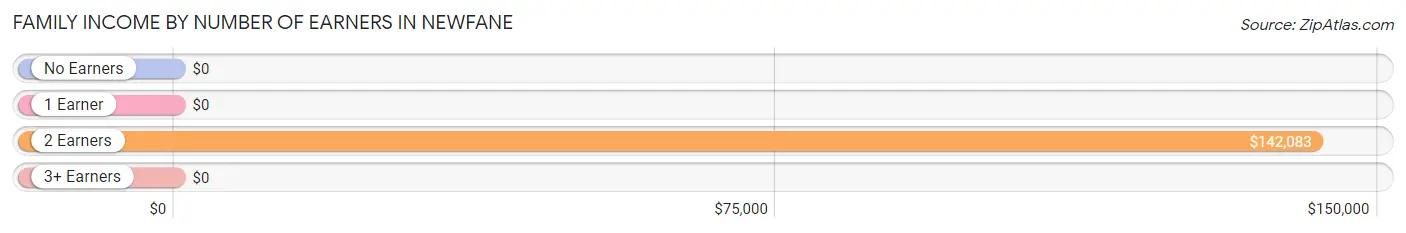
| Number of Earners | # Families | Median Income |
| No Earners | 0 (0.0%) | $0 |
| 1 Earner | 4 (18.2%) | $0 |
| 2 Earners | 18 (81.8%) | $142,083 |
| 3+ Earners | 0 (0.0%) | $0 |
| Total | 22 (100.0%) | $141,250 |
Household Income in Newfane
Household Income Brackets in Newfane
With 15 households falling in the category, the $50,000 to $74,999 income range is the most frequent in Newfane, accounting for 29.4% of all households.
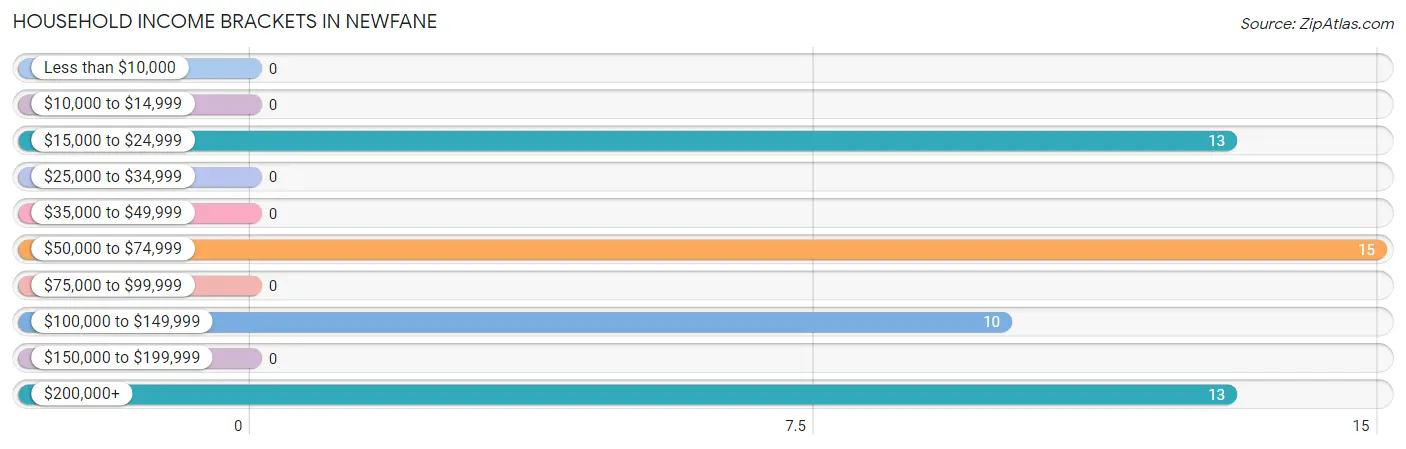
| Income Bracket | # Households | % Households |
| Less than $10,000 | 0 | 0.0% |
| $10,000 to $14,999 | 0 | 0.0% |
| $15,000 to $24,999 | 13 | 25.5% |
| $25,000 to $34,999 | 0 | 0.0% |
| $35,000 to $49,999 | 0 | 0.0% |
| $50,000 to $74,999 | 15 | 29.4% |
| $75,000 to $99,999 | 0 | 0.0% |
| $100,000 to $149,999 | 10 | 19.6% |
| $150,000 to $199,999 | 0 | 0.0% |
| $200,000+ | 13 | 25.5% |
Household Income by Householder Age in Newfane
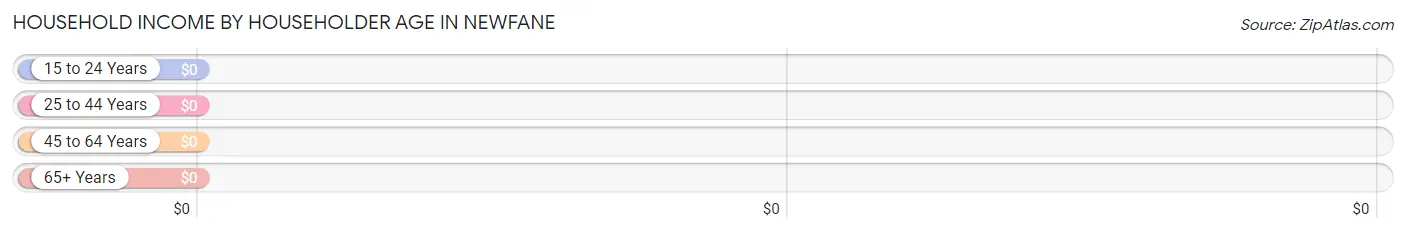
| Income Bracket | # Households | Median Income |
| 15 to 24 Years | 9 (17.6%) | $0 |
| 25 to 44 Years | 14 (27.5%) | $0 |
| 45 to 64 Years | 10 (19.6%) | $0 |
| 65+ Years | 18 (35.3%) | $0 |
| Total | 51 (100.0%) | $0 |
Poverty in Newfane
Income Below Poverty by Sex and Age in Newfane
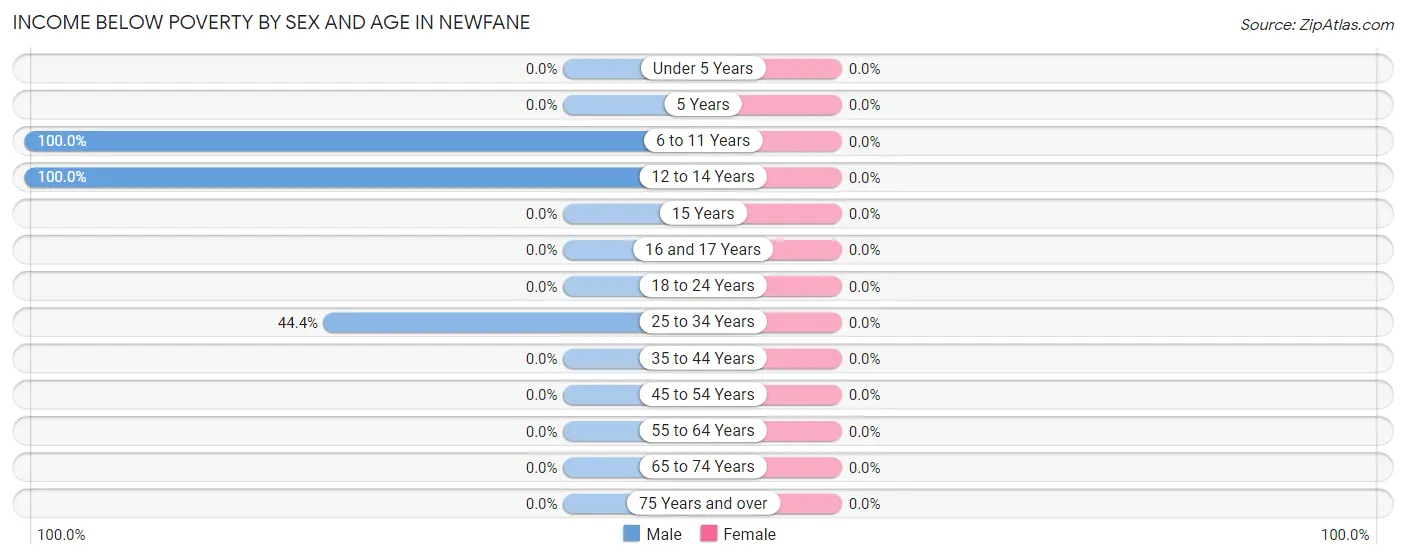
| Age Bracket | Male | Female |
| Under 5 Years | 0 (0.0%) | 0 (0.0%) |
| 5 Years | 0 (0.0%) | 0 (0.0%) |
| 6 to 11 Years | 3 (100.0%) | 0 (0.0%) |
| 12 to 14 Years | 2 (100.0%) | 0 (0.0%) |
| 15 Years | 0 (0.0%) | 0 (0.0%) |
| 16 and 17 Years | 0 (0.0%) | 0 (0.0%) |
| 18 to 24 Years | 0 (0.0%) | 0 (0.0%) |
| 25 to 34 Years | 4 (44.4%) | 0 (0.0%) |
| 35 to 44 Years | 0 (0.0%) | 0 (0.0%) |
| 45 to 54 Years | 0 (0.0%) | 0 (0.0%) |
| 55 to 64 Years | 0 (0.0%) | 0 (0.0%) |
| 65 to 74 Years | 0 (0.0%) | 0 (0.0%) |
| 75 Years and over | 0 (0.0%) | 0 (0.0%) |
| Total | 9 (13.6%) | 0 (0.0%) |
Income Above Poverty by Sex and Age in Newfane
According to the poverty statistics in Newfane, males aged 18 to 24 years and females aged under 5 years are the age groups that are most secure financially, with 100.0% of males and 100.0% of females in these age groups living above the poverty line.
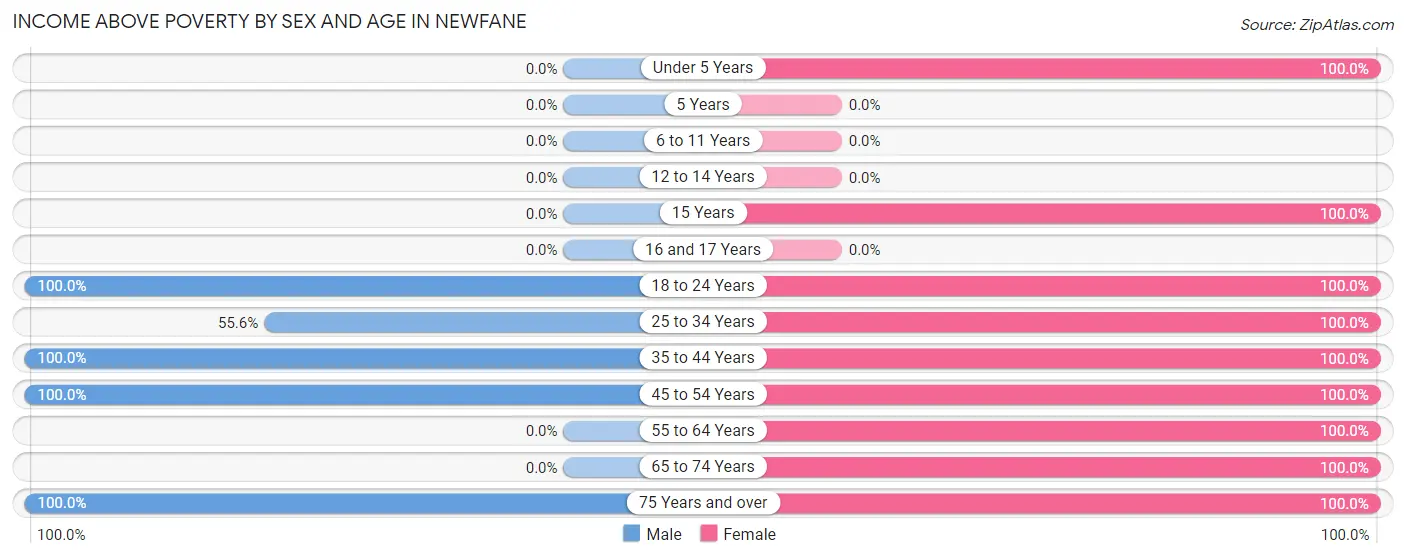
| Age Bracket | Male | Female |
| Under 5 Years | 0 (0.0%) | 4 (100.0%) |
| 5 Years | 0 (0.0%) | 0 (0.0%) |
| 6 to 11 Years | 0 (0.0%) | 0 (0.0%) |
| 12 to 14 Years | 0 (0.0%) | 0 (0.0%) |
| 15 Years | 0 (0.0%) | 8 (100.0%) |
| 16 and 17 Years | 0 (0.0%) | 0 (0.0%) |
| 18 to 24 Years | 38 (100.0%) | 12 (100.0%) |
| 25 to 34 Years | 5 (55.6%) | 4 (100.0%) |
| 35 to 44 Years | 4 (100.0%) | 13 (100.0%) |
| 45 to 54 Years | 6 (100.0%) | 6 (100.0%) |
| 55 to 64 Years | 0 (0.0%) | 4 (100.0%) |
| 65 to 74 Years | 0 (0.0%) | 9 (100.0%) |
| 75 Years and over | 4 (100.0%) | 9 (100.0%) |
| Total | 57 (86.4%) | 69 (100.0%) |
Income Below Poverty Among Married-Couple Families in Newfane
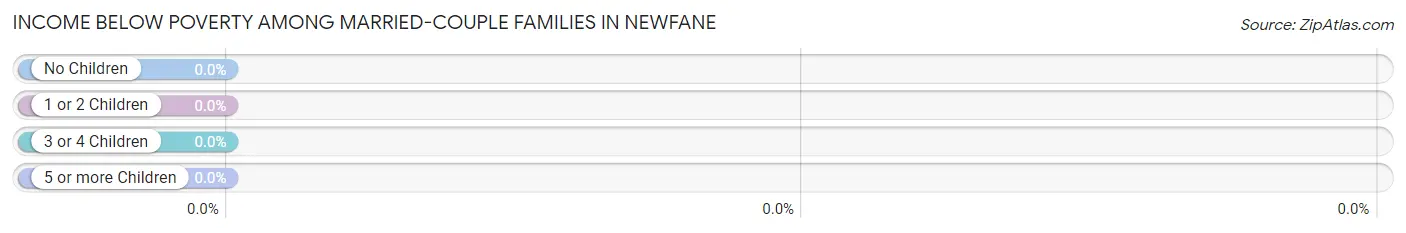
| Children | Above Poverty | Below Poverty |
| No Children | 8 (100.0%) | 0 (0.0%) |
| 1 or 2 Children | 10 (100.0%) | 0 (0.0%) |
| 3 or 4 Children | 0 (0.0%) | 0 (0.0%) |
| 5 or more Children | 0 (0.0%) | 0 (0.0%) |
| Total | 18 (100.0%) | 0 (0.0%) |
Income Below Poverty Among Single-Parent Households in Newfane
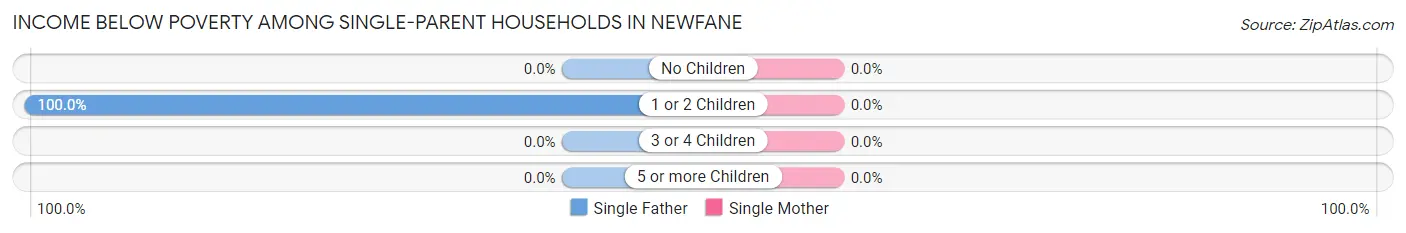
| Children | Single Father | Single Mother |
| No Children | 0 (0.0%) | 0 (0.0%) |
| 1 or 2 Children | 4 (100.0%) | 0 (0.0%) |
| 3 or 4 Children | 0 (0.0%) | 0 (0.0%) |
| 5 or more Children | 0 (0.0%) | 0 (0.0%) |
| Total | 4 (100.0%) | 0 (0.0%) |
Income Below Poverty Among Married-Couple vs Single-Parent Households in Newfane
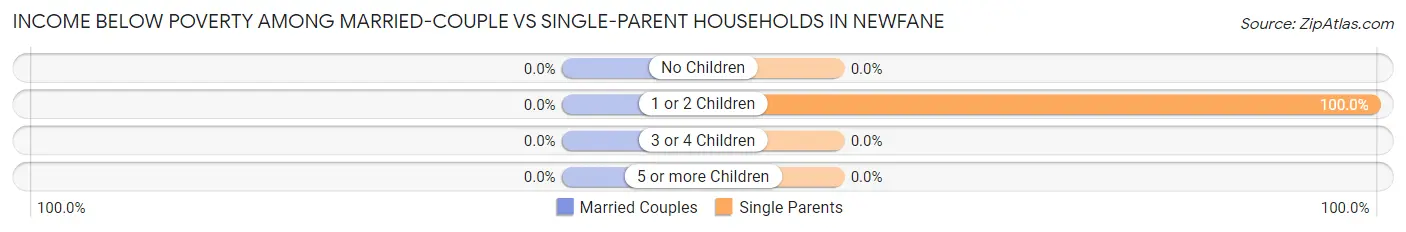
| Children | Married-Couple Families | Single-Parent Households |
| No Children | 0 (0.0%) | 0 (0.0%) |
| 1 or 2 Children | 0 (0.0%) | 4 (100.0%) |
| 3 or 4 Children | 0 (0.0%) | 0 (0.0%) |
| 5 or more Children | 0 (0.0%) | 0 (0.0%) |
| Total | 0 (0.0%) | 4 (100.0%) |
Race in Newfane
The most populous races in Newfane are , and White / Caucasian (135 | 100.0%).
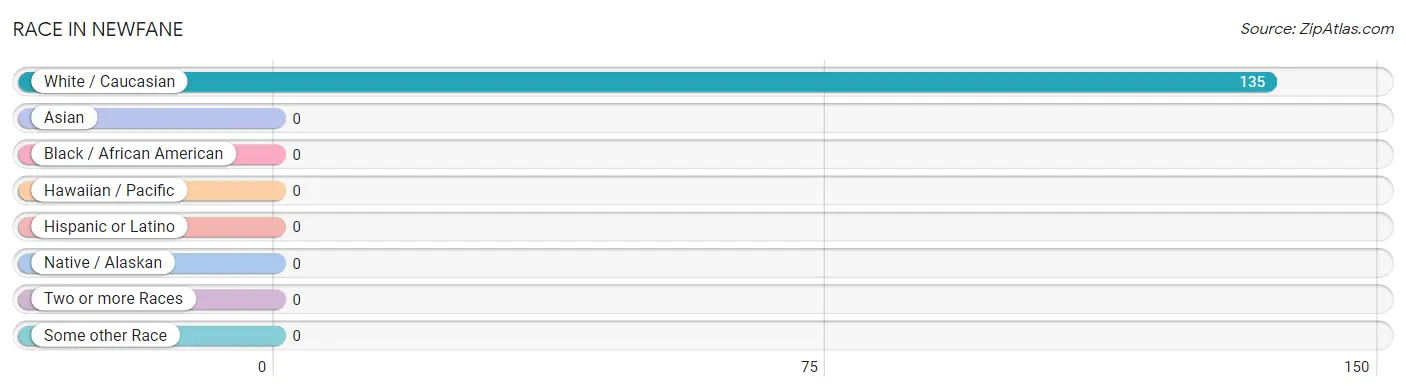
| Race | # Population | % Population |
| Asian | 0 | 0.0% |
| Black / African American | 0 | 0.0% |
| Hawaiian / Pacific | 0 | 0.0% |
| Hispanic or Latino | 0 | 0.0% |
| Native / Alaskan | 0 | 0.0% |
| White / Caucasian | 135 | 100.0% |
| Two or more Races | 0 | 0.0% |
| Some other Race | 0 | 0.0% |
| Total | 135 | 100.0% |
Ancestry in Newfane
The most populous ancestries reported in Newfane are Italian (28 | 20.7%), English (24 | 17.8%), German (20 | 14.8%), Northern European (19 | 14.1%), and Irish (13 | 9.6%), together accounting for 77.0% of all Newfane residents.
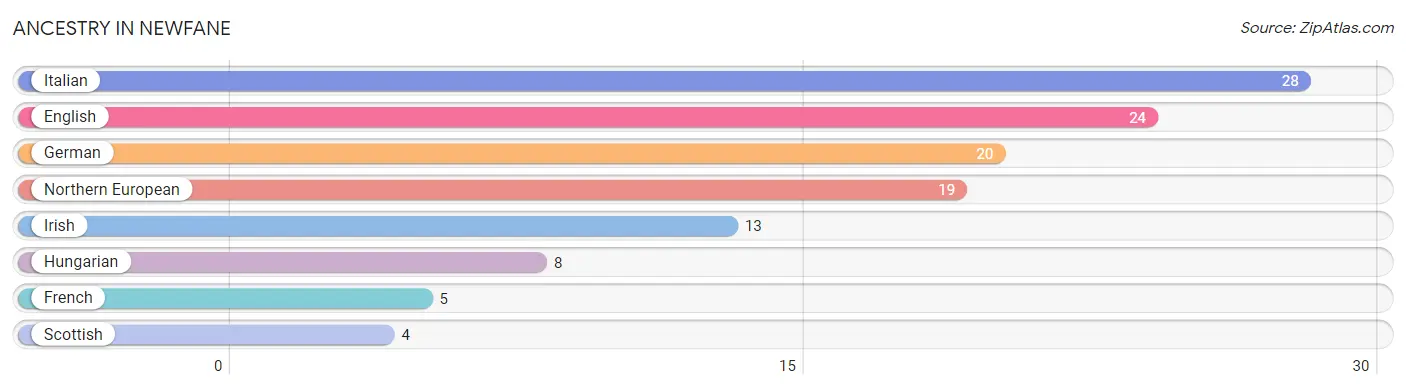
| Ancestry | # Population | % Population |
| English | 24 | 17.8% |
| French | 5 | 3.7% |
| German | 20 | 14.8% |
| Hungarian | 8 | 5.9% |
| Irish | 13 | 9.6% |
| Italian | 28 | 20.7% |
| Northern European | 19 | 14.1% |
| Scottish | 4 | 3.0% | View All 8 Rows |
Immigrants in Newfane

| Immigration Origin | # Population | % Population | View All 0 Rows |
Sex and Age in Newfane
Sex and Age in Newfane
The most populous age groups in Newfane are 20 to 24 Years (34 | 51.5%) for men and 15 to 19 Years (16 | 23.2%) for women.
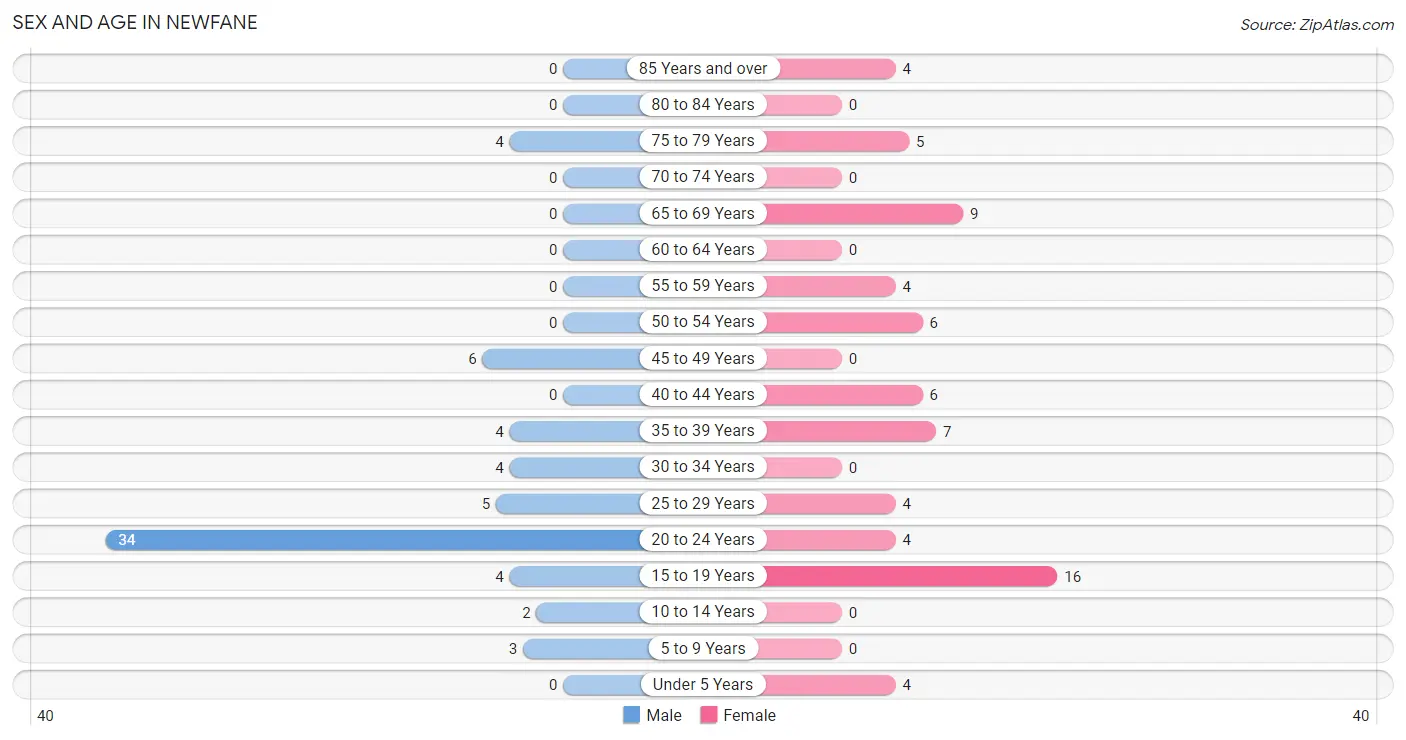
| Age Bracket | Male | Female |
| Under 5 Years | 0 (0.0%) | 4 (5.8%) |
| 5 to 9 Years | 3 (4.5%) | 0 (0.0%) |
| 10 to 14 Years | 2 (3.0%) | 0 (0.0%) |
| 15 to 19 Years | 4 (6.1%) | 16 (23.2%) |
| 20 to 24 Years | 34 (51.5%) | 4 (5.8%) |
| 25 to 29 Years | 5 (7.6%) | 4 (5.8%) |
| 30 to 34 Years | 4 (6.1%) | 0 (0.0%) |
| 35 to 39 Years | 4 (6.1%) | 7 (10.1%) |
| 40 to 44 Years | 0 (0.0%) | 6 (8.7%) |
| 45 to 49 Years | 6 (9.1%) | 0 (0.0%) |
| 50 to 54 Years | 0 (0.0%) | 6 (8.7%) |
| 55 to 59 Years | 0 (0.0%) | 4 (5.8%) |
| 60 to 64 Years | 0 (0.0%) | 0 (0.0%) |
| 65 to 69 Years | 0 (0.0%) | 9 (13.0%) |
| 70 to 74 Years | 0 (0.0%) | 0 (0.0%) |
| 75 to 79 Years | 4 (6.1%) | 5 (7.2%) |
| 80 to 84 Years | 0 (0.0%) | 0 (0.0%) |
| 85 Years and over | 0 (0.0%) | 4 (5.8%) |
| Total | 66 (100.0%) | 69 (100.0%) |
Families and Households in Newfane
Median Family Size in Newfane
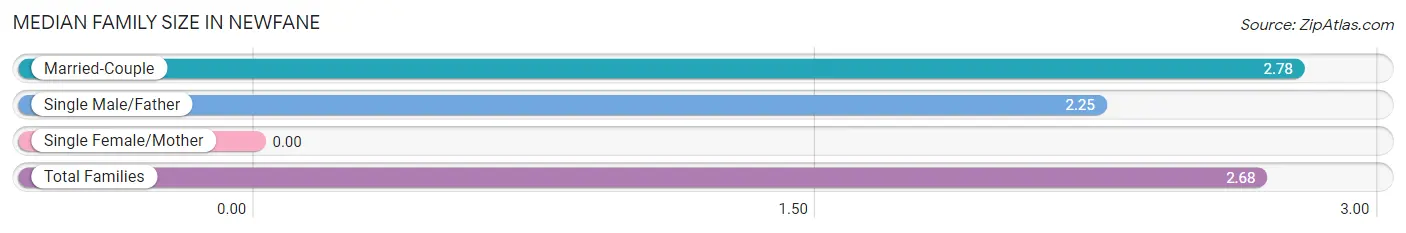
| Family Type | # Families | Family Size |
| Married-Couple | 18 (81.8%) | 2.78 |
| Single Male/Father | 4 (18.2%) | 2.25 |
| Single Female/Mother | 0 (0.0%) | - |
| Total Families | 22 (100.0%) | 2.68 |
Median Household Size in Newfane
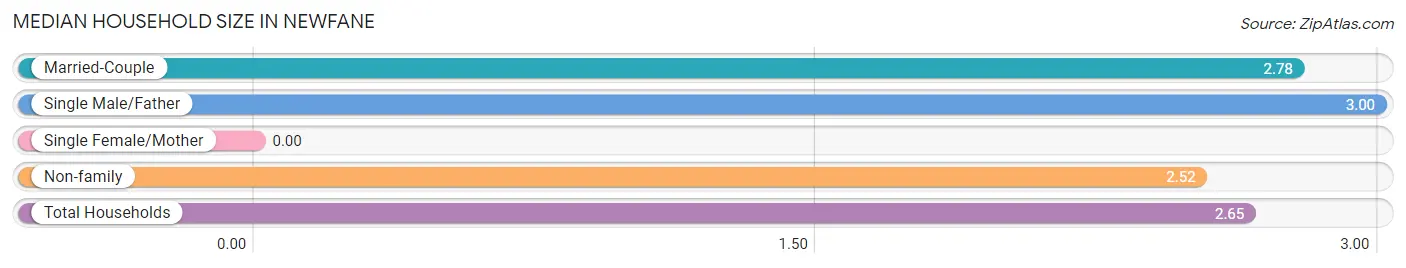
| Household Type | # Households | Household Size |
| Married-Couple | 18 (35.3%) | 2.78 |
| Single Male/Father | 4 (7.8%) | 3.00 |
| Single Female/Mother | 0 (0.0%) | - |
| Non-family | 29 (56.9%) | 2.52 |
| Total Households | 51 (100.0%) | 2.65 |
Household Size by Marriage Status in Newfane
Out of a total of 51 households in Newfane, 22 (43.1%) are family households, while 29 (56.9%) are nonfamily households. The most numerous type of family households are 3-person households, comprising 10, and the most common type of nonfamily households are 1-person households, comprising 20.
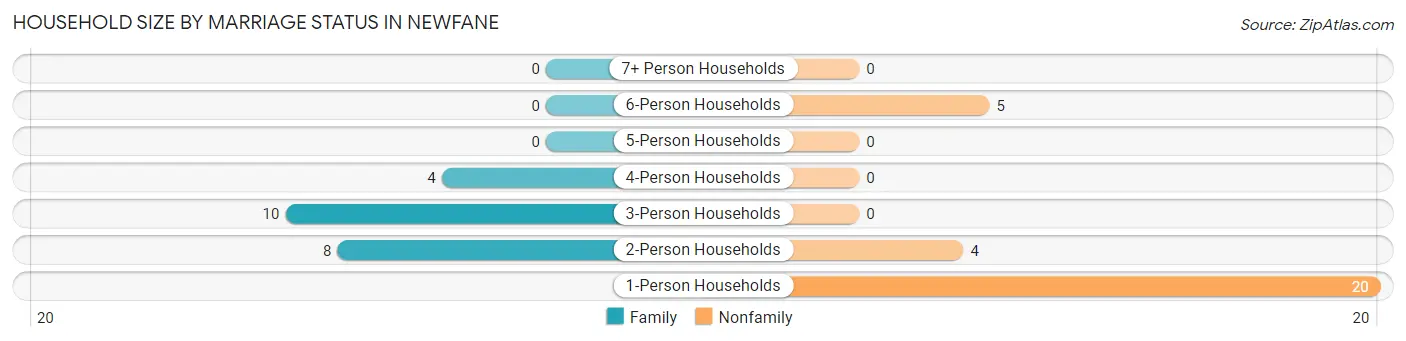
| Household Size | Family Households | Nonfamily Households |
| 1-Person Households | - | 20 (39.2%) |
| 2-Person Households | 8 (15.7%) | 4 (7.8%) |
| 3-Person Households | 10 (19.6%) | 0 (0.0%) |
| 4-Person Households | 4 (7.8%) | 0 (0.0%) |
| 5-Person Households | 0 (0.0%) | 0 (0.0%) |
| 6-Person Households | 0 (0.0%) | 5 (9.8%) |
| 7+ Person Households | 0 (0.0%) | 0 (0.0%) |
| Total | 22 (43.1%) | 29 (56.9%) |
Female Fertility in Newfane
Fertility by Age in Newfane
| Age Bracket | Women with Births | Births / 1,000 Women |
| 15 to 19 years | 0 (0.0%) | 0.0 |
| 20 to 34 years | 0 (0.0%) | 0.0 |
| 35 to 50 years | 0 (0.0%) | 0.0 |
| Total | 0 (0.0%) | 0.0 |
Fertility by Age by Marriage Status in Newfane
| Age Bracket | Married | Unmarried |
| 15 to 19 years | 0 (0.0%) | 0 (0.0%) |
| 20 to 34 years | 0 (0.0%) | 0 (0.0%) |
| 35 to 50 years | 0 (0.0%) | 0 (0.0%) |
| Total | 0 (0.0%) | 0 (0.0%) |
Fertility by Education in Newfane
| Educational Attainment | Women with Births | Births / 1,000 Women |
| Less than High School | 0 (0.0%) | 0.0 |
| High School Diploma | 0 (0.0%) | 0.0 |
| College or Associate's Degree | 0 (0.0%) | 0.0 |
| Bachelor's Degree | 0 (0.0%) | 0.0 |
| Graduate Degree | 0 (0.0%) | 0.0 |
| Total | 0 (0.0%) | 0.0 |
Fertility by Education by Marriage Status in Newfane
| Educational Attainment | Married | Unmarried |
| Less than High School | 0 (0.0%) | 0 (0.0%) |
| High School Diploma | 0 (0.0%) | 0 (0.0%) |
| College or Associate's Degree | 0 (0.0%) | 0 (0.0%) |
| Bachelor's Degree | 0 (0.0%) | 0 (0.0%) |
| Graduate Degree | 0 (0.0%) | 0 (0.0%) |
| Total | 0 (0.0%) | 0 (0.0%) |
Employment Characteristics in Newfane
Employment by Class of Employer in Newfane
Among the 114 employed individuals in Newfane, private company employees (69 | 60.5%), self-employed (not incorporated) (14 | 12.3%), and not-for-profit organizations (14 | 12.3%) make up the most common classes of employment.
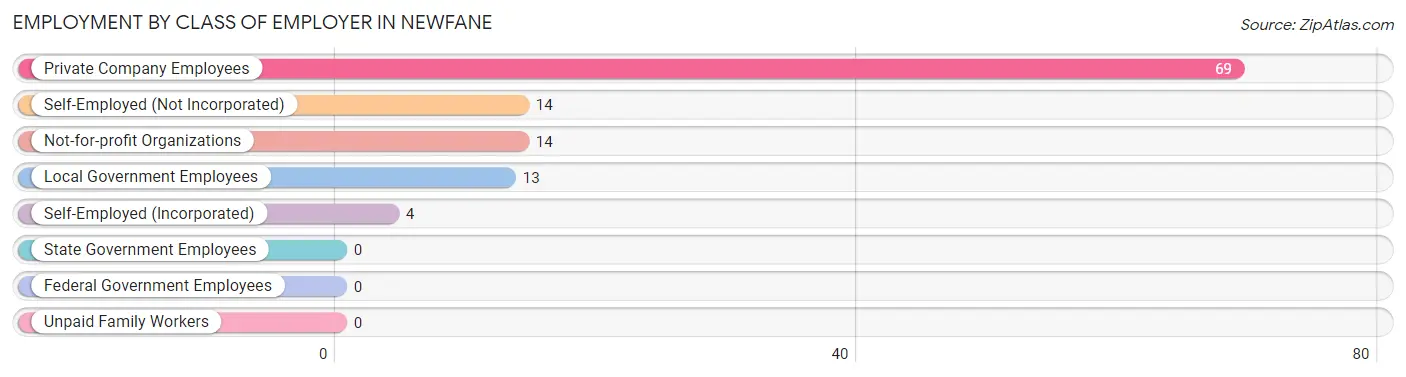
| Employer Class | # Employees | % Employees |
| Private Company Employees | 69 | 60.5% |
| Self-Employed (Incorporated) | 4 | 3.5% |
| Self-Employed (Not Incorporated) | 14 | 12.3% |
| Not-for-profit Organizations | 14 | 12.3% |
| Local Government Employees | 13 | 11.4% |
| State Government Employees | 0 | 0.0% |
| Federal Government Employees | 0 | 0.0% |
| Unpaid Family Workers | 0 | 0.0% |
| Total | 114 | 100.0% |
Employment Status by Age in Newfane
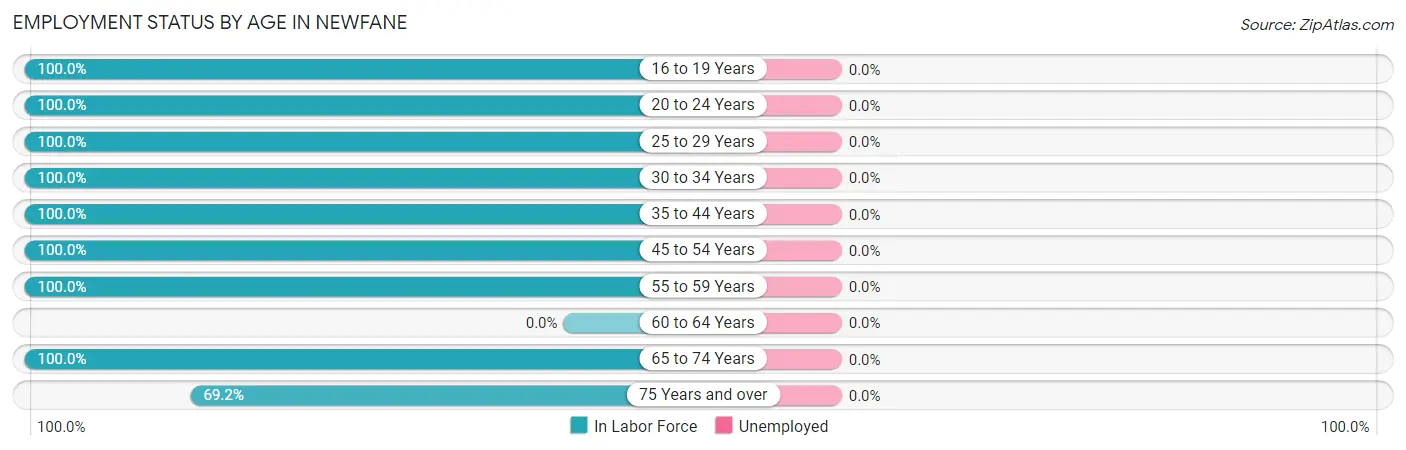
| Age Bracket | In Labor Force | Unemployed |
| 16 to 19 Years | 12 (100.0%) | 0 (0.0%) |
| 20 to 24 Years | 38 (100.0%) | 0 (0.0%) |
| 25 to 29 Years | 9 (100.0%) | 0 (0.0%) |
| 30 to 34 Years | 4 (100.0%) | 0 (0.0%) |
| 35 to 44 Years | 17 (100.0%) | 0 (0.0%) |
| 45 to 54 Years | 12 (100.0%) | 0 (0.0%) |
| 55 to 59 Years | 4 (100.0%) | 0 (0.0%) |
| 60 to 64 Years | 0 (0.0%) | 0 (0.0%) |
| 65 to 74 Years | 9 (100.0%) | 0 (0.0%) |
| 75 Years and over | 9 (69.2%) | 0 (0.0%) |
| Total | 114 (96.6%) | 0 (0.0%) |
Employment Status by Educational Attainment in Newfane
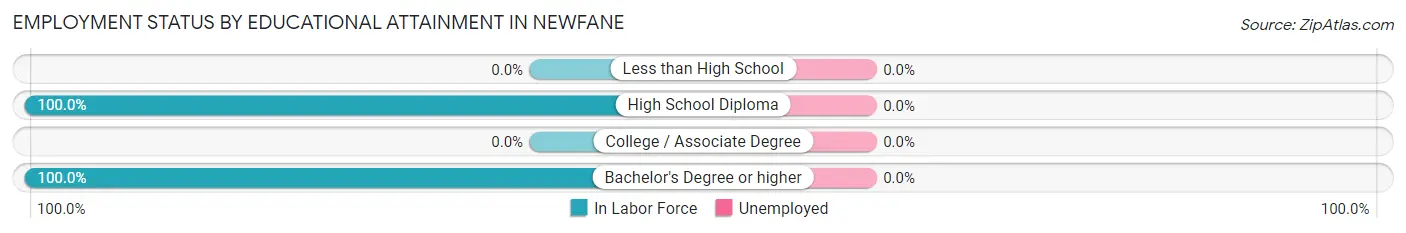
| Educational Attainment | In Labor Force | Unemployed |
| Less than High School | 0 (0.0%) | 0 (0.0%) |
| High School Diploma | 15 (100.0%) | 0 (0.0%) |
| College / Associate Degree | 0 (0.0%) | 0 (0.0%) |
| Bachelor's Degree or higher | 31 (100.0%) | 0 (0.0%) |
| Total | 46 (100.0%) | 0 (0.0%) |
Employment Occupations by Sex in Newfane
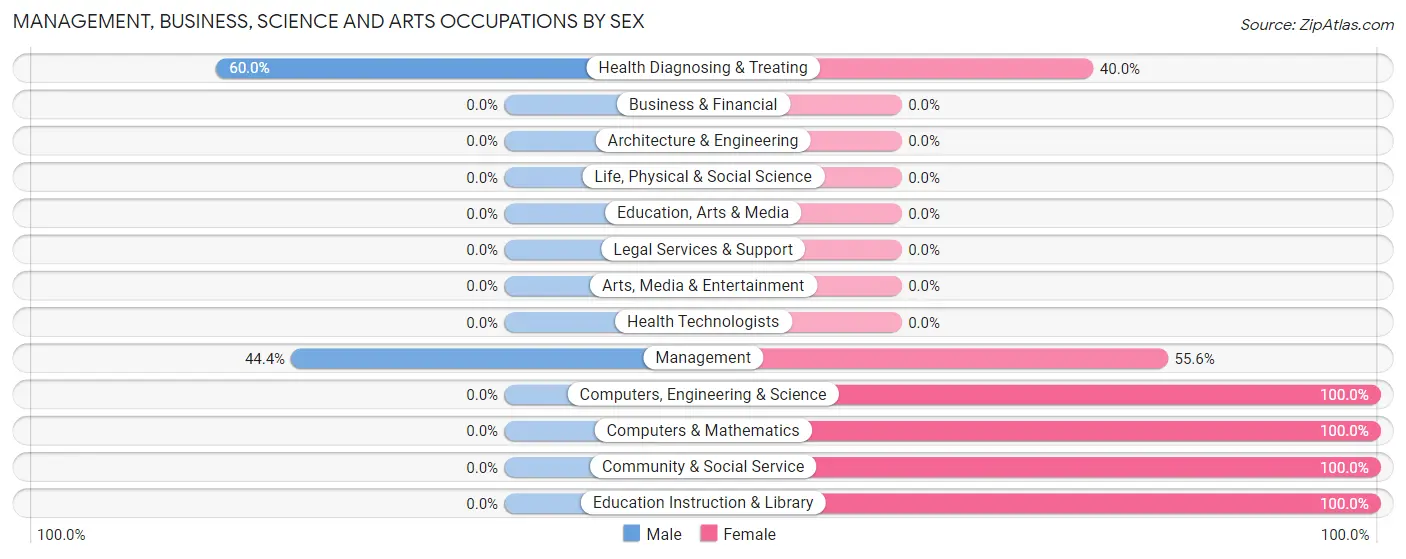
Management, Business, Science and Arts Occupations
The most common Management, Business, Science and Arts occupations in Newfane are Management (18 | 15.8%), Community & Social Service (10 | 8.8%), Education Instruction & Library (10 | 8.8%), Health Diagnosing & Treating (10 | 8.8%), and Computers, Engineering & Science (4 | 3.5%).
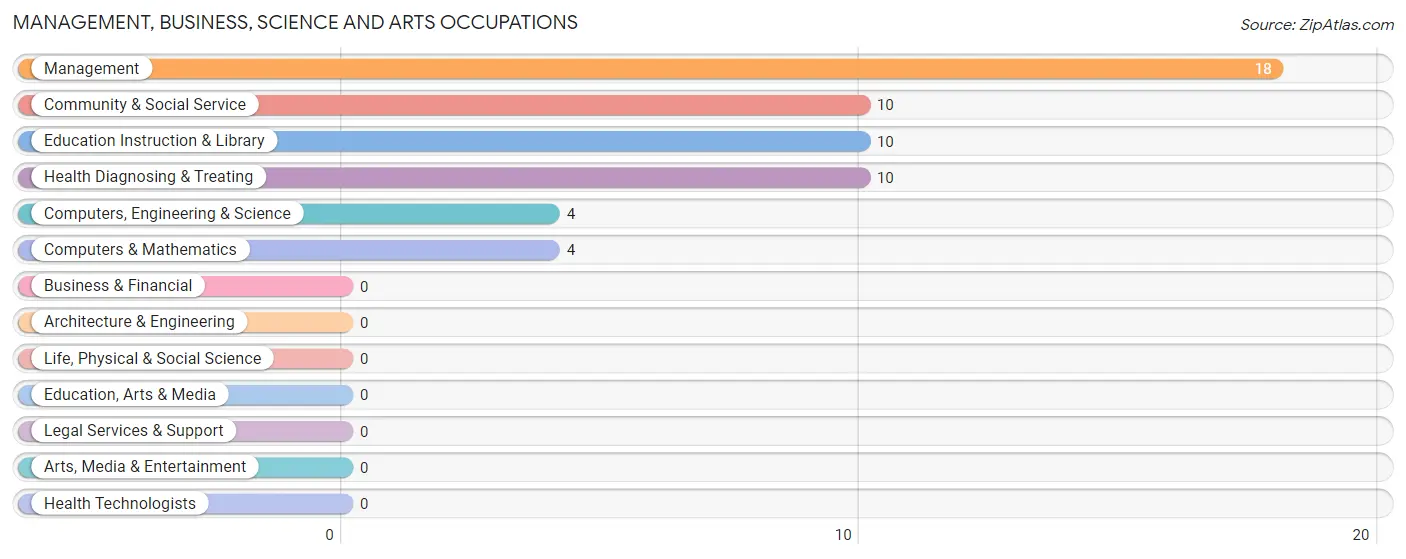
Management, Business, Science and Arts Occupations by Sex
Within the Management, Business, Science and Arts occupations in Newfane, the most male-oriented occupations are Health Diagnosing & Treating (60.0%), and Management (44.4%), while the most female-oriented occupations are Computers, Engineering & Science (100.0%), Computers & Mathematics (100.0%), and Community & Social Service (100.0%).
| Occupation | Male | Female |
| Management | 8 (44.4%) | 10 (55.6%) |
| Business & Financial | 0 (0.0%) | 0 (0.0%) |
| Computers, Engineering & Science | 0 (0.0%) | 4 (100.0%) |
| Computers & Mathematics | 0 (0.0%) | 4 (100.0%) |
| Architecture & Engineering | 0 (0.0%) | 0 (0.0%) |
| Life, Physical & Social Science | 0 (0.0%) | 0 (0.0%) |
| Community & Social Service | 0 (0.0%) | 10 (100.0%) |
| Education, Arts & Media | 0 (0.0%) | 0 (0.0%) |
| Legal Services & Support | 0 (0.0%) | 0 (0.0%) |
| Education Instruction & Library | 0 (0.0%) | 10 (100.0%) |
| Arts, Media & Entertainment | 0 (0.0%) | 0 (0.0%) |
| Health Diagnosing & Treating | 6 (60.0%) | 4 (40.0%) |
| Health Technologists | 0 (0.0%) | 0 (0.0%) |
| Total (Category) | 14 (33.3%) | 28 (66.7%) |
| Total (Overall) | 61 (53.5%) | 53 (46.5%) |
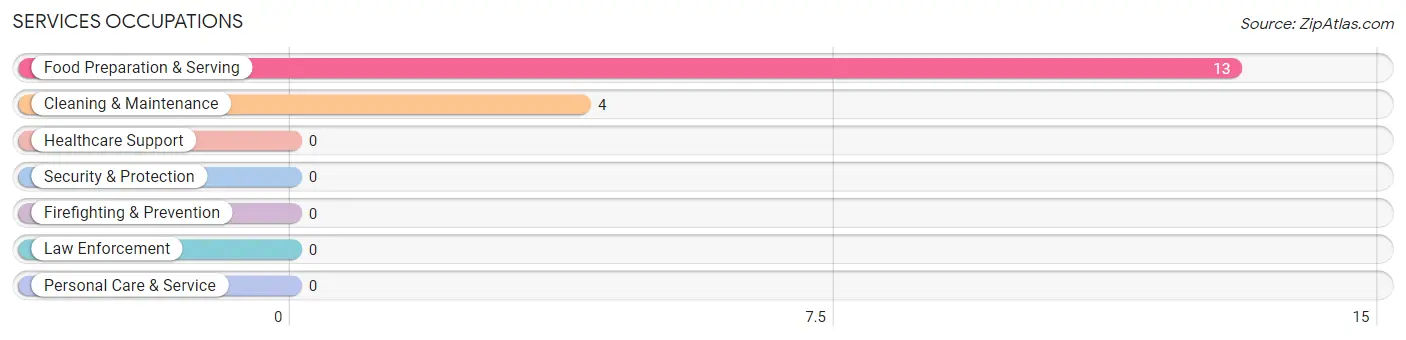
Services Occupations
The most common Services occupations in Newfane are Food Preparation & Serving (13 | 11.4%), and Cleaning & Maintenance (4 | 3.5%).
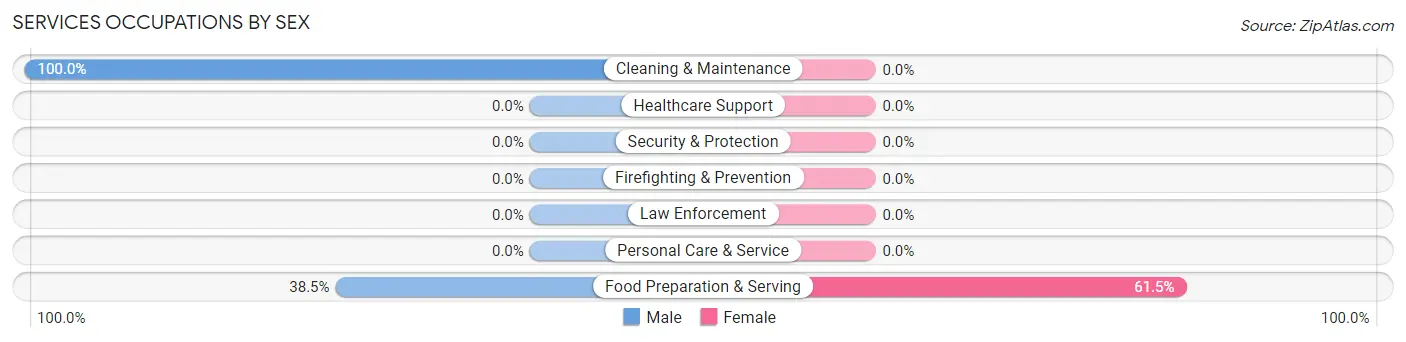
Services Occupations by Sex
| Occupation | Male | Female |
| Healthcare Support | 0 (0.0%) | 0 (0.0%) |
| Security & Protection | 0 (0.0%) | 0 (0.0%) |
| Firefighting & Prevention | 0 (0.0%) | 0 (0.0%) |
| Law Enforcement | 0 (0.0%) | 0 (0.0%) |
| Food Preparation & Serving | 5 (38.5%) | 8 (61.5%) |
| Cleaning & Maintenance | 4 (100.0%) | 0 (0.0%) |
| Personal Care & Service | 0 (0.0%) | 0 (0.0%) |
| Total (Category) | 9 (52.9%) | 8 (47.1%) |
| Total (Overall) | 61 (53.5%) | 53 (46.5%) |
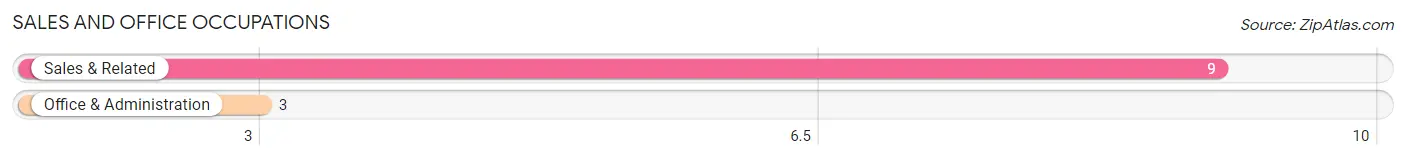
Sales and Office Occupations
The most common Sales and Office occupations in Newfane are Sales & Related (9 | 7.9%), and Office & Administration (3 | 2.6%).
Sales and Office Occupations by Sex
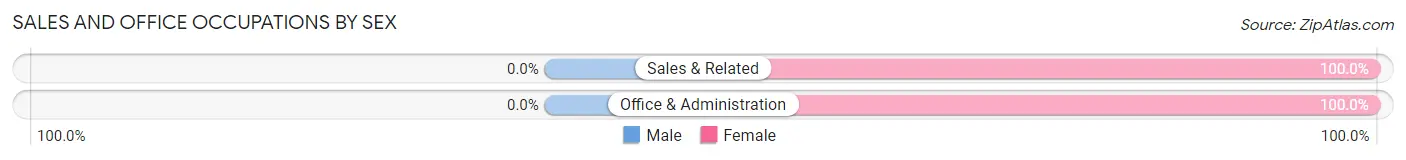
| Occupation | Male | Female |
| Sales & Related | 0 (0.0%) | 9 (100.0%) |
| Office & Administration | 0 (0.0%) | 3 (100.0%) |
| Total (Category) | 0 (0.0%) | 12 (100.0%) |
| Total (Overall) | 61 (53.5%) | 53 (46.5%) |
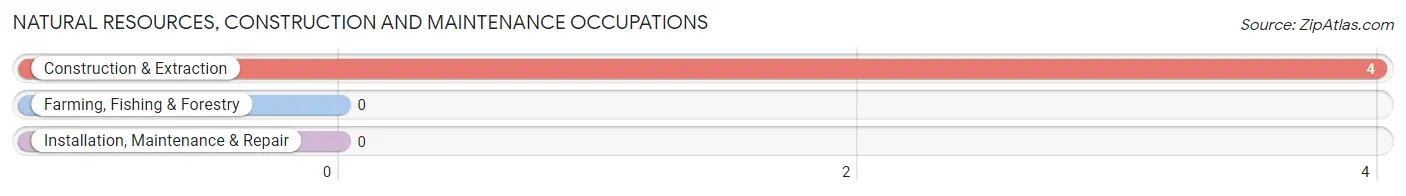
Natural Resources, Construction and Maintenance Occupations
The most common Natural Resources, Construction and Maintenance occupations in Newfane are , and Construction & Extraction (4 | 3.5%).
Natural Resources, Construction and Maintenance Occupations by Sex
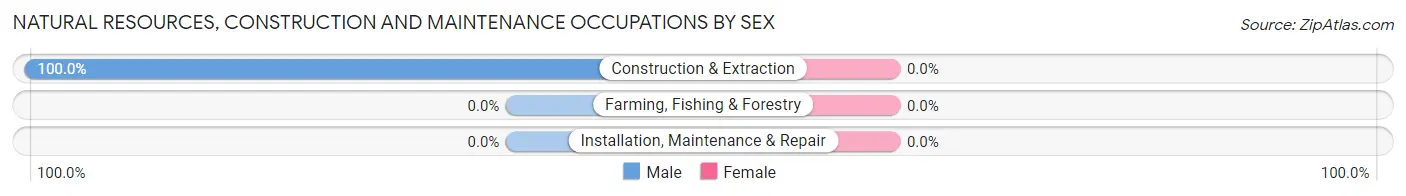
| Occupation | Male | Female |
| Farming, Fishing & Forestry | 0 (0.0%) | 0 (0.0%) |
| Construction & Extraction | 4 (100.0%) | 0 (0.0%) |
| Installation, Maintenance & Repair | 0 (0.0%) | 0 (0.0%) |
| Total (Category) | 4 (100.0%) | 0 (0.0%) |
| Total (Overall) | 61 (53.5%) | 53 (46.5%) |
Production, Transportation and Moving Occupations
The most common Production, Transportation and Moving occupations in Newfane are Material Moving (22 | 19.3%), Production (15 | 13.2%), and Transportation (2 | 1.8%).
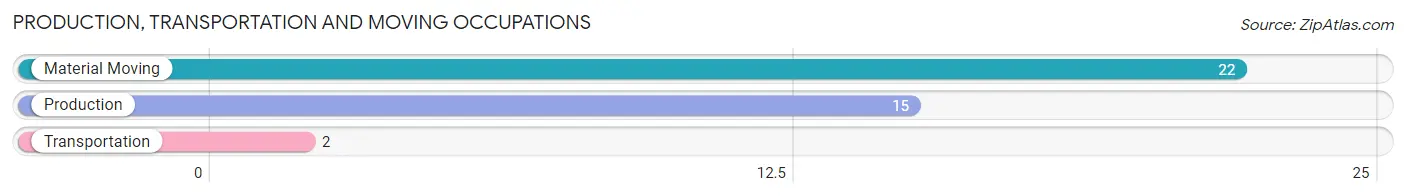
Production, Transportation and Moving Occupations by Sex
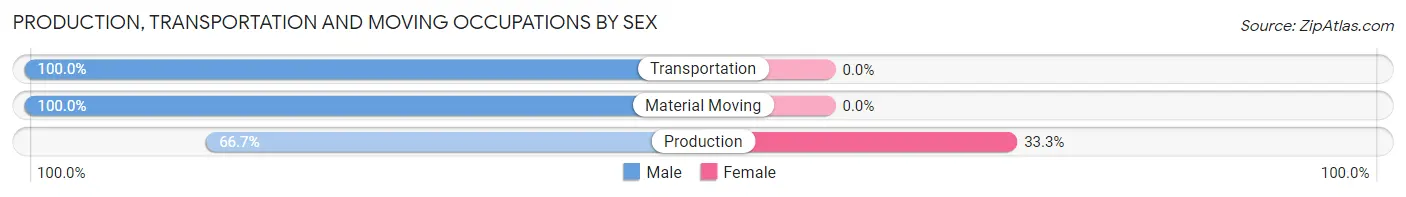
| Occupation | Male | Female |
| Production | 10 (66.7%) | 5 (33.3%) |
| Transportation | 2 (100.0%) | 0 (0.0%) |
| Material Moving | 22 (100.0%) | 0 (0.0%) |
| Total (Category) | 34 (87.2%) | 5 (12.8%) |
| Total (Overall) | 61 (53.5%) | 53 (46.5%) |
Employment Industries by Sex in Newfane
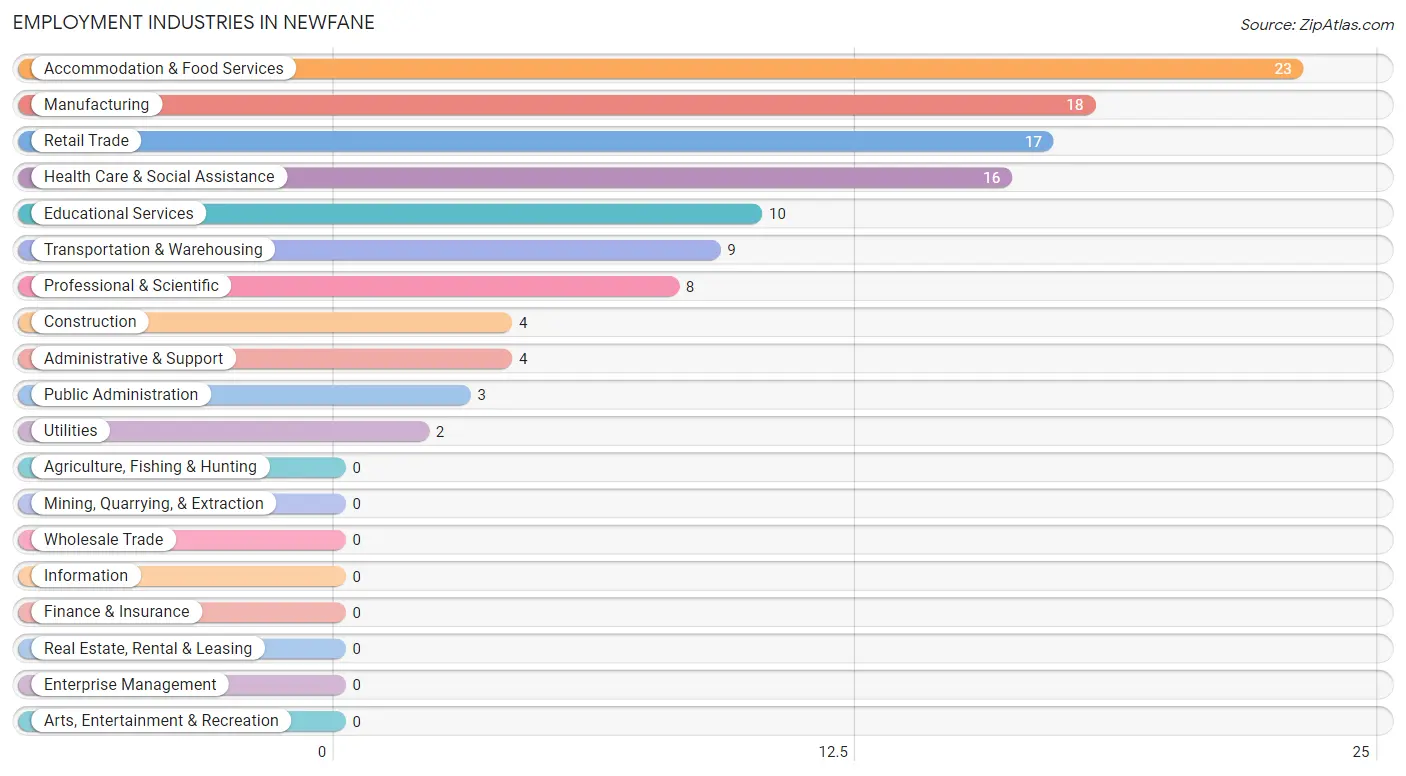
Employment Industries in Newfane
The major employment industries in Newfane include Accommodation & Food Services (23 | 20.2%), Manufacturing (18 | 15.8%), Retail Trade (17 | 14.9%), Health Care & Social Assistance (16 | 14.0%), and Educational Services (10 | 8.8%).
Employment Industries by Sex in Newfane
The Newfane industries that see more men than women are Construction (100.0%), Transportation & Warehousing (100.0%), and Utilities (100.0%), whereas the industries that tend to have a higher number of women are Retail Trade (100.0%), Professional & Scientific (100.0%), and Educational Services (100.0%).

| Industry | Male | Female |
| Agriculture, Fishing & Hunting | 0 (0.0%) | 0 (0.0%) |
| Mining, Quarrying, & Extraction | 0 (0.0%) | 0 (0.0%) |
| Construction | 4 (100.0%) | 0 (0.0%) |
| Manufacturing | 13 (72.2%) | 5 (27.8%) |
| Wholesale Trade | 0 (0.0%) | 0 (0.0%) |
| Retail Trade | 0 (0.0%) | 17 (100.0%) |
| Transportation & Warehousing | 9 (100.0%) | 0 (0.0%) |
| Utilities | 2 (100.0%) | 0 (0.0%) |
| Information | 0 (0.0%) | 0 (0.0%) |
| Finance & Insurance | 0 (0.0%) | 0 (0.0%) |
| Real Estate, Rental & Leasing | 0 (0.0%) | 0 (0.0%) |
| Professional & Scientific | 0 (0.0%) | 8 (100.0%) |
| Enterprise Management | 0 (0.0%) | 0 (0.0%) |
| Administrative & Support | 4 (100.0%) | 0 (0.0%) |
| Educational Services | 0 (0.0%) | 10 (100.0%) |
| Health Care & Social Assistance | 10 (62.5%) | 6 (37.5%) |
| Arts, Entertainment & Recreation | 0 (0.0%) | 0 (0.0%) |
| Accommodation & Food Services | 19 (82.6%) | 4 (17.4%) |
| Public Administration | 0 (0.0%) | 3 (100.0%) |
| Total | 61 (53.5%) | 53 (46.5%) |
Education in Newfane
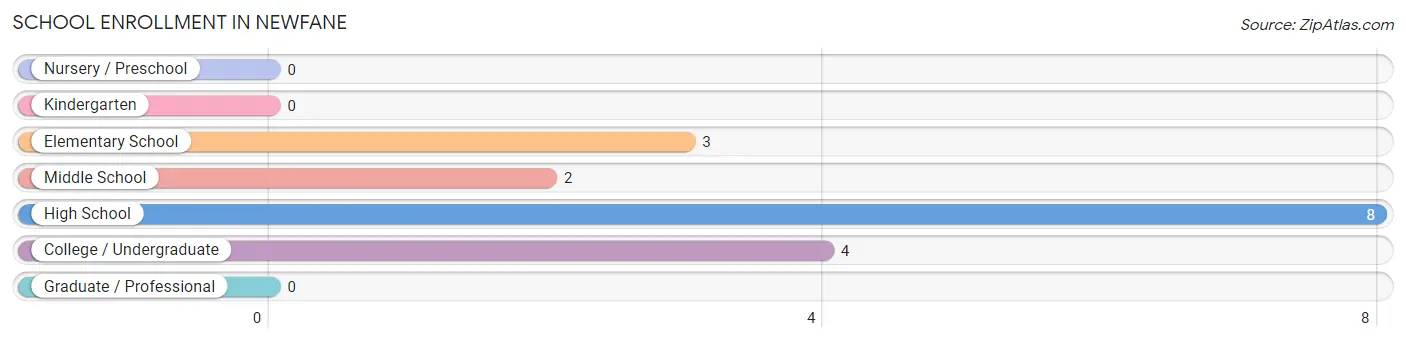
School Enrollment in Newfane
The most common levels of schooling among the 17 students in Newfane are high school (8 | 47.1%), college / undergraduate (4 | 23.5%), and elementary school (3 | 17.6%).
| School Level | # Students | % Students |
| Nursery / Preschool | 0 | 0.0% |
| Kindergarten | 0 | 0.0% |
| Elementary School | 3 | 17.6% |
| Middle School | 2 | 11.8% |
| High School | 8 | 47.1% |
| College / Undergraduate | 4 | 23.5% |
| Graduate / Professional | 0 | 0.0% |
| Total | 17 | 100.0% |
School Enrollment by Age by Funding Source in Newfane
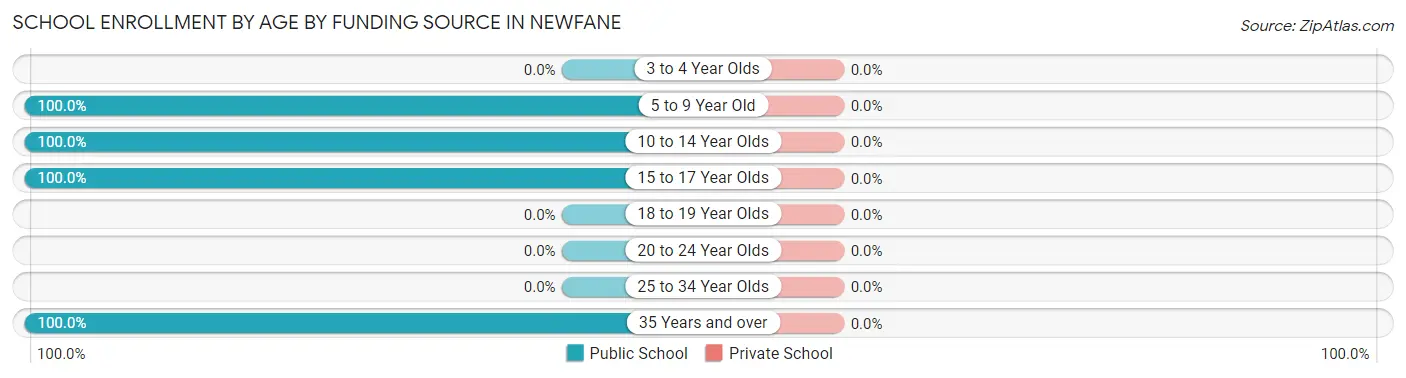
| Age Bracket | Public School | Private School |
| 3 to 4 Year Olds | 0 (0.0%) | 0 (0.0%) |
| 5 to 9 Year Old | 3 (100.0%) | 0 (0.0%) |
| 10 to 14 Year Olds | 2 (100.0%) | 0 (0.0%) |
| 15 to 17 Year Olds | 8 (100.0%) | 0 (0.0%) |
| 18 to 19 Year Olds | 0 (0.0%) | 0 (0.0%) |
| 20 to 24 Year Olds | 0 (0.0%) | 0 (0.0%) |
| 25 to 34 Year Olds | 0 (0.0%) | 0 (0.0%) |
| 35 Years and over | 4 (100.0%) | 0 (0.0%) |
| Total | 17 (100.0%) | 0 (0.0%) |
Educational Attainment by Field of Study in Newfane
Business (16 | 30.2%), bio, nature & agricultural (10 | 18.9%), visual & performing arts (10 | 18.9%), arts & humanities (9 | 17.0%), and psychology (4 | 7.5%) are the most common fields of study among 53 individuals in Newfane who have obtained a bachelor's degree or higher.
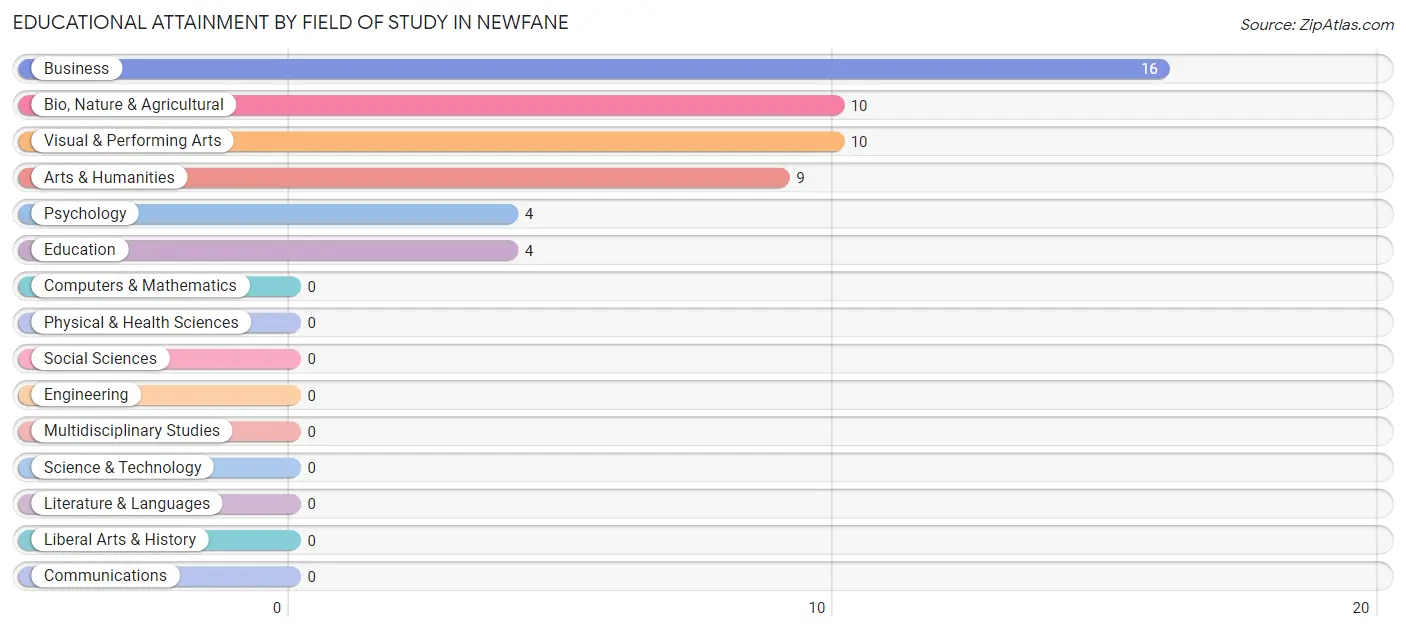
| Field of Study | # Graduates | % Graduates |
| Computers & Mathematics | 0 | 0.0% |
| Bio, Nature & Agricultural | 10 | 18.9% |
| Physical & Health Sciences | 0 | 0.0% |
| Psychology | 4 | 7.5% |
| Social Sciences | 0 | 0.0% |
| Engineering | 0 | 0.0% |
| Multidisciplinary Studies | 0 | 0.0% |
| Science & Technology | 0 | 0.0% |
| Business | 16 | 30.2% |
| Education | 4 | 7.5% |
| Literature & Languages | 0 | 0.0% |
| Liberal Arts & History | 0 | 0.0% |
| Visual & Performing Arts | 10 | 18.9% |
| Communications | 0 | 0.0% |
| Arts & Humanities | 9 | 17.0% |
| Total | 53 | 100.0% |
Transportation & Commute in Newfane
Vehicle Availability by Sex in Newfane
The most prevalent vehicle ownership categories in Newfane are males with 5 or more vehicles (38, accounting for 62.3%) and females with 5 or more vehicles (8, making up 71.7%).
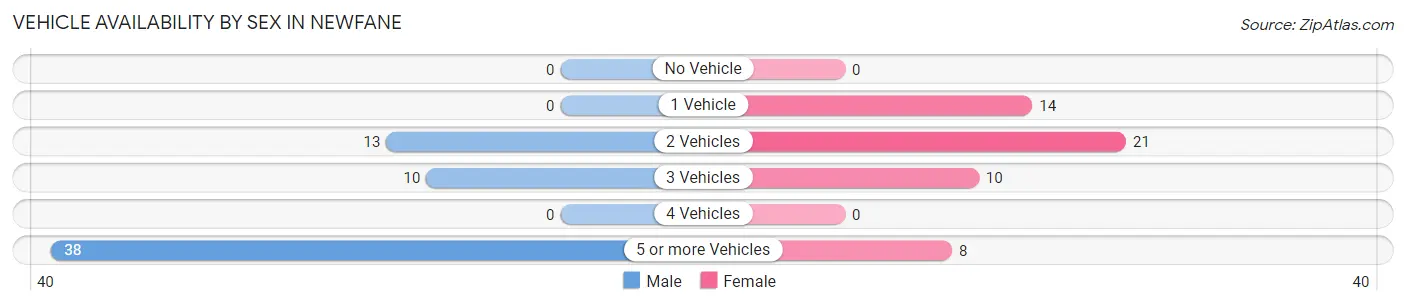
| Vehicles Available | Male | Female |
| No Vehicle | 0 (0.0%) | 0 (0.0%) |
| 1 Vehicle | 0 (0.0%) | 14 (26.4%) |
| 2 Vehicles | 13 (21.3%) | 21 (39.6%) |
| 3 Vehicles | 10 (16.4%) | 10 (18.9%) |
| 4 Vehicles | 0 (0.0%) | 0 (0.0%) |
| 5 or more Vehicles | 38 (62.3%) | 8 (15.1%) |
| Total | 61 (100.0%) | 53 (100.0%) |
Commute Time in Newfane
The most frequently occuring commute durations in Newfane are 20 to 24 minutes (38 commuters, 39.6%), 30 to 34 minutes (24 commuters, 25.0%), and less than 5 minutes (11 commuters, 11.5%).
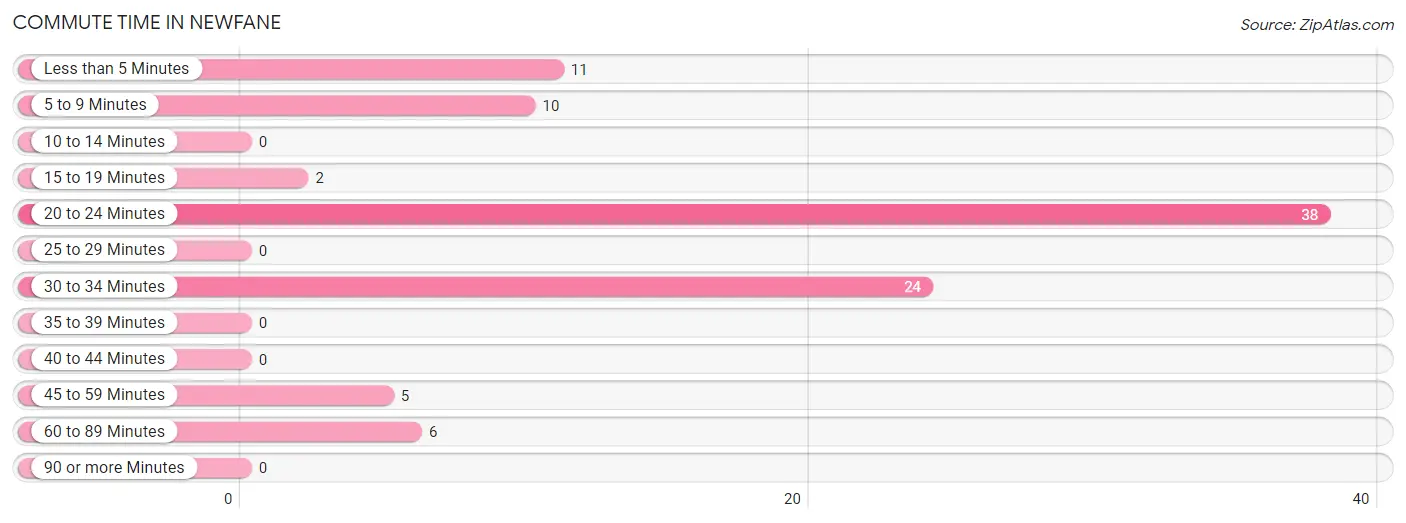
| Commute Time | # Commuters | % Commuters |
| Less than 5 Minutes | 11 | 11.5% |
| 5 to 9 Minutes | 10 | 10.4% |
| 10 to 14 Minutes | 0 | 0.0% |
| 15 to 19 Minutes | 2 | 2.1% |
| 20 to 24 Minutes | 38 | 39.6% |
| 25 to 29 Minutes | 0 | 0.0% |
| 30 to 34 Minutes | 24 | 25.0% |
| 35 to 39 Minutes | 0 | 0.0% |
| 40 to 44 Minutes | 0 | 0.0% |
| 45 to 59 Minutes | 5 | 5.2% |
| 60 to 89 Minutes | 6 | 6.2% |
| 90 or more Minutes | 0 | 0.0% |
Commute Time by Sex in Newfane
The most common commute times in Newfane are 20 to 24 minutes (30 commuters, 52.6%) for males and 5 to 9 minutes (10 commuters, 25.6%) for females.
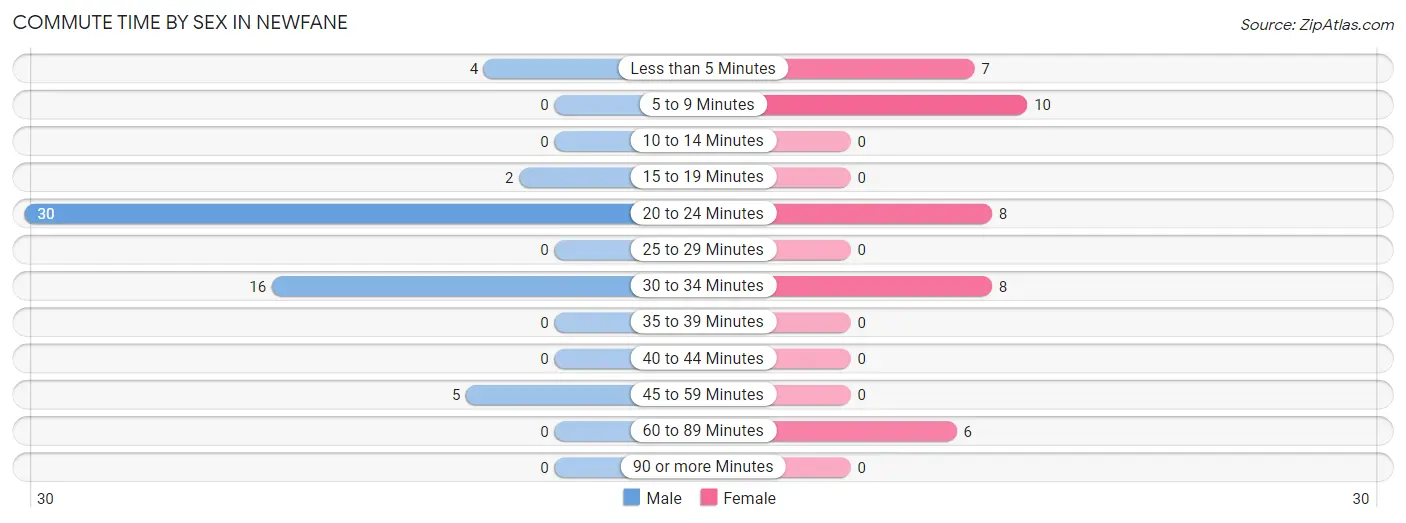
| Commute Time | Male | Female |
| Less than 5 Minutes | 4 (7.0%) | 7 (17.9%) |
| 5 to 9 Minutes | 0 (0.0%) | 10 (25.6%) |
| 10 to 14 Minutes | 0 (0.0%) | 0 (0.0%) |
| 15 to 19 Minutes | 2 (3.5%) | 0 (0.0%) |
| 20 to 24 Minutes | 30 (52.6%) | 8 (20.5%) |
| 25 to 29 Minutes | 0 (0.0%) | 0 (0.0%) |
| 30 to 34 Minutes | 16 (28.1%) | 8 (20.5%) |
| 35 to 39 Minutes | 0 (0.0%) | 0 (0.0%) |
| 40 to 44 Minutes | 0 (0.0%) | 0 (0.0%) |
| 45 to 59 Minutes | 5 (8.8%) | 0 (0.0%) |
| 60 to 89 Minutes | 0 (0.0%) | 6 (15.4%) |
| 90 or more Minutes | 0 (0.0%) | 0 (0.0%) |
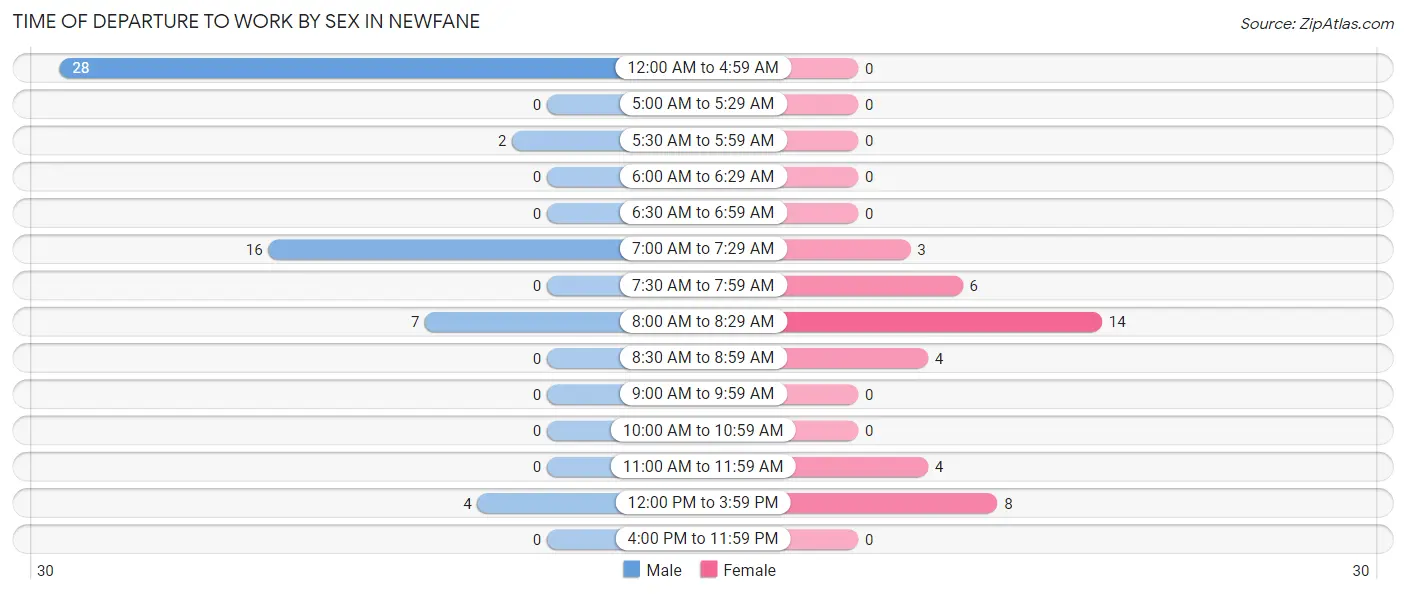
Time of Departure to Work by Sex in Newfane
The most frequent times of departure to work in Newfane are 12:00 AM to 4:59 AM (28, 49.1%) for males and 8:00 AM to 8:29 AM (14, 35.9%) for females.
| Time of Departure | Male | Female |
| 12:00 AM to 4:59 AM | 28 (49.1%) | 0 (0.0%) |
| 5:00 AM to 5:29 AM | 0 (0.0%) | 0 (0.0%) |
| 5:30 AM to 5:59 AM | 2 (3.5%) | 0 (0.0%) |
| 6:00 AM to 6:29 AM | 0 (0.0%) | 0 (0.0%) |
| 6:30 AM to 6:59 AM | 0 (0.0%) | 0 (0.0%) |
| 7:00 AM to 7:29 AM | 16 (28.1%) | 3 (7.7%) |
| 7:30 AM to 7:59 AM | 0 (0.0%) | 6 (15.4%) |
| 8:00 AM to 8:29 AM | 7 (12.3%) | 14 (35.9%) |
| 8:30 AM to 8:59 AM | 0 (0.0%) | 4 (10.3%) |
| 9:00 AM to 9:59 AM | 0 (0.0%) | 0 (0.0%) |
| 10:00 AM to 10:59 AM | 0 (0.0%) | 0 (0.0%) |
| 11:00 AM to 11:59 AM | 0 (0.0%) | 4 (10.3%) |
| 12:00 PM to 3:59 PM | 4 (7.0%) | 8 (20.5%) |
| 4:00 PM to 11:59 PM | 0 (0.0%) | 0 (0.0%) |
| Total | 57 (100.0%) | 39 (100.0%) |
Housing Occupancy in Newfane
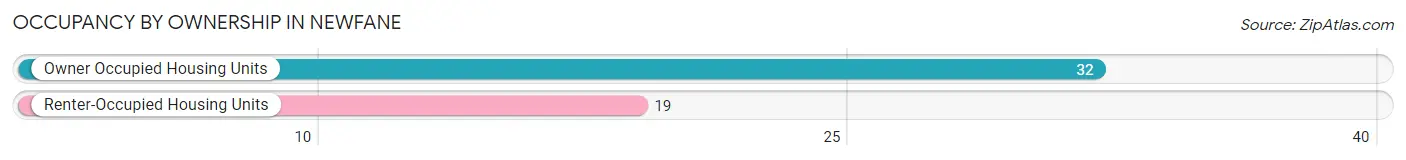
Occupancy by Ownership in Newfane
Of the total 51 dwellings in Newfane, owner-occupied units account for 32 (62.7%), while renter-occupied units make up 19 (37.2%).
| Occupancy | # Housing Units | % Housing Units |
| Owner Occupied Housing Units | 32 | 62.7% |
| Renter-Occupied Housing Units | 19 | 37.2% |
| Total Occupied Housing Units | 51 | 100.0% |
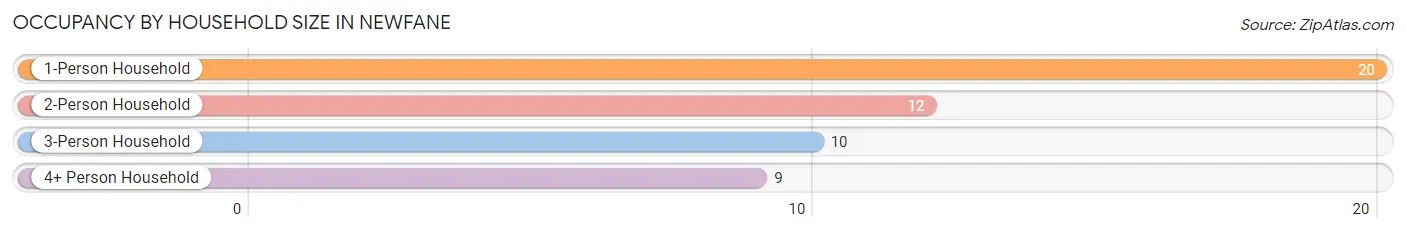
Occupancy by Household Size in Newfane
| Household Size | # Housing Units | % Housing Units |
| 1-Person Household | 20 | 39.2% |
| 2-Person Household | 12 | 23.5% |
| 3-Person Household | 10 | 19.6% |
| 4+ Person Household | 9 | 17.6% |
| Total Housing Units | 51 | 100.0% |
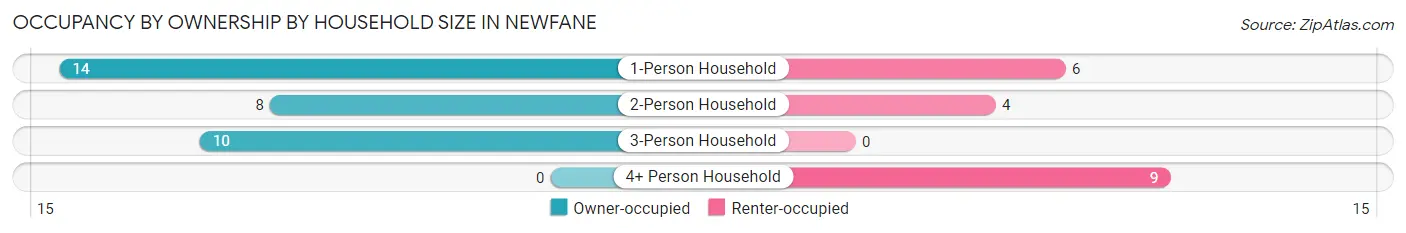
Occupancy by Ownership by Household Size in Newfane
| Household Size | Owner-occupied | Renter-occupied |
| 1-Person Household | 14 (70.0%) | 6 (30.0%) |
| 2-Person Household | 8 (66.7%) | 4 (33.3%) |
| 3-Person Household | 10 (100.0%) | 0 (0.0%) |
| 4+ Person Household | 0 (0.0%) | 9 (100.0%) |
| Total Housing Units | 32 (62.7%) | 19 (37.2%) |
Occupancy by Educational Attainment in Newfane
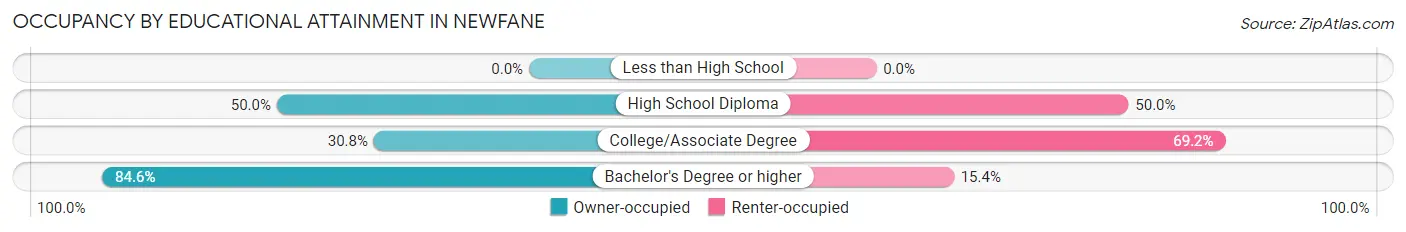
| Household Size | Owner-occupied | Renter-occupied |
| Less than High School | 0 (0.0%) | 0 (0.0%) |
| High School Diploma | 6 (50.0%) | 6 (50.0%) |
| College/Associate Degree | 4 (30.8%) | 9 (69.2%) |
| Bachelor's Degree or higher | 22 (84.6%) | 4 (15.4%) |
Occupancy by Age of Householder in Newfane
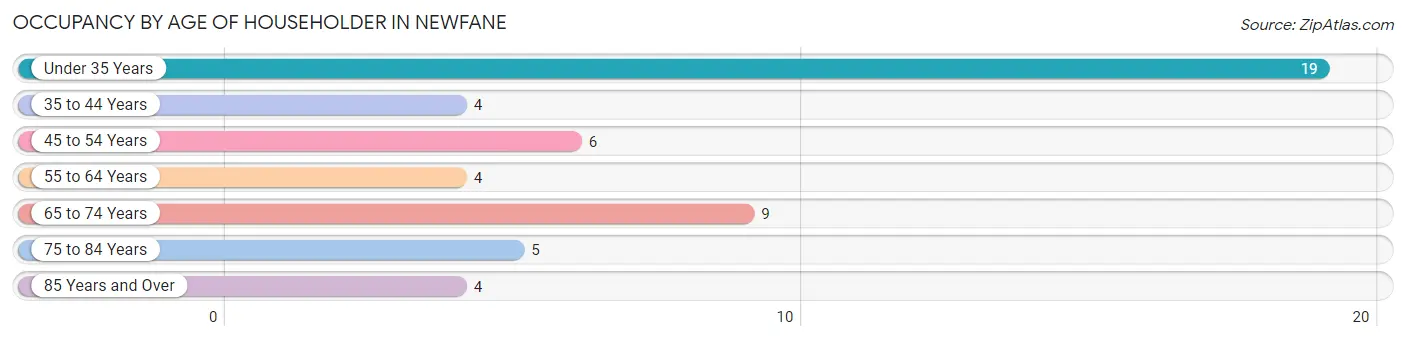
| Age Bracket | # Households | % Households |
| Under 35 Years | 19 | 37.2% |
| 35 to 44 Years | 4 | 7.8% |
| 45 to 54 Years | 6 | 11.8% |
| 55 to 64 Years | 4 | 7.8% |
| 65 to 74 Years | 9 | 17.6% |
| 75 to 84 Years | 5 | 9.8% |
| 85 Years and Over | 4 | 7.8% |
| Total | 51 | 100.0% |
Housing Finances in Newfane
Median Income by Occupancy in Newfane
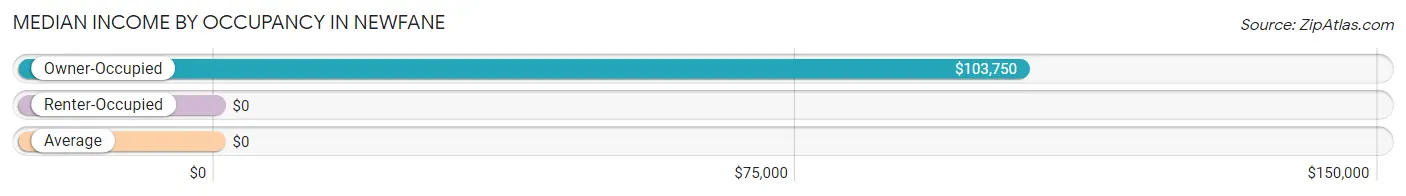
| Occupancy Type | # Households | Median Income |
| Owner-Occupied | 32 (62.7%) | $103,750 |
| Renter-Occupied | 19 (37.2%) | $0 |
| Average | 51 (100.0%) | $0 |
Occupancy by Householder Income Bracket in Newfane
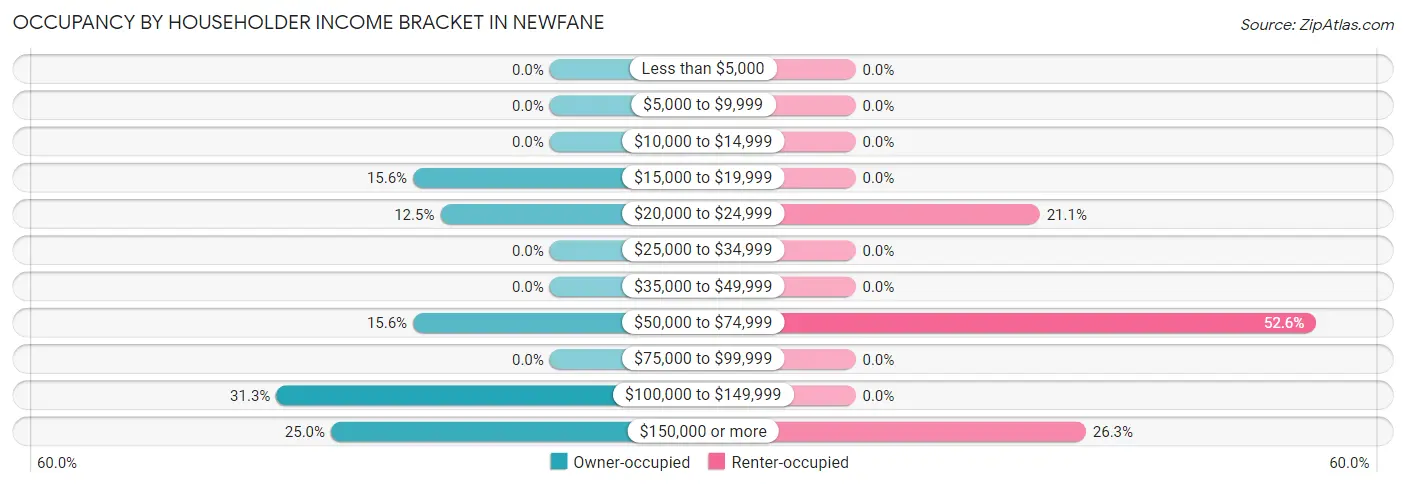
| Income Bracket | Owner-occupied | Renter-occupied |
| Less than $5,000 | 0 (0.0%) | 0 (0.0%) |
| $5,000 to $9,999 | 0 (0.0%) | 0 (0.0%) |
| $10,000 to $14,999 | 0 (0.0%) | 0 (0.0%) |
| $15,000 to $19,999 | 5 (15.6%) | 0 (0.0%) |
| $20,000 to $24,999 | 4 (12.5%) | 4 (21.0%) |
| $25,000 to $34,999 | 0 (0.0%) | 0 (0.0%) |
| $35,000 to $49,999 | 0 (0.0%) | 0 (0.0%) |
| $50,000 to $74,999 | 5 (15.6%) | 10 (52.6%) |
| $75,000 to $99,999 | 0 (0.0%) | 0 (0.0%) |
| $100,000 to $149,999 | 10 (31.2%) | 0 (0.0%) |
| $150,000 or more | 8 (25.0%) | 5 (26.3%) |
| Total | 32 (100.0%) | 19 (100.0%) |
Monthly Housing Cost Tiers in Newfane
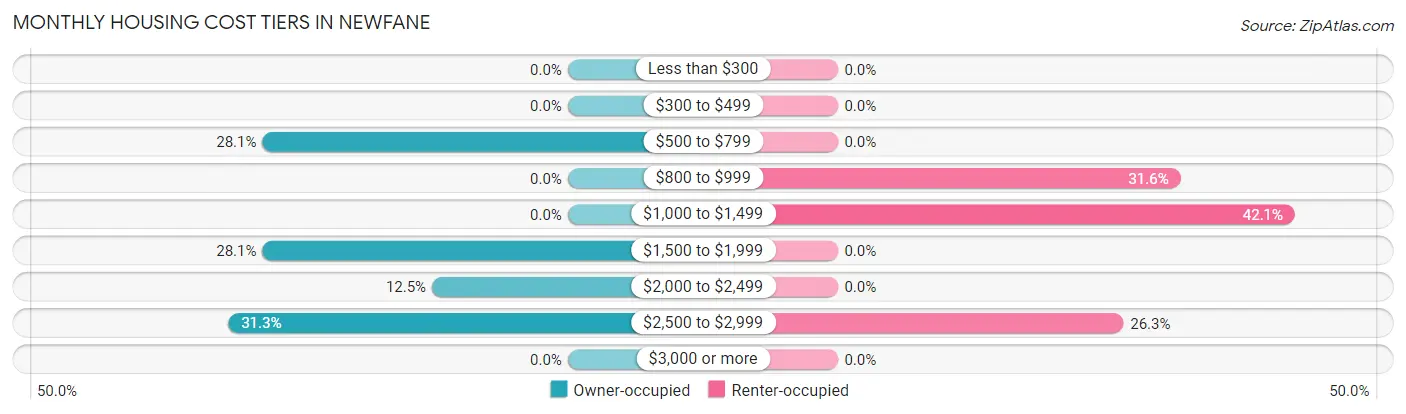
| Monthly Cost | Owner-occupied | Renter-occupied |
| Less than $300 | 0 (0.0%) | 0 (0.0%) |
| $300 to $499 | 0 (0.0%) | 0 (0.0%) |
| $500 to $799 | 9 (28.1%) | 0 (0.0%) |
| $800 to $999 | 0 (0.0%) | 6 (31.6%) |
| $1,000 to $1,499 | 0 (0.0%) | 8 (42.1%) |
| $1,500 to $1,999 | 9 (28.1%) | 0 (0.0%) |
| $2,000 to $2,499 | 4 (12.5%) | 0 (0.0%) |
| $2,500 to $2,999 | 10 (31.2%) | 5 (26.3%) |
| $3,000 or more | 0 (0.0%) | 0 (0.0%) |
| Total | 32 (100.0%) | 19 (100.0%) |
Physical Housing Characteristics in Newfane
Housing Structures in Newfane
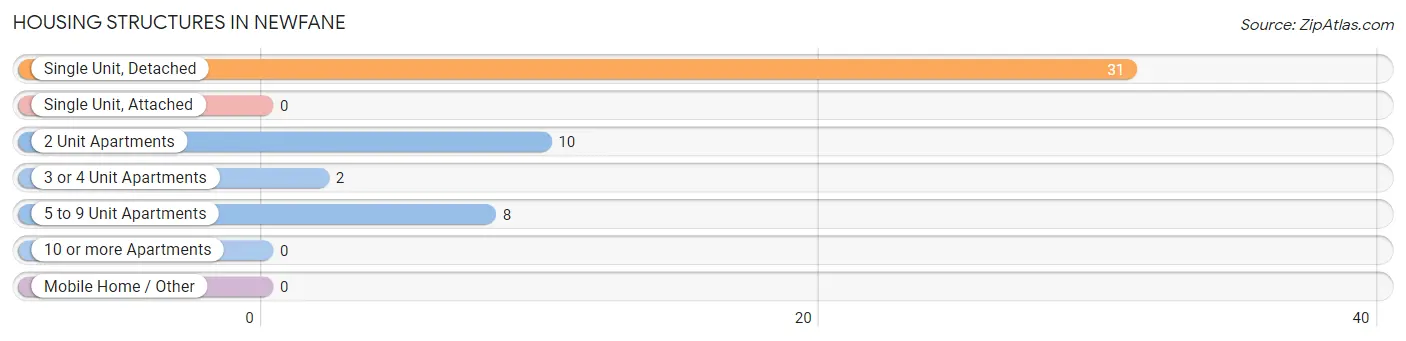
| Structure Type | # Housing Units | % Housing Units |
| Single Unit, Detached | 31 | 60.8% |
| Single Unit, Attached | 0 | 0.0% |
| 2 Unit Apartments | 10 | 19.6% |
| 3 or 4 Unit Apartments | 2 | 3.9% |
| 5 to 9 Unit Apartments | 8 | 15.7% |
| 10 or more Apartments | 0 | 0.0% |
| Mobile Home / Other | 0 | 0.0% |
| Total | 51 | 100.0% |
Housing Structures by Occupancy in Newfane
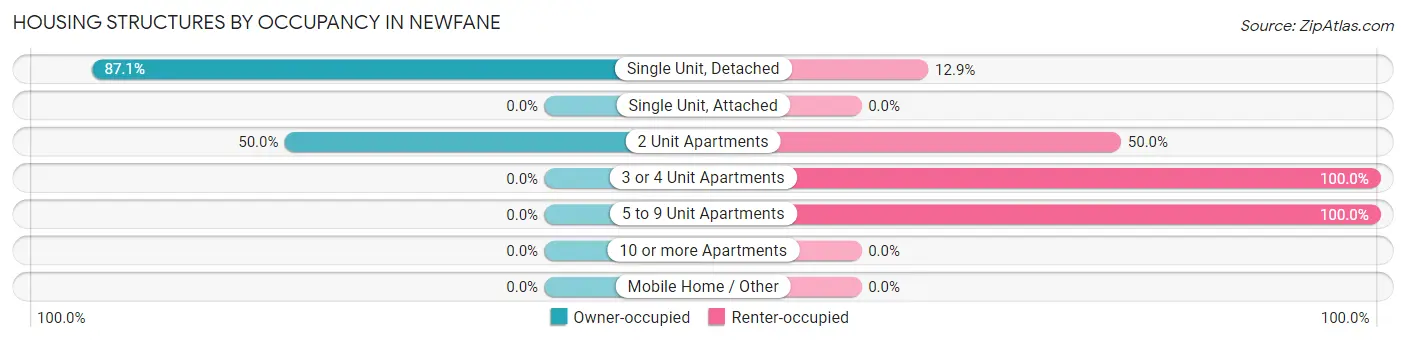
| Structure Type | Owner-occupied | Renter-occupied |
| Single Unit, Detached | 27 (87.1%) | 4 (12.9%) |
| Single Unit, Attached | 0 (0.0%) | 0 (0.0%) |
| 2 Unit Apartments | 5 (50.0%) | 5 (50.0%) |
| 3 or 4 Unit Apartments | 0 (0.0%) | 2 (100.0%) |
| 5 to 9 Unit Apartments | 0 (0.0%) | 8 (100.0%) |
| 10 or more Apartments | 0 (0.0%) | 0 (0.0%) |
| Mobile Home / Other | 0 (0.0%) | 0 (0.0%) |
| Total | 32 (62.7%) | 19 (37.2%) |
Housing Structures by Number of Rooms in Newfane
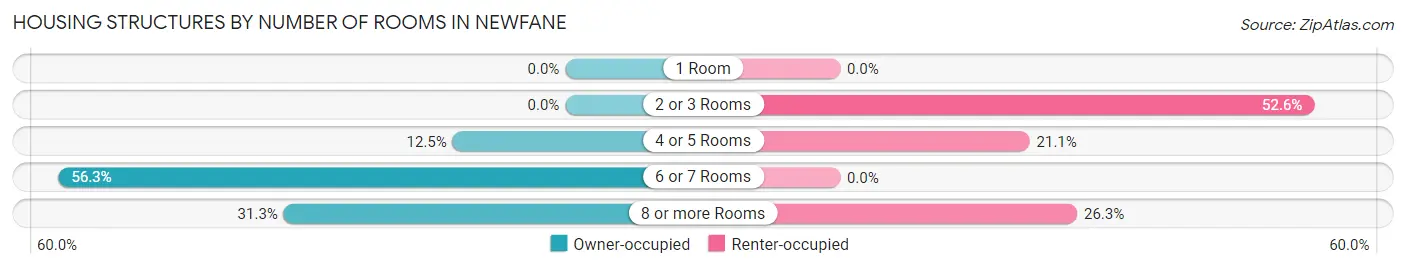
| Number of Rooms | Owner-occupied | Renter-occupied |
| 1 Room | 0 (0.0%) | 0 (0.0%) |
| 2 or 3 Rooms | 0 (0.0%) | 10 (52.6%) |
| 4 or 5 Rooms | 4 (12.5%) | 4 (21.0%) |
| 6 or 7 Rooms | 18 (56.2%) | 0 (0.0%) |
| 8 or more Rooms | 10 (31.2%) | 5 (26.3%) |
| Total | 32 (100.0%) | 19 (100.0%) |
Housing Structure by Heating Type in Newfane
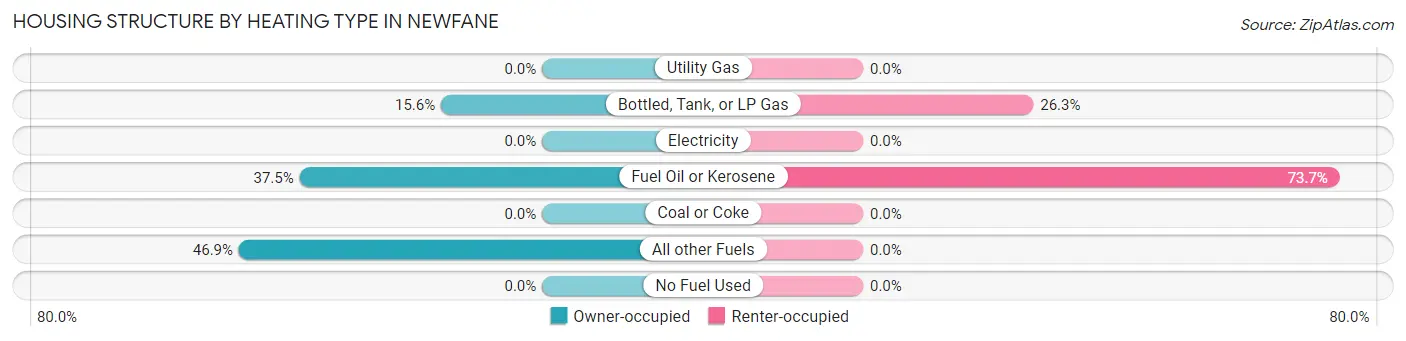
| Heating Type | Owner-occupied | Renter-occupied |
| Utility Gas | 0 (0.0%) | 0 (0.0%) |
| Bottled, Tank, or LP Gas | 5 (15.6%) | 5 (26.3%) |
| Electricity | 0 (0.0%) | 0 (0.0%) |
| Fuel Oil or Kerosene | 12 (37.5%) | 14 (73.7%) |
| Coal or Coke | 0 (0.0%) | 0 (0.0%) |
| All other Fuels | 15 (46.9%) | 0 (0.0%) |
| No Fuel Used | 0 (0.0%) | 0 (0.0%) |
| Total | 32 (100.0%) | 19 (100.0%) |
Household Vehicle Usage in Newfane
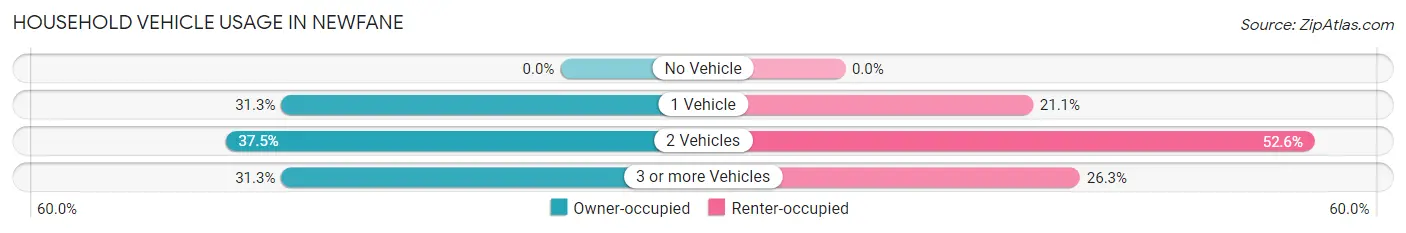
| Vehicles per Household | Owner-occupied | Renter-occupied |
| No Vehicle | 0 (0.0%) | 0 (0.0%) |
| 1 Vehicle | 10 (31.2%) | 4 (21.0%) |
| 2 Vehicles | 12 (37.5%) | 10 (52.6%) |
| 3 or more Vehicles | 10 (31.2%) | 5 (26.3%) |
| Total | 32 (100.0%) | 19 (100.0%) |
Real Estate & Mortgages in Newfane
Real Estate and Mortgage Overview in Newfane
| Characteristic | Without Mortgage | With Mortgage |
| Housing Units | 14 | 18 |
| Median Property Value | $265,000 | $390,000 |
| Median Household Income | - | - |
| Monthly Housing Costs | - | - |
| Real Estate Taxes | $6,250 | $0 |
Property Value by Mortgage Status in Newfane
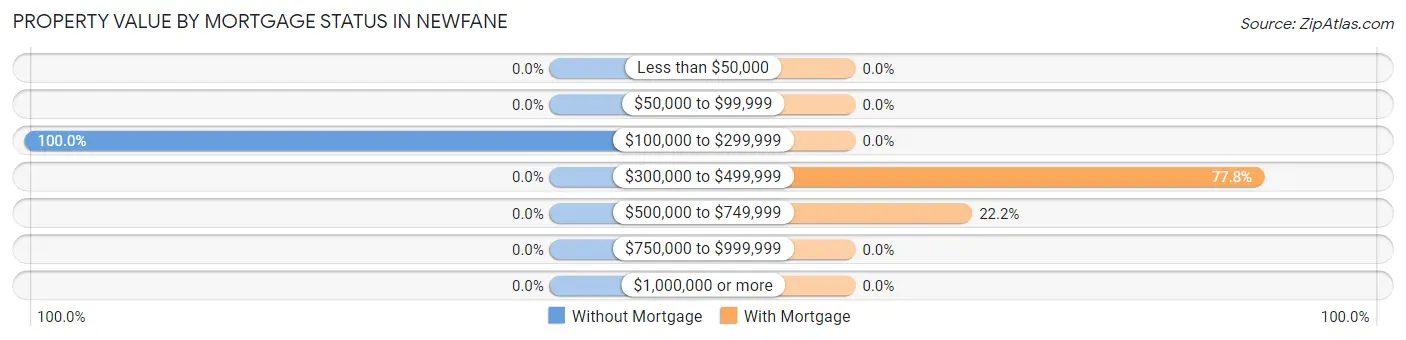
| Property Value | Without Mortgage | With Mortgage |
| Less than $50,000 | 0 (0.0%) | 0 (0.0%) |
| $50,000 to $99,999 | 0 (0.0%) | 0 (0.0%) |
| $100,000 to $299,999 | 14 (100.0%) | 0 (0.0%) |
| $300,000 to $499,999 | 0 (0.0%) | 14 (77.8%) |
| $500,000 to $749,999 | 0 (0.0%) | 4 (22.2%) |
| $750,000 to $999,999 | 0 (0.0%) | 0 (0.0%) |
| $1,000,000 or more | 0 (0.0%) | 0 (0.0%) |
| Total | 14 (100.0%) | 18 (100.0%) |
Household Income by Mortgage Status in Newfane
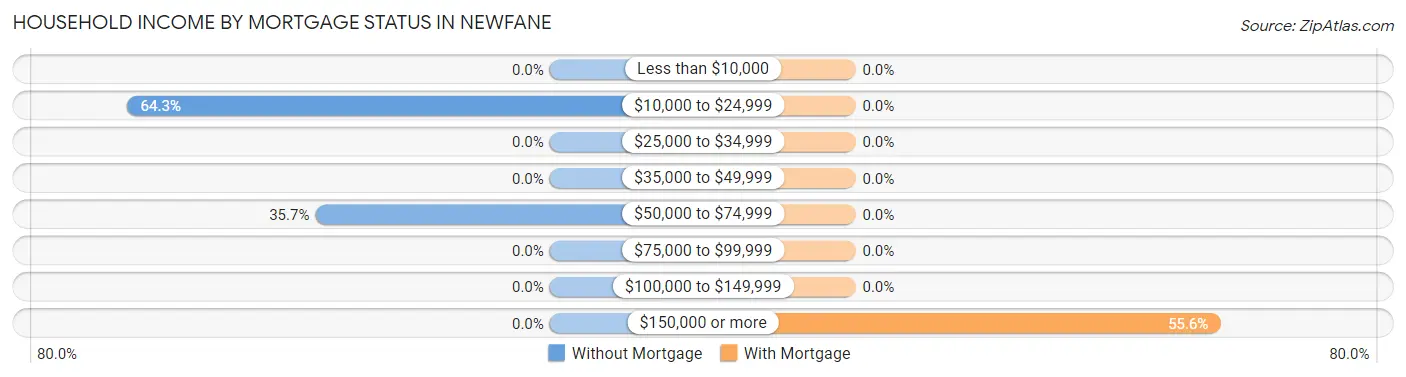
| Household Income | Without Mortgage | With Mortgage |
| Less than $10,000 | 0 (0.0%) | 0 (0.0%) |
| $10,000 to $24,999 | 9 (64.3%) | 0 (0.0%) |
| $25,000 to $34,999 | 0 (0.0%) | 0 (0.0%) |
| $35,000 to $49,999 | 0 (0.0%) | 0 (0.0%) |
| $50,000 to $74,999 | 5 (35.7%) | 0 (0.0%) |
| $75,000 to $99,999 | 0 (0.0%) | 0 (0.0%) |
| $100,000 to $149,999 | 0 (0.0%) | 0 (0.0%) |
| $150,000 or more | 0 (0.0%) | 10 (55.6%) |
| Total | 14 (100.0%) | 18 (100.0%) |
Property Value to Household Income Ratio in Newfane
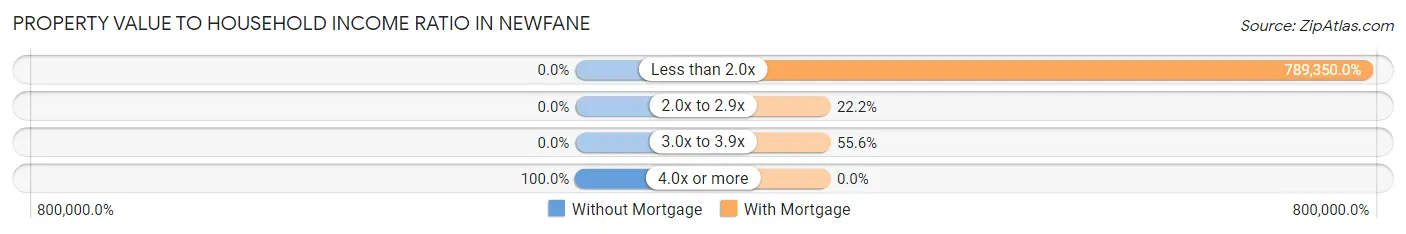
| Value-to-Income Ratio | Without Mortgage | With Mortgage |
| Less than 2.0x | 0 (0.0%) | 142,083 (789,350.0%) |
| 2.0x to 2.9x | 0 (0.0%) | 4 (22.2%) |
| 3.0x to 3.9x | 0 (0.0%) | 10 (55.6%) |
| 4.0x or more | 14 (100.0%) | 0 (0.0%) |
| Total | 14 (100.0%) | 18 (100.0%) |
Real Estate Taxes by Mortgage Status in Newfane
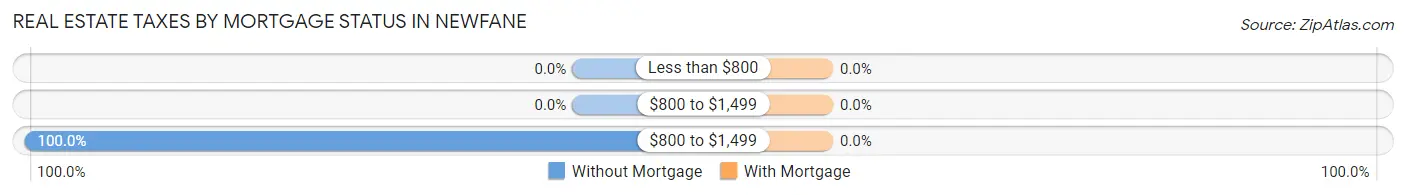
| Property Taxes | Without Mortgage | With Mortgage |
| Less than $800 | 0 (0.0%) | 0 (0.0%) |
| $800 to $1,499 | 0 (0.0%) | 0 (0.0%) |
| $800 to $1,499 | 14 (100.0%) | 0 (0.0%) |
| Total | 14 (100.0%) | 18 (100.0%) |
Health & Disability in Newfane
Health Insurance Coverage by Age in Newfane
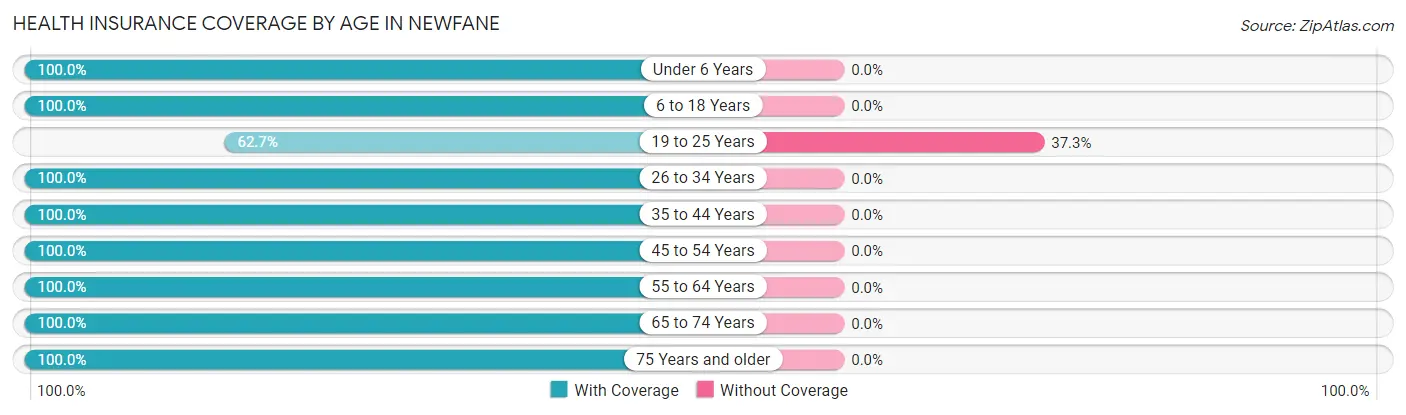
| Age Bracket | With Coverage | Without Coverage |
| Under 6 Years | 4 (100.0%) | 0 (0.0%) |
| 6 to 18 Years | 13 (100.0%) | 0 (0.0%) |
| 19 to 25 Years | 37 (62.7%) | 22 (37.3%) |
| 26 to 34 Years | 4 (100.0%) | 0 (0.0%) |
| 35 to 44 Years | 17 (100.0%) | 0 (0.0%) |
| 45 to 54 Years | 12 (100.0%) | 0 (0.0%) |
| 55 to 64 Years | 4 (100.0%) | 0 (0.0%) |
| 65 to 74 Years | 9 (100.0%) | 0 (0.0%) |
| 75 Years and older | 13 (100.0%) | 0 (0.0%) |
| Total | 113 (83.7%) | 22 (16.3%) |
Health Insurance Coverage by Citizenship Status in Newfane
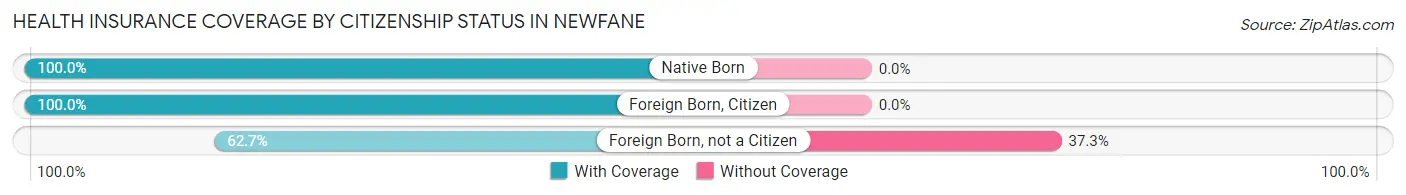
| Citizenship Status | With Coverage | Without Coverage |
| Native Born | 4 (100.0%) | 0 (0.0%) |
| Foreign Born, Citizen | 13 (100.0%) | 0 (0.0%) |
| Foreign Born, not a Citizen | 37 (62.7%) | 22 (37.3%) |
Health Insurance Coverage by Household Income in Newfane
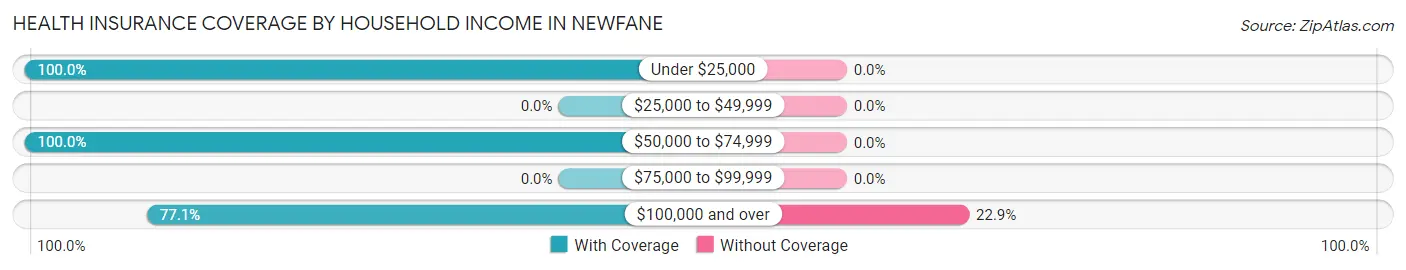
| Household Income | With Coverage | Without Coverage |
| Under $25,000 | 13 (100.0%) | 0 (0.0%) |
| $25,000 to $49,999 | 0 (0.0%) | 0 (0.0%) |
| $50,000 to $74,999 | 26 (100.0%) | 0 (0.0%) |
| $75,000 to $99,999 | 0 (0.0%) | 0 (0.0%) |
| $100,000 and over | 74 (77.1%) | 22 (22.9%) |
Public vs Private Health Insurance Coverage by Age in Newfane
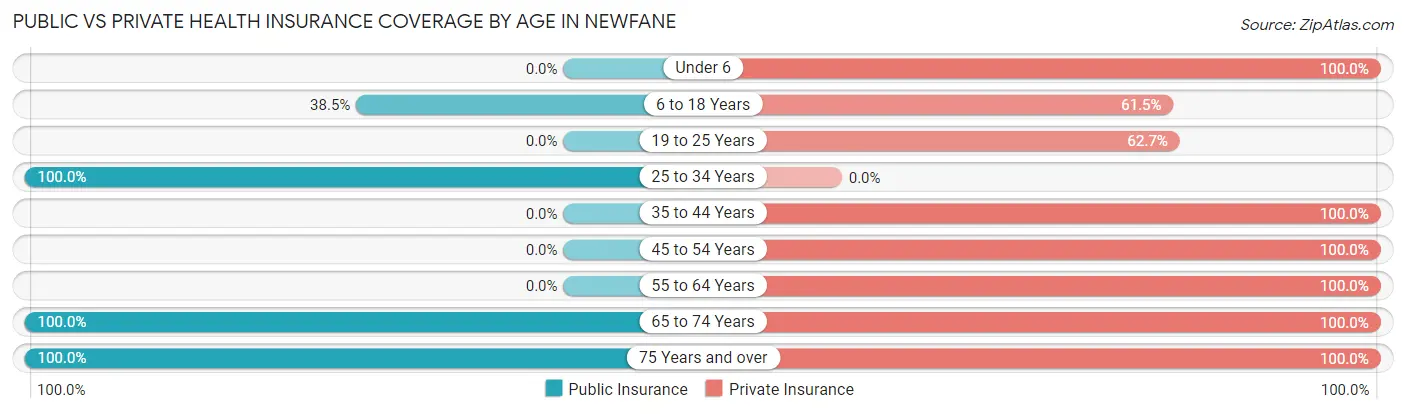
| Age Bracket | Public Insurance | Private Insurance |
| Under 6 | 0 (0.0%) | 4 (100.0%) |
| 6 to 18 Years | 5 (38.5%) | 8 (61.5%) |
| 19 to 25 Years | 0 (0.0%) | 37 (62.7%) |
| 25 to 34 Years | 4 (100.0%) | 0 (0.0%) |
| 35 to 44 Years | 0 (0.0%) | 17 (100.0%) |
| 45 to 54 Years | 0 (0.0%) | 12 (100.0%) |
| 55 to 64 Years | 0 (0.0%) | 4 (100.0%) |
| 65 to 74 Years | 9 (100.0%) | 9 (100.0%) |
| 75 Years and over | 13 (100.0%) | 13 (100.0%) |
| Total | 31 (23.0%) | 104 (77.0%) |
Disability Status by Sex by Age in Newfane
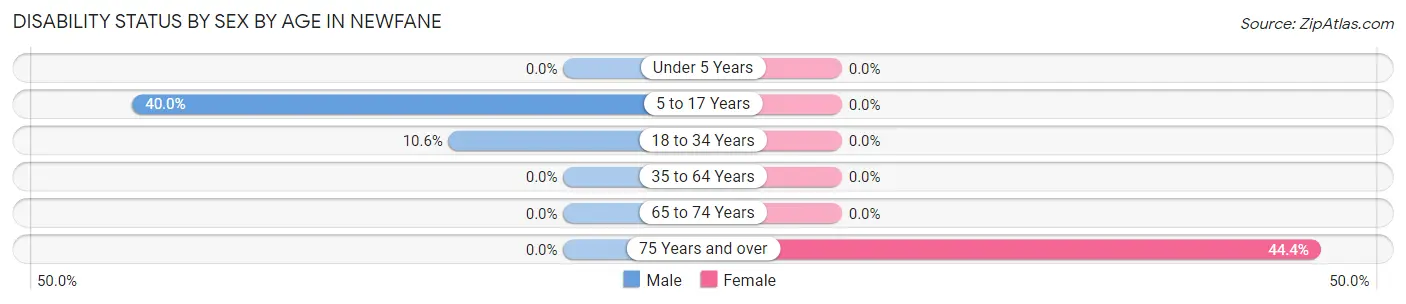
| Age Bracket | Male | Female |
| Under 5 Years | 0 (0.0%) | 0 (0.0%) |
| 5 to 17 Years | 2 (40.0%) | 0 (0.0%) |
| 18 to 34 Years | 5 (10.6%) | 0 (0.0%) |
| 35 to 64 Years | 0 (0.0%) | 0 (0.0%) |
| 65 to 74 Years | 0 (0.0%) | 0 (0.0%) |
| 75 Years and over | 0 (0.0%) | 4 (44.4%) |
Disability Class by Sex by Age in Newfane
Disability Class: Hearing Difficulty
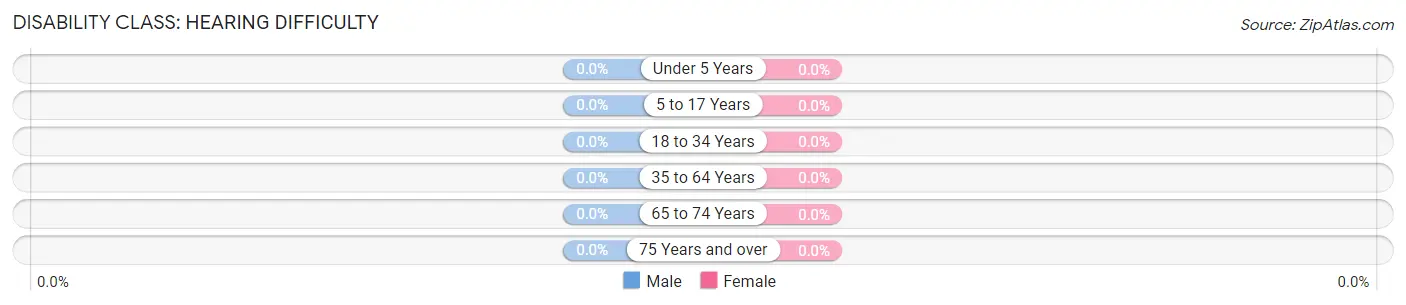
| Age Bracket | Male | Female |
| Under 5 Years | 0 (0.0%) | 0 (0.0%) |
| 5 to 17 Years | 0 (0.0%) | 0 (0.0%) |
| 18 to 34 Years | 0 (0.0%) | 0 (0.0%) |
| 35 to 64 Years | 0 (0.0%) | 0 (0.0%) |
| 65 to 74 Years | 0 (0.0%) | 0 (0.0%) |
| 75 Years and over | 0 (0.0%) | 0 (0.0%) |
Disability Class: Vision Difficulty
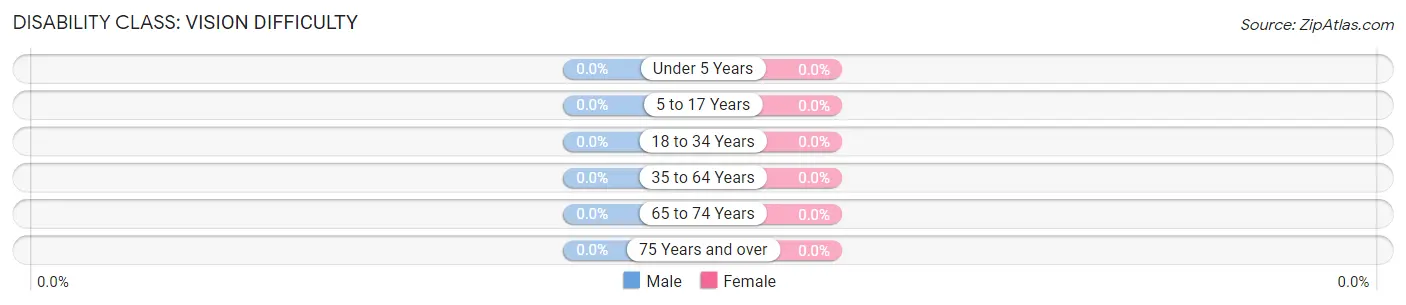
| Age Bracket | Male | Female |
| Under 5 Years | 0 (0.0%) | 0 (0.0%) |
| 5 to 17 Years | 0 (0.0%) | 0 (0.0%) |
| 18 to 34 Years | 0 (0.0%) | 0 (0.0%) |
| 35 to 64 Years | 0 (0.0%) | 0 (0.0%) |
| 65 to 74 Years | 0 (0.0%) | 0 (0.0%) |
| 75 Years and over | 0 (0.0%) | 0 (0.0%) |
Disability Class: Cognitive Difficulty
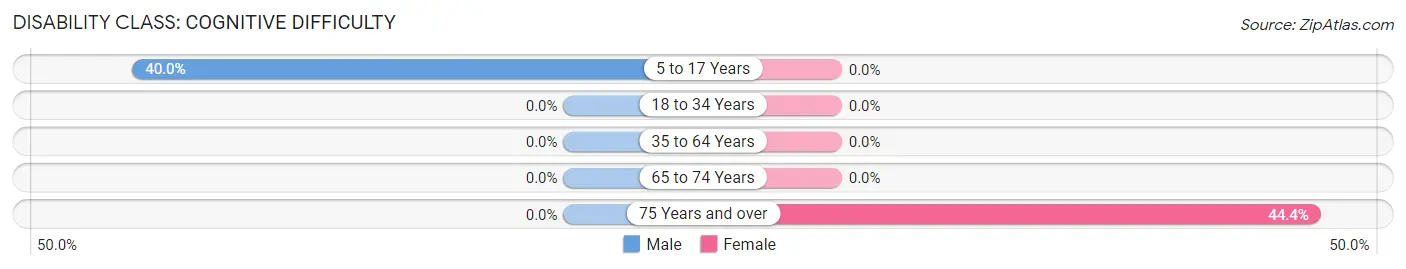
| Age Bracket | Male | Female |
| 5 to 17 Years | 2 (40.0%) | 0 (0.0%) |
| 18 to 34 Years | 0 (0.0%) | 0 (0.0%) |
| 35 to 64 Years | 0 (0.0%) | 0 (0.0%) |
| 65 to 74 Years | 0 (0.0%) | 0 (0.0%) |
| 75 Years and over | 0 (0.0%) | 4 (44.4%) |
Disability Class: Ambulatory Difficulty
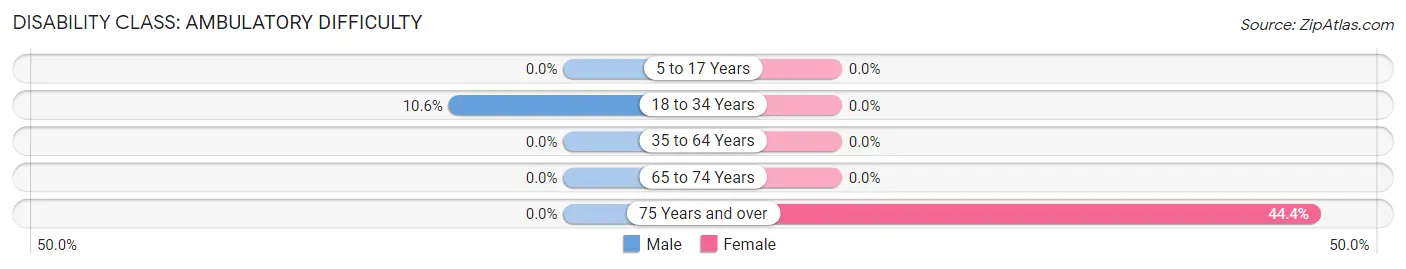
| Age Bracket | Male | Female |
| 5 to 17 Years | 0 (0.0%) | 0 (0.0%) |
| 18 to 34 Years | 5 (10.6%) | 0 (0.0%) |
| 35 to 64 Years | 0 (0.0%) | 0 (0.0%) |
| 65 to 74 Years | 0 (0.0%) | 0 (0.0%) |
| 75 Years and over | 0 (0.0%) | 4 (44.4%) |
Disability Class: Self-Care Difficulty
| Age Bracket | Male | Female |
| 5 to 17 Years | 0 (0.0%) | 0 (0.0%) |
| 18 to 34 Years | 0 (0.0%) | 0 (0.0%) |
| 35 to 64 Years | 0 (0.0%) | 0 (0.0%) |
| 65 to 74 Years | 0 (0.0%) | 0 (0.0%) |
| 75 Years and over | 0 (0.0%) | 0 (0.0%) |
Technology Access in Newfane
Computing Device Access in Newfane
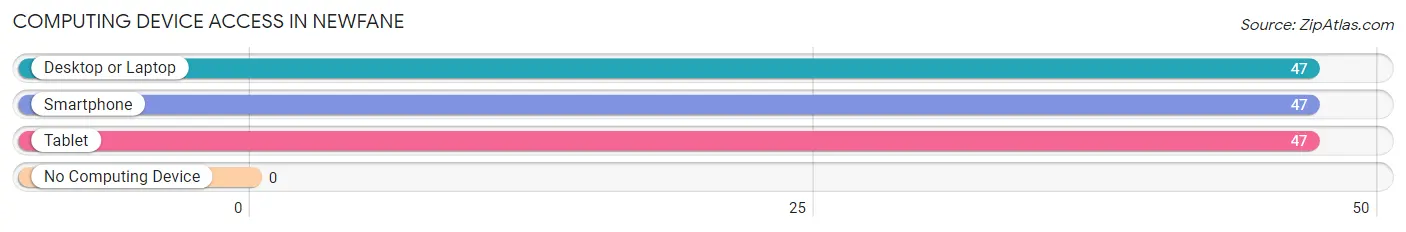
| Device Type | # Households | % Households |
| Desktop or Laptop | 47 | 92.2% |
| Smartphone | 47 | 92.2% |
| Tablet | 47 | 92.2% |
| No Computing Device | 0 | 0.0% |
| Total | 51 | 100.0% |
Internet Access in Newfane

| Internet Type | # Households | % Households |
| Dial-Up Internet | 0 | 0.0% |
| Broadband Home | 20 | 39.2% |
| Cellular Data Only | 0 | 0.0% |
| Satellite Internet | 0 | 0.0% |
| No Internet | 31 | 60.8% |
| Total | 51 | 100.0% |
Newfane Summary
Newfane, Vermont is a small town located in the southwestern corner of the state. It is situated in the foothills of the Green Mountains and is part of the Windham County. The town was first settled in 1780 and was incorporated in 1781. The town has a population of 1,717 people as of the 2010 census.
Geography
Newfane is located in the southwestern corner of Vermont, in Windham County. It is situated in the foothills of the Green Mountains and is bordered by the towns of Dover, Jamaica, Townshend, and Wardsboro. The town is located on the banks of the West River, which flows through the town and is a tributary of the Connecticut River. The town has a total area of 33.2 square miles, of which 32.9 square miles is land and 0.3 square miles is water.
The town is home to several small mountains, including Bald Mountain, which has an elevation of 1,890 feet, and Mount Wantastiquet, which has an elevation of 2,068 feet. The town is also home to several small lakes, including Lake Whitingham, which is the largest lake in the town.
History
Newfane was first settled in 1780 by settlers from Massachusetts and Connecticut. The town was incorporated in 1781 and was named after Newfane, Connecticut. The town was originally an agricultural community, with the main crops being corn, wheat, and potatoes.
In the 19th century, the town became a popular summer resort destination, with many wealthy families from New York and Boston building summer homes in the area. The town also became a popular destination for artists, writers, and musicians.
In the 20th century, the town began to decline in population as many of the summer homes were abandoned and the town's economy shifted away from agriculture. The town has since become a popular destination for outdoor recreation, with many people visiting the area for hiking, fishing, and camping.
Economy
The economy of Newfane is largely based on tourism and outdoor recreation. The town is home to several small businesses, including restaurants, shops, and lodging. The town is also home to several small farms, which produce a variety of products, including vegetables, fruits, and dairy products.
The town is also home to several small manufacturing companies, which produce a variety of products, including furniture, clothing, and wood products. The town is also home to several small technology companies, which produce a variety of products, including software and hardware.
Demographics
As of the 2010 census, the population of Newfane was 1,717 people. The racial makeup of the town was 97.2% White, 0.5% African American, 0.2% Native American, 0.3% Asian, 0.1% Pacific Islander, 0.3% from other races, and 1.4% from two or more races. Hispanic or Latino of any race were 1.2% of the population.
The median household income in the town was $45,938, and the median family income was $51,250. The per capita income in the town was $22,945. About 8.2% of families and 10.3% of the population were below the poverty line, including 14.2% of those under age 18 and 5.2% of those age 65 or over.
Conclusion
Newfane, Vermont is a small town located in the southwestern corner of the state. It is situated in the foothills of the Green Mountains and is part of the Windham County. The town was first settled in 1780 and was incorporated in 1781. The town has a population of 1,717 people as of the 2010 census. The economy of Newfane is largely based on tourism and outdoor recreation, with many people visiting the area for hiking, fishing, and camping. The town is also home to several small businesses, farms, and manufacturing companies. The racial makeup of the town is 97.2% White, 0.5% African American, 0.2% Native American, 0.3% Asian, 0.1% Pacific Islander, 0.3% from other races, and 1.4% from two or more races. The median household income in the town was $45,938, and the median family income was $51,250.
Common Questions
What is Per Capita Income in Newfane?
Per Capita income in Newfane is $44,010.
What is the Median Family Income in Newfane?
Median Family Income in Newfane is $141,250.
What is Income or Wage Gap in Newfane?
Income or Wage Gap in Newfane is 1.5%.
Women in Newfane earn 98.5 cents for every dollar earned by a man.
What is Inequality or Gini Index in Newfane?
Inequality or Gini Index in Newfane is 0.40.
What is the Total Population of Newfane?
Total Population of Newfane is 135.
What is the Total Male Population of Newfane?
Total Male Population of Newfane is 66.
What is the Total Female Population of Newfane?
Total Female Population of Newfane is 69.
What is the Ratio of Males per 100 Females in Newfane?
There are 95.65 Males per 100 Females in Newfane.
What is the Ratio of Females per 100 Males in Newfane?
There are 104.55 Females per 100 Males in Newfane.
What is the Median Population Age in Newfane?
Median Population Age in Newfane is 25.1 Years.
What is the Average Family Size in Newfane
Average Family Size in Newfane is 2.7 People.
What is the Average Household Size in Newfane
Average Household Size in Newfane is 2.6 People.
How Large is the Labor Force in Newfane?
There are 114 People in the Labor Forcein in Newfane.
What is the Percentage of People in the Labor Force in Newfane?
96.6% of People are in the Labor Force in Newfane.