Cities with the Highest Percentage of Immigrants from Asia in Vermont
RELATED REPORTS & OPTIONS
Asia
Vermont
Compare Cities
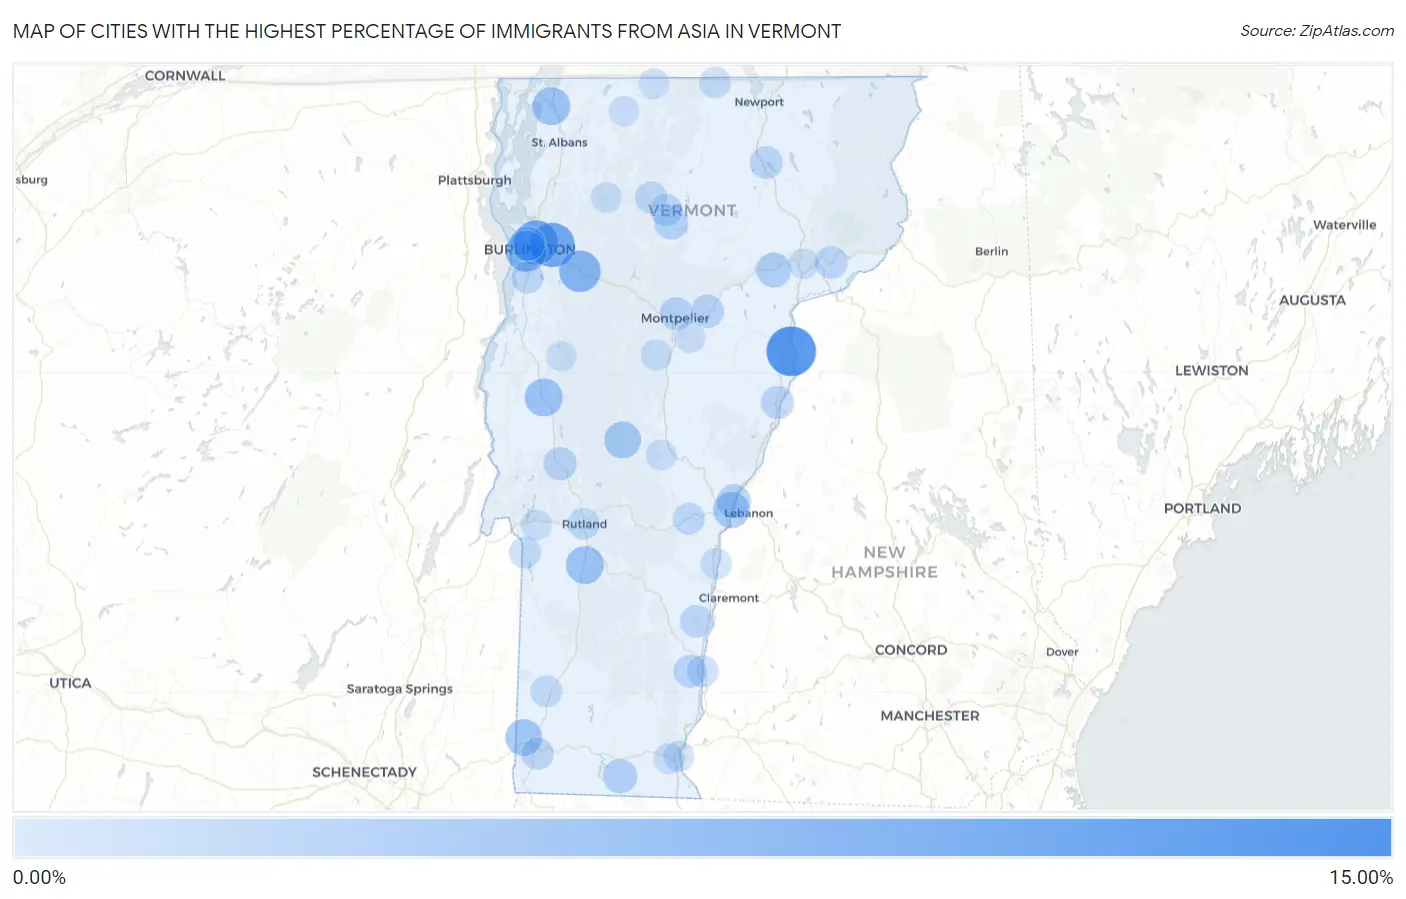
Map of Cities with the Highest Percentage of Immigrants from Asia in Vermont
0.00%
15.00%
Cities with the Highest Percentage of Immigrants from Asia in Vermont
| City | Asia | vs State | vs National | |
| 1. | Sheffield | 13.40% | 1.41%(+12.0)#1 | 4.26%(+9.14)#583 |
| 2. | Wells River | 12.58% | 1.41%(+11.2)#2 | 4.26%(+8.32)#643 |
| 3. | Lyndon Center | 10.85% | 1.41%(+9.43)#3 | 4.26%(+6.59)#803 |
| 4. | Essex Junction | 9.34% | 1.41%(+7.92)#4 | 4.26%(+5.08)#1,008 |
| 5. | Winooski | 9.17% | 1.41%(+7.76)#5 | 4.26%(+4.91)#1,033 |
| 6. | Richmond | 7.26% | 1.41%(+5.84)#6 | 4.26%(+3.00)#1,433 |
| 7. | South Burlington | 6.89% | 1.41%(+5.47)#7 | 4.26%(+2.63)#1,541 |
| 8. | North Clarendon | 5.66% | 1.41%(+4.25)#8 | 4.26%(+1.40)#1,921 |
| 9. | Wallingford | 4.96% | 1.41%(+3.55)#9 | 4.26%(+0.701)#2,215 |
| 10. | Middlebury | 4.93% | 1.41%(+3.52)#10 | 4.26%(+0.672)#2,234 |
| 11. | Swanton | 4.86% | 1.41%(+3.45)#11 | 4.26%(+0.600)#2,271 |
| 12. | Killington | 4.27% | 1.41%(+2.86)#12 | 4.26%(+0.013)#2,630 |
| 13. | North Bennington | 4.15% | 1.41%(+2.74)#13 | 4.26%(-0.105)#2,726 |
| 14. | Rochester | 4.05% | 1.41%(+2.64)#14 | 4.26%(-0.206)#2,792 |
| 15. | White River Junction | 3.83% | 1.41%(+2.42)#15 | 4.26%(-0.428)#2,948 |
| 16. | West Woodstock | 3.02% | 1.41%(+1.61)#16 | 4.26%(-1.24)#3,716 |
| 17. | Burlington | 2.95% | 1.41%(+1.54)#17 | 4.26%(-1.31)#3,791 |
| 18. | Danville | 2.89% | 1.41%(+1.48)#18 | 4.26%(-1.37)#3,869 |
| 19. | Jacksonville | 2.59% | 1.41%(+1.17)#19 | 4.26%(-1.67)#4,270 |
| 20. | Morrisville | 2.52% | 1.41%(+1.11)#20 | 4.26%(-1.74)#4,377 |
| 21. | Wilder | 2.48% | 1.41%(+1.06)#21 | 4.26%(-1.78)#4,448 |
| 22. | Stamford | 2.44% | 1.41%(+1.03)#22 | 4.26%(-1.82)#4,515 |
| 23. | Townshend | 2.35% | 1.41%(+0.940)#23 | 4.26%(-1.91)#4,679 |
| 24. | Brandon | 1.99% | 1.41%(+0.578)#24 | 4.26%(-2.27)#5,376 |
| 25. | Montpelier | 1.96% | 1.41%(+0.542)#25 | 4.26%(-2.31)#5,457 |
| 26. | Bradford | 1.89% | 1.41%(+0.474)#26 | 4.26%(-2.37)#5,607 |
| 27. | Plainfield | 1.86% | 1.41%(+0.447)#27 | 4.26%(-2.40)#5,666 |
| 28. | Saxtons River | 1.74% | 1.41%(+0.324)#28 | 4.26%(-2.52)#5,953 |
| 29. | Barton | 1.71% | 1.41%(+0.301)#29 | 4.26%(-2.55)#6,013 |
| 30. | Danby | 1.69% | 1.41%(+0.272)#30 | 4.26%(-2.57)#6,091 |
| 31. | Concord | 1.66% | 1.41%(+0.244)#31 | 4.26%(-2.60)#6,161 |
| 32. | Springfield | 1.47% | 1.41%(+0.057)#32 | 4.26%(-2.79)#6,692 |
| 33. | Hyde Park | 1.39% | 1.41%(-0.028)#33 | 4.26%(-2.87)#6,936 |
| 34. | Bennington | 1.31% | 1.41%(-0.099)#34 | 4.26%(-2.95)#7,184 |
| 35. | Johnson | 1.26% | 1.41%(-0.151)#35 | 4.26%(-3.00)#7,367 |
| 36. | Shelburne | 1.26% | 1.41%(-0.154)#36 | 4.26%(-3.00)#7,379 |
| 37. | Woodstock | 1.26% | 1.41%(-0.155)#37 | 4.26%(-3.00)#7,382 |
| 38. | Bellows Falls | 1.13% | 1.41%(-0.280)#38 | 4.26%(-3.13)#7,865 |
| 39. | Rutland | 1.13% | 1.41%(-0.288)#39 | 4.26%(-3.14)#7,894 |
| 40. | Arlington | 1.07% | 1.41%(-0.346)#40 | 4.26%(-3.19)#8,117 |
| 41. | Poultney | 1.04% | 1.41%(-0.373)#41 | 4.26%(-3.22)#8,225 |
| 42. | North Troy | 0.86% | 1.41%(-0.557)#42 | 4.26%(-3.40)#9,058 |
| 43. | Northfield | 0.75% | 1.41%(-0.662)#43 | 4.26%(-3.51)#9,562 |
| 44. | Windsor | 0.65% | 1.41%(-0.758)#44 | 4.26%(-3.61)#10,095 |
| 45. | Lunenburg | 0.58% | 1.41%(-0.828)#45 | 4.26%(-3.68)#10,499 |
| 46. | Castleton | 0.55% | 1.41%(-0.861)#46 | 4.26%(-3.71)#10,700 |
| 47. | West Brattleboro | 0.53% | 1.41%(-0.881)#47 | 4.26%(-3.73)#10,824 |
| 48. | Barre | 0.53% | 1.41%(-0.883)#48 | 4.26%(-3.73)#10,842 |
| 49. | Cambridge | 0.51% | 1.41%(-0.908)#49 | 4.26%(-3.76)#11,021 |
| 50. | Brattleboro | 0.49% | 1.41%(-0.923)#50 | 4.26%(-3.77)#11,121 |
| 51. | Bethel | 0.45% | 1.41%(-0.963)#51 | 4.26%(-3.81)#11,394 |
| 52. | Enosburg Falls | 0.32% | 1.41%(-1.09)#52 | 4.26%(-3.94)#12,259 |
| 53. | Richford | 0.31% | 1.41%(-1.11)#53 | 4.26%(-3.95)#12,385 |
| 54. | St Johnsbury | 0.25% | 1.41%(-1.16)#54 | 4.26%(-4.01)#12,775 |
| 55. | Bristol | 0.15% | 1.41%(-1.26)#55 | 4.26%(-4.11)#13,460 |
1
2Common Questions
What are the Top 10 Cities with the Highest Percentage of Immigrants from Asia in Vermont?
Top 10 Cities with the Highest Percentage of Immigrants from Asia in Vermont are:
#1
12.58%
#2
9.34%
#3
9.17%
#4
7.26%
#5
6.89%
#6
4.96%
#7
4.93%
#8
4.86%
#9
4.15%
#10
4.05%
What city has the Highest Percentage of Immigrants from Asia in Vermont?
Wells River has the Highest Percentage of Immigrants from Asia in Vermont with 12.58%.
What is the Percentage of Immigrants from Asia in the State of Vermont?
Percentage of Immigrants from Asia in Vermont is 1.41%.
What is the Percentage of Immigrants from Asia in the United States?
Percentage of Immigrants from Asia in the United States is 4.26%.