Arlington, VT Map & Demographics
Arlington Map
Arlington Overview
$33,953
PER CAPITA INCOME
$75,750
AVG FAMILY INCOME
$70,938
AVG HOUSEHOLD INCOME
30.9%
WAGE / INCOME GAP [ % ]
69.1¢/ $1
WAGE / INCOME GAP [ $ ]
0.41
INEQUALITY / GINI INDEX
1,781
TOTAL POPULATION
858
MALE POPULATION
923
FEMALE POPULATION
92.96
MALES / 100 FEMALES
107.58
FEMALES / 100 MALES
36.2
MEDIAN AGE
4.0
AVG FAMILY SIZE
3.0
AVG HOUSEHOLD SIZE
949
LABOR FORCE [ PEOPLE ]
70.4%
PERCENT IN LABOR FORCE
5.8%
UNEMPLOYMENT RATE
Arlington Zip Codes
Arlington Area Codes
Income in Arlington
Income Overview in Arlington
Per Capita Income in Arlington is $33,953, while median incomes of families and households are $75,750 and $70,938 respectively.
| Characteristic | Number | Measure |
| Per Capita Income | 1,781 | $33,953 |
| Median Family Income | 347 | $75,750 |
| Mean Family Income | 347 | $87,182 |
| Median Household Income | 588 | $70,938 |
| Mean Household Income | 588 | $91,295 |
| Income Deficit | 347 | $0 |
| Wage / Income Gap (%) | 1,781 | 30.90% |
| Wage / Income Gap ($) | 1,781 | 69.10¢ per $1 |
| Gini / Inequality Index | 1,781 | 0.41 |
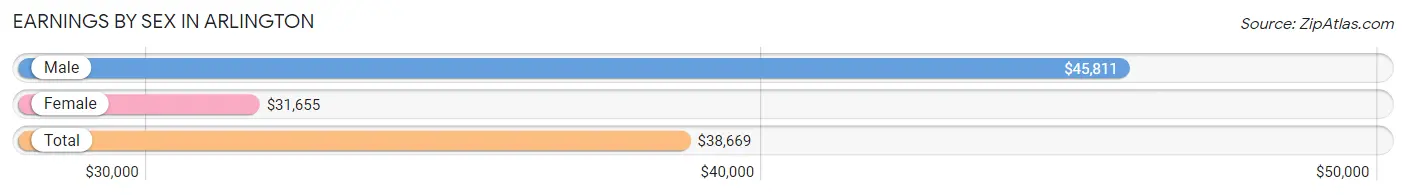
Earnings by Sex in Arlington
Average Earnings in Arlington are $38,669, $45,811 for men and $31,655 for women, a difference of 30.9%.
| Sex | Number | Average Earnings |
| Male | 446 (43.7%) | $45,811 |
| Female | 575 (56.3%) | $31,655 |
| Total | 1,021 (100.0%) | $38,669 |
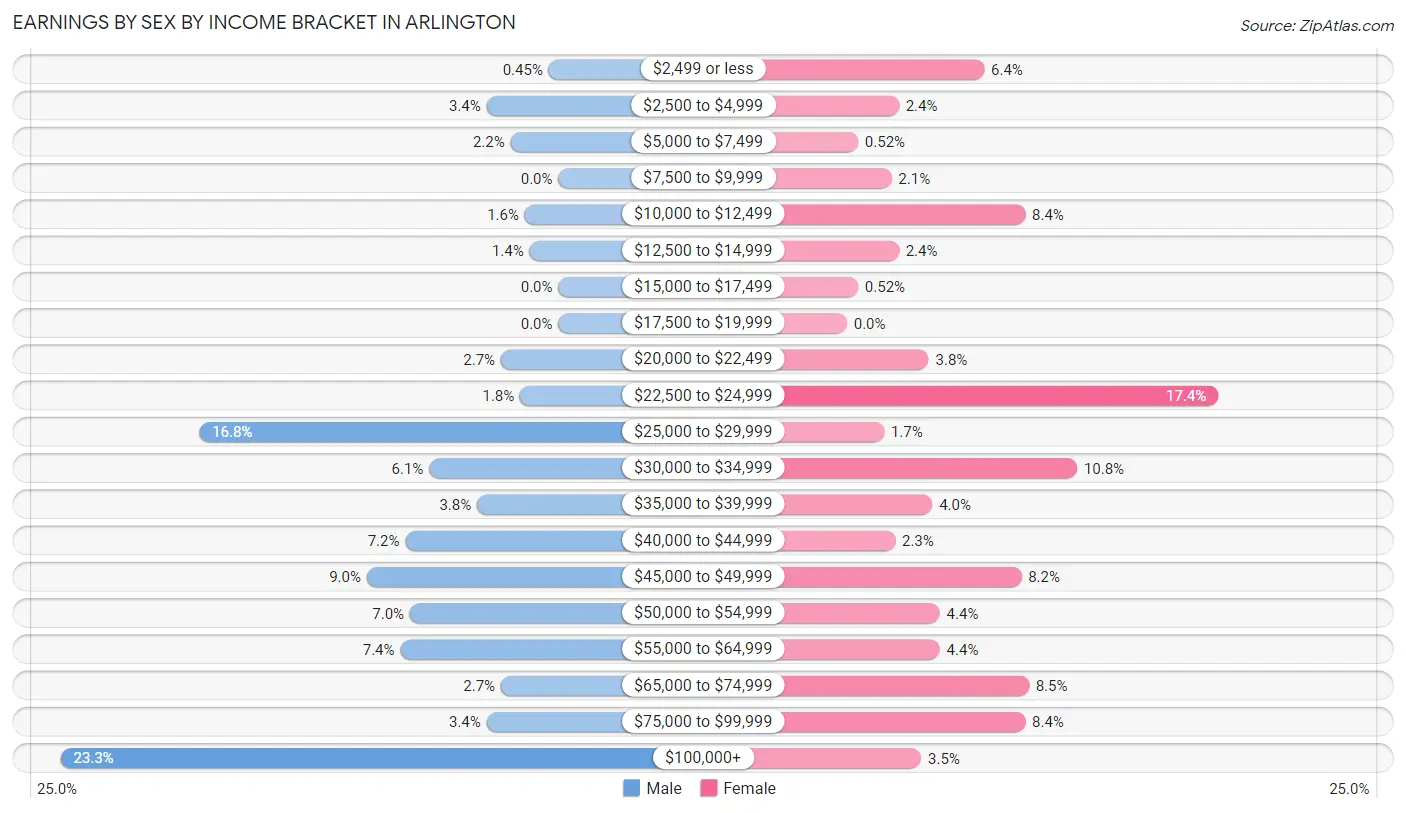
Earnings by Sex by Income Bracket in Arlington
The most common earnings brackets in Arlington are $100,000+ for men (104 | 23.3%) and $22,500 to $24,999 for women (100 | 17.4%).
| Income | Male | Female |
| $2,499 or less | 2 (0.4%) | 37 (6.4%) |
| $2,500 to $4,999 | 15 (3.4%) | 14 (2.4%) |
| $5,000 to $7,499 | 10 (2.2%) | 3 (0.5%) |
| $7,500 to $9,999 | 0 (0.0%) | 12 (2.1%) |
| $10,000 to $12,499 | 7 (1.6%) | 48 (8.4%) |
| $12,500 to $14,999 | 6 (1.3%) | 14 (2.4%) |
| $15,000 to $17,499 | 0 (0.0%) | 3 (0.5%) |
| $17,500 to $19,999 | 0 (0.0%) | 0 (0.0%) |
| $20,000 to $22,499 | 12 (2.7%) | 22 (3.8%) |
| $22,500 to $24,999 | 8 (1.8%) | 100 (17.4%) |
| $25,000 to $29,999 | 75 (16.8%) | 10 (1.7%) |
| $30,000 to $34,999 | 27 (6.0%) | 62 (10.8%) |
| $35,000 to $39,999 | 17 (3.8%) | 23 (4.0%) |
| $40,000 to $44,999 | 32 (7.2%) | 13 (2.3%) |
| $45,000 to $49,999 | 40 (9.0%) | 47 (8.2%) |
| $50,000 to $54,999 | 31 (7.0%) | 25 (4.3%) |
| $55,000 to $64,999 | 33 (7.4%) | 25 (4.3%) |
| $65,000 to $74,999 | 12 (2.7%) | 49 (8.5%) |
| $75,000 to $99,999 | 15 (3.4%) | 48 (8.4%) |
| $100,000+ | 104 (23.3%) | 20 (3.5%) |
| Total | 446 (100.0%) | 575 (100.0%) |
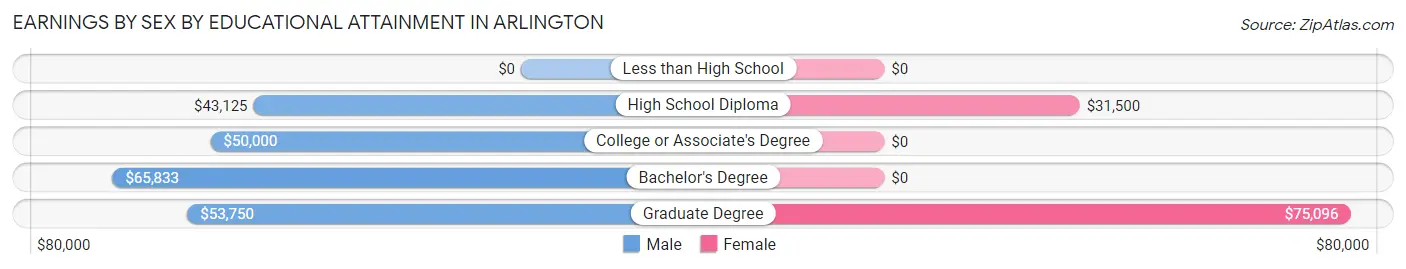
Earnings by Sex by Educational Attainment in Arlington
Average earnings in Arlington are $51,389 for men and $34,079 for women, a difference of 33.7%. Men with an educational attainment of bachelor's degree enjoy the highest average annual earnings of $65,833, while those with high school diploma education earn the least with $43,125. Women with an educational attainment of graduate degree earn the most with the average annual earnings of $75,096, while those with high school diploma education have the smallest earnings of $31,500.
| Educational Attainment | Male Income | Female Income |
| Less than High School | - | - |
| High School Diploma | $43,125 | $31,500 |
| College or Associate's Degree | $50,000 | $0 |
| Bachelor's Degree | $65,833 | $0 |
| Graduate Degree | $53,750 | $75,096 |
| Total | $51,389 | $34,079 |
Family Income in Arlington
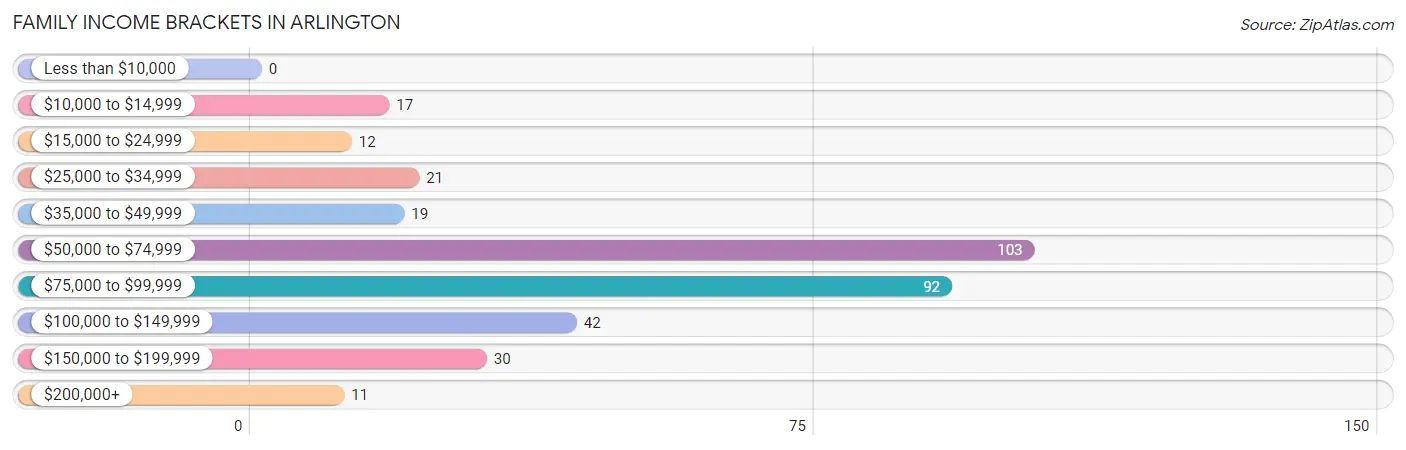
Family Income Brackets in Arlington
According to the Arlington family income data, there are 103 families falling into the $50,000 to $74,999 income range, which is the most common income bracket and makes up 29.7% of all families.
| Income Bracket | # Families | % Families |
| Less than $10,000 | 0 | 0.0% |
| $10,000 to $14,999 | 17 | 4.9% |
| $15,000 to $24,999 | 12 | 3.5% |
| $25,000 to $34,999 | 21 | 6.1% |
| $35,000 to $49,999 | 19 | 5.5% |
| $50,000 to $74,999 | 103 | 29.7% |
| $75,000 to $99,999 | 92 | 26.5% |
| $100,000 to $149,999 | 42 | 12.1% |
| $150,000 to $199,999 | 30 | 8.6% |
| $200,000+ | 11 | 3.2% |
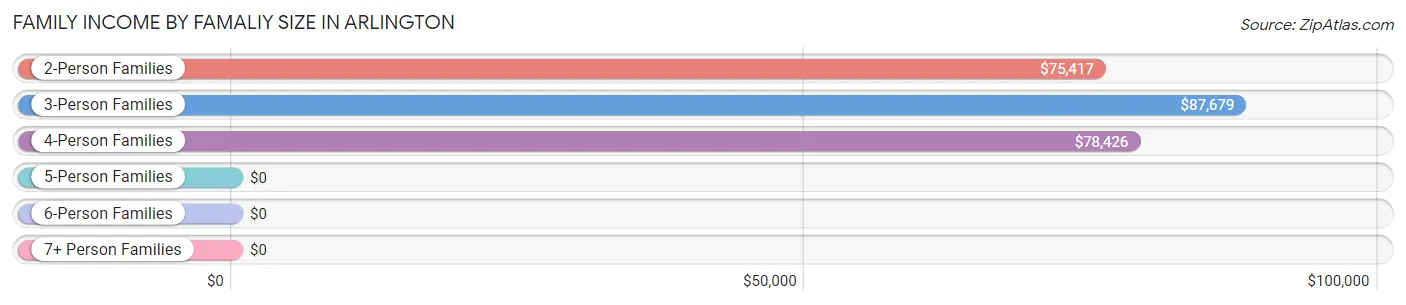
Family Income by Famaliy Size in Arlington
3-person families (99 | 28.5%) account for the highest median family income in Arlington with $87,679 per family, while 2-person families (127 | 36.6%) have the highest median income of $37,708 per family member.
| Income Bracket | # Families | Median Income |
| 2-Person Families | 127 (36.6%) | $75,417 |
| 3-Person Families | 99 (28.5%) | $87,679 |
| 4-Person Families | 84 (24.2%) | $78,426 |
| 5-Person Families | 8 (2.3%) | $0 |
| 6-Person Families | 23 (6.6%) | $0 |
| 7+ Person Families | 6 (1.7%) | $0 |
| Total | 347 (100.0%) | $75,750 |
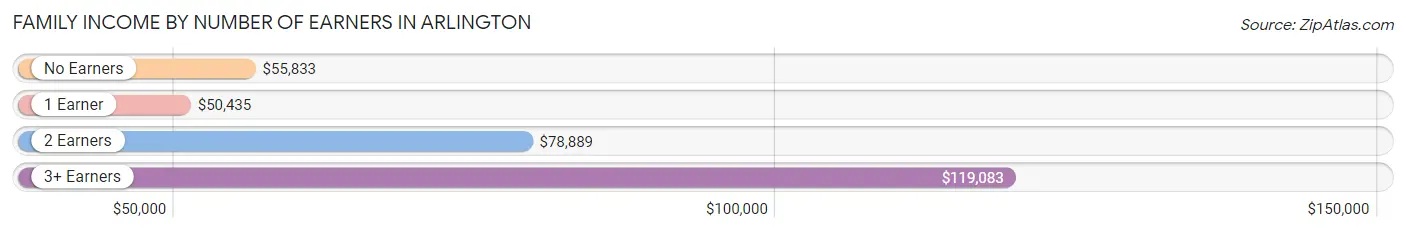
Family Income by Number of Earners in Arlington
The median family income in Arlington is $75,750, with families comprising 3+ earners (25) having the highest median family income of $119,083, while families with 1 earner (98) have the lowest median family income of $50,435, accounting for 7.2% and 28.2% of families, respectively.
| Number of Earners | # Families | Median Income |
| No Earners | 40 (11.5%) | $55,833 |
| 1 Earner | 98 (28.2%) | $50,435 |
| 2 Earners | 184 (53.0%) | $78,889 |
| 3+ Earners | 25 (7.2%) | $119,083 |
| Total | 347 (100.0%) | $75,750 |
Household Income in Arlington
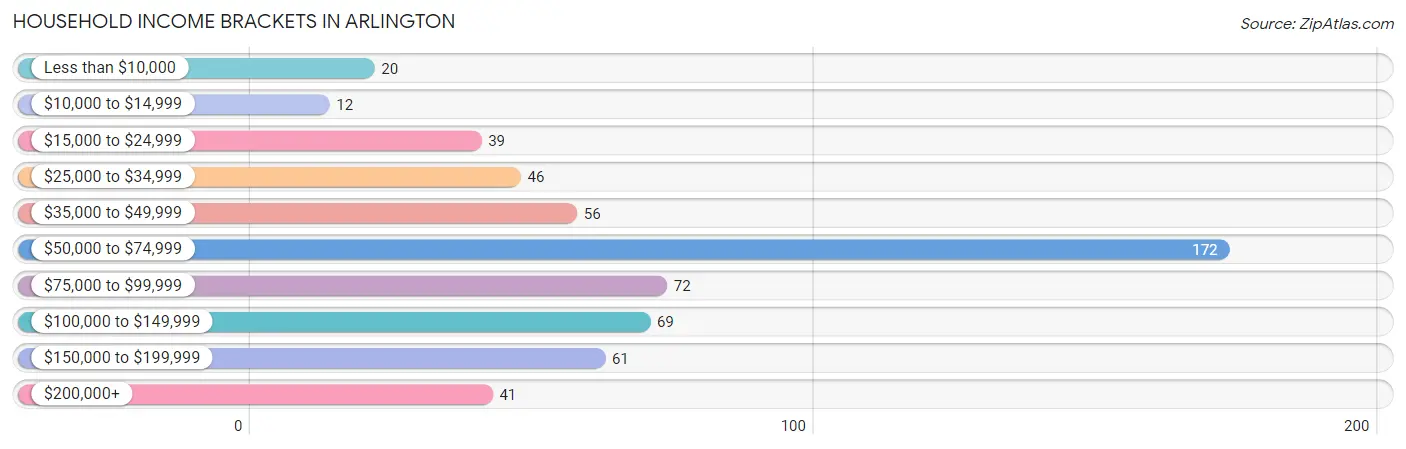
Household Income Brackets in Arlington
With 172 households falling in the category, the $50,000 to $74,999 income range is the most frequent in Arlington, accounting for 29.2% of all households. In contrast, only 12 households (2.0%) fall into the $10,000 to $14,999 income bracket, making it the least populous group.
| Income Bracket | # Households | % Households |
| Less than $10,000 | 20 | 3.4% |
| $10,000 to $14,999 | 12 | 2.0% |
| $15,000 to $24,999 | 39 | 6.6% |
| $25,000 to $34,999 | 46 | 7.8% |
| $35,000 to $49,999 | 56 | 9.5% |
| $50,000 to $74,999 | 172 | 29.3% |
| $75,000 to $99,999 | 72 | 12.2% |
| $100,000 to $149,999 | 69 | 11.7% |
| $150,000 to $199,999 | 61 | 10.4% |
| $200,000+ | 41 | 7.0% |
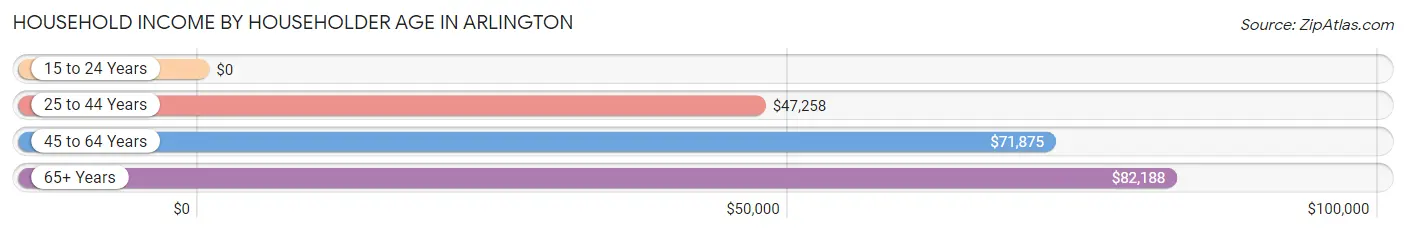
Household Income by Householder Age in Arlington
The median household income in Arlington is $70,938, with the highest median household income of $82,188 found in the 65+ years age bracket for the primary householder. A total of 105 households (17.9%) fall into this category. Meanwhile, the 15 to 24 years age bracket for the primary householder has the lowest median household income of $0, with 6 households (1.0%) in this group.
| Income Bracket | # Households | Median Income |
| 15 to 24 Years | 6 (1.0%) | $0 |
| 25 to 44 Years | 196 (33.3%) | $47,258 |
| 45 to 64 Years | 281 (47.8%) | $71,875 |
| 65+ Years | 105 (17.9%) | $82,188 |
| Total | 588 (100.0%) | $70,938 |
Poverty in Arlington
Income Below Poverty by Sex and Age in Arlington
With 9.2% poverty level for males and 11.7% for females among the residents of Arlington, 6 to 11 year old males and 16 and 17 year old females are the most vulnerable to poverty, with 22 males (22.2%) and 4 females (100.0%) in their respective age groups living below the poverty level.
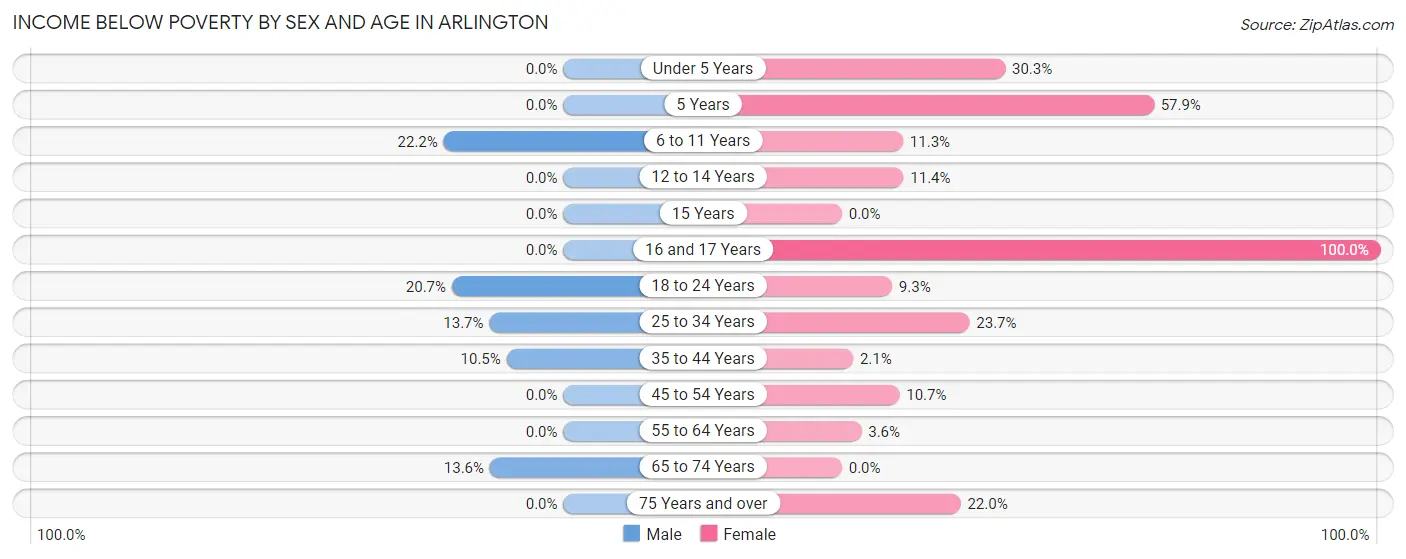
| Age Bracket | Male | Female |
| Under 5 Years | 0 (0.0%) | 10 (30.3%) |
| 5 Years | 0 (0.0%) | 11 (57.9%) |
| 6 to 11 Years | 22 (22.2%) | 11 (11.3%) |
| 12 to 14 Years | 0 (0.0%) | 4 (11.4%) |
| 15 Years | 0 (0.0%) | 0 (0.0%) |
| 16 and 17 Years | 0 (0.0%) | 4 (100.0%) |
| 18 to 24 Years | 24 (20.7%) | 8 (9.3%) |
| 25 to 34 Years | 7 (13.7%) | 27 (23.7%) |
| 35 to 44 Years | 14 (10.5%) | 4 (2.1%) |
| 45 to 54 Years | 0 (0.0%) | 11 (10.7%) |
| 55 to 64 Years | 0 (0.0%) | 5 (3.6%) |
| 65 to 74 Years | 12 (13.6%) | 0 (0.0%) |
| 75 Years and over | 0 (0.0%) | 13 (22.0%) |
| Total | 79 (9.2%) | 108 (11.7%) |
Income Above Poverty by Sex and Age in Arlington
According to the poverty statistics in Arlington, males aged under 5 years and females aged 65 to 74 years are the age groups that are most secure financially, with 100.0% of males and 100.0% of females in these age groups living above the poverty line.
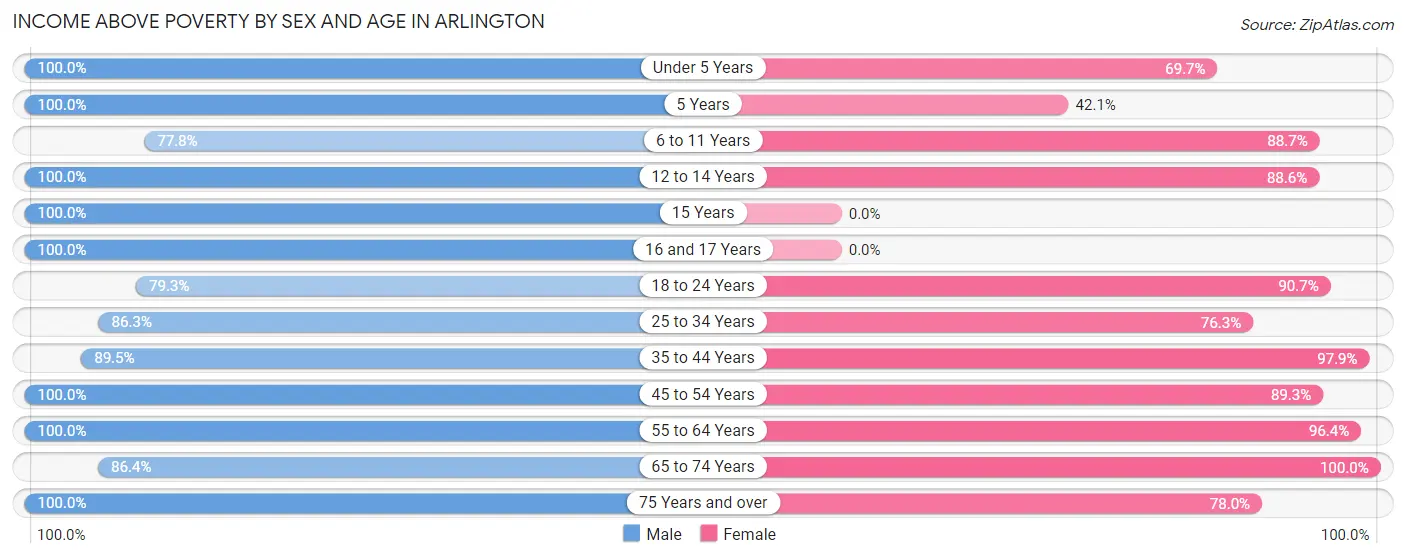
| Age Bracket | Male | Female |
| Under 5 Years | 80 (100.0%) | 23 (69.7%) |
| 5 Years | 8 (100.0%) | 8 (42.1%) |
| 6 to 11 Years | 77 (77.8%) | 86 (88.7%) |
| 12 to 14 Years | 48 (100.0%) | 31 (88.6%) |
| 15 Years | 14 (100.0%) | 0 (0.0%) |
| 16 and 17 Years | 12 (100.0%) | 0 (0.0%) |
| 18 to 24 Years | 92 (79.3%) | 78 (90.7%) |
| 25 to 34 Years | 44 (86.3%) | 87 (76.3%) |
| 35 to 44 Years | 119 (89.5%) | 188 (97.9%) |
| 45 to 54 Years | 70 (100.0%) | 92 (89.3%) |
| 55 to 64 Years | 118 (100.0%) | 133 (96.4%) |
| 65 to 74 Years | 76 (86.4%) | 43 (100.0%) |
| 75 Years and over | 21 (100.0%) | 46 (78.0%) |
| Total | 779 (90.8%) | 815 (88.3%) |
Income Below Poverty Among Married-Couple Families in Arlington
The poverty statistics for married-couple families in Arlington show that 1.6% or 4 of the total 255 families live below the poverty line. Families with 1 or 2 children have the highest poverty rate of 5.6%, comprising of 4 families. On the other hand, families with no children have the lowest poverty rate of 0.0%, which includes 0 families.
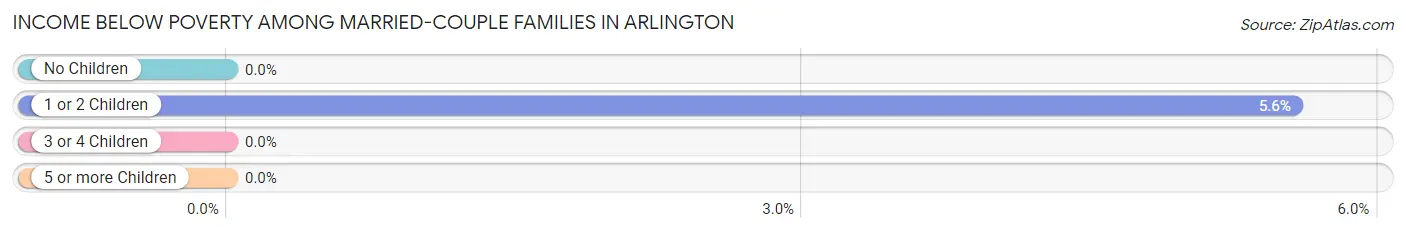
| Children | Above Poverty | Below Poverty |
| No Children | 147 (100.0%) | 0 (0.0%) |
| 1 or 2 Children | 68 (94.4%) | 4 (5.6%) |
| 3 or 4 Children | 30 (100.0%) | 0 (0.0%) |
| 5 or more Children | 6 (100.0%) | 0 (0.0%) |
| Total | 251 (98.4%) | 4 (1.6%) |
Income Below Poverty Among Single-Parent Households in Arlington
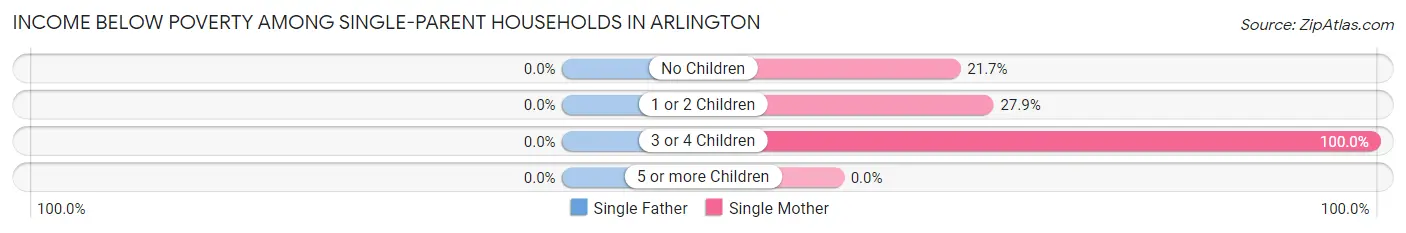
| Children | Single Father | Single Mother |
| No Children | 0 (0.0%) | 5 (21.7%) |
| 1 or 2 Children | 0 (0.0%) | 12 (27.9%) |
| 3 or 4 Children | 0 (0.0%) | 8 (100.0%) |
| 5 or more Children | 0 (0.0%) | 0 (0.0%) |
| Total | 0 (0.0%) | 25 (33.8%) |
Income Below Poverty Among Married-Couple vs Single-Parent Households in Arlington
The poverty data for Arlington shows that 4 of the married-couple family households (1.6%) and 25 of the single-parent households (27.2%) are living below the poverty level. Within the married-couple family households, those with 1 or 2 children have the highest poverty rate, with 4 households (5.6%) falling below the poverty line. Among the single-parent households, those with 3 or 4 children have the highest poverty rate, with 8 household (100.0%) living below poverty.
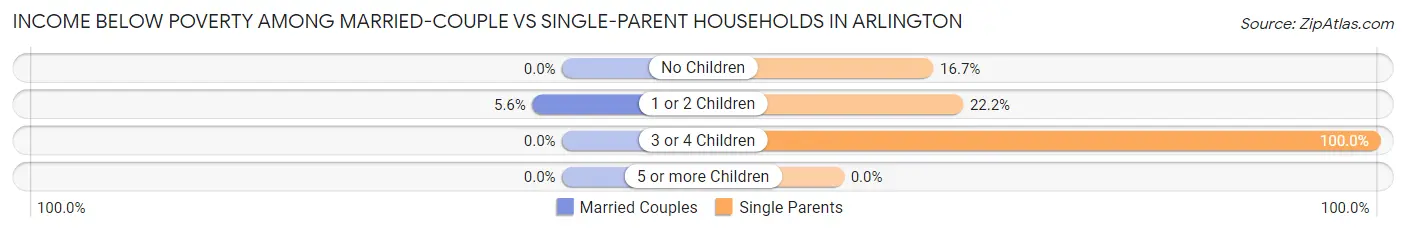
| Children | Married-Couple Families | Single-Parent Households |
| No Children | 0 (0.0%) | 5 (16.7%) |
| 1 or 2 Children | 4 (5.6%) | 12 (22.2%) |
| 3 or 4 Children | 0 (0.0%) | 8 (100.0%) |
| 5 or more Children | 0 (0.0%) | 0 (0.0%) |
| Total | 4 (1.6%) | 25 (27.2%) |
Race in Arlington
The most populous races in Arlington are White / Caucasian (1,537 | 86.3%), Hispanic or Latino (167 | 9.4%), and Two or more Races (158 | 8.9%).
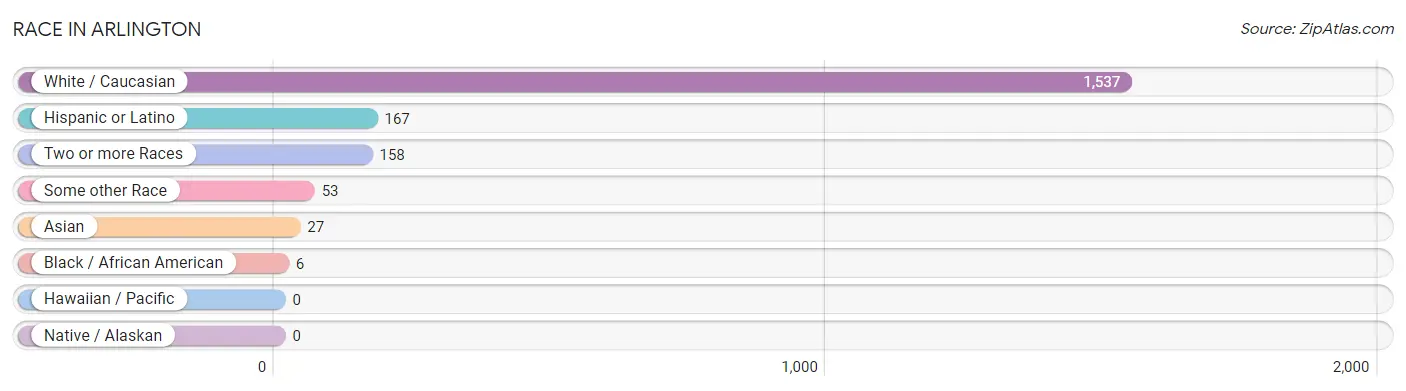
| Race | # Population | % Population |
| Asian | 27 | 1.5% |
| Black / African American | 6 | 0.3% |
| Hawaiian / Pacific | 0 | 0.0% |
| Hispanic or Latino | 167 | 9.4% |
| Native / Alaskan | 0 | 0.0% |
| White / Caucasian | 1,537 | 86.3% |
| Two or more Races | 158 | 8.9% |
| Some other Race | 53 | 3.0% |
| Total | 1,781 | 100.0% |
Ancestry in Arlington
The most populous ancestries reported in Arlington are Irish (332 | 18.6%), American (323 | 18.1%), German (253 | 14.2%), English (204 | 11.5%), and Italian (106 | 5.9%), together accounting for 68.4% of all Arlington residents.
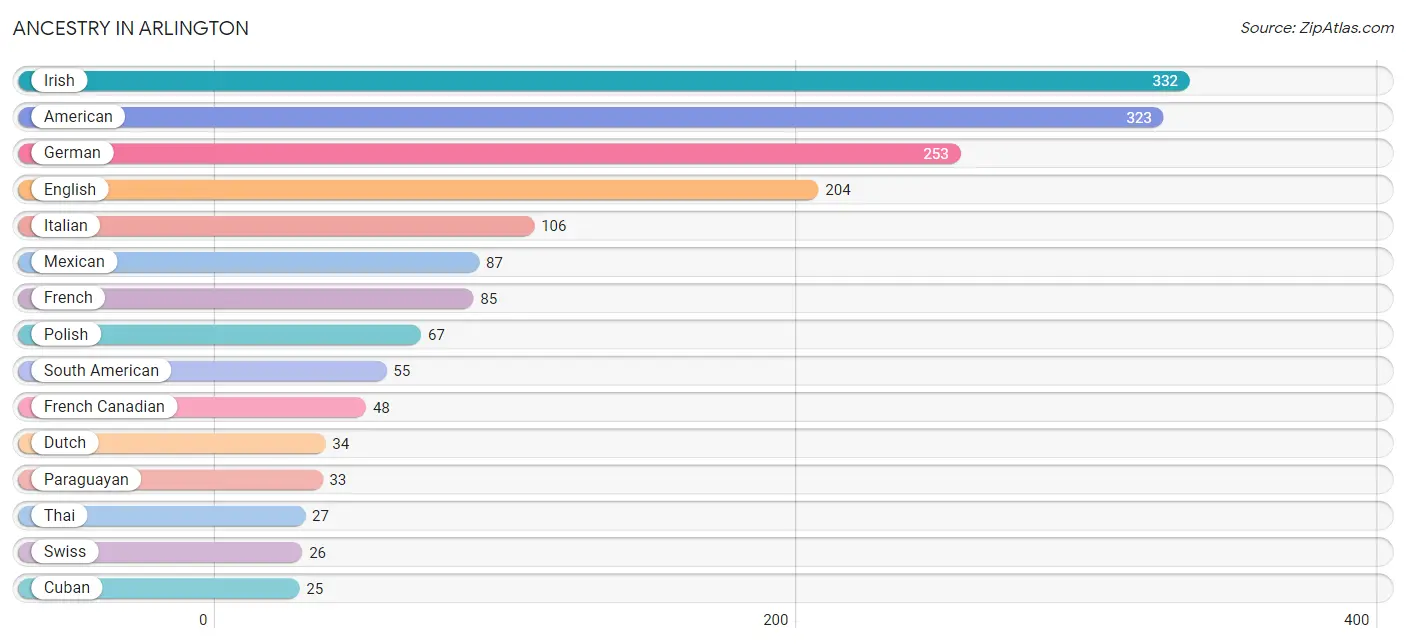
| Ancestry | # Population | % Population |
| American | 323 | 18.1% |
| Bhutanese | 18 | 1.0% |
| British | 9 | 0.5% |
| Canadian | 21 | 1.2% |
| Celtic | 8 | 0.4% |
| Croatian | 9 | 0.5% |
| Cuban | 25 | 1.4% |
| Dutch | 34 | 1.9% |
| English | 204 | 11.5% |
| European | 6 | 0.3% |
| Finnish | 8 | 0.4% |
| French | 85 | 4.8% |
| French Canadian | 48 | 2.7% |
| German | 253 | 14.2% |
| Greek | 20 | 1.1% |
| Hungarian | 18 | 1.0% |
| Irish | 332 | 18.6% |
| Italian | 106 | 5.9% |
| Latvian | 6 | 0.3% |
| Lithuanian | 6 | 0.3% |
| Mexican | 87 | 4.9% |
| Northern European | 9 | 0.5% |
| Paraguayan | 33 | 1.8% |
| Peruvian | 22 | 1.2% |
| Polish | 67 | 3.8% |
| Scandinavian | 10 | 0.6% |
| Scotch-Irish | 10 | 0.6% |
| Scottish | 2 | 0.1% |
| Slovak | 15 | 0.8% |
| South American | 55 | 3.1% |
| Swedish | 19 | 1.1% |
| Swiss | 26 | 1.5% |
| Thai | 27 | 1.5% |
| Ukrainian | 5 | 0.3% |
| Welsh | 9 | 0.5% | View All 35 Rows |
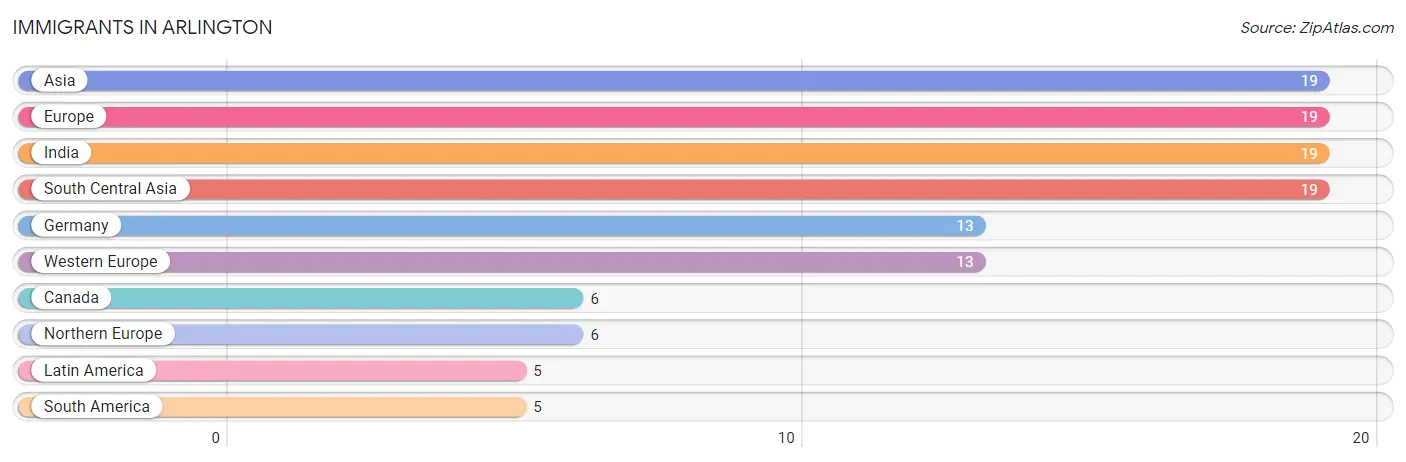
Immigrants in Arlington
The most numerous immigrant groups reported in Arlington came from Asia (19 | 1.1%), Europe (19 | 1.1%), India (19 | 1.1%), South Central Asia (19 | 1.1%), and Germany (13 | 0.7%), together accounting for 5.0% of all Arlington residents.
| Immigration Origin | # Population | % Population |
| Asia | 19 | 1.1% |
| Canada | 6 | 0.3% |
| Europe | 19 | 1.1% |
| Germany | 13 | 0.7% |
| India | 19 | 1.1% |
| Latin America | 5 | 0.3% |
| Northern Europe | 6 | 0.3% |
| South America | 5 | 0.3% |
| South Central Asia | 19 | 1.1% |
| Western Europe | 13 | 0.7% | View All 10 Rows |
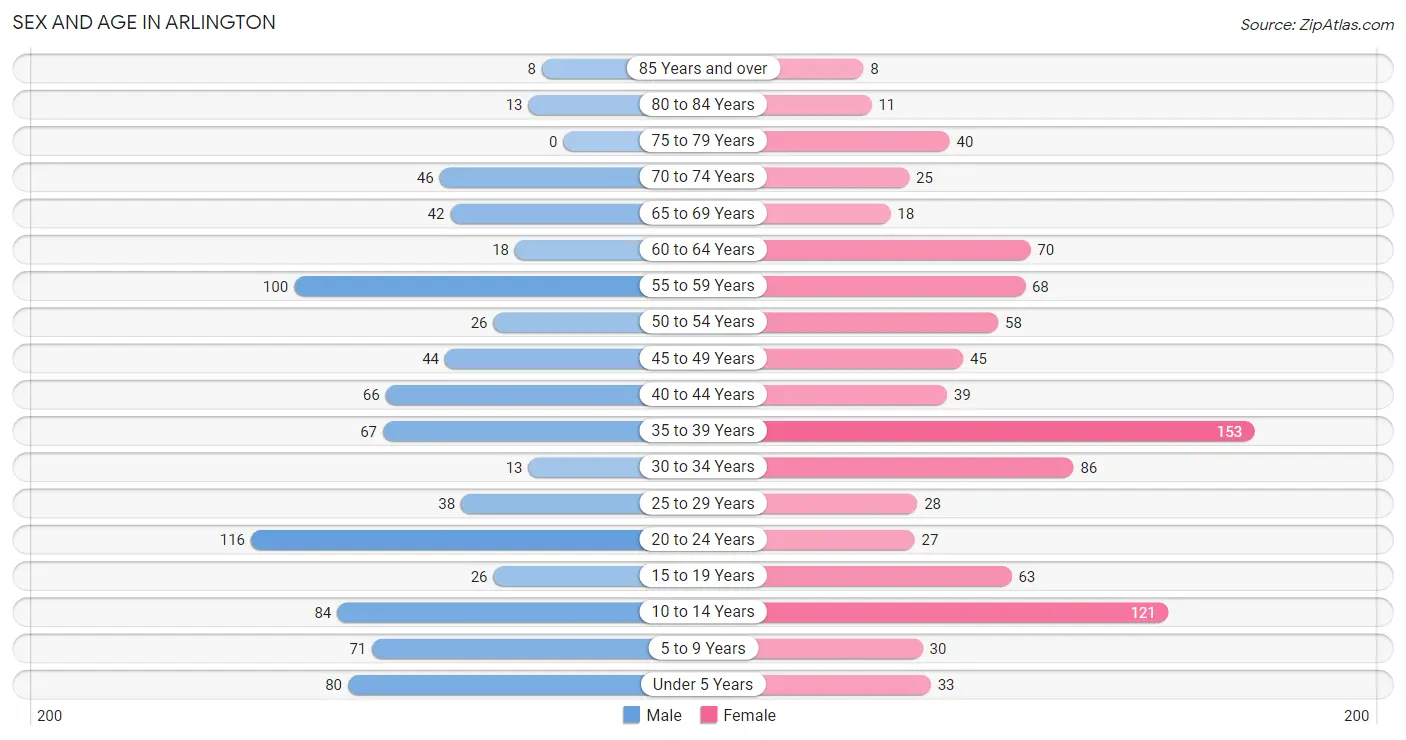
Sex and Age in Arlington
Sex and Age in Arlington
The most populous age groups in Arlington are 20 to 24 Years (116 | 13.5%) for men and 35 to 39 Years (153 | 16.6%) for women.
| Age Bracket | Male | Female |
| Under 5 Years | 80 (9.3%) | 33 (3.6%) |
| 5 to 9 Years | 71 (8.3%) | 30 (3.3%) |
| 10 to 14 Years | 84 (9.8%) | 121 (13.1%) |
| 15 to 19 Years | 26 (3.0%) | 63 (6.8%) |
| 20 to 24 Years | 116 (13.5%) | 27 (2.9%) |
| 25 to 29 Years | 38 (4.4%) | 28 (3.0%) |
| 30 to 34 Years | 13 (1.5%) | 86 (9.3%) |
| 35 to 39 Years | 67 (7.8%) | 153 (16.6%) |
| 40 to 44 Years | 66 (7.7%) | 39 (4.2%) |
| 45 to 49 Years | 44 (5.1%) | 45 (4.9%) |
| 50 to 54 Years | 26 (3.0%) | 58 (6.3%) |
| 55 to 59 Years | 100 (11.7%) | 68 (7.4%) |
| 60 to 64 Years | 18 (2.1%) | 70 (7.6%) |
| 65 to 69 Years | 42 (4.9%) | 18 (1.9%) |
| 70 to 74 Years | 46 (5.4%) | 25 (2.7%) |
| 75 to 79 Years | 0 (0.0%) | 40 (4.3%) |
| 80 to 84 Years | 13 (1.5%) | 11 (1.2%) |
| 85 Years and over | 8 (0.9%) | 8 (0.9%) |
| Total | 858 (100.0%) | 923 (100.0%) |
Families and Households in Arlington
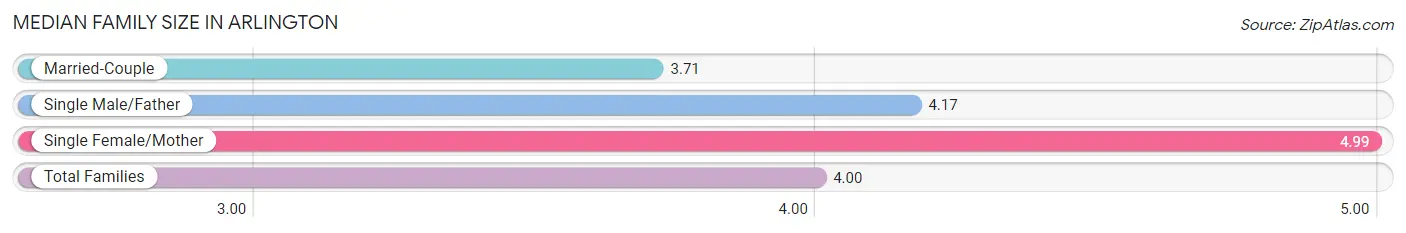
Median Family Size in Arlington
The median family size in Arlington is 4.00 persons per family, with single female/mother families (74 | 21.3%) accounting for the largest median family size of 4.99 persons per family. On the other hand, married-couple families (255 | 73.5%) represent the smallest median family size with 3.71 persons per family.
| Family Type | # Families | Family Size |
| Married-Couple | 255 (73.5%) | 3.71 |
| Single Male/Father | 18 (5.2%) | 4.17 |
| Single Female/Mother | 74 (21.3%) | 4.99 |
| Total Families | 347 (100.0%) | 4.00 |
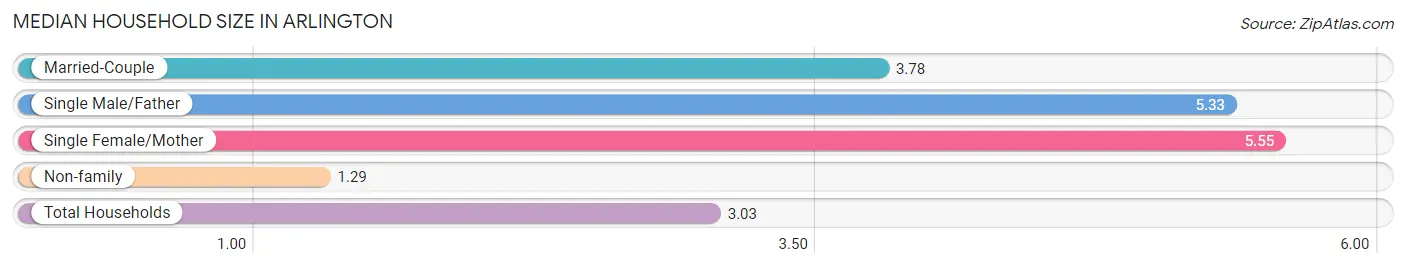
Median Household Size in Arlington
The median household size in Arlington is 3.03 persons per household, with single female/mother households (74 | 12.6%) accounting for the largest median household size of 5.55 persons per household. non-family households (241 | 41.0%) represent the smallest median household size with 1.29 persons per household.
| Household Type | # Households | Household Size |
| Married-Couple | 255 (43.4%) | 3.78 |
| Single Male/Father | 18 (3.1%) | 5.33 |
| Single Female/Mother | 74 (12.6%) | 5.55 |
| Non-family | 241 (41.0%) | 1.29 |
| Total Households | 588 (100.0%) | 3.03 |
Household Size by Marriage Status in Arlington
Out of a total of 588 households in Arlington, 347 (59.0%) are family households, while 241 (41.0%) are nonfamily households. The most numerous type of family households are 2-person households, comprising 124, and the most common type of nonfamily households are 1-person households, comprising 161.
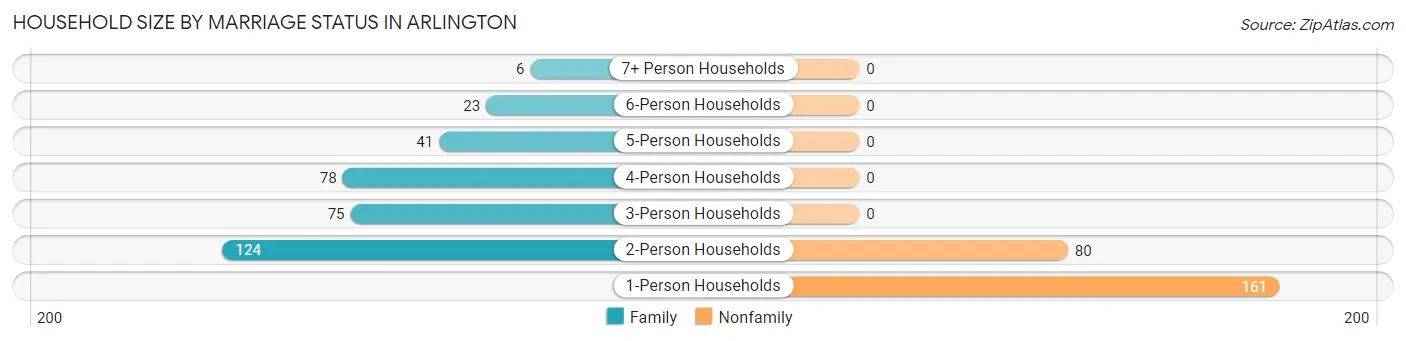
| Household Size | Family Households | Nonfamily Households |
| 1-Person Households | - | 161 (27.4%) |
| 2-Person Households | 124 (21.1%) | 80 (13.6%) |
| 3-Person Households | 75 (12.8%) | 0 (0.0%) |
| 4-Person Households | 78 (13.3%) | 0 (0.0%) |
| 5-Person Households | 41 (7.0%) | 0 (0.0%) |
| 6-Person Households | 23 (3.9%) | 0 (0.0%) |
| 7+ Person Households | 6 (1.0%) | 0 (0.0%) |
| Total | 347 (59.0%) | 241 (41.0%) |
Female Fertility in Arlington
Fertility by Age in Arlington
Average fertility rate in Arlington is 82.0 births per 1,000 women. Women in the age bracket of 35 to 50 years have the highest fertility rate with 118.0 births per 1,000 women. Women in the age bracket of 35 to 50 years acount for 77.8% of all women with births.
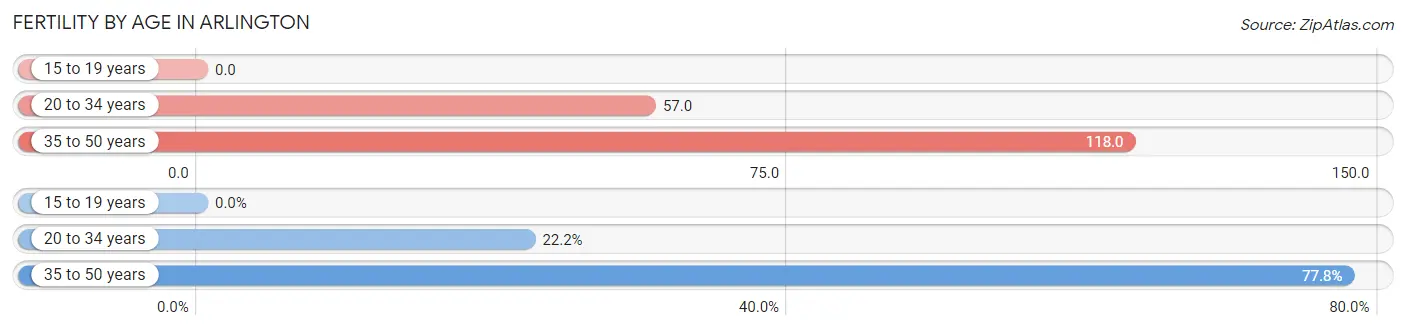
| Age Bracket | Women with Births | Births / 1,000 Women |
| 15 to 19 years | 0 (0.0%) | 0.0 |
| 20 to 34 years | 8 (22.2%) | 57.0 |
| 35 to 50 years | 28 (77.8%) | 118.0 |
| Total | 36 (100.0%) | 82.0 |
Fertility by Age by Marriage Status in Arlington
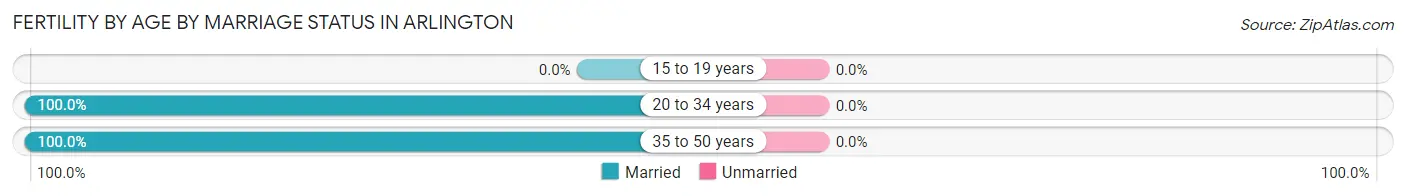
| Age Bracket | Married | Unmarried |
| 15 to 19 years | 0 (0.0%) | 0 (0.0%) |
| 20 to 34 years | 8 (100.0%) | 0 (0.0%) |
| 35 to 50 years | 28 (100.0%) | 0 (0.0%) |
| Total | 36 (100.0%) | 0 (0.0%) |
Fertility by Education in Arlington
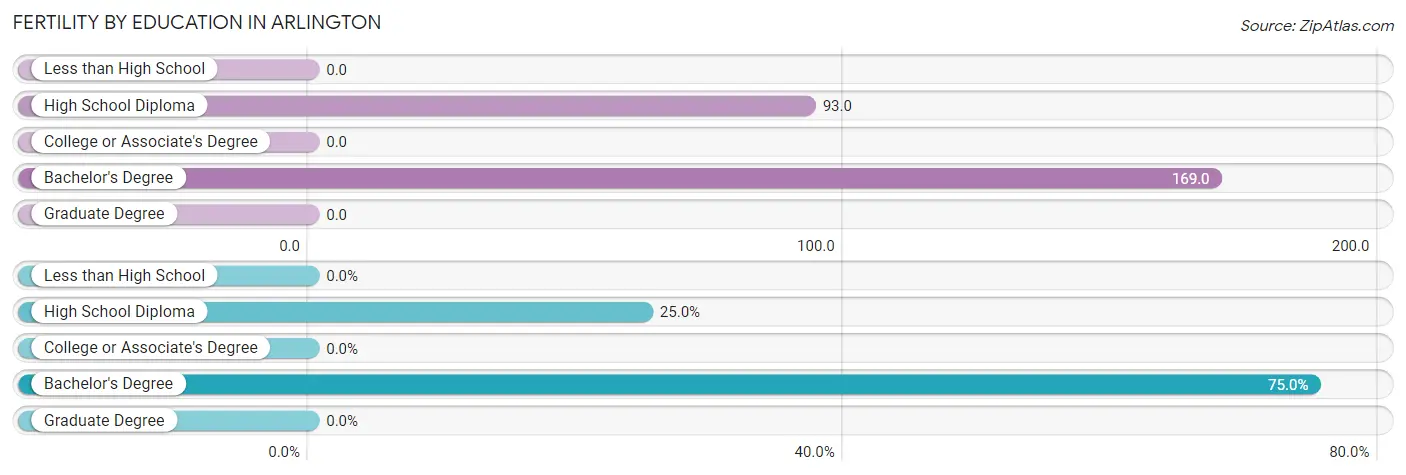
| Educational Attainment | Women with Births | Births / 1,000 Women |
| Less than High School | 0 (0.0%) | 0.0 |
| High School Diploma | 9 (25.0%) | 93.0 |
| College or Associate's Degree | 0 (0.0%) | 0.0 |
| Bachelor's Degree | 27 (75.0%) | 169.0 |
| Graduate Degree | 0 (0.0%) | 0.0 |
| Total | 36 (100.0%) | 82.0 |
Fertility by Education by Marriage Status in Arlington
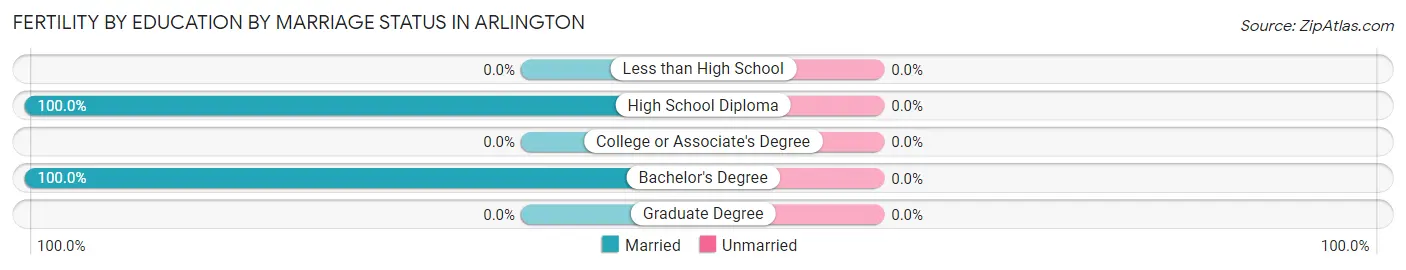
| Educational Attainment | Married | Unmarried |
| Less than High School | 0 (0.0%) | 0 (0.0%) |
| High School Diploma | 9 (100.0%) | 0 (0.0%) |
| College or Associate's Degree | 0 (0.0%) | 0 (0.0%) |
| Bachelor's Degree | 27 (100.0%) | 0 (0.0%) |
| Graduate Degree | 0 (0.0%) | 0 (0.0%) |
| Total | 36 (100.0%) | 0 (0.0%) |
Employment Characteristics in Arlington
Employment by Class of Employer in Arlington
Among the 874 employed individuals in Arlington, private company employees (556 | 63.6%), not-for-profit organizations (138 | 15.8%), and self-employed (incorporated) (61 | 7.0%) make up the most common classes of employment.
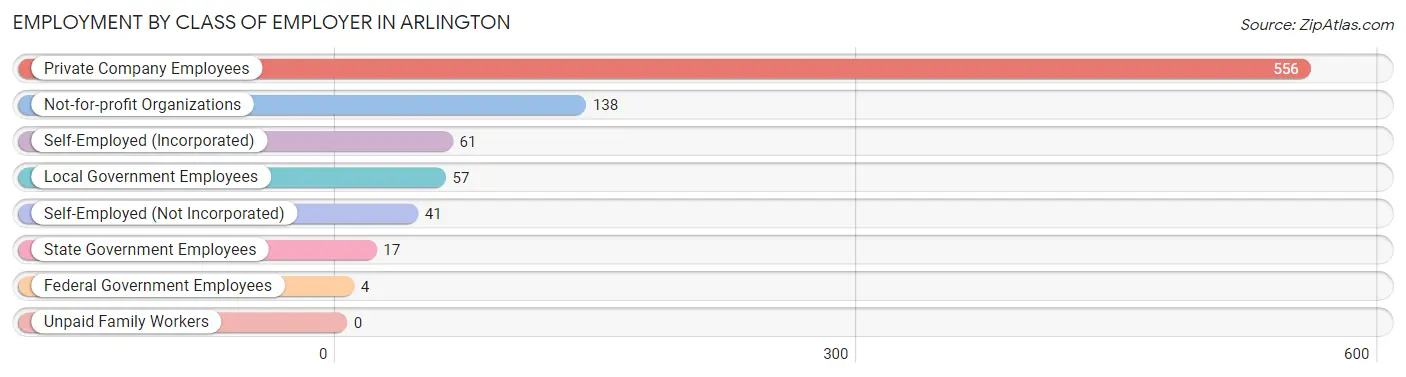
| Employer Class | # Employees | % Employees |
| Private Company Employees | 556 | 63.6% |
| Self-Employed (Incorporated) | 61 | 7.0% |
| Self-Employed (Not Incorporated) | 41 | 4.7% |
| Not-for-profit Organizations | 138 | 15.8% |
| Local Government Employees | 57 | 6.5% |
| State Government Employees | 17 | 1.9% |
| Federal Government Employees | 4 | 0.5% |
| Unpaid Family Workers | 0 | 0.0% |
| Total | 874 | 100.0% |
Employment Status by Age in Arlington
According to the labor force statistics for Arlington, out of the total population over 16 years of age (1,348), 70.4% or 949 individuals are in the labor force, with 5.8% or 55 of them unemployed. The age group with the highest labor force participation rate is 30 to 34 years, with 100.0% or 99 individuals in the labor force. Within the labor force, the 30 to 34 years age range has the highest percentage of unemployed individuals, with 40.4% or 40 of them being unemployed.
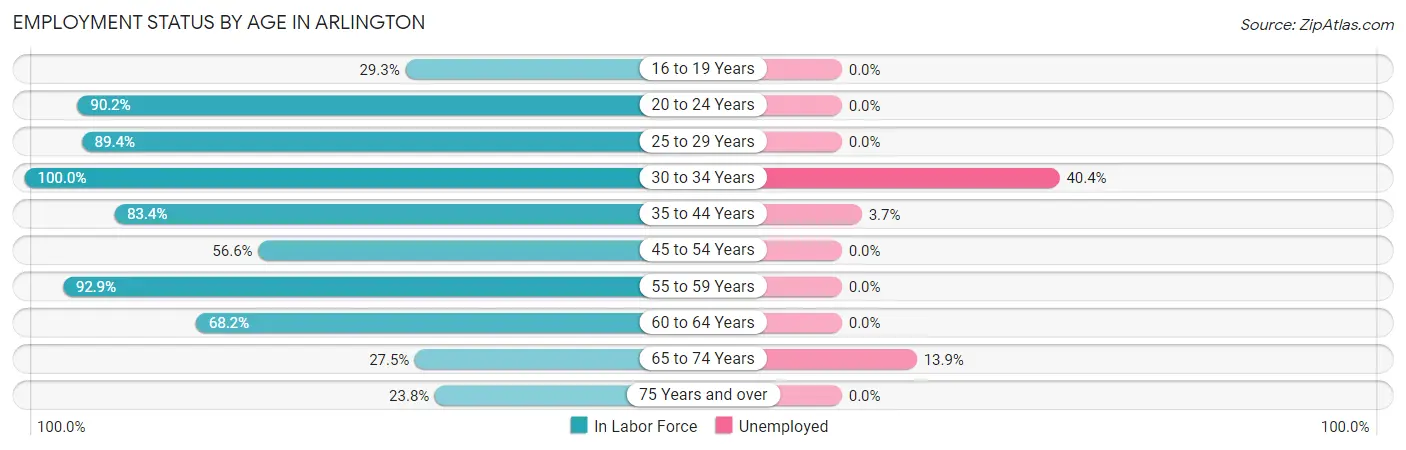
| Age Bracket | In Labor Force | Unemployed |
| 16 to 19 Years | 22 (29.3%) | 0 (0.0%) |
| 20 to 24 Years | 129 (90.2%) | 0 (0.0%) |
| 25 to 29 Years | 59 (89.4%) | 0 (0.0%) |
| 30 to 34 Years | 99 (100.0%) | 40 (40.4%) |
| 35 to 44 Years | 271 (83.4%) | 10 (3.7%) |
| 45 to 54 Years | 98 (56.6%) | 0 (0.0%) |
| 55 to 59 Years | 156 (92.9%) | 0 (0.0%) |
| 60 to 64 Years | 60 (68.2%) | 0 (0.0%) |
| 65 to 74 Years | 36 (27.5%) | 5 (13.9%) |
| 75 Years and over | 19 (23.8%) | 0 (0.0%) |
| Total | 949 (70.4%) | 55 (5.8%) |
Employment Status by Educational Attainment in Arlington
According to labor force statistics for Arlington, 80.8% of individuals (743) out of the total population between 25 and 64 years of age (919) are in the labor force, with 6.7% or 50 of them being unemployed. The group with the highest labor force participation rate are those with the educational attainment of bachelor's degree or higher, with 87.0% or 322 individuals in the labor force. Within the labor force, individuals with high school diploma education have the highest percentage of unemployment, with 22.7% or 40 of them being unemployed.
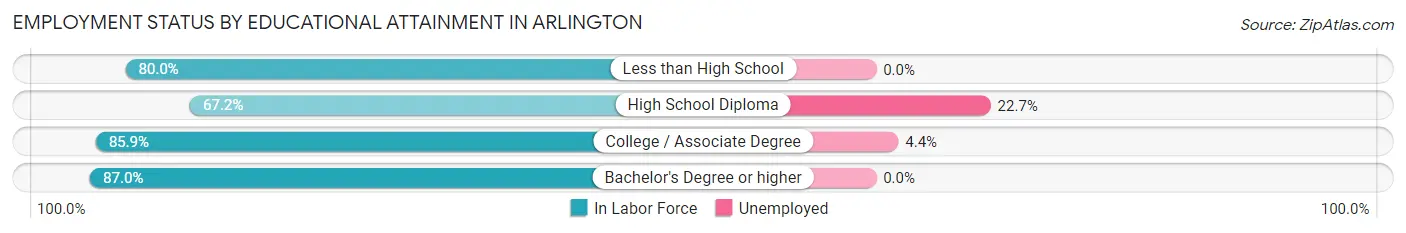
| Educational Attainment | In Labor Force | Unemployed |
| Less than High School | 20 (80.0%) | 0 (0.0%) |
| High School Diploma | 176 (67.2%) | 59 (22.7%) |
| College / Associate Degree | 225 (85.9%) | 12 (4.4%) |
| Bachelor's Degree or higher | 322 (87.0%) | 0 (0.0%) |
| Total | 743 (80.8%) | 62 (6.7%) |
Employment Occupations by Sex in Arlington
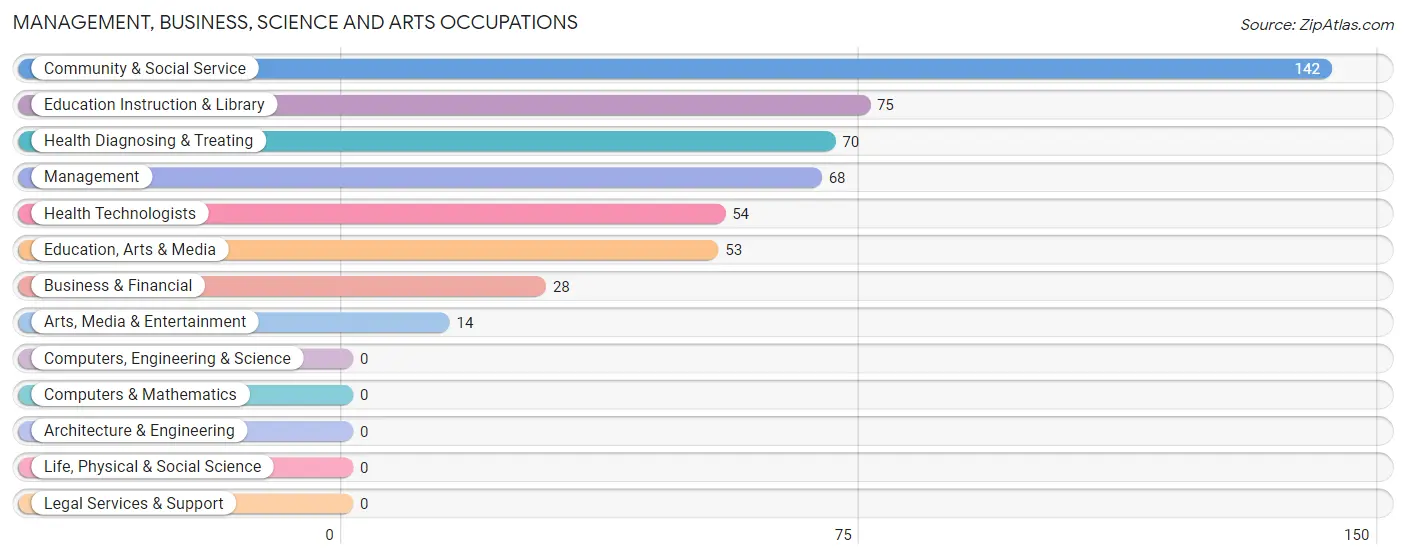
Management, Business, Science and Arts Occupations
The most common Management, Business, Science and Arts occupations in Arlington are Community & Social Service (142 | 15.9%), Education Instruction & Library (75 | 8.4%), Health Diagnosing & Treating (70 | 7.8%), Management (68 | 7.6%), and Health Technologists (54 | 6.0%).
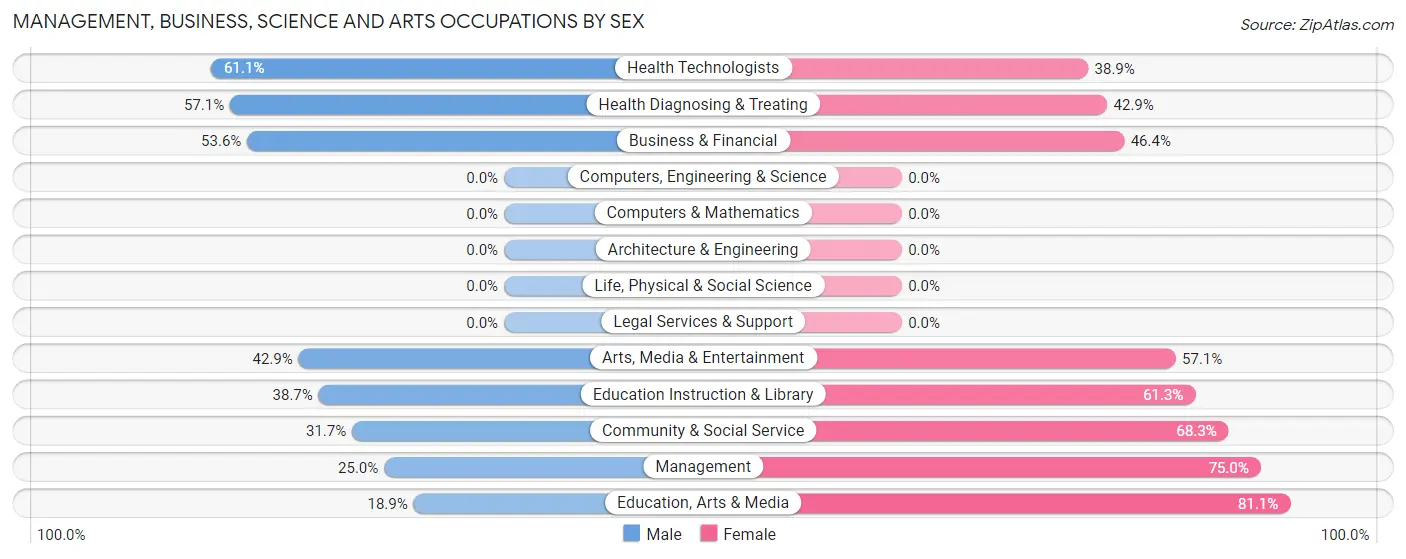
Management, Business, Science and Arts Occupations by Sex
Within the Management, Business, Science and Arts occupations in Arlington, the most male-oriented occupations are Health Technologists (61.1%), Health Diagnosing & Treating (57.1%), and Business & Financial (53.6%), while the most female-oriented occupations are Education, Arts & Media (81.1%), Management (75.0%), and Community & Social Service (68.3%).
| Occupation | Male | Female |
| Management | 17 (25.0%) | 51 (75.0%) |
| Business & Financial | 15 (53.6%) | 13 (46.4%) |
| Computers, Engineering & Science | 0 (0.0%) | 0 (0.0%) |
| Computers & Mathematics | 0 (0.0%) | 0 (0.0%) |
| Architecture & Engineering | 0 (0.0%) | 0 (0.0%) |
| Life, Physical & Social Science | 0 (0.0%) | 0 (0.0%) |
| Community & Social Service | 45 (31.7%) | 97 (68.3%) |
| Education, Arts & Media | 10 (18.9%) | 43 (81.1%) |
| Legal Services & Support | 0 (0.0%) | 0 (0.0%) |
| Education Instruction & Library | 29 (38.7%) | 46 (61.3%) |
| Arts, Media & Entertainment | 6 (42.9%) | 8 (57.1%) |
| Health Diagnosing & Treating | 40 (57.1%) | 30 (42.9%) |
| Health Technologists | 33 (61.1%) | 21 (38.9%) |
| Total (Category) | 117 (38.0%) | 191 (62.0%) |
| Total (Overall) | 412 (46.1%) | 482 (53.9%) |
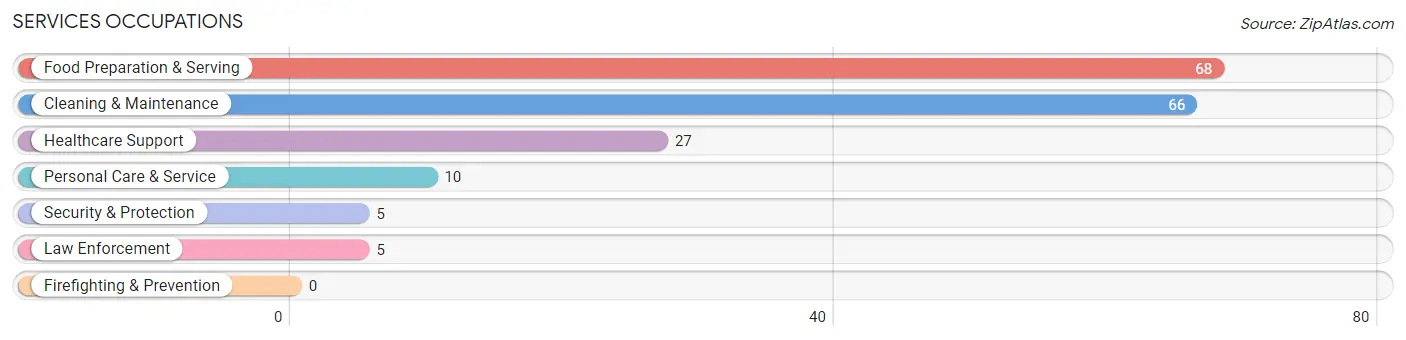
Services Occupations
The most common Services occupations in Arlington are Food Preparation & Serving (68 | 7.6%), Cleaning & Maintenance (66 | 7.4%), Healthcare Support (27 | 3.0%), Personal Care & Service (10 | 1.1%), and Security & Protection (5 | 0.6%).
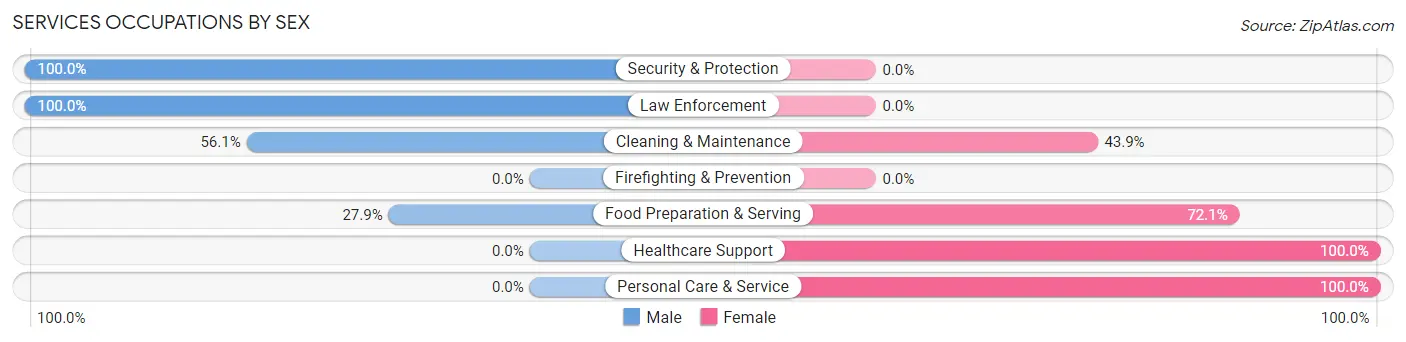
Services Occupations by Sex
Within the Services occupations in Arlington, the most male-oriented occupations are Security & Protection (100.0%), Law Enforcement (100.0%), and Cleaning & Maintenance (56.1%), while the most female-oriented occupations are Healthcare Support (100.0%), Personal Care & Service (100.0%), and Food Preparation & Serving (72.1%).
| Occupation | Male | Female |
| Healthcare Support | 0 (0.0%) | 27 (100.0%) |
| Security & Protection | 5 (100.0%) | 0 (0.0%) |
| Firefighting & Prevention | 0 (0.0%) | 0 (0.0%) |
| Law Enforcement | 5 (100.0%) | 0 (0.0%) |
| Food Preparation & Serving | 19 (27.9%) | 49 (72.1%) |
| Cleaning & Maintenance | 37 (56.1%) | 29 (43.9%) |
| Personal Care & Service | 0 (0.0%) | 10 (100.0%) |
| Total (Category) | 61 (34.7%) | 115 (65.3%) |
| Total (Overall) | 412 (46.1%) | 482 (53.9%) |
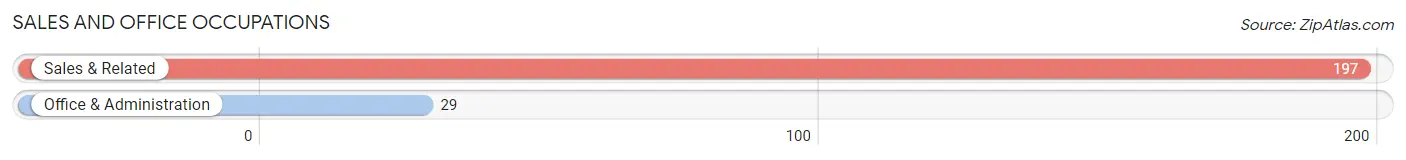
Sales and Office Occupations
The most common Sales and Office occupations in Arlington are Sales & Related (197 | 22.0%), and Office & Administration (29 | 3.2%).
Sales and Office Occupations by Sex
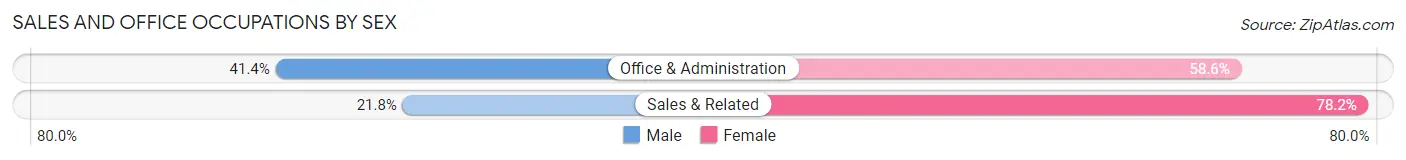
| Occupation | Male | Female |
| Sales & Related | 43 (21.8%) | 154 (78.2%) |
| Office & Administration | 12 (41.4%) | 17 (58.6%) |
| Total (Category) | 55 (24.3%) | 171 (75.7%) |
| Total (Overall) | 412 (46.1%) | 482 (53.9%) |
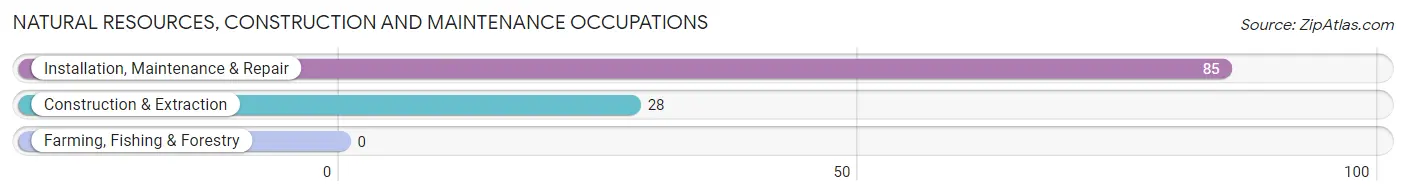
Natural Resources, Construction and Maintenance Occupations
The most common Natural Resources, Construction and Maintenance occupations in Arlington are Installation, Maintenance & Repair (85 | 9.5%), and Construction & Extraction (28 | 3.1%).
Natural Resources, Construction and Maintenance Occupations by Sex
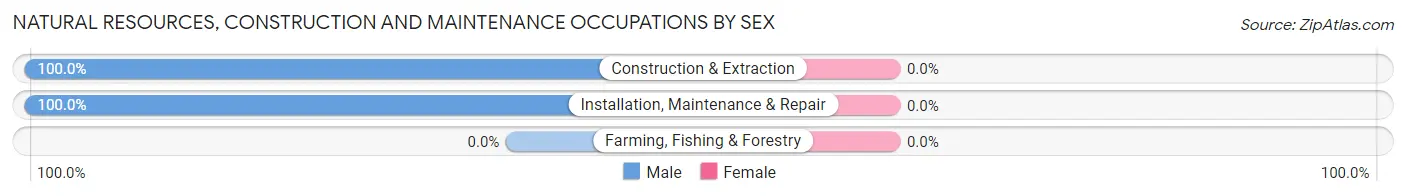
| Occupation | Male | Female |
| Farming, Fishing & Forestry | 0 (0.0%) | 0 (0.0%) |
| Construction & Extraction | 28 (100.0%) | 0 (0.0%) |
| Installation, Maintenance & Repair | 85 (100.0%) | 0 (0.0%) |
| Total (Category) | 113 (100.0%) | 0 (0.0%) |
| Total (Overall) | 412 (46.1%) | 482 (53.9%) |
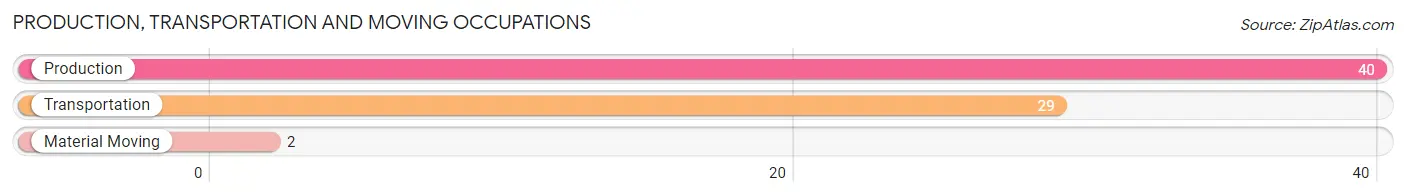
Production, Transportation and Moving Occupations
The most common Production, Transportation and Moving occupations in Arlington are Production (40 | 4.5%), Transportation (29 | 3.2%), and Material Moving (2 | 0.2%).
Production, Transportation and Moving Occupations by Sex
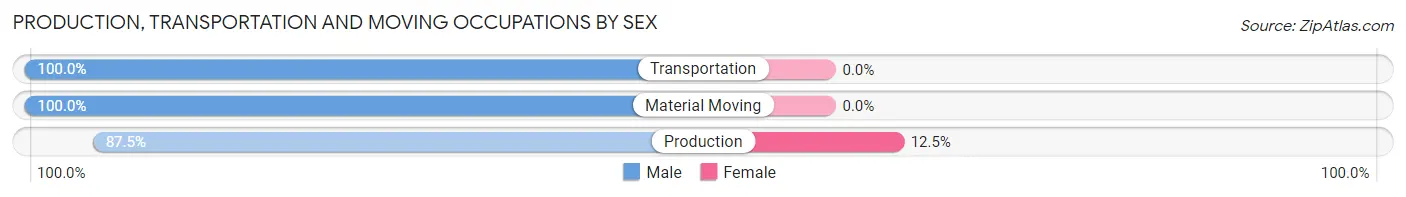
| Occupation | Male | Female |
| Production | 35 (87.5%) | 5 (12.5%) |
| Transportation | 29 (100.0%) | 0 (0.0%) |
| Material Moving | 2 (100.0%) | 0 (0.0%) |
| Total (Category) | 66 (93.0%) | 5 (7.0%) |
| Total (Overall) | 412 (46.1%) | 482 (53.9%) |
Employment Industries by Sex in Arlington
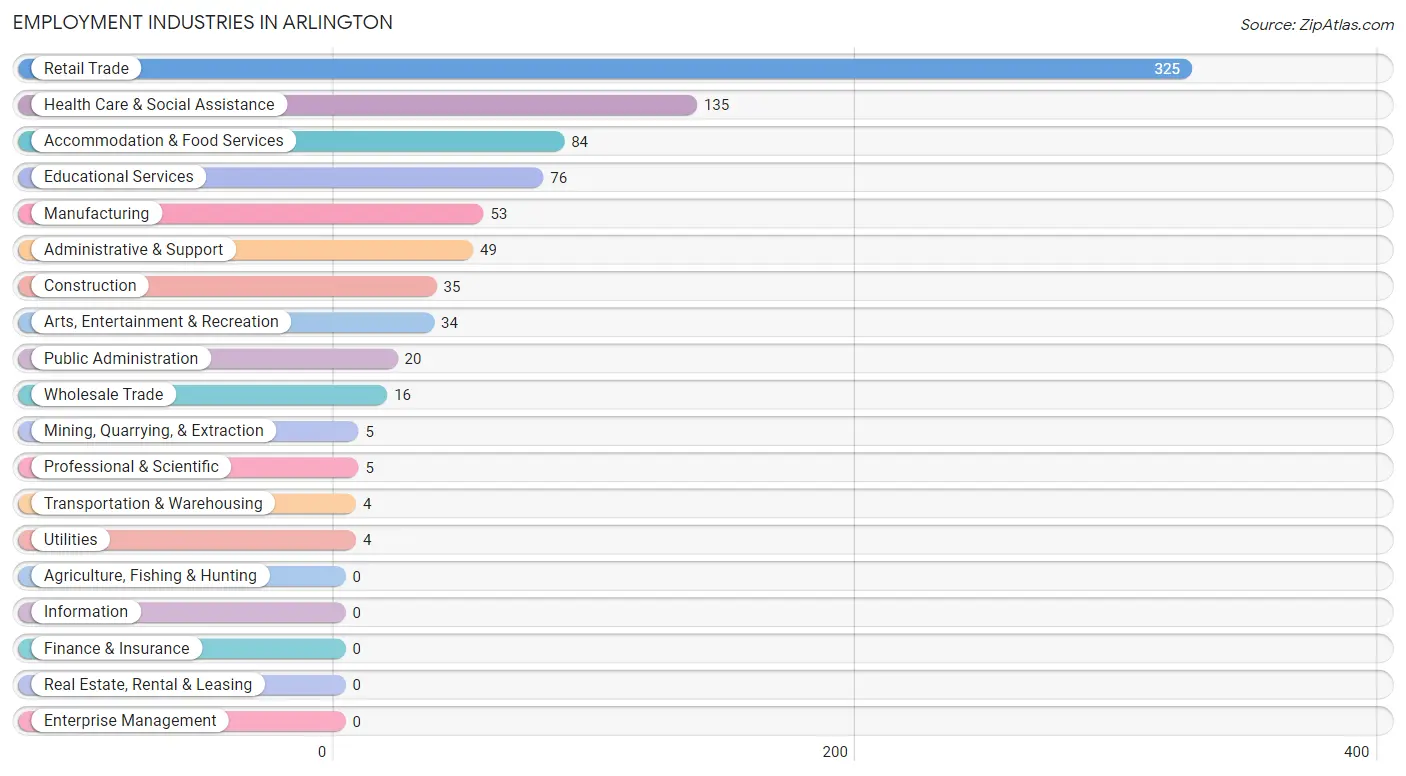
Employment Industries in Arlington
The major employment industries in Arlington include Retail Trade (325 | 36.3%), Health Care & Social Assistance (135 | 15.1%), Accommodation & Food Services (84 | 9.4%), Educational Services (76 | 8.5%), and Manufacturing (53 | 5.9%).
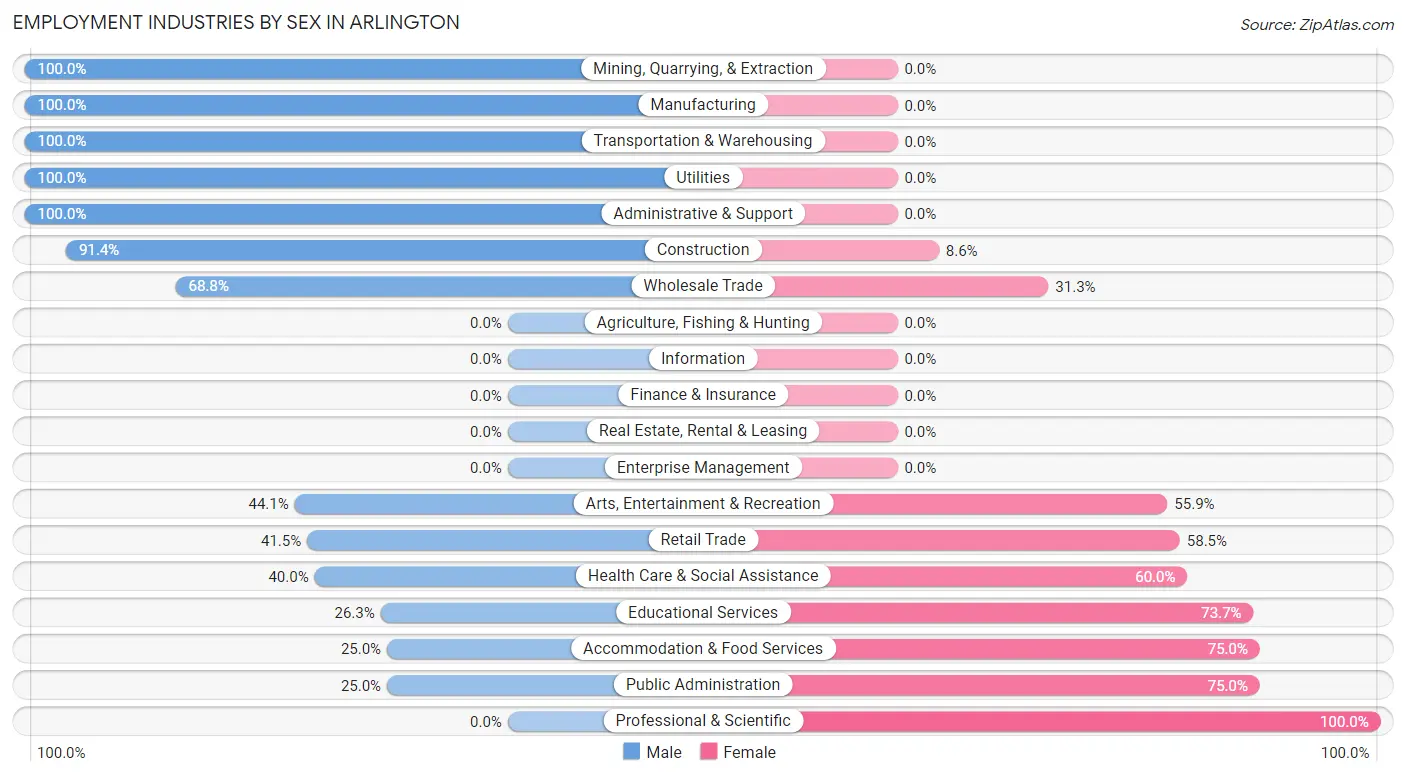
Employment Industries by Sex in Arlington
The Arlington industries that see more men than women are Mining, Quarrying, & Extraction (100.0%), Manufacturing (100.0%), and Transportation & Warehousing (100.0%), whereas the industries that tend to have a higher number of women are Professional & Scientific (100.0%), Accommodation & Food Services (75.0%), and Public Administration (75.0%).
| Industry | Male | Female |
| Agriculture, Fishing & Hunting | 0 (0.0%) | 0 (0.0%) |
| Mining, Quarrying, & Extraction | 5 (100.0%) | 0 (0.0%) |
| Construction | 32 (91.4%) | 3 (8.6%) |
| Manufacturing | 53 (100.0%) | 0 (0.0%) |
| Wholesale Trade | 11 (68.8%) | 5 (31.2%) |
| Retail Trade | 135 (41.5%) | 190 (58.5%) |
| Transportation & Warehousing | 4 (100.0%) | 0 (0.0%) |
| Utilities | 4 (100.0%) | 0 (0.0%) |
| Information | 0 (0.0%) | 0 (0.0%) |
| Finance & Insurance | 0 (0.0%) | 0 (0.0%) |
| Real Estate, Rental & Leasing | 0 (0.0%) | 0 (0.0%) |
| Professional & Scientific | 0 (0.0%) | 5 (100.0%) |
| Enterprise Management | 0 (0.0%) | 0 (0.0%) |
| Administrative & Support | 49 (100.0%) | 0 (0.0%) |
| Educational Services | 20 (26.3%) | 56 (73.7%) |
| Health Care & Social Assistance | 54 (40.0%) | 81 (60.0%) |
| Arts, Entertainment & Recreation | 15 (44.1%) | 19 (55.9%) |
| Accommodation & Food Services | 21 (25.0%) | 63 (75.0%) |
| Public Administration | 5 (25.0%) | 15 (75.0%) |
| Total | 412 (46.1%) | 482 (53.9%) |
Education in Arlington
School Enrollment in Arlington
The most common levels of schooling among the 449 students in Arlington are middle school (181 | 40.3%), elementary school (80 | 17.8%), and high school (64 | 14.2%).
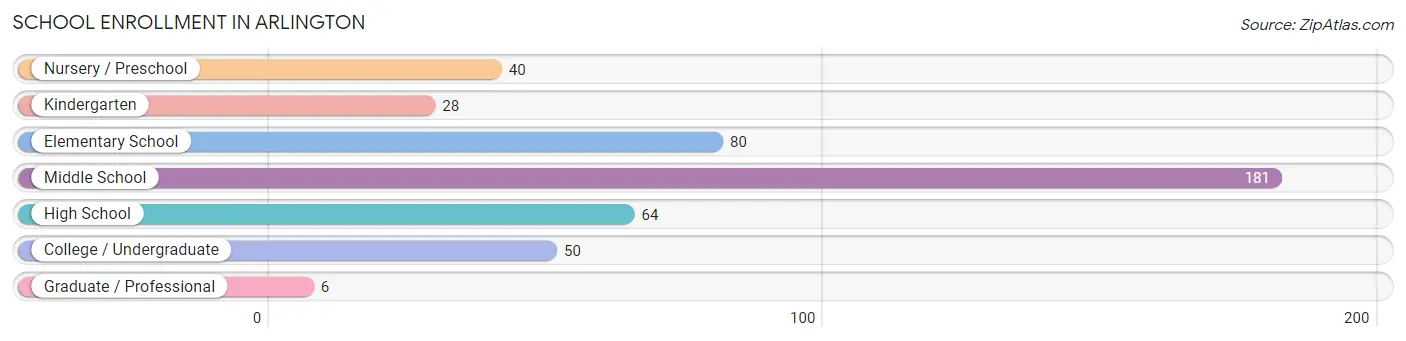
| School Level | # Students | % Students |
| Nursery / Preschool | 40 | 8.9% |
| Kindergarten | 28 | 6.2% |
| Elementary School | 80 | 17.8% |
| Middle School | 181 | 40.3% |
| High School | 64 | 14.2% |
| College / Undergraduate | 50 | 11.1% |
| Graduate / Professional | 6 | 1.3% |
| Total | 449 | 100.0% |
School Enrollment by Age by Funding Source in Arlington
Out of a total of 449 students who are enrolled in schools in Arlington, 162 (36.1%) attend a private institution, while the remaining 287 (63.9%) are enrolled in public schools. The age group of 20 to 24 year olds has the highest likelihood of being enrolled in private schools, with 21 (100.0% in the age bracket) enrolled. Conversely, the age group of 15 to 17 year olds has the lowest likelihood of being enrolled in a private school, with 30 (100.0% in the age bracket) attending a public institution.
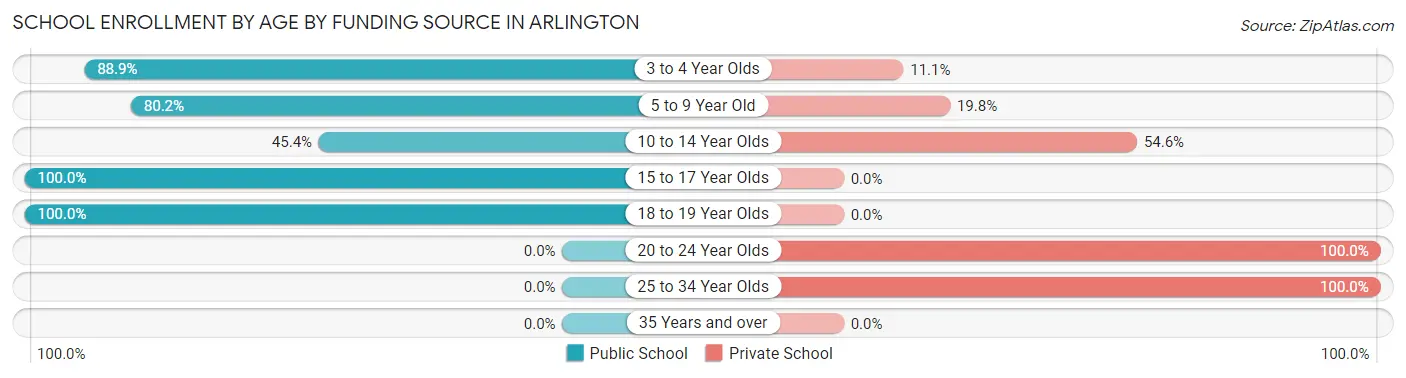
| Age Bracket | Public School | Private School |
| 3 to 4 Year Olds | 24 (88.9%) | 3 (11.1%) |
| 5 to 9 Year Old | 81 (80.2%) | 20 (19.8%) |
| 10 to 14 Year Olds | 93 (45.4%) | 112 (54.6%) |
| 15 to 17 Year Olds | 30 (100.0%) | 0 (0.0%) |
| 18 to 19 Year Olds | 59 (100.0%) | 0 (0.0%) |
| 20 to 24 Year Olds | 0 (0.0%) | 21 (100.0%) |
| 25 to 34 Year Olds | 0 (0.0%) | 6 (100.0%) |
| 35 Years and over | 0 (0.0%) | 0 (0.0%) |
| Total | 287 (63.9%) | 162 (36.1%) |
Educational Attainment by Field of Study in Arlington
Business (106 | 19.2%), visual & performing arts (90 | 16.3%), communications (88 | 16.0%), education (65 | 11.8%), and psychology (43 | 7.8%) are the most common fields of study among 551 individuals in Arlington who have obtained a bachelor's degree or higher.
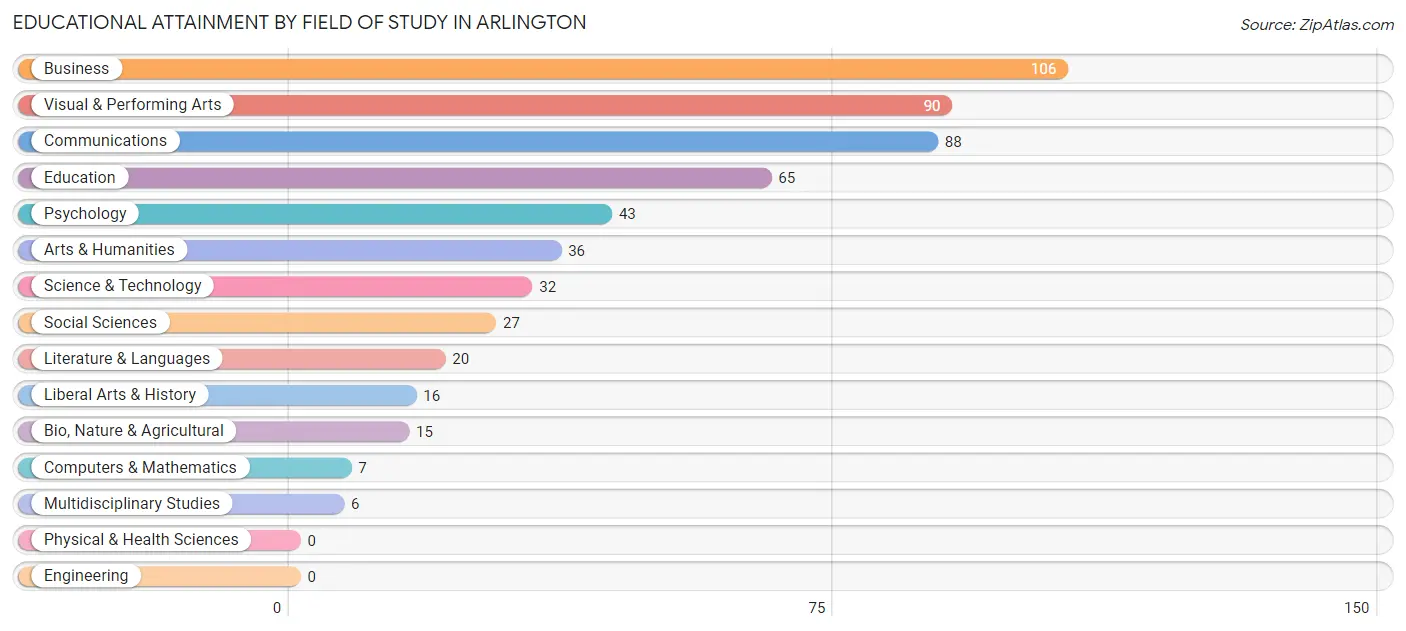
| Field of Study | # Graduates | % Graduates |
| Computers & Mathematics | 7 | 1.3% |
| Bio, Nature & Agricultural | 15 | 2.7% |
| Physical & Health Sciences | 0 | 0.0% |
| Psychology | 43 | 7.8% |
| Social Sciences | 27 | 4.9% |
| Engineering | 0 | 0.0% |
| Multidisciplinary Studies | 6 | 1.1% |
| Science & Technology | 32 | 5.8% |
| Business | 106 | 19.2% |
| Education | 65 | 11.8% |
| Literature & Languages | 20 | 3.6% |
| Liberal Arts & History | 16 | 2.9% |
| Visual & Performing Arts | 90 | 16.3% |
| Communications | 88 | 16.0% |
| Arts & Humanities | 36 | 6.5% |
| Total | 551 | 100.0% |
Transportation & Commute in Arlington
Vehicle Availability by Sex in Arlington
The most prevalent vehicle ownership categories in Arlington are males with 2 vehicles (174, accounting for 43.0%) and females with 2 vehicles (239, making up 37.1%).
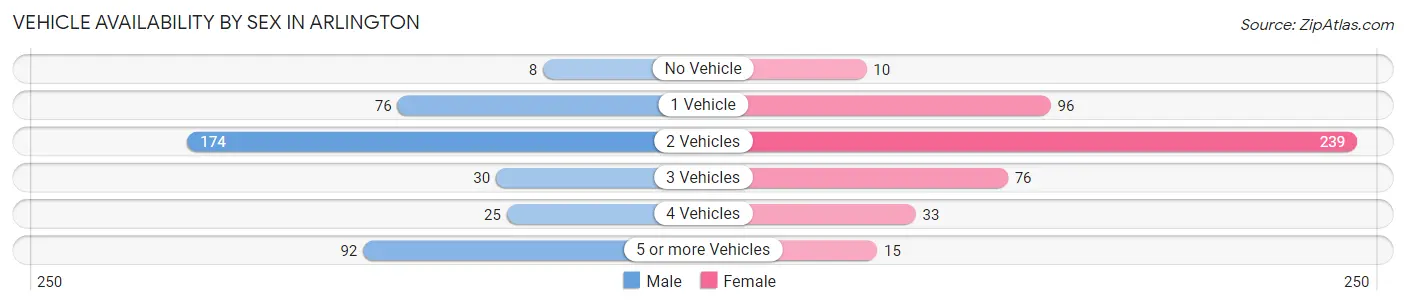
| Vehicles Available | Male | Female |
| No Vehicle | 8 (2.0%) | 10 (2.1%) |
| 1 Vehicle | 76 (18.8%) | 96 (20.5%) |
| 2 Vehicles | 174 (43.0%) | 239 (51.0%) |
| 3 Vehicles | 30 (7.4%) | 76 (16.2%) |
| 4 Vehicles | 25 (6.2%) | 33 (7.0%) |
| 5 or more Vehicles | 92 (22.7%) | 15 (3.2%) |
| Total | 405 (100.0%) | 469 (100.0%) |
Commute Time in Arlington
The most frequently occuring commute durations in Arlington are 20 to 24 minutes (249 commuters, 36.1%), 15 to 19 minutes (153 commuters, 22.2%), and less than 5 minutes (71 commuters, 10.3%).
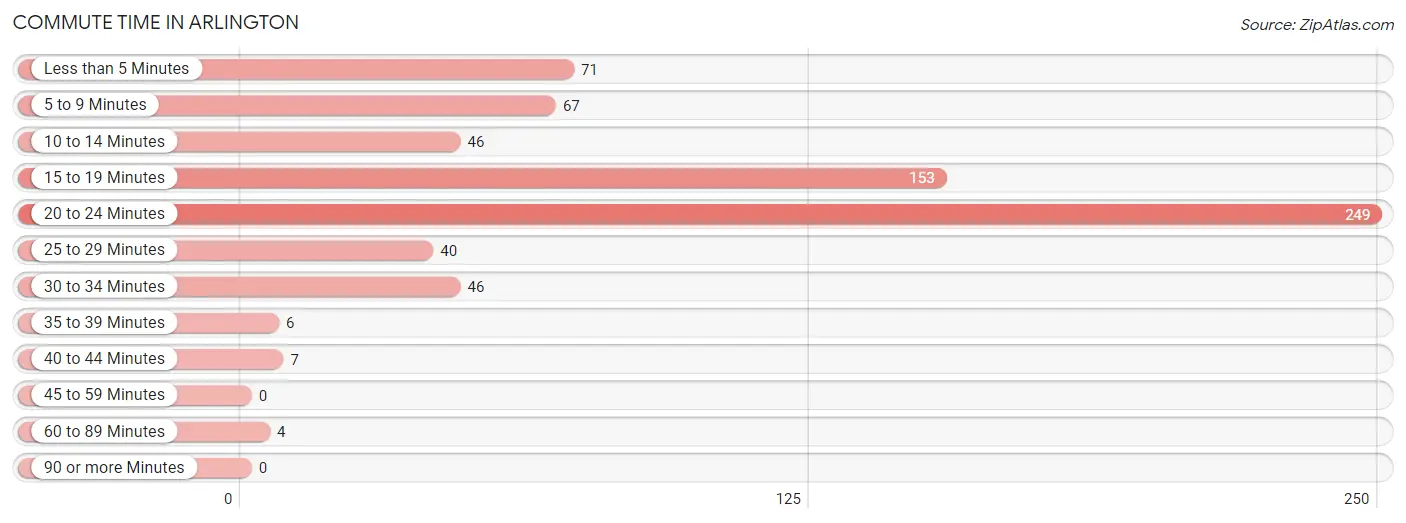
| Commute Time | # Commuters | % Commuters |
| Less than 5 Minutes | 71 | 10.3% |
| 5 to 9 Minutes | 67 | 9.7% |
| 10 to 14 Minutes | 46 | 6.7% |
| 15 to 19 Minutes | 153 | 22.2% |
| 20 to 24 Minutes | 249 | 36.1% |
| 25 to 29 Minutes | 40 | 5.8% |
| 30 to 34 Minutes | 46 | 6.7% |
| 35 to 39 Minutes | 6 | 0.9% |
| 40 to 44 Minutes | 7 | 1.0% |
| 45 to 59 Minutes | 0 | 0.0% |
| 60 to 89 Minutes | 4 | 0.6% |
| 90 or more Minutes | 0 | 0.0% |
Commute Time by Sex in Arlington
The most common commute times in Arlington are 20 to 24 minutes (105 commuters, 32.1%) for males and 20 to 24 minutes (144 commuters, 39.8%) for females.
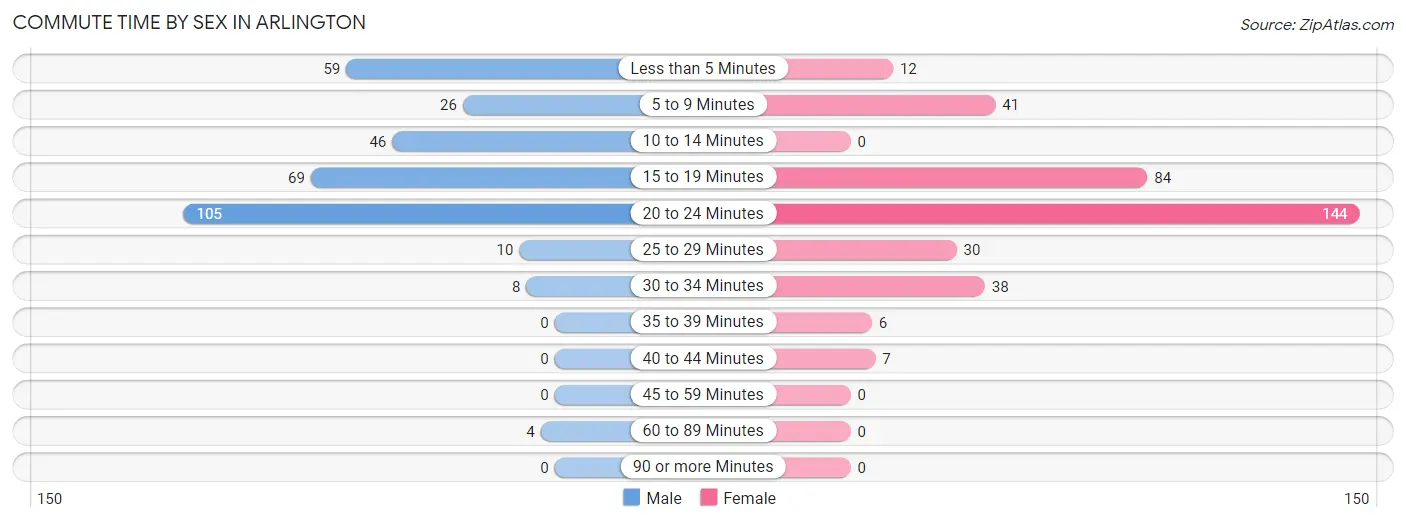
| Commute Time | Male | Female |
| Less than 5 Minutes | 59 (18.0%) | 12 (3.3%) |
| 5 to 9 Minutes | 26 (8.0%) | 41 (11.3%) |
| 10 to 14 Minutes | 46 (14.1%) | 0 (0.0%) |
| 15 to 19 Minutes | 69 (21.1%) | 84 (23.2%) |
| 20 to 24 Minutes | 105 (32.1%) | 144 (39.8%) |
| 25 to 29 Minutes | 10 (3.1%) | 30 (8.3%) |
| 30 to 34 Minutes | 8 (2.5%) | 38 (10.5%) |
| 35 to 39 Minutes | 0 (0.0%) | 6 (1.7%) |
| 40 to 44 Minutes | 0 (0.0%) | 7 (1.9%) |
| 45 to 59 Minutes | 0 (0.0%) | 0 (0.0%) |
| 60 to 89 Minutes | 4 (1.2%) | 0 (0.0%) |
| 90 or more Minutes | 0 (0.0%) | 0 (0.0%) |
Time of Departure to Work by Sex in Arlington
The most frequent times of departure to work in Arlington are 6:30 AM to 6:59 AM (111, 33.9%) for males and 7:30 AM to 7:59 AM (80, 22.1%) for females.
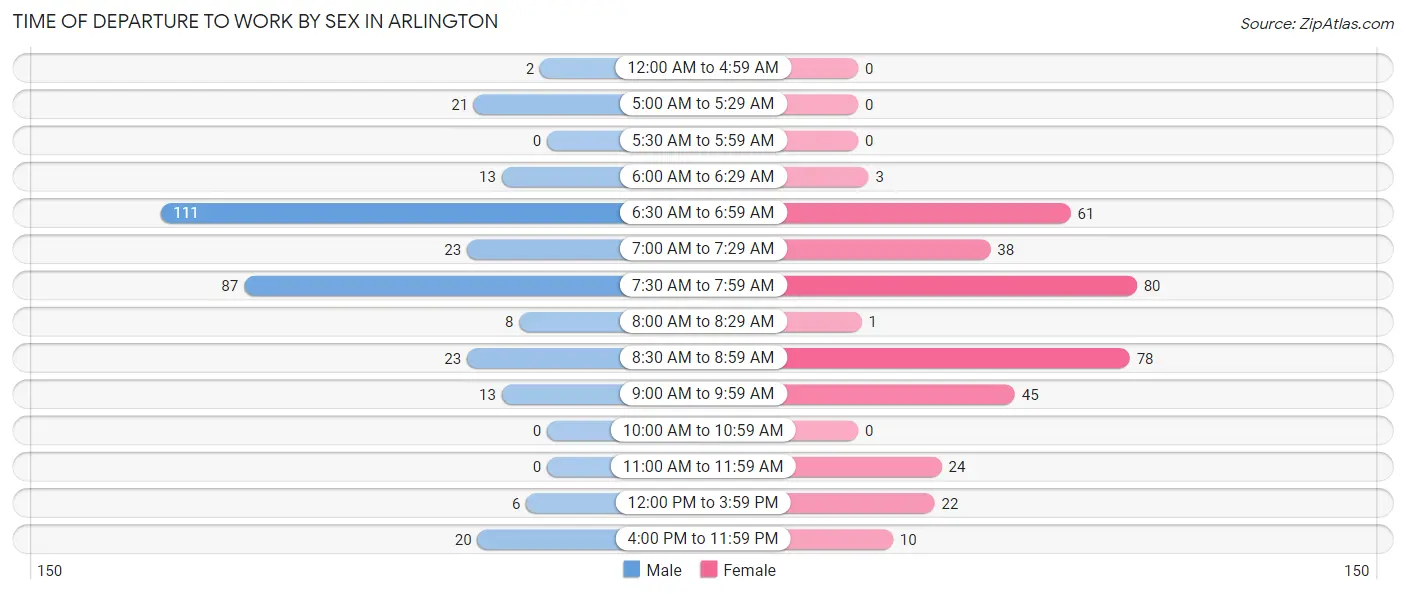
| Time of Departure | Male | Female |
| 12:00 AM to 4:59 AM | 2 (0.6%) | 0 (0.0%) |
| 5:00 AM to 5:29 AM | 21 (6.4%) | 0 (0.0%) |
| 5:30 AM to 5:59 AM | 0 (0.0%) | 0 (0.0%) |
| 6:00 AM to 6:29 AM | 13 (4.0%) | 3 (0.8%) |
| 6:30 AM to 6:59 AM | 111 (33.9%) | 61 (16.9%) |
| 7:00 AM to 7:29 AM | 23 (7.0%) | 38 (10.5%) |
| 7:30 AM to 7:59 AM | 87 (26.6%) | 80 (22.1%) |
| 8:00 AM to 8:29 AM | 8 (2.5%) | 1 (0.3%) |
| 8:30 AM to 8:59 AM | 23 (7.0%) | 78 (21.5%) |
| 9:00 AM to 9:59 AM | 13 (4.0%) | 45 (12.4%) |
| 10:00 AM to 10:59 AM | 0 (0.0%) | 0 (0.0%) |
| 11:00 AM to 11:59 AM | 0 (0.0%) | 24 (6.6%) |
| 12:00 PM to 3:59 PM | 6 (1.8%) | 22 (6.1%) |
| 4:00 PM to 11:59 PM | 20 (6.1%) | 10 (2.8%) |
| Total | 327 (100.0%) | 362 (100.0%) |
Housing Occupancy in Arlington
Occupancy by Ownership in Arlington
Of the total 588 dwellings in Arlington, owner-occupied units account for 439 (74.7%), while renter-occupied units make up 149 (25.3%).
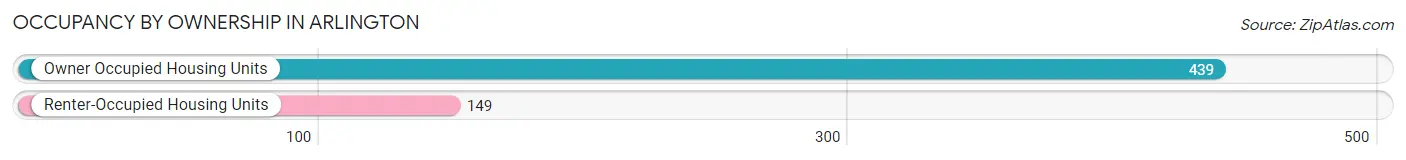
| Occupancy | # Housing Units | % Housing Units |
| Owner Occupied Housing Units | 439 | 74.7% |
| Renter-Occupied Housing Units | 149 | 25.3% |
| Total Occupied Housing Units | 588 | 100.0% |
Occupancy by Household Size in Arlington
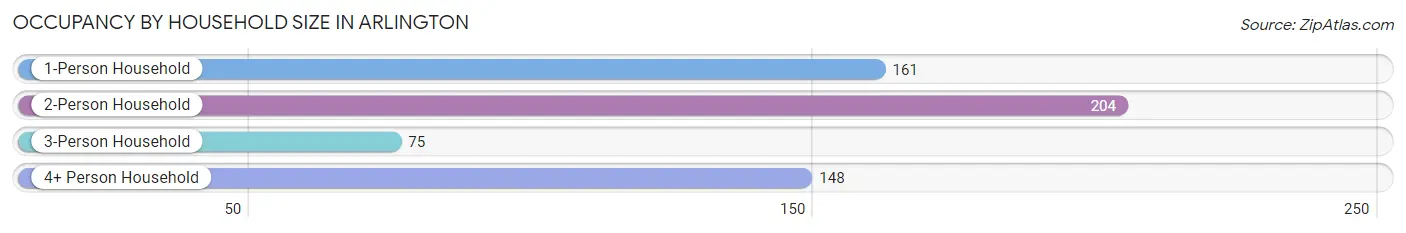
| Household Size | # Housing Units | % Housing Units |
| 1-Person Household | 161 | 27.4% |
| 2-Person Household | 204 | 34.7% |
| 3-Person Household | 75 | 12.8% |
| 4+ Person Household | 148 | 25.2% |
| Total Housing Units | 588 | 100.0% |
Occupancy by Ownership by Household Size in Arlington
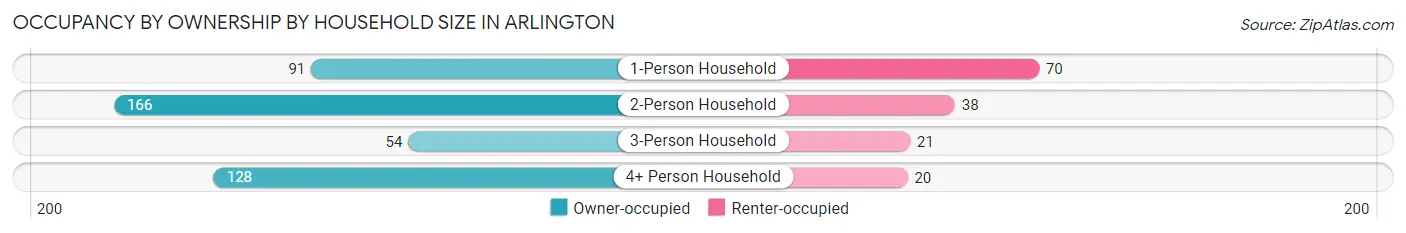
| Household Size | Owner-occupied | Renter-occupied |
| 1-Person Household | 91 (56.5%) | 70 (43.5%) |
| 2-Person Household | 166 (81.4%) | 38 (18.6%) |
| 3-Person Household | 54 (72.0%) | 21 (28.0%) |
| 4+ Person Household | 128 (86.5%) | 20 (13.5%) |
| Total Housing Units | 439 (74.7%) | 149 (25.3%) |
Occupancy by Educational Attainment in Arlington
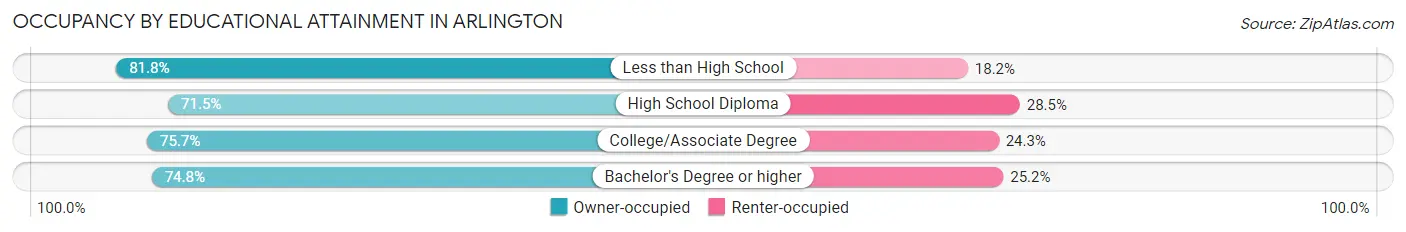
| Household Size | Owner-occupied | Renter-occupied |
| Less than High School | 27 (81.8%) | 6 (18.2%) |
| High School Diploma | 103 (71.5%) | 41 (28.5%) |
| College/Associate Degree | 134 (75.7%) | 43 (24.3%) |
| Bachelor's Degree or higher | 175 (74.8%) | 59 (25.2%) |
Occupancy by Age of Householder in Arlington
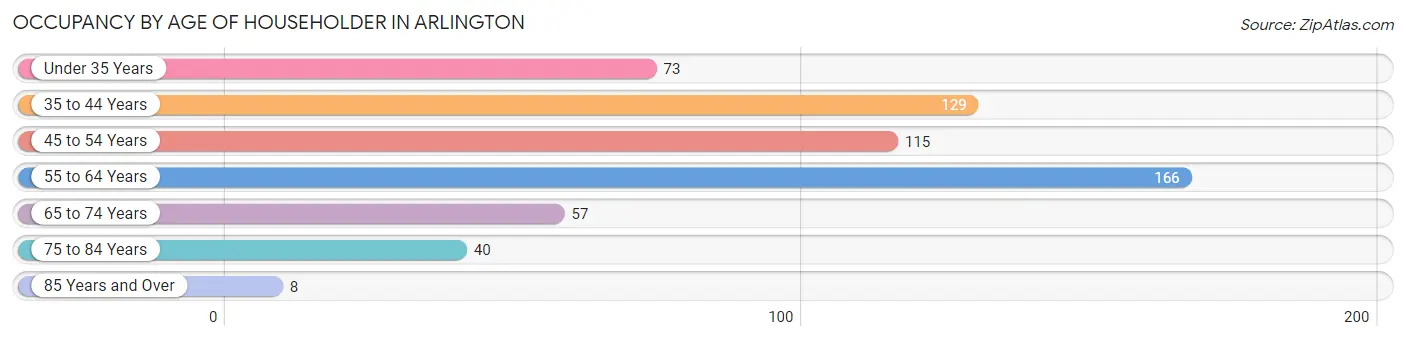
| Age Bracket | # Households | % Households |
| Under 35 Years | 73 | 12.4% |
| 35 to 44 Years | 129 | 21.9% |
| 45 to 54 Years | 115 | 19.6% |
| 55 to 64 Years | 166 | 28.2% |
| 65 to 74 Years | 57 | 9.7% |
| 75 to 84 Years | 40 | 6.8% |
| 85 Years and Over | 8 | 1.4% |
| Total | 588 | 100.0% |
Housing Finances in Arlington
Median Income by Occupancy in Arlington
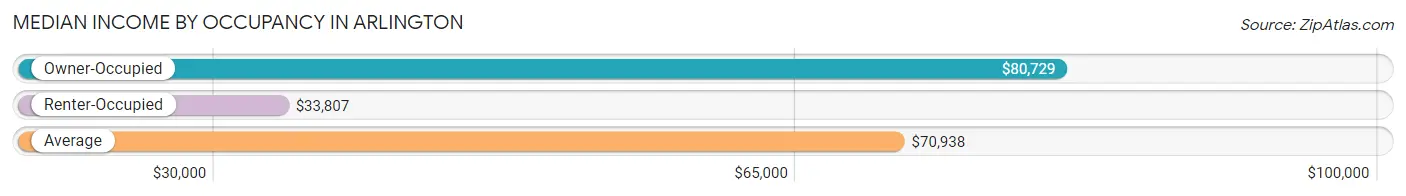
| Occupancy Type | # Households | Median Income |
| Owner-Occupied | 439 (74.7%) | $80,729 |
| Renter-Occupied | 149 (25.3%) | $33,807 |
| Average | 588 (100.0%) | $70,938 |
Occupancy by Householder Income Bracket in Arlington
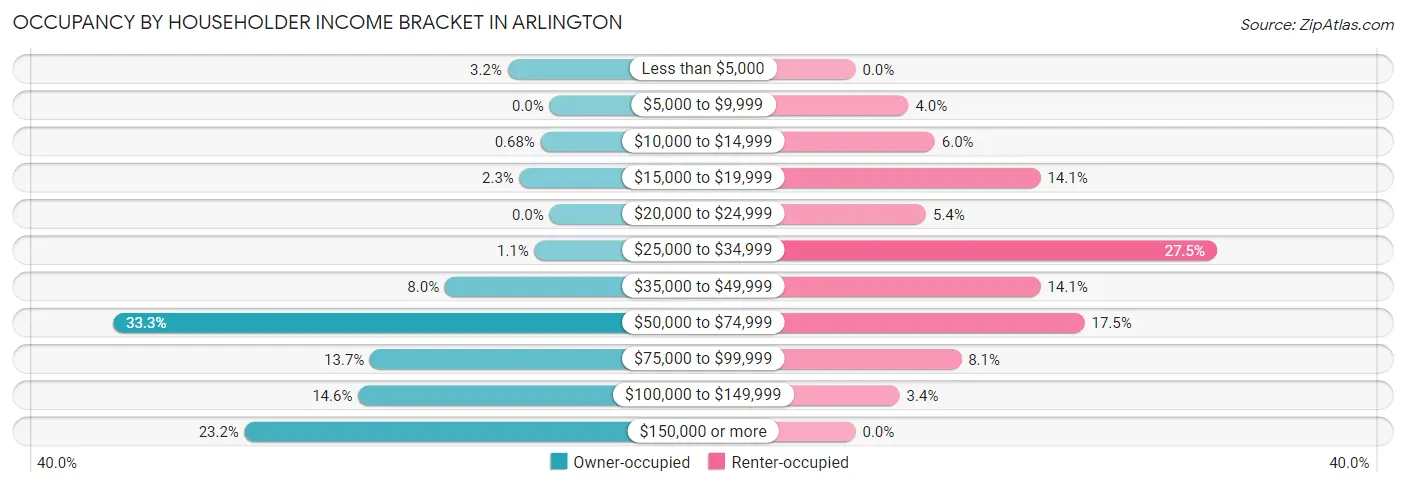
| Income Bracket | Owner-occupied | Renter-occupied |
| Less than $5,000 | 14 (3.2%) | 0 (0.0%) |
| $5,000 to $9,999 | 0 (0.0%) | 6 (4.0%) |
| $10,000 to $14,999 | 3 (0.7%) | 9 (6.0%) |
| $15,000 to $19,999 | 10 (2.3%) | 21 (14.1%) |
| $20,000 to $24,999 | 0 (0.0%) | 8 (5.4%) |
| $25,000 to $34,999 | 5 (1.1%) | 41 (27.5%) |
| $35,000 to $49,999 | 35 (8.0%) | 21 (14.1%) |
| $50,000 to $74,999 | 146 (33.3%) | 26 (17.4%) |
| $75,000 to $99,999 | 60 (13.7%) | 12 (8.1%) |
| $100,000 to $149,999 | 64 (14.6%) | 5 (3.4%) |
| $150,000 or more | 102 (23.2%) | 0 (0.0%) |
| Total | 439 (100.0%) | 149 (100.0%) |
Monthly Housing Cost Tiers in Arlington
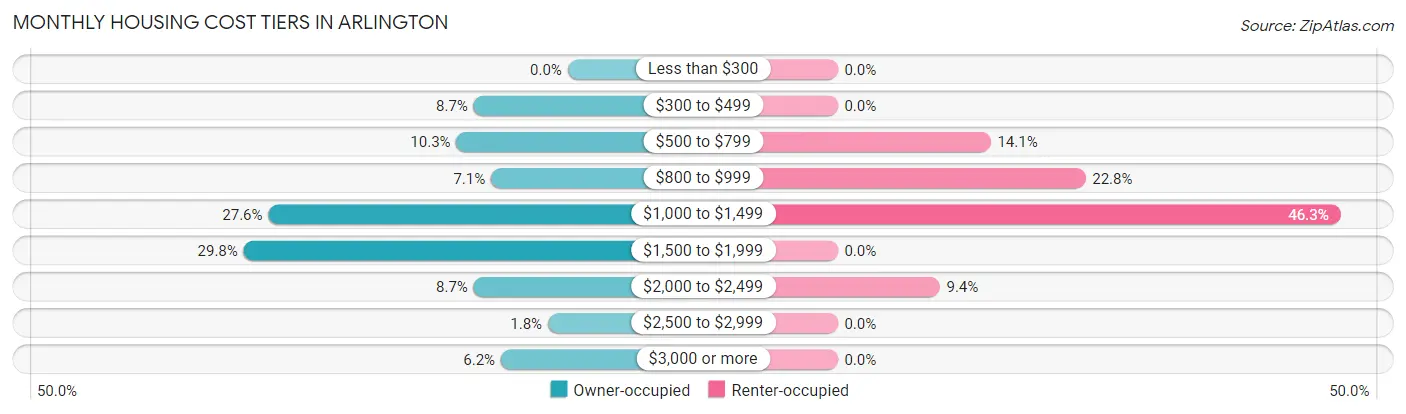
| Monthly Cost | Owner-occupied | Renter-occupied |
| Less than $300 | 0 (0.0%) | 0 (0.0%) |
| $300 to $499 | 38 (8.7%) | 0 (0.0%) |
| $500 to $799 | 45 (10.2%) | 21 (14.1%) |
| $800 to $999 | 31 (7.1%) | 34 (22.8%) |
| $1,000 to $1,499 | 121 (27.6%) | 69 (46.3%) |
| $1,500 to $1,999 | 131 (29.8%) | 0 (0.0%) |
| $2,000 to $2,499 | 38 (8.7%) | 14 (9.4%) |
| $2,500 to $2,999 | 8 (1.8%) | 0 (0.0%) |
| $3,000 or more | 27 (6.1%) | 0 (0.0%) |
| Total | 439 (100.0%) | 149 (100.0%) |
Physical Housing Characteristics in Arlington
Housing Structures in Arlington
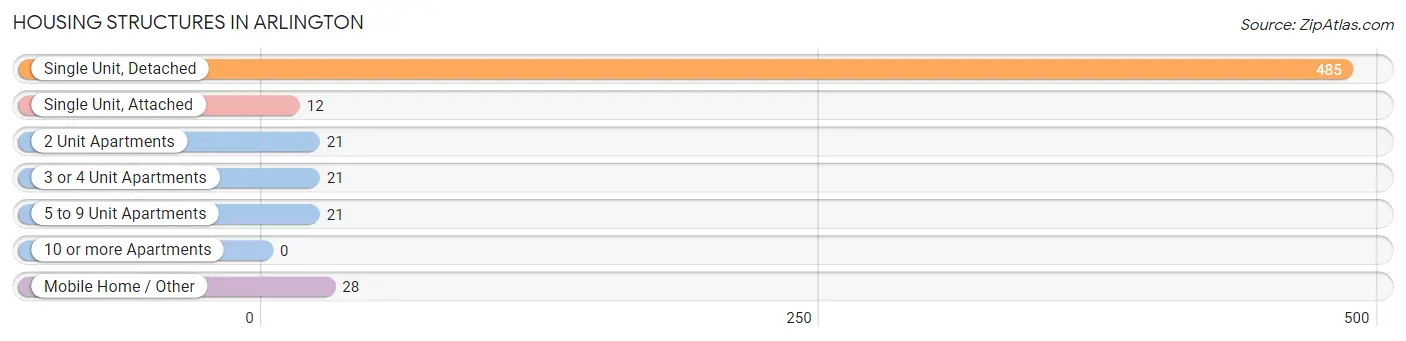
| Structure Type | # Housing Units | % Housing Units |
| Single Unit, Detached | 485 | 82.5% |
| Single Unit, Attached | 12 | 2.0% |
| 2 Unit Apartments | 21 | 3.6% |
| 3 or 4 Unit Apartments | 21 | 3.6% |
| 5 to 9 Unit Apartments | 21 | 3.6% |
| 10 or more Apartments | 0 | 0.0% |
| Mobile Home / Other | 28 | 4.8% |
| Total | 588 | 100.0% |
Housing Structures by Occupancy in Arlington
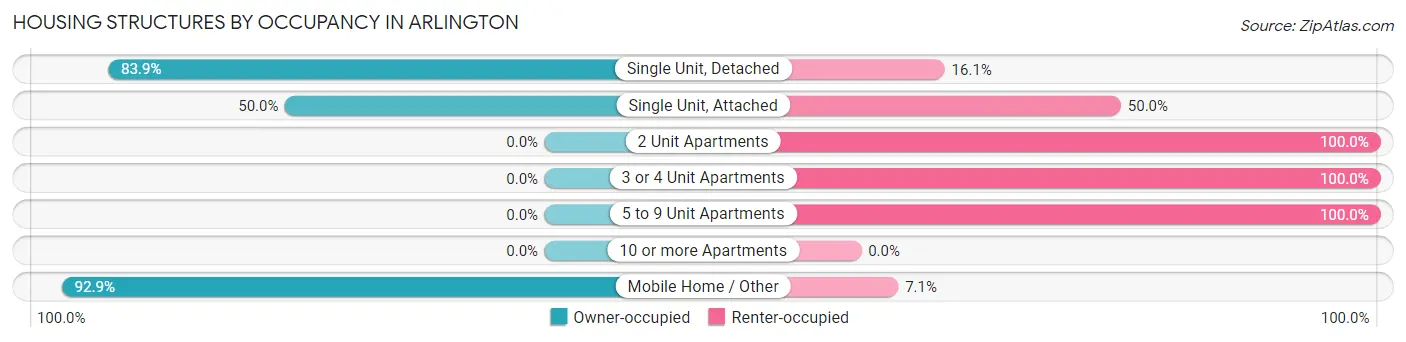
| Structure Type | Owner-occupied | Renter-occupied |
| Single Unit, Detached | 407 (83.9%) | 78 (16.1%) |
| Single Unit, Attached | 6 (50.0%) | 6 (50.0%) |
| 2 Unit Apartments | 0 (0.0%) | 21 (100.0%) |
| 3 or 4 Unit Apartments | 0 (0.0%) | 21 (100.0%) |
| 5 to 9 Unit Apartments | 0 (0.0%) | 21 (100.0%) |
| 10 or more Apartments | 0 (0.0%) | 0 (0.0%) |
| Mobile Home / Other | 26 (92.9%) | 2 (7.1%) |
| Total | 439 (74.7%) | 149 (25.3%) |
Housing Structures by Number of Rooms in Arlington
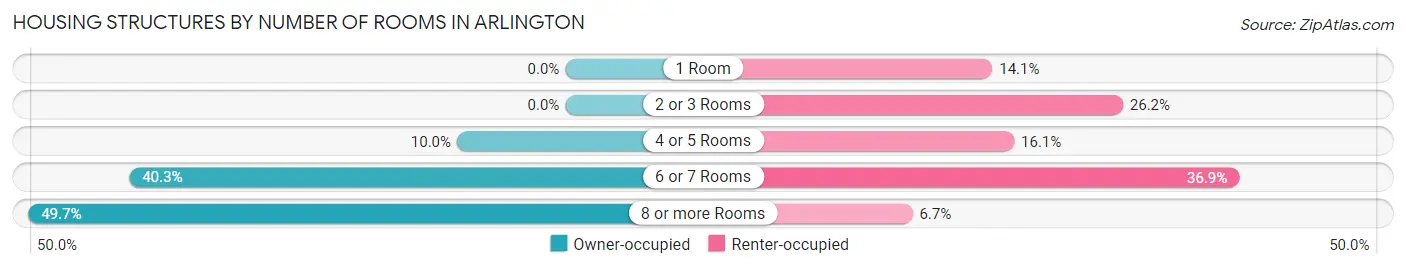
| Number of Rooms | Owner-occupied | Renter-occupied |
| 1 Room | 0 (0.0%) | 21 (14.1%) |
| 2 or 3 Rooms | 0 (0.0%) | 39 (26.2%) |
| 4 or 5 Rooms | 44 (10.0%) | 24 (16.1%) |
| 6 or 7 Rooms | 177 (40.3%) | 55 (36.9%) |
| 8 or more Rooms | 218 (49.7%) | 10 (6.7%) |
| Total | 439 (100.0%) | 149 (100.0%) |
Housing Structure by Heating Type in Arlington
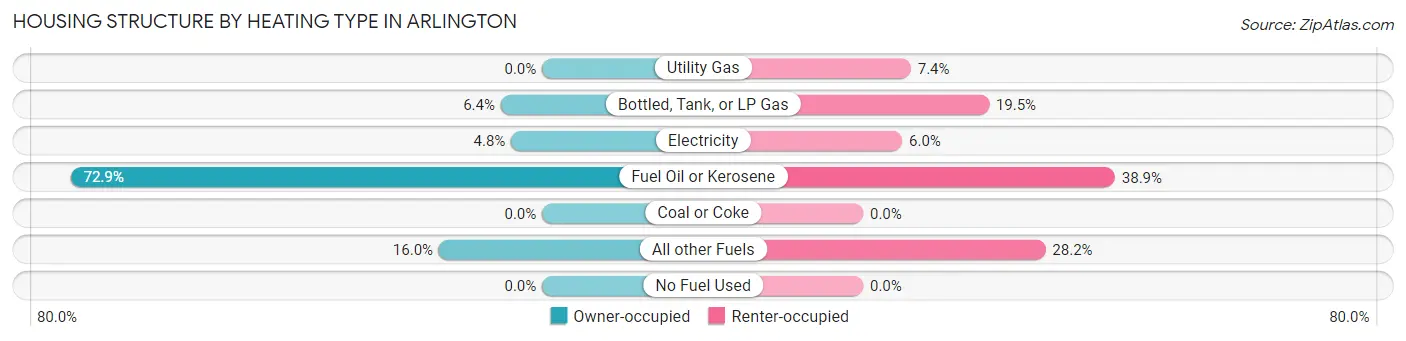
| Heating Type | Owner-occupied | Renter-occupied |
| Utility Gas | 0 (0.0%) | 11 (7.4%) |
| Bottled, Tank, or LP Gas | 28 (6.4%) | 29 (19.5%) |
| Electricity | 21 (4.8%) | 9 (6.0%) |
| Fuel Oil or Kerosene | 320 (72.9%) | 58 (38.9%) |
| Coal or Coke | 0 (0.0%) | 0 (0.0%) |
| All other Fuels | 70 (16.0%) | 42 (28.2%) |
| No Fuel Used | 0 (0.0%) | 0 (0.0%) |
| Total | 439 (100.0%) | 149 (100.0%) |
Household Vehicle Usage in Arlington
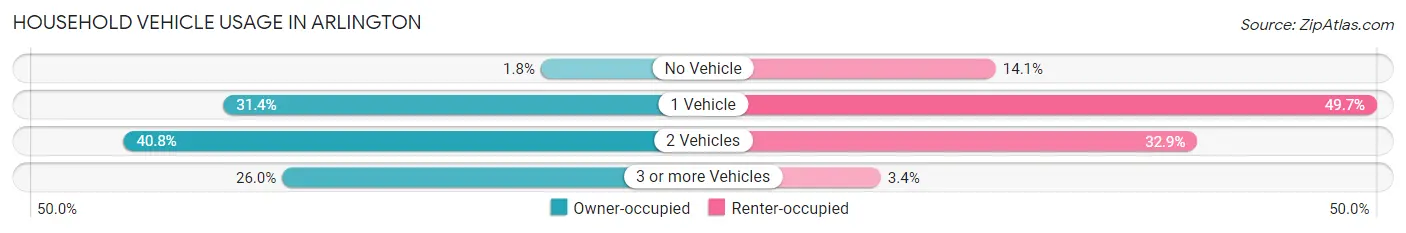
| Vehicles per Household | Owner-occupied | Renter-occupied |
| No Vehicle | 8 (1.8%) | 21 (14.1%) |
| 1 Vehicle | 138 (31.4%) | 74 (49.7%) |
| 2 Vehicles | 179 (40.8%) | 49 (32.9%) |
| 3 or more Vehicles | 114 (26.0%) | 5 (3.4%) |
| Total | 439 (100.0%) | 149 (100.0%) |
Real Estate & Mortgages in Arlington
Real Estate and Mortgage Overview in Arlington
| Characteristic | Without Mortgage | With Mortgage |
| Housing Units | 112 | 327 |
| Median Property Value | $183,300 | $217,500 |
| Median Household Income | $67,800 | $85 |
| Monthly Housing Costs | $618 | $27 |
| Real Estate Taxes | $2,857 | $0 |
Property Value by Mortgage Status in Arlington
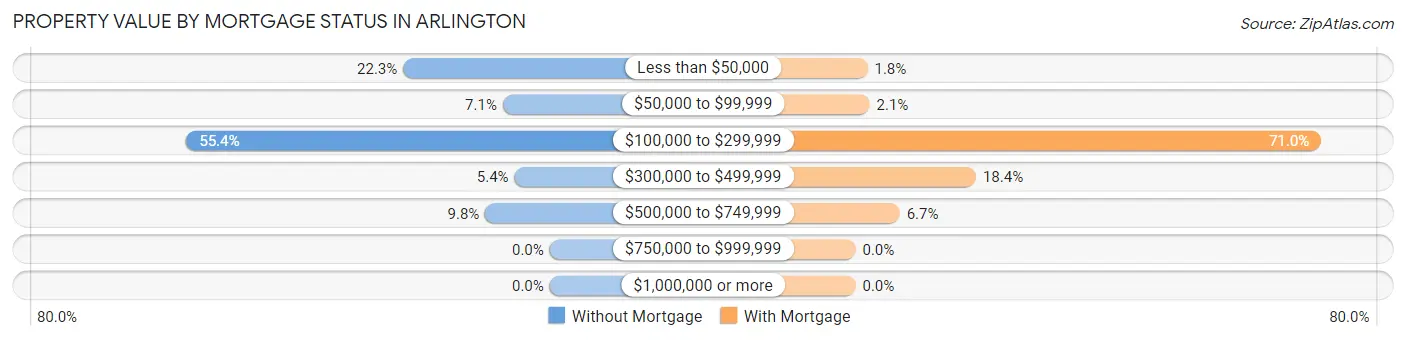
| Property Value | Without Mortgage | With Mortgage |
| Less than $50,000 | 25 (22.3%) | 6 (1.8%) |
| $50,000 to $99,999 | 8 (7.1%) | 7 (2.1%) |
| $100,000 to $299,999 | 62 (55.4%) | 232 (71.0%) |
| $300,000 to $499,999 | 6 (5.4%) | 60 (18.3%) |
| $500,000 to $749,999 | 11 (9.8%) | 22 (6.7%) |
| $750,000 to $999,999 | 0 (0.0%) | 0 (0.0%) |
| $1,000,000 or more | 0 (0.0%) | 0 (0.0%) |
| Total | 112 (100.0%) | 327 (100.0%) |
Household Income by Mortgage Status in Arlington
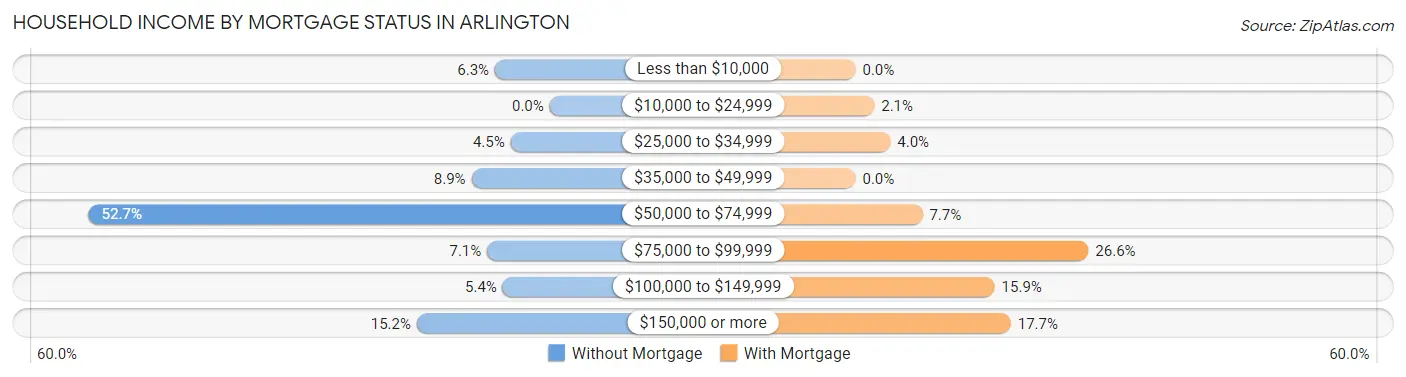
| Household Income | Without Mortgage | With Mortgage |
| Less than $10,000 | 7 (6.2%) | 0 (0.0%) |
| $10,000 to $24,999 | 0 (0.0%) | 7 (2.1%) |
| $25,000 to $34,999 | 5 (4.5%) | 13 (4.0%) |
| $35,000 to $49,999 | 10 (8.9%) | 0 (0.0%) |
| $50,000 to $74,999 | 59 (52.7%) | 25 (7.6%) |
| $75,000 to $99,999 | 8 (7.1%) | 87 (26.6%) |
| $100,000 to $149,999 | 6 (5.4%) | 52 (15.9%) |
| $150,000 or more | 17 (15.2%) | 58 (17.7%) |
| Total | 112 (100.0%) | 327 (100.0%) |
Property Value to Household Income Ratio in Arlington
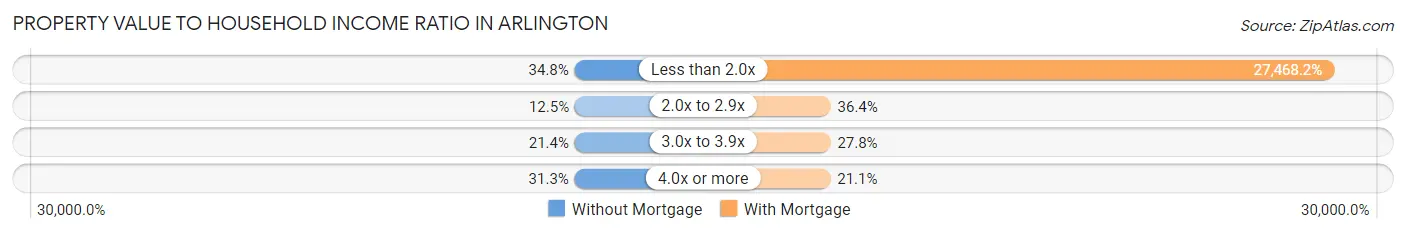
| Value-to-Income Ratio | Without Mortgage | With Mortgage |
| Less than 2.0x | 39 (34.8%) | 89,821 (27,468.2%) |
| 2.0x to 2.9x | 14 (12.5%) | 119 (36.4%) |
| 3.0x to 3.9x | 24 (21.4%) | 91 (27.8%) |
| 4.0x or more | 35 (31.2%) | 69 (21.1%) |
| Total | 112 (100.0%) | 327 (100.0%) |
Real Estate Taxes by Mortgage Status in Arlington
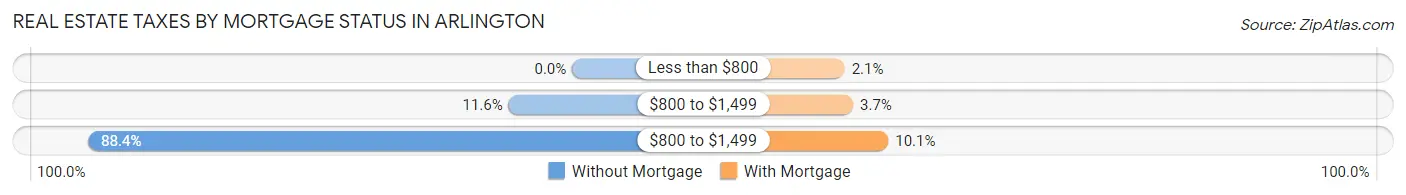
| Property Taxes | Without Mortgage | With Mortgage |
| Less than $800 | 0 (0.0%) | 7 (2.1%) |
| $800 to $1,499 | 13 (11.6%) | 12 (3.7%) |
| $800 to $1,499 | 99 (88.4%) | 33 (10.1%) |
| Total | 112 (100.0%) | 327 (100.0%) |
Health & Disability in Arlington
Health Insurance Coverage by Age in Arlington
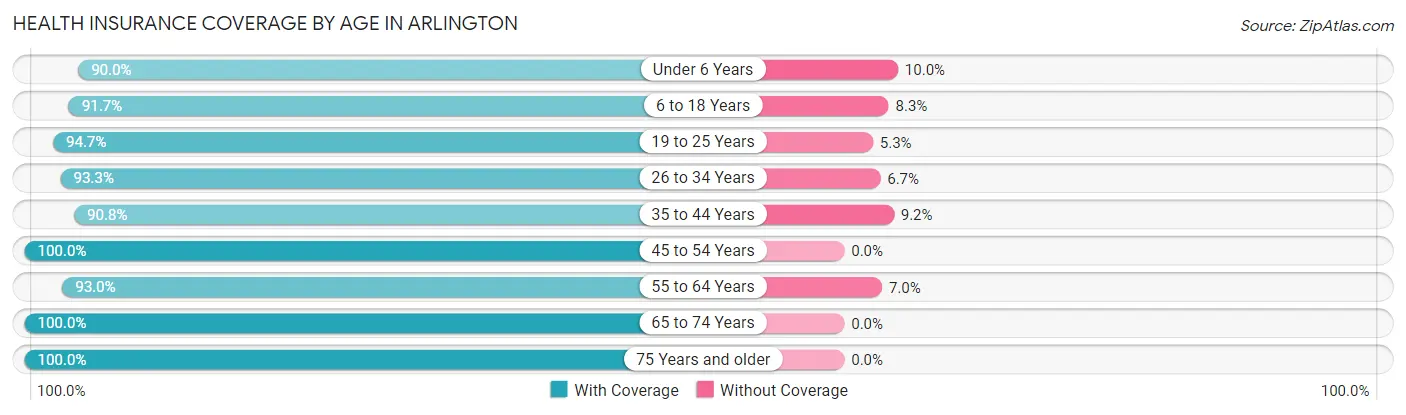
| Age Bracket | With Coverage | Without Coverage |
| Under 6 Years | 126 (90.0%) | 14 (10.0%) |
| 6 to 18 Years | 311 (91.7%) | 28 (8.3%) |
| 19 to 25 Years | 178 (94.7%) | 10 (5.3%) |
| 26 to 34 Years | 139 (93.3%) | 10 (6.7%) |
| 35 to 44 Years | 295 (90.8%) | 30 (9.2%) |
| 45 to 54 Years | 173 (100.0%) | 0 (0.0%) |
| 55 to 64 Years | 238 (93.0%) | 18 (7.0%) |
| 65 to 74 Years | 131 (100.0%) | 0 (0.0%) |
| 75 Years and older | 80 (100.0%) | 0 (0.0%) |
| Total | 1,671 (93.8%) | 110 (6.2%) |
Health Insurance Coverage by Citizenship Status in Arlington
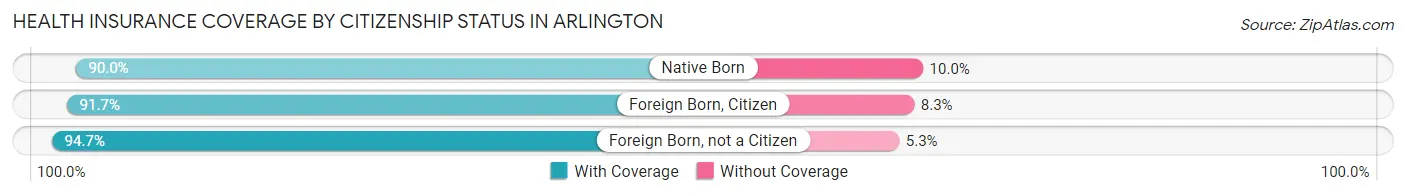
| Citizenship Status | With Coverage | Without Coverage |
| Native Born | 126 (90.0%) | 14 (10.0%) |
| Foreign Born, Citizen | 311 (91.7%) | 28 (8.3%) |
| Foreign Born, not a Citizen | 178 (94.7%) | 10 (5.3%) |
Health Insurance Coverage by Household Income in Arlington
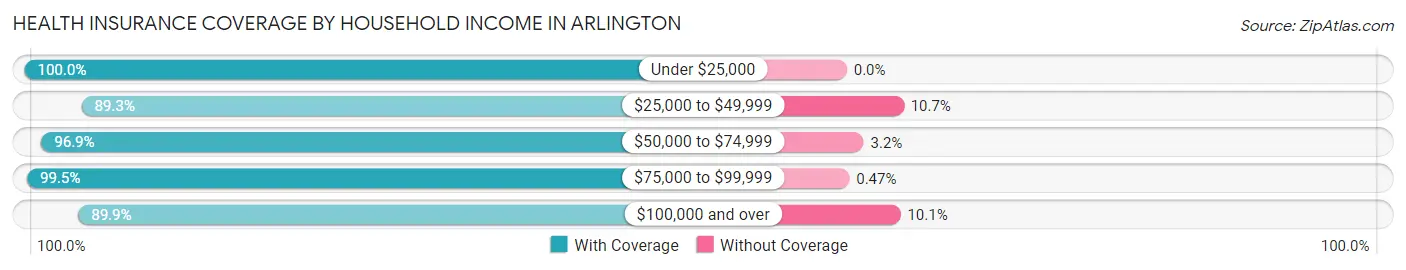
| Household Income | With Coverage | Without Coverage |
| Under $25,000 | 145 (100.0%) | 0 (0.0%) |
| $25,000 to $49,999 | 176 (89.3%) | 21 (10.7%) |
| $50,000 to $74,999 | 492 (96.9%) | 16 (3.2%) |
| $75,000 to $99,999 | 214 (99.5%) | 1 (0.5%) |
| $100,000 and over | 644 (89.9%) | 72 (10.1%) |
Public vs Private Health Insurance Coverage by Age in Arlington
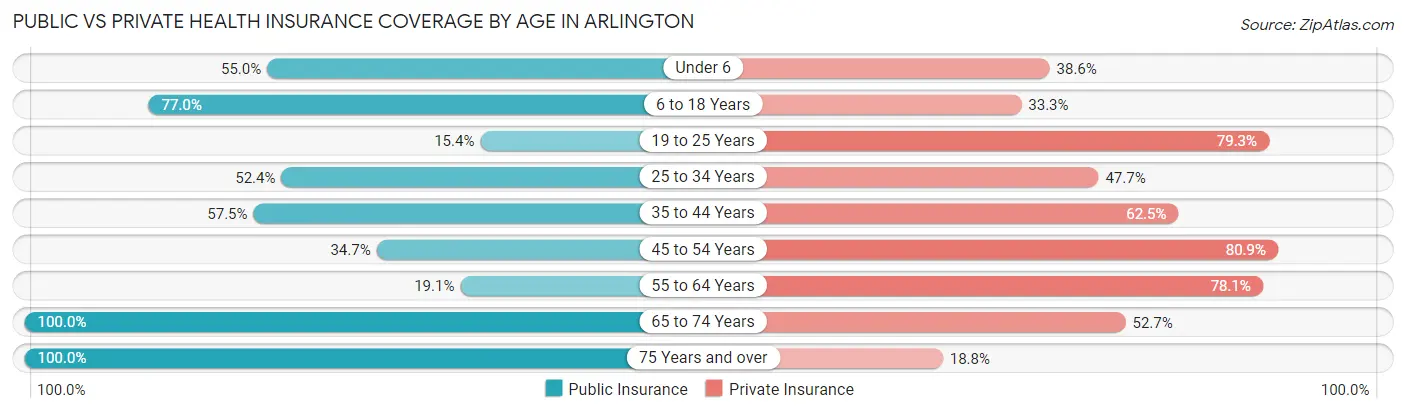
| Age Bracket | Public Insurance | Private Insurance |
| Under 6 | 77 (55.0%) | 54 (38.6%) |
| 6 to 18 Years | 261 (77.0%) | 113 (33.3%) |
| 19 to 25 Years | 29 (15.4%) | 149 (79.3%) |
| 25 to 34 Years | 78 (52.3%) | 71 (47.6%) |
| 35 to 44 Years | 187 (57.5%) | 203 (62.5%) |
| 45 to 54 Years | 60 (34.7%) | 140 (80.9%) |
| 55 to 64 Years | 49 (19.1%) | 200 (78.1%) |
| 65 to 74 Years | 131 (100.0%) | 69 (52.7%) |
| 75 Years and over | 80 (100.0%) | 15 (18.8%) |
| Total | 952 (53.4%) | 1,014 (56.9%) |
Disability Status by Sex by Age in Arlington
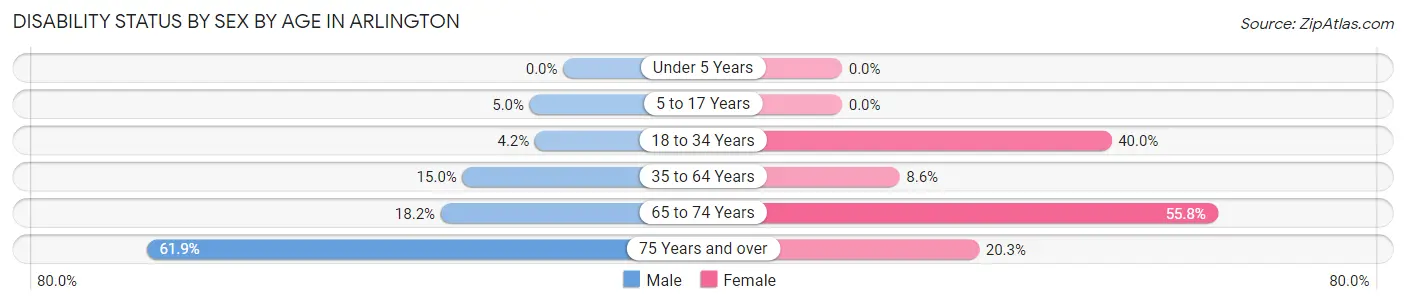
| Age Bracket | Male | Female |
| Under 5 Years | 0 (0.0%) | 0 (0.0%) |
| 5 to 17 Years | 9 (5.0%) | 0 (0.0%) |
| 18 to 34 Years | 7 (4.2%) | 80 (40.0%) |
| 35 to 64 Years | 48 (14.9%) | 37 (8.6%) |
| 65 to 74 Years | 16 (18.2%) | 24 (55.8%) |
| 75 Years and over | 13 (61.9%) | 12 (20.3%) |
Disability Class by Sex by Age in Arlington
Disability Class: Hearing Difficulty
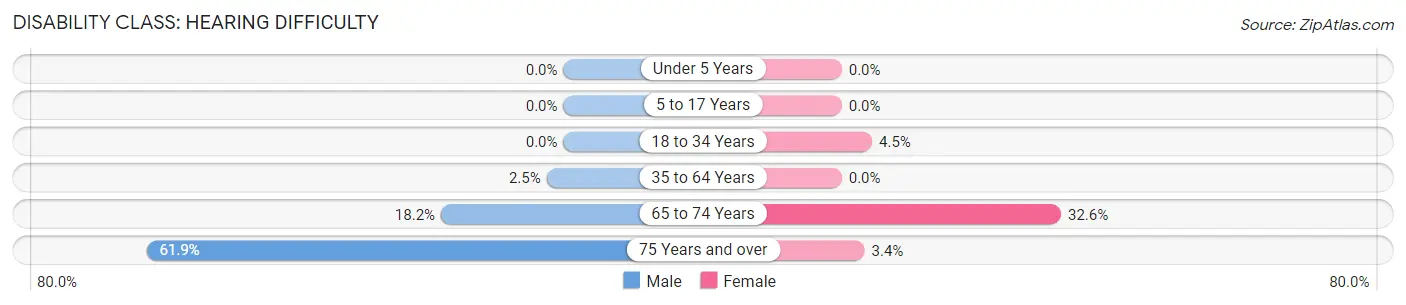
| Age Bracket | Male | Female |
| Under 5 Years | 0 (0.0%) | 0 (0.0%) |
| 5 to 17 Years | 0 (0.0%) | 0 (0.0%) |
| 18 to 34 Years | 0 (0.0%) | 9 (4.5%) |
| 35 to 64 Years | 8 (2.5%) | 0 (0.0%) |
| 65 to 74 Years | 16 (18.2%) | 14 (32.6%) |
| 75 Years and over | 13 (61.9%) | 2 (3.4%) |
Disability Class: Vision Difficulty
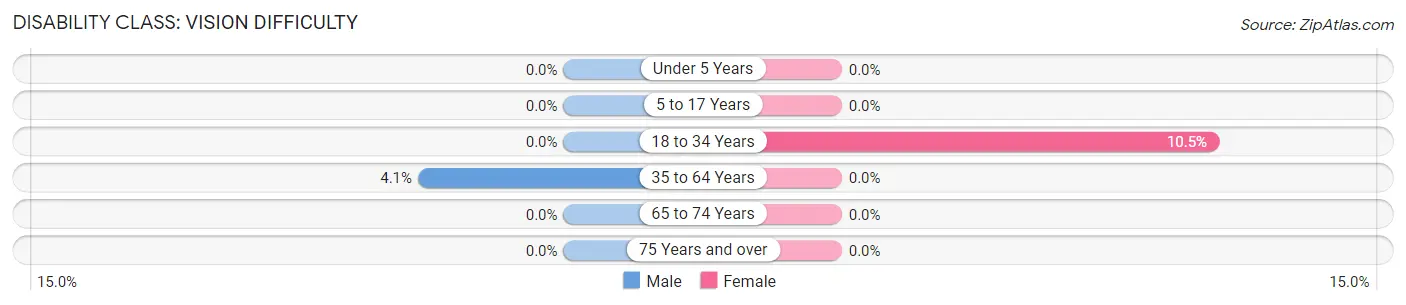
| Age Bracket | Male | Female |
| Under 5 Years | 0 (0.0%) | 0 (0.0%) |
| 5 to 17 Years | 0 (0.0%) | 0 (0.0%) |
| 18 to 34 Years | 0 (0.0%) | 21 (10.5%) |
| 35 to 64 Years | 13 (4.1%) | 0 (0.0%) |
| 65 to 74 Years | 0 (0.0%) | 0 (0.0%) |
| 75 Years and over | 0 (0.0%) | 0 (0.0%) |
Disability Class: Cognitive Difficulty
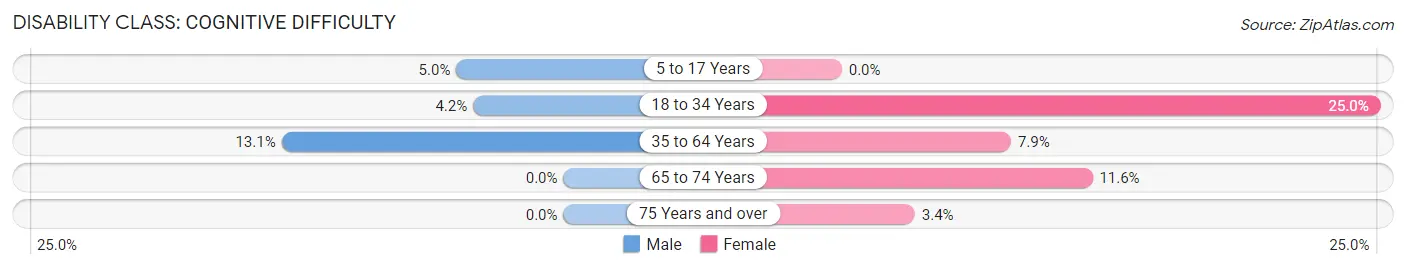
| Age Bracket | Male | Female |
| 5 to 17 Years | 9 (5.0%) | 0 (0.0%) |
| 18 to 34 Years | 7 (4.2%) | 50 (25.0%) |
| 35 to 64 Years | 42 (13.1%) | 34 (7.9%) |
| 65 to 74 Years | 0 (0.0%) | 5 (11.6%) |
| 75 Years and over | 0 (0.0%) | 2 (3.4%) |
Disability Class: Ambulatory Difficulty
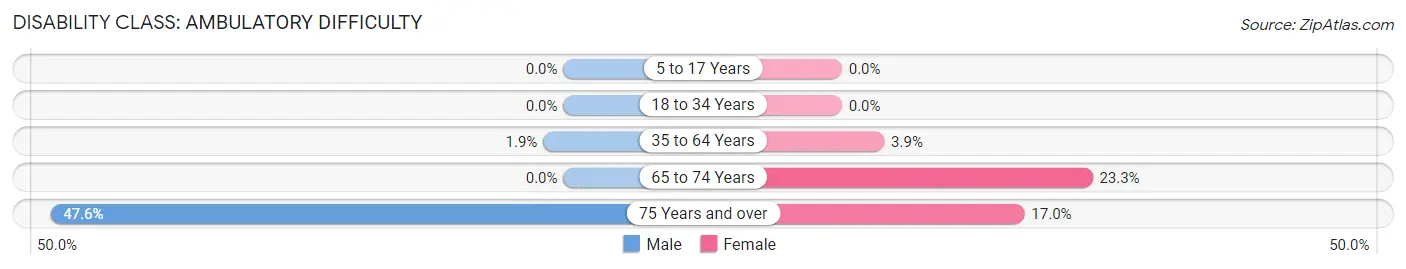
| Age Bracket | Male | Female |
| 5 to 17 Years | 0 (0.0%) | 0 (0.0%) |
| 18 to 34 Years | 0 (0.0%) | 0 (0.0%) |
| 35 to 64 Years | 6 (1.9%) | 17 (3.9%) |
| 65 to 74 Years | 0 (0.0%) | 10 (23.3%) |
| 75 Years and over | 10 (47.6%) | 10 (17.0%) |
Disability Class: Self-Care Difficulty
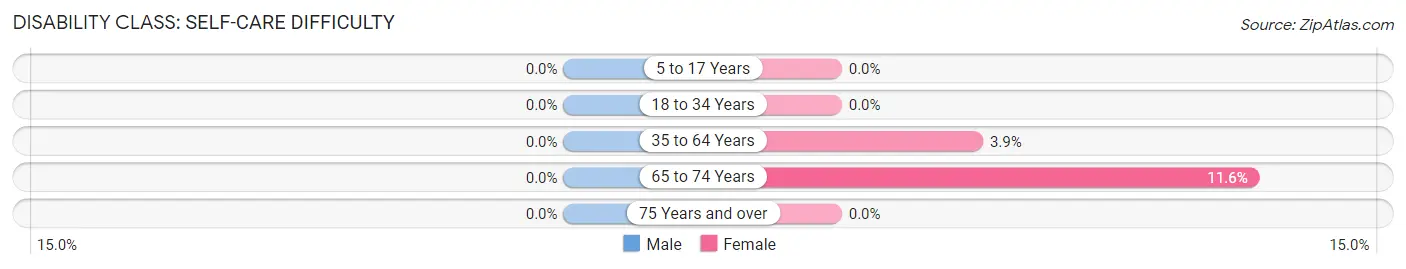
| Age Bracket | Male | Female |
| 5 to 17 Years | 0 (0.0%) | 0 (0.0%) |
| 18 to 34 Years | 0 (0.0%) | 0 (0.0%) |
| 35 to 64 Years | 0 (0.0%) | 17 (3.9%) |
| 65 to 74 Years | 0 (0.0%) | 5 (11.6%) |
| 75 Years and over | 0 (0.0%) | 0 (0.0%) |
Technology Access in Arlington
Computing Device Access in Arlington
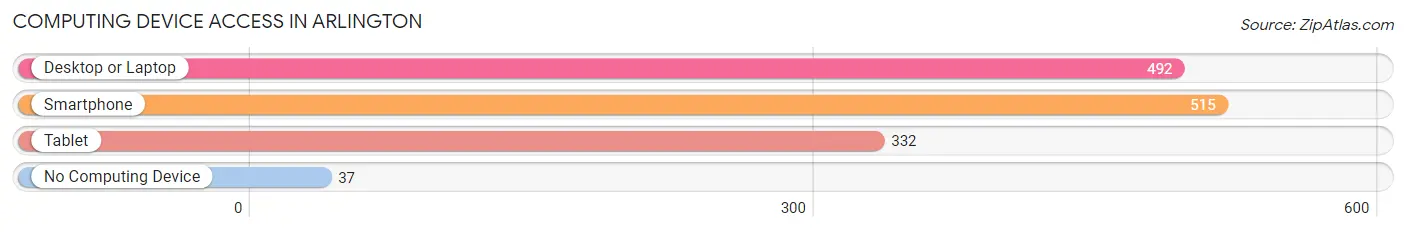
| Device Type | # Households | % Households |
| Desktop or Laptop | 492 | 83.7% |
| Smartphone | 515 | 87.6% |
| Tablet | 332 | 56.5% |
| No Computing Device | 37 | 6.3% |
| Total | 588 | 100.0% |
Internet Access in Arlington
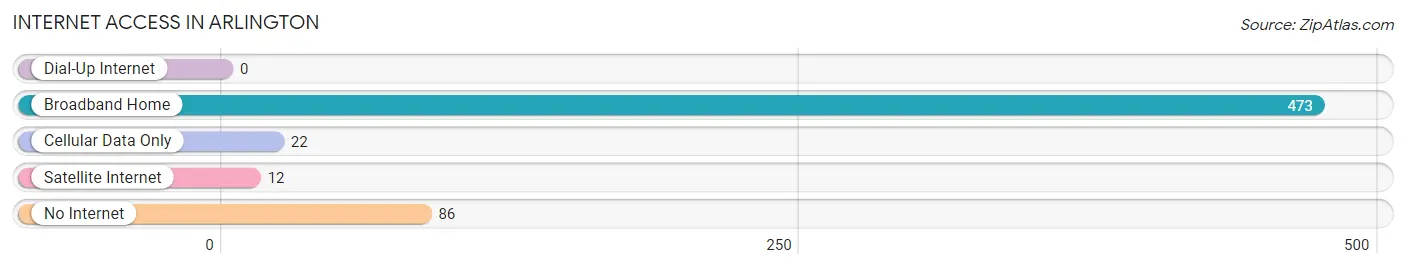
| Internet Type | # Households | % Households |
| Dial-Up Internet | 0 | 0.0% |
| Broadband Home | 473 | 80.4% |
| Cellular Data Only | 22 | 3.7% |
| Satellite Internet | 12 | 2.0% |
| No Internet | 86 | 14.6% |
| Total | 588 | 100.0% |
Arlington Summary
Arlington is a town located in Bennington County, Vermont, United States. The population was 2,317 at the 2010 census. It is part of the Bennington, VT Micropolitan Statistical Area.
History
Arlington was first settled in 1761 by settlers from Massachusetts. The town was named after Henry Bennet, 1st Earl of Arlington, an English statesman. The town was incorporated in 1791.
In the 19th century, Arlington was a center of marble production. The town was home to the Vermont Marble Company, which was founded in 1880 and operated until the 1930s. The company was the largest marble producer in the United States at the time.
Geography
Arlington is located in southwestern Bennington County, bordered to the west by the town of Sunderland and to the east by the town of Sandgate. The town is situated in the Green Mountains, with the highest point in the town being the summit of Mount Equinox at 3,848 feet (1,173 m).
The Batten Kill, a tributary of the Hudson River, flows through the town. The town is home to several small lakes, including Lake Shaftsbury, Lake Paran, and Lake Hortonia.
Economy
The economy of Arlington is largely based on tourism and agriculture. The town is home to several small farms, which produce dairy products, vegetables, and maple syrup.
The town is also home to several small businesses, including a general store, a hardware store, and a restaurant.
Demographics
As of the 2010 census, there were 2,317 people, 945 households, and 645 families residing in the town. The population density was 44.2 people per square mile (17.1/km2). There were 1,039 housing units at an average density of 19.7 per square mile (7.6/km2). The racial makeup of the town was 97.3% White, 0.3% African American, 0.2% Native American, 0.4% Asian, 0.1% Pacific Islander, 0.2% from other races, and 1.5% from two or more races. Hispanic or Latino of any race were 1.2% of the population.
There were 945 households, out of which 28.3% had children under the age of 18 living with them, 54.2% were married couples living together, 8.7% had a female householder with no husband present, and 32.2% were non-families. 25.7% of all households were made up of individuals, and 11.2% had someone living alone who was 65 years of age or older. The average household size was 2.44 and the average family size was 2.93.
In the town, the population was spread out, with 23.2% under the age of 18, 6.2% from 18 to 24, 25.2% from 25 to 44, 29.2% from 45 to 64, and 16.2% who were 65 years of age or older. The median age was 42 years. For every 100 females, there were 97.2 males. For every 100 females age 18 and over, there were 94.2 males.
The median income for a household in the town was $41,964, and the median income for a family was $50,000. Males had a median income of $35,000 versus $25,000 for females. The per capita income for the town was $20,945. About 5.2% of families and 8.2% of the population were below the poverty line, including 10.2% of those under age 18 and 8.2% of those age 65 or over.
Common Questions
What is Per Capita Income in Arlington?
Per Capita income in Arlington is $33,953.
What is the Median Family Income in Arlington?
Median Family Income in Arlington is $75,750.
What is the Median Household income in Arlington?
Median Household Income in Arlington is $70,938.
What is Income or Wage Gap in Arlington?
Income or Wage Gap in Arlington is 30.9%.
Women in Arlington earn 69.1 cents for every dollar earned by a man.
What is Inequality or Gini Index in Arlington?
Inequality or Gini Index in Arlington is 0.41.
What is the Total Population of Arlington?
Total Population of Arlington is 1,781.
What is the Total Male Population of Arlington?
Total Male Population of Arlington is 858.
What is the Total Female Population of Arlington?
Total Female Population of Arlington is 923.
What is the Ratio of Males per 100 Females in Arlington?
There are 92.96 Males per 100 Females in Arlington.
What is the Ratio of Females per 100 Males in Arlington?
There are 107.58 Females per 100 Males in Arlington.
What is the Median Population Age in Arlington?
Median Population Age in Arlington is 36.2 Years.
What is the Average Family Size in Arlington
Average Family Size in Arlington is 4.0 People.
What is the Average Household Size in Arlington
Average Household Size in Arlington is 3.0 People.
How Large is the Labor Force in Arlington?
There are 949 People in the Labor Forcein in Arlington.
What is the Percentage of People in the Labor Force in Arlington?
70.4% of People are in the Labor Force in Arlington.
What is the Unemployment Rate in Arlington?
Unemployment Rate in Arlington is 5.8%.