North Hartland, VT Map & Demographics
North Hartland Map
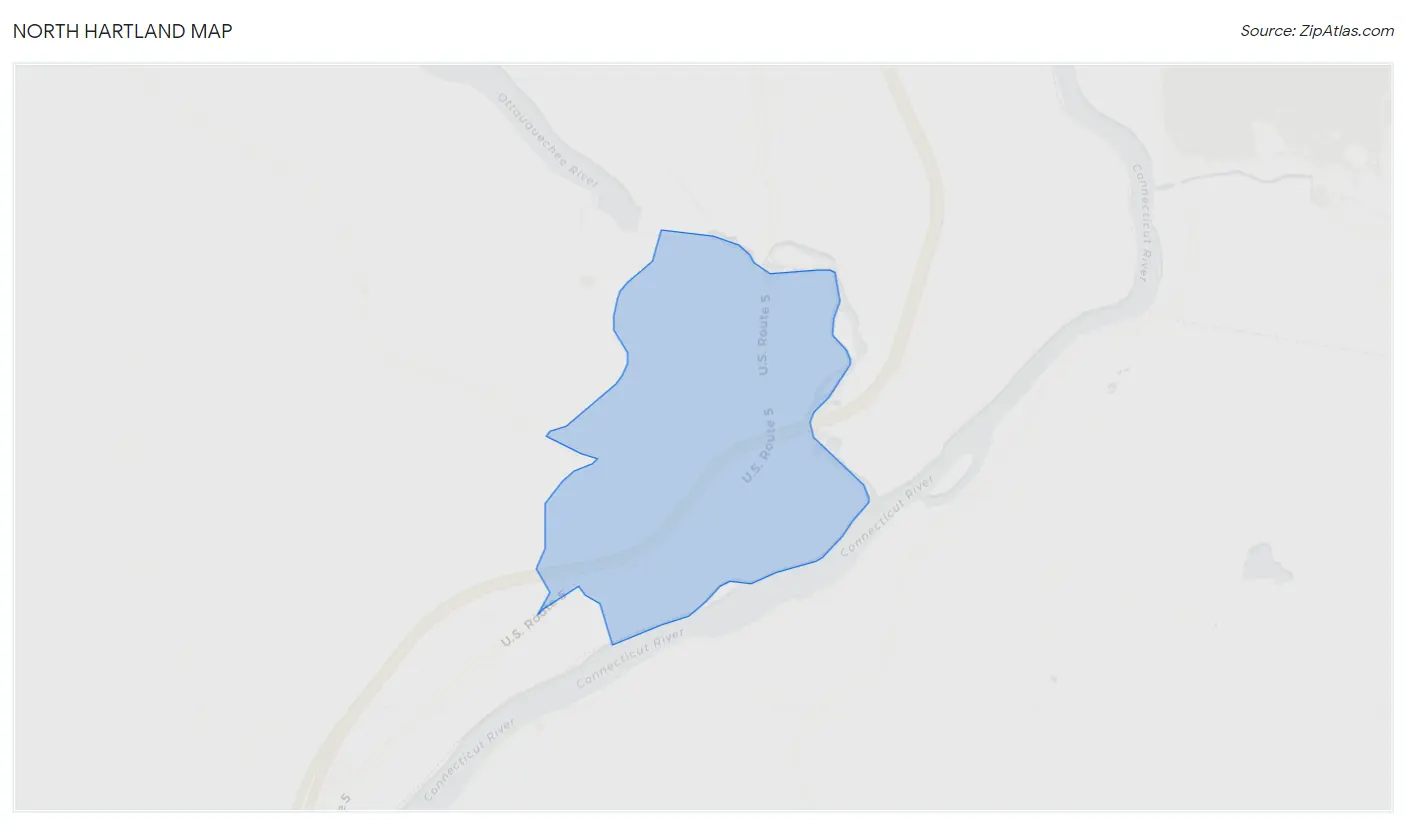
North Hartland Overview
$42,942
PER CAPITA INCOME
$152,574
AVG FAMILY INCOME
$80,104
AVG HOUSEHOLD INCOME
0.36
INEQUALITY / GINI INDEX
416
TOTAL POPULATION
200
MALE POPULATION
216
FEMALE POPULATION
92.59
MALES / 100 FEMALES
108.00
FEMALES / 100 MALES
52.1
MEDIAN AGE
2.9
AVG FAMILY SIZE
2.4
AVG HOUSEHOLD SIZE
191
LABOR FORCE [ PEOPLE ]
54.9%
PERCENT IN LABOR FORCE
North Hartland Zip Codes
North Hartland Area Codes
Income in North Hartland
Income Overview in North Hartland
Per Capita Income in North Hartland is $42,942, while median incomes of families and households are $152,574 and $80,104 respectively.
| Characteristic | Number | Measure |
| Per Capita Income | 416 | $42,942 |
| Median Family Income | 102 | $152,574 |
| Mean Family Income | 102 | $129,886 |
| Median Household Income | 173 | $80,104 |
| Mean Household Income | 173 | $101,879 |
| Income Deficit | 102 | $0 |
| Wage / Income Gap (%) | 416 | 0.00% |
| Wage / Income Gap ($) | 416 | 100.00¢ per $1 |
| Gini / Inequality Index | 416 | 0.36 |
Earnings by Sex in North Hartland
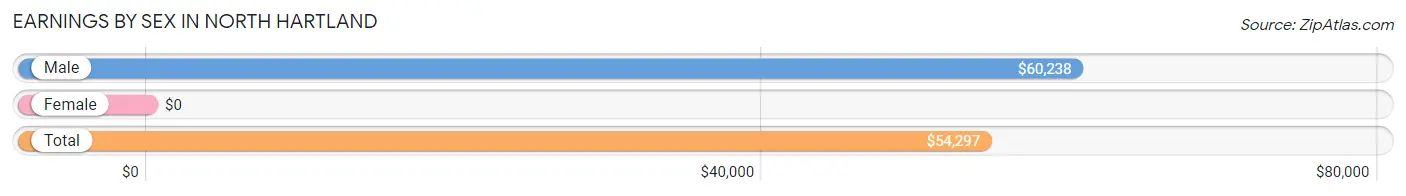
| Sex | Number | Average Earnings |
| Male | 142 (53.6%) | $60,238 |
| Female | 123 (46.4%) | $0 |
| Total | 265 (100.0%) | $54,297 |
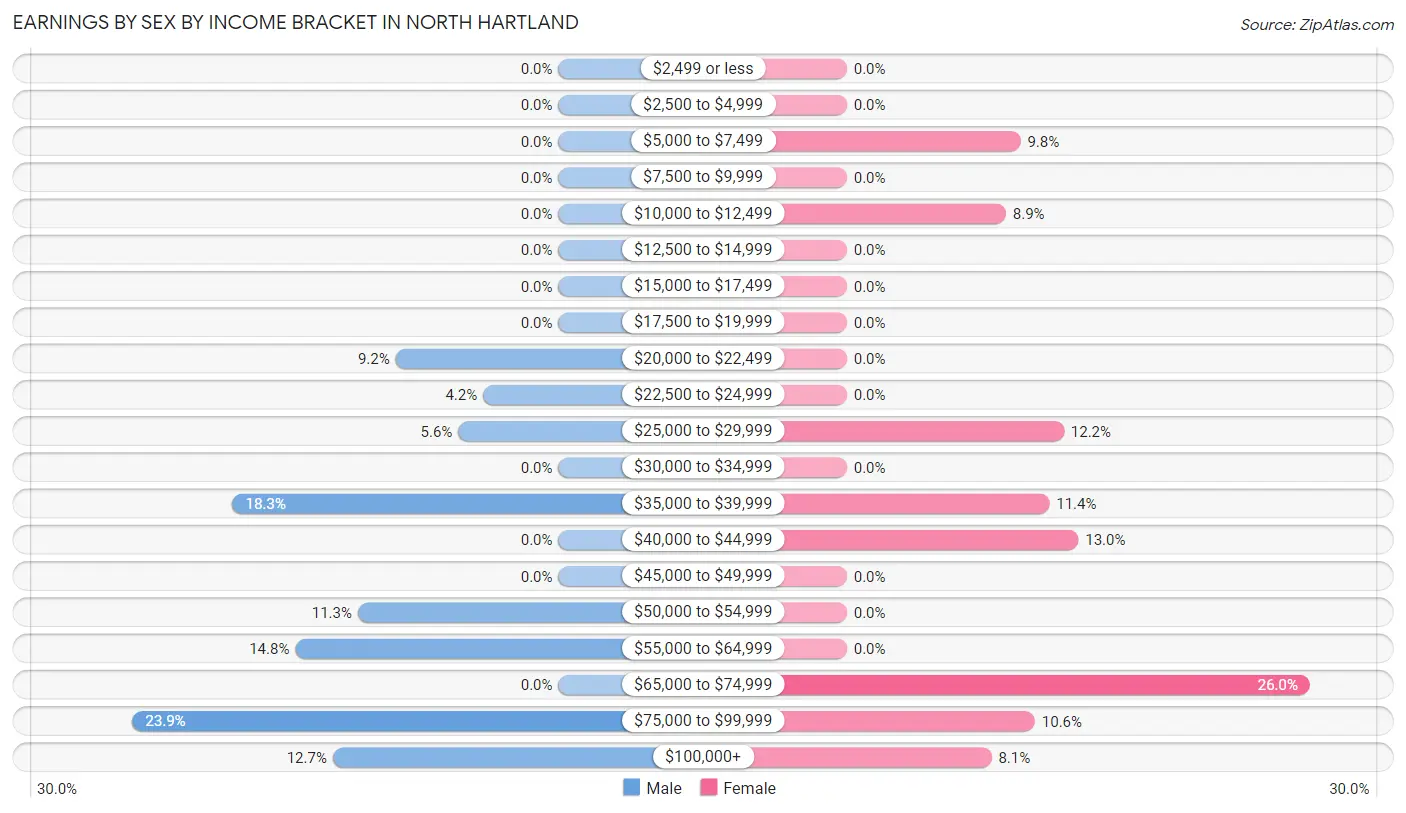
Earnings by Sex by Income Bracket in North Hartland
The most common earnings brackets in North Hartland are $75,000 to $99,999 for men (34 | 23.9%) and $65,000 to $74,999 for women (32 | 26.0%).
| Income | Male | Female |
| $2,499 or less | 0 (0.0%) | 0 (0.0%) |
| $2,500 to $4,999 | 0 (0.0%) | 0 (0.0%) |
| $5,000 to $7,499 | 0 (0.0%) | 12 (9.8%) |
| $7,500 to $9,999 | 0 (0.0%) | 0 (0.0%) |
| $10,000 to $12,499 | 0 (0.0%) | 11 (8.9%) |
| $12,500 to $14,999 | 0 (0.0%) | 0 (0.0%) |
| $15,000 to $17,499 | 0 (0.0%) | 0 (0.0%) |
| $17,500 to $19,999 | 0 (0.0%) | 0 (0.0%) |
| $20,000 to $22,499 | 13 (9.1%) | 0 (0.0%) |
| $22,500 to $24,999 | 6 (4.2%) | 0 (0.0%) |
| $25,000 to $29,999 | 8 (5.6%) | 15 (12.2%) |
| $30,000 to $34,999 | 0 (0.0%) | 0 (0.0%) |
| $35,000 to $39,999 | 26 (18.3%) | 14 (11.4%) |
| $40,000 to $44,999 | 0 (0.0%) | 16 (13.0%) |
| $45,000 to $49,999 | 0 (0.0%) | 0 (0.0%) |
| $50,000 to $54,999 | 16 (11.3%) | 0 (0.0%) |
| $55,000 to $64,999 | 21 (14.8%) | 0 (0.0%) |
| $65,000 to $74,999 | 0 (0.0%) | 32 (26.0%) |
| $75,000 to $99,999 | 34 (23.9%) | 13 (10.6%) |
| $100,000+ | 18 (12.7%) | 10 (8.1%) |
| Total | 142 (100.0%) | 123 (100.0%) |
Earnings by Sex by Educational Attainment in North Hartland

| Educational Attainment | Male Income | Female Income |
| Less than High School | - | - |
| High School Diploma | - | - |
| College or Associate's Degree | - | - |
| Bachelor's Degree | - | - |
| Graduate Degree | - | - |
| Total | $61,071 | $65,039 |
Family Income in North Hartland
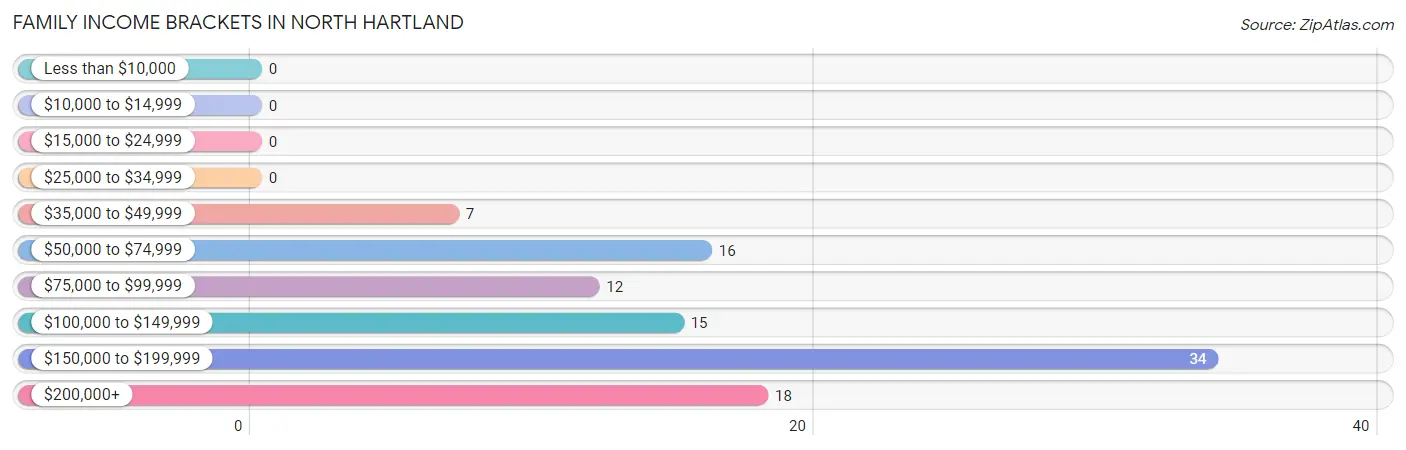
Family Income Brackets in North Hartland
According to the North Hartland family income data, there are 34 families falling into the $150,000 to $199,999 income range, which is the most common income bracket and makes up 33.3% of all families.
| Income Bracket | # Families | % Families |
| Less than $10,000 | 0 | 0.0% |
| $10,000 to $14,999 | 0 | 0.0% |
| $15,000 to $24,999 | 0 | 0.0% |
| $25,000 to $34,999 | 0 | 0.0% |
| $35,000 to $49,999 | 7 | 6.9% |
| $50,000 to $74,999 | 16 | 15.7% |
| $75,000 to $99,999 | 12 | 11.8% |
| $100,000 to $149,999 | 15 | 14.7% |
| $150,000 to $199,999 | 34 | 33.3% |
| $200,000+ | 18 | 17.6% |
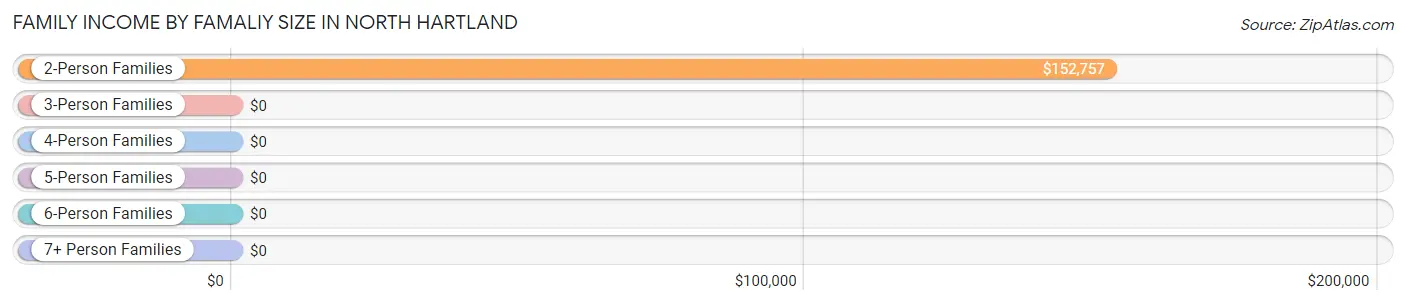
Family Income by Famaliy Size in North Hartland
2-person families (61 | 59.8%) account for the highest median family income in North Hartland with $152,757 per family, while 2-person families (61 | 59.8%) have the highest median income of $76,378 per family member.
| Income Bracket | # Families | Median Income |
| 2-Person Families | 61 (59.8%) | $152,757 |
| 3-Person Families | 18 (17.6%) | $0 |
| 4-Person Families | 7 (6.9%) | $0 |
| 5-Person Families | 0 (0.0%) | $0 |
| 6-Person Families | 16 (15.7%) | $0 |
| 7+ Person Families | 0 (0.0%) | $0 |
| Total | 102 (100.0%) | $152,574 |
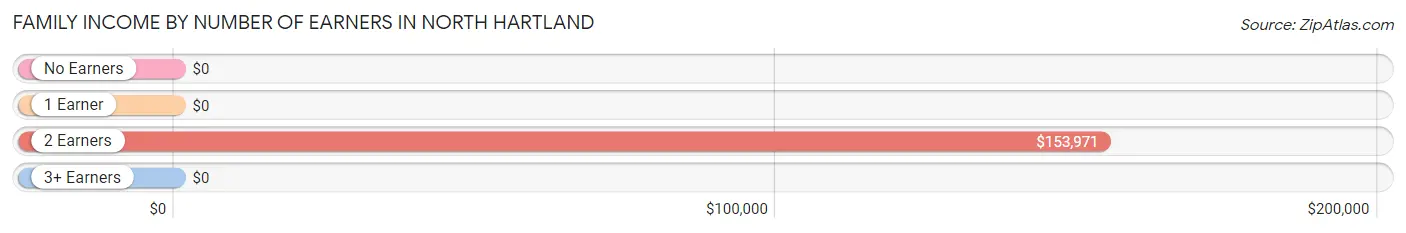
Family Income by Number of Earners in North Hartland
| Number of Earners | # Families | Median Income |
| No Earners | 0 (0.0%) | $0 |
| 1 Earner | 38 (37.2%) | $0 |
| 2 Earners | 64 (62.7%) | $153,971 |
| 3+ Earners | 0 (0.0%) | $0 |
| Total | 102 (100.0%) | $152,574 |
Household Income in North Hartland
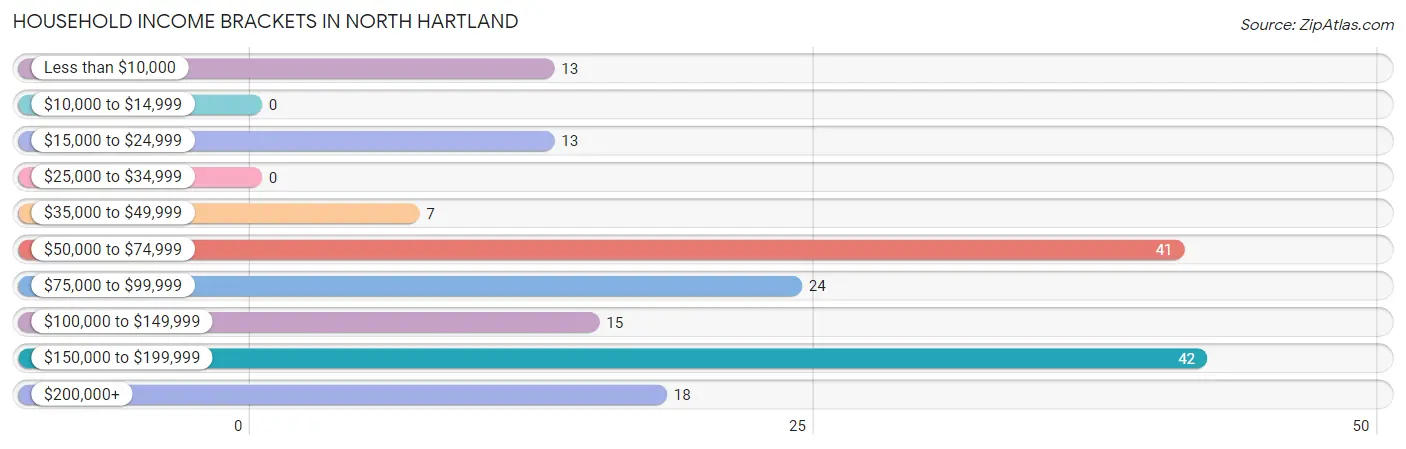
Household Income Brackets in North Hartland
With 42 households falling in the category, the $150,000 to $199,999 income range is the most frequent in North Hartland, accounting for 24.3% of all households.
| Income Bracket | # Households | % Households |
| Less than $10,000 | 13 | 7.5% |
| $10,000 to $14,999 | 0 | 0.0% |
| $15,000 to $24,999 | 13 | 7.5% |
| $25,000 to $34,999 | 0 | 0.0% |
| $35,000 to $49,999 | 7 | 4.0% |
| $50,000 to $74,999 | 41 | 23.7% |
| $75,000 to $99,999 | 24 | 13.9% |
| $100,000 to $149,999 | 15 | 8.7% |
| $150,000 to $199,999 | 42 | 24.3% |
| $200,000+ | 18 | 10.4% |
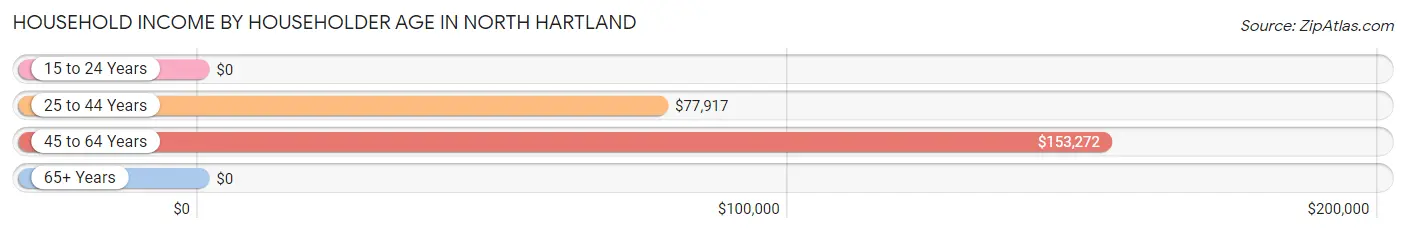
Household Income by Householder Age in North Hartland
The median household income in North Hartland is $80,104, with the highest median household income of $153,272 found in the 45 to 64 years age bracket for the primary householder. A total of 83 households (48.0%) fall into this category. Meanwhile, the 15 to 24 years age bracket for the primary householder has the lowest median household income of $0, with 14 households (8.1%) in this group.
| Income Bracket | # Households | Median Income |
| 15 to 24 Years | 14 (8.1%) | $0 |
| 25 to 44 Years | 36 (20.8%) | $77,917 |
| 45 to 64 Years | 83 (48.0%) | $153,272 |
| 65+ Years | 40 (23.1%) | $0 |
| Total | 173 (100.0%) | $80,104 |
Poverty in North Hartland
Income Below Poverty by Sex and Age in North Hartland
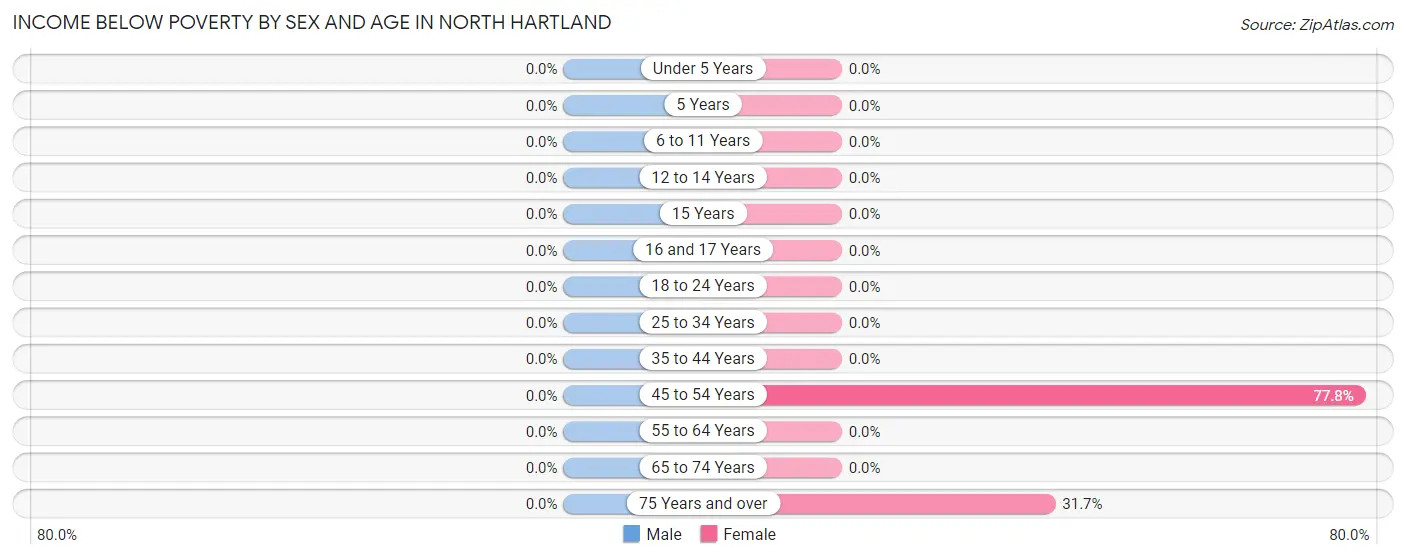
| Age Bracket | Male | Female |
| Under 5 Years | 0 (0.0%) | 0 (0.0%) |
| 5 Years | 0 (0.0%) | 0 (0.0%) |
| 6 to 11 Years | 0 (0.0%) | 0 (0.0%) |
| 12 to 14 Years | 0 (0.0%) | 0 (0.0%) |
| 15 Years | 0 (0.0%) | 0 (0.0%) |
| 16 and 17 Years | 0 (0.0%) | 0 (0.0%) |
| 18 to 24 Years | 0 (0.0%) | 0 (0.0%) |
| 25 to 34 Years | 0 (0.0%) | 0 (0.0%) |
| 35 to 44 Years | 0 (0.0%) | 0 (0.0%) |
| 45 to 54 Years | 0 (0.0%) | 14 (77.8%) |
| 55 to 64 Years | 0 (0.0%) | 0 (0.0%) |
| 65 to 74 Years | 0 (0.0%) | 0 (0.0%) |
| 75 Years and over | 0 (0.0%) | 13 (31.7%) |
| Total | 0 (0.0%) | 27 (12.5%) |
Income Above Poverty by Sex and Age in North Hartland
According to the poverty statistics in North Hartland, males aged 6 to 11 years and females aged under 5 years are the age groups that are most secure financially, with 100.0% of males and 100.0% of females in these age groups living above the poverty line.
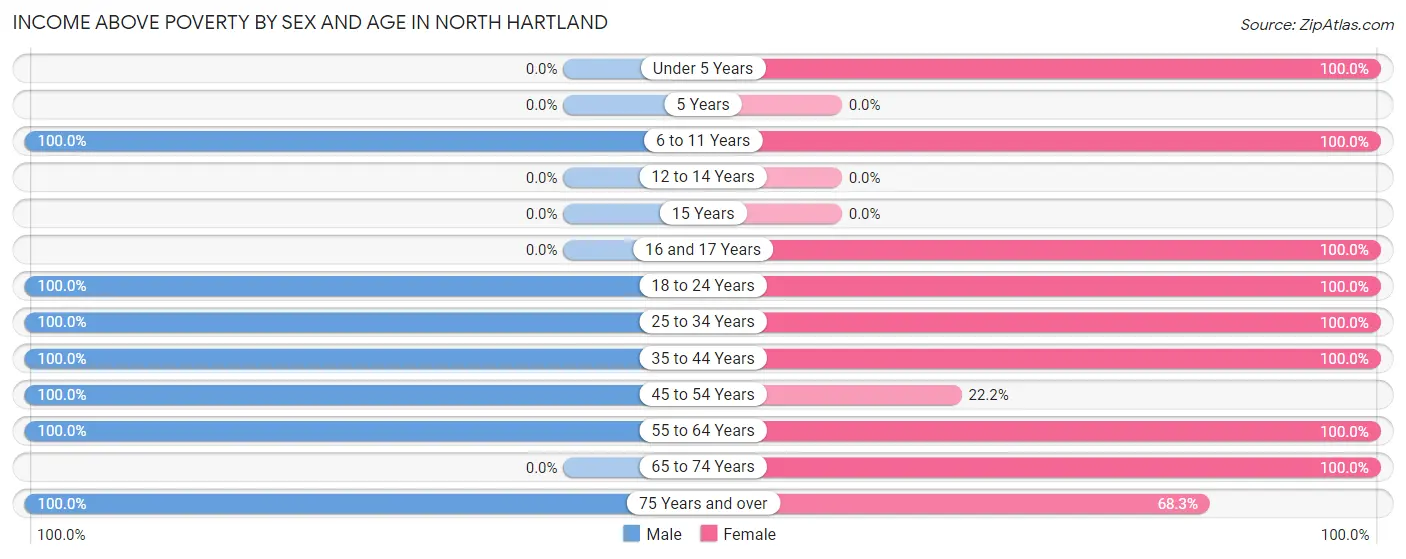
| Age Bracket | Male | Female |
| Under 5 Years | 0 (0.0%) | 14 (100.0%) |
| 5 Years | 0 (0.0%) | 0 (0.0%) |
| 6 to 11 Years | 35 (100.0%) | 19 (100.0%) |
| 12 to 14 Years | 0 (0.0%) | 0 (0.0%) |
| 15 Years | 0 (0.0%) | 0 (0.0%) |
| 16 and 17 Years | 0 (0.0%) | 16 (100.0%) |
| 18 to 24 Years | 14 (100.0%) | 14 (100.0%) |
| 25 to 34 Years | 8 (100.0%) | 10 (100.0%) |
| 35 to 44 Years | 28 (100.0%) | 26 (100.0%) |
| 45 to 54 Years | 18 (100.0%) | 4 (22.2%) |
| 55 to 64 Years | 81 (100.0%) | 43 (100.0%) |
| 65 to 74 Years | 0 (0.0%) | 15 (100.0%) |
| 75 Years and over | 16 (100.0%) | 28 (68.3%) |
| Total | 200 (100.0%) | 189 (87.5%) |
Income Below Poverty Among Married-Couple Families in North Hartland
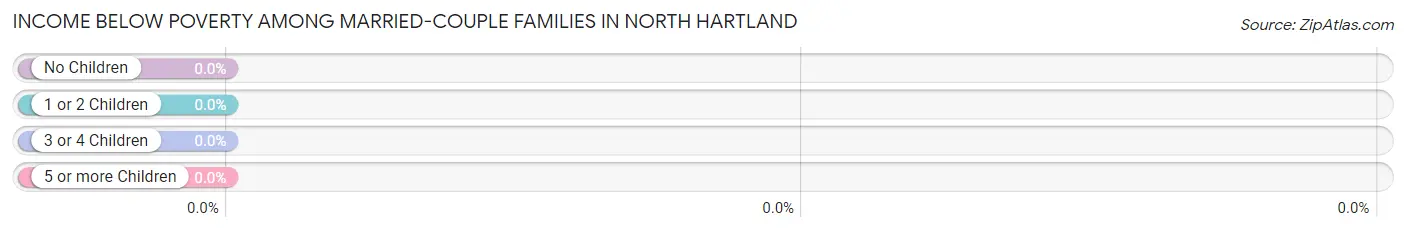
| Children | Above Poverty | Below Poverty |
| No Children | 56 (100.0%) | 0 (0.0%) |
| 1 or 2 Children | 18 (100.0%) | 0 (0.0%) |
| 3 or 4 Children | 16 (100.0%) | 0 (0.0%) |
| 5 or more Children | 0 (0.0%) | 0 (0.0%) |
| Total | 90 (100.0%) | 0 (0.0%) |
Income Below Poverty Among Single-Parent Households in North Hartland
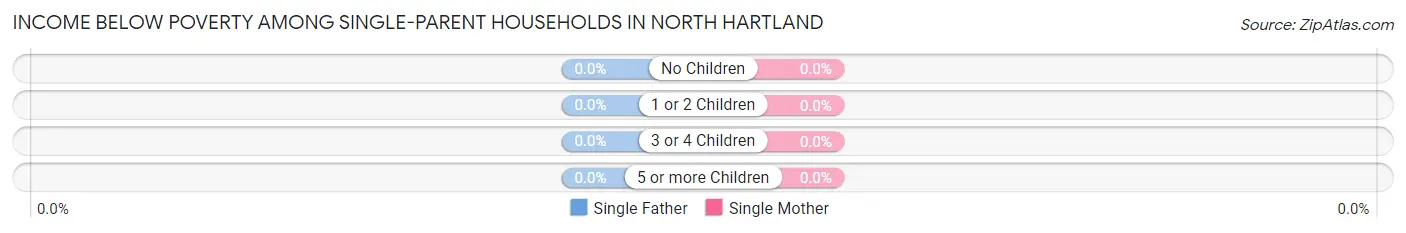
| Children | Single Father | Single Mother |
| No Children | 0 (0.0%) | 0 (0.0%) |
| 1 or 2 Children | 0 (0.0%) | 0 (0.0%) |
| 3 or 4 Children | 0 (0.0%) | 0 (0.0%) |
| 5 or more Children | 0 (0.0%) | 0 (0.0%) |
| Total | 0 (0.0%) | 0 (0.0%) |
Income Below Poverty Among Married-Couple vs Single-Parent Households in North Hartland
| Children | Married-Couple Families | Single-Parent Households |
| No Children | 0 (0.0%) | 0 (0.0%) |
| 1 or 2 Children | 0 (0.0%) | 0 (0.0%) |
| 3 or 4 Children | 0 (0.0%) | 0 (0.0%) |
| 5 or more Children | 0 (0.0%) | 0 (0.0%) |
| Total | 0 (0.0%) | 0 (0.0%) |
Race in North Hartland
The most populous races in North Hartland are White / Caucasian (400 | 96.2%), and Two or more Races (16 | 3.8%).
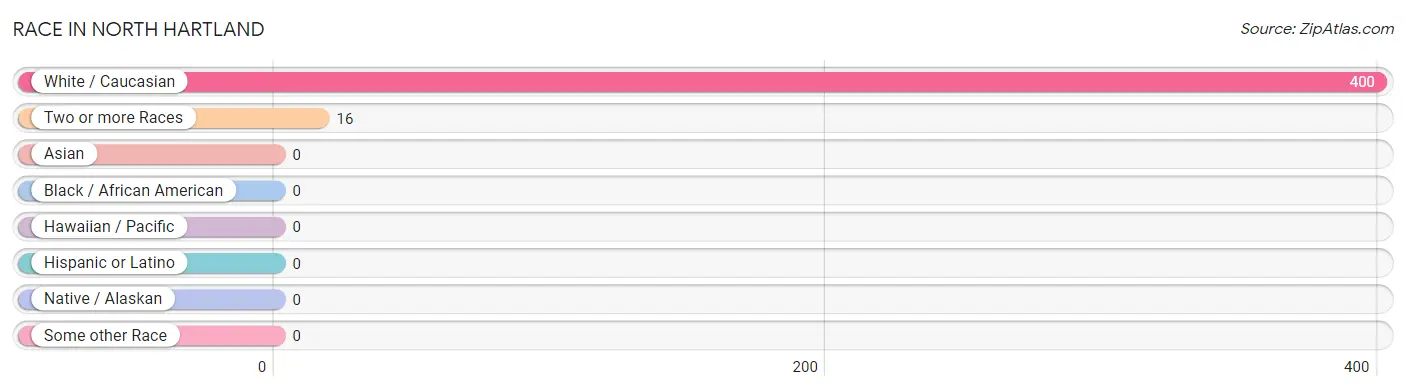
| Race | # Population | % Population |
| Asian | 0 | 0.0% |
| Black / African American | 0 | 0.0% |
| Hawaiian / Pacific | 0 | 0.0% |
| Hispanic or Latino | 0 | 0.0% |
| Native / Alaskan | 0 | 0.0% |
| White / Caucasian | 400 | 96.2% |
| Two or more Races | 16 | 3.8% |
| Some other Race | 0 | 0.0% |
| Total | 416 | 100.0% |
Ancestry in North Hartland
The most populous ancestries reported in North Hartland are French Canadian (168 | 40.4%), English (59 | 14.2%), Scottish (33 | 7.9%), Canadian (29 | 7.0%), and American (28 | 6.7%), together accounting for 76.2% of all North Hartland residents.
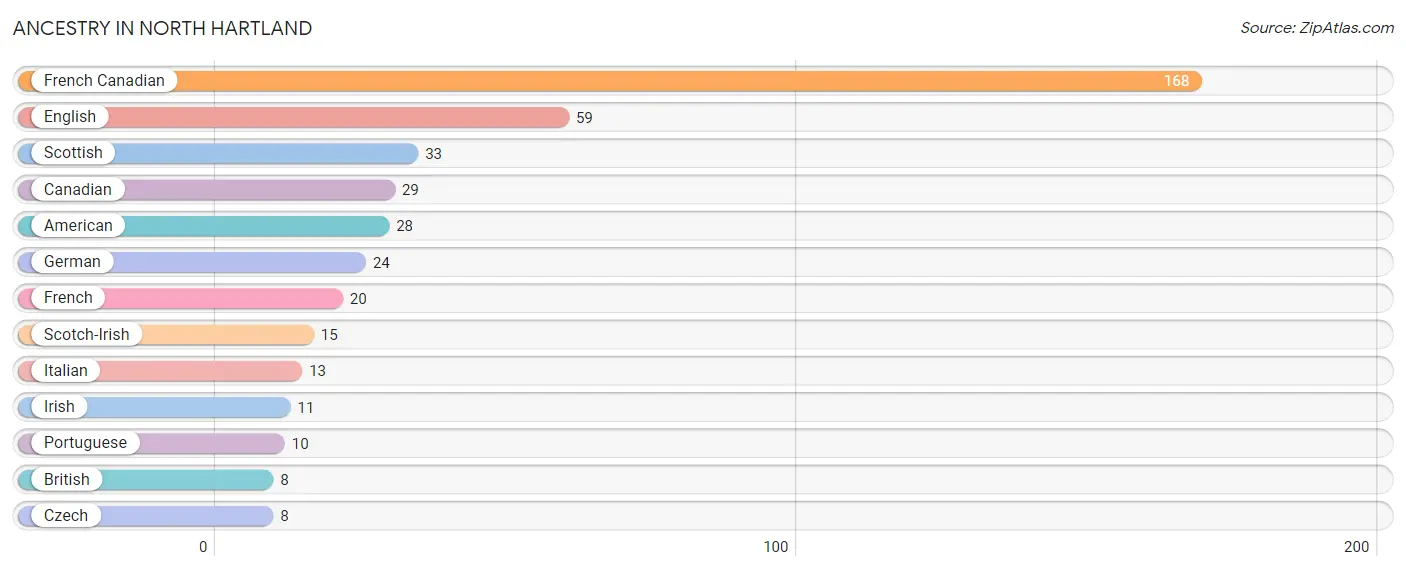
| Ancestry | # Population | % Population |
| American | 28 | 6.7% |
| British | 8 | 1.9% |
| Canadian | 29 | 7.0% |
| Czech | 8 | 1.9% |
| English | 59 | 14.2% |
| French | 20 | 4.8% |
| French Canadian | 168 | 40.4% |
| German | 24 | 5.8% |
| Irish | 11 | 2.6% |
| Italian | 13 | 3.1% |
| Portuguese | 10 | 2.4% |
| Scotch-Irish | 15 | 3.6% |
| Scottish | 33 | 7.9% | View All 13 Rows |
Immigrants in North Hartland
The most numerous immigrant groups reported in North Hartland came from , and Canada (31 | 7.4%), together accounting for 7.4% of all North Hartland residents.

| Immigration Origin | # Population | % Population |
| Canada | 31 | 7.4% | View All 1 Rows |
Sex and Age in North Hartland
Sex and Age in North Hartland
The most populous age groups in North Hartland are 60 to 64 Years (47 | 23.5%) for men and 55 to 59 Years (32 | 14.8%) for women.
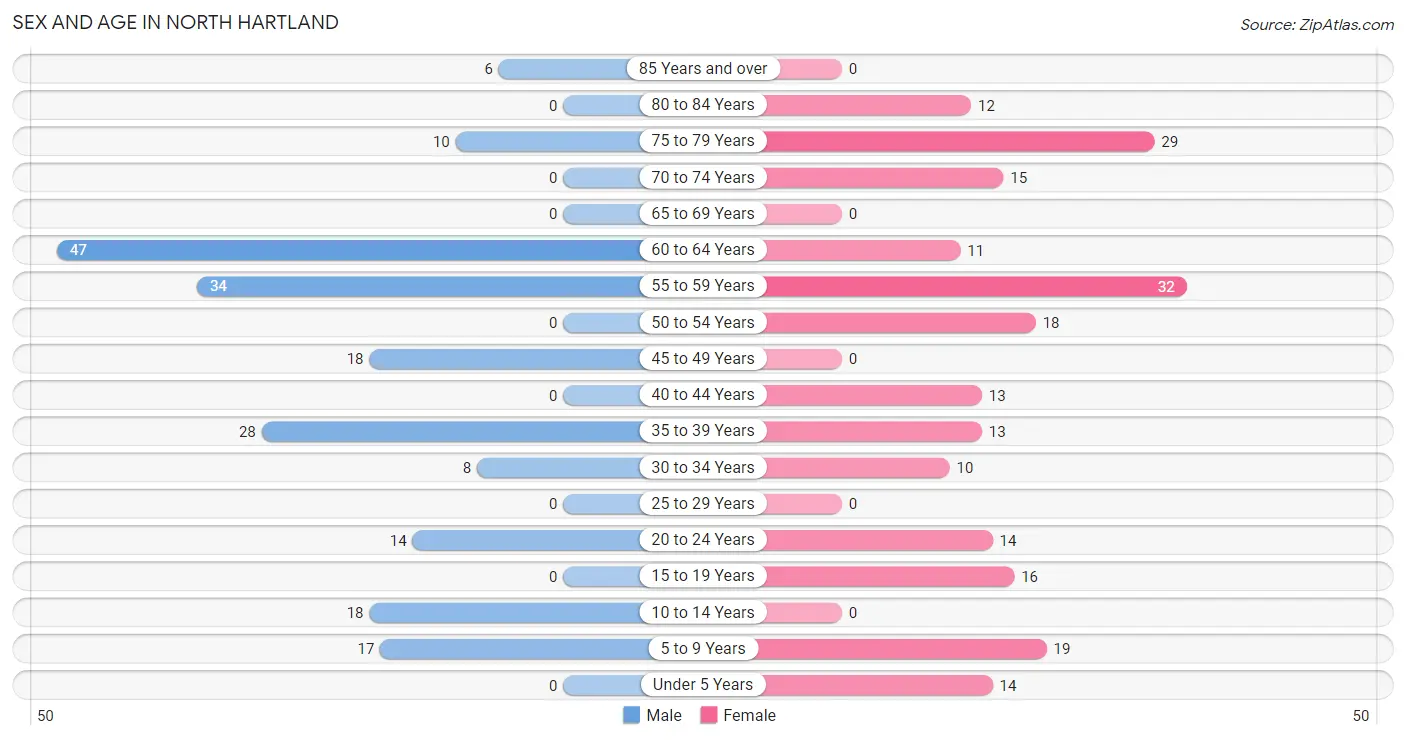
| Age Bracket | Male | Female |
| Under 5 Years | 0 (0.0%) | 14 (6.5%) |
| 5 to 9 Years | 17 (8.5%) | 19 (8.8%) |
| 10 to 14 Years | 18 (9.0%) | 0 (0.0%) |
| 15 to 19 Years | 0 (0.0%) | 16 (7.4%) |
| 20 to 24 Years | 14 (7.0%) | 14 (6.5%) |
| 25 to 29 Years | 0 (0.0%) | 0 (0.0%) |
| 30 to 34 Years | 8 (4.0%) | 10 (4.6%) |
| 35 to 39 Years | 28 (14.0%) | 13 (6.0%) |
| 40 to 44 Years | 0 (0.0%) | 13 (6.0%) |
| 45 to 49 Years | 18 (9.0%) | 0 (0.0%) |
| 50 to 54 Years | 0 (0.0%) | 18 (8.3%) |
| 55 to 59 Years | 34 (17.0%) | 32 (14.8%) |
| 60 to 64 Years | 47 (23.5%) | 11 (5.1%) |
| 65 to 69 Years | 0 (0.0%) | 0 (0.0%) |
| 70 to 74 Years | 0 (0.0%) | 15 (6.9%) |
| 75 to 79 Years | 10 (5.0%) | 29 (13.4%) |
| 80 to 84 Years | 0 (0.0%) | 12 (5.6%) |
| 85 Years and over | 6 (3.0%) | 0 (0.0%) |
| Total | 200 (100.0%) | 216 (100.0%) |
Families and Households in North Hartland
Median Family Size in North Hartland
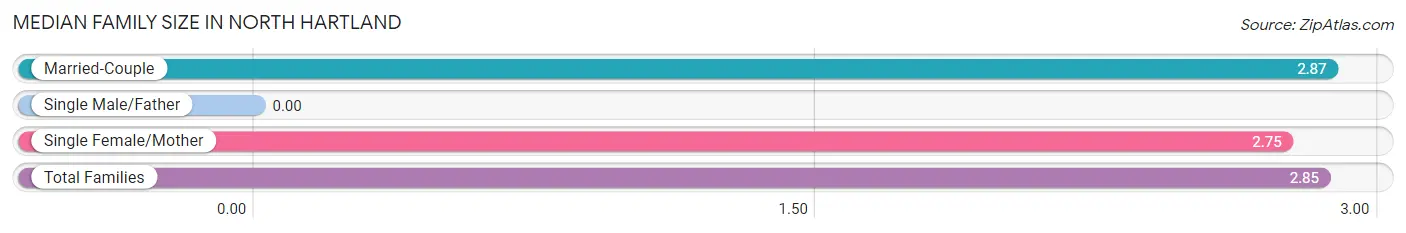
| Family Type | # Families | Family Size |
| Married-Couple | 90 (88.2%) | 2.87 |
| Single Male/Father | 0 (0.0%) | - |
| Single Female/Mother | 12 (11.8%) | 2.75 |
| Total Families | 102 (100.0%) | 2.85 |
Median Household Size in North Hartland
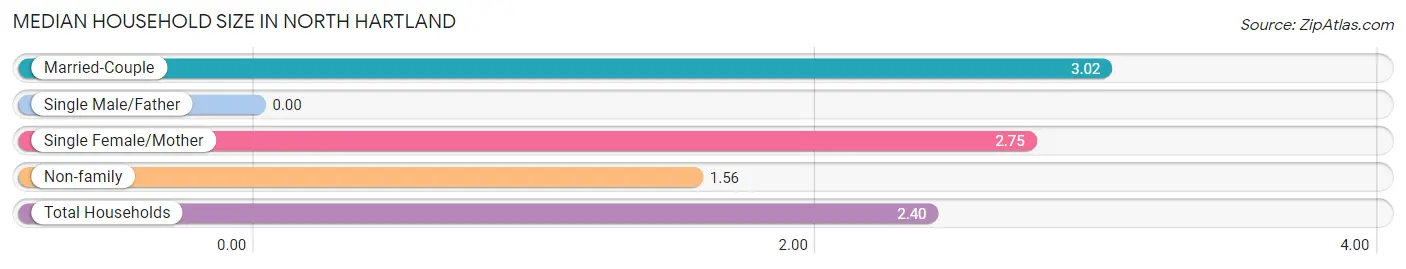
| Household Type | # Households | Household Size |
| Married-Couple | 90 (52.0%) | 3.02 |
| Single Male/Father | 0 (0.0%) | - |
| Single Female/Mother | 12 (6.9%) | 2.75 |
| Non-family | 71 (41.0%) | 1.56 |
| Total Households | 173 (100.0%) | 2.40 |
Household Size by Marriage Status in North Hartland
Out of a total of 173 households in North Hartland, 102 (59.0%) are family households, while 71 (41.0%) are nonfamily households. The most numerous type of family households are 2-person households, comprising 61, and the most common type of nonfamily households are 1-person households, comprising 37.
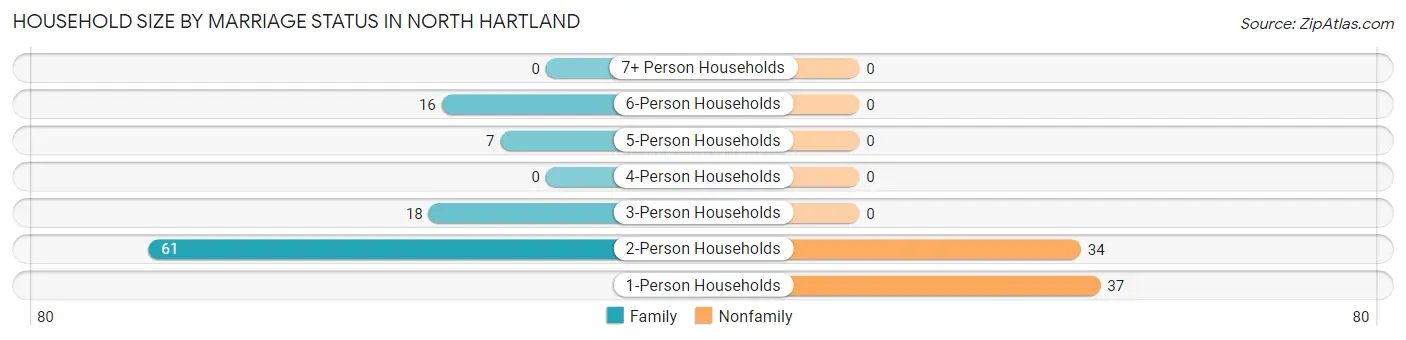
| Household Size | Family Households | Nonfamily Households |
| 1-Person Households | - | 37 (21.4%) |
| 2-Person Households | 61 (35.3%) | 34 (19.7%) |
| 3-Person Households | 18 (10.4%) | 0 (0.0%) |
| 4-Person Households | 0 (0.0%) | 0 (0.0%) |
| 5-Person Households | 7 (4.1%) | 0 (0.0%) |
| 6-Person Households | 16 (9.2%) | 0 (0.0%) |
| 7+ Person Households | 0 (0.0%) | 0 (0.0%) |
| Total | 102 (59.0%) | 71 (41.0%) |
Female Fertility in North Hartland
Fertility by Age in North Hartland
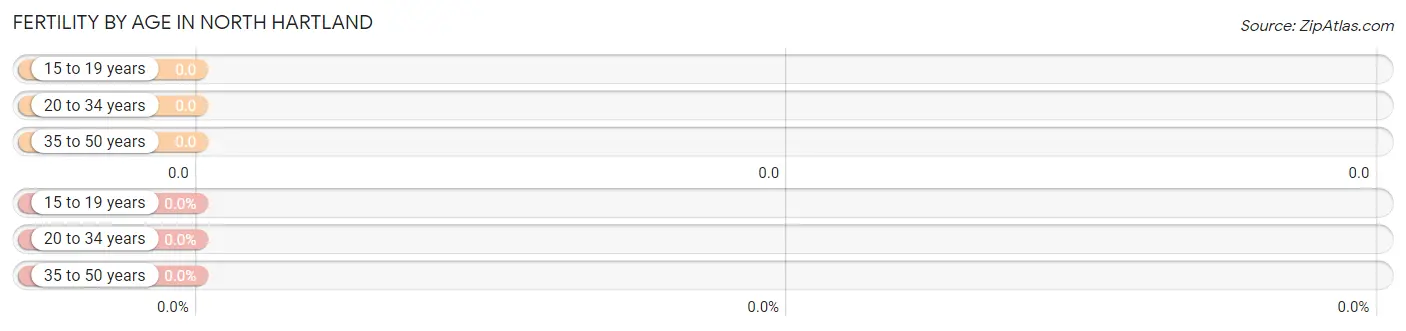
| Age Bracket | Women with Births | Births / 1,000 Women |
| 15 to 19 years | 0 (0.0%) | 0.0 |
| 20 to 34 years | 0 (0.0%) | 0.0 |
| 35 to 50 years | 0 (0.0%) | 0.0 |
| Total | 0 (0.0%) | 0.0 |
Fertility by Age by Marriage Status in North Hartland
| Age Bracket | Married | Unmarried |
| 15 to 19 years | 0 (0.0%) | 0 (0.0%) |
| 20 to 34 years | 0 (0.0%) | 0 (0.0%) |
| 35 to 50 years | 0 (0.0%) | 0 (0.0%) |
| Total | 0 (0.0%) | 0 (0.0%) |
Fertility by Education in North Hartland
| Educational Attainment | Women with Births | Births / 1,000 Women |
| Less than High School | 0 (0.0%) | 0.0 |
| High School Diploma | 0 (0.0%) | 0.0 |
| College or Associate's Degree | 0 (0.0%) | 0.0 |
| Bachelor's Degree | 0 (0.0%) | 0.0 |
| Graduate Degree | 0 (0.0%) | 0.0 |
| Total | 0 (0.0%) | 0.0 |
Fertility by Education by Marriage Status in North Hartland
| Educational Attainment | Married | Unmarried |
| Less than High School | 0 (0.0%) | 0 (0.0%) |
| High School Diploma | 0 (0.0%) | 0 (0.0%) |
| College or Associate's Degree | 0 (0.0%) | 0 (0.0%) |
| Bachelor's Degree | 0 (0.0%) | 0 (0.0%) |
| Graduate Degree | 0 (0.0%) | 0 (0.0%) |
| Total | 0 (0.0%) | 0 (0.0%) |
Employment Characteristics in North Hartland
Employment by Class of Employer in North Hartland
Among the 191 employed individuals in North Hartland, not-for-profit organizations (119 | 62.3%), and private company employees (72 | 37.7%) make up the most common classes of employment.
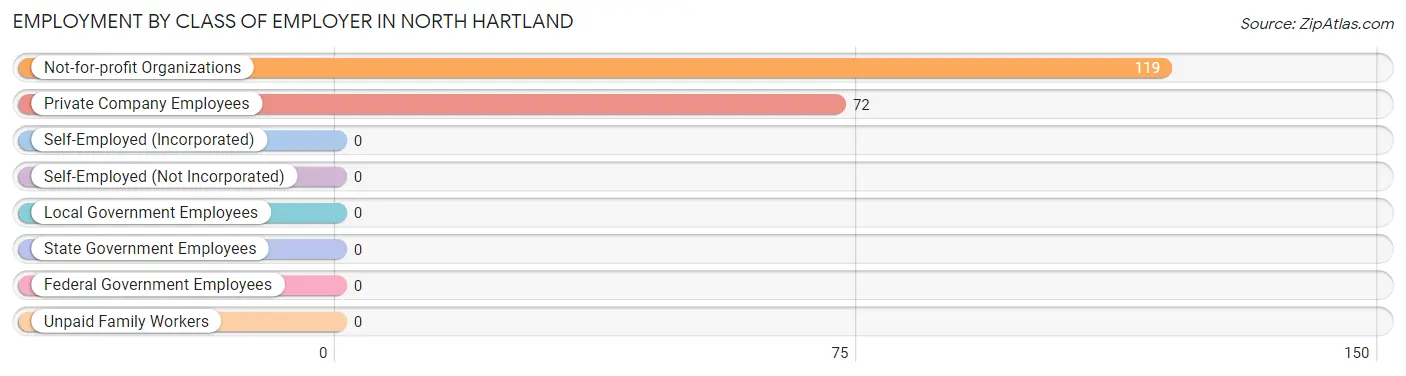
| Employer Class | # Employees | % Employees |
| Private Company Employees | 72 | 37.7% |
| Self-Employed (Incorporated) | 0 | 0.0% |
| Self-Employed (Not Incorporated) | 0 | 0.0% |
| Not-for-profit Organizations | 119 | 62.3% |
| Local Government Employees | 0 | 0.0% |
| State Government Employees | 0 | 0.0% |
| Federal Government Employees | 0 | 0.0% |
| Unpaid Family Workers | 0 | 0.0% |
| Total | 191 | 100.0% |
Employment Status by Age in North Hartland
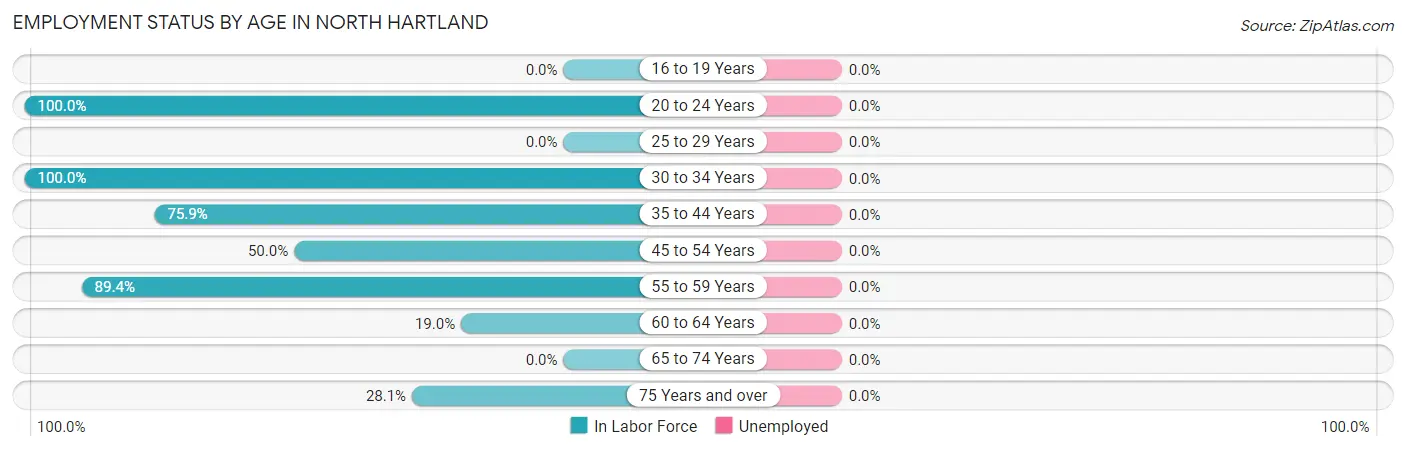
| Age Bracket | In Labor Force | Unemployed |
| 16 to 19 Years | 0 (0.0%) | 0 (0.0%) |
| 20 to 24 Years | 28 (100.0%) | 0 (0.0%) |
| 25 to 29 Years | 0 (0.0%) | 0 (0.0%) |
| 30 to 34 Years | 18 (100.0%) | 0 (0.0%) |
| 35 to 44 Years | 41 (75.9%) | 0 (0.0%) |
| 45 to 54 Years | 18 (50.0%) | 0 (0.0%) |
| 55 to 59 Years | 59 (89.4%) | 0 (0.0%) |
| 60 to 64 Years | 11 (19.0%) | 0 (0.0%) |
| 65 to 74 Years | 0 (0.0%) | 0 (0.0%) |
| 75 Years and over | 16 (28.1%) | 0 (0.0%) |
| Total | 191 (54.9%) | 0 (0.0%) |
Employment Status by Educational Attainment in North Hartland
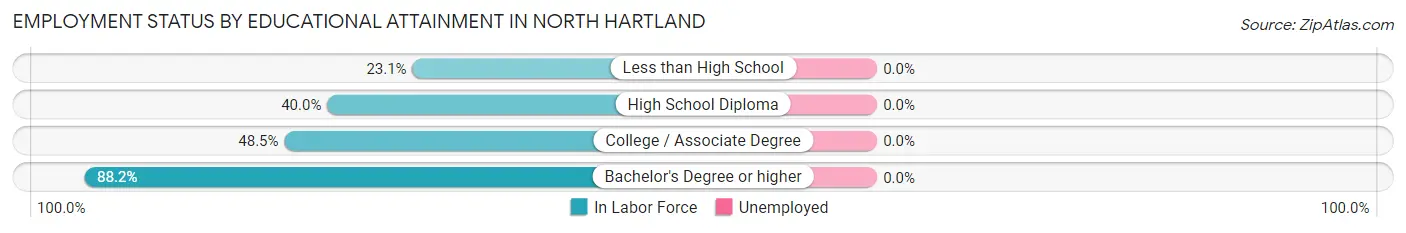
| Educational Attainment | In Labor Force | Unemployed |
| Less than High School | 6 (23.1%) | 0 (0.0%) |
| High School Diploma | 12 (40.0%) | 0 (0.0%) |
| College / Associate Degree | 32 (48.5%) | 0 (0.0%) |
| Bachelor's Degree or higher | 97 (88.2%) | 0 (0.0%) |
| Total | 147 (63.4%) | 0 (0.0%) |
Employment Occupations by Sex in North Hartland
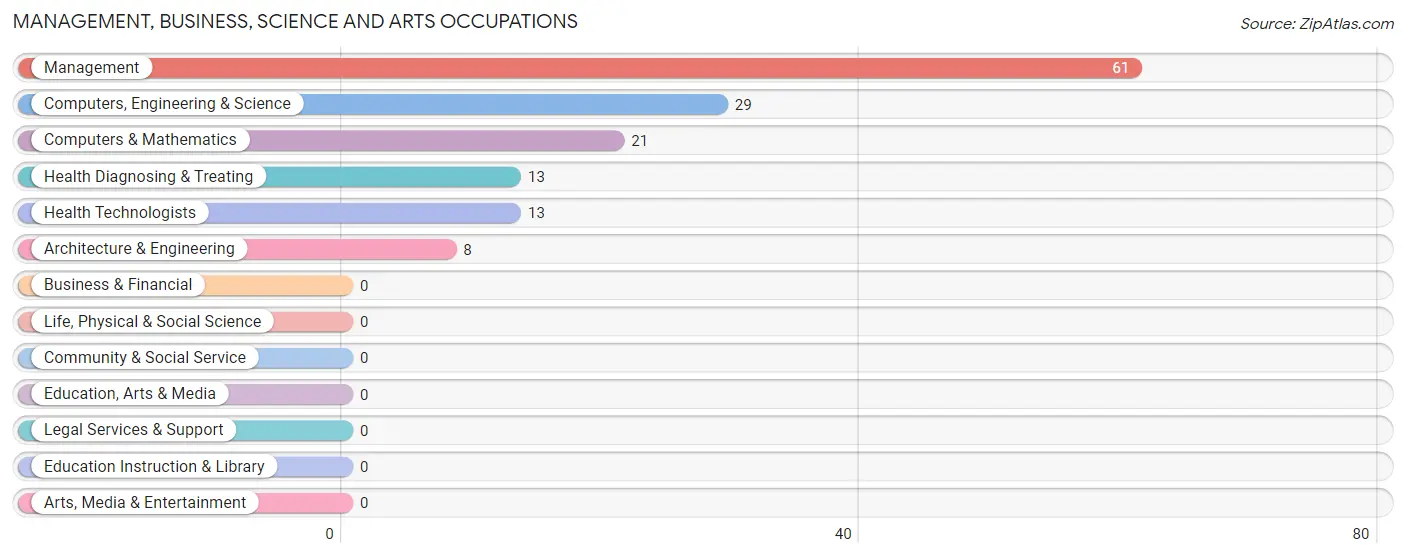
Management, Business, Science and Arts Occupations
The most common Management, Business, Science and Arts occupations in North Hartland are Management (61 | 31.9%), Computers, Engineering & Science (29 | 15.2%), Computers & Mathematics (21 | 11.0%), Health Diagnosing & Treating (13 | 6.8%), and Health Technologists (13 | 6.8%).
Management, Business, Science and Arts Occupations by Sex
Within the Management, Business, Science and Arts occupations in North Hartland, the most male-oriented occupations are Computers, Engineering & Science (100.0%), Computers & Mathematics (100.0%), and Architecture & Engineering (100.0%), while the most female-oriented occupations are Health Diagnosing & Treating (100.0%), Health Technologists (100.0%), and Management (70.5%).
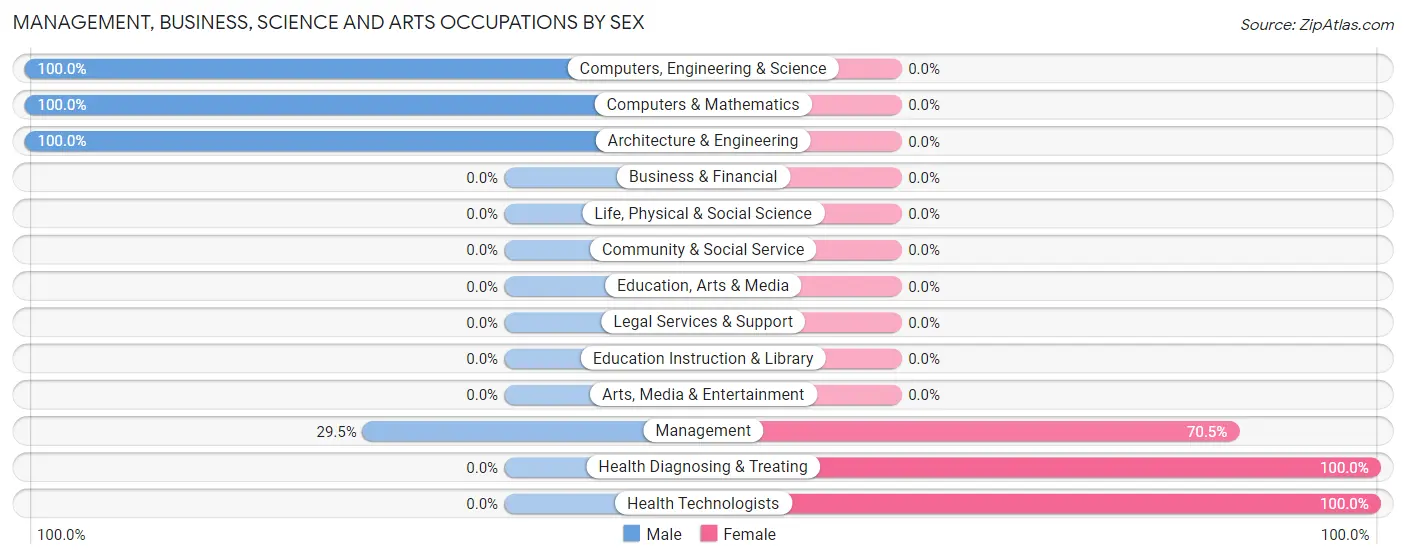
| Occupation | Male | Female |
| Management | 18 (29.5%) | 43 (70.5%) |
| Business & Financial | 0 (0.0%) | 0 (0.0%) |
| Computers, Engineering & Science | 29 (100.0%) | 0 (0.0%) |
| Computers & Mathematics | 21 (100.0%) | 0 (0.0%) |
| Architecture & Engineering | 8 (100.0%) | 0 (0.0%) |
| Life, Physical & Social Science | 0 (0.0%) | 0 (0.0%) |
| Community & Social Service | 0 (0.0%) | 0 (0.0%) |
| Education, Arts & Media | 0 (0.0%) | 0 (0.0%) |
| Legal Services & Support | 0 (0.0%) | 0 (0.0%) |
| Education Instruction & Library | 0 (0.0%) | 0 (0.0%) |
| Arts, Media & Entertainment | 0 (0.0%) | 0 (0.0%) |
| Health Diagnosing & Treating | 0 (0.0%) | 13 (100.0%) |
| Health Technologists | 0 (0.0%) | 13 (100.0%) |
| Total (Category) | 47 (45.6%) | 56 (54.4%) |
| Total (Overall) | 95 (49.7%) | 96 (50.3%) |
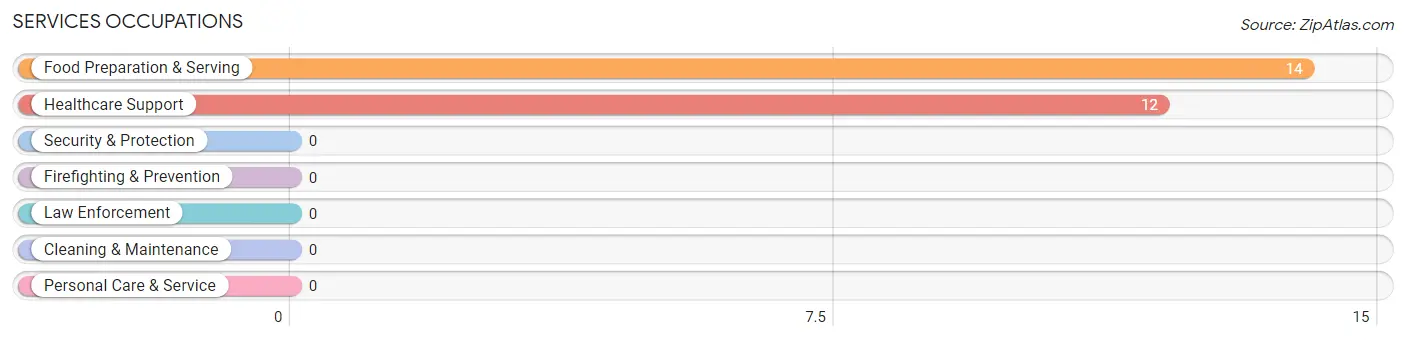
Services Occupations
The most common Services occupations in North Hartland are Food Preparation & Serving (14 | 7.3%), and Healthcare Support (12 | 6.3%).
Services Occupations by Sex
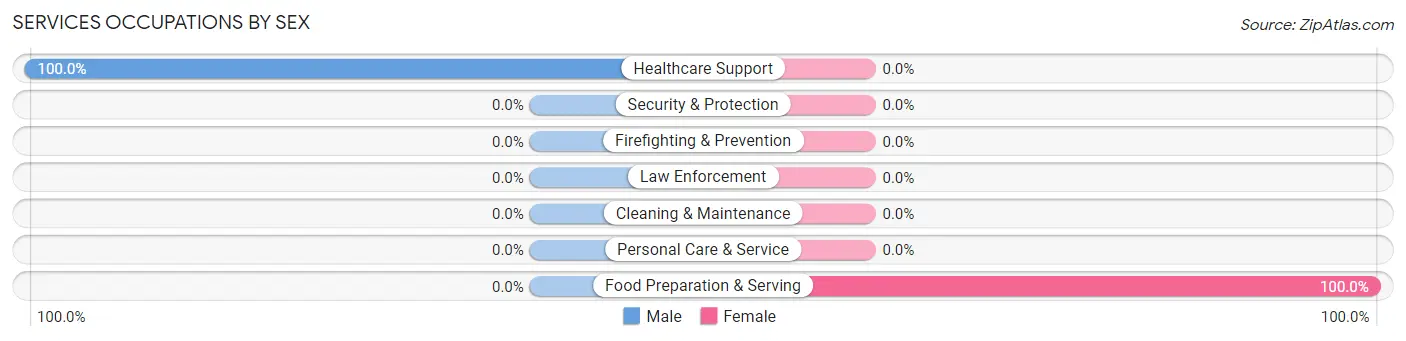
| Occupation | Male | Female |
| Healthcare Support | 12 (100.0%) | 0 (0.0%) |
| Security & Protection | 0 (0.0%) | 0 (0.0%) |
| Firefighting & Prevention | 0 (0.0%) | 0 (0.0%) |
| Law Enforcement | 0 (0.0%) | 0 (0.0%) |
| Food Preparation & Serving | 0 (0.0%) | 14 (100.0%) |
| Cleaning & Maintenance | 0 (0.0%) | 0 (0.0%) |
| Personal Care & Service | 0 (0.0%) | 0 (0.0%) |
| Total (Category) | 12 (46.2%) | 14 (53.8%) |
| Total (Overall) | 95 (49.7%) | 96 (50.3%) |
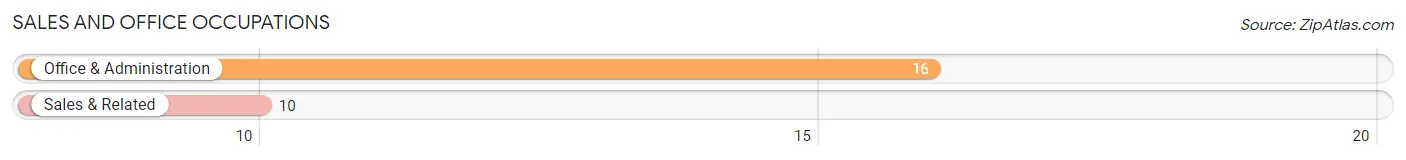
Sales and Office Occupations
The most common Sales and Office occupations in North Hartland are Office & Administration (16 | 8.4%), and Sales & Related (10 | 5.2%).
Sales and Office Occupations by Sex
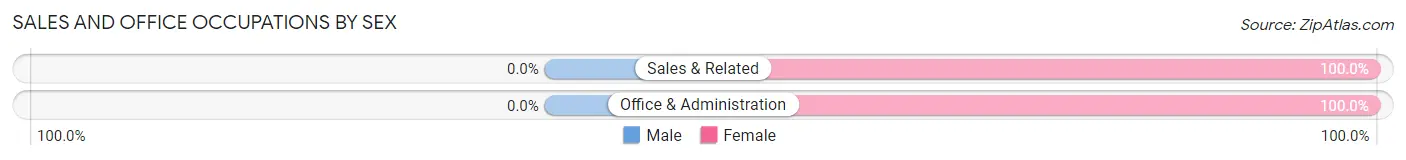
| Occupation | Male | Female |
| Sales & Related | 0 (0.0%) | 10 (100.0%) |
| Office & Administration | 0 (0.0%) | 16 (100.0%) |
| Total (Category) | 0 (0.0%) | 26 (100.0%) |
| Total (Overall) | 95 (49.7%) | 96 (50.3%) |
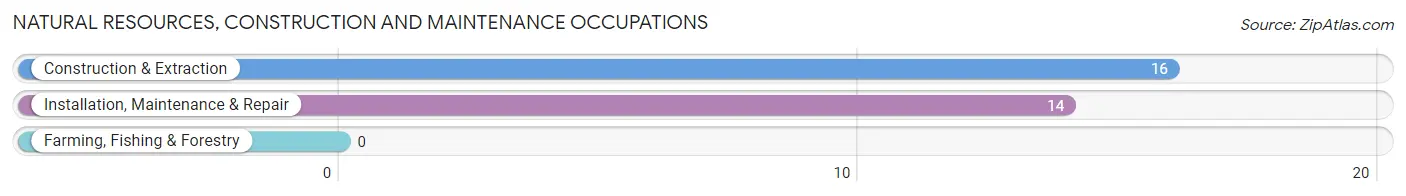
Natural Resources, Construction and Maintenance Occupations
The most common Natural Resources, Construction and Maintenance occupations in North Hartland are Construction & Extraction (16 | 8.4%), and Installation, Maintenance & Repair (14 | 7.3%).
Natural Resources, Construction and Maintenance Occupations by Sex
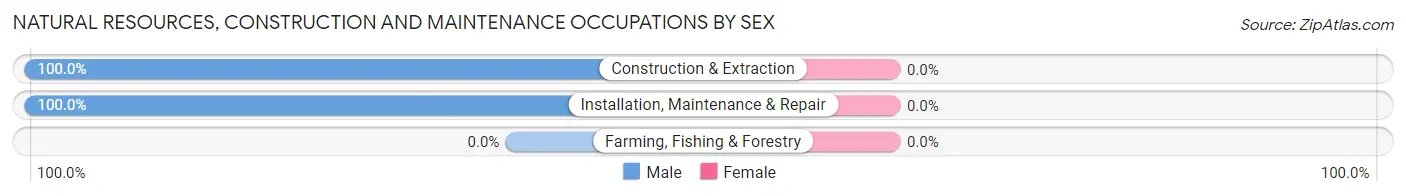
| Occupation | Male | Female |
| Farming, Fishing & Forestry | 0 (0.0%) | 0 (0.0%) |
| Construction & Extraction | 16 (100.0%) | 0 (0.0%) |
| Installation, Maintenance & Repair | 14 (100.0%) | 0 (0.0%) |
| Total (Category) | 30 (100.0%) | 0 (0.0%) |
| Total (Overall) | 95 (49.7%) | 96 (50.3%) |
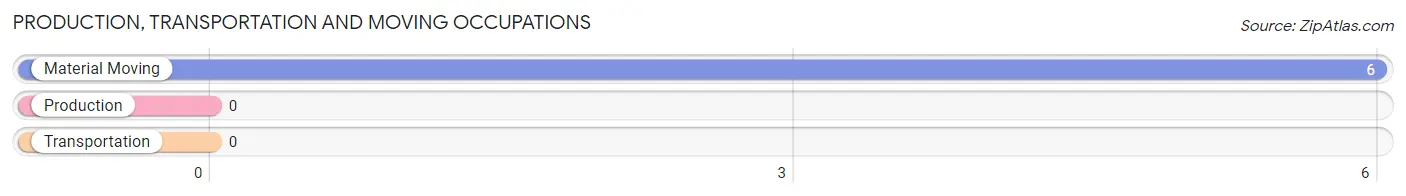
Production, Transportation and Moving Occupations
The most common Production, Transportation and Moving occupations in North Hartland are , and Material Moving (6 | 3.1%).
Production, Transportation and Moving Occupations by Sex
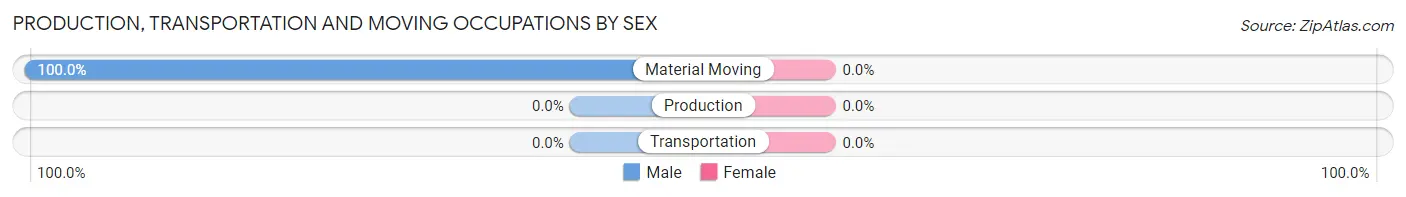
| Occupation | Male | Female |
| Production | 0 (0.0%) | 0 (0.0%) |
| Transportation | 0 (0.0%) | 0 (0.0%) |
| Material Moving | 6 (100.0%) | 0 (0.0%) |
| Total (Category) | 6 (100.0%) | 0 (0.0%) |
| Total (Overall) | 95 (49.7%) | 96 (50.3%) |
Employment Industries by Sex in North Hartland
Employment Industries in North Hartland
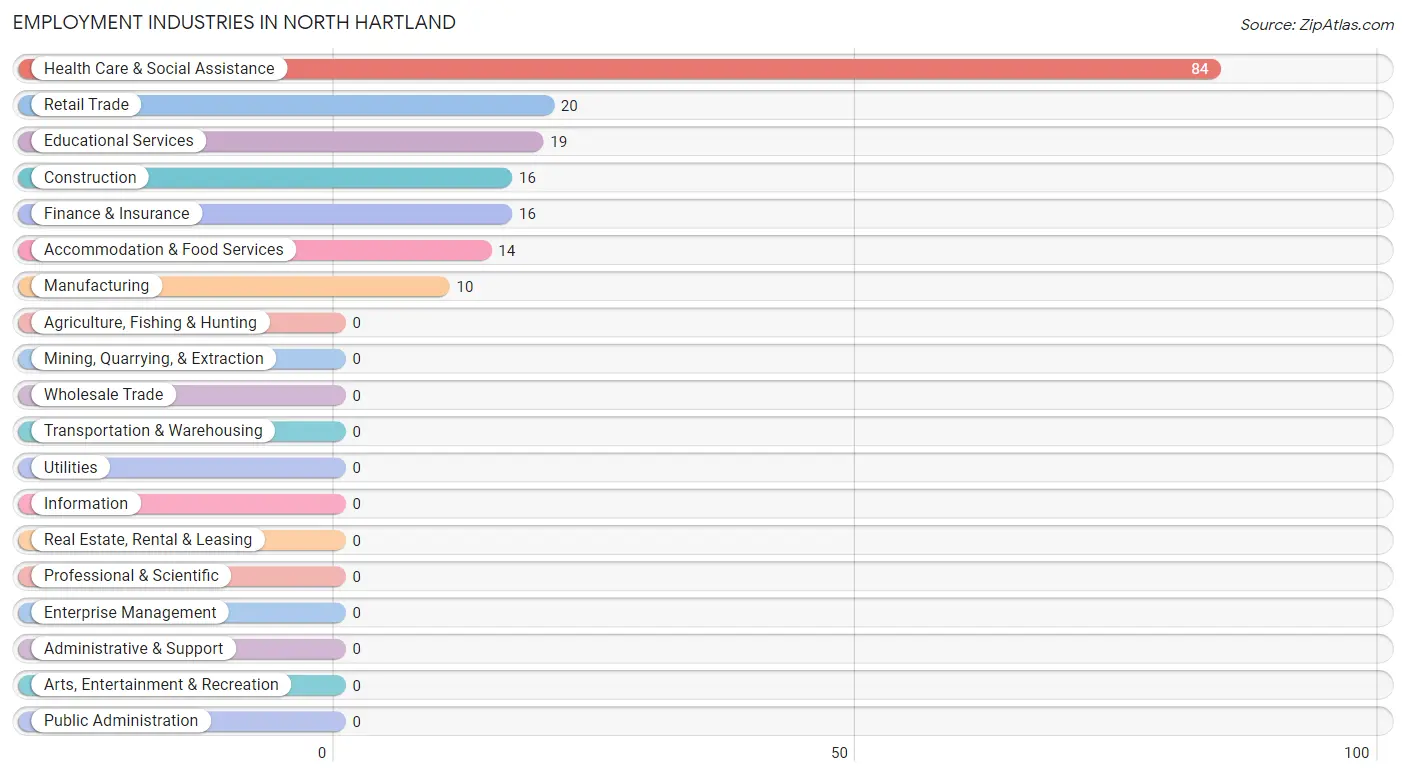
The major employment industries in North Hartland include Health Care & Social Assistance (84 | 44.0%), Retail Trade (20 | 10.5%), Educational Services (19 | 10.0%), Construction (16 | 8.4%), and Finance & Insurance (16 | 8.4%).
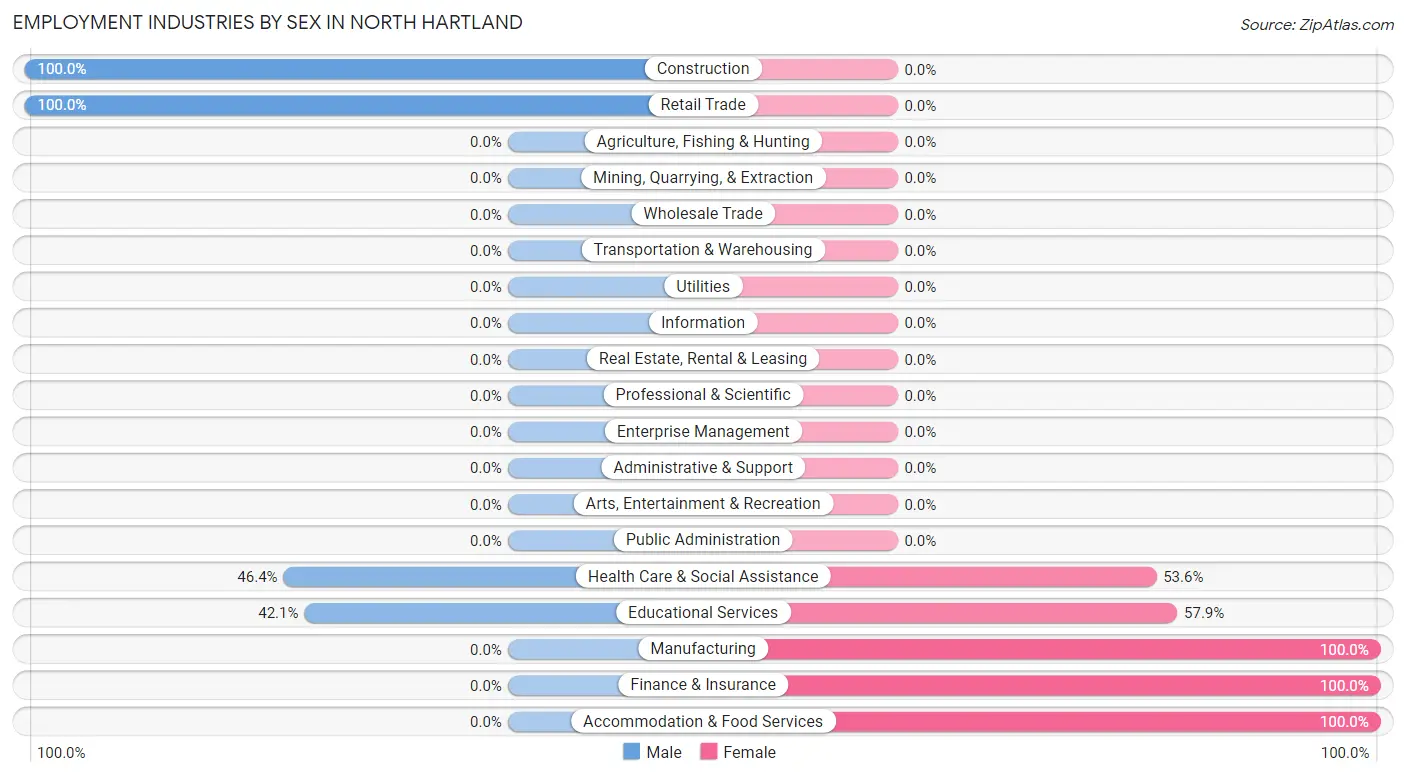
Employment Industries by Sex in North Hartland
The North Hartland industries that see more men than women are Construction (100.0%), Retail Trade (100.0%), and Health Care & Social Assistance (46.4%), whereas the industries that tend to have a higher number of women are Manufacturing (100.0%), Finance & Insurance (100.0%), and Accommodation & Food Services (100.0%).
| Industry | Male | Female |
| Agriculture, Fishing & Hunting | 0 (0.0%) | 0 (0.0%) |
| Mining, Quarrying, & Extraction | 0 (0.0%) | 0 (0.0%) |
| Construction | 16 (100.0%) | 0 (0.0%) |
| Manufacturing | 0 (0.0%) | 10 (100.0%) |
| Wholesale Trade | 0 (0.0%) | 0 (0.0%) |
| Retail Trade | 20 (100.0%) | 0 (0.0%) |
| Transportation & Warehousing | 0 (0.0%) | 0 (0.0%) |
| Utilities | 0 (0.0%) | 0 (0.0%) |
| Information | 0 (0.0%) | 0 (0.0%) |
| Finance & Insurance | 0 (0.0%) | 16 (100.0%) |
| Real Estate, Rental & Leasing | 0 (0.0%) | 0 (0.0%) |
| Professional & Scientific | 0 (0.0%) | 0 (0.0%) |
| Enterprise Management | 0 (0.0%) | 0 (0.0%) |
| Administrative & Support | 0 (0.0%) | 0 (0.0%) |
| Educational Services | 8 (42.1%) | 11 (57.9%) |
| Health Care & Social Assistance | 39 (46.4%) | 45 (53.6%) |
| Arts, Entertainment & Recreation | 0 (0.0%) | 0 (0.0%) |
| Accommodation & Food Services | 0 (0.0%) | 14 (100.0%) |
| Public Administration | 0 (0.0%) | 0 (0.0%) |
| Total | 95 (49.7%) | 96 (50.3%) |
Education in North Hartland
School Enrollment in North Hartland
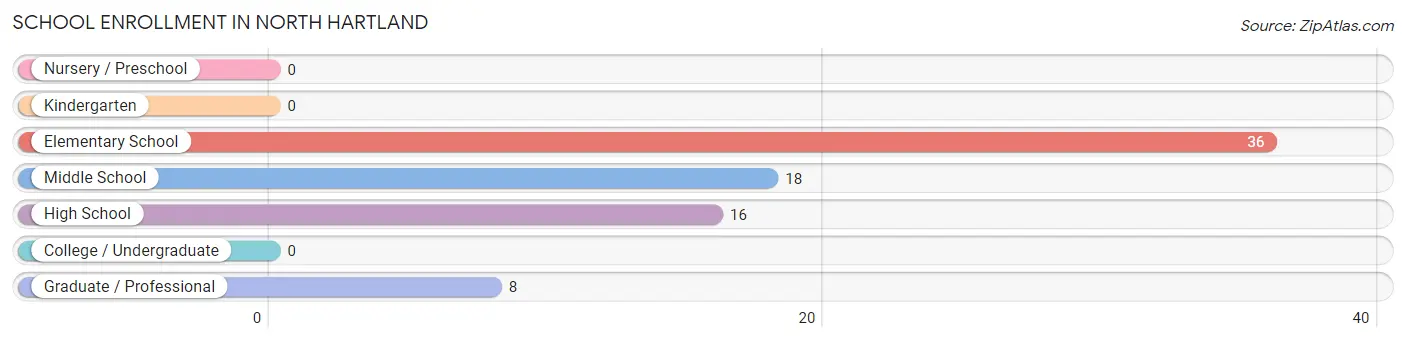
The most common levels of schooling among the 78 students in North Hartland are elementary school (36 | 46.2%), middle school (18 | 23.1%), and high school (16 | 20.5%).
| School Level | # Students | % Students |
| Nursery / Preschool | 0 | 0.0% |
| Kindergarten | 0 | 0.0% |
| Elementary School | 36 | 46.2% |
| Middle School | 18 | 23.1% |
| High School | 16 | 20.5% |
| College / Undergraduate | 0 | 0.0% |
| Graduate / Professional | 8 | 10.3% |
| Total | 78 | 100.0% |
School Enrollment by Age by Funding Source in North Hartland
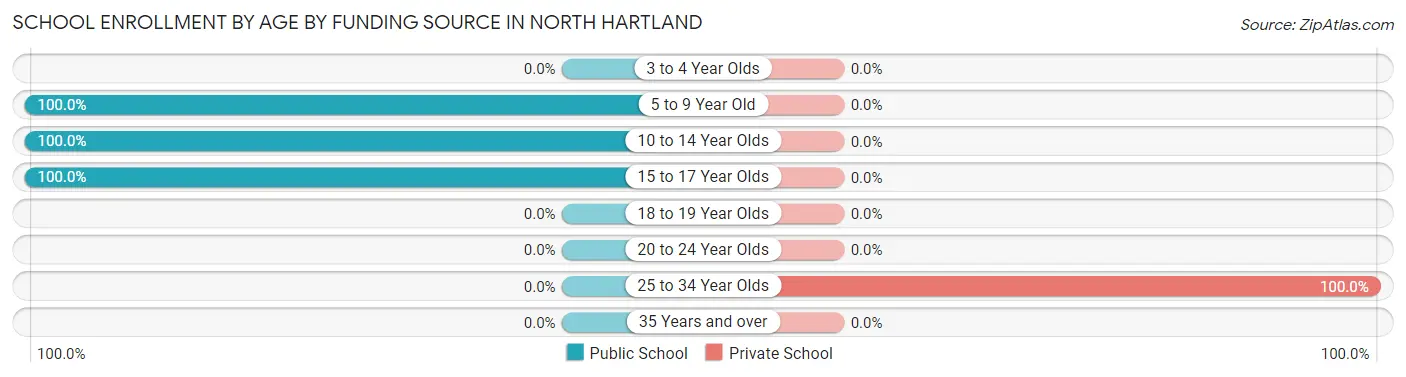
Out of a total of 78 students who are enrolled in schools in North Hartland, 8 (10.3%) attend a private institution, while the remaining 70 (89.7%) are enrolled in public schools. The age group of 25 to 34 year olds has the highest likelihood of being enrolled in private schools, with 8 (100.0% in the age bracket) enrolled. Conversely, the age group of 5 to 9 year old has the lowest likelihood of being enrolled in a private school, with 36 (100.0% in the age bracket) attending a public institution.
| Age Bracket | Public School | Private School |
| 3 to 4 Year Olds | 0 (0.0%) | 0 (0.0%) |
| 5 to 9 Year Old | 36 (100.0%) | 0 (0.0%) |
| 10 to 14 Year Olds | 18 (100.0%) | 0 (0.0%) |
| 15 to 17 Year Olds | 16 (100.0%) | 0 (0.0%) |
| 18 to 19 Year Olds | 0 (0.0%) | 0 (0.0%) |
| 20 to 24 Year Olds | 0 (0.0%) | 0 (0.0%) |
| 25 to 34 Year Olds | 0 (0.0%) | 8 (100.0%) |
| 35 Years and over | 0 (0.0%) | 0 (0.0%) |
| Total | 70 (89.7%) | 8 (10.3%) |
Educational Attainment by Field of Study in North Hartland
Computers & mathematics (28 | 23.0%), communications (23 | 18.9%), social sciences (21 | 17.2%), bio, nature & agricultural (18 | 14.7%), and science & technology (13 | 10.7%) are the most common fields of study among 122 individuals in North Hartland who have obtained a bachelor's degree or higher.
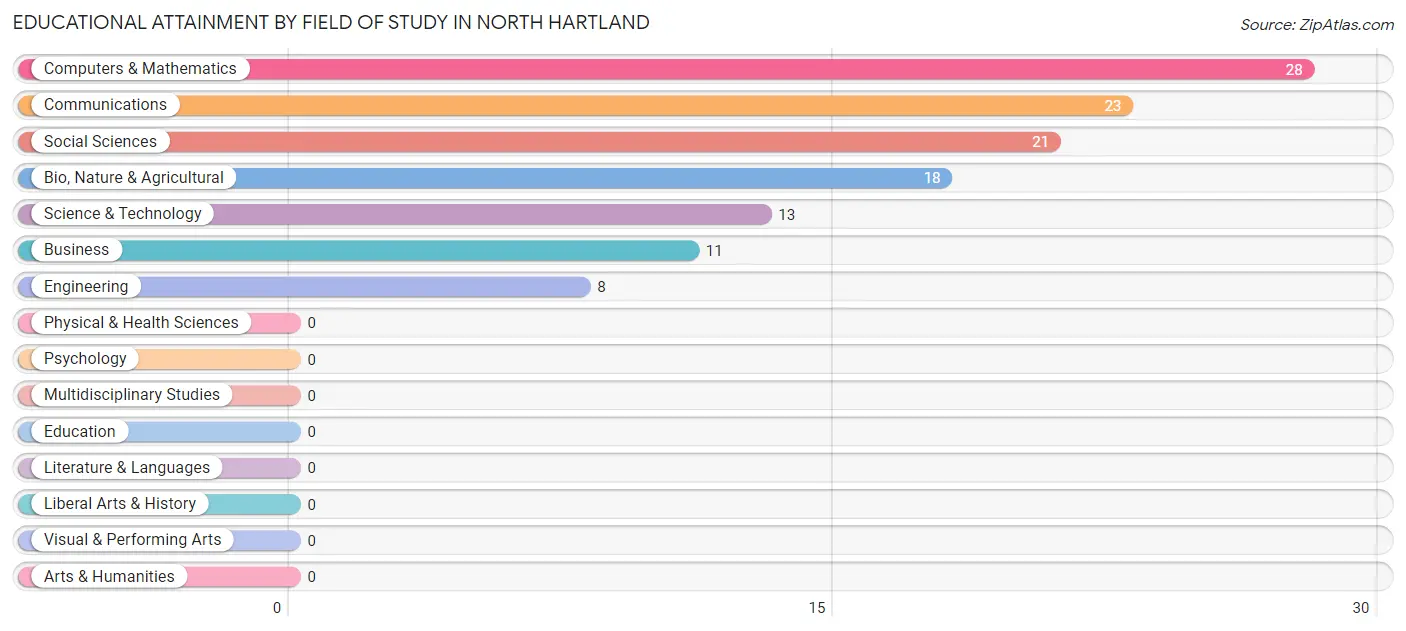
| Field of Study | # Graduates | % Graduates |
| Computers & Mathematics | 28 | 23.0% |
| Bio, Nature & Agricultural | 18 | 14.7% |
| Physical & Health Sciences | 0 | 0.0% |
| Psychology | 0 | 0.0% |
| Social Sciences | 21 | 17.2% |
| Engineering | 8 | 6.6% |
| Multidisciplinary Studies | 0 | 0.0% |
| Science & Technology | 13 | 10.7% |
| Business | 11 | 9.0% |
| Education | 0 | 0.0% |
| Literature & Languages | 0 | 0.0% |
| Liberal Arts & History | 0 | 0.0% |
| Visual & Performing Arts | 0 | 0.0% |
| Communications | 23 | 18.9% |
| Arts & Humanities | 0 | 0.0% |
| Total | 122 | 100.0% |
Transportation & Commute in North Hartland
Vehicle Availability by Sex in North Hartland
The most prevalent vehicle ownership categories in North Hartland are males with 2 vehicles (41, accounting for 43.2%) and females with 2 vehicles (26, making up 42.7%).
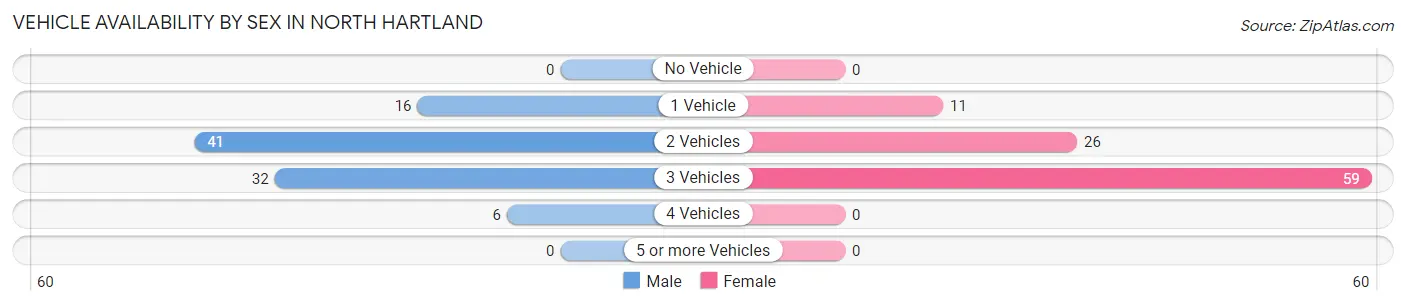
| Vehicles Available | Male | Female |
| No Vehicle | 0 (0.0%) | 0 (0.0%) |
| 1 Vehicle | 16 (16.8%) | 11 (11.5%) |
| 2 Vehicles | 41 (43.2%) | 26 (27.1%) |
| 3 Vehicles | 32 (33.7%) | 59 (61.5%) |
| 4 Vehicles | 6 (6.3%) | 0 (0.0%) |
| 5 or more Vehicles | 0 (0.0%) | 0 (0.0%) |
| Total | 95 (100.0%) | 96 (100.0%) |
Commute Time in North Hartland
The most frequently occuring commute durations in North Hartland are 15 to 19 minutes (50 commuters, 27.6%), 20 to 24 minutes (49 commuters, 27.1%), and 30 to 34 minutes (37 commuters, 20.4%).
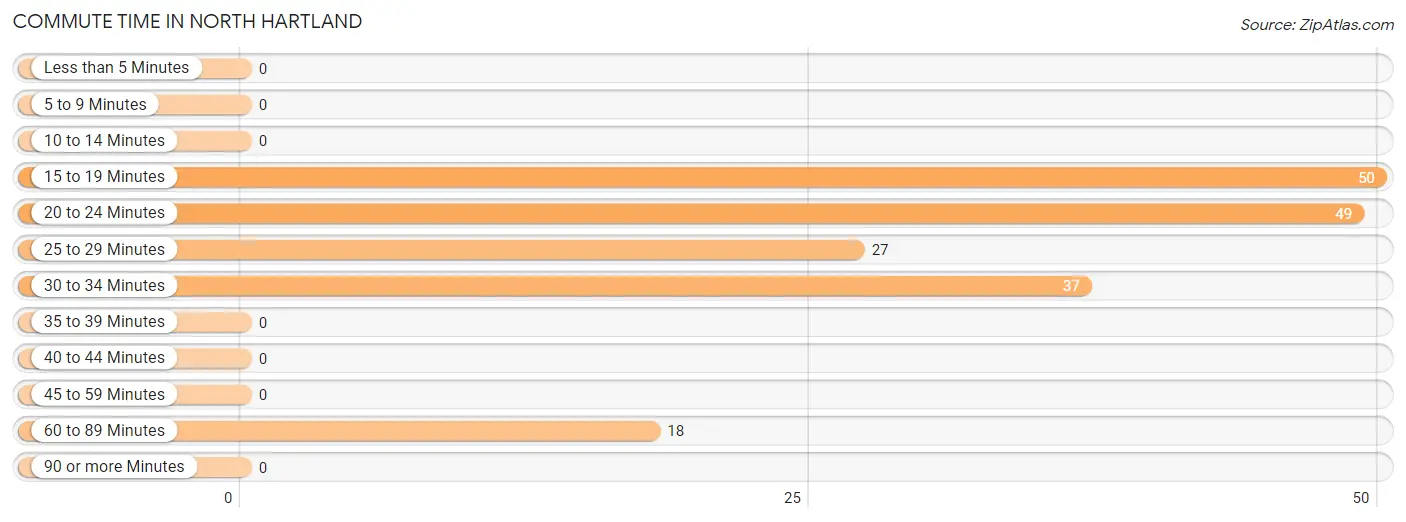
| Commute Time | # Commuters | % Commuters |
| Less than 5 Minutes | 0 | 0.0% |
| 5 to 9 Minutes | 0 | 0.0% |
| 10 to 14 Minutes | 0 | 0.0% |
| 15 to 19 Minutes | 50 | 27.6% |
| 20 to 24 Minutes | 49 | 27.1% |
| 25 to 29 Minutes | 27 | 14.9% |
| 30 to 34 Minutes | 37 | 20.4% |
| 35 to 39 Minutes | 0 | 0.0% |
| 40 to 44 Minutes | 0 | 0.0% |
| 45 to 59 Minutes | 0 | 0.0% |
| 60 to 89 Minutes | 18 | 9.9% |
| 90 or more Minutes | 0 | 0.0% |
Commute Time by Sex in North Hartland
The most common commute times in North Hartland are 15 to 19 minutes (36 commuters, 37.9%) for males and 20 to 24 minutes (43 commuters, 50.0%) for females.
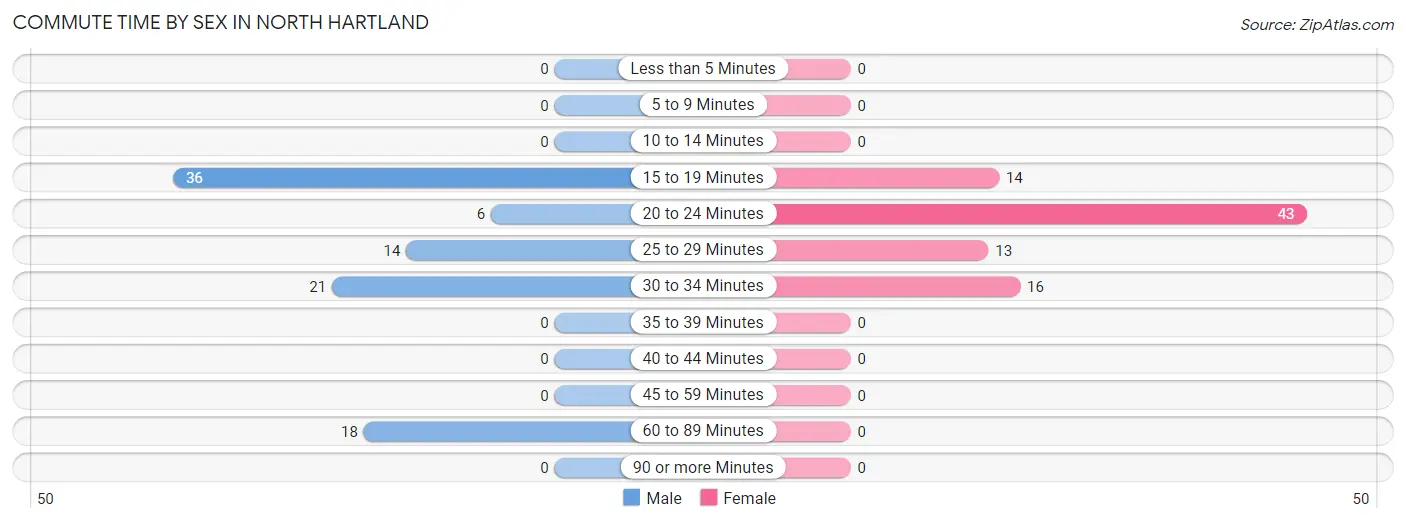
| Commute Time | Male | Female |
| Less than 5 Minutes | 0 (0.0%) | 0 (0.0%) |
| 5 to 9 Minutes | 0 (0.0%) | 0 (0.0%) |
| 10 to 14 Minutes | 0 (0.0%) | 0 (0.0%) |
| 15 to 19 Minutes | 36 (37.9%) | 14 (16.3%) |
| 20 to 24 Minutes | 6 (6.3%) | 43 (50.0%) |
| 25 to 29 Minutes | 14 (14.7%) | 13 (15.1%) |
| 30 to 34 Minutes | 21 (22.1%) | 16 (18.6%) |
| 35 to 39 Minutes | 0 (0.0%) | 0 (0.0%) |
| 40 to 44 Minutes | 0 (0.0%) | 0 (0.0%) |
| 45 to 59 Minutes | 0 (0.0%) | 0 (0.0%) |
| 60 to 89 Minutes | 18 (19.0%) | 0 (0.0%) |
| 90 or more Minutes | 0 (0.0%) | 0 (0.0%) |
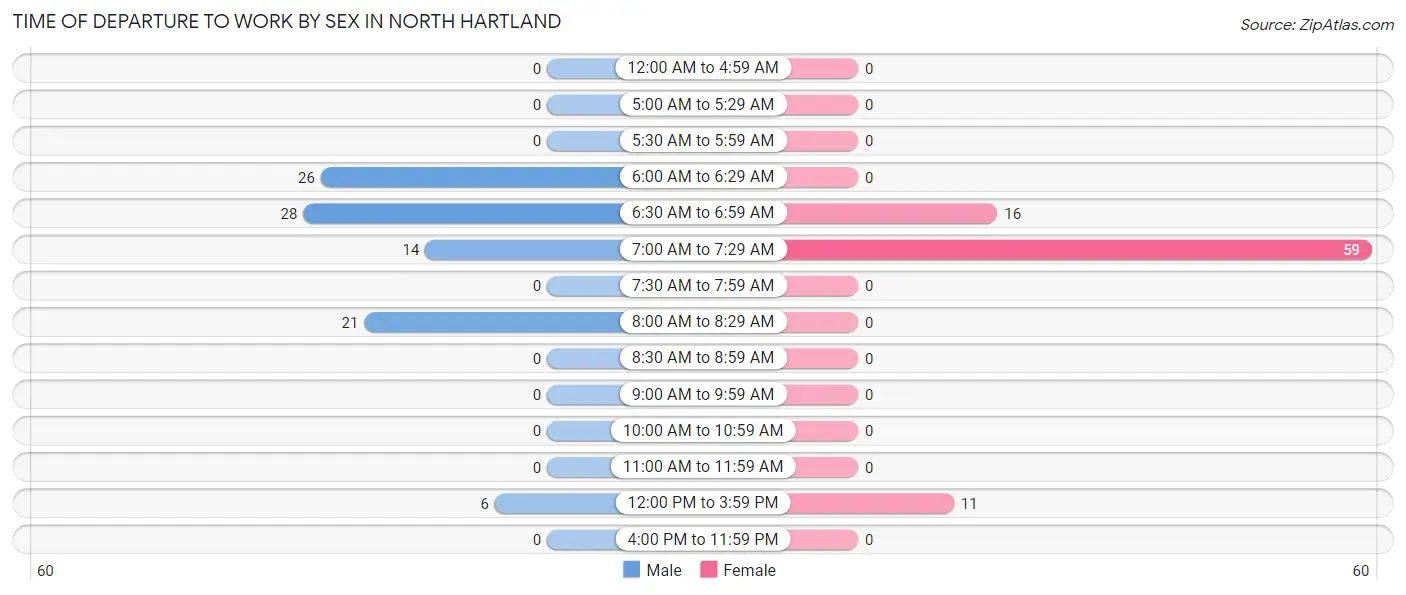
Time of Departure to Work by Sex in North Hartland
The most frequent times of departure to work in North Hartland are 6:30 AM to 6:59 AM (28, 29.5%) for males and 7:00 AM to 7:29 AM (59, 68.6%) for females.
| Time of Departure | Male | Female |
| 12:00 AM to 4:59 AM | 0 (0.0%) | 0 (0.0%) |
| 5:00 AM to 5:29 AM | 0 (0.0%) | 0 (0.0%) |
| 5:30 AM to 5:59 AM | 0 (0.0%) | 0 (0.0%) |
| 6:00 AM to 6:29 AM | 26 (27.4%) | 0 (0.0%) |
| 6:30 AM to 6:59 AM | 28 (29.5%) | 16 (18.6%) |
| 7:00 AM to 7:29 AM | 14 (14.7%) | 59 (68.6%) |
| 7:30 AM to 7:59 AM | 0 (0.0%) | 0 (0.0%) |
| 8:00 AM to 8:29 AM | 21 (22.1%) | 0 (0.0%) |
| 8:30 AM to 8:59 AM | 0 (0.0%) | 0 (0.0%) |
| 9:00 AM to 9:59 AM | 0 (0.0%) | 0 (0.0%) |
| 10:00 AM to 10:59 AM | 0 (0.0%) | 0 (0.0%) |
| 11:00 AM to 11:59 AM | 0 (0.0%) | 0 (0.0%) |
| 12:00 PM to 3:59 PM | 6 (6.3%) | 11 (12.8%) |
| 4:00 PM to 11:59 PM | 0 (0.0%) | 0 (0.0%) |
| Total | 95 (100.0%) | 86 (100.0%) |
Housing Occupancy in North Hartland
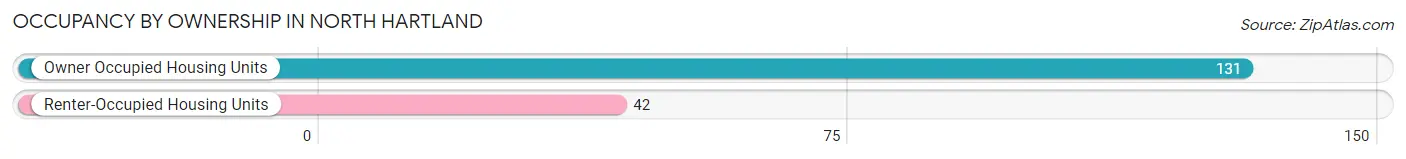
Occupancy by Ownership in North Hartland
Of the total 173 dwellings in North Hartland, owner-occupied units account for 131 (75.7%), while renter-occupied units make up 42 (24.3%).
| Occupancy | # Housing Units | % Housing Units |
| Owner Occupied Housing Units | 131 | 75.7% |
| Renter-Occupied Housing Units | 42 | 24.3% |
| Total Occupied Housing Units | 173 | 100.0% |
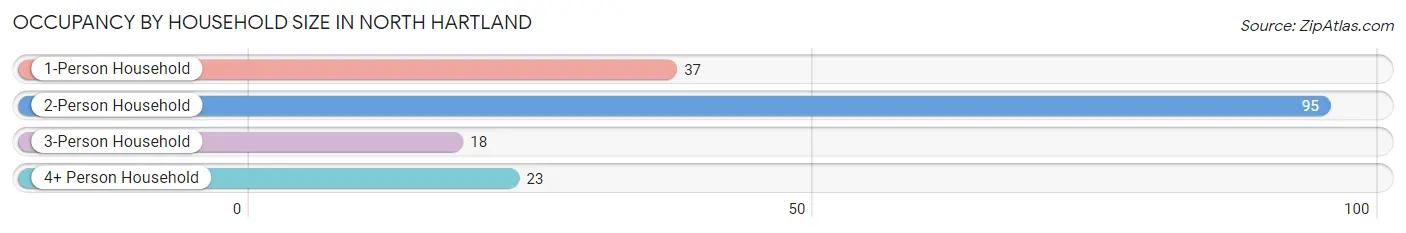
Occupancy by Household Size in North Hartland
| Household Size | # Housing Units | % Housing Units |
| 1-Person Household | 37 | 21.4% |
| 2-Person Household | 95 | 54.9% |
| 3-Person Household | 18 | 10.4% |
| 4+ Person Household | 23 | 13.3% |
| Total Housing Units | 173 | 100.0% |
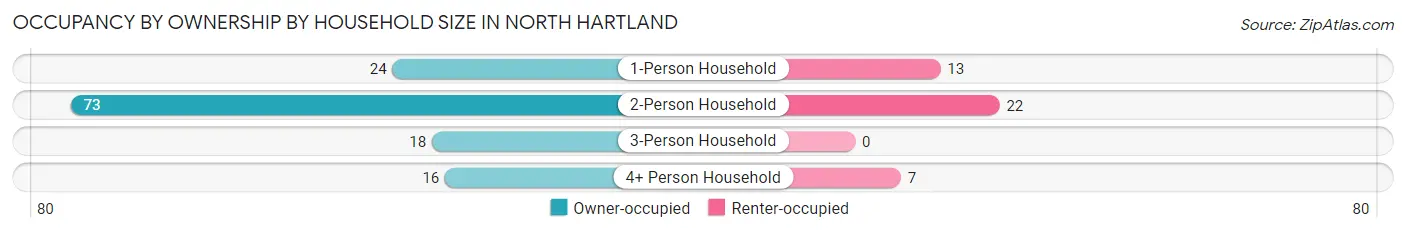
Occupancy by Ownership by Household Size in North Hartland
| Household Size | Owner-occupied | Renter-occupied |
| 1-Person Household | 24 (64.9%) | 13 (35.1%) |
| 2-Person Household | 73 (76.8%) | 22 (23.2%) |
| 3-Person Household | 18 (100.0%) | 0 (0.0%) |
| 4+ Person Household | 16 (69.6%) | 7 (30.4%) |
| Total Housing Units | 131 (75.7%) | 42 (24.3%) |
Occupancy by Educational Attainment in North Hartland
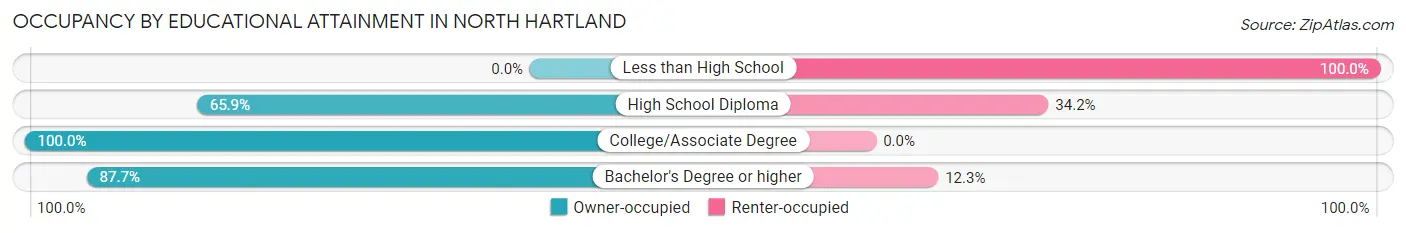
| Household Size | Owner-occupied | Renter-occupied |
| Less than High School | 0 (0.0%) | 20 (100.0%) |
| High School Diploma | 27 (65.8%) | 14 (34.2%) |
| College/Associate Degree | 47 (100.0%) | 0 (0.0%) |
| Bachelor's Degree or higher | 57 (87.7%) | 8 (12.3%) |
Occupancy by Age of Householder in North Hartland
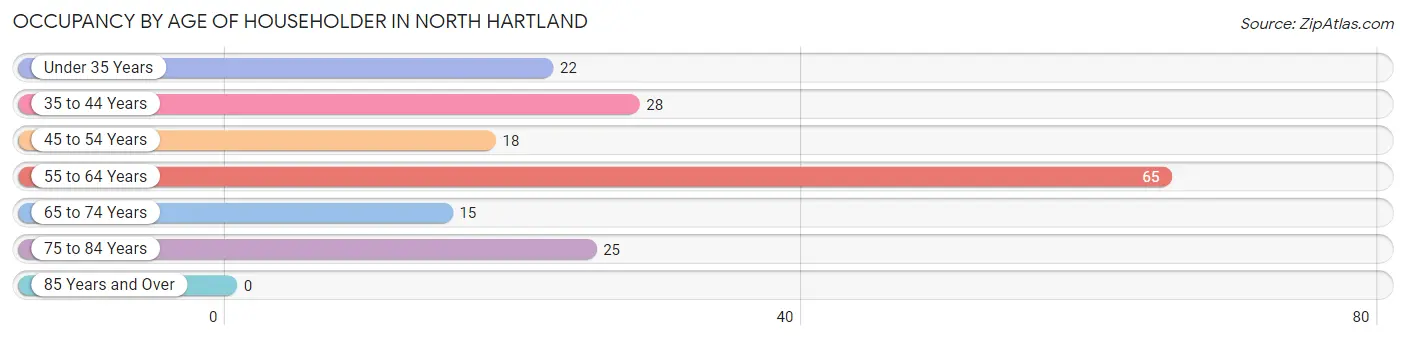
| Age Bracket | # Households | % Households |
| Under 35 Years | 22 | 12.7% |
| 35 to 44 Years | 28 | 16.2% |
| 45 to 54 Years | 18 | 10.4% |
| 55 to 64 Years | 65 | 37.6% |
| 65 to 74 Years | 15 | 8.7% |
| 75 to 84 Years | 25 | 14.4% |
| 85 Years and Over | 0 | 0.0% |
| Total | 173 | 100.0% |
Housing Finances in North Hartland
Median Income by Occupancy in North Hartland
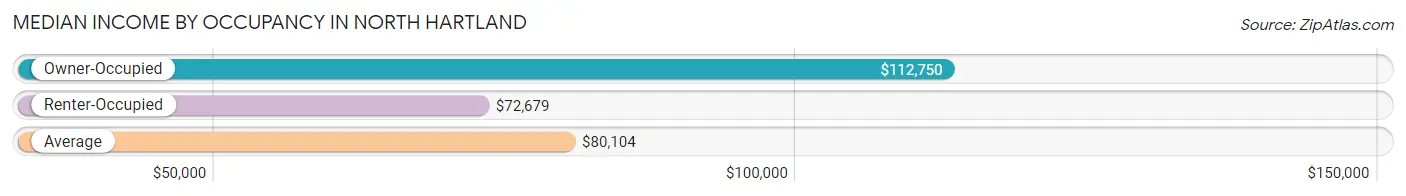
| Occupancy Type | # Households | Median Income |
| Owner-Occupied | 131 (75.7%) | $112,750 |
| Renter-Occupied | 42 (24.3%) | $72,679 |
| Average | 173 (100.0%) | $80,104 |
Occupancy by Householder Income Bracket in North Hartland
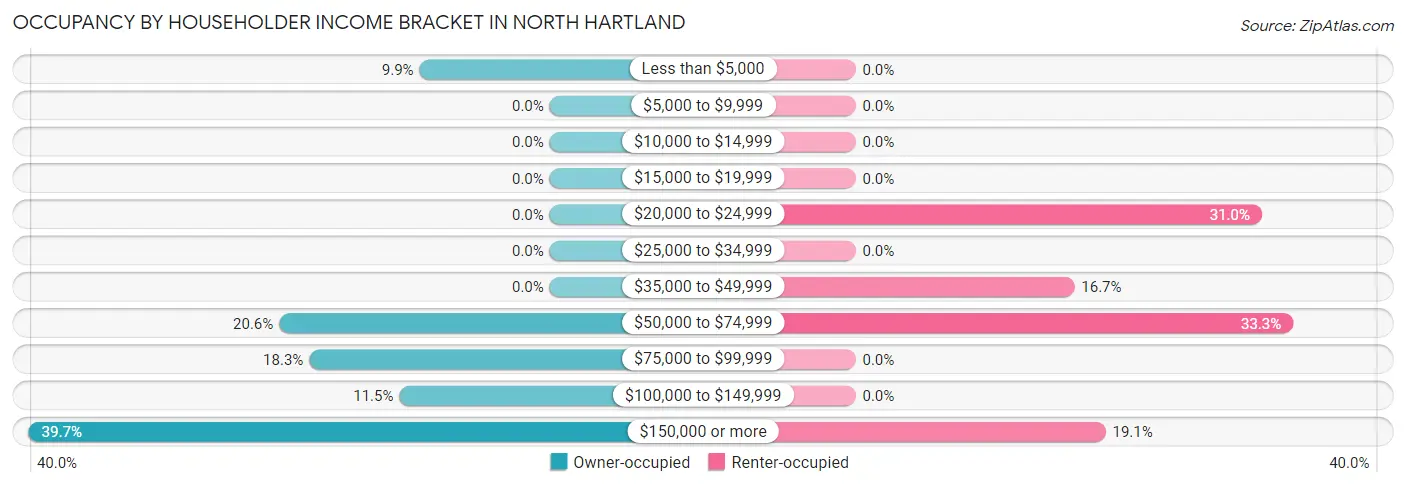
| Income Bracket | Owner-occupied | Renter-occupied |
| Less than $5,000 | 13 (9.9%) | 0 (0.0%) |
| $5,000 to $9,999 | 0 (0.0%) | 0 (0.0%) |
| $10,000 to $14,999 | 0 (0.0%) | 0 (0.0%) |
| $15,000 to $19,999 | 0 (0.0%) | 0 (0.0%) |
| $20,000 to $24,999 | 0 (0.0%) | 13 (30.9%) |
| $25,000 to $34,999 | 0 (0.0%) | 0 (0.0%) |
| $35,000 to $49,999 | 0 (0.0%) | 7 (16.7%) |
| $50,000 to $74,999 | 27 (20.6%) | 14 (33.3%) |
| $75,000 to $99,999 | 24 (18.3%) | 0 (0.0%) |
| $100,000 to $149,999 | 15 (11.5%) | 0 (0.0%) |
| $150,000 or more | 52 (39.7%) | 8 (19.1%) |
| Total | 131 (100.0%) | 42 (100.0%) |
Monthly Housing Cost Tiers in North Hartland
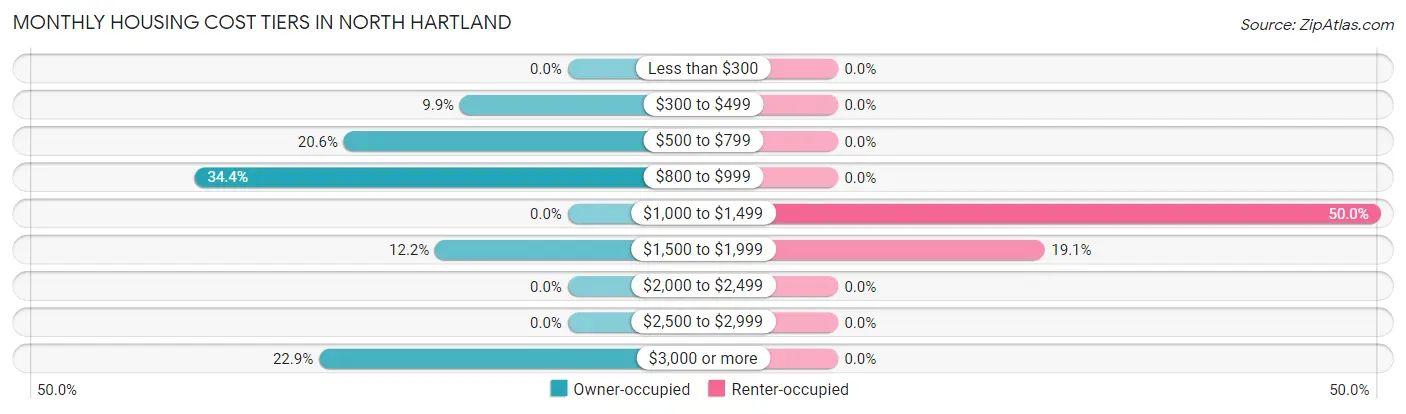
| Monthly Cost | Owner-occupied | Renter-occupied |
| Less than $300 | 0 (0.0%) | 0 (0.0%) |
| $300 to $499 | 13 (9.9%) | 0 (0.0%) |
| $500 to $799 | 27 (20.6%) | 0 (0.0%) |
| $800 to $999 | 45 (34.4%) | 0 (0.0%) |
| $1,000 to $1,499 | 0 (0.0%) | 21 (50.0%) |
| $1,500 to $1,999 | 16 (12.2%) | 8 (19.1%) |
| $2,000 to $2,499 | 0 (0.0%) | 0 (0.0%) |
| $2,500 to $2,999 | 0 (0.0%) | 0 (0.0%) |
| $3,000 or more | 30 (22.9%) | 0 (0.0%) |
| Total | 131 (100.0%) | 42 (100.0%) |
Physical Housing Characteristics in North Hartland
Housing Structures in North Hartland
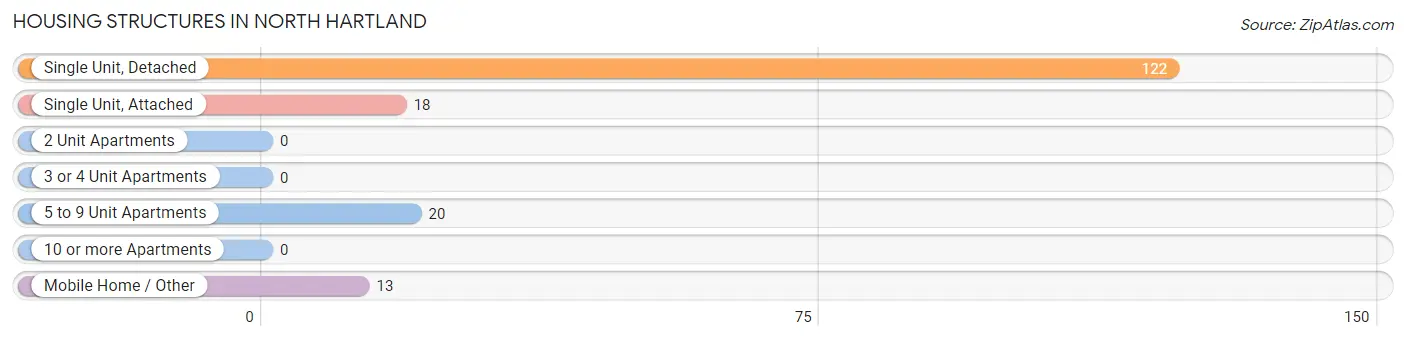
| Structure Type | # Housing Units | % Housing Units |
| Single Unit, Detached | 122 | 70.5% |
| Single Unit, Attached | 18 | 10.4% |
| 2 Unit Apartments | 0 | 0.0% |
| 3 or 4 Unit Apartments | 0 | 0.0% |
| 5 to 9 Unit Apartments | 20 | 11.6% |
| 10 or more Apartments | 0 | 0.0% |
| Mobile Home / Other | 13 | 7.5% |
| Total | 173 | 100.0% |
Housing Structures by Occupancy in North Hartland
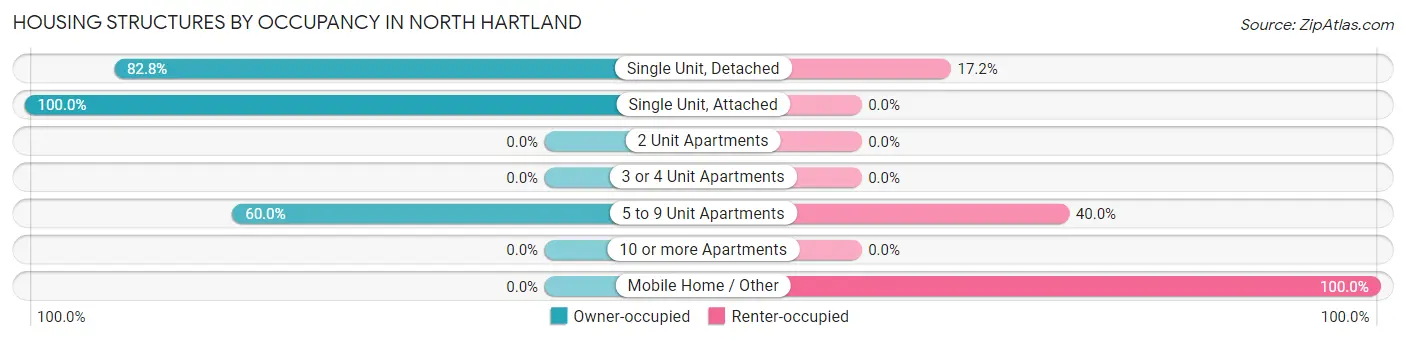
| Structure Type | Owner-occupied | Renter-occupied |
| Single Unit, Detached | 101 (82.8%) | 21 (17.2%) |
| Single Unit, Attached | 18 (100.0%) | 0 (0.0%) |
| 2 Unit Apartments | 0 (0.0%) | 0 (0.0%) |
| 3 or 4 Unit Apartments | 0 (0.0%) | 0 (0.0%) |
| 5 to 9 Unit Apartments | 12 (60.0%) | 8 (40.0%) |
| 10 or more Apartments | 0 (0.0%) | 0 (0.0%) |
| Mobile Home / Other | 0 (0.0%) | 13 (100.0%) |
| Total | 131 (75.7%) | 42 (24.3%) |
Housing Structures by Number of Rooms in North Hartland
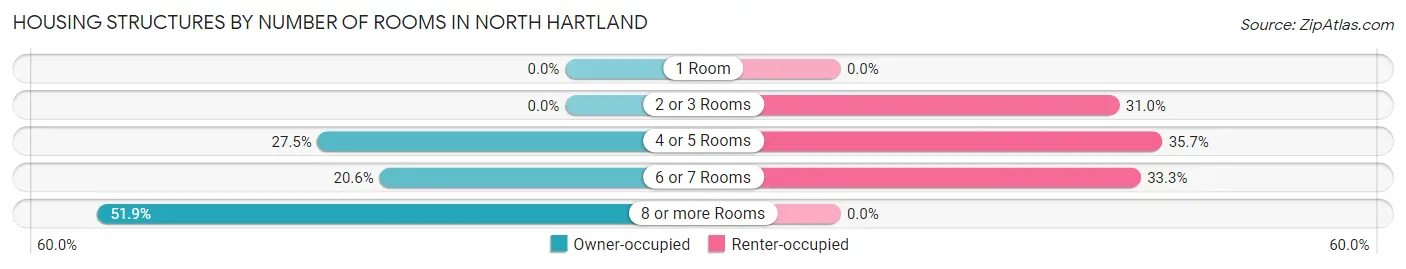
| Number of Rooms | Owner-occupied | Renter-occupied |
| 1 Room | 0 (0.0%) | 0 (0.0%) |
| 2 or 3 Rooms | 0 (0.0%) | 13 (30.9%) |
| 4 or 5 Rooms | 36 (27.5%) | 15 (35.7%) |
| 6 or 7 Rooms | 27 (20.6%) | 14 (33.3%) |
| 8 or more Rooms | 68 (51.9%) | 0 (0.0%) |
| Total | 131 (100.0%) | 42 (100.0%) |
Housing Structure by Heating Type in North Hartland
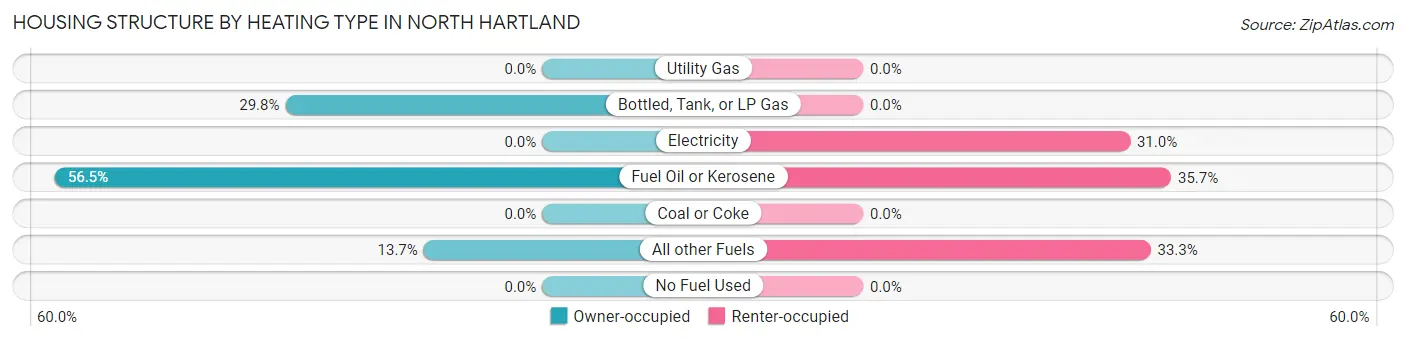
| Heating Type | Owner-occupied | Renter-occupied |
| Utility Gas | 0 (0.0%) | 0 (0.0%) |
| Bottled, Tank, or LP Gas | 39 (29.8%) | 0 (0.0%) |
| Electricity | 0 (0.0%) | 13 (30.9%) |
| Fuel Oil or Kerosene | 74 (56.5%) | 15 (35.7%) |
| Coal or Coke | 0 (0.0%) | 0 (0.0%) |
| All other Fuels | 18 (13.7%) | 14 (33.3%) |
| No Fuel Used | 0 (0.0%) | 0 (0.0%) |
| Total | 131 (100.0%) | 42 (100.0%) |
Household Vehicle Usage in North Hartland
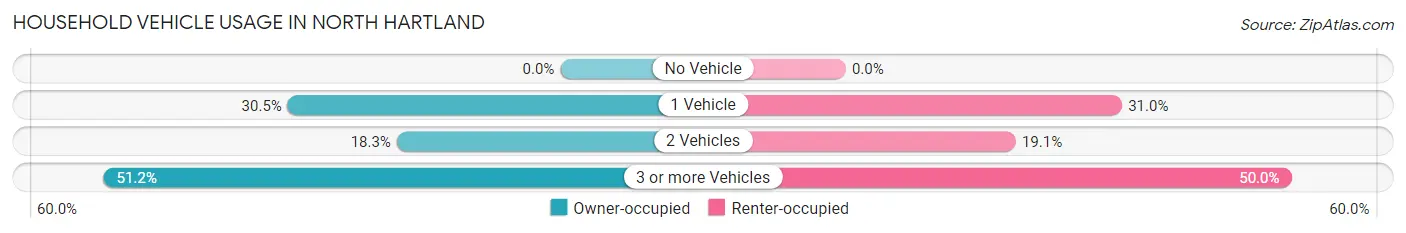
| Vehicles per Household | Owner-occupied | Renter-occupied |
| No Vehicle | 0 (0.0%) | 0 (0.0%) |
| 1 Vehicle | 40 (30.5%) | 13 (30.9%) |
| 2 Vehicles | 24 (18.3%) | 8 (19.1%) |
| 3 or more Vehicles | 67 (51.1%) | 21 (50.0%) |
| Total | 131 (100.0%) | 42 (100.0%) |
Real Estate & Mortgages in North Hartland
Real Estate and Mortgage Overview in North Hartland
| Characteristic | Without Mortgage | With Mortgage |
| Housing Units | 85 | 46 |
| Median Property Value | $283,700 | $0 |
| Median Household Income | $113,583 | $18 |
| Monthly Housing Costs | $806 | $30 |
| Real Estate Taxes | - | - |
Property Value by Mortgage Status in North Hartland
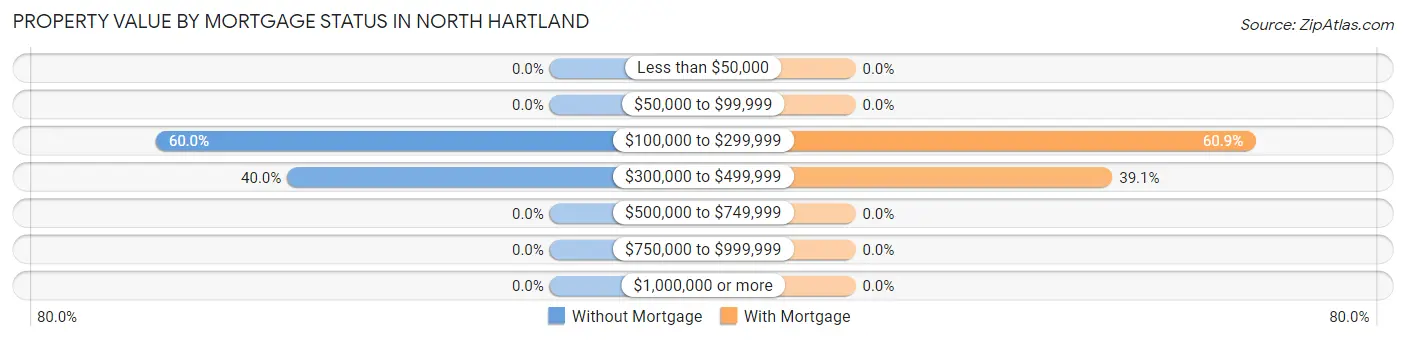
| Property Value | Without Mortgage | With Mortgage |
| Less than $50,000 | 0 (0.0%) | 0 (0.0%) |
| $50,000 to $99,999 | 0 (0.0%) | 0 (0.0%) |
| $100,000 to $299,999 | 51 (60.0%) | 28 (60.9%) |
| $300,000 to $499,999 | 34 (40.0%) | 18 (39.1%) |
| $500,000 to $749,999 | 0 (0.0%) | 0 (0.0%) |
| $750,000 to $999,999 | 0 (0.0%) | 0 (0.0%) |
| $1,000,000 or more | 0 (0.0%) | 0 (0.0%) |
| Total | 85 (100.0%) | 46 (100.0%) |
Household Income by Mortgage Status in North Hartland
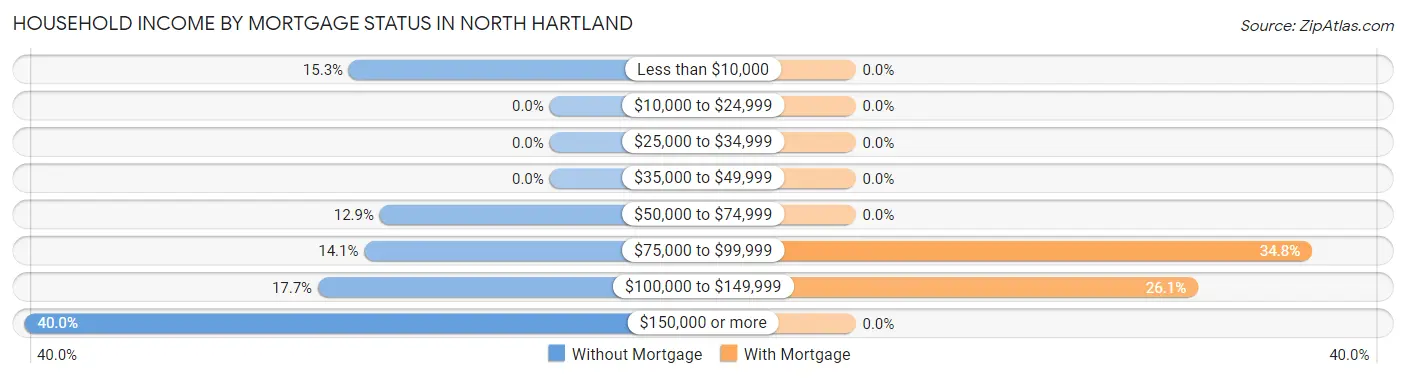
| Household Income | Without Mortgage | With Mortgage |
| Less than $10,000 | 13 (15.3%) | 0 (0.0%) |
| $10,000 to $24,999 | 0 (0.0%) | 0 (0.0%) |
| $25,000 to $34,999 | 0 (0.0%) | 0 (0.0%) |
| $35,000 to $49,999 | 0 (0.0%) | 0 (0.0%) |
| $50,000 to $74,999 | 11 (12.9%) | 0 (0.0%) |
| $75,000 to $99,999 | 12 (14.1%) | 16 (34.8%) |
| $100,000 to $149,999 | 15 (17.6%) | 12 (26.1%) |
| $150,000 or more | 34 (40.0%) | 0 (0.0%) |
| Total | 85 (100.0%) | 46 (100.0%) |
Property Value to Household Income Ratio in North Hartland
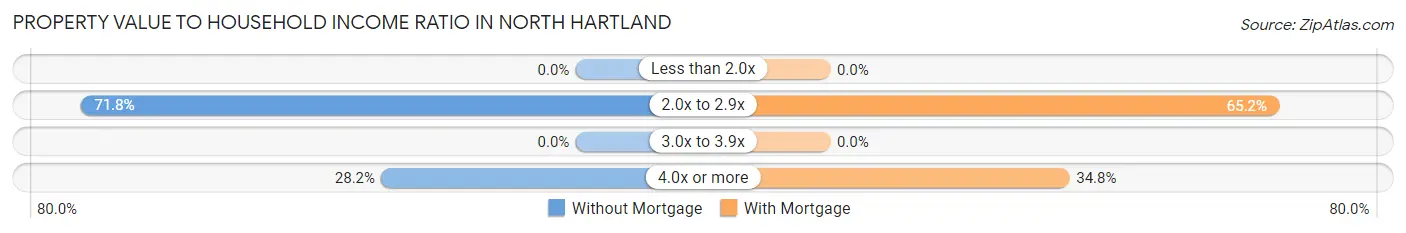
| Value-to-Income Ratio | Without Mortgage | With Mortgage |
| Less than 2.0x | 0 (0.0%) | 0 (0.0%) |
| 2.0x to 2.9x | 61 (71.8%) | 30 (65.2%) |
| 3.0x to 3.9x | 0 (0.0%) | 0 (0.0%) |
| 4.0x or more | 24 (28.2%) | 16 (34.8%) |
| Total | 85 (100.0%) | 46 (100.0%) |
Real Estate Taxes by Mortgage Status in North Hartland
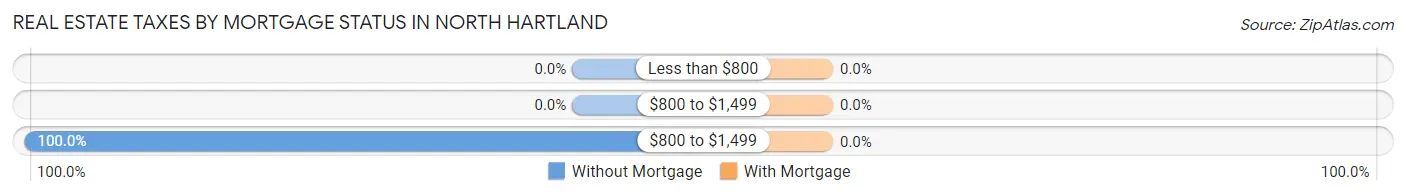
| Property Taxes | Without Mortgage | With Mortgage |
| Less than $800 | 0 (0.0%) | 0 (0.0%) |
| $800 to $1,499 | 0 (0.0%) | 0 (0.0%) |
| $800 to $1,499 | 85 (100.0%) | 0 (0.0%) |
| Total | 85 (100.0%) | 46 (100.0%) |
Health & Disability in North Hartland
Health Insurance Coverage by Age in North Hartland
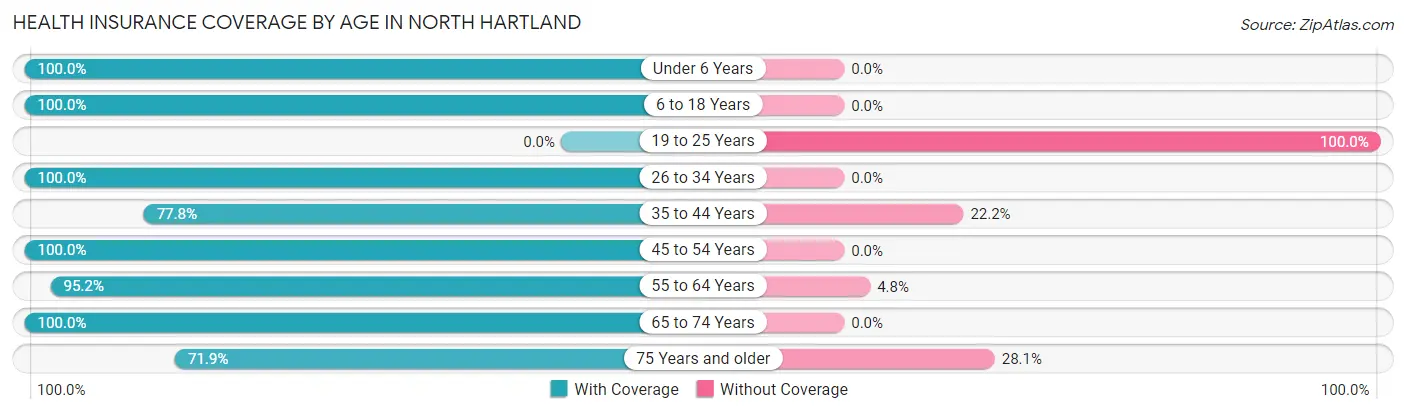
| Age Bracket | With Coverage | Without Coverage |
| Under 6 Years | 14 (100.0%) | 0 (0.0%) |
| 6 to 18 Years | 70 (100.0%) | 0 (0.0%) |
| 19 to 25 Years | 0 (0.0%) | 28 (100.0%) |
| 26 to 34 Years | 18 (100.0%) | 0 (0.0%) |
| 35 to 44 Years | 42 (77.8%) | 12 (22.2%) |
| 45 to 54 Years | 36 (100.0%) | 0 (0.0%) |
| 55 to 64 Years | 118 (95.2%) | 6 (4.8%) |
| 65 to 74 Years | 15 (100.0%) | 0 (0.0%) |
| 75 Years and older | 41 (71.9%) | 16 (28.1%) |
| Total | 354 (85.1%) | 62 (14.9%) |
Health Insurance Coverage by Citizenship Status in North Hartland
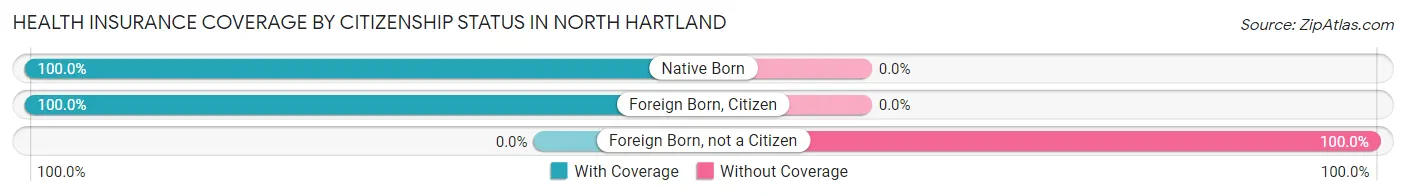
| Citizenship Status | With Coverage | Without Coverage |
| Native Born | 14 (100.0%) | 0 (0.0%) |
| Foreign Born, Citizen | 70 (100.0%) | 0 (0.0%) |
| Foreign Born, not a Citizen | 0 (0.0%) | 28 (100.0%) |
Health Insurance Coverage by Household Income in North Hartland
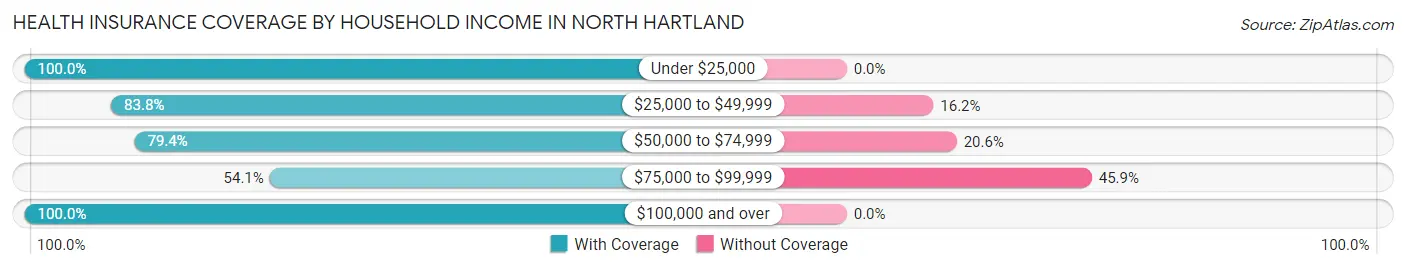
| Household Income | With Coverage | Without Coverage |
| Under $25,000 | 26 (100.0%) | 0 (0.0%) |
| $25,000 to $49,999 | 31 (83.8%) | 6 (16.2%) |
| $50,000 to $74,999 | 108 (79.4%) | 28 (20.6%) |
| $75,000 to $99,999 | 33 (54.1%) | 28 (45.9%) |
| $100,000 and over | 156 (100.0%) | 0 (0.0%) |
Public vs Private Health Insurance Coverage by Age in North Hartland
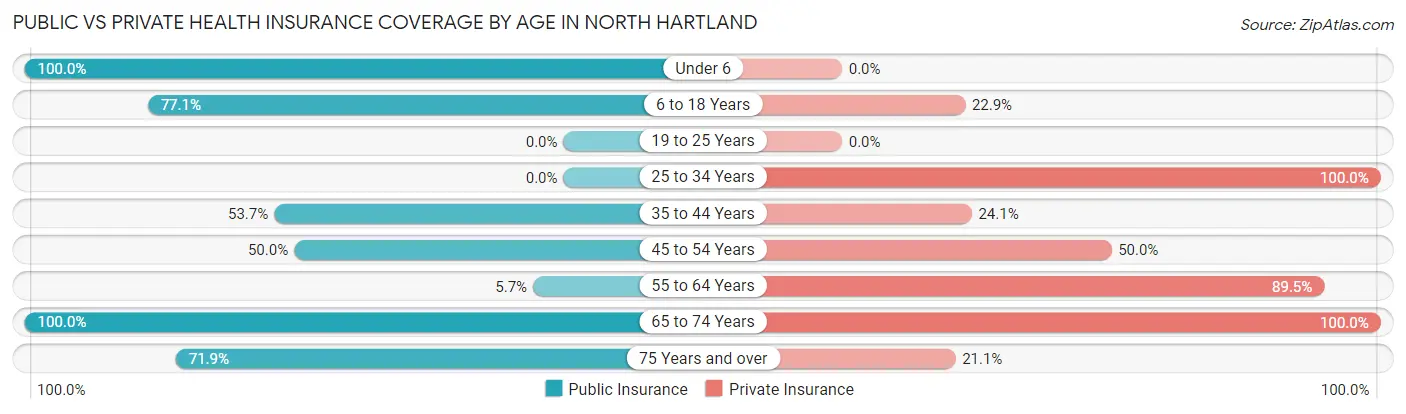
| Age Bracket | Public Insurance | Private Insurance |
| Under 6 | 14 (100.0%) | 0 (0.0%) |
| 6 to 18 Years | 54 (77.1%) | 16 (22.9%) |
| 19 to 25 Years | 0 (0.0%) | 0 (0.0%) |
| 25 to 34 Years | 0 (0.0%) | 18 (100.0%) |
| 35 to 44 Years | 29 (53.7%) | 13 (24.1%) |
| 45 to 54 Years | 18 (50.0%) | 18 (50.0%) |
| 55 to 64 Years | 7 (5.7%) | 111 (89.5%) |
| 65 to 74 Years | 15 (100.0%) | 15 (100.0%) |
| 75 Years and over | 41 (71.9%) | 12 (21.0%) |
| Total | 178 (42.8%) | 203 (48.8%) |
Disability Status by Sex by Age in North Hartland
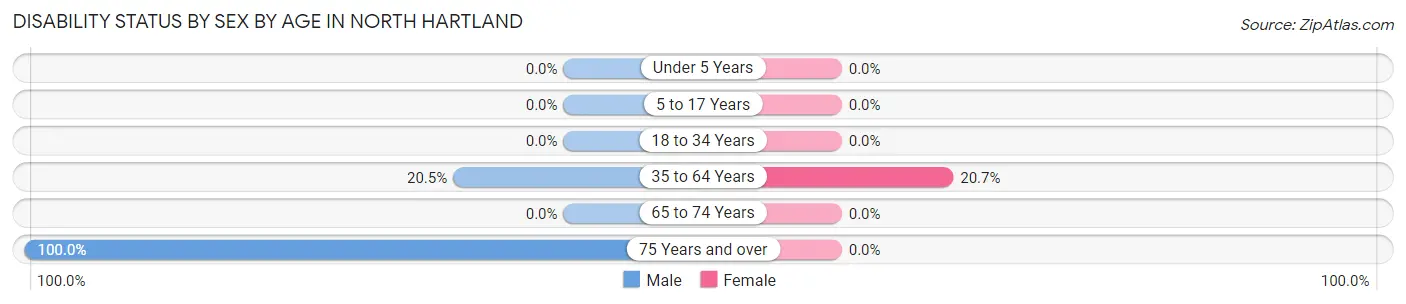
| Age Bracket | Male | Female |
| Under 5 Years | 0 (0.0%) | 0 (0.0%) |
| 5 to 17 Years | 0 (0.0%) | 0 (0.0%) |
| 18 to 34 Years | 0 (0.0%) | 0 (0.0%) |
| 35 to 64 Years | 26 (20.5%) | 18 (20.7%) |
| 65 to 74 Years | 0 (0.0%) | 0 (0.0%) |
| 75 Years and over | 16 (100.0%) | 0 (0.0%) |
Disability Class by Sex by Age in North Hartland
Disability Class: Hearing Difficulty
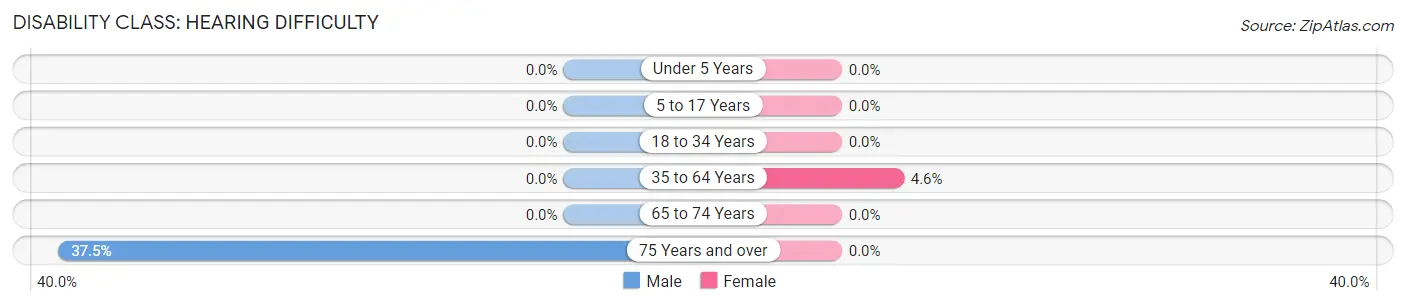
| Age Bracket | Male | Female |
| Under 5 Years | 0 (0.0%) | 0 (0.0%) |
| 5 to 17 Years | 0 (0.0%) | 0 (0.0%) |
| 18 to 34 Years | 0 (0.0%) | 0 (0.0%) |
| 35 to 64 Years | 0 (0.0%) | 4 (4.6%) |
| 65 to 74 Years | 0 (0.0%) | 0 (0.0%) |
| 75 Years and over | 6 (37.5%) | 0 (0.0%) |
Disability Class: Vision Difficulty
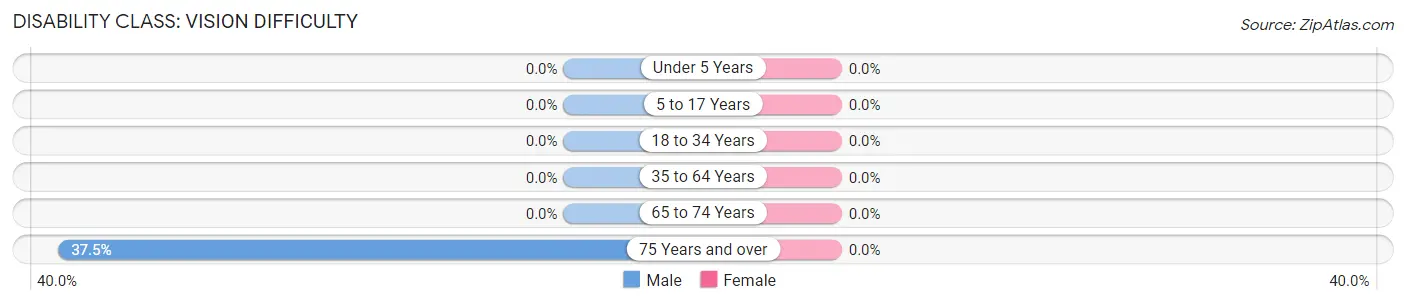
| Age Bracket | Male | Female |
| Under 5 Years | 0 (0.0%) | 0 (0.0%) |
| 5 to 17 Years | 0 (0.0%) | 0 (0.0%) |
| 18 to 34 Years | 0 (0.0%) | 0 (0.0%) |
| 35 to 64 Years | 0 (0.0%) | 0 (0.0%) |
| 65 to 74 Years | 0 (0.0%) | 0 (0.0%) |
| 75 Years and over | 6 (37.5%) | 0 (0.0%) |
Disability Class: Cognitive Difficulty
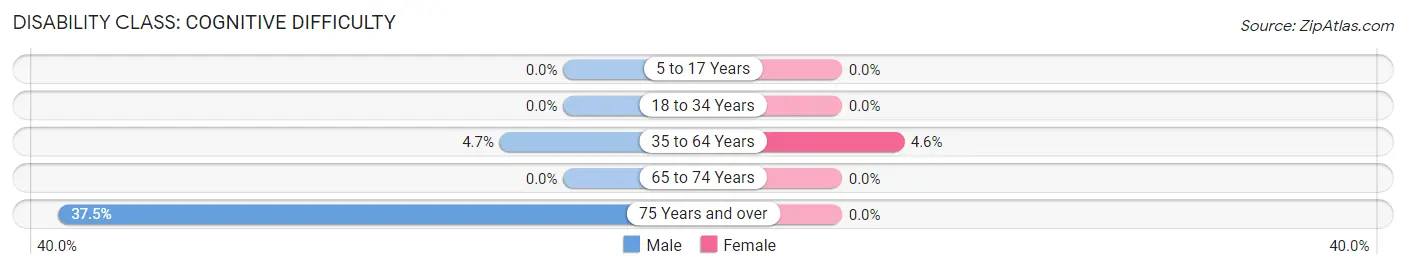
| Age Bracket | Male | Female |
| 5 to 17 Years | 0 (0.0%) | 0 (0.0%) |
| 18 to 34 Years | 0 (0.0%) | 0 (0.0%) |
| 35 to 64 Years | 6 (4.7%) | 4 (4.6%) |
| 65 to 74 Years | 0 (0.0%) | 0 (0.0%) |
| 75 Years and over | 6 (37.5%) | 0 (0.0%) |
Disability Class: Ambulatory Difficulty
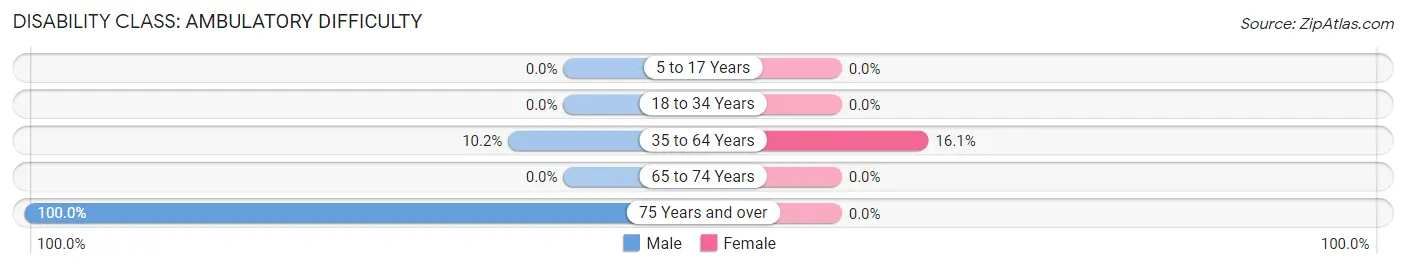
| Age Bracket | Male | Female |
| 5 to 17 Years | 0 (0.0%) | 0 (0.0%) |
| 18 to 34 Years | 0 (0.0%) | 0 (0.0%) |
| 35 to 64 Years | 13 (10.2%) | 14 (16.1%) |
| 65 to 74 Years | 0 (0.0%) | 0 (0.0%) |
| 75 Years and over | 16 (100.0%) | 0 (0.0%) |
Disability Class: Self-Care Difficulty
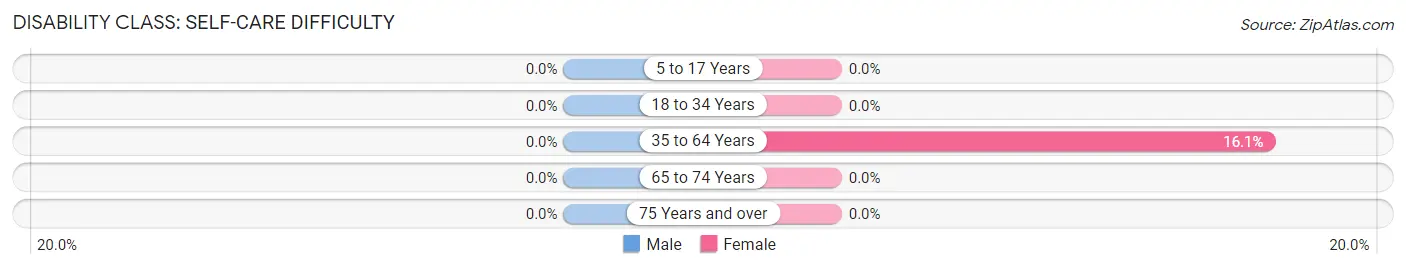
| Age Bracket | Male | Female |
| 5 to 17 Years | 0 (0.0%) | 0 (0.0%) |
| 18 to 34 Years | 0 (0.0%) | 0 (0.0%) |
| 35 to 64 Years | 0 (0.0%) | 14 (16.1%) |
| 65 to 74 Years | 0 (0.0%) | 0 (0.0%) |
| 75 Years and over | 0 (0.0%) | 0 (0.0%) |
Technology Access in North Hartland
Computing Device Access in North Hartland
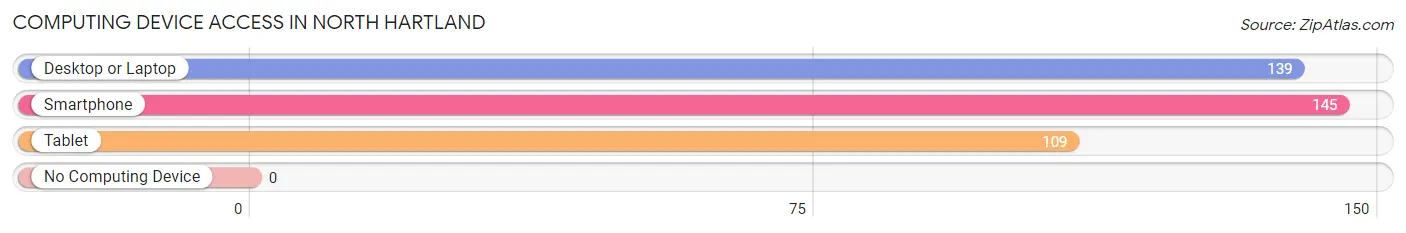
| Device Type | # Households | % Households |
| Desktop or Laptop | 139 | 80.3% |
| Smartphone | 145 | 83.8% |
| Tablet | 109 | 63.0% |
| No Computing Device | 0 | 0.0% |
| Total | 173 | 100.0% |
Internet Access in North Hartland
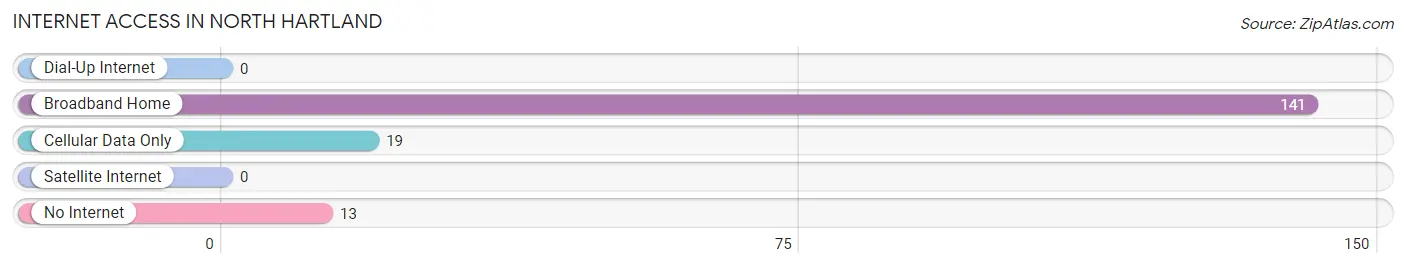
| Internet Type | # Households | % Households |
| Dial-Up Internet | 0 | 0.0% |
| Broadband Home | 141 | 81.5% |
| Cellular Data Only | 19 | 11.0% |
| Satellite Internet | 0 | 0.0% |
| No Internet | 13 | 7.5% |
| Total | 173 | 100.0% |
North Hartland Summary
Hartland, Vermont is a small town located in the White River Valley of Windsor County, in the state of Vermont. It is situated on the banks of the White River, and is bordered by the towns of Bridgewater, Woodstock, and Hartland. The town has a population of 1,845 people, according to the 2010 census.
Hartland is a rural town, with a strong agricultural tradition. The town is home to several dairy farms, as well as a number of small businesses. The town is also home to the Hartland Covered Bridge, which is the longest covered bridge in the United States.
History
Hartland was first settled in 1780 by a group of settlers from Connecticut. The town was originally known as “Hart’s Land”, after the first settler, John Hart. The town was officially incorporated in 1781.
In the early 19th century, Hartland was a thriving agricultural community. The town was home to several mills, including a sawmill, gristmill, and a woolen mill. The town also had a number of small businesses, including a blacksmith, a tannery, and a general store.
In the late 19th century, the town began to decline. The mills closed, and the population began to decline. The town was also hit hard by the Great Depression, and many of the businesses closed.
Geography
Hartland is located in the White River Valley of Windsor County, in the state of Vermont. The town is situated on the banks of the White River, and is bordered by the towns of Bridgewater, Woodstock, and Hartland. The town has a total area of 24.2 square miles, of which 24.1 square miles is land and 0.1 square miles is water.
The town is located in the Green Mountains, and is home to several mountains, including Mount Ascutney, Mount Tom, and Mount Peg. The town is also home to several rivers, including the White River, the Ottauquechee River, and the Black River.
Economy
Hartland is a rural town, with a strong agricultural tradition. The town is home to several dairy farms, as well as a number of small businesses. The town is also home to the Hartland Covered Bridge, which is the longest covered bridge in the United States.
The town is also home to several small businesses, including a general store, a hardware store, a restaurant, and a gas station. The town is also home to a number of small manufacturing businesses, including a furniture maker, a woodworking shop, and a metal fabrication shop.
Demographics
According to the 2010 census, the town has a population of 1,845 people. The racial makeup of the town is 97.3% White, 0.3% African American, 0.2% Native American, 0.3% Asian, 0.1% Pacific Islander, 0.2% from other races, and 1.5% from two or more races.
The median household income in the town is $50,938, and the median family income is $60,938. The per capita income in the town is $25,938. The town has a poverty rate of 8.3%.
Conclusion
Hartland, Vermont is a small town located in the White River Valley of Windsor County, in the state of Vermont. It is a rural town, with a strong agricultural tradition. The town is home to several dairy farms, as well as a number of small businesses. The town is also home to the Hartland Covered Bridge, which is the longest covered bridge in the United States. The town has a population of 1,845 people, according to the 2010 census. The town has a median household income of $50,938, and a poverty rate of 8.3%.
Common Questions
What is Per Capita Income in North Hartland?
Per Capita income in North Hartland is $42,942.
What is the Median Family Income in North Hartland?
Median Family Income in North Hartland is $152,574.
What is the Median Household income in North Hartland?
Median Household Income in North Hartland is $80,104.
What is Inequality or Gini Index in North Hartland?
Inequality or Gini Index in North Hartland is 0.36.
What is the Total Population of North Hartland?
Total Population of North Hartland is 416.
What is the Total Male Population of North Hartland?
Total Male Population of North Hartland is 200.
What is the Total Female Population of North Hartland?
Total Female Population of North Hartland is 216.
What is the Ratio of Males per 100 Females in North Hartland?
There are 92.59 Males per 100 Females in North Hartland.
What is the Ratio of Females per 100 Males in North Hartland?
There are 108.00 Females per 100 Males in North Hartland.
What is the Median Population Age in North Hartland?
Median Population Age in North Hartland is 52.1 Years.
What is the Average Family Size in North Hartland
Average Family Size in North Hartland is 2.9 People.
What is the Average Household Size in North Hartland
Average Household Size in North Hartland is 2.4 People.
How Large is the Labor Force in North Hartland?
There are 191 People in the Labor Forcein in North Hartland.
What is the Percentage of People in the Labor Force in North Hartland?
54.9% of People are in the Labor Force in North Hartland.