Brattleboro, VT Map & Demographics
Brattleboro Map
Brattleboro Overview
$36,873
PER CAPITA INCOME
$70,675
AVG FAMILY INCOME
$42,776
AVG HOUSEHOLD INCOME
14.2%
WAGE / INCOME GAP [ % ]
85.8¢/ $1
WAGE / INCOME GAP [ $ ]
0.54
INEQUALITY / GINI INDEX
7,543
TOTAL POPULATION
3,520
MALE POPULATION
4,023
FEMALE POPULATION
87.50
MALES / 100 FEMALES
114.29
FEMALES / 100 MALES
45.4
MEDIAN AGE
2.8
AVG FAMILY SIZE
2.1
AVG HOUSEHOLD SIZE
3,546
LABOR FORCE [ PEOPLE ]
55.0%
PERCENT IN LABOR FORCE
9.2%
UNEMPLOYMENT RATE
Brattleboro Zip Codes
Brattleboro Area Codes
Income in Brattleboro
Income Overview in Brattleboro
Per Capita Income in Brattleboro is $36,873, while median incomes of families and households are $70,675 and $42,776 respectively.
| Characteristic | Number | Measure |
| Per Capita Income | 7,543 | $36,873 |
| Median Family Income | 1,460 | $70,675 |
| Mean Family Income | 1,460 | $97,305 |
| Median Household Income | 3,491 | $42,776 |
| Mean Household Income | 3,491 | $74,843 |
| Income Deficit | 1,460 | $0 |
| Wage / Income Gap (%) | 7,543 | 14.23% |
| Wage / Income Gap ($) | 7,543 | 85.77¢ per $1 |
| Gini / Inequality Index | 7,543 | 0.54 |
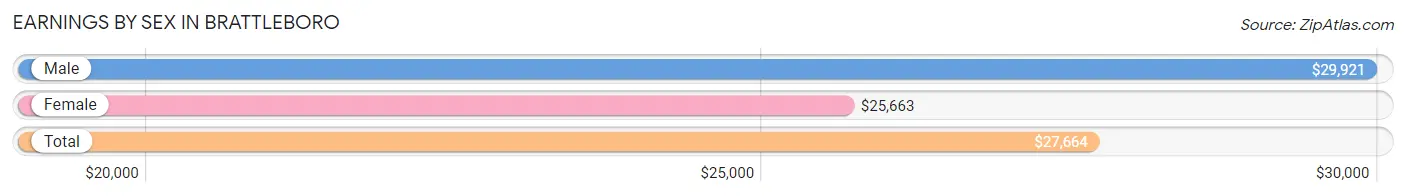
Earnings by Sex in Brattleboro
Average Earnings in Brattleboro are $27,664, $29,921 for men and $25,663 for women, a difference of 14.2%.
| Sex | Number | Average Earnings |
| Male | 1,580 (41.9%) | $29,921 |
| Female | 2,191 (58.1%) | $25,663 |
| Total | 3,771 (100.0%) | $27,664 |
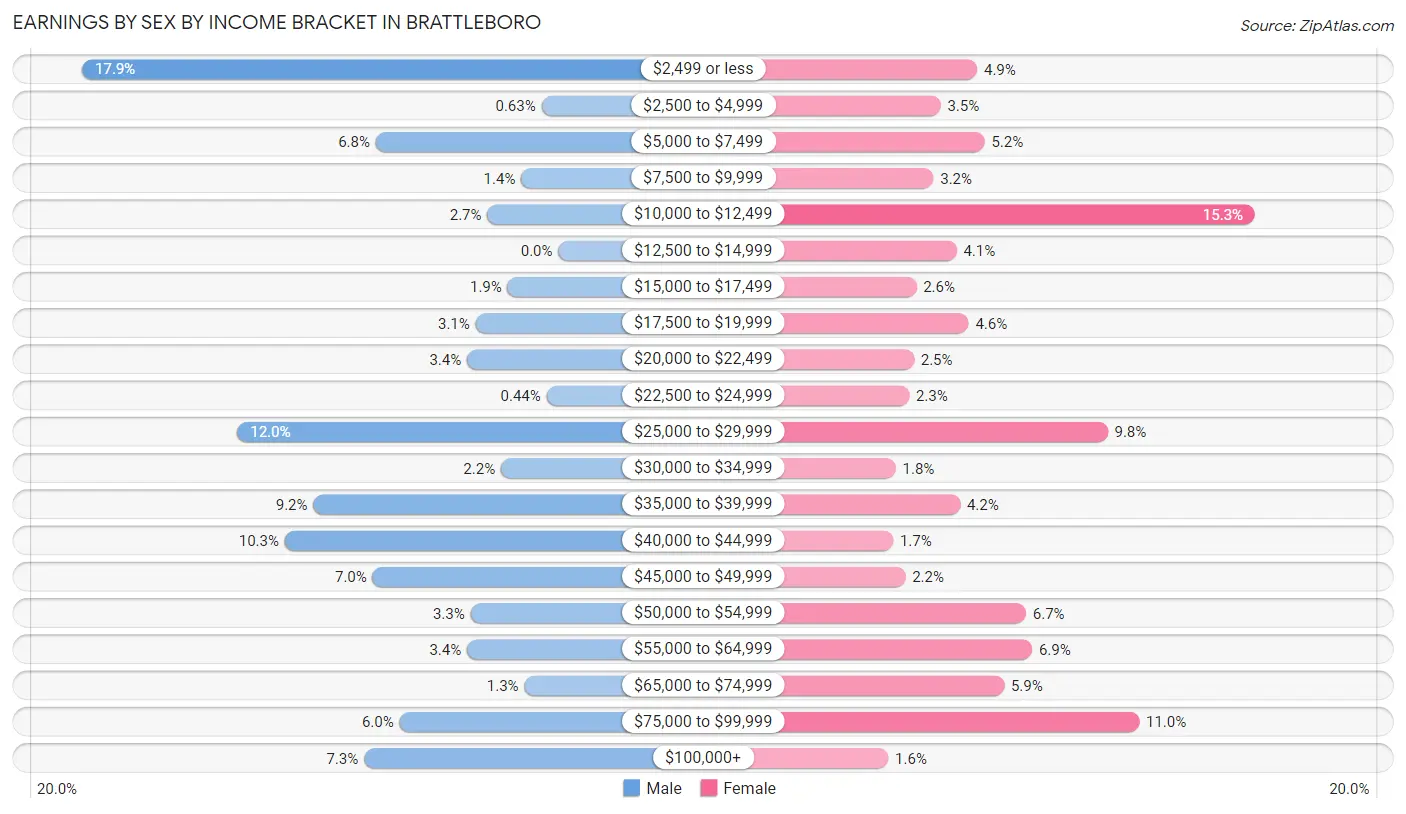
Earnings by Sex by Income Bracket in Brattleboro
The most common earnings brackets in Brattleboro are $2,499 or less for men (282 | 17.8%) and $10,000 to $12,499 for women (335 | 15.3%).
| Income | Male | Female |
| $2,499 or less | 282 (17.8%) | 107 (4.9%) |
| $2,500 to $4,999 | 10 (0.6%) | 77 (3.5%) |
| $5,000 to $7,499 | 108 (6.8%) | 113 (5.2%) |
| $7,500 to $9,999 | 22 (1.4%) | 71 (3.2%) |
| $10,000 to $12,499 | 42 (2.7%) | 335 (15.3%) |
| $12,500 to $14,999 | 0 (0.0%) | 90 (4.1%) |
| $15,000 to $17,499 | 30 (1.9%) | 57 (2.6%) |
| $17,500 to $19,999 | 49 (3.1%) | 100 (4.6%) |
| $20,000 to $22,499 | 54 (3.4%) | 55 (2.5%) |
| $22,500 to $24,999 | 7 (0.4%) | 51 (2.3%) |
| $25,000 to $29,999 | 190 (12.0%) | 214 (9.8%) |
| $30,000 to $34,999 | 34 (2.1%) | 40 (1.8%) |
| $35,000 to $39,999 | 145 (9.2%) | 93 (4.2%) |
| $40,000 to $44,999 | 162 (10.2%) | 38 (1.7%) |
| $45,000 to $49,999 | 110 (7.0%) | 48 (2.2%) |
| $50,000 to $54,999 | 52 (3.3%) | 147 (6.7%) |
| $55,000 to $64,999 | 54 (3.4%) | 152 (6.9%) |
| $65,000 to $74,999 | 20 (1.3%) | 129 (5.9%) |
| $75,000 to $99,999 | 94 (5.9%) | 240 (11.0%) |
| $100,000+ | 115 (7.3%) | 34 (1.5%) |
| Total | 1,580 (100.0%) | 2,191 (100.0%) |
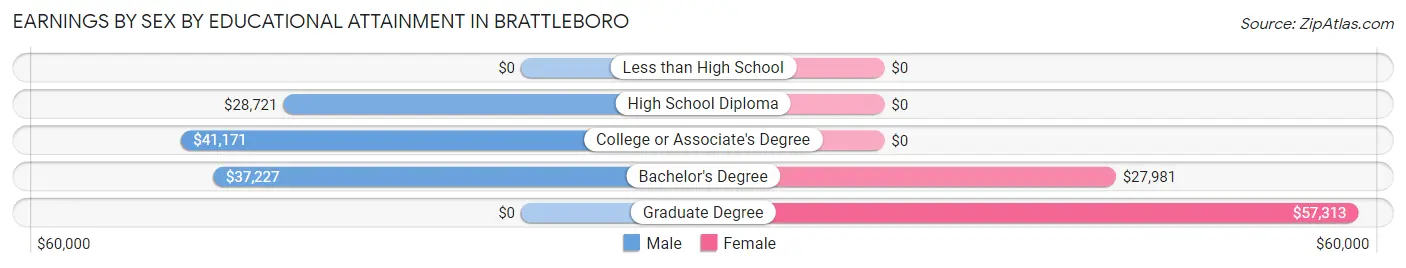
Earnings by Sex by Educational Attainment in Brattleboro
Average earnings in Brattleboro are $37,676 for men and $34,125 for women, a difference of 9.4%. Men with an educational attainment of college or associate's degree enjoy the highest average annual earnings of $41,171, while those with high school diploma education earn the least with $28,721. Women with an educational attainment of graduate degree earn the most with the average annual earnings of $57,313, while those with bachelor's degree education have the smallest earnings of $27,981.
| Educational Attainment | Male Income | Female Income |
| Less than High School | - | - |
| High School Diploma | $28,721 | $0 |
| College or Associate's Degree | $41,171 | $0 |
| Bachelor's Degree | $37,227 | $27,981 |
| Graduate Degree | - | - |
| Total | $37,676 | $34,125 |
Family Income in Brattleboro
Family Income Brackets in Brattleboro
According to the Brattleboro family income data, there are 402 families falling into the $50,000 to $74,999 income range, which is the most common income bracket and makes up 27.5% of all families. Conversely, the $10,000 to $14,999 income bracket is the least frequent group with only 32 families (2.2%) belonging to this category.
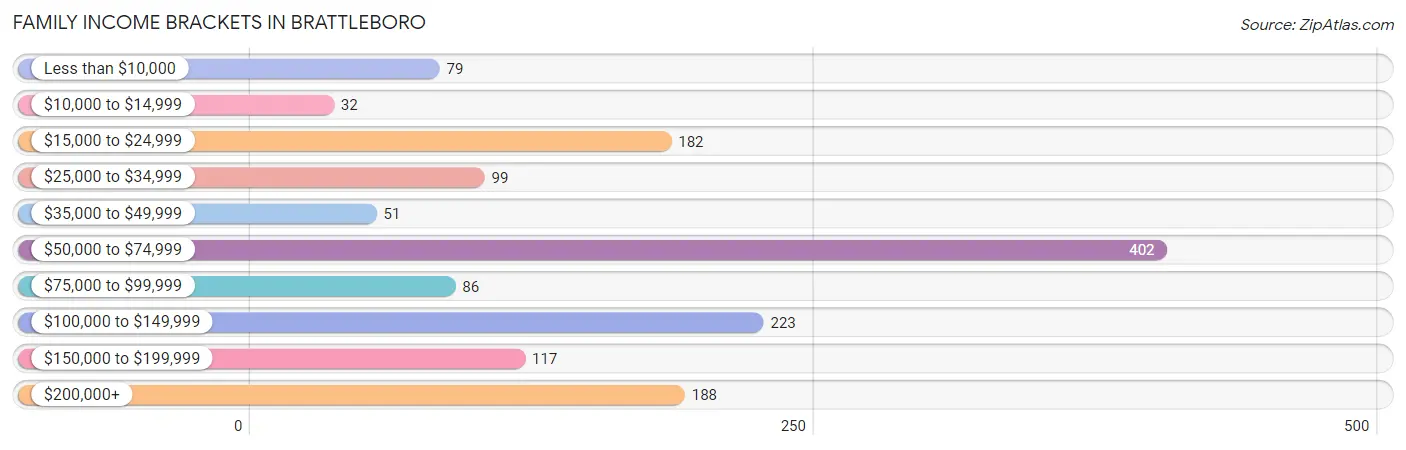
| Income Bracket | # Families | % Families |
| Less than $10,000 | 79 | 5.4% |
| $10,000 to $14,999 | 32 | 2.2% |
| $15,000 to $24,999 | 182 | 12.5% |
| $25,000 to $34,999 | 99 | 6.8% |
| $35,000 to $49,999 | 51 | 3.5% |
| $50,000 to $74,999 | 402 | 27.5% |
| $75,000 to $99,999 | 86 | 5.9% |
| $100,000 to $149,999 | 223 | 15.3% |
| $150,000 to $199,999 | 117 | 8.0% |
| $200,000+ | 188 | 12.9% |
Family Income by Famaliy Size in Brattleboro
2-person families (921 | 63.1%) account for the highest median family income in Brattleboro with $71,563 per family, while 2-person families (921 | 63.1%) have the highest median income of $35,782 per family member.
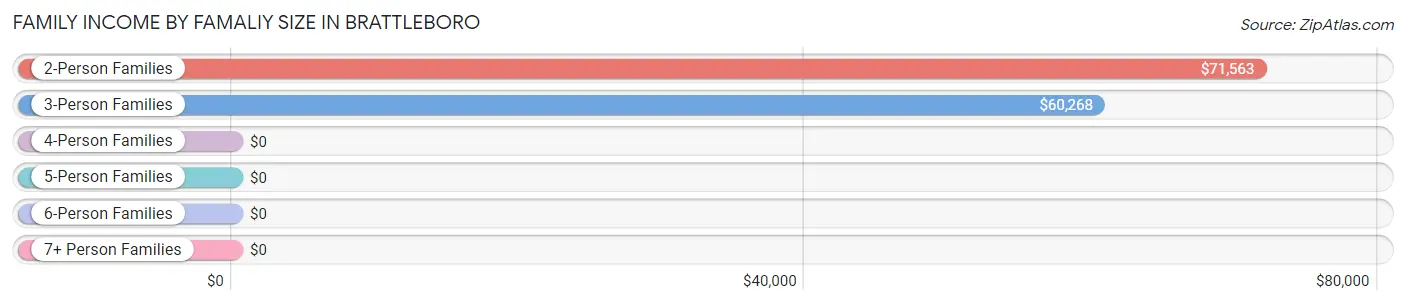
| Income Bracket | # Families | Median Income |
| 2-Person Families | 921 (63.1%) | $71,563 |
| 3-Person Families | 384 (26.3%) | $60,268 |
| 4-Person Families | 117 (8.0%) | $0 |
| 5-Person Families | 26 (1.8%) | $0 |
| 6-Person Families | 12 (0.8%) | $0 |
| 7+ Person Families | 0 (0.0%) | $0 |
| Total | 1,460 (100.0%) | $70,675 |
Family Income by Number of Earners in Brattleboro
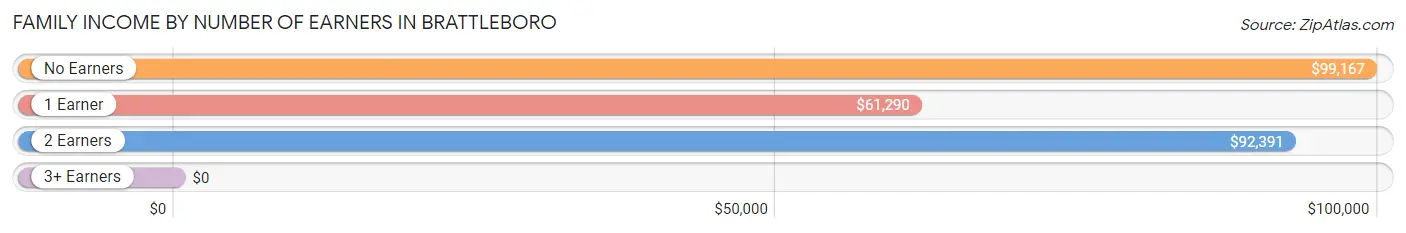
| Number of Earners | # Families | Median Income |
| No Earners | 258 (17.7%) | $99,167 |
| 1 Earner | 644 (44.1%) | $61,290 |
| 2 Earners | 476 (32.6%) | $92,391 |
| 3+ Earners | 82 (5.6%) | $0 |
| Total | 1,460 (100.0%) | $70,675 |
Household Income in Brattleboro
Household Income Brackets in Brattleboro
With 566 households falling in the category, the $50,000 to $74,999 income range is the most frequent in Brattleboro, accounting for 16.2% of all households. In contrast, only 157 households (4.5%) fall into the $150,000 to $199,999 income bracket, making it the least populous group.
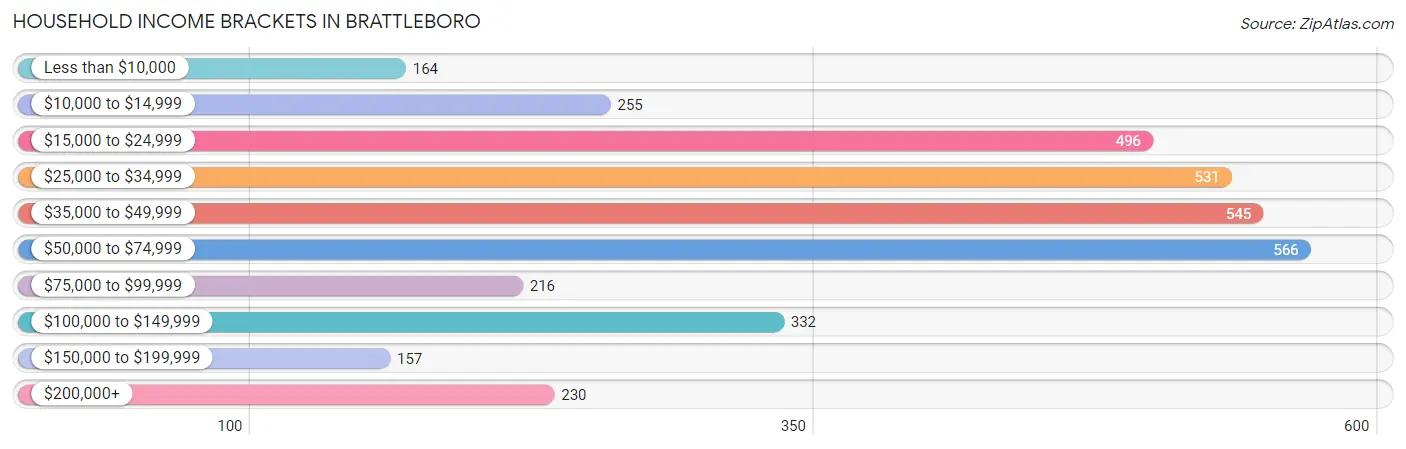
| Income Bracket | # Households | % Households |
| Less than $10,000 | 164 | 4.7% |
| $10,000 to $14,999 | 255 | 7.3% |
| $15,000 to $24,999 | 496 | 14.2% |
| $25,000 to $34,999 | 531 | 15.2% |
| $35,000 to $49,999 | 545 | 15.6% |
| $50,000 to $74,999 | 566 | 16.2% |
| $75,000 to $99,999 | 216 | 6.2% |
| $100,000 to $149,999 | 332 | 9.5% |
| $150,000 to $199,999 | 157 | 4.5% |
| $200,000+ | 230 | 6.6% |
Household Income by Householder Age in Brattleboro
The median household income in Brattleboro is $42,776, with the highest median household income of $45,345 found in the 45 to 64 years age bracket for the primary householder. A total of 1,072 households (30.7%) fall into this category. Meanwhile, the 15 to 24 years age bracket for the primary householder has the lowest median household income of $26,048, with 72 households (2.1%) in this group.
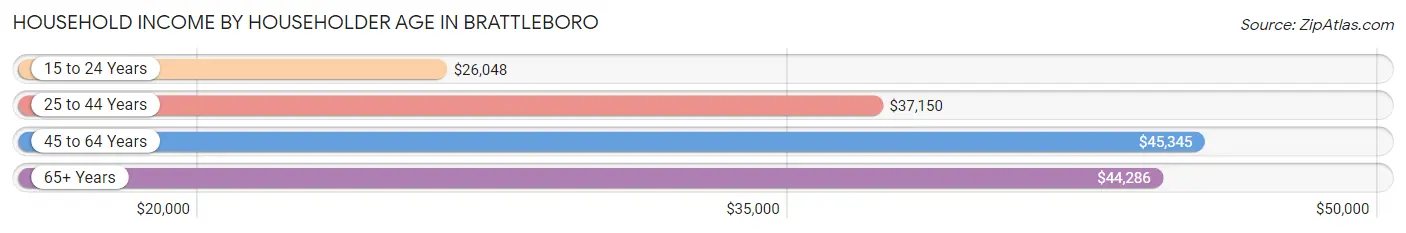
| Income Bracket | # Households | Median Income |
| 15 to 24 Years | 72 (2.1%) | $26,048 |
| 25 to 44 Years | 989 (28.3%) | $37,150 |
| 45 to 64 Years | 1,072 (30.7%) | $45,345 |
| 65+ Years | 1,358 (38.9%) | $44,286 |
| Total | 3,491 (100.0%) | $42,776 |
Poverty in Brattleboro
Income Below Poverty by Sex and Age in Brattleboro
With 22.9% poverty level for males and 28.9% for females among the residents of Brattleboro, 5 year old males and 18 to 24 year old females are the most vulnerable to poverty, with 97 males (89.8%) and 262 females (67.7%) in their respective age groups living below the poverty level.
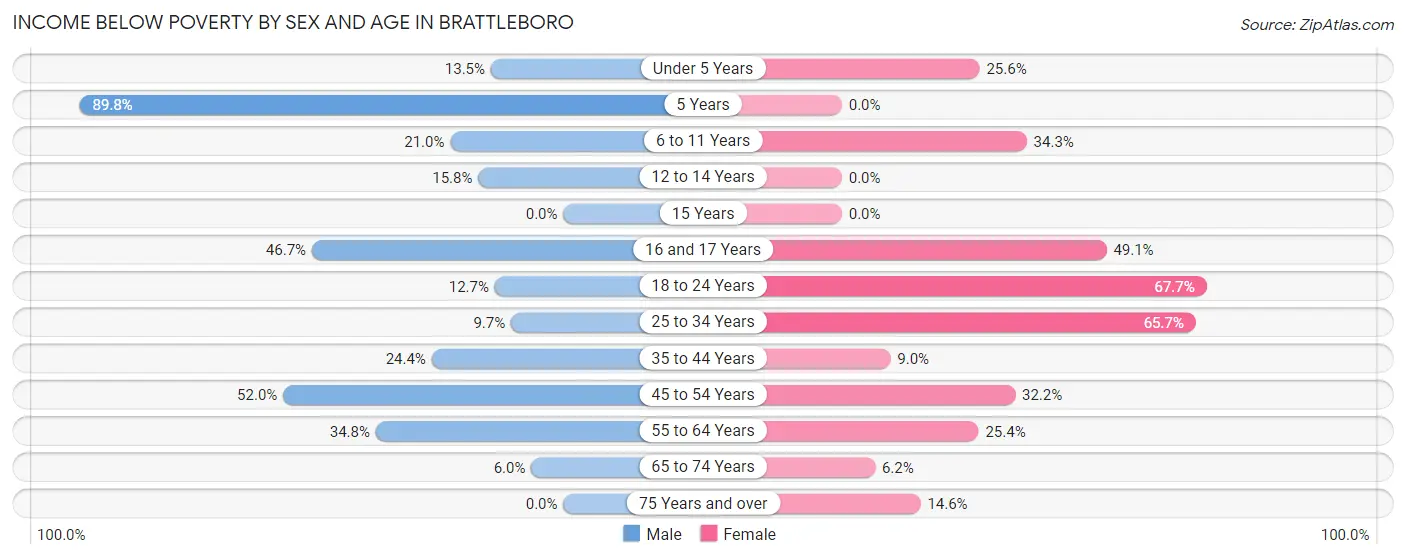
| Age Bracket | Male | Female |
| Under 5 Years | 23 (13.5%) | 46 (25.6%) |
| 5 Years | 97 (89.8%) | 0 (0.0%) |
| 6 to 11 Years | 30 (21.0%) | 47 (34.3%) |
| 12 to 14 Years | 30 (15.8%) | 0 (0.0%) |
| 15 Years | 0 (0.0%) | 0 (0.0%) |
| 16 and 17 Years | 84 (46.7%) | 28 (49.1%) |
| 18 to 24 Years | 21 (12.7%) | 262 (67.7%) |
| 25 to 34 Years | 68 (9.7%) | 268 (65.7%) |
| 35 to 44 Years | 65 (24.4%) | 40 (9.0%) |
| 45 to 54 Years | 194 (52.0%) | 155 (32.2%) |
| 55 to 64 Years | 165 (34.8%) | 170 (25.4%) |
| 65 to 74 Years | 21 (5.9%) | 34 (6.1%) |
| 75 Years and over | 0 (0.0%) | 73 (14.6%) |
| Total | 798 (22.9%) | 1,123 (28.9%) |
Income Above Poverty by Sex and Age in Brattleboro
According to the poverty statistics in Brattleboro, males aged 15 years and females aged 5 years are the age groups that are most secure financially, with 100.0% of males and 100.0% of females in these age groups living above the poverty line.
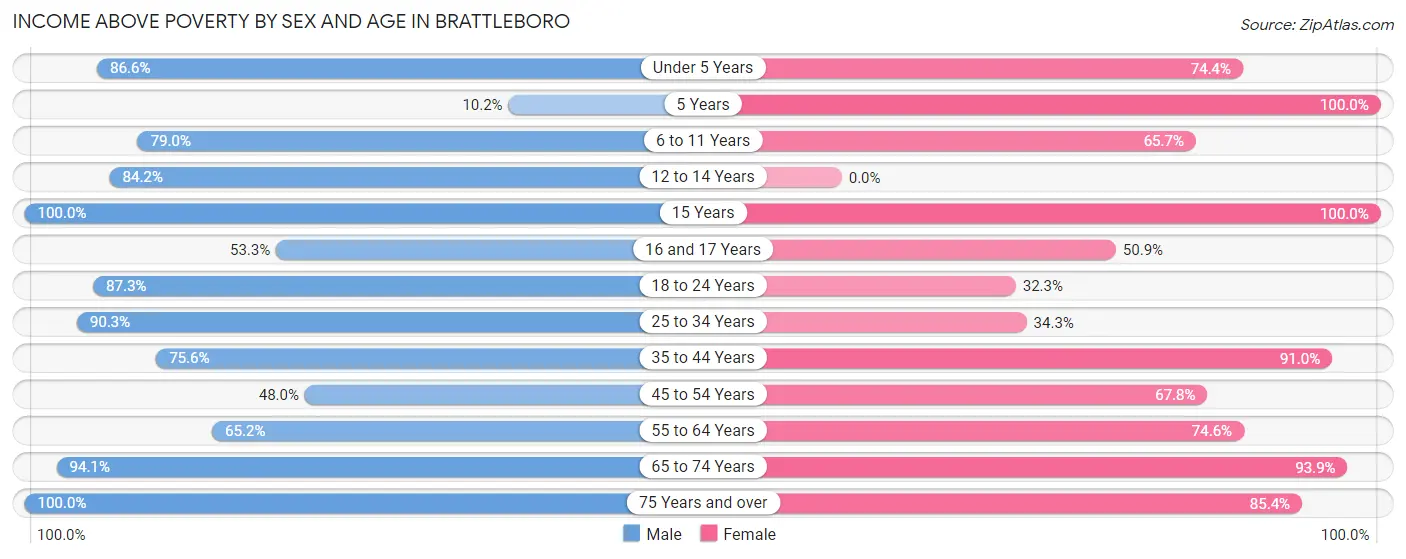
| Age Bracket | Male | Female |
| Under 5 Years | 148 (86.6%) | 134 (74.4%) |
| 5 Years | 11 (10.2%) | 38 (100.0%) |
| 6 to 11 Years | 113 (79.0%) | 90 (65.7%) |
| 12 to 14 Years | 160 (84.2%) | 0 (0.0%) |
| 15 Years | 44 (100.0%) | 25 (100.0%) |
| 16 and 17 Years | 96 (53.3%) | 29 (50.9%) |
| 18 to 24 Years | 144 (87.3%) | 125 (32.3%) |
| 25 to 34 Years | 632 (90.3%) | 140 (34.3%) |
| 35 to 44 Years | 201 (75.6%) | 404 (91.0%) |
| 45 to 54 Years | 179 (48.0%) | 327 (67.8%) |
| 55 to 64 Years | 309 (65.2%) | 500 (74.6%) |
| 65 to 74 Years | 332 (94.1%) | 519 (93.9%) |
| 75 Years and over | 324 (100.0%) | 427 (85.4%) |
| Total | 2,693 (77.1%) | 2,758 (71.1%) |
Income Below Poverty Among Married-Couple Families in Brattleboro
The poverty statistics for married-couple families in Brattleboro show that 9.2% or 75 of the total 818 families live below the poverty line. Families with 1 or 2 children have the highest poverty rate of 15.2%, comprising of 26 families. On the other hand, families with 3 or 4 children have the lowest poverty rate of 0.0%, which includes 0 families.
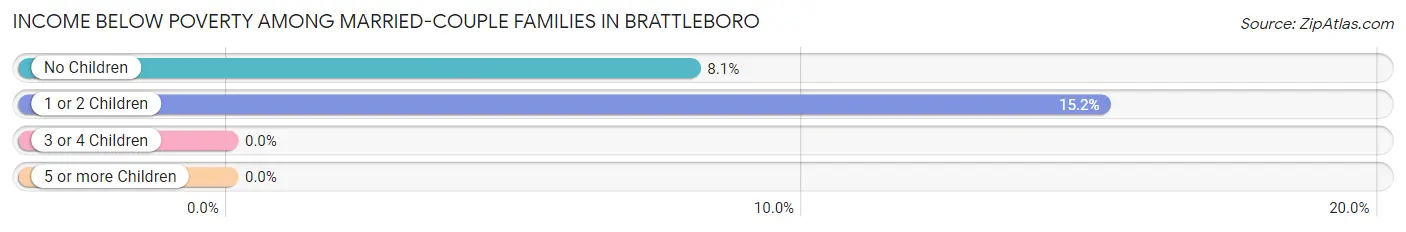
| Children | Above Poverty | Below Poverty |
| No Children | 560 (91.9%) | 49 (8.1%) |
| 1 or 2 Children | 145 (84.8%) | 26 (15.2%) |
| 3 or 4 Children | 38 (100.0%) | 0 (0.0%) |
| 5 or more Children | 0 (0.0%) | 0 (0.0%) |
| Total | 743 (90.8%) | 75 (9.2%) |
Income Below Poverty Among Single-Parent Households in Brattleboro
According to the poverty data in Brattleboro, 46.3% or 31 single-father households and 30.1% or 173 single-mother households are living below the poverty line. Among single-father households, those with 1 or 2 children have the highest poverty rate, with 31 households (52.5%) experiencing poverty. Likewise, among single-mother households, those with 1 or 2 children have the highest poverty rate, with 147 households (34.2%) falling below the poverty line.
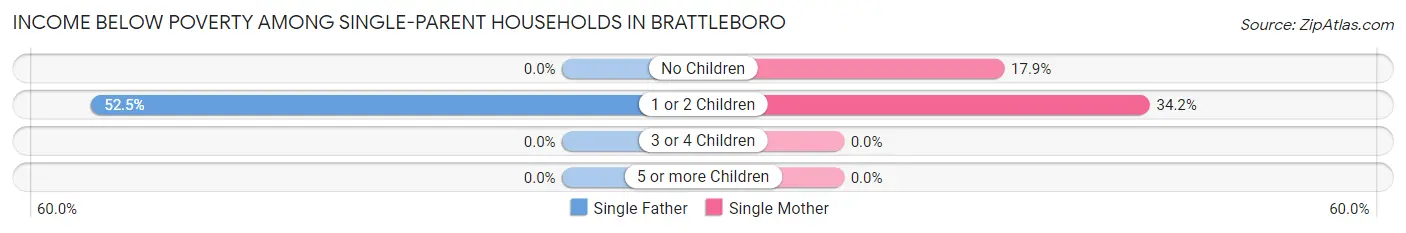
| Children | Single Father | Single Mother |
| No Children | 0 (0.0%) | 26 (17.9%) |
| 1 or 2 Children | 31 (52.5%) | 147 (34.2%) |
| 3 or 4 Children | 0 (0.0%) | 0 (0.0%) |
| 5 or more Children | 0 (0.0%) | 0 (0.0%) |
| Total | 31 (46.3%) | 173 (30.1%) |
Income Below Poverty Among Married-Couple vs Single-Parent Households in Brattleboro
The poverty data for Brattleboro shows that 75 of the married-couple family households (9.2%) and 204 of the single-parent households (31.8%) are living below the poverty level. Within the married-couple family households, those with 1 or 2 children have the highest poverty rate, with 26 households (15.2%) falling below the poverty line. Among the single-parent households, those with 1 or 2 children have the highest poverty rate, with 178 household (36.4%) living below poverty.
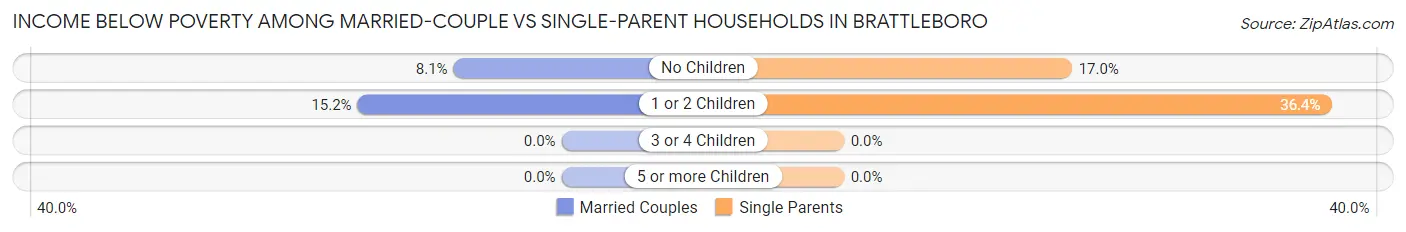
| Children | Married-Couple Families | Single-Parent Households |
| No Children | 49 (8.1%) | 26 (17.0%) |
| 1 or 2 Children | 26 (15.2%) | 178 (36.4%) |
| 3 or 4 Children | 0 (0.0%) | 0 (0.0%) |
| 5 or more Children | 0 (0.0%) | 0 (0.0%) |
| Total | 75 (9.2%) | 204 (31.8%) |
Race in Brattleboro
The most populous races in Brattleboro are White / Caucasian (7,074 | 93.8%), Two or more Races (338 | 4.5%), and Hispanic or Latino (209 | 2.8%).
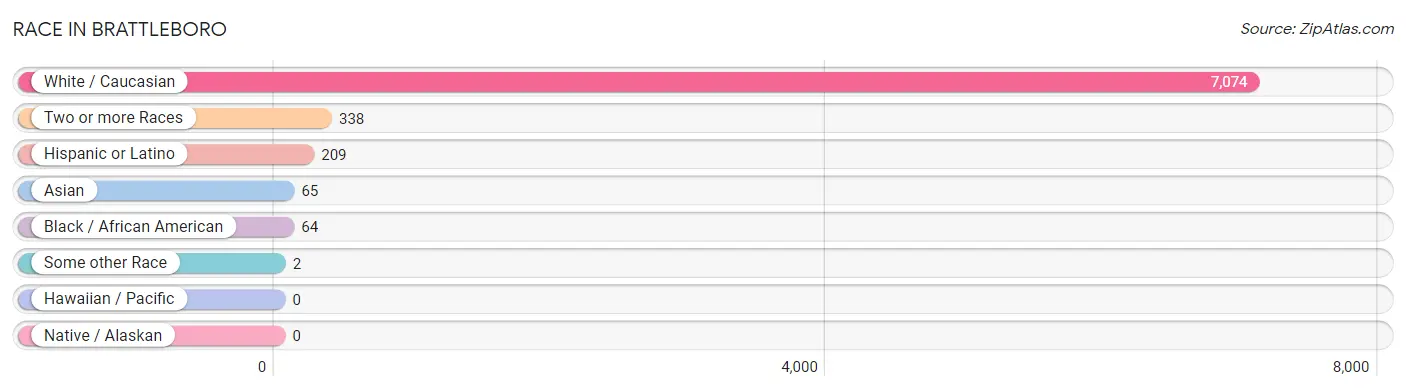
| Race | # Population | % Population |
| Asian | 65 | 0.9% |
| Black / African American | 64 | 0.9% |
| Hawaiian / Pacific | 0 | 0.0% |
| Hispanic or Latino | 209 | 2.8% |
| Native / Alaskan | 0 | 0.0% |
| White / Caucasian | 7,074 | 93.8% |
| Two or more Races | 338 | 4.5% |
| Some other Race | 2 | 0.0% |
| Total | 7,543 | 100.0% |
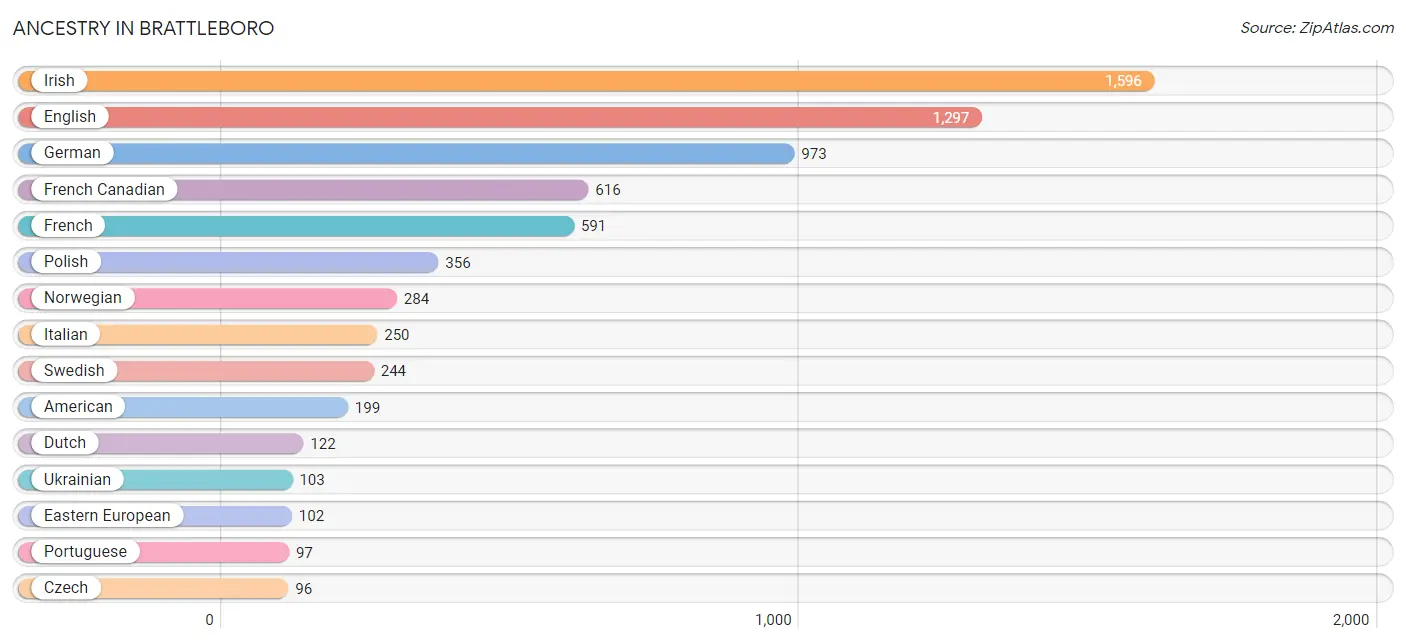
Ancestry in Brattleboro
The most populous ancestries reported in Brattleboro are Irish (1,596 | 21.2%), English (1,297 | 17.2%), German (973 | 12.9%), French Canadian (616 | 8.2%), and French (591 | 7.8%), together accounting for 67.3% of all Brattleboro residents.
| Ancestry | # Population | % Population |
| American | 199 | 2.6% |
| Armenian | 14 | 0.2% |
| Austrian | 31 | 0.4% |
| Bolivian | 70 | 0.9% |
| British | 44 | 0.6% |
| Cape Verdean | 12 | 0.2% |
| Celtic | 50 | 0.7% |
| Central American | 67 | 0.9% |
| Cherokee | 7 | 0.1% |
| Chippewa | 10 | 0.1% |
| Czech | 96 | 1.3% |
| Danish | 48 | 0.6% |
| Dutch | 122 | 1.6% |
| Eastern European | 102 | 1.3% |
| English | 1,297 | 17.2% |
| European | 13 | 0.2% |
| Filipino | 3 | 0.0% |
| Finnish | 25 | 0.3% |
| French | 591 | 7.8% |
| French Canadian | 616 | 8.2% |
| German | 973 | 12.9% |
| Greek | 36 | 0.5% |
| Hungarian | 4 | 0.1% |
| Indian (Asian) | 15 | 0.2% |
| Irish | 1,596 | 21.2% |
| Italian | 250 | 3.3% |
| Lithuanian | 36 | 0.5% |
| Nicaraguan | 67 | 0.9% |
| Northern European | 69 | 0.9% |
| Norwegian | 284 | 3.8% |
| Pakistani | 28 | 0.4% |
| Polish | 356 | 4.7% |
| Portuguese | 97 | 1.3% |
| Puerto Rican | 31 | 0.4% |
| Romanian | 54 | 0.7% |
| Russian | 92 | 1.2% |
| Scandinavian | 17 | 0.2% |
| Scotch-Irish | 59 | 0.8% |
| Scottish | 83 | 1.1% |
| Slavic | 9 | 0.1% |
| Slovak | 28 | 0.4% |
| South American | 70 | 0.9% |
| Spaniard | 38 | 0.5% |
| Sri Lankan | 13 | 0.2% |
| Subsaharan African | 12 | 0.2% |
| Swedish | 244 | 3.2% |
| Thai | 6 | 0.1% |
| Ukrainian | 103 | 1.4% | View All 48 Rows |
Immigrants in Brattleboro
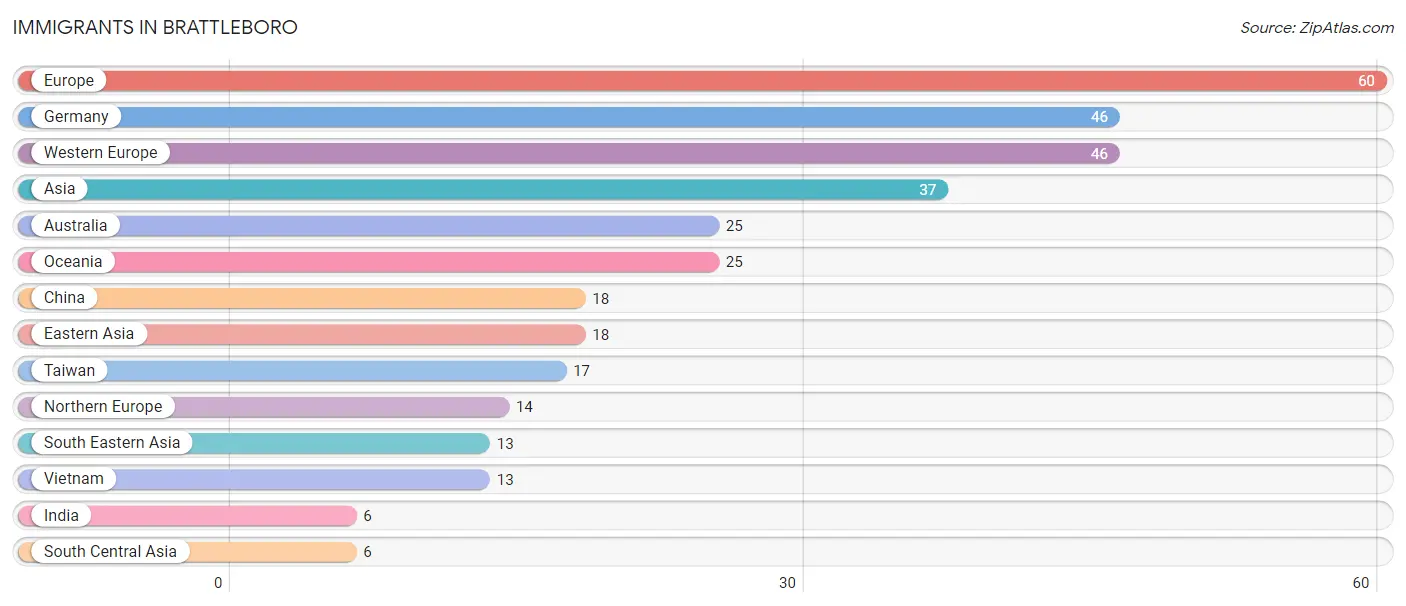
The most numerous immigrant groups reported in Brattleboro came from Europe (60 | 0.8%), Germany (46 | 0.6%), Western Europe (46 | 0.6%), Asia (37 | 0.5%), and Australia (25 | 0.3%), together accounting for 2.8% of all Brattleboro residents.
| Immigration Origin | # Population | % Population |
| Asia | 37 | 0.5% |
| Australia | 25 | 0.3% |
| China | 18 | 0.2% |
| Eastern Asia | 18 | 0.2% |
| Europe | 60 | 0.8% |
| Germany | 46 | 0.6% |
| India | 6 | 0.1% |
| Northern Europe | 14 | 0.2% |
| Oceania | 25 | 0.3% |
| South Central Asia | 6 | 0.1% |
| South Eastern Asia | 13 | 0.2% |
| Taiwan | 17 | 0.2% |
| Vietnam | 13 | 0.2% |
| Western Europe | 46 | 0.6% | View All 14 Rows |
Sex and Age in Brattleboro
Sex and Age in Brattleboro
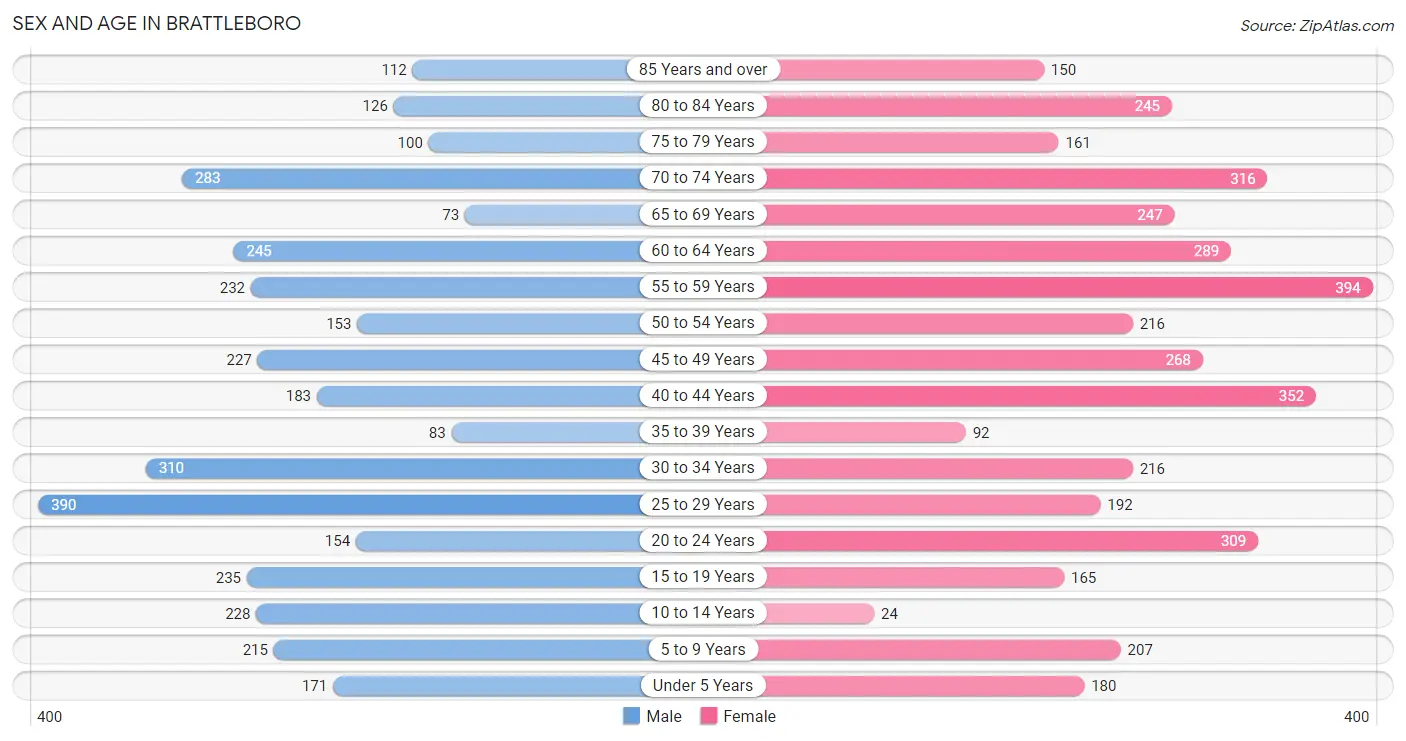
The most populous age groups in Brattleboro are 25 to 29 Years (390 | 11.1%) for men and 55 to 59 Years (394 | 9.8%) for women.
| Age Bracket | Male | Female |
| Under 5 Years | 171 (4.9%) | 180 (4.5%) |
| 5 to 9 Years | 215 (6.1%) | 207 (5.1%) |
| 10 to 14 Years | 228 (6.5%) | 24 (0.6%) |
| 15 to 19 Years | 235 (6.7%) | 165 (4.1%) |
| 20 to 24 Years | 154 (4.4%) | 309 (7.7%) |
| 25 to 29 Years | 390 (11.1%) | 192 (4.8%) |
| 30 to 34 Years | 310 (8.8%) | 216 (5.4%) |
| 35 to 39 Years | 83 (2.4%) | 92 (2.3%) |
| 40 to 44 Years | 183 (5.2%) | 352 (8.7%) |
| 45 to 49 Years | 227 (6.5%) | 268 (6.7%) |
| 50 to 54 Years | 153 (4.3%) | 216 (5.4%) |
| 55 to 59 Years | 232 (6.6%) | 394 (9.8%) |
| 60 to 64 Years | 245 (7.0%) | 289 (7.2%) |
| 65 to 69 Years | 73 (2.1%) | 247 (6.1%) |
| 70 to 74 Years | 283 (8.0%) | 316 (7.9%) |
| 75 to 79 Years | 100 (2.8%) | 161 (4.0%) |
| 80 to 84 Years | 126 (3.6%) | 245 (6.1%) |
| 85 Years and over | 112 (3.2%) | 150 (3.7%) |
| Total | 3,520 (100.0%) | 4,023 (100.0%) |
Families and Households in Brattleboro
Median Family Size in Brattleboro
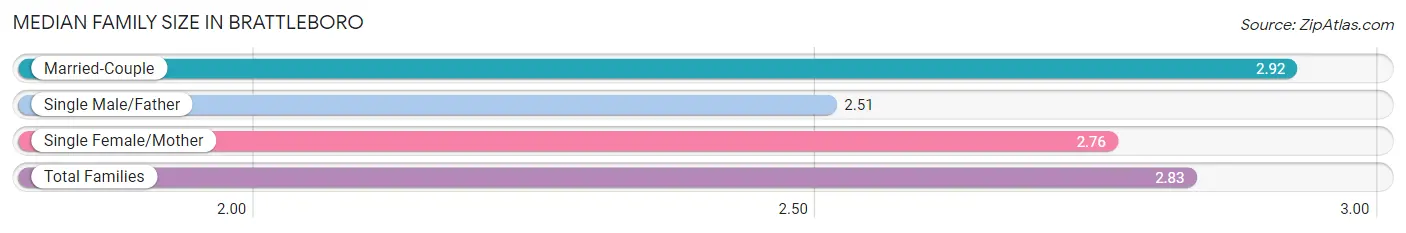
The median family size in Brattleboro is 2.83 persons per family, with married-couple families (818 | 56.0%) accounting for the largest median family size of 2.92 persons per family. On the other hand, single male/father families (67 | 4.6%) represent the smallest median family size with 2.51 persons per family.
| Family Type | # Families | Family Size |
| Married-Couple | 818 (56.0%) | 2.92 |
| Single Male/Father | 67 (4.6%) | 2.51 |
| Single Female/Mother | 575 (39.4%) | 2.76 |
| Total Families | 1,460 (100.0%) | 2.83 |
Median Household Size in Brattleboro
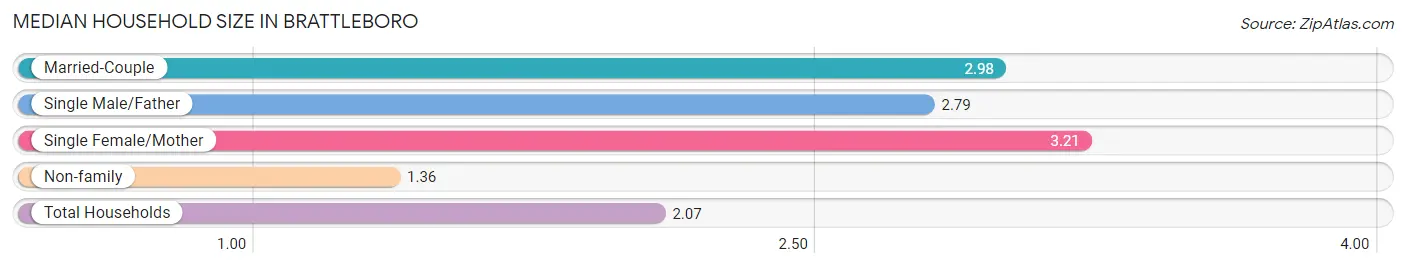
The median household size in Brattleboro is 2.07 persons per household, with single female/mother households (575 | 16.5%) accounting for the largest median household size of 3.21 persons per household. non-family households (2,031 | 58.2%) represent the smallest median household size with 1.36 persons per household.
| Household Type | # Households | Household Size |
| Married-Couple | 818 (23.4%) | 2.98 |
| Single Male/Father | 67 (1.9%) | 2.79 |
| Single Female/Mother | 575 (16.5%) | 3.21 |
| Non-family | 2,031 (58.2%) | 1.36 |
| Total Households | 3,491 (100.0%) | 2.07 |
Household Size by Marriage Status in Brattleboro
Out of a total of 3,491 households in Brattleboro, 1,460 (41.8%) are family households, while 2,031 (58.2%) are nonfamily households. The most numerous type of family households are 2-person households, comprising 855, and the most common type of nonfamily households are 1-person households, comprising 1,651.
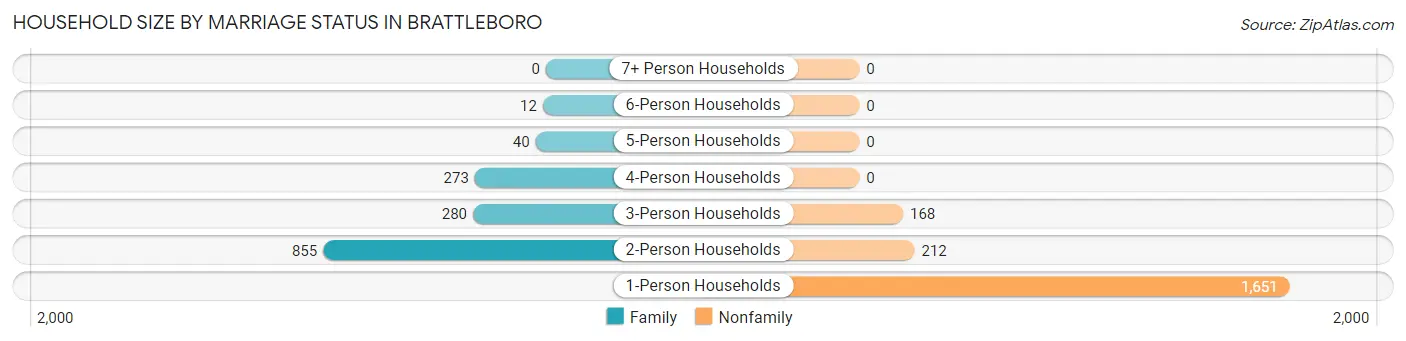
| Household Size | Family Households | Nonfamily Households |
| 1-Person Households | - | 1,651 (47.3%) |
| 2-Person Households | 855 (24.5%) | 212 (6.1%) |
| 3-Person Households | 280 (8.0%) | 168 (4.8%) |
| 4-Person Households | 273 (7.8%) | 0 (0.0%) |
| 5-Person Households | 40 (1.1%) | 0 (0.0%) |
| 6-Person Households | 12 (0.3%) | 0 (0.0%) |
| 7+ Person Households | 0 (0.0%) | 0 (0.0%) |
| Total | 1,460 (41.8%) | 2,031 (58.2%) |
Female Fertility in Brattleboro
Fertility by Age in Brattleboro
Average fertility rate in Brattleboro is 39.0 births per 1,000 women. Women in the age bracket of 35 to 50 years have the highest fertility rate with 65.0 births per 1,000 women. Women in the age bracket of 35 to 50 years acount for 78.8% of all women with births.
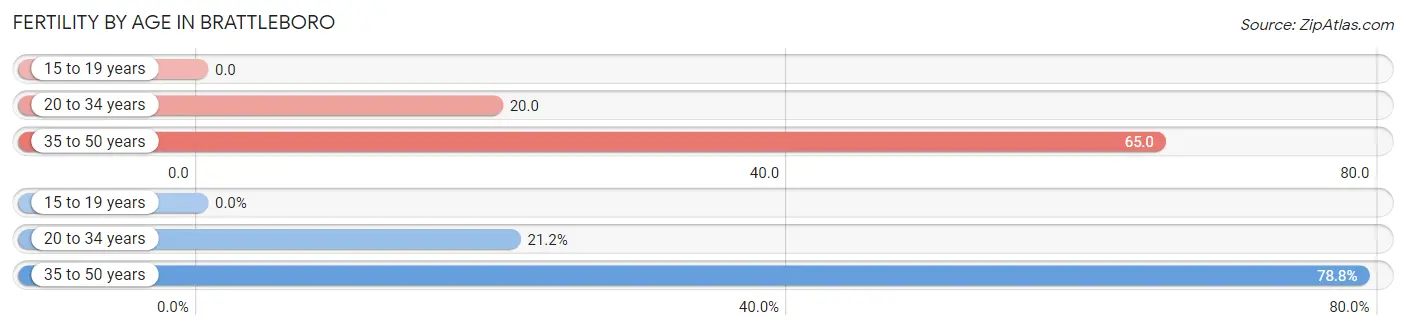
| Age Bracket | Women with Births | Births / 1,000 Women |
| 15 to 19 years | 0 (0.0%) | 0.0 |
| 20 to 34 years | 14 (21.2%) | 20.0 |
| 35 to 50 years | 52 (78.8%) | 65.0 |
| Total | 66 (100.0%) | 39.0 |
Fertility by Age by Marriage Status in Brattleboro
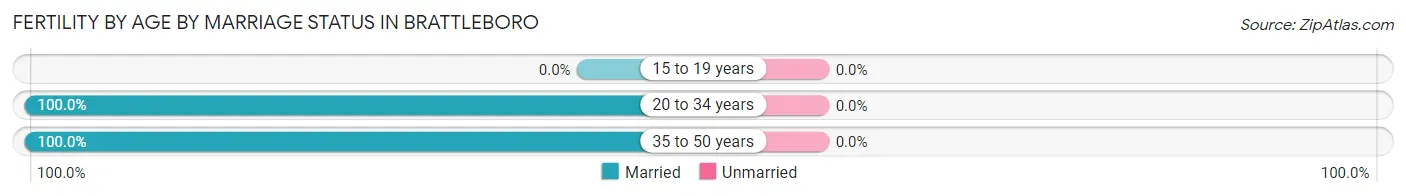
| Age Bracket | Married | Unmarried |
| 15 to 19 years | 0 (0.0%) | 0 (0.0%) |
| 20 to 34 years | 14 (100.0%) | 0 (0.0%) |
| 35 to 50 years | 52 (100.0%) | 0 (0.0%) |
| Total | 66 (100.0%) | 0 (0.0%) |
Fertility by Education in Brattleboro
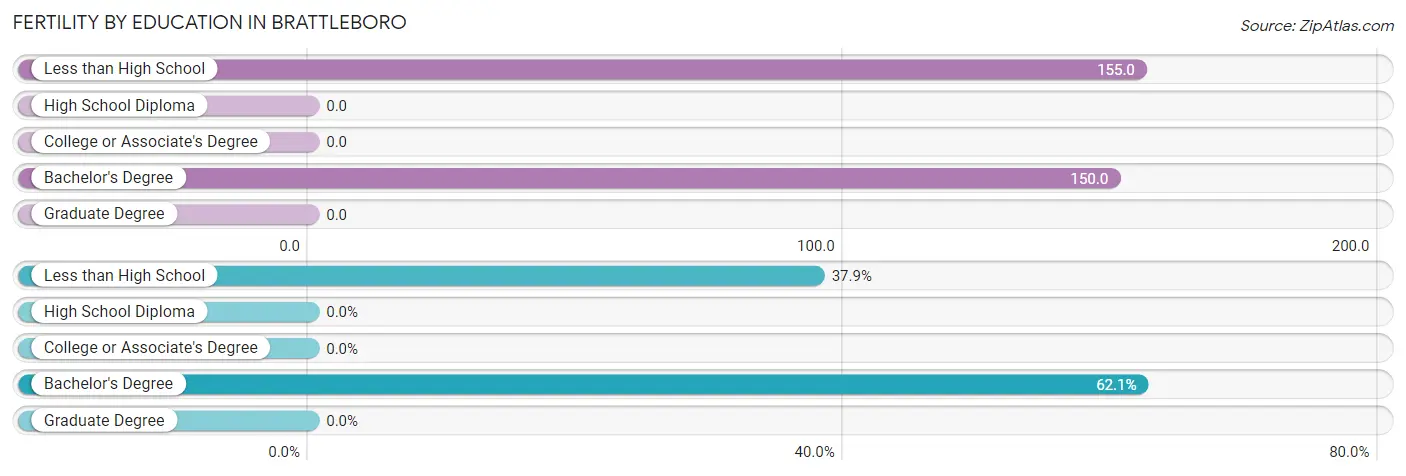
| Educational Attainment | Women with Births | Births / 1,000 Women |
| Less than High School | 25 (37.9%) | 155.0 |
| High School Diploma | 0 (0.0%) | 0.0 |
| College or Associate's Degree | 0 (0.0%) | 0.0 |
| Bachelor's Degree | 41 (62.1%) | 150.0 |
| Graduate Degree | 0 (0.0%) | 0.0 |
| Total | 66 (100.0%) | 39.0 |
Fertility by Education by Marriage Status in Brattleboro
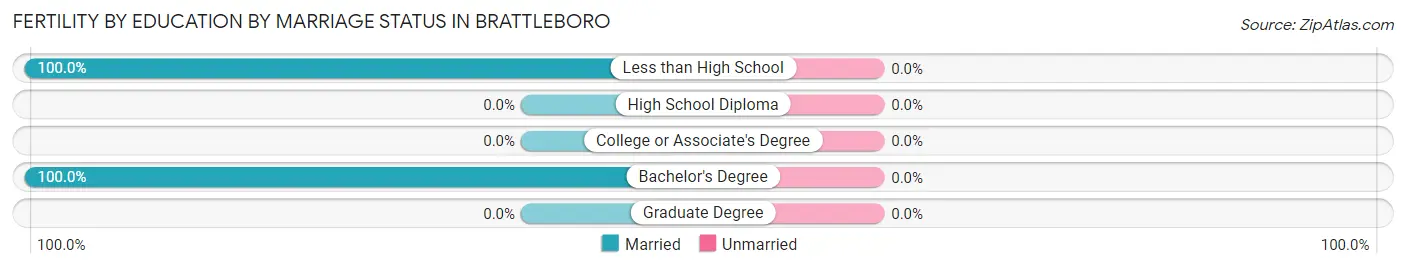
| Educational Attainment | Married | Unmarried |
| Less than High School | 25 (100.0%) | 0 (0.0%) |
| High School Diploma | 0 (0.0%) | 0 (0.0%) |
| College or Associate's Degree | 0 (0.0%) | 0 (0.0%) |
| Bachelor's Degree | 41 (100.0%) | 0 (0.0%) |
| Graduate Degree | 0 (0.0%) | 0 (0.0%) |
| Total | 66 (100.0%) | 0 (0.0%) |
Employment Characteristics in Brattleboro
Employment by Class of Employer in Brattleboro
Among the 3,178 employed individuals in Brattleboro, private company employees (1,441 | 45.3%), not-for-profit organizations (644 | 20.3%), and self-employed (not incorporated) (440 | 13.9%) make up the most common classes of employment.
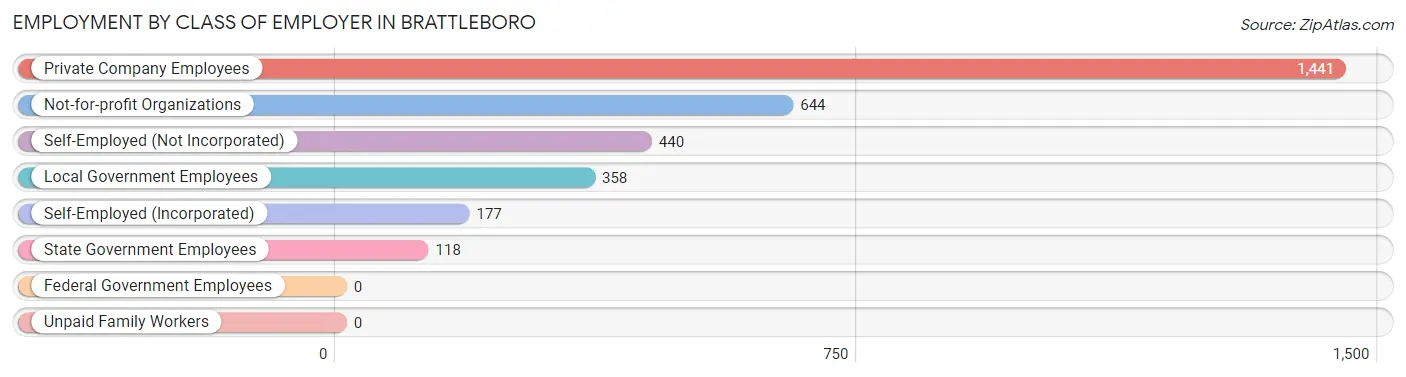
| Employer Class | # Employees | % Employees |
| Private Company Employees | 1,441 | 45.3% |
| Self-Employed (Incorporated) | 177 | 5.6% |
| Self-Employed (Not Incorporated) | 440 | 13.9% |
| Not-for-profit Organizations | 644 | 20.3% |
| Local Government Employees | 358 | 11.3% |
| State Government Employees | 118 | 3.7% |
| Federal Government Employees | 0 | 0.0% |
| Unpaid Family Workers | 0 | 0.0% |
| Total | 3,178 | 100.0% |
Employment Status by Age in Brattleboro
According to the labor force statistics for Brattleboro, out of the total population over 16 years of age (6,447), 55.0% or 3,546 individuals are in the labor force, with 9.2% or 326 of them unemployed. The age group with the highest labor force participation rate is 35 to 44 years, with 93.7% or 665 individuals in the labor force. Within the labor force, the 30 to 34 years age range has the highest percentage of unemployed individuals, with 27.5% or 99 of them being unemployed.
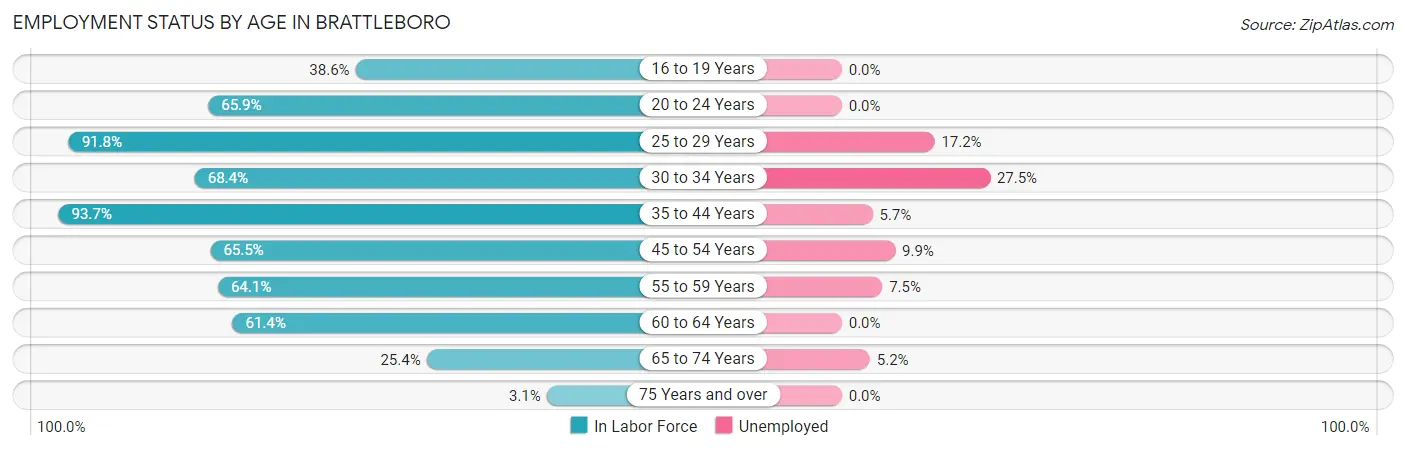
| Age Bracket | In Labor Force | Unemployed |
| 16 to 19 Years | 127 (38.6%) | 0 (0.0%) |
| 20 to 24 Years | 305 (65.9%) | 0 (0.0%) |
| 25 to 29 Years | 534 (91.8%) | 92 (17.2%) |
| 30 to 34 Years | 360 (68.4%) | 99 (27.5%) |
| 35 to 44 Years | 665 (93.7%) | 38 (5.7%) |
| 45 to 54 Years | 566 (65.5%) | 56 (9.9%) |
| 55 to 59 Years | 401 (64.1%) | 30 (7.5%) |
| 60 to 64 Years | 328 (61.4%) | 0 (0.0%) |
| 65 to 74 Years | 233 (25.4%) | 12 (5.2%) |
| 75 Years and over | 28 (3.1%) | 0 (0.0%) |
| Total | 3,546 (55.0%) | 326 (9.2%) |
Employment Status by Educational Attainment in Brattleboro
According to labor force statistics for Brattleboro, 74.3% of individuals (2,855) out of the total population between 25 and 64 years of age (3,842) are in the labor force, with 11.0% or 314 of them being unemployed. The group with the highest labor force participation rate are those with the educational attainment of bachelor's degree or higher, with 88.0% or 1,559 individuals in the labor force. Within the labor force, individuals with less than high school education have the highest percentage of unemployment, with 44.3% or 39 of them being unemployed.
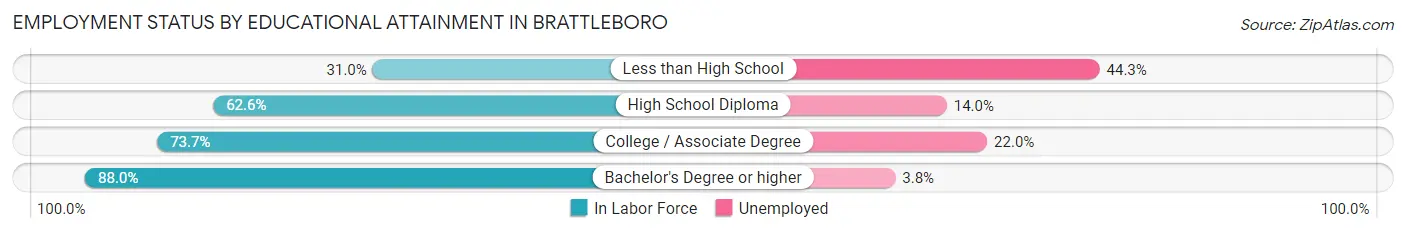
| Educational Attainment | In Labor Force | Unemployed |
| Less than High School | 88 (31.0%) | 126 (44.3%) |
| High School Diploma | 620 (62.6%) | 139 (14.0%) |
| College / Associate Degree | 586 (73.7%) | 175 (22.0%) |
| Bachelor's Degree or higher | 1,559 (88.0%) | 67 (3.8%) |
| Total | 2,855 (74.3%) | 423 (11.0%) |
Employment Occupations by Sex in Brattleboro
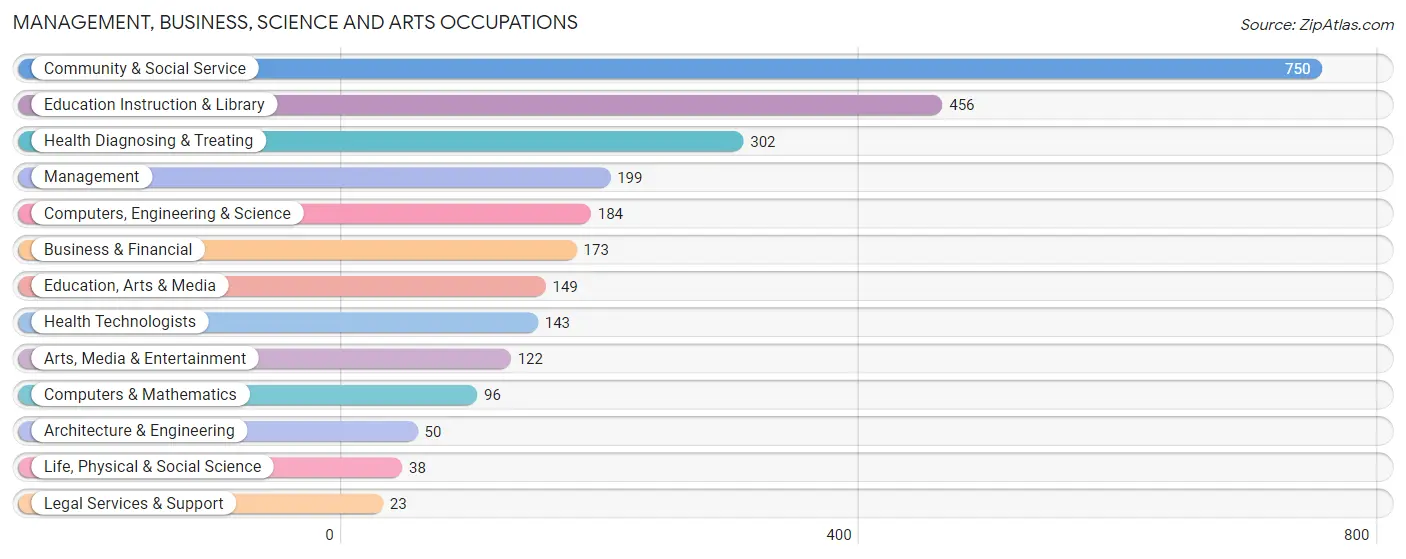
Management, Business, Science and Arts Occupations
The most common Management, Business, Science and Arts occupations in Brattleboro are Community & Social Service (750 | 23.3%), Education Instruction & Library (456 | 14.2%), Health Diagnosing & Treating (302 | 9.4%), Management (199 | 6.2%), and Computers, Engineering & Science (184 | 5.7%).
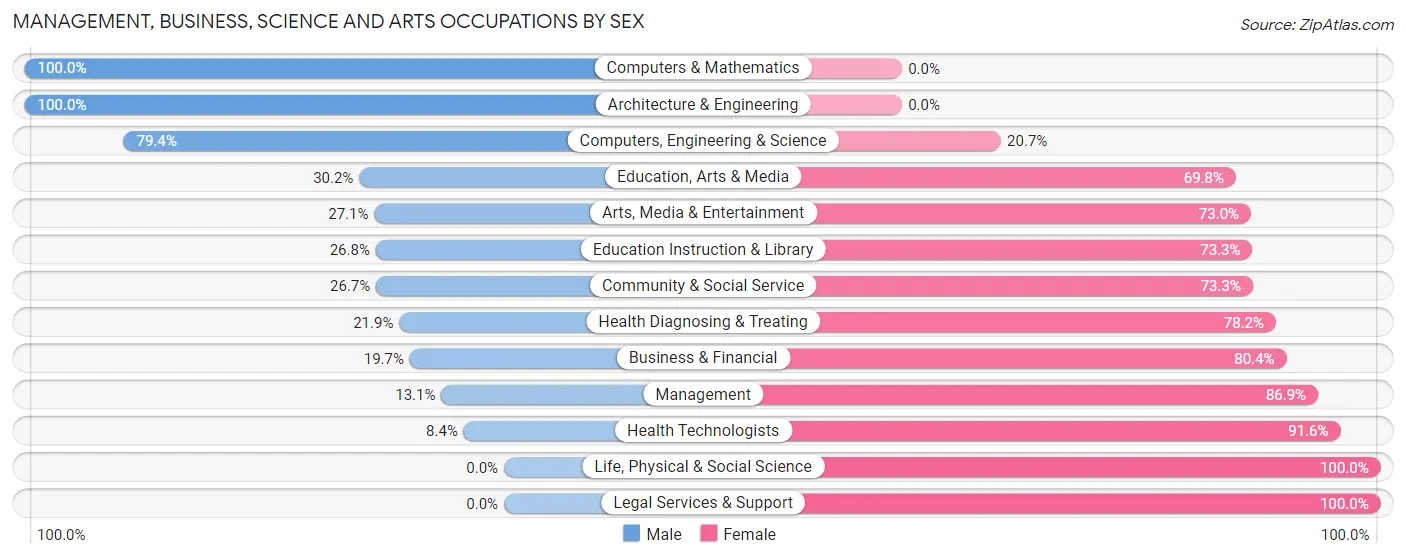
Management, Business, Science and Arts Occupations by Sex
Within the Management, Business, Science and Arts occupations in Brattleboro, the most male-oriented occupations are Computers & Mathematics (100.0%), Architecture & Engineering (100.0%), and Computers, Engineering & Science (79.3%), while the most female-oriented occupations are Life, Physical & Social Science (100.0%), Legal Services & Support (100.0%), and Health Technologists (91.6%).
| Occupation | Male | Female |
| Management | 26 (13.1%) | 173 (86.9%) |
| Business & Financial | 34 (19.7%) | 139 (80.3%) |
| Computers, Engineering & Science | 146 (79.3%) | 38 (20.6%) |
| Computers & Mathematics | 96 (100.0%) | 0 (0.0%) |
| Architecture & Engineering | 50 (100.0%) | 0 (0.0%) |
| Life, Physical & Social Science | 0 (0.0%) | 38 (100.0%) |
| Community & Social Service | 200 (26.7%) | 550 (73.3%) |
| Education, Arts & Media | 45 (30.2%) | 104 (69.8%) |
| Legal Services & Support | 0 (0.0%) | 23 (100.0%) |
| Education Instruction & Library | 122 (26.8%) | 334 (73.3%) |
| Arts, Media & Entertainment | 33 (27.1%) | 89 (73.0%) |
| Health Diagnosing & Treating | 66 (21.8%) | 236 (78.1%) |
| Health Technologists | 12 (8.4%) | 131 (91.6%) |
| Total (Category) | 472 (29.3%) | 1,136 (70.7%) |
| Total (Overall) | 1,353 (42.0%) | 1,867 (58.0%) |
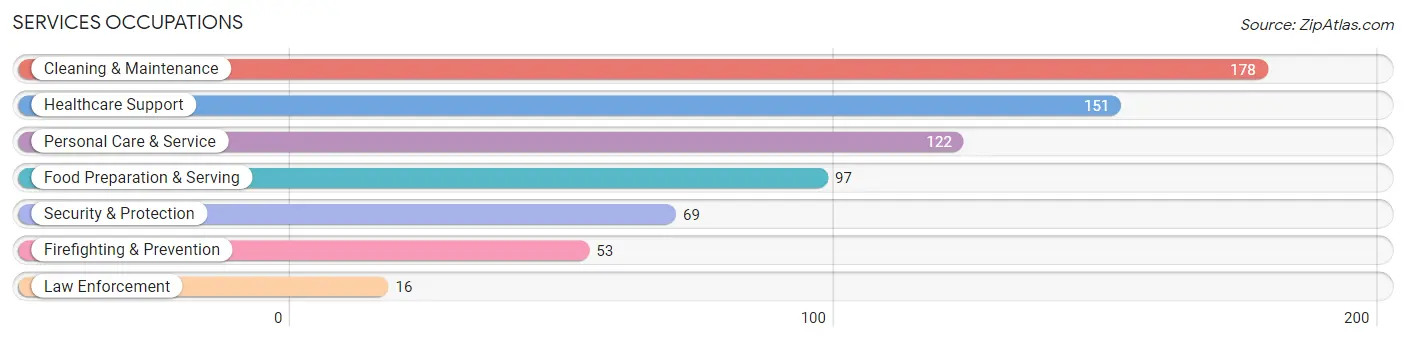
Services Occupations
The most common Services occupations in Brattleboro are Cleaning & Maintenance (178 | 5.5%), Healthcare Support (151 | 4.7%), Personal Care & Service (122 | 3.8%), Food Preparation & Serving (97 | 3.0%), and Security & Protection (69 | 2.1%).
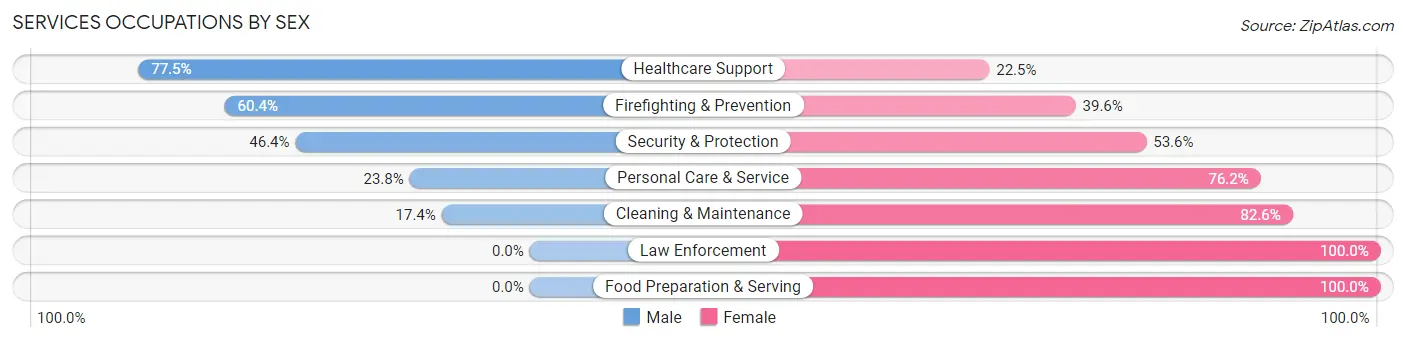
Services Occupations by Sex
Within the Services occupations in Brattleboro, the most male-oriented occupations are Healthcare Support (77.5%), Firefighting & Prevention (60.4%), and Security & Protection (46.4%), while the most female-oriented occupations are Law Enforcement (100.0%), Food Preparation & Serving (100.0%), and Cleaning & Maintenance (82.6%).
| Occupation | Male | Female |
| Healthcare Support | 117 (77.5%) | 34 (22.5%) |
| Security & Protection | 32 (46.4%) | 37 (53.6%) |
| Firefighting & Prevention | 32 (60.4%) | 21 (39.6%) |
| Law Enforcement | 0 (0.0%) | 16 (100.0%) |
| Food Preparation & Serving | 0 (0.0%) | 97 (100.0%) |
| Cleaning & Maintenance | 31 (17.4%) | 147 (82.6%) |
| Personal Care & Service | 29 (23.8%) | 93 (76.2%) |
| Total (Category) | 209 (33.9%) | 408 (66.1%) |
| Total (Overall) | 1,353 (42.0%) | 1,867 (58.0%) |
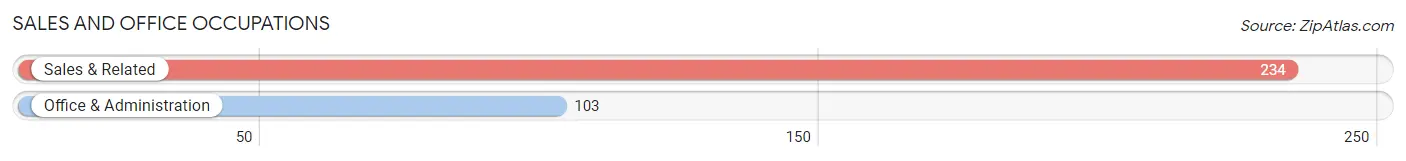
Sales and Office Occupations
The most common Sales and Office occupations in Brattleboro are Sales & Related (234 | 7.3%), and Office & Administration (103 | 3.2%).
Sales and Office Occupations by Sex
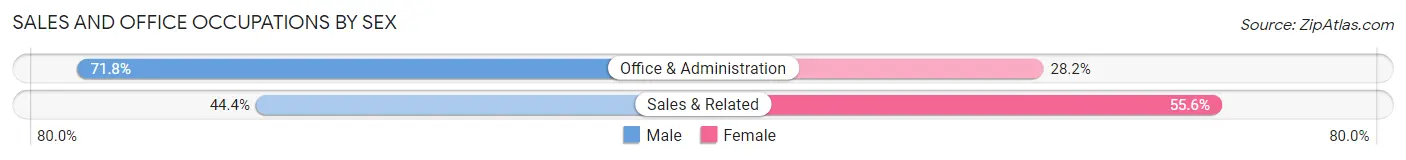
| Occupation | Male | Female |
| Sales & Related | 104 (44.4%) | 130 (55.6%) |
| Office & Administration | 74 (71.8%) | 29 (28.2%) |
| Total (Category) | 178 (52.8%) | 159 (47.2%) |
| Total (Overall) | 1,353 (42.0%) | 1,867 (58.0%) |
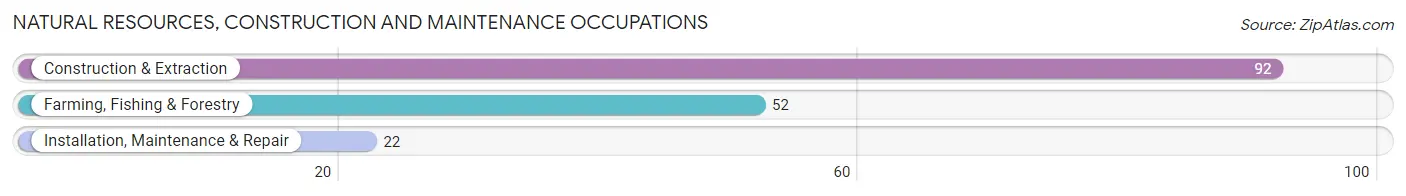
Natural Resources, Construction and Maintenance Occupations
The most common Natural Resources, Construction and Maintenance occupations in Brattleboro are Construction & Extraction (92 | 2.9%), Farming, Fishing & Forestry (52 | 1.6%), and Installation, Maintenance & Repair (22 | 0.7%).
Natural Resources, Construction and Maintenance Occupations by Sex
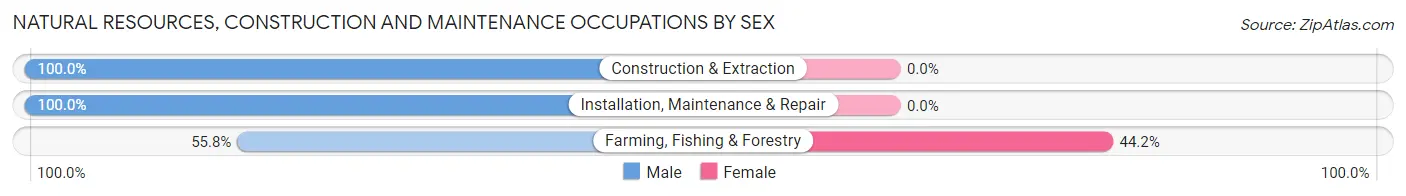
| Occupation | Male | Female |
| Farming, Fishing & Forestry | 29 (55.8%) | 23 (44.2%) |
| Construction & Extraction | 92 (100.0%) | 0 (0.0%) |
| Installation, Maintenance & Repair | 22 (100.0%) | 0 (0.0%) |
| Total (Category) | 143 (86.1%) | 23 (13.9%) |
| Total (Overall) | 1,353 (42.0%) | 1,867 (58.0%) |
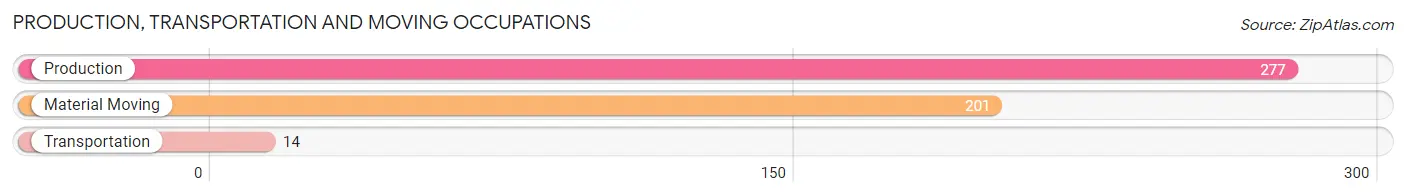
Production, Transportation and Moving Occupations
The most common Production, Transportation and Moving occupations in Brattleboro are Production (277 | 8.6%), Material Moving (201 | 6.2%), and Transportation (14 | 0.4%).
Production, Transportation and Moving Occupations by Sex
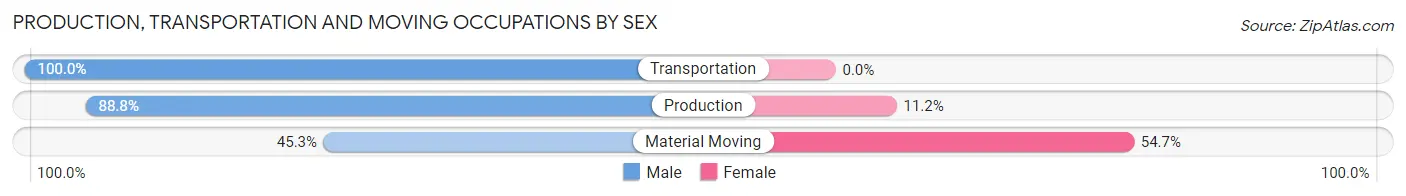
| Occupation | Male | Female |
| Production | 246 (88.8%) | 31 (11.2%) |
| Transportation | 14 (100.0%) | 0 (0.0%) |
| Material Moving | 91 (45.3%) | 110 (54.7%) |
| Total (Category) | 351 (71.3%) | 141 (28.7%) |
| Total (Overall) | 1,353 (42.0%) | 1,867 (58.0%) |
Employment Industries by Sex in Brattleboro
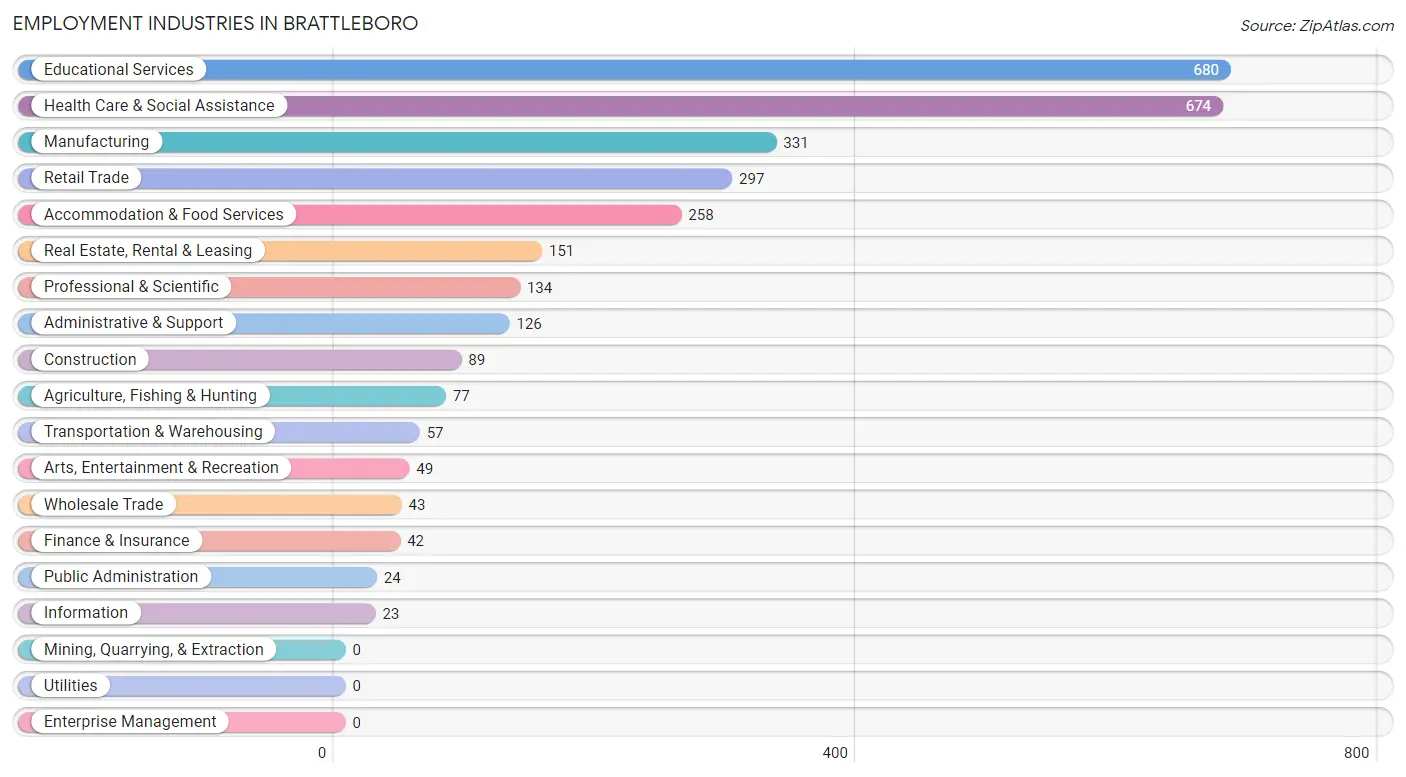
Employment Industries in Brattleboro
The major employment industries in Brattleboro include Educational Services (680 | 21.1%), Health Care & Social Assistance (674 | 20.9%), Manufacturing (331 | 10.3%), Retail Trade (297 | 9.2%), and Accommodation & Food Services (258 | 8.0%).
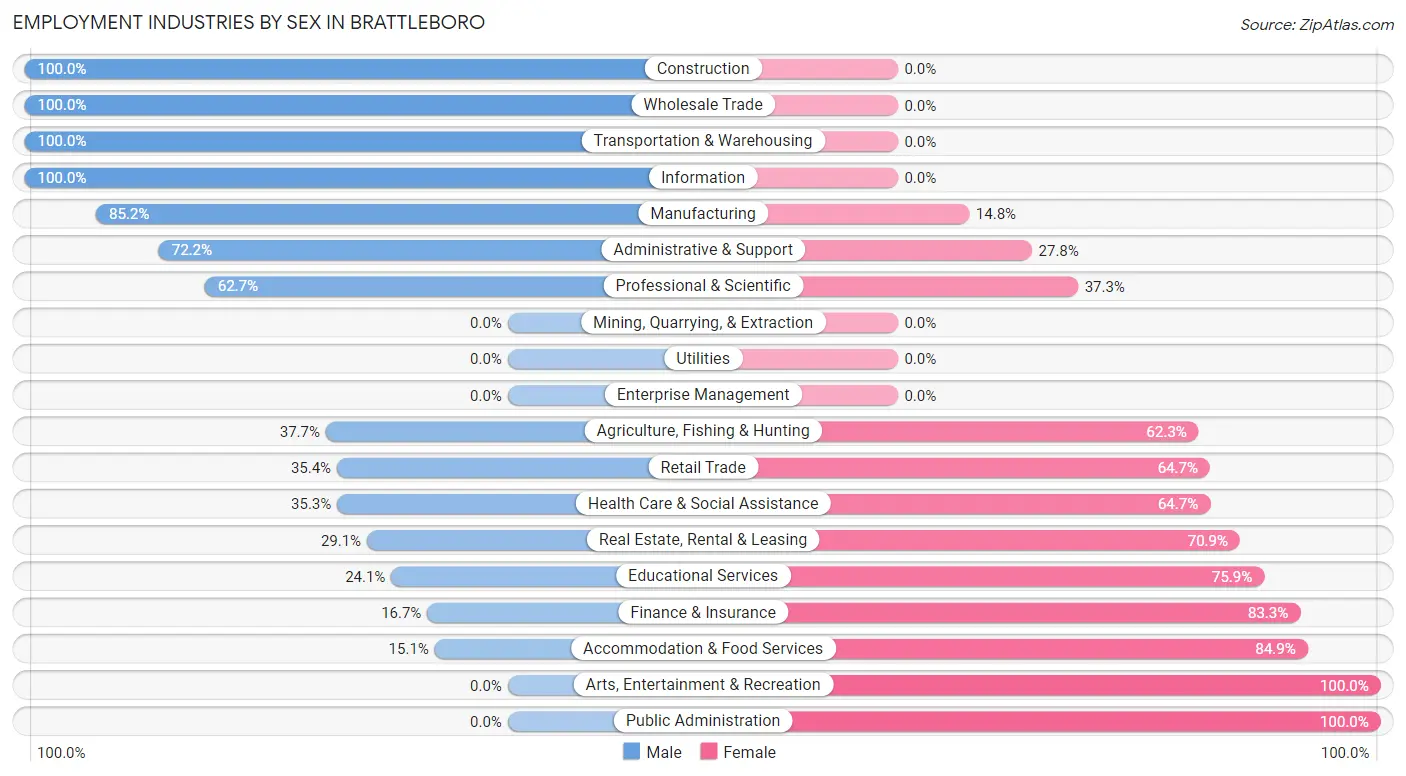
Employment Industries by Sex in Brattleboro
The Brattleboro industries that see more men than women are Construction (100.0%), Wholesale Trade (100.0%), and Transportation & Warehousing (100.0%), whereas the industries that tend to have a higher number of women are Arts, Entertainment & Recreation (100.0%), Public Administration (100.0%), and Accommodation & Food Services (84.9%).
| Industry | Male | Female |
| Agriculture, Fishing & Hunting | 29 (37.7%) | 48 (62.3%) |
| Mining, Quarrying, & Extraction | 0 (0.0%) | 0 (0.0%) |
| Construction | 89 (100.0%) | 0 (0.0%) |
| Manufacturing | 282 (85.2%) | 49 (14.8%) |
| Wholesale Trade | 43 (100.0%) | 0 (0.0%) |
| Retail Trade | 105 (35.3%) | 192 (64.6%) |
| Transportation & Warehousing | 57 (100.0%) | 0 (0.0%) |
| Utilities | 0 (0.0%) | 0 (0.0%) |
| Information | 23 (100.0%) | 0 (0.0%) |
| Finance & Insurance | 7 (16.7%) | 35 (83.3%) |
| Real Estate, Rental & Leasing | 44 (29.1%) | 107 (70.9%) |
| Professional & Scientific | 84 (62.7%) | 50 (37.3%) |
| Enterprise Management | 0 (0.0%) | 0 (0.0%) |
| Administrative & Support | 91 (72.2%) | 35 (27.8%) |
| Educational Services | 164 (24.1%) | 516 (75.9%) |
| Health Care & Social Assistance | 238 (35.3%) | 436 (64.7%) |
| Arts, Entertainment & Recreation | 0 (0.0%) | 49 (100.0%) |
| Accommodation & Food Services | 39 (15.1%) | 219 (84.9%) |
| Public Administration | 0 (0.0%) | 24 (100.0%) |
| Total | 1,353 (42.0%) | 1,867 (58.0%) |
Education in Brattleboro
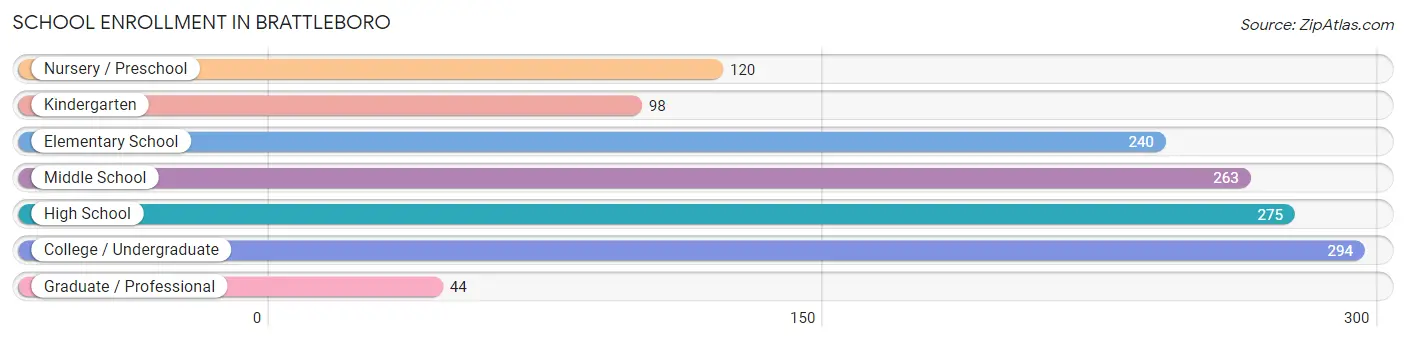
School Enrollment in Brattleboro
The most common levels of schooling among the 1,334 students in Brattleboro are college / undergraduate (294 | 22.0%), high school (275 | 20.6%), and middle school (263 | 19.7%).
| School Level | # Students | % Students |
| Nursery / Preschool | 120 | 9.0% |
| Kindergarten | 98 | 7.3% |
| Elementary School | 240 | 18.0% |
| Middle School | 263 | 19.7% |
| High School | 275 | 20.6% |
| College / Undergraduate | 294 | 22.0% |
| Graduate / Professional | 44 | 3.3% |
| Total | 1,334 | 100.0% |
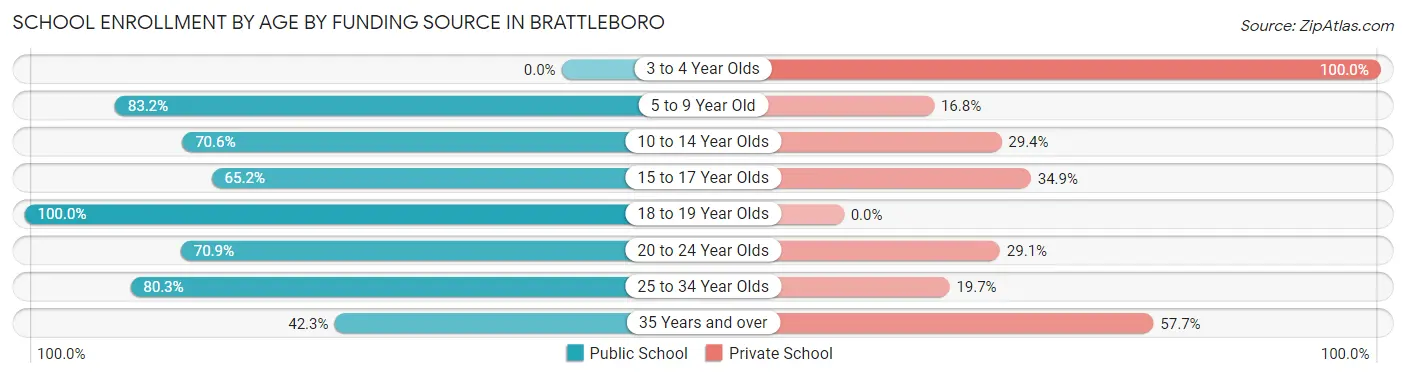
School Enrollment by Age by Funding Source in Brattleboro
Out of a total of 1,334 students who are enrolled in schools in Brattleboro, 359 (26.9%) attend a private institution, while the remaining 975 (73.1%) are enrolled in public schools. The age group of 3 to 4 year olds has the highest likelihood of being enrolled in private schools, with 23 (100.0% in the age bracket) enrolled. Conversely, the age group of 18 to 19 year olds has the lowest likelihood of being enrolled in a private school, with 37 (100.0% in the age bracket) attending a public institution.
| Age Bracket | Public School | Private School |
| 3 to 4 Year Olds | 0 (0.0%) | 23 (100.0%) |
| 5 to 9 Year Old | 351 (83.2%) | 71 (16.8%) |
| 10 to 14 Year Olds | 178 (70.6%) | 74 (29.4%) |
| 15 to 17 Year Olds | 172 (65.1%) | 92 (34.8%) |
| 18 to 19 Year Olds | 37 (100.0%) | 0 (0.0%) |
| 20 to 24 Year Olds | 173 (70.9%) | 71 (29.1%) |
| 25 to 34 Year Olds | 53 (80.3%) | 13 (19.7%) |
| 35 Years and over | 11 (42.3%) | 15 (57.7%) |
| Total | 975 (73.1%) | 359 (26.9%) |
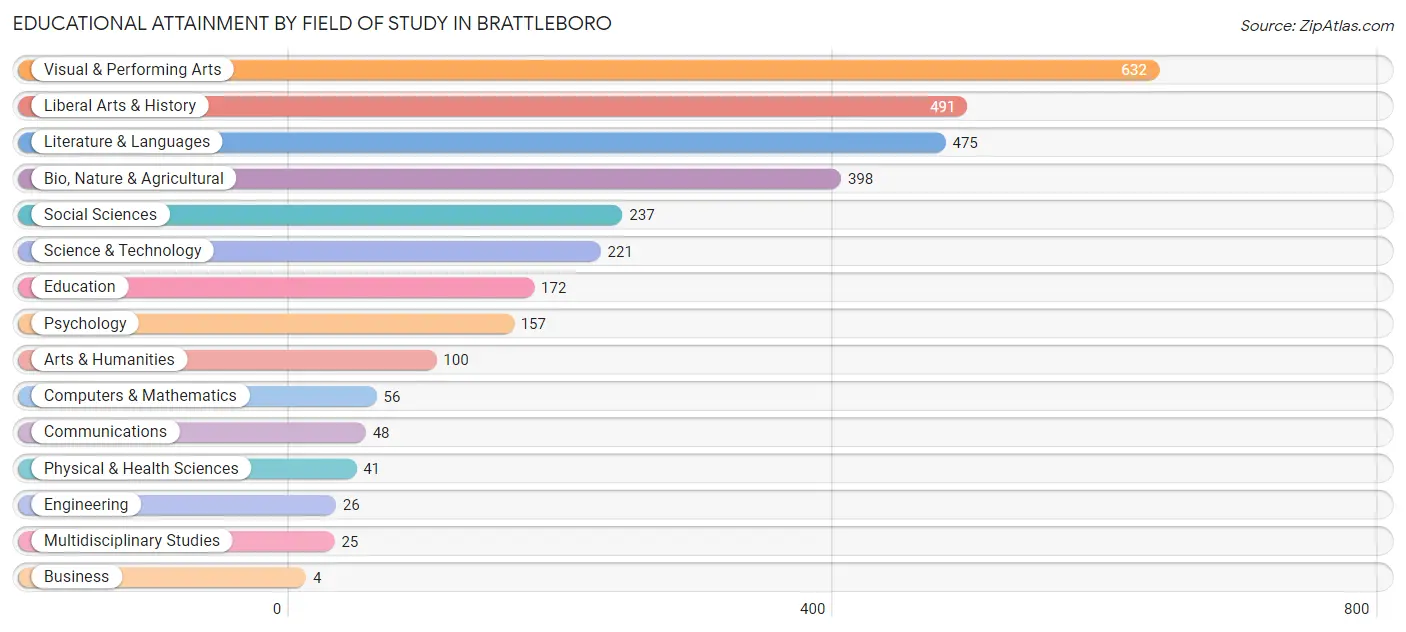
Educational Attainment by Field of Study in Brattleboro
Visual & performing arts (632 | 20.5%), liberal arts & history (491 | 15.9%), literature & languages (475 | 15.4%), bio, nature & agricultural (398 | 12.9%), and social sciences (237 | 7.7%) are the most common fields of study among 3,083 individuals in Brattleboro who have obtained a bachelor's degree or higher.
| Field of Study | # Graduates | % Graduates |
| Computers & Mathematics | 56 | 1.8% |
| Bio, Nature & Agricultural | 398 | 12.9% |
| Physical & Health Sciences | 41 | 1.3% |
| Psychology | 157 | 5.1% |
| Social Sciences | 237 | 7.7% |
| Engineering | 26 | 0.8% |
| Multidisciplinary Studies | 25 | 0.8% |
| Science & Technology | 221 | 7.2% |
| Business | 4 | 0.1% |
| Education | 172 | 5.6% |
| Literature & Languages | 475 | 15.4% |
| Liberal Arts & History | 491 | 15.9% |
| Visual & Performing Arts | 632 | 20.5% |
| Communications | 48 | 1.6% |
| Arts & Humanities | 100 | 3.2% |
| Total | 3,083 | 100.0% |
Transportation & Commute in Brattleboro
Vehicle Availability by Sex in Brattleboro
The most prevalent vehicle ownership categories in Brattleboro are males with 2 vehicles (629, accounting for 47.0%) and females with 2 vehicles (561, making up 34.2%).
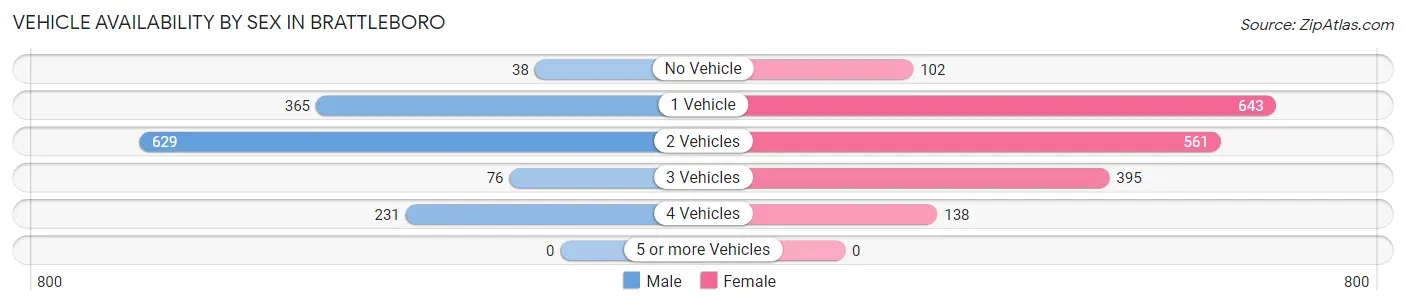
| Vehicles Available | Male | Female |
| No Vehicle | 38 (2.8%) | 102 (5.6%) |
| 1 Vehicle | 365 (27.3%) | 643 (35.0%) |
| 2 Vehicles | 629 (47.0%) | 561 (30.5%) |
| 3 Vehicles | 76 (5.7%) | 395 (21.5%) |
| 4 Vehicles | 231 (17.2%) | 138 (7.5%) |
| 5 or more Vehicles | 0 (0.0%) | 0 (0.0%) |
| Total | 1,339 (100.0%) | 1,839 (100.0%) |
Commute Time in Brattleboro
The most frequently occuring commute durations in Brattleboro are 5 to 9 minutes (763 commuters, 28.1%), 15 to 19 minutes (545 commuters, 20.1%), and 10 to 14 minutes (487 commuters, 17.9%).
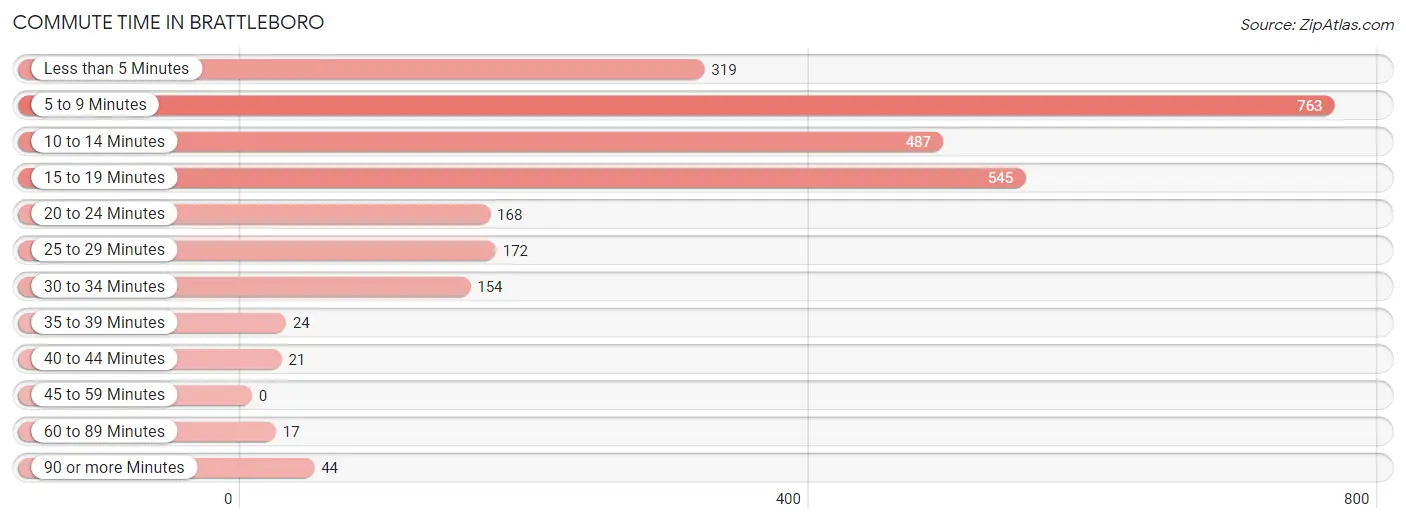
| Commute Time | # Commuters | % Commuters |
| Less than 5 Minutes | 319 | 11.7% |
| 5 to 9 Minutes | 763 | 28.1% |
| 10 to 14 Minutes | 487 | 17.9% |
| 15 to 19 Minutes | 545 | 20.1% |
| 20 to 24 Minutes | 168 | 6.2% |
| 25 to 29 Minutes | 172 | 6.3% |
| 30 to 34 Minutes | 154 | 5.7% |
| 35 to 39 Minutes | 24 | 0.9% |
| 40 to 44 Minutes | 21 | 0.8% |
| 45 to 59 Minutes | 0 | 0.0% |
| 60 to 89 Minutes | 17 | 0.6% |
| 90 or more Minutes | 44 | 1.6% |
Commute Time by Sex in Brattleboro
The most common commute times in Brattleboro are 5 to 9 minutes (334 commuters, 28.6%) for males and 5 to 9 minutes (429 commuters, 27.8%) for females.
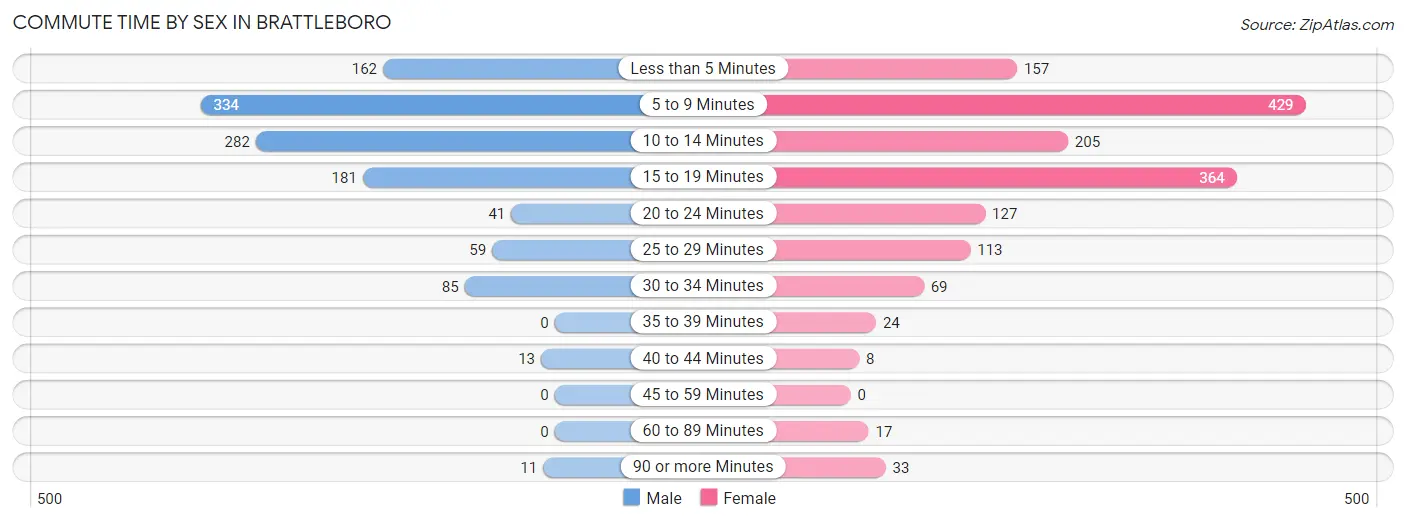
| Commute Time | Male | Female |
| Less than 5 Minutes | 162 (13.9%) | 157 (10.2%) |
| 5 to 9 Minutes | 334 (28.6%) | 429 (27.8%) |
| 10 to 14 Minutes | 282 (24.1%) | 205 (13.3%) |
| 15 to 19 Minutes | 181 (15.5%) | 364 (23.5%) |
| 20 to 24 Minutes | 41 (3.5%) | 127 (8.2%) |
| 25 to 29 Minutes | 59 (5.1%) | 113 (7.3%) |
| 30 to 34 Minutes | 85 (7.3%) | 69 (4.5%) |
| 35 to 39 Minutes | 0 (0.0%) | 24 (1.5%) |
| 40 to 44 Minutes | 13 (1.1%) | 8 (0.5%) |
| 45 to 59 Minutes | 0 (0.0%) | 0 (0.0%) |
| 60 to 89 Minutes | 0 (0.0%) | 17 (1.1%) |
| 90 or more Minutes | 11 (0.9%) | 33 (2.1%) |
Time of Departure to Work by Sex in Brattleboro
The most frequent times of departure to work in Brattleboro are 9:00 AM to 9:59 AM (256, 21.9%) for males and 8:00 AM to 8:29 AM (445, 28.8%) for females.
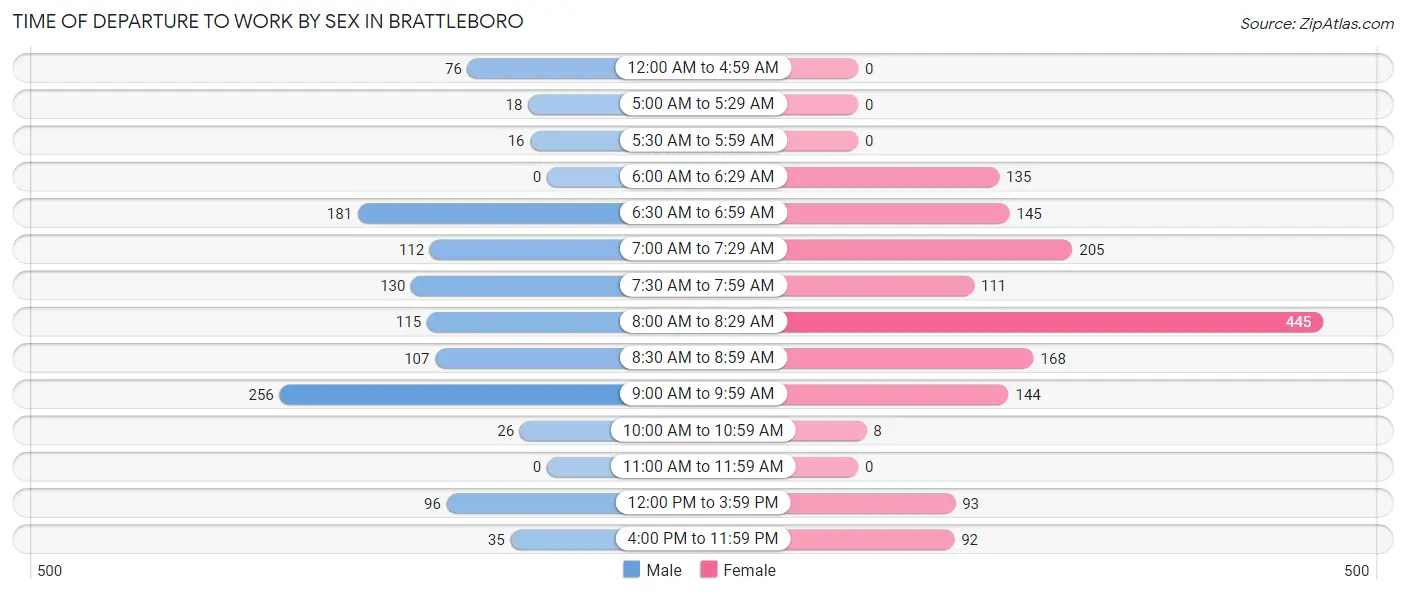
| Time of Departure | Male | Female |
| 12:00 AM to 4:59 AM | 76 (6.5%) | 0 (0.0%) |
| 5:00 AM to 5:29 AM | 18 (1.5%) | 0 (0.0%) |
| 5:30 AM to 5:59 AM | 16 (1.4%) | 0 (0.0%) |
| 6:00 AM to 6:29 AM | 0 (0.0%) | 135 (8.7%) |
| 6:30 AM to 6:59 AM | 181 (15.5%) | 145 (9.4%) |
| 7:00 AM to 7:29 AM | 112 (9.6%) | 205 (13.3%) |
| 7:30 AM to 7:59 AM | 130 (11.1%) | 111 (7.2%) |
| 8:00 AM to 8:29 AM | 115 (9.9%) | 445 (28.8%) |
| 8:30 AM to 8:59 AM | 107 (9.2%) | 168 (10.9%) |
| 9:00 AM to 9:59 AM | 256 (21.9%) | 144 (9.3%) |
| 10:00 AM to 10:59 AM | 26 (2.2%) | 8 (0.5%) |
| 11:00 AM to 11:59 AM | 0 (0.0%) | 0 (0.0%) |
| 12:00 PM to 3:59 PM | 96 (8.2%) | 93 (6.0%) |
| 4:00 PM to 11:59 PM | 35 (3.0%) | 92 (5.9%) |
| Total | 1,168 (100.0%) | 1,546 (100.0%) |
Housing Occupancy in Brattleboro
Occupancy by Ownership in Brattleboro
Of the total 3,491 dwellings in Brattleboro, owner-occupied units account for 1,661 (47.6%), while renter-occupied units make up 1,830 (52.4%).
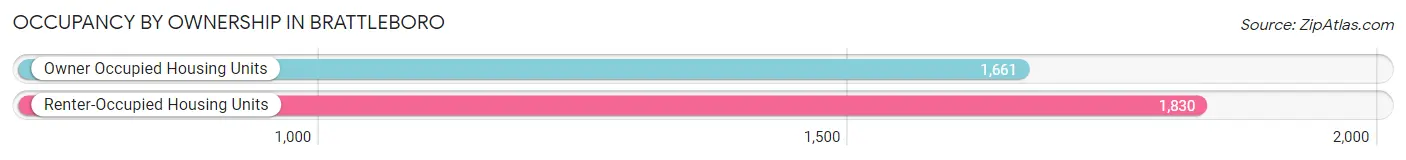
| Occupancy | # Housing Units | % Housing Units |
| Owner Occupied Housing Units | 1,661 | 47.6% |
| Renter-Occupied Housing Units | 1,830 | 52.4% |
| Total Occupied Housing Units | 3,491 | 100.0% |
Occupancy by Household Size in Brattleboro
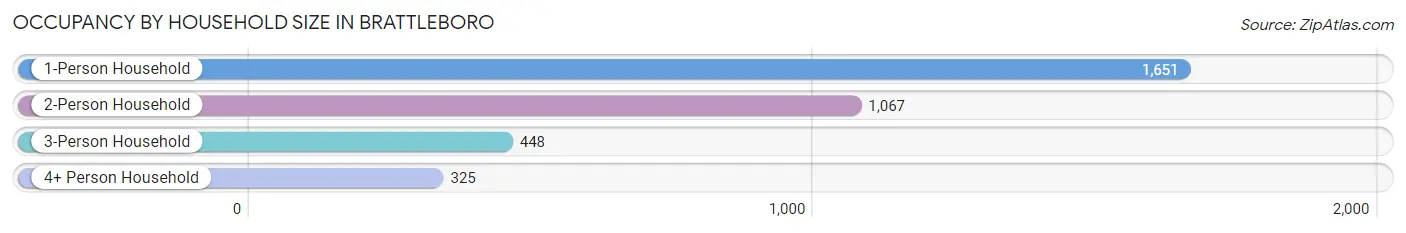
| Household Size | # Housing Units | % Housing Units |
| 1-Person Household | 1,651 | 47.3% |
| 2-Person Household | 1,067 | 30.6% |
| 3-Person Household | 448 | 12.8% |
| 4+ Person Household | 325 | 9.3% |
| Total Housing Units | 3,491 | 100.0% |
Occupancy by Ownership by Household Size in Brattleboro
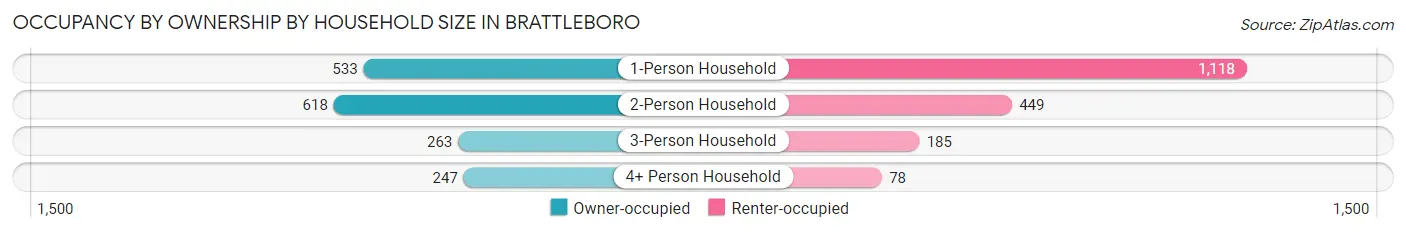
| Household Size | Owner-occupied | Renter-occupied |
| 1-Person Household | 533 (32.3%) | 1,118 (67.7%) |
| 2-Person Household | 618 (57.9%) | 449 (42.1%) |
| 3-Person Household | 263 (58.7%) | 185 (41.3%) |
| 4+ Person Household | 247 (76.0%) | 78 (24.0%) |
| Total Housing Units | 1,661 (47.6%) | 1,830 (52.4%) |
Occupancy by Educational Attainment in Brattleboro
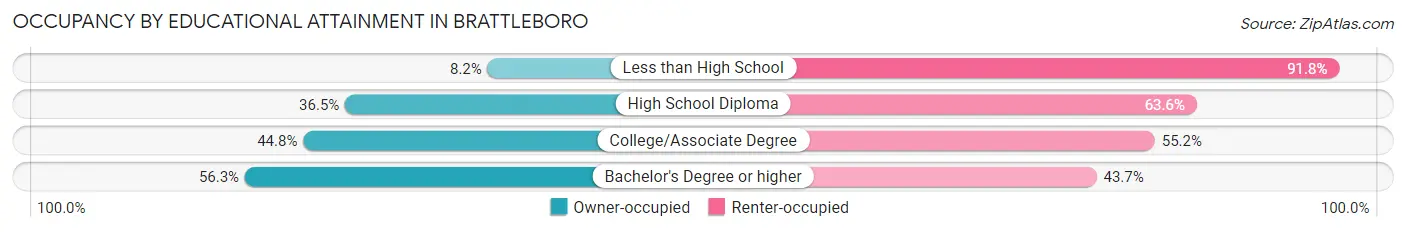
| Household Size | Owner-occupied | Renter-occupied |
| Less than High School | 10 (8.2%) | 112 (91.8%) |
| High School Diploma | 304 (36.4%) | 530 (63.5%) |
| College/Associate Degree | 312 (44.8%) | 385 (55.2%) |
| Bachelor's Degree or higher | 1,035 (56.3%) | 803 (43.7%) |
Occupancy by Age of Householder in Brattleboro
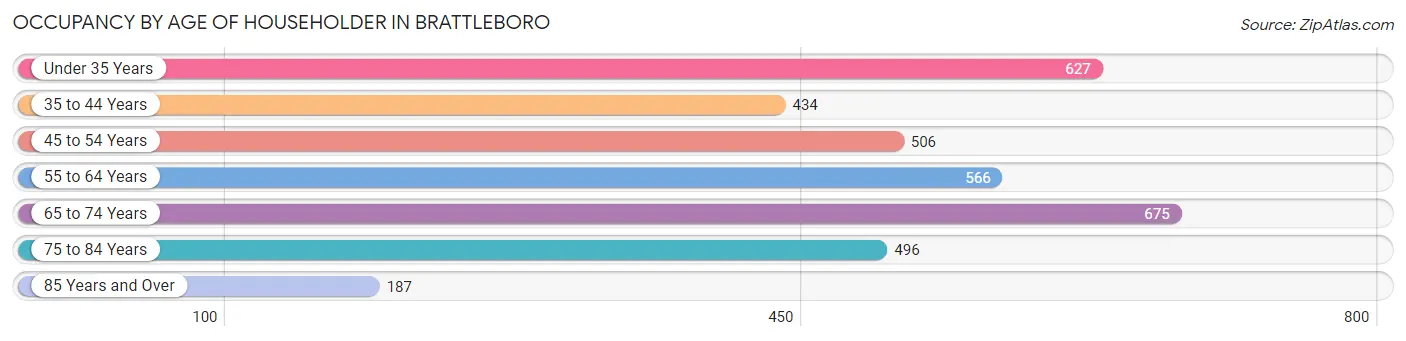
| Age Bracket | # Households | % Households |
| Under 35 Years | 627 | 18.0% |
| 35 to 44 Years | 434 | 12.4% |
| 45 to 54 Years | 506 | 14.5% |
| 55 to 64 Years | 566 | 16.2% |
| 65 to 74 Years | 675 | 19.3% |
| 75 to 84 Years | 496 | 14.2% |
| 85 Years and Over | 187 | 5.4% |
| Total | 3,491 | 100.0% |
Housing Finances in Brattleboro
Median Income by Occupancy in Brattleboro
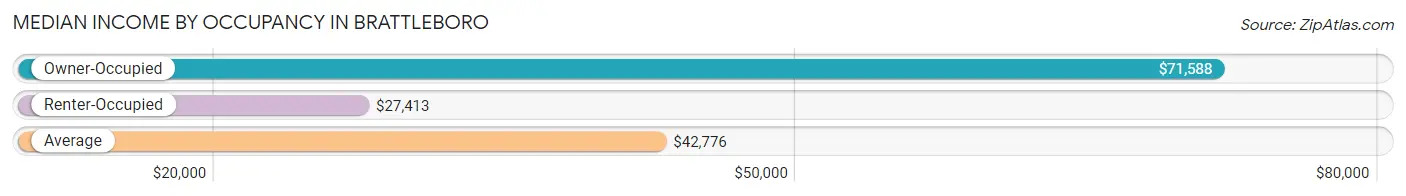
| Occupancy Type | # Households | Median Income |
| Owner-Occupied | 1,661 (47.6%) | $71,588 |
| Renter-Occupied | 1,830 (52.4%) | $27,413 |
| Average | 3,491 (100.0%) | $42,776 |
Occupancy by Householder Income Bracket in Brattleboro
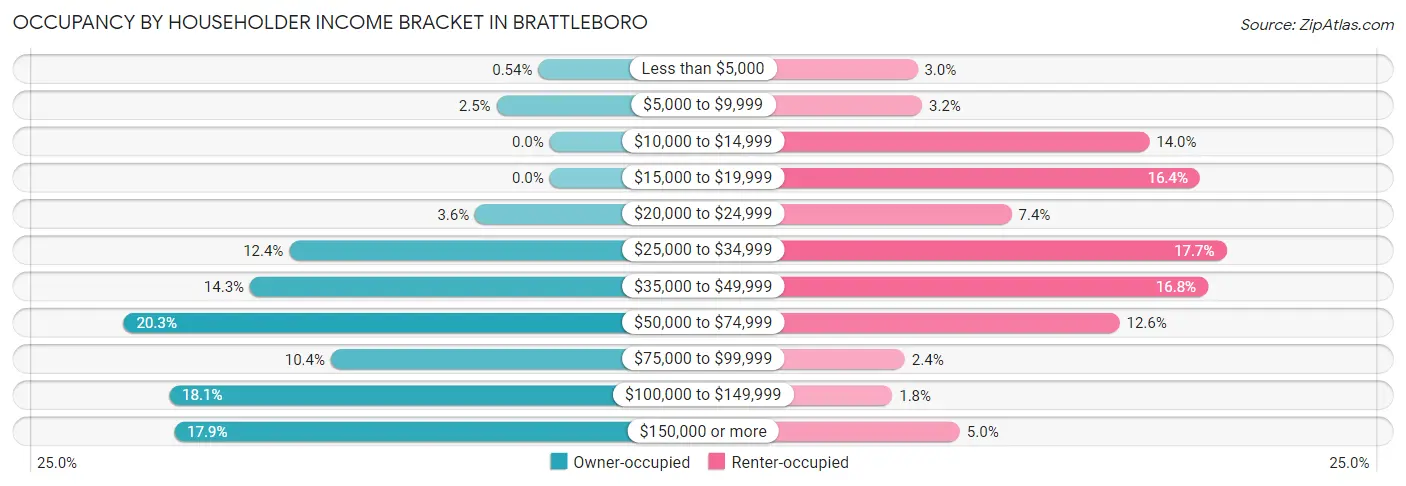
| Income Bracket | Owner-occupied | Renter-occupied |
| Less than $5,000 | 9 (0.5%) | 54 (2.9%) |
| $5,000 to $9,999 | 42 (2.5%) | 58 (3.2%) |
| $10,000 to $14,999 | 0 (0.0%) | 256 (14.0%) |
| $15,000 to $19,999 | 0 (0.0%) | 300 (16.4%) |
| $20,000 to $24,999 | 59 (3.5%) | 136 (7.4%) |
| $25,000 to $34,999 | 206 (12.4%) | 323 (17.6%) |
| $35,000 to $49,999 | 237 (14.3%) | 307 (16.8%) |
| $50,000 to $74,999 | 337 (20.3%) | 230 (12.6%) |
| $75,000 to $99,999 | 173 (10.4%) | 43 (2.4%) |
| $100,000 to $149,999 | 301 (18.1%) | 32 (1.8%) |
| $150,000 or more | 297 (17.9%) | 91 (5.0%) |
| Total | 1,661 (100.0%) | 1,830 (100.0%) |
Monthly Housing Cost Tiers in Brattleboro
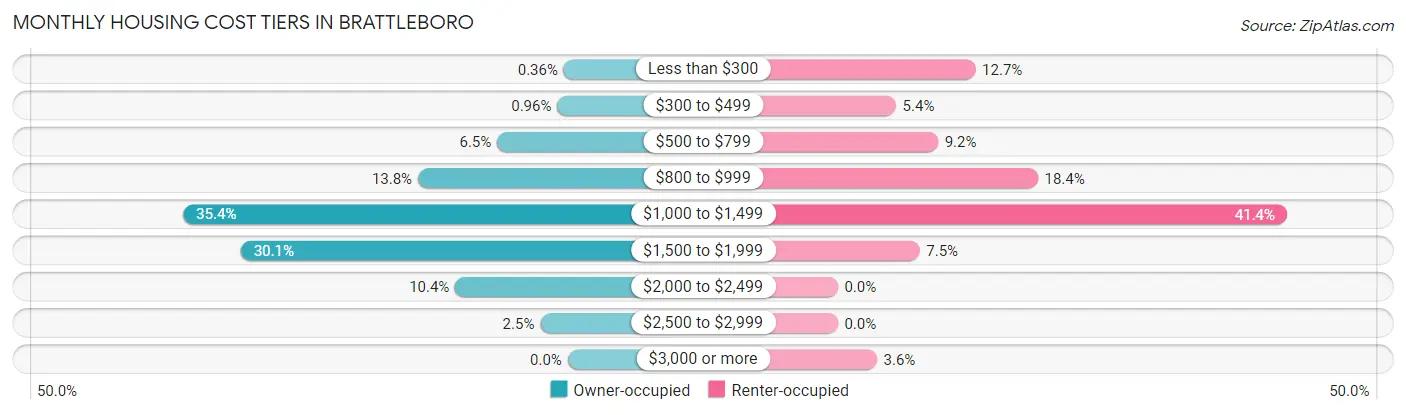
| Monthly Cost | Owner-occupied | Renter-occupied |
| Less than $300 | 6 (0.4%) | 232 (12.7%) |
| $300 to $499 | 16 (1.0%) | 98 (5.4%) |
| $500 to $799 | 108 (6.5%) | 169 (9.2%) |
| $800 to $999 | 229 (13.8%) | 337 (18.4%) |
| $1,000 to $1,499 | 588 (35.4%) | 757 (41.4%) |
| $1,500 to $1,999 | 500 (30.1%) | 138 (7.5%) |
| $2,000 to $2,499 | 172 (10.4%) | 0 (0.0%) |
| $2,500 to $2,999 | 42 (2.5%) | 0 (0.0%) |
| $3,000 or more | 0 (0.0%) | 66 (3.6%) |
| Total | 1,661 (100.0%) | 1,830 (100.0%) |
Physical Housing Characteristics in Brattleboro
Housing Structures in Brattleboro
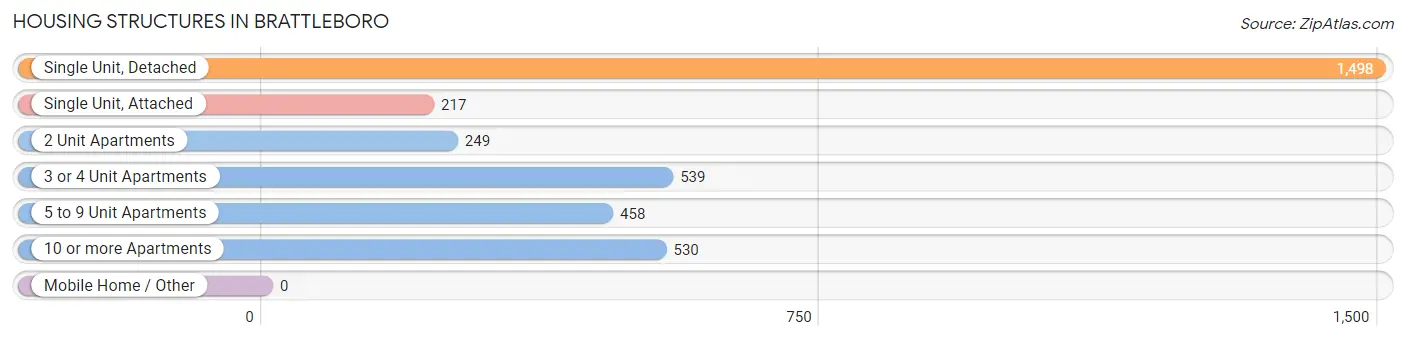
| Structure Type | # Housing Units | % Housing Units |
| Single Unit, Detached | 1,498 | 42.9% |
| Single Unit, Attached | 217 | 6.2% |
| 2 Unit Apartments | 249 | 7.1% |
| 3 or 4 Unit Apartments | 539 | 15.4% |
| 5 to 9 Unit Apartments | 458 | 13.1% |
| 10 or more Apartments | 530 | 15.2% |
| Mobile Home / Other | 0 | 0.0% |
| Total | 3,491 | 100.0% |
Housing Structures by Occupancy in Brattleboro
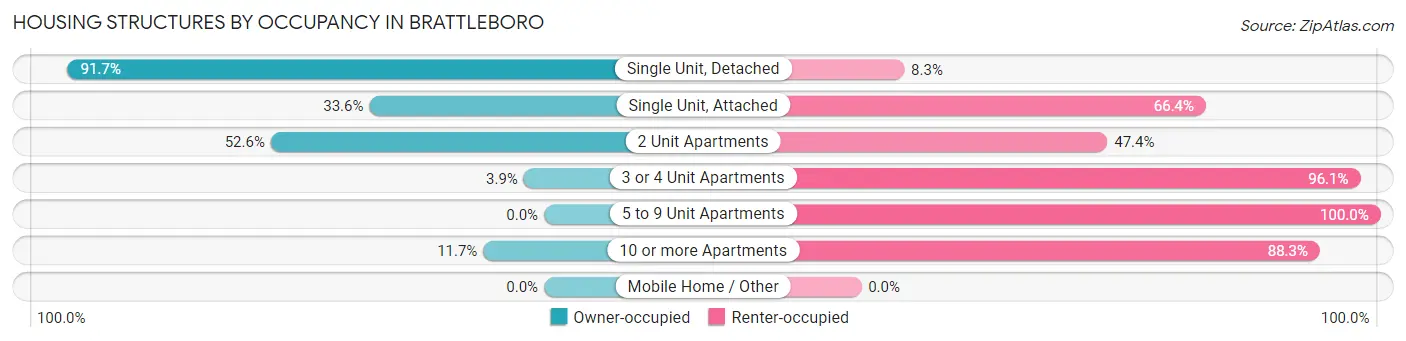
| Structure Type | Owner-occupied | Renter-occupied |
| Single Unit, Detached | 1,374 (91.7%) | 124 (8.3%) |
| Single Unit, Attached | 73 (33.6%) | 144 (66.4%) |
| 2 Unit Apartments | 131 (52.6%) | 118 (47.4%) |
| 3 or 4 Unit Apartments | 21 (3.9%) | 518 (96.1%) |
| 5 to 9 Unit Apartments | 0 (0.0%) | 458 (100.0%) |
| 10 or more Apartments | 62 (11.7%) | 468 (88.3%) |
| Mobile Home / Other | 0 (0.0%) | 0 (0.0%) |
| Total | 1,661 (47.6%) | 1,830 (52.4%) |
Housing Structures by Number of Rooms in Brattleboro
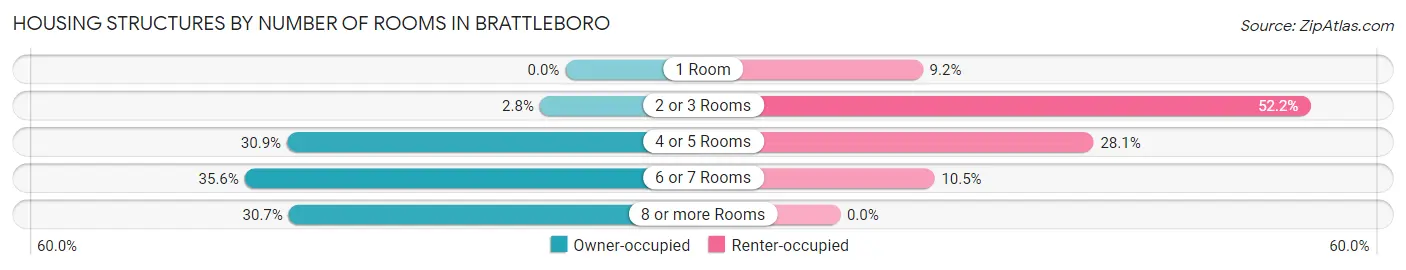
| Number of Rooms | Owner-occupied | Renter-occupied |
| 1 Room | 0 (0.0%) | 168 (9.2%) |
| 2 or 3 Rooms | 47 (2.8%) | 955 (52.2%) |
| 4 or 5 Rooms | 513 (30.9%) | 515 (28.1%) |
| 6 or 7 Rooms | 591 (35.6%) | 192 (10.5%) |
| 8 or more Rooms | 510 (30.7%) | 0 (0.0%) |
| Total | 1,661 (100.0%) | 1,830 (100.0%) |
Housing Structure by Heating Type in Brattleboro
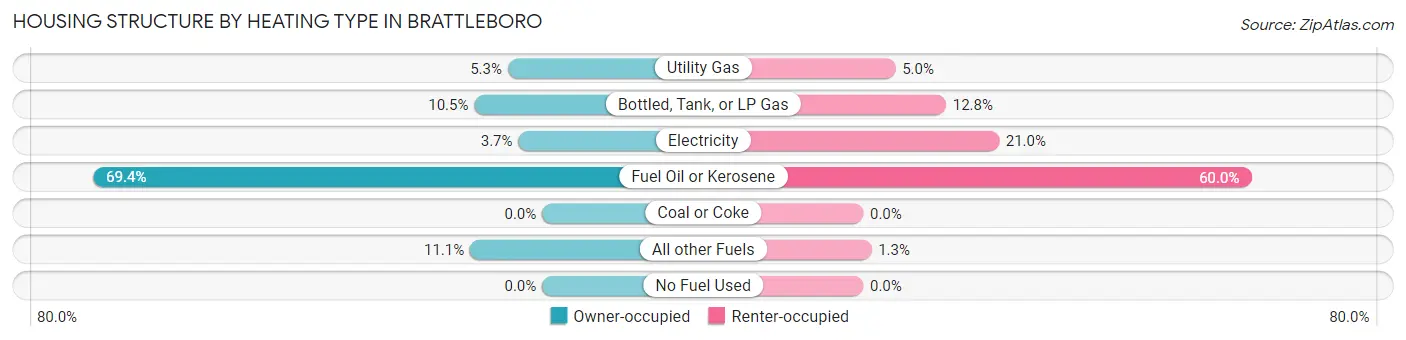
| Heating Type | Owner-occupied | Renter-occupied |
| Utility Gas | 88 (5.3%) | 91 (5.0%) |
| Bottled, Tank, or LP Gas | 174 (10.5%) | 234 (12.8%) |
| Electricity | 61 (3.7%) | 384 (21.0%) |
| Fuel Oil or Kerosene | 1,153 (69.4%) | 1,098 (60.0%) |
| Coal or Coke | 0 (0.0%) | 0 (0.0%) |
| All other Fuels | 185 (11.1%) | 23 (1.3%) |
| No Fuel Used | 0 (0.0%) | 0 (0.0%) |
| Total | 1,661 (100.0%) | 1,830 (100.0%) |
Household Vehicle Usage in Brattleboro
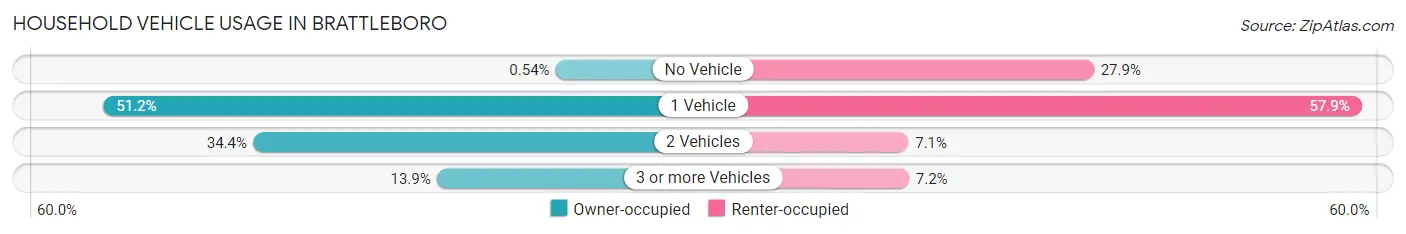
| Vehicles per Household | Owner-occupied | Renter-occupied |
| No Vehicle | 9 (0.5%) | 510 (27.9%) |
| 1 Vehicle | 850 (51.2%) | 1,059 (57.9%) |
| 2 Vehicles | 572 (34.4%) | 130 (7.1%) |
| 3 or more Vehicles | 230 (13.9%) | 131 (7.2%) |
| Total | 1,661 (100.0%) | 1,830 (100.0%) |
Real Estate & Mortgages in Brattleboro
Real Estate and Mortgage Overview in Brattleboro
| Characteristic | Without Mortgage | With Mortgage |
| Housing Units | 446 | 1,215 |
| Median Property Value | $238,000 | $213,800 |
| Median Household Income | $74,583 | $186 |
| Monthly Housing Costs | $996 | $0 |
| Real Estate Taxes | $5,821 | $48 |
Property Value by Mortgage Status in Brattleboro
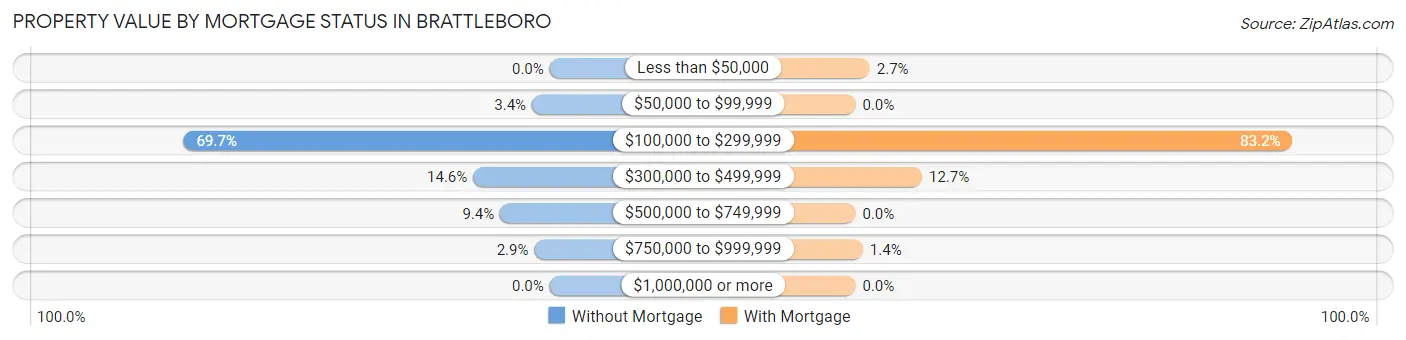
| Property Value | Without Mortgage | With Mortgage |
| Less than $50,000 | 0 (0.0%) | 33 (2.7%) |
| $50,000 to $99,999 | 15 (3.4%) | 0 (0.0%) |
| $100,000 to $299,999 | 311 (69.7%) | 1,011 (83.2%) |
| $300,000 to $499,999 | 65 (14.6%) | 154 (12.7%) |
| $500,000 to $749,999 | 42 (9.4%) | 0 (0.0%) |
| $750,000 to $999,999 | 13 (2.9%) | 17 (1.4%) |
| $1,000,000 or more | 0 (0.0%) | 0 (0.0%) |
| Total | 446 (100.0%) | 1,215 (100.0%) |
Household Income by Mortgage Status in Brattleboro
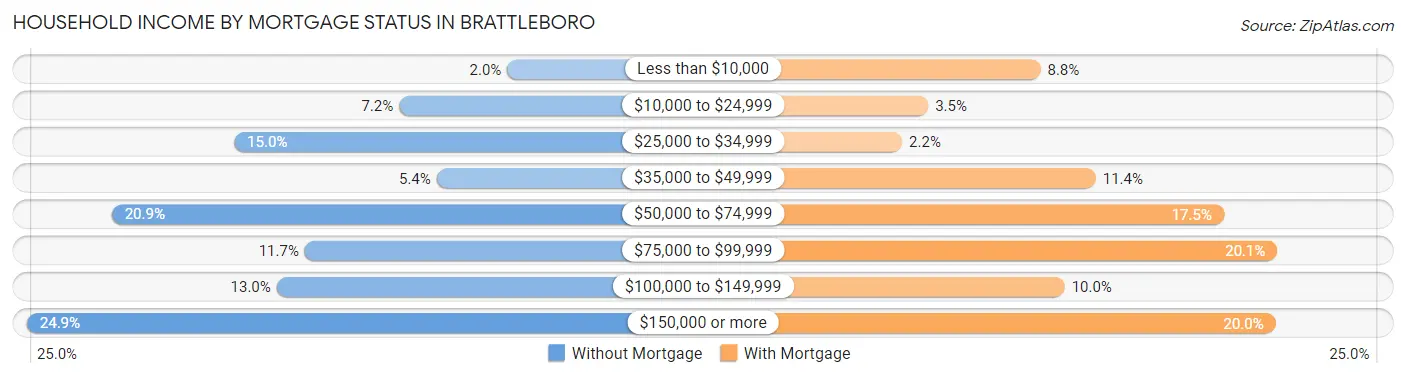
| Household Income | Without Mortgage | With Mortgage |
| Less than $10,000 | 9 (2.0%) | 107 (8.8%) |
| $10,000 to $24,999 | 32 (7.2%) | 42 (3.5%) |
| $25,000 to $34,999 | 67 (15.0%) | 27 (2.2%) |
| $35,000 to $49,999 | 24 (5.4%) | 139 (11.4%) |
| $50,000 to $74,999 | 93 (20.8%) | 213 (17.5%) |
| $75,000 to $99,999 | 52 (11.7%) | 244 (20.1%) |
| $100,000 to $149,999 | 58 (13.0%) | 121 (10.0%) |
| $150,000 or more | 111 (24.9%) | 243 (20.0%) |
| Total | 446 (100.0%) | 1,215 (100.0%) |
Property Value to Household Income Ratio in Brattleboro
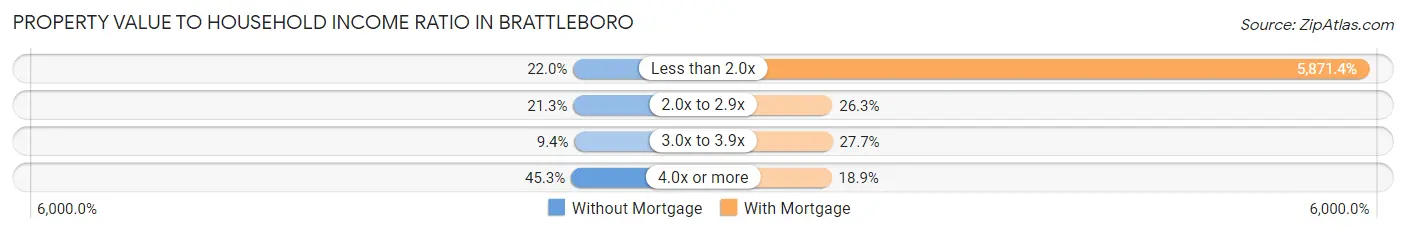
| Value-to-Income Ratio | Without Mortgage | With Mortgage |
| Less than 2.0x | 98 (22.0%) | 71,338 (5,871.4%) |
| 2.0x to 2.9x | 95 (21.3%) | 319 (26.3%) |
| 3.0x to 3.9x | 42 (9.4%) | 336 (27.7%) |
| 4.0x or more | 202 (45.3%) | 229 (18.9%) |
| Total | 446 (100.0%) | 1,215 (100.0%) |
Real Estate Taxes by Mortgage Status in Brattleboro
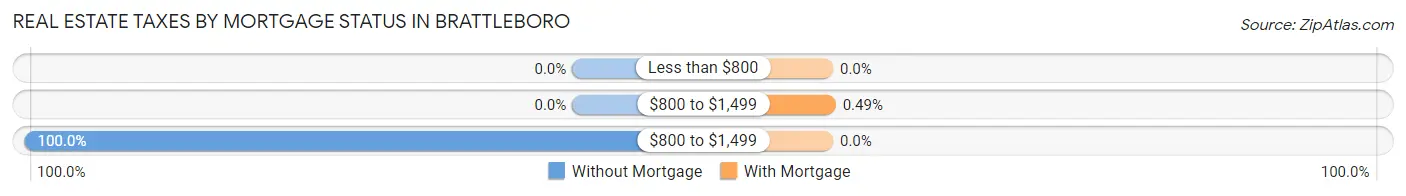
| Property Taxes | Without Mortgage | With Mortgage |
| Less than $800 | 0 (0.0%) | 0 (0.0%) |
| $800 to $1,499 | 0 (0.0%) | 6 (0.5%) |
| $800 to $1,499 | 446 (100.0%) | 0 (0.0%) |
| Total | 446 (100.0%) | 1,215 (100.0%) |
Health & Disability in Brattleboro
Health Insurance Coverage by Age in Brattleboro
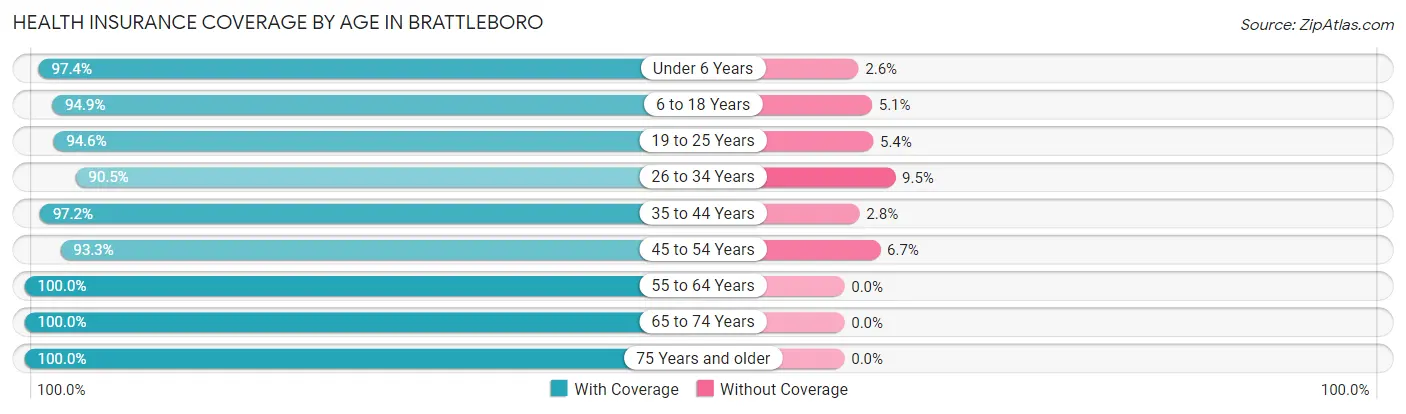
| Age Bracket | With Coverage | Without Coverage |
| Under 6 Years | 484 (97.4%) | 13 (2.6%) |
| 6 to 18 Years | 814 (94.9%) | 44 (5.1%) |
| 19 to 25 Years | 689 (94.6%) | 39 (5.4%) |
| 26 to 34 Years | 812 (90.5%) | 85 (9.5%) |
| 35 to 44 Years | 690 (97.2%) | 20 (2.8%) |
| 45 to 54 Years | 798 (93.3%) | 57 (6.7%) |
| 55 to 64 Years | 1,144 (100.0%) | 0 (0.0%) |
| 65 to 74 Years | 906 (100.0%) | 0 (0.0%) |
| 75 Years and older | 824 (100.0%) | 0 (0.0%) |
| Total | 7,161 (96.5%) | 258 (3.5%) |
Health Insurance Coverage by Citizenship Status in Brattleboro
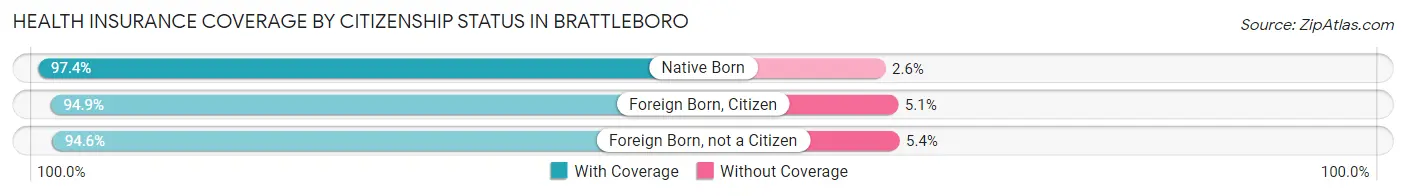
| Citizenship Status | With Coverage | Without Coverage |
| Native Born | 484 (97.4%) | 13 (2.6%) |
| Foreign Born, Citizen | 814 (94.9%) | 44 (5.1%) |
| Foreign Born, not a Citizen | 689 (94.6%) | 39 (5.4%) |
Health Insurance Coverage by Household Income in Brattleboro
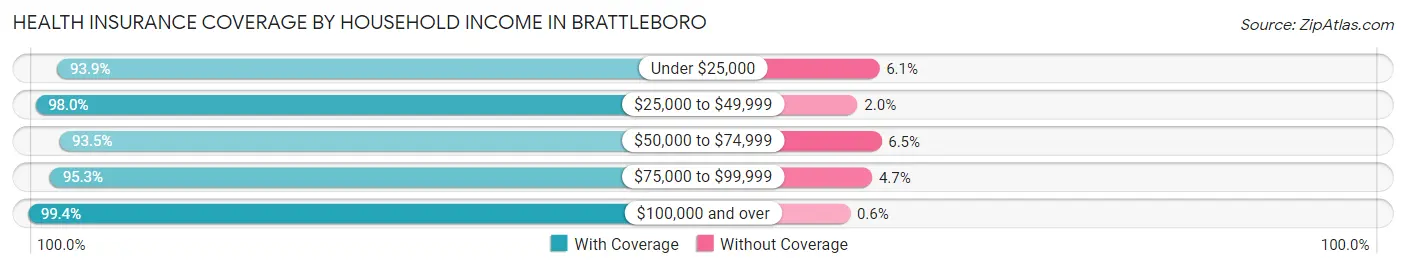
| Household Income | With Coverage | Without Coverage |
| Under $25,000 | 1,328 (93.9%) | 86 (6.1%) |
| $25,000 to $49,999 | 1,867 (98.0%) | 38 (2.0%) |
| $50,000 to $74,999 | 1,230 (93.5%) | 85 (6.5%) |
| $75,000 to $99,999 | 405 (95.3%) | 20 (4.7%) |
| $100,000 and over | 2,162 (99.4%) | 13 (0.6%) |
Public vs Private Health Insurance Coverage by Age in Brattleboro
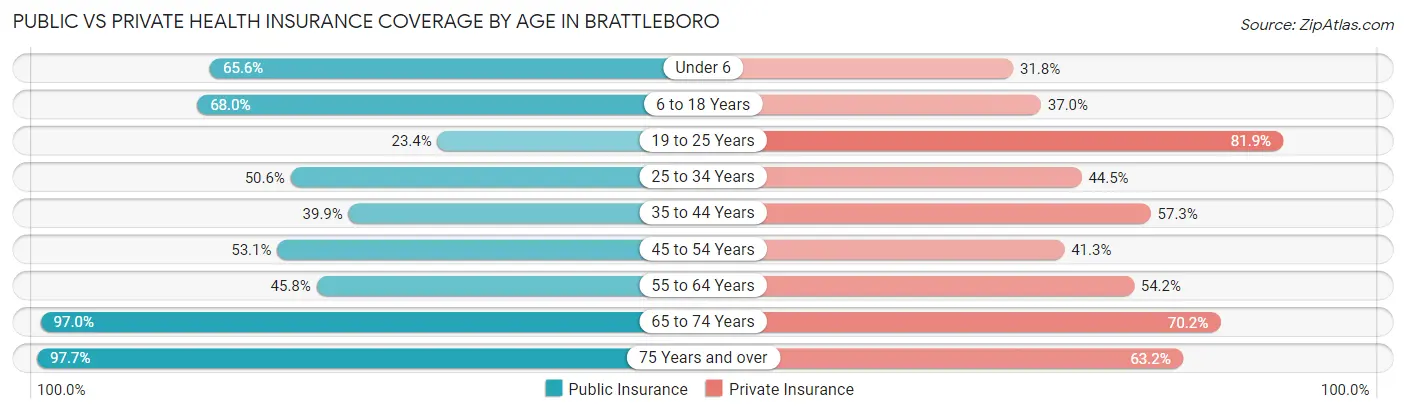
| Age Bracket | Public Insurance | Private Insurance |
| Under 6 | 326 (65.6%) | 158 (31.8%) |
| 6 to 18 Years | 583 (67.9%) | 317 (36.9%) |
| 19 to 25 Years | 170 (23.4%) | 596 (81.9%) |
| 25 to 34 Years | 454 (50.6%) | 399 (44.5%) |
| 35 to 44 Years | 283 (39.9%) | 407 (57.3%) |
| 45 to 54 Years | 454 (53.1%) | 353 (41.3%) |
| 55 to 64 Years | 524 (45.8%) | 620 (54.2%) |
| 65 to 74 Years | 879 (97.0%) | 636 (70.2%) |
| 75 Years and over | 805 (97.7%) | 521 (63.2%) |
| Total | 4,478 (60.4%) | 4,007 (54.0%) |
Disability Status by Sex by Age in Brattleboro
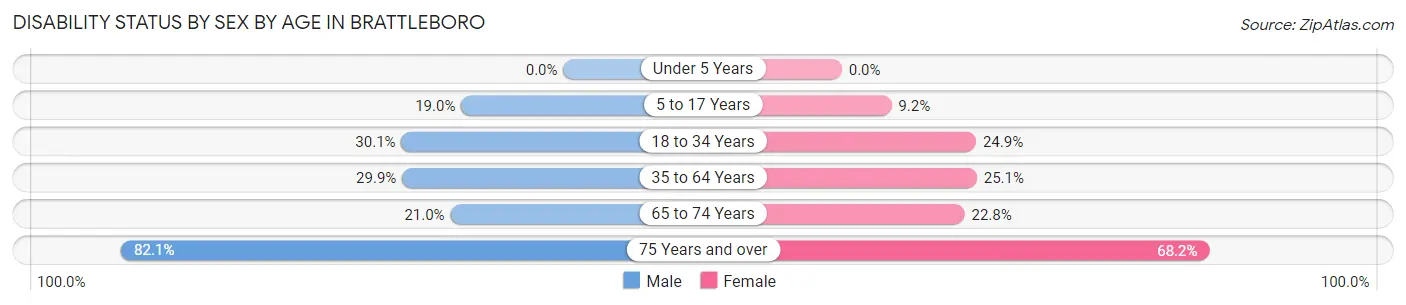
| Age Bracket | Male | Female |
| Under 5 Years | 0 (0.0%) | 0 (0.0%) |
| 5 to 17 Years | 126 (19.0%) | 28 (9.2%) |
| 18 to 34 Years | 260 (30.1%) | 198 (24.9%) |
| 35 to 64 Years | 333 (29.9%) | 400 (25.1%) |
| 65 to 74 Years | 74 (21.0%) | 126 (22.8%) |
| 75 Years and over | 266 (82.1%) | 341 (68.2%) |
Disability Class by Sex by Age in Brattleboro
Disability Class: Hearing Difficulty
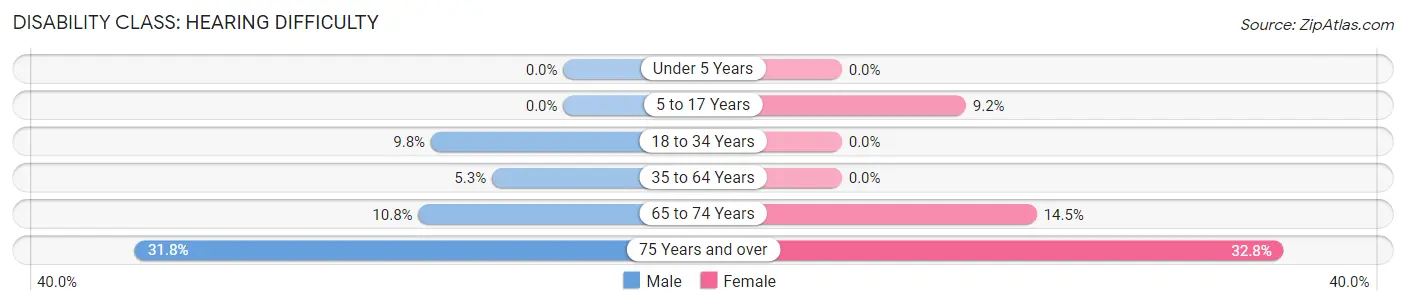
| Age Bracket | Male | Female |
| Under 5 Years | 0 (0.0%) | 0 (0.0%) |
| 5 to 17 Years | 0 (0.0%) | 28 (9.2%) |
| 18 to 34 Years | 85 (9.8%) | 0 (0.0%) |
| 35 to 64 Years | 59 (5.3%) | 0 (0.0%) |
| 65 to 74 Years | 38 (10.8%) | 80 (14.5%) |
| 75 Years and over | 103 (31.8%) | 164 (32.8%) |
Disability Class: Vision Difficulty
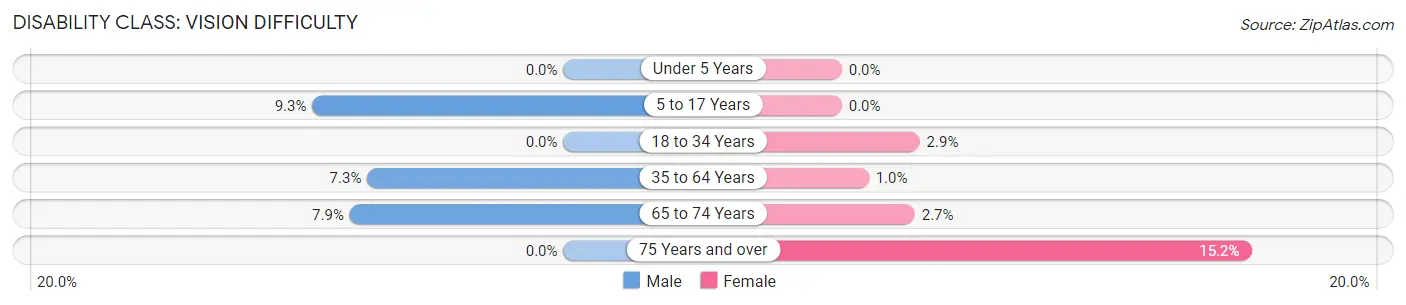
| Age Bracket | Male | Female |
| Under 5 Years | 0 (0.0%) | 0 (0.0%) |
| 5 to 17 Years | 62 (9.3%) | 0 (0.0%) |
| 18 to 34 Years | 0 (0.0%) | 23 (2.9%) |
| 35 to 64 Years | 81 (7.3%) | 16 (1.0%) |
| 65 to 74 Years | 28 (7.9%) | 15 (2.7%) |
| 75 Years and over | 0 (0.0%) | 76 (15.2%) |
Disability Class: Cognitive Difficulty
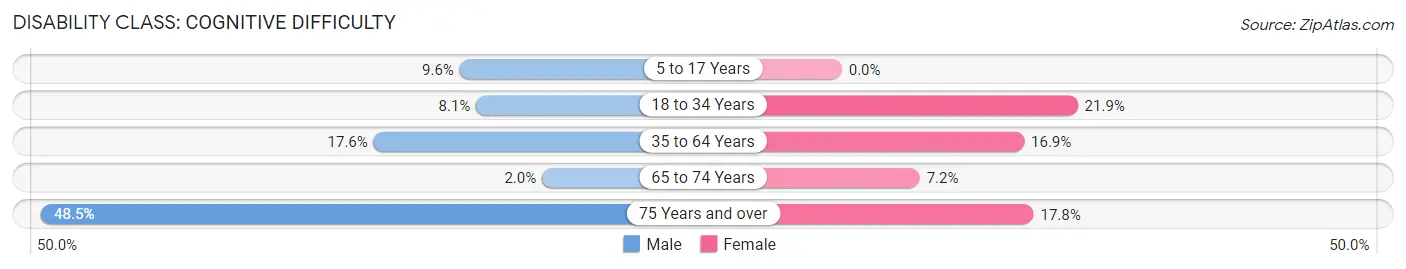
| Age Bracket | Male | Female |
| 5 to 17 Years | 64 (9.6%) | 0 (0.0%) |
| 18 to 34 Years | 70 (8.1%) | 174 (21.9%) |
| 35 to 64 Years | 196 (17.6%) | 270 (16.9%) |
| 65 to 74 Years | 7 (2.0%) | 40 (7.2%) |
| 75 Years and over | 157 (48.5%) | 89 (17.8%) |
Disability Class: Ambulatory Difficulty
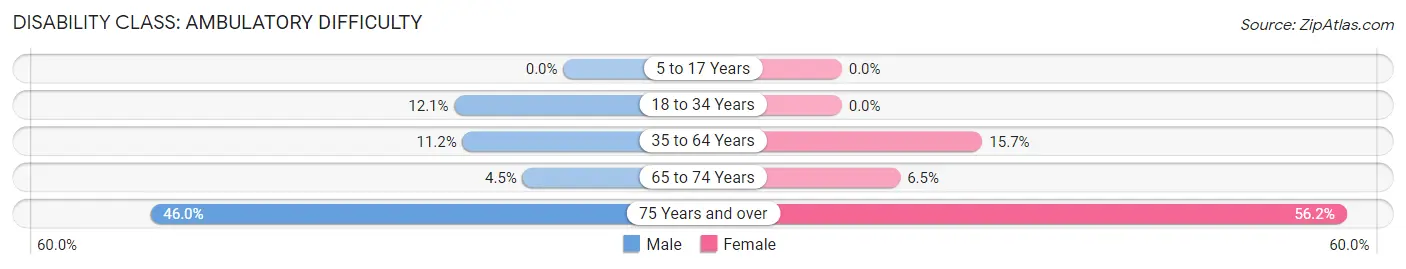
| Age Bracket | Male | Female |
| 5 to 17 Years | 0 (0.0%) | 0 (0.0%) |
| 18 to 34 Years | 105 (12.1%) | 0 (0.0%) |
| 35 to 64 Years | 125 (11.2%) | 250 (15.7%) |
| 65 to 74 Years | 16 (4.5%) | 36 (6.5%) |
| 75 Years and over | 149 (46.0%) | 281 (56.2%) |
Disability Class: Self-Care Difficulty
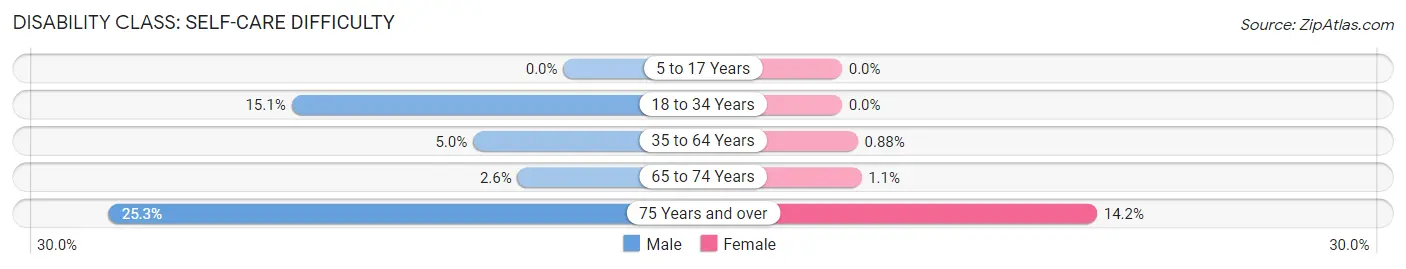
| Age Bracket | Male | Female |
| 5 to 17 Years | 0 (0.0%) | 0 (0.0%) |
| 18 to 34 Years | 131 (15.1%) | 0 (0.0%) |
| 35 to 64 Years | 56 (5.0%) | 14 (0.9%) |
| 65 to 74 Years | 9 (2.5%) | 6 (1.1%) |
| 75 Years and over | 82 (25.3%) | 71 (14.2%) |
Technology Access in Brattleboro
Computing Device Access in Brattleboro
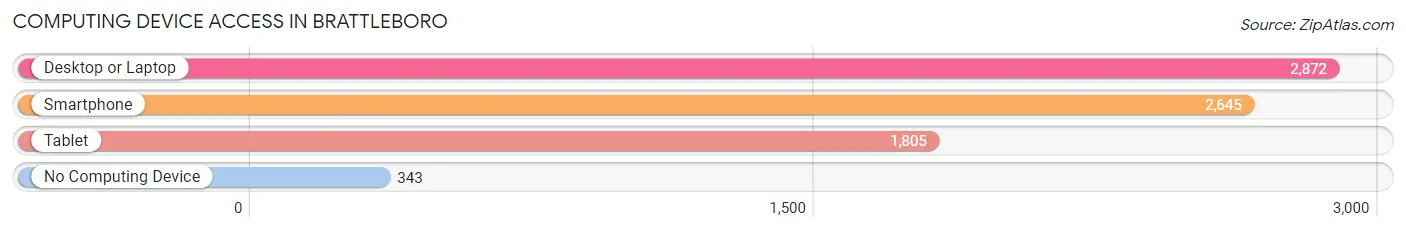
| Device Type | # Households | % Households |
| Desktop or Laptop | 2,872 | 82.3% |
| Smartphone | 2,645 | 75.8% |
| Tablet | 1,805 | 51.7% |
| No Computing Device | 343 | 9.8% |
| Total | 3,491 | 100.0% |
Internet Access in Brattleboro
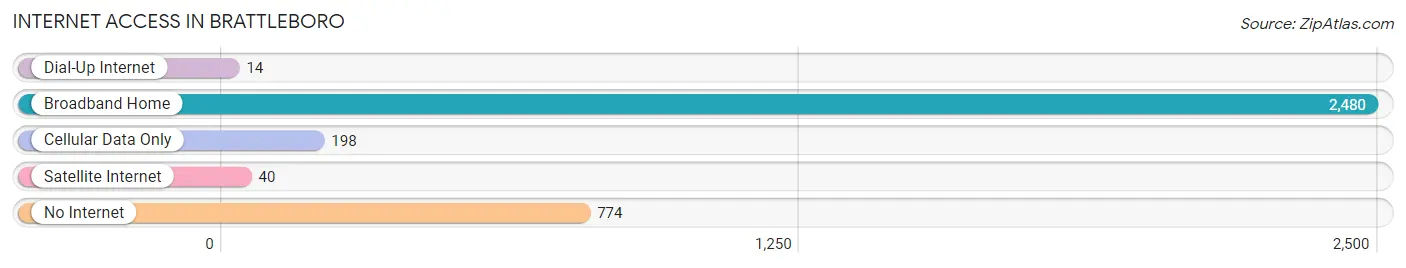
| Internet Type | # Households | % Households |
| Dial-Up Internet | 14 | 0.4% |
| Broadband Home | 2,480 | 71.0% |
| Cellular Data Only | 198 | 5.7% |
| Satellite Internet | 40 | 1.1% |
| No Internet | 774 | 22.2% |
| Total | 3,491 | 100.0% |
Brattleboro Summary
Brattleboro, Vermont is a small town located in the southeastern corner of the state, near the Connecticut River. It is the largest town in Windham County and the most populous municipality in the state. The town has a population of 12,046 as of the 2020 census, and is the commercial and cultural hub of the region.
History
Brattleboro was first settled in 1753 by settlers from Massachusetts and Connecticut. The town was named after Colonel William Brattle, a prominent Boston merchant and politician. The town was incorporated in 1781 and quickly became an important trading center for the region. In the 19th century, the town was a major stop on the stagecoach route between Boston and Montreal.
The town was also an important center for the textile industry, with several mills operating in the area. The town was also home to several factories that produced paper, furniture, and other goods. The town was also home to several publishing houses, including the Brattleboro Publishing Company, which published books and magazines.
Geography
Brattleboro is located in the southeastern corner of Vermont, near the Connecticut River. The town is bordered by the towns of Dummerston, Guilford, Putney, and Vernon. The town is located in the Connecticut River Valley, and is surrounded by hills and mountains. The town is located in a temperate climate, with warm summers and cold winters.
Economy
Brattleboro is a major economic center for the region. The town is home to several large employers, including the Brattleboro Memorial Hospital, the Brattleboro Retreat, and the Vermont Yankee Nuclear Power Plant. The town is also home to several small businesses, including restaurants, retail stores, and art galleries. The town is also home to several educational institutions, including the Community College of Vermont and the Vermont Technical College.
Demographics
As of the 2020 census, Brattleboro had a population of 12,046. The racial makeup of the town was 94.3% White, 1.3% African American, 0.7% Native American, 1.2% Asian, 0.2% Pacific Islander, 0.7% from other races, and 1.7% from two or more races. Hispanic or Latino of any race were 2.3% of the population.
The median income for a household in the town was $50,945, and the median income for a family was $62,917. The per capita income for the town was $27,845. About 8.3% of families and 11.2% of the population were below the poverty line, including 15.2% of those under age 18 and 6.2% of those age 65 or over.
Brattleboro is a small town with a rich history and a vibrant economy. The town is home to several large employers, educational institutions, and small businesses. The town has a diverse population, with a mix of races and ethnicities. The town is a great place to live, work, and visit, and is a great example of the beauty and culture of Vermont.
Common Questions
What is Per Capita Income in Brattleboro?
Per Capita income in Brattleboro is $36,873.
What is the Median Family Income in Brattleboro?
Median Family Income in Brattleboro is $70,675.
What is the Median Household income in Brattleboro?
Median Household Income in Brattleboro is $42,776.
What is Income or Wage Gap in Brattleboro?
Income or Wage Gap in Brattleboro is 14.2%.
Women in Brattleboro earn 85.8 cents for every dollar earned by a man.
What is Inequality or Gini Index in Brattleboro?
Inequality or Gini Index in Brattleboro is 0.54.
What is the Total Population of Brattleboro?
Total Population of Brattleboro is 7,543.
What is the Total Male Population of Brattleboro?
Total Male Population of Brattleboro is 3,520.
What is the Total Female Population of Brattleboro?
Total Female Population of Brattleboro is 4,023.
What is the Ratio of Males per 100 Females in Brattleboro?
There are 87.50 Males per 100 Females in Brattleboro.
What is the Ratio of Females per 100 Males in Brattleboro?
There are 114.29 Females per 100 Males in Brattleboro.
What is the Median Population Age in Brattleboro?
Median Population Age in Brattleboro is 45.4 Years.
What is the Average Family Size in Brattleboro
Average Family Size in Brattleboro is 2.8 People.
What is the Average Household Size in Brattleboro
Average Household Size in Brattleboro is 2.1 People.
How Large is the Labor Force in Brattleboro?
There are 3,546 People in the Labor Forcein in Brattleboro.
What is the Percentage of People in the Labor Force in Brattleboro?
55.0% of People are in the Labor Force in Brattleboro.
What is the Unemployment Rate in Brattleboro?
Unemployment Rate in Brattleboro is 9.2%.