Wells, VT Map & Demographics
Wells Map
Wells Overview
$37,091
PER CAPITA INCOME
$86,979
AVG FAMILY INCOME
$80,875
AVG HOUSEHOLD INCOME
27.2%
WAGE / INCOME GAP [ % ]
72.8¢/ $1
WAGE / INCOME GAP [ $ ]
0.46
INEQUALITY / GINI INDEX
369
TOTAL POPULATION
164
MALE POPULATION
205
FEMALE POPULATION
80.00
MALES / 100 FEMALES
125.00
FEMALES / 100 MALES
30.2
MEDIAN AGE
3.0
AVG FAMILY SIZE
2.5
AVG HOUSEHOLD SIZE
224
LABOR FORCE [ PEOPLE ]
67.3%
PERCENT IN LABOR FORCE
Wells Zip Codes
Wells Area Codes
Income in Wells
Income Overview in Wells
Per Capita Income in Wells is $37,091, while median incomes of families and households are $86,979 and $80,875 respectively.
| Characteristic | Number | Measure |
| Per Capita Income | 369 | $37,091 |
| Median Family Income | 93 | $86,979 |
| Mean Family Income | 93 | $99,209 |
| Median Household Income | 145 | $80,875 |
| Mean Household Income | 145 | $83,216 |
| Income Deficit | 93 | $0 |
| Wage / Income Gap (%) | 369 | 27.21% |
| Wage / Income Gap ($) | 369 | 72.79¢ per $1 |
| Gini / Inequality Index | 369 | 0.46 |
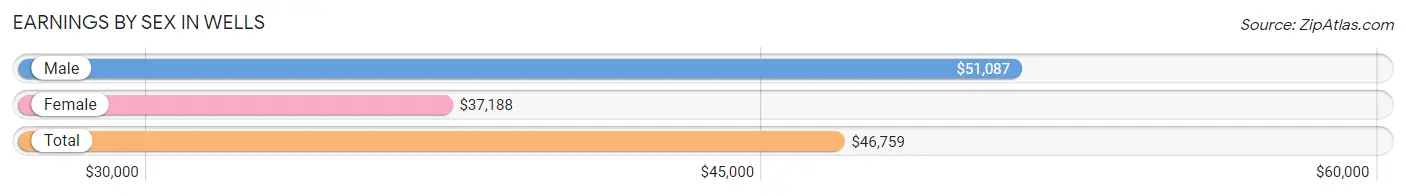
Earnings by Sex in Wells
Average Earnings in Wells are $46,759, $51,087 for men and $37,188 for women, a difference of 27.2%.
| Sex | Number | Average Earnings |
| Male | 98 (43.8%) | $51,087 |
| Female | 126 (56.2%) | $37,188 |
| Total | 224 (100.0%) | $46,759 |
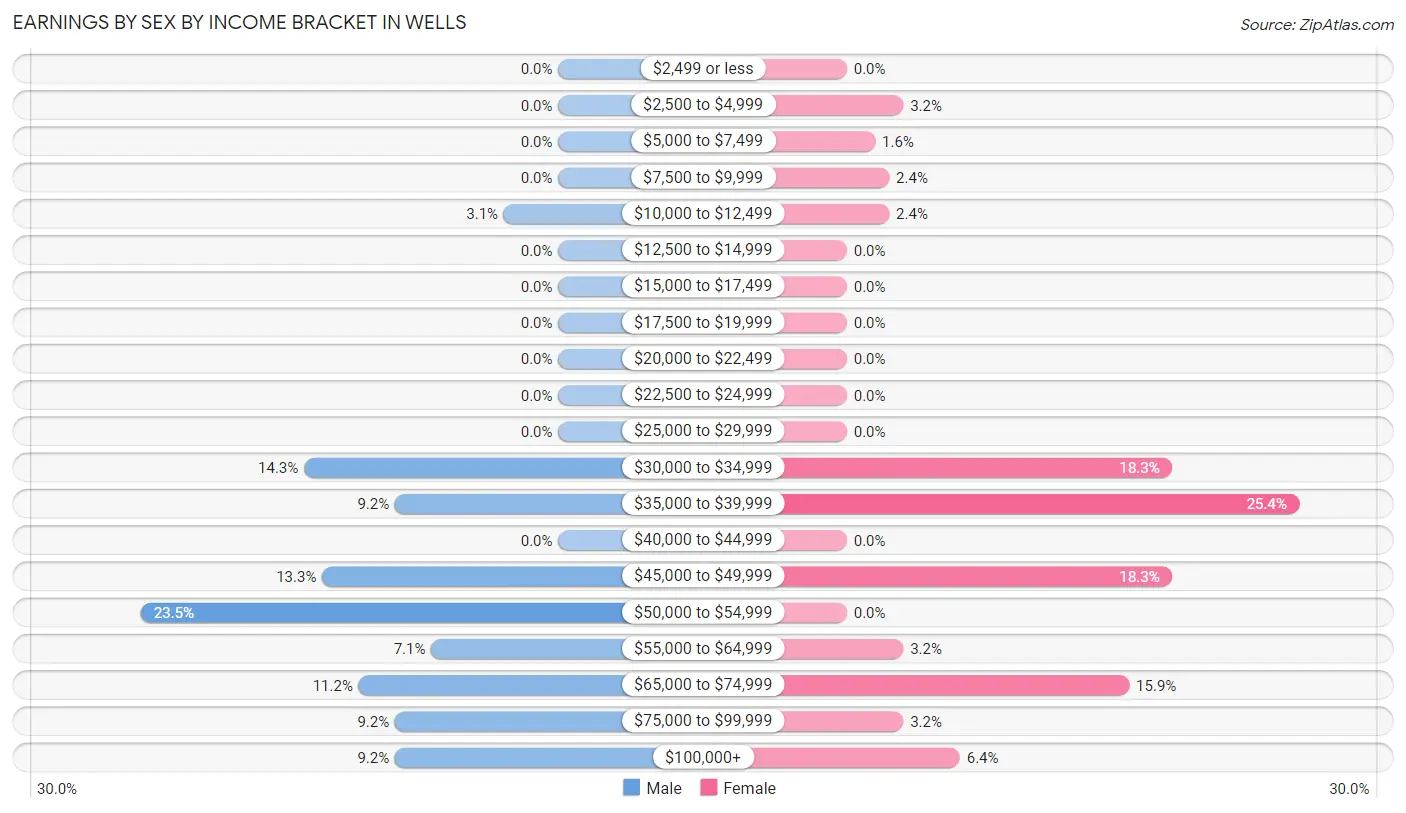
Earnings by Sex by Income Bracket in Wells
The most common earnings brackets in Wells are $50,000 to $54,999 for men (23 | 23.5%) and $35,000 to $39,999 for women (32 | 25.4%).
| Income | Male | Female |
| $2,499 or less | 0 (0.0%) | 0 (0.0%) |
| $2,500 to $4,999 | 0 (0.0%) | 4 (3.2%) |
| $5,000 to $7,499 | 0 (0.0%) | 2 (1.6%) |
| $7,500 to $9,999 | 0 (0.0%) | 3 (2.4%) |
| $10,000 to $12,499 | 3 (3.1%) | 3 (2.4%) |
| $12,500 to $14,999 | 0 (0.0%) | 0 (0.0%) |
| $15,000 to $17,499 | 0 (0.0%) | 0 (0.0%) |
| $17,500 to $19,999 | 0 (0.0%) | 0 (0.0%) |
| $20,000 to $22,499 | 0 (0.0%) | 0 (0.0%) |
| $22,500 to $24,999 | 0 (0.0%) | 0 (0.0%) |
| $25,000 to $29,999 | 0 (0.0%) | 0 (0.0%) |
| $30,000 to $34,999 | 14 (14.3%) | 23 (18.2%) |
| $35,000 to $39,999 | 9 (9.2%) | 32 (25.4%) |
| $40,000 to $44,999 | 0 (0.0%) | 0 (0.0%) |
| $45,000 to $49,999 | 13 (13.3%) | 23 (18.2%) |
| $50,000 to $54,999 | 23 (23.5%) | 0 (0.0%) |
| $55,000 to $64,999 | 7 (7.1%) | 4 (3.2%) |
| $65,000 to $74,999 | 11 (11.2%) | 20 (15.9%) |
| $75,000 to $99,999 | 9 (9.2%) | 4 (3.2%) |
| $100,000+ | 9 (9.2%) | 8 (6.4%) |
| Total | 98 (100.0%) | 126 (100.0%) |
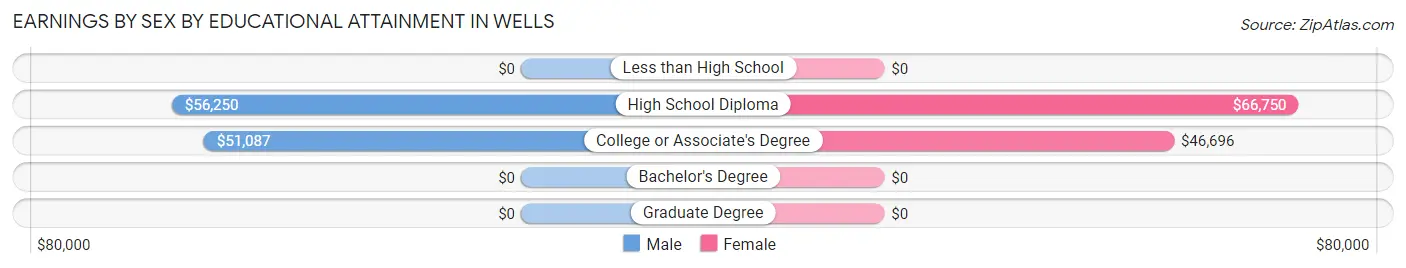
Earnings by Sex by Educational Attainment in Wells
Average earnings in Wells are $51,957 for men and $47,639 for women, a difference of 8.3%. Men with an educational attainment of high school diploma enjoy the highest average annual earnings of $56,250, while those with college or associate's degree education earn the least with $51,087. Women with an educational attainment of high school diploma earn the most with the average annual earnings of $66,750, while those with college or associate's degree education have the smallest earnings of $46,696.
| Educational Attainment | Male Income | Female Income |
| Less than High School | - | - |
| High School Diploma | $56,250 | $66,750 |
| College or Associate's Degree | $51,087 | $46,696 |
| Bachelor's Degree | - | - |
| Graduate Degree | - | - |
| Total | $51,957 | $47,639 |
Family Income in Wells
Family Income Brackets in Wells
According to the Wells family income data, there are 34 families falling into the $75,000 to $99,999 income range, which is the most common income bracket and makes up 36.6% of all families.
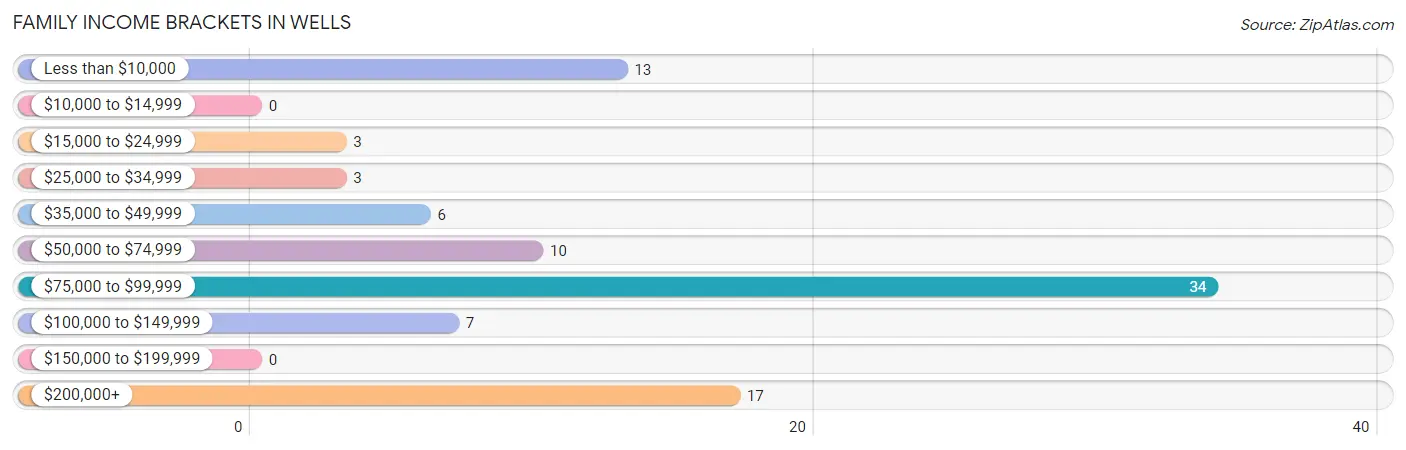
| Income Bracket | # Families | % Families |
| Less than $10,000 | 13 | 14.0% |
| $10,000 to $14,999 | 0 | 0.0% |
| $15,000 to $24,999 | 3 | 3.2% |
| $25,000 to $34,999 | 3 | 3.2% |
| $35,000 to $49,999 | 6 | 6.5% |
| $50,000 to $74,999 | 10 | 10.8% |
| $75,000 to $99,999 | 34 | 36.6% |
| $100,000 to $149,999 | 7 | 7.5% |
| $150,000 to $199,999 | 0 | 0.0% |
| $200,000+ | 17 | 18.3% |
Family Income by Famaliy Size in Wells
2-person families (58 | 62.4%) account for the highest median family income in Wells with $58,750 per family, while 2-person families (58 | 62.4%) have the highest median income of $29,375 per family member.
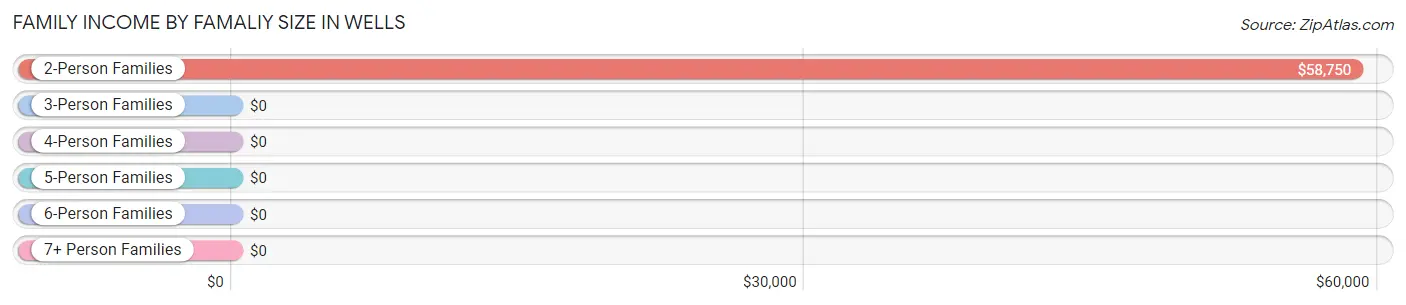
| Income Bracket | # Families | Median Income |
| 2-Person Families | 58 (62.4%) | $58,750 |
| 3-Person Families | 17 (18.3%) | $0 |
| 4-Person Families | 18 (19.4%) | $0 |
| 5-Person Families | 0 (0.0%) | $0 |
| 6-Person Families | 0 (0.0%) | $0 |
| 7+ Person Families | 0 (0.0%) | $0 |
| Total | 93 (100.0%) | $86,979 |
Family Income by Number of Earners in Wells
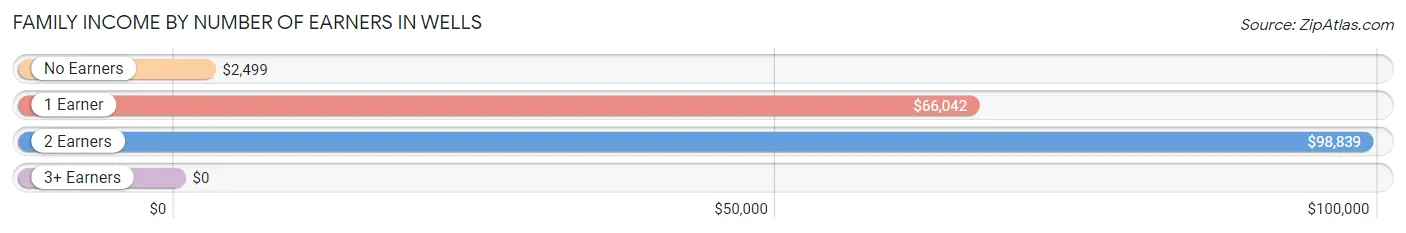
| Number of Earners | # Families | Median Income |
| No Earners | 25 (26.9%) | $2,499 |
| 1 Earner | 13 (14.0%) | $66,042 |
| 2 Earners | 43 (46.2%) | $98,839 |
| 3+ Earners | 12 (12.9%) | $0 |
| Total | 93 (100.0%) | $86,979 |
Household Income in Wells
Household Income Brackets in Wells
With 50 households falling in the category, the $75,000 to $99,999 income range is the most frequent in Wells, accounting for 34.5% of all households. In contrast, only 4 households (2.8%) fall into the $10,000 to $14,999 income bracket, making it the least populous group.
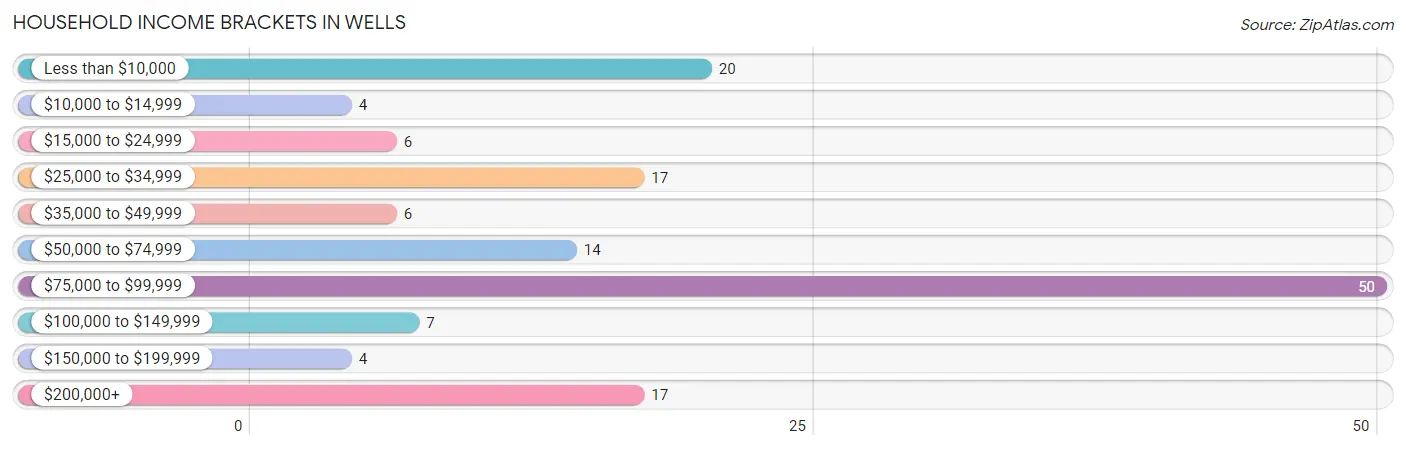
| Income Bracket | # Households | % Households |
| Less than $10,000 | 20 | 13.8% |
| $10,000 to $14,999 | 4 | 2.8% |
| $15,000 to $24,999 | 6 | 4.1% |
| $25,000 to $34,999 | 17 | 11.7% |
| $35,000 to $49,999 | 6 | 4.1% |
| $50,000 to $74,999 | 14 | 9.7% |
| $75,000 to $99,999 | 50 | 34.5% |
| $100,000 to $149,999 | 7 | 4.8% |
| $150,000 to $199,999 | 4 | 2.8% |
| $200,000+ | 17 | 11.7% |
Household Income by Householder Age in Wells
The median household income in Wells is $80,875, with the highest median household income of $93,750 found in the 25 to 44 years age bracket for the primary householder. A total of 50 households (34.5%) fall into this category. Meanwhile, the 15 to 24 years age bracket for the primary householder has the lowest median household income of $0, with 10 households (6.9%) in this group.
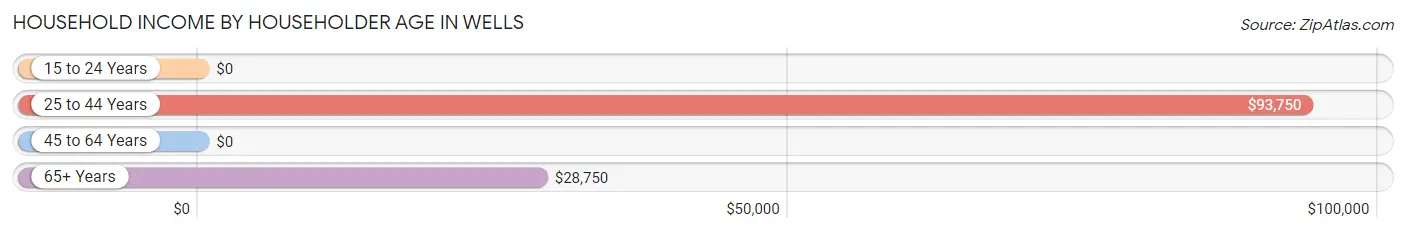
| Income Bracket | # Households | Median Income |
| 15 to 24 Years | 10 (6.9%) | $0 |
| 25 to 44 Years | 50 (34.5%) | $93,750 |
| 45 to 64 Years | 37 (25.5%) | $0 |
| 65+ Years | 48 (33.1%) | $28,750 |
| Total | 145 (100.0%) | $80,875 |
Poverty in Wells
Income Below Poverty by Sex and Age in Wells
With 10.4% poverty level for males and 21.5% for females among the residents of Wells, 55 to 64 year old males and under 5 year old females are the most vulnerable to poverty, with 4 males (33.3%) and 12 females (66.7%) in their respective age groups living below the poverty level.
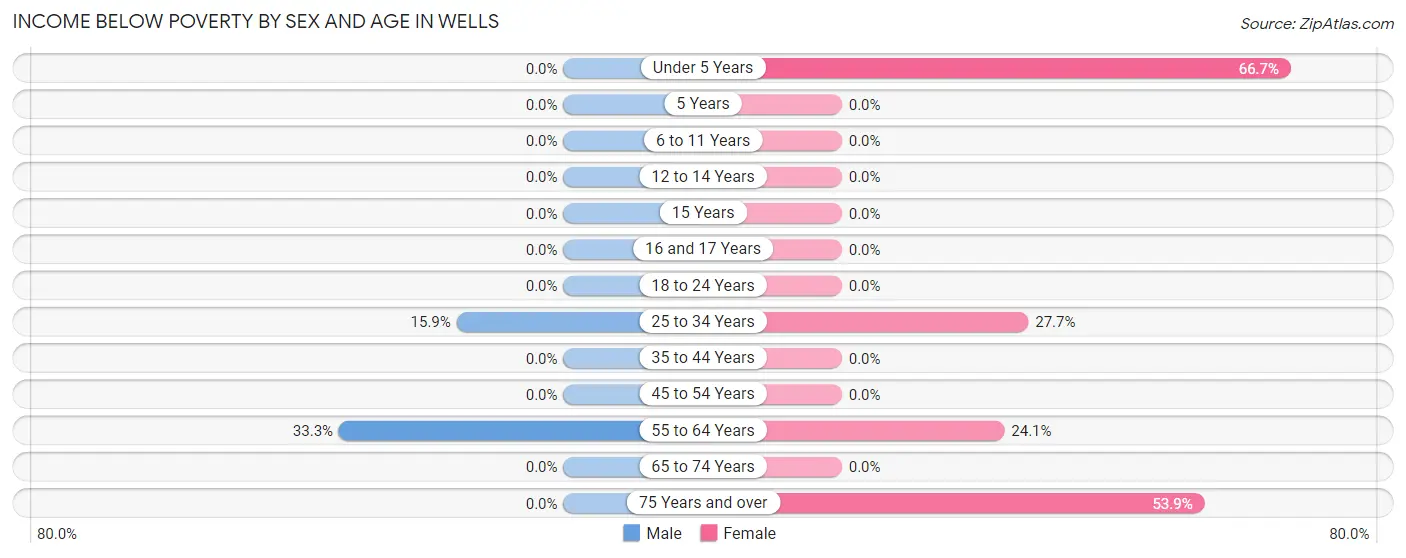
| Age Bracket | Male | Female |
| Under 5 Years | 0 (0.0%) | 12 (66.7%) |
| 5 Years | 0 (0.0%) | 0 (0.0%) |
| 6 to 11 Years | 0 (0.0%) | 0 (0.0%) |
| 12 to 14 Years | 0 (0.0%) | 0 (0.0%) |
| 15 Years | 0 (0.0%) | 0 (0.0%) |
| 16 and 17 Years | 0 (0.0%) | 0 (0.0%) |
| 18 to 24 Years | 0 (0.0%) | 0 (0.0%) |
| 25 to 34 Years | 13 (15.9%) | 18 (27.7%) |
| 35 to 44 Years | 0 (0.0%) | 0 (0.0%) |
| 45 to 54 Years | 0 (0.0%) | 0 (0.0%) |
| 55 to 64 Years | 4 (33.3%) | 7 (24.1%) |
| 65 to 74 Years | 0 (0.0%) | 0 (0.0%) |
| 75 Years and over | 0 (0.0%) | 7 (53.8%) |
| Total | 17 (10.4%) | 44 (21.5%) |
Income Above Poverty by Sex and Age in Wells
According to the poverty statistics in Wells, males aged under 5 years and females aged 18 to 24 years are the age groups that are most secure financially, with 100.0% of males and 100.0% of females in these age groups living above the poverty line.
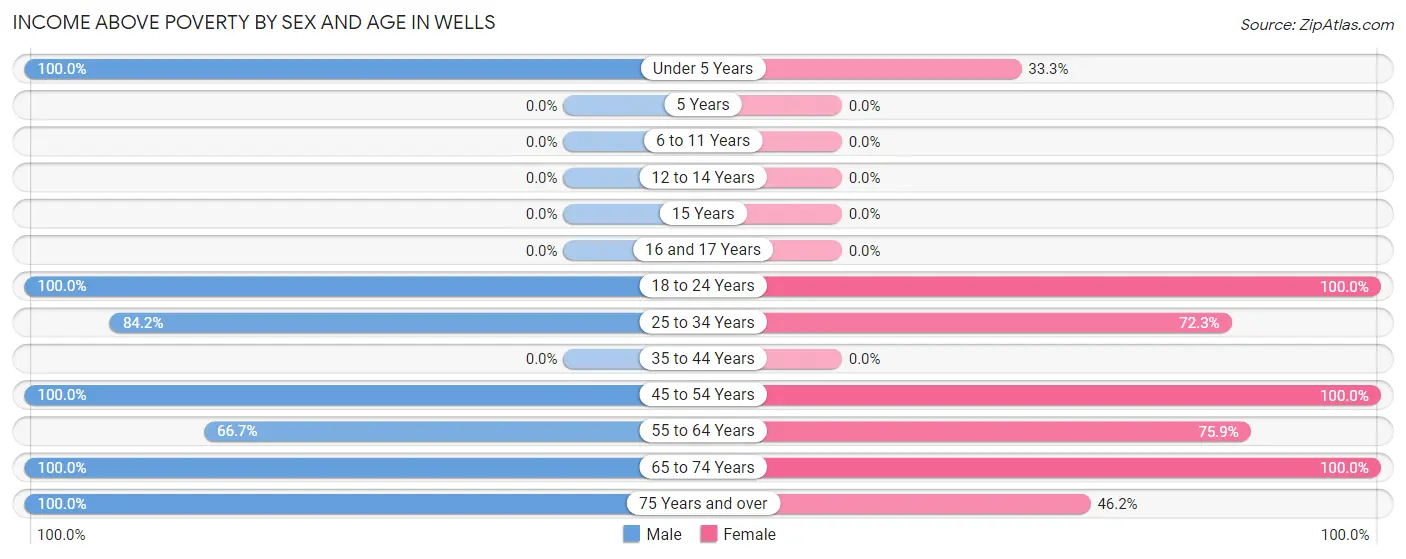
| Age Bracket | Male | Female |
| Under 5 Years | 18 (100.0%) | 6 (33.3%) |
| 5 Years | 0 (0.0%) | 0 (0.0%) |
| 6 to 11 Years | 0 (0.0%) | 0 (0.0%) |
| 12 to 14 Years | 0 (0.0%) | 0 (0.0%) |
| 15 Years | 0 (0.0%) | 0 (0.0%) |
| 16 and 17 Years | 0 (0.0%) | 0 (0.0%) |
| 18 to 24 Years | 16 (100.0%) | 37 (100.0%) |
| 25 to 34 Years | 69 (84.2%) | 47 (72.3%) |
| 35 to 44 Years | 0 (0.0%) | 0 (0.0%) |
| 45 to 54 Years | 15 (100.0%) | 14 (100.0%) |
| 55 to 64 Years | 8 (66.7%) | 22 (75.9%) |
| 65 to 74 Years | 15 (100.0%) | 29 (100.0%) |
| 75 Years and over | 6 (100.0%) | 6 (46.2%) |
| Total | 147 (89.6%) | 161 (78.5%) |
Income Below Poverty Among Married-Couple Families in Wells
The poverty statistics for married-couple families in Wells show that 4.6% or 3 of the total 65 families live below the poverty line. Families with no children have the highest poverty rate of 5.9%, comprising of 3 families. On the other hand, families with 1 or 2 children have the lowest poverty rate of 0.0%, which includes 0 families.
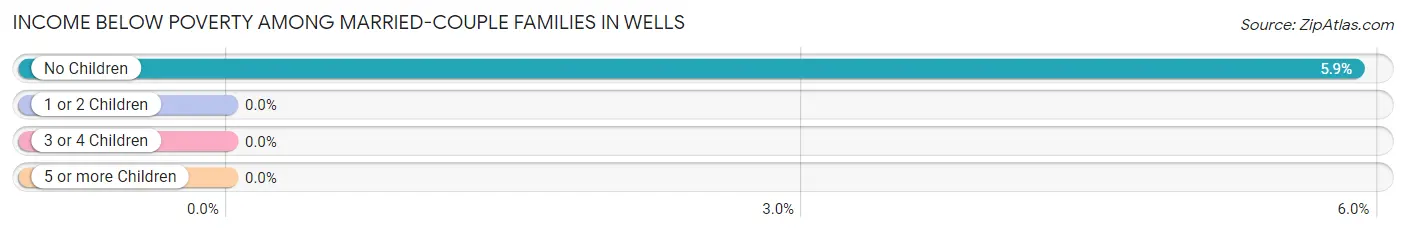
| Children | Above Poverty | Below Poverty |
| No Children | 48 (94.1%) | 3 (5.9%) |
| 1 or 2 Children | 14 (100.0%) | 0 (0.0%) |
| 3 or 4 Children | 0 (0.0%) | 0 (0.0%) |
| 5 or more Children | 0 (0.0%) | 0 (0.0%) |
| Total | 62 (95.4%) | 3 (4.6%) |
Income Below Poverty Among Single-Parent Households in Wells
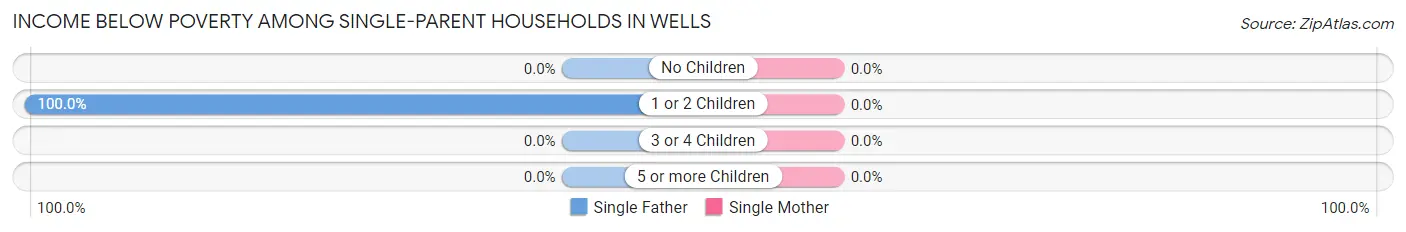
| Children | Single Father | Single Mother |
| No Children | 0 (0.0%) | 0 (0.0%) |
| 1 or 2 Children | 13 (100.0%) | 0 (0.0%) |
| 3 or 4 Children | 0 (0.0%) | 0 (0.0%) |
| 5 or more Children | 0 (0.0%) | 0 (0.0%) |
| Total | 13 (100.0%) | 0 (0.0%) |
Income Below Poverty Among Married-Couple vs Single-Parent Households in Wells
The poverty data for Wells shows that 3 of the married-couple family households (4.6%) and 13 of the single-parent households (46.4%) are living below the poverty level. Within the married-couple family households, those with no children have the highest poverty rate, with 3 households (5.9%) falling below the poverty line. Among the single-parent households, those with 1 or 2 children have the highest poverty rate, with 13 household (46.4%) living below poverty.
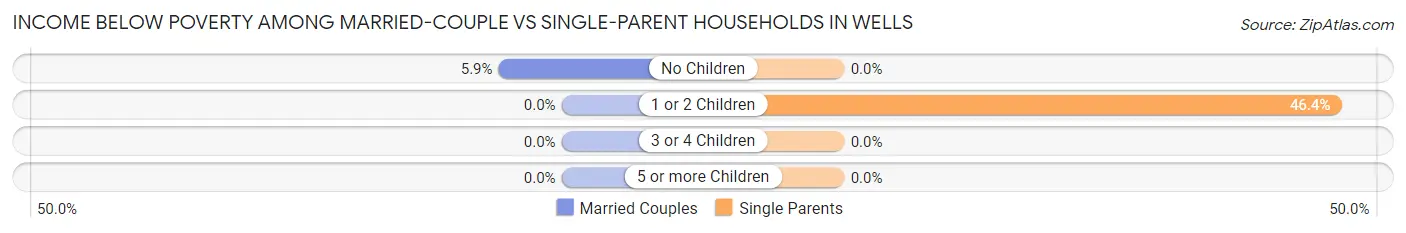
| Children | Married-Couple Families | Single-Parent Households |
| No Children | 3 (5.9%) | 0 (0.0%) |
| 1 or 2 Children | 0 (0.0%) | 13 (46.4%) |
| 3 or 4 Children | 0 (0.0%) | 0 (0.0%) |
| 5 or more Children | 0 (0.0%) | 0 (0.0%) |
| Total | 3 (4.6%) | 13 (46.4%) |
Race in Wells
The most populous races in Wells are White / Caucasian (314 | 85.1%), and Two or more Races (55 | 14.9%).
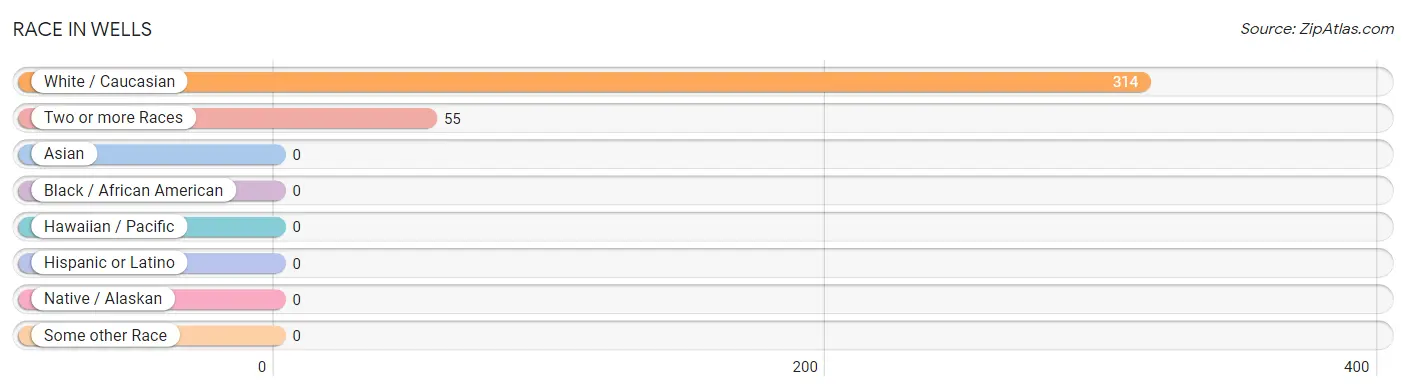
| Race | # Population | % Population |
| Asian | 0 | 0.0% |
| Black / African American | 0 | 0.0% |
| Hawaiian / Pacific | 0 | 0.0% |
| Hispanic or Latino | 0 | 0.0% |
| Native / Alaskan | 0 | 0.0% |
| White / Caucasian | 314 | 85.1% |
| Two or more Races | 55 | 14.9% |
| Some other Race | 0 | 0.0% |
| Total | 369 | 100.0% |
Ancestry in Wells
The most populous ancestries reported in Wells are French (74 | 20.1%), American (52 | 14.1%), English (51 | 13.8%), Welsh (46 | 12.5%), and French Canadian (44 | 11.9%), together accounting for 72.4% of all Wells residents.
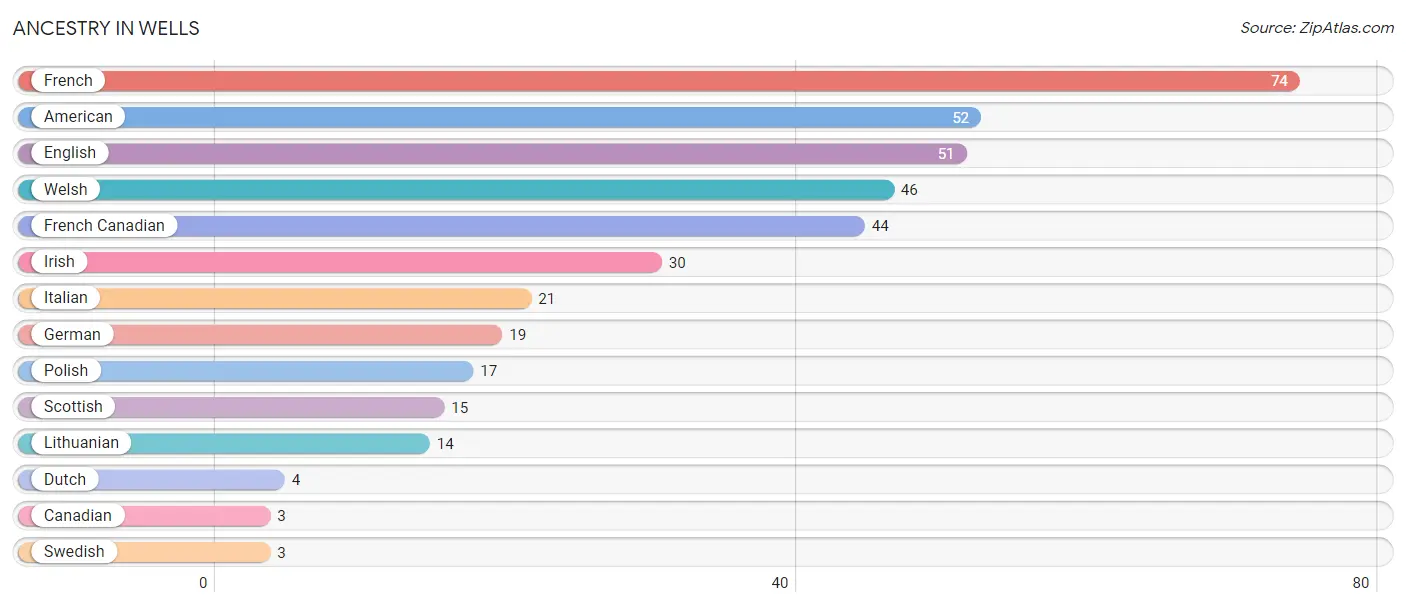
| Ancestry | # Population | % Population |
| American | 52 | 14.1% |
| Canadian | 3 | 0.8% |
| Dutch | 4 | 1.1% |
| English | 51 | 13.8% |
| French | 74 | 20.1% |
| French Canadian | 44 | 11.9% |
| German | 19 | 5.1% |
| Irish | 30 | 8.1% |
| Italian | 21 | 5.7% |
| Lithuanian | 14 | 3.8% |
| Polish | 17 | 4.6% |
| Scottish | 15 | 4.1% |
| Swedish | 3 | 0.8% |
| Welsh | 46 | 12.5% | View All 14 Rows |
Immigrants in Wells

| Immigration Origin | # Population | % Population | View All 0 Rows |
Sex and Age in Wells
Sex and Age in Wells
The most populous age groups in Wells are 25 to 29 Years (56 | 34.2%) for men and 20 to 24 Years (37 | 18.0%) for women.
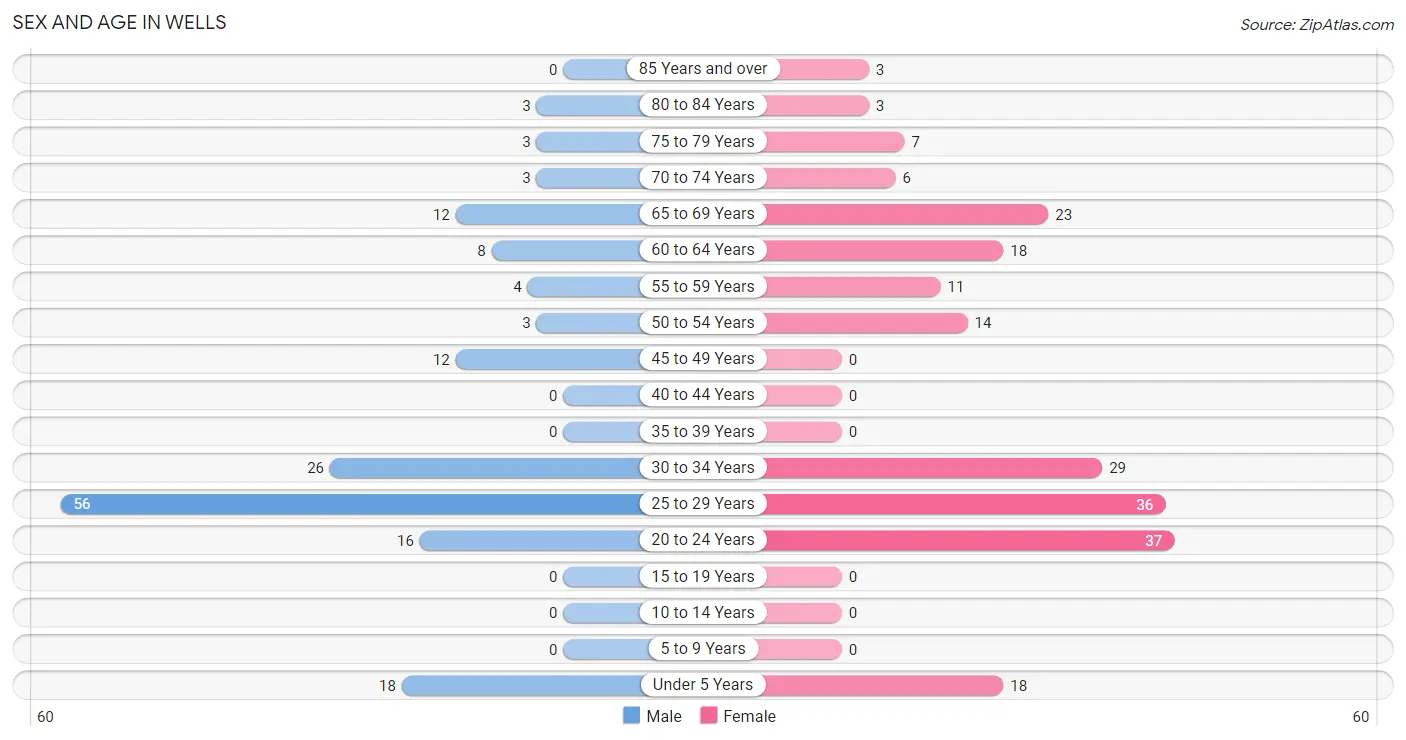
| Age Bracket | Male | Female |
| Under 5 Years | 18 (11.0%) | 18 (8.8%) |
| 5 to 9 Years | 0 (0.0%) | 0 (0.0%) |
| 10 to 14 Years | 0 (0.0%) | 0 (0.0%) |
| 15 to 19 Years | 0 (0.0%) | 0 (0.0%) |
| 20 to 24 Years | 16 (9.8%) | 37 (18.0%) |
| 25 to 29 Years | 56 (34.2%) | 36 (17.6%) |
| 30 to 34 Years | 26 (15.9%) | 29 (14.1%) |
| 35 to 39 Years | 0 (0.0%) | 0 (0.0%) |
| 40 to 44 Years | 0 (0.0%) | 0 (0.0%) |
| 45 to 49 Years | 12 (7.3%) | 0 (0.0%) |
| 50 to 54 Years | 3 (1.8%) | 14 (6.8%) |
| 55 to 59 Years | 4 (2.4%) | 11 (5.4%) |
| 60 to 64 Years | 8 (4.9%) | 18 (8.8%) |
| 65 to 69 Years | 12 (7.3%) | 23 (11.2%) |
| 70 to 74 Years | 3 (1.8%) | 6 (2.9%) |
| 75 to 79 Years | 3 (1.8%) | 7 (3.4%) |
| 80 to 84 Years | 3 (1.8%) | 3 (1.5%) |
| 85 Years and over | 0 (0.0%) | 3 (1.5%) |
| Total | 164 (100.0%) | 205 (100.0%) |
Families and Households in Wells
Median Family Size in Wells
The median family size in Wells is 3.03 persons per family, with single female/mother families (15 | 16.1%) accounting for the largest median family size of 4.4 persons per family. On the other hand, single male/father families (13 | 14.0%) represent the smallest median family size with 1.92 persons per family.
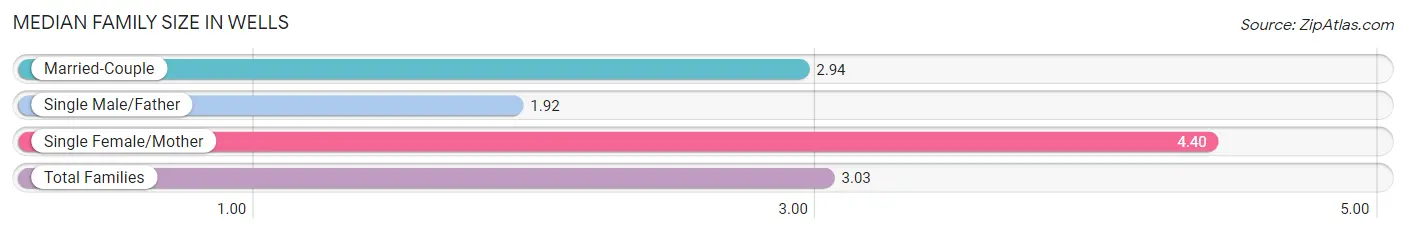
| Family Type | # Families | Family Size |
| Married-Couple | 65 (69.9%) | 2.94 |
| Single Male/Father | 13 (14.0%) | 1.92 |
| Single Female/Mother | 15 (16.1%) | 4.40 |
| Total Families | 93 (100.0%) | 3.03 |
Median Household Size in Wells
The median household size in Wells is 2.54 persons per household, with single female/mother households (15 | 10.3%) accounting for the largest median household size of 4.4 persons per household. non-family households (52 | 35.9%) represent the smallest median household size with 1.33 persons per household.
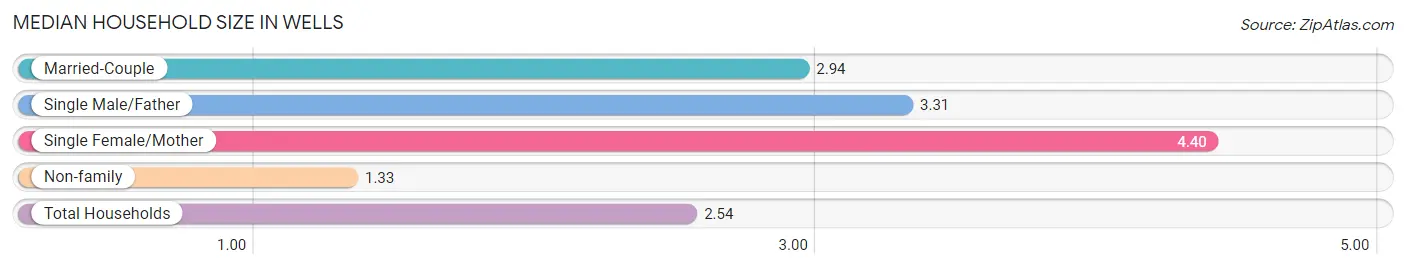
| Household Type | # Households | Household Size |
| Married-Couple | 65 (44.8%) | 2.94 |
| Single Male/Father | 13 (9.0%) | 3.31 |
| Single Female/Mother | 15 (10.3%) | 4.40 |
| Non-family | 52 (35.9%) | 1.33 |
| Total Households | 145 (100.0%) | 2.54 |
Household Size by Marriage Status in Wells
Out of a total of 145 households in Wells, 93 (64.1%) are family households, while 52 (35.9%) are nonfamily households. The most numerous type of family households are 2-person households, comprising 45, and the most common type of nonfamily households are 1-person households, comprising 38.
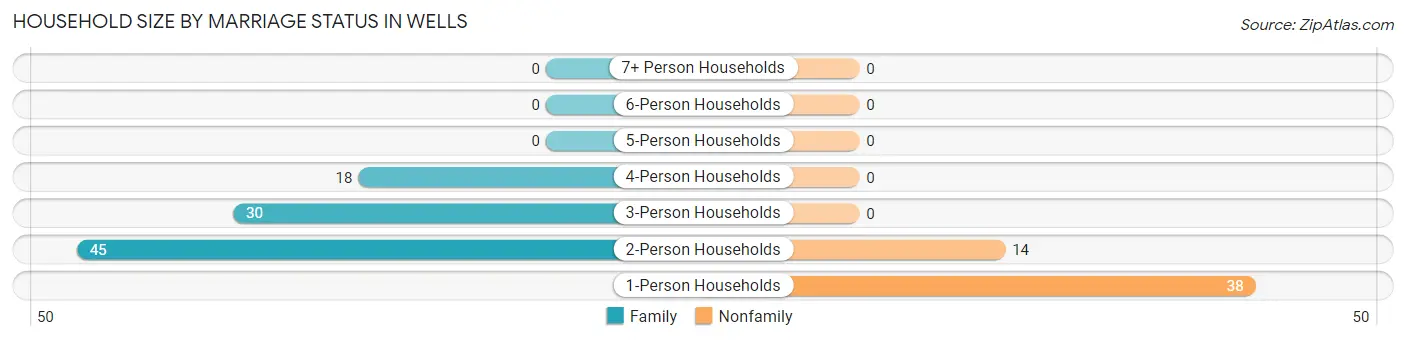
| Household Size | Family Households | Nonfamily Households |
| 1-Person Households | - | 38 (26.2%) |
| 2-Person Households | 45 (31.0%) | 14 (9.7%) |
| 3-Person Households | 30 (20.7%) | 0 (0.0%) |
| 4-Person Households | 18 (12.4%) | 0 (0.0%) |
| 5-Person Households | 0 (0.0%) | 0 (0.0%) |
| 6-Person Households | 0 (0.0%) | 0 (0.0%) |
| 7+ Person Households | 0 (0.0%) | 0 (0.0%) |
| Total | 93 (64.1%) | 52 (35.9%) |
Female Fertility in Wells
Fertility by Age in Wells
Average fertility rate in Wells is 137.0 births per 1,000 women. Women in the age bracket of 20 to 34 years have the highest fertility rate with 137.0 births per 1,000 women. Women in the age bracket of 20 to 34 years acount for 100.0% of all women with births.
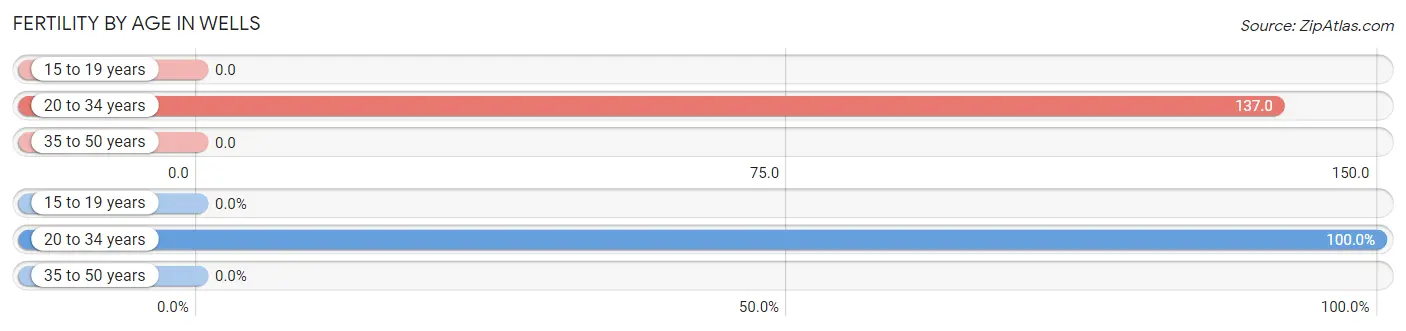
| Age Bracket | Women with Births | Births / 1,000 Women |
| 15 to 19 years | 0 (0.0%) | 0.0 |
| 20 to 34 years | 14 (100.0%) | 137.0 |
| 35 to 50 years | 0 (0.0%) | 0.0 |
| Total | 14 (100.0%) | 137.0 |
Fertility by Age by Marriage Status in Wells
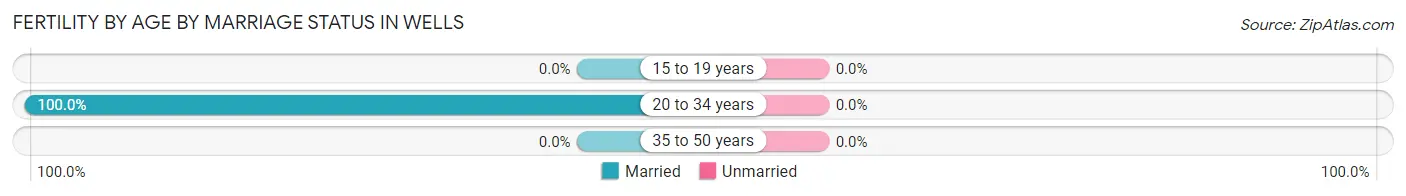
| Age Bracket | Married | Unmarried |
| 15 to 19 years | 0 (0.0%) | 0 (0.0%) |
| 20 to 34 years | 14 (100.0%) | 0 (0.0%) |
| 35 to 50 years | 0 (0.0%) | 0 (0.0%) |
| Total | 14 (100.0%) | 0 (0.0%) |
Fertility by Education in Wells
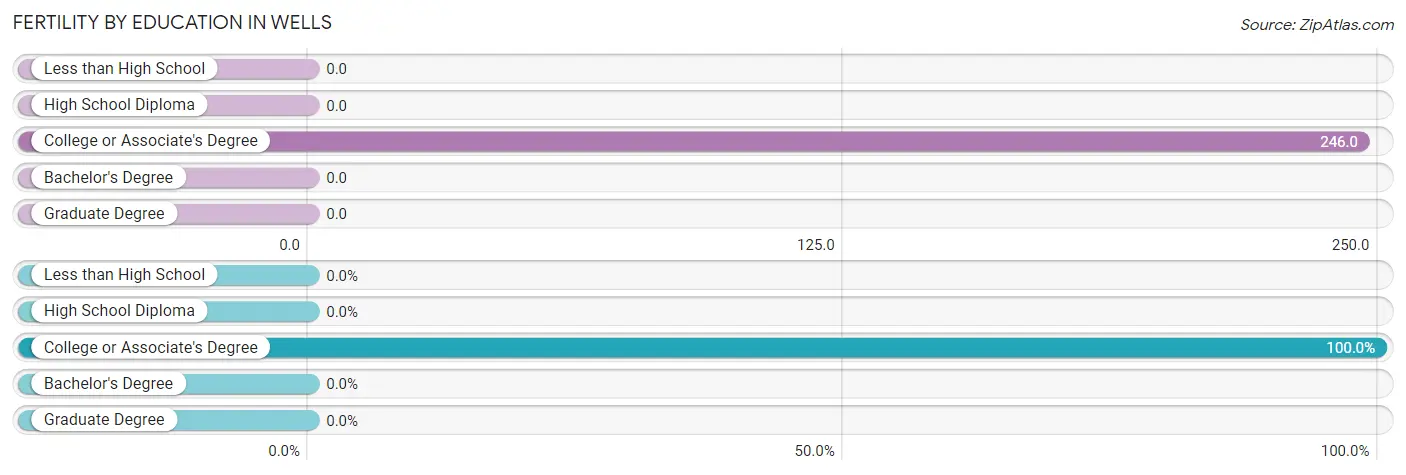
| Educational Attainment | Women with Births | Births / 1,000 Women |
| Less than High School | 0 (0.0%) | 0.0 |
| High School Diploma | 0 (0.0%) | 0.0 |
| College or Associate's Degree | 14 (100.0%) | 246.0 |
| Bachelor's Degree | 0 (0.0%) | 0.0 |
| Graduate Degree | 0 (0.0%) | 0.0 |
| Total | 14 (100.0%) | 137.0 |
Fertility by Education by Marriage Status in Wells
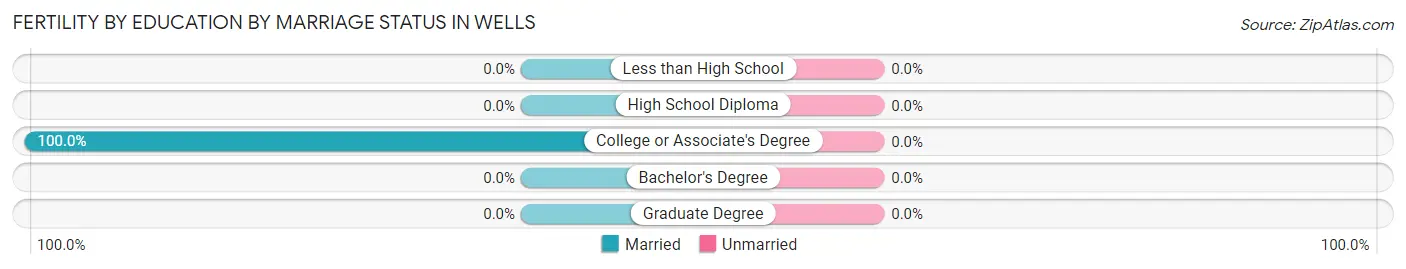
| Educational Attainment | Married | Unmarried |
| Less than High School | 0 (0.0%) | 0 (0.0%) |
| High School Diploma | 0 (0.0%) | 0 (0.0%) |
| College or Associate's Degree | 14 (100.0%) | 0 (0.0%) |
| Bachelor's Degree | 0 (0.0%) | 0 (0.0%) |
| Graduate Degree | 0 (0.0%) | 0 (0.0%) |
| Total | 14 (100.0%) | 0 (0.0%) |
Employment Characteristics in Wells
Employment by Class of Employer in Wells
Among the 224 employed individuals in Wells, private company employees (158 | 70.5%), federal government employees (28 | 12.5%), and not-for-profit organizations (27 | 12.0%) make up the most common classes of employment.
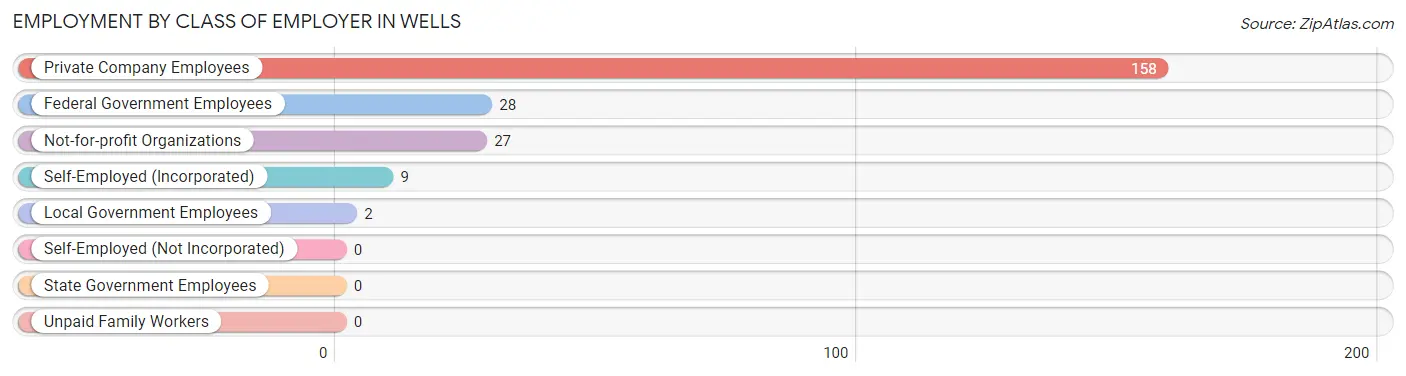
| Employer Class | # Employees | % Employees |
| Private Company Employees | 158 | 70.5% |
| Self-Employed (Incorporated) | 9 | 4.0% |
| Self-Employed (Not Incorporated) | 0 | 0.0% |
| Not-for-profit Organizations | 27 | 12.0% |
| Local Government Employees | 2 | 0.9% |
| State Government Employees | 0 | 0.0% |
| Federal Government Employees | 28 | 12.5% |
| Unpaid Family Workers | 0 | 0.0% |
| Total | 224 | 100.0% |
Employment Status by Age in Wells
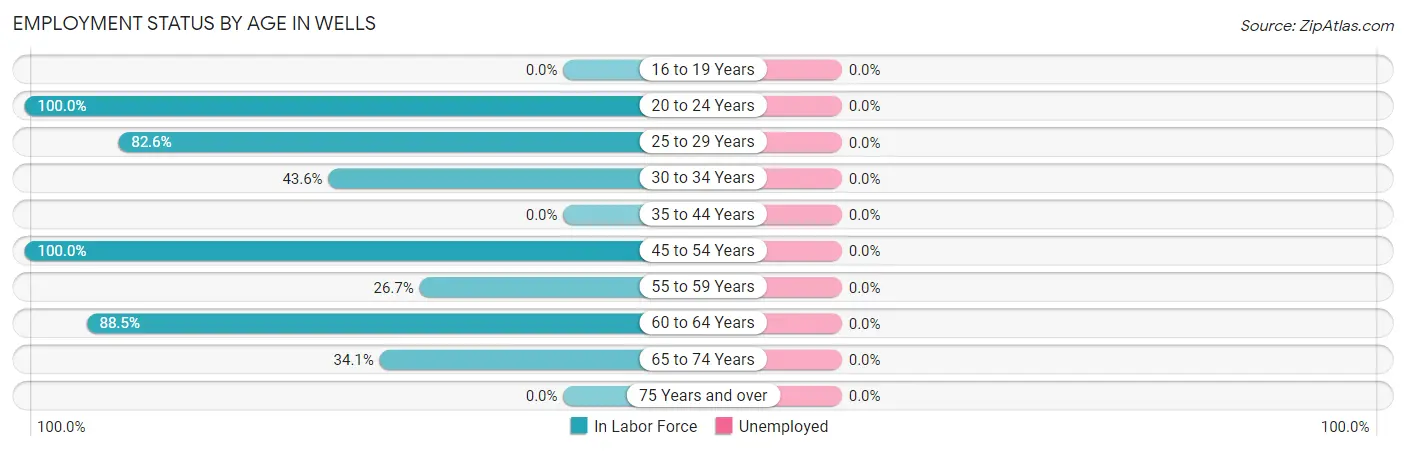
| Age Bracket | In Labor Force | Unemployed |
| 16 to 19 Years | 0 (0.0%) | 0 (0.0%) |
| 20 to 24 Years | 53 (100.0%) | 0 (0.0%) |
| 25 to 29 Years | 76 (82.6%) | 0 (0.0%) |
| 30 to 34 Years | 24 (43.6%) | 0 (0.0%) |
| 35 to 44 Years | 0 (0.0%) | 0 (0.0%) |
| 45 to 54 Years | 29 (100.0%) | 0 (0.0%) |
| 55 to 59 Years | 4 (26.7%) | 0 (0.0%) |
| 60 to 64 Years | 23 (88.5%) | 0 (0.0%) |
| 65 to 74 Years | 15 (34.1%) | 0 (0.0%) |
| 75 Years and over | 0 (0.0%) | 0 (0.0%) |
| Total | 224 (67.3%) | 0 (0.0%) |
Employment Status by Educational Attainment in Wells
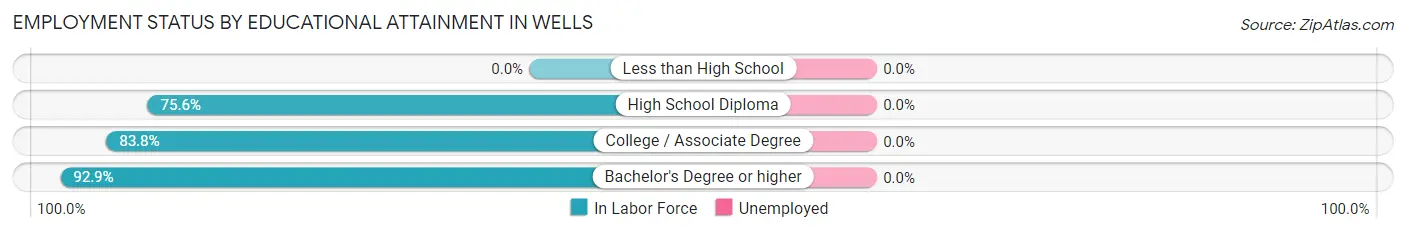
| Educational Attainment | In Labor Force | Unemployed |
| Less than High School | 0 (0.0%) | 0 (0.0%) |
| High School Diploma | 34 (75.6%) | 0 (0.0%) |
| College / Associate Degree | 83 (83.8%) | 0 (0.0%) |
| Bachelor's Degree or higher | 39 (92.9%) | 0 (0.0%) |
| Total | 156 (71.9%) | 0 (0.0%) |
Employment Occupations by Sex in Wells
Management, Business, Science and Arts Occupations
The most common Management, Business, Science and Arts occupations in Wells are Community & Social Service (44 | 19.6%), Education Instruction & Library (26 | 11.6%), Arts, Media & Entertainment (18 | 8.0%), Health Diagnosing & Treating (15 | 6.7%), and Health Technologists (15 | 6.7%).
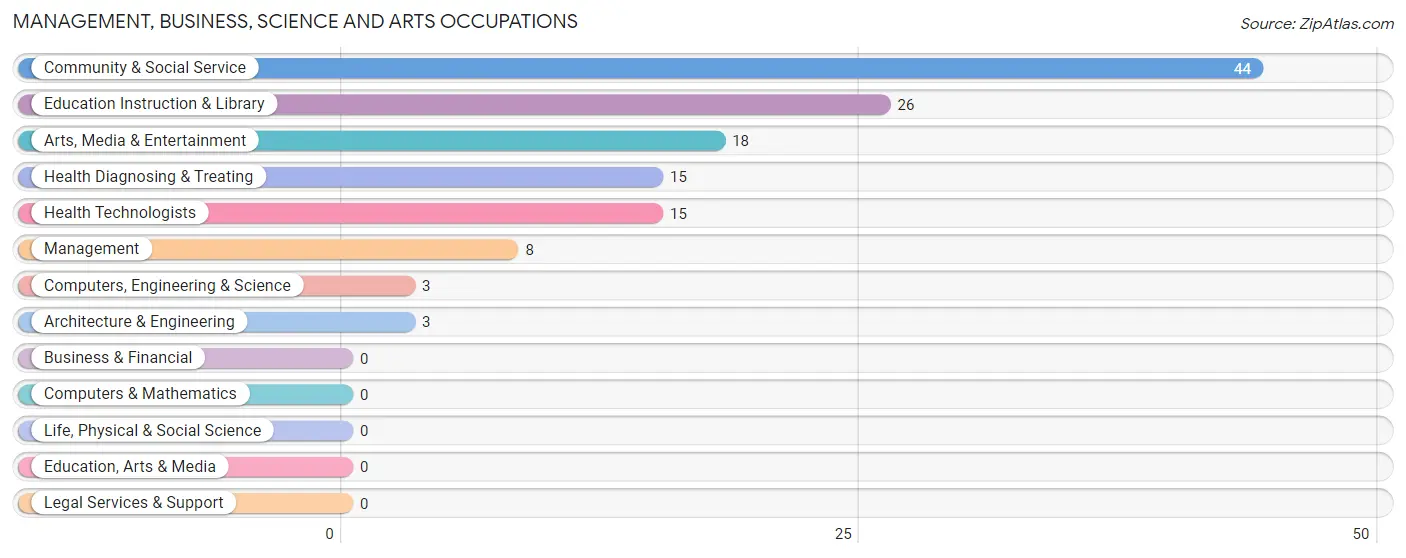
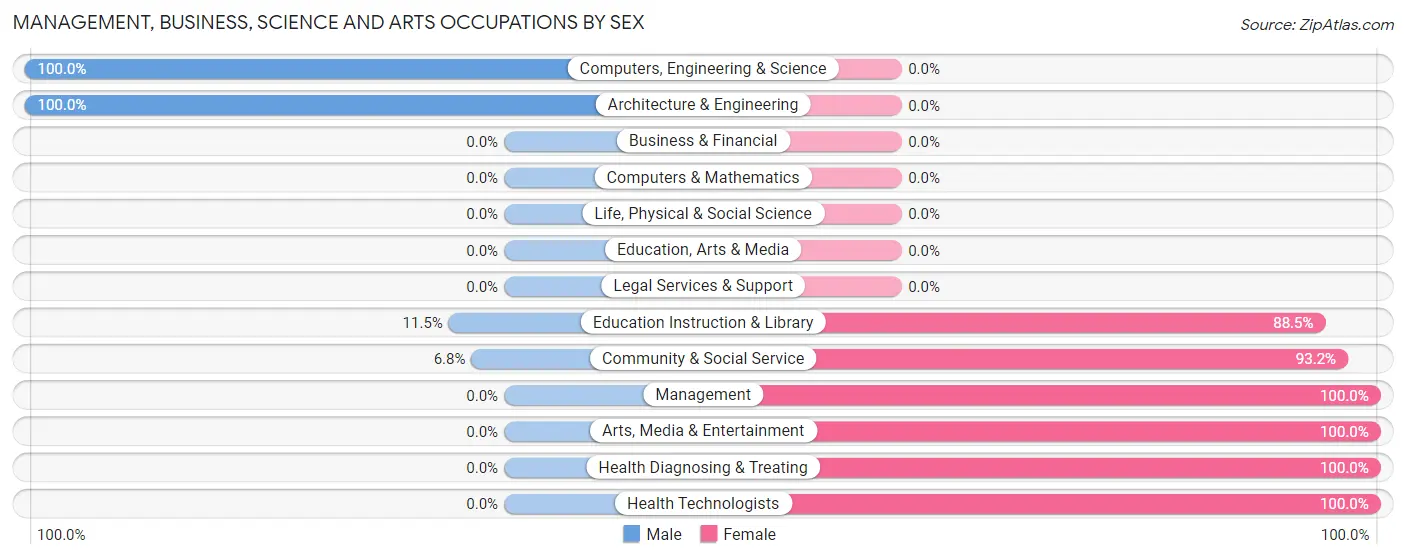
Management, Business, Science and Arts Occupations by Sex
Within the Management, Business, Science and Arts occupations in Wells, the most male-oriented occupations are Computers, Engineering & Science (100.0%), Architecture & Engineering (100.0%), and Education Instruction & Library (11.5%), while the most female-oriented occupations are Management (100.0%), Arts, Media & Entertainment (100.0%), and Health Diagnosing & Treating (100.0%).
| Occupation | Male | Female |
| Management | 0 (0.0%) | 8 (100.0%) |
| Business & Financial | 0 (0.0%) | 0 (0.0%) |
| Computers, Engineering & Science | 3 (100.0%) | 0 (0.0%) |
| Computers & Mathematics | 0 (0.0%) | 0 (0.0%) |
| Architecture & Engineering | 3 (100.0%) | 0 (0.0%) |
| Life, Physical & Social Science | 0 (0.0%) | 0 (0.0%) |
| Community & Social Service | 3 (6.8%) | 41 (93.2%) |
| Education, Arts & Media | 0 (0.0%) | 0 (0.0%) |
| Legal Services & Support | 0 (0.0%) | 0 (0.0%) |
| Education Instruction & Library | 3 (11.5%) | 23 (88.5%) |
| Arts, Media & Entertainment | 0 (0.0%) | 18 (100.0%) |
| Health Diagnosing & Treating | 0 (0.0%) | 15 (100.0%) |
| Health Technologists | 0 (0.0%) | 15 (100.0%) |
| Total (Category) | 6 (8.6%) | 64 (91.4%) |
| Total (Overall) | 98 (43.8%) | 126 (56.2%) |
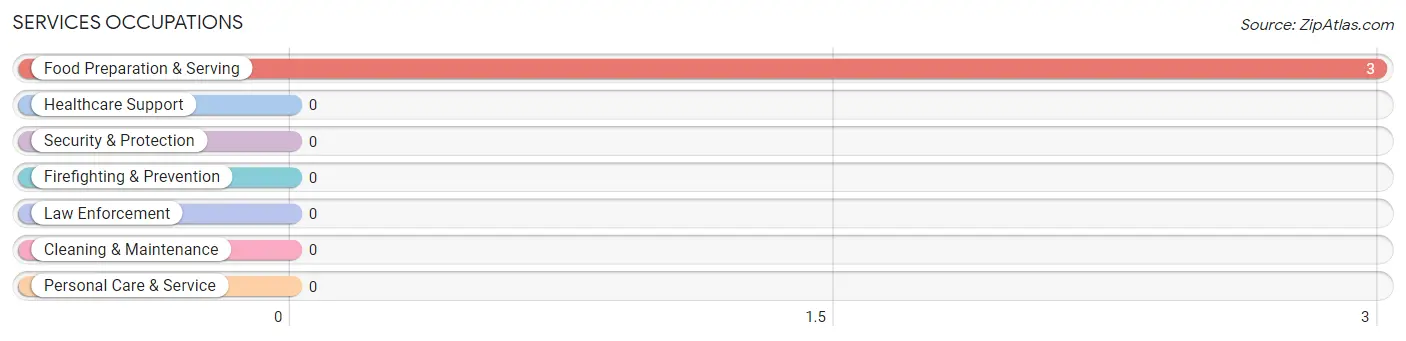
Services Occupations
The most common Services occupations in Wells are , and Food Preparation & Serving (3 | 1.3%).
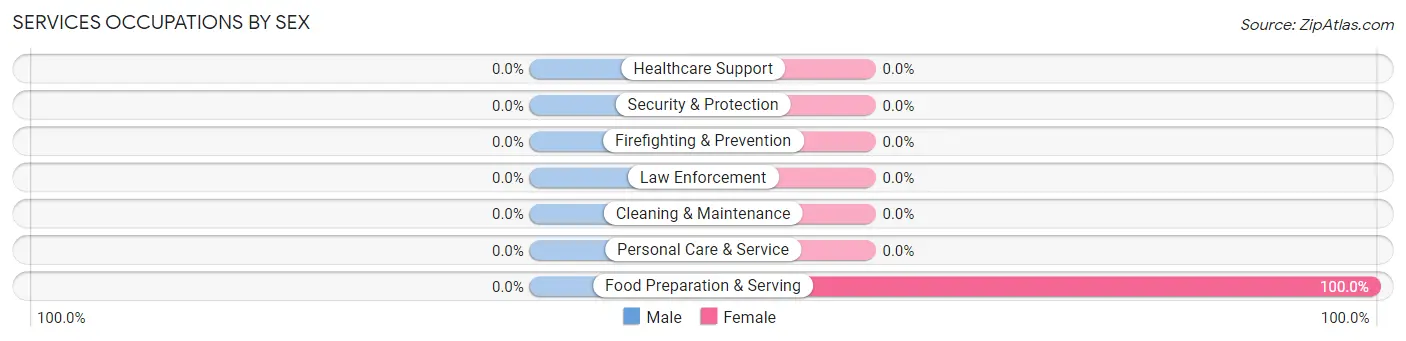
Services Occupations by Sex
| Occupation | Male | Female |
| Healthcare Support | 0 (0.0%) | 0 (0.0%) |
| Security & Protection | 0 (0.0%) | 0 (0.0%) |
| Firefighting & Prevention | 0 (0.0%) | 0 (0.0%) |
| Law Enforcement | 0 (0.0%) | 0 (0.0%) |
| Food Preparation & Serving | 0 (0.0%) | 3 (100.0%) |
| Cleaning & Maintenance | 0 (0.0%) | 0 (0.0%) |
| Personal Care & Service | 0 (0.0%) | 0 (0.0%) |
| Total (Category) | 0 (0.0%) | 3 (100.0%) |
| Total (Overall) | 98 (43.8%) | 126 (56.2%) |
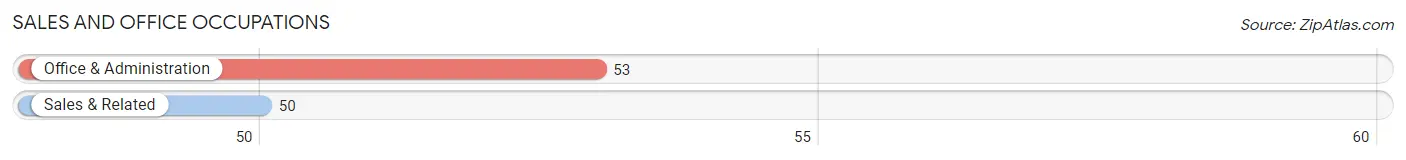
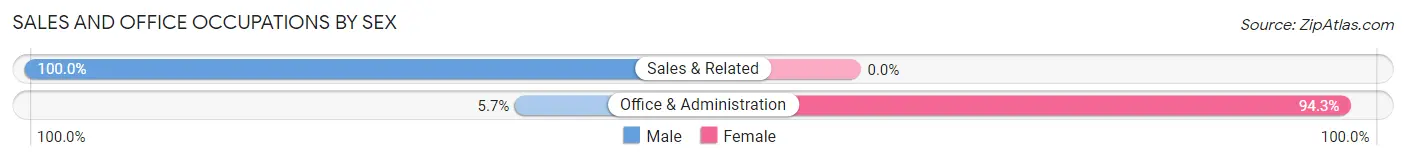
Sales and Office Occupations
The most common Sales and Office occupations in Wells are Office & Administration (53 | 23.7%), and Sales & Related (50 | 22.3%).
Sales and Office Occupations by Sex
| Occupation | Male | Female |
| Sales & Related | 50 (100.0%) | 0 (0.0%) |
| Office & Administration | 3 (5.7%) | 50 (94.3%) |
| Total (Category) | 53 (51.5%) | 50 (48.5%) |
| Total (Overall) | 98 (43.8%) | 126 (56.2%) |
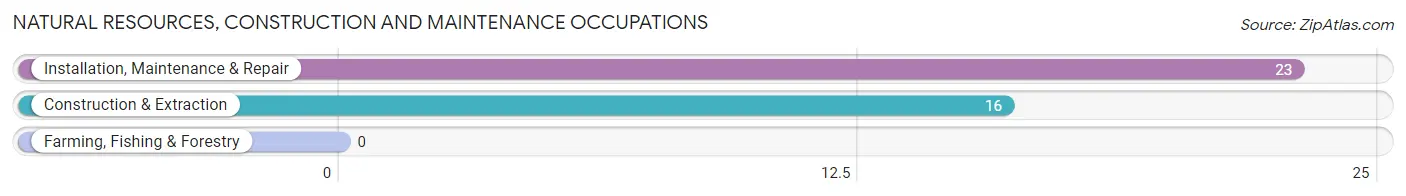
Natural Resources, Construction and Maintenance Occupations
The most common Natural Resources, Construction and Maintenance occupations in Wells are Installation, Maintenance & Repair (23 | 10.3%), and Construction & Extraction (16 | 7.1%).
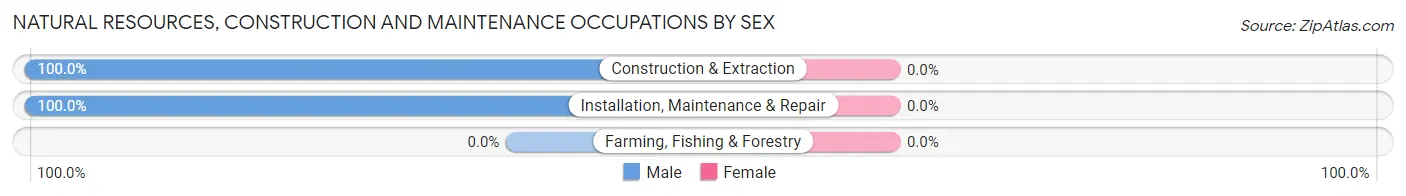
Natural Resources, Construction and Maintenance Occupations by Sex
| Occupation | Male | Female |
| Farming, Fishing & Forestry | 0 (0.0%) | 0 (0.0%) |
| Construction & Extraction | 16 (100.0%) | 0 (0.0%) |
| Installation, Maintenance & Repair | 23 (100.0%) | 0 (0.0%) |
| Total (Category) | 39 (100.0%) | 0 (0.0%) |
| Total (Overall) | 98 (43.8%) | 126 (56.2%) |
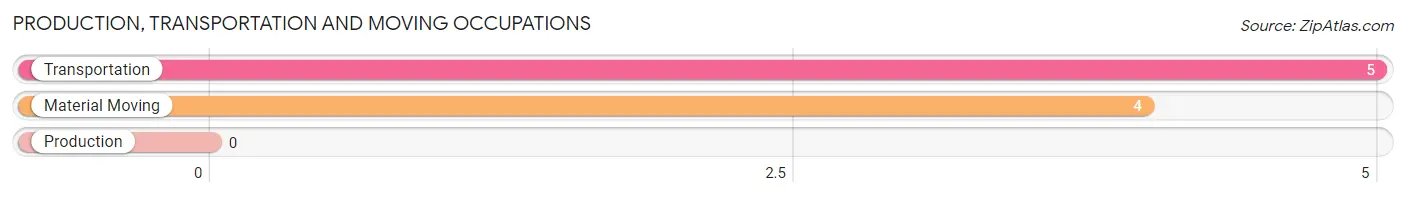
Production, Transportation and Moving Occupations
The most common Production, Transportation and Moving occupations in Wells are Transportation (5 | 2.2%), and Material Moving (4 | 1.8%).
Production, Transportation and Moving Occupations by Sex
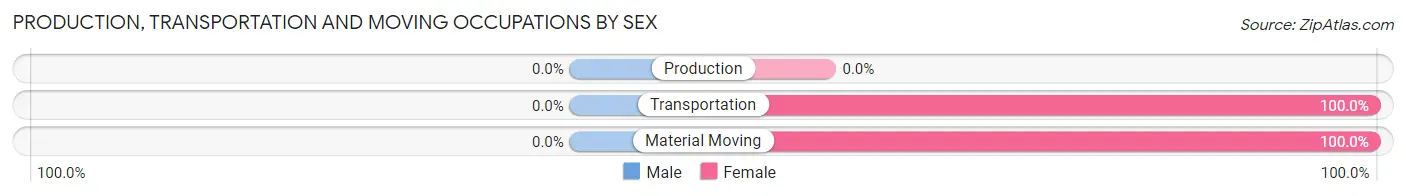
| Occupation | Male | Female |
| Production | 0 (0.0%) | 0 (0.0%) |
| Transportation | 0 (0.0%) | 5 (100.0%) |
| Material Moving | 0 (0.0%) | 4 (100.0%) |
| Total (Category) | 0 (0.0%) | 9 (100.0%) |
| Total (Overall) | 98 (43.8%) | 126 (56.2%) |
Employment Industries by Sex in Wells
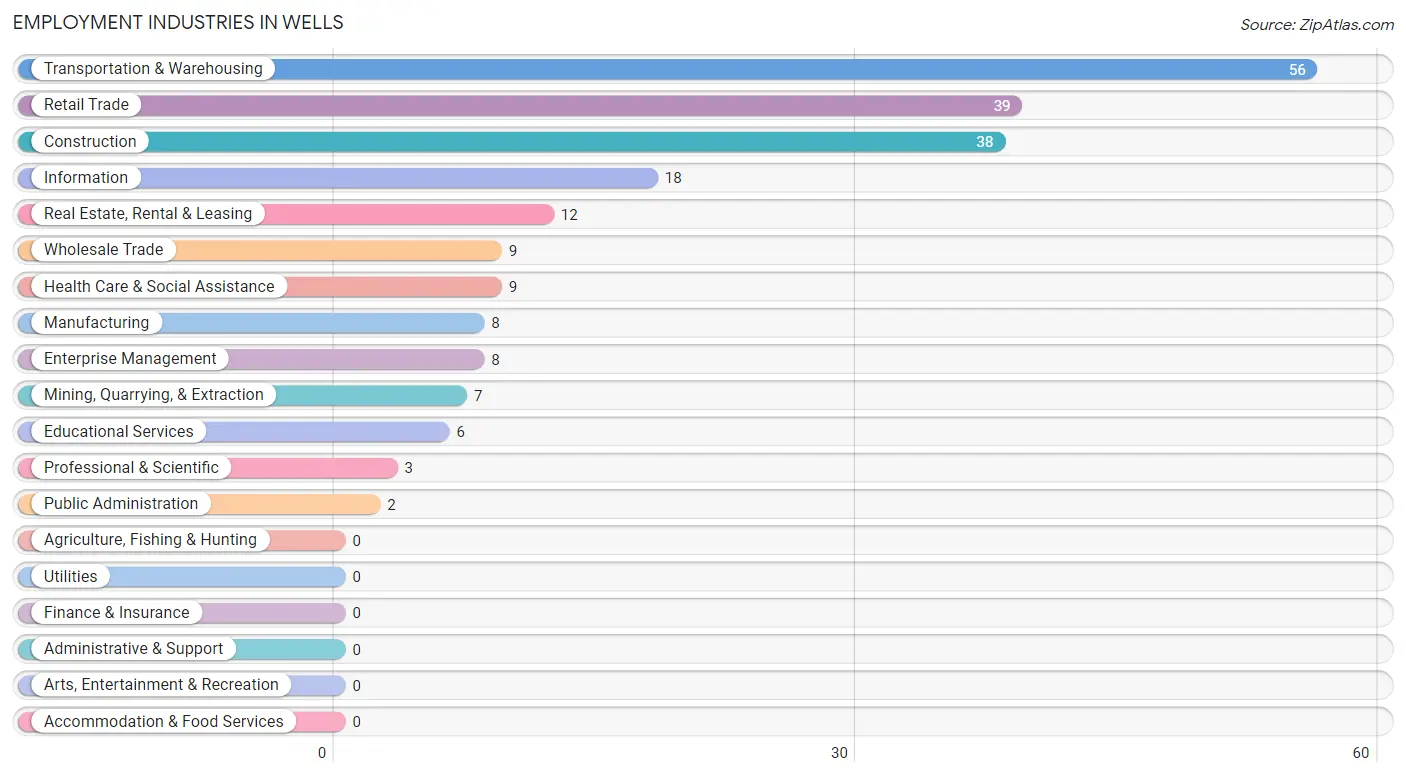
Employment Industries in Wells
The major employment industries in Wells include Transportation & Warehousing (56 | 25.0%), Retail Trade (39 | 17.4%), Construction (38 | 17.0%), Information (18 | 8.0%), and Real Estate, Rental & Leasing (12 | 5.4%).
Employment Industries by Sex in Wells
The Wells industries that see more men than women are Mining, Quarrying, & Extraction (100.0%), Wholesale Trade (100.0%), and Retail Trade (100.0%), whereas the industries that tend to have a higher number of women are Manufacturing (100.0%), Transportation & Warehousing (100.0%), and Information (100.0%).
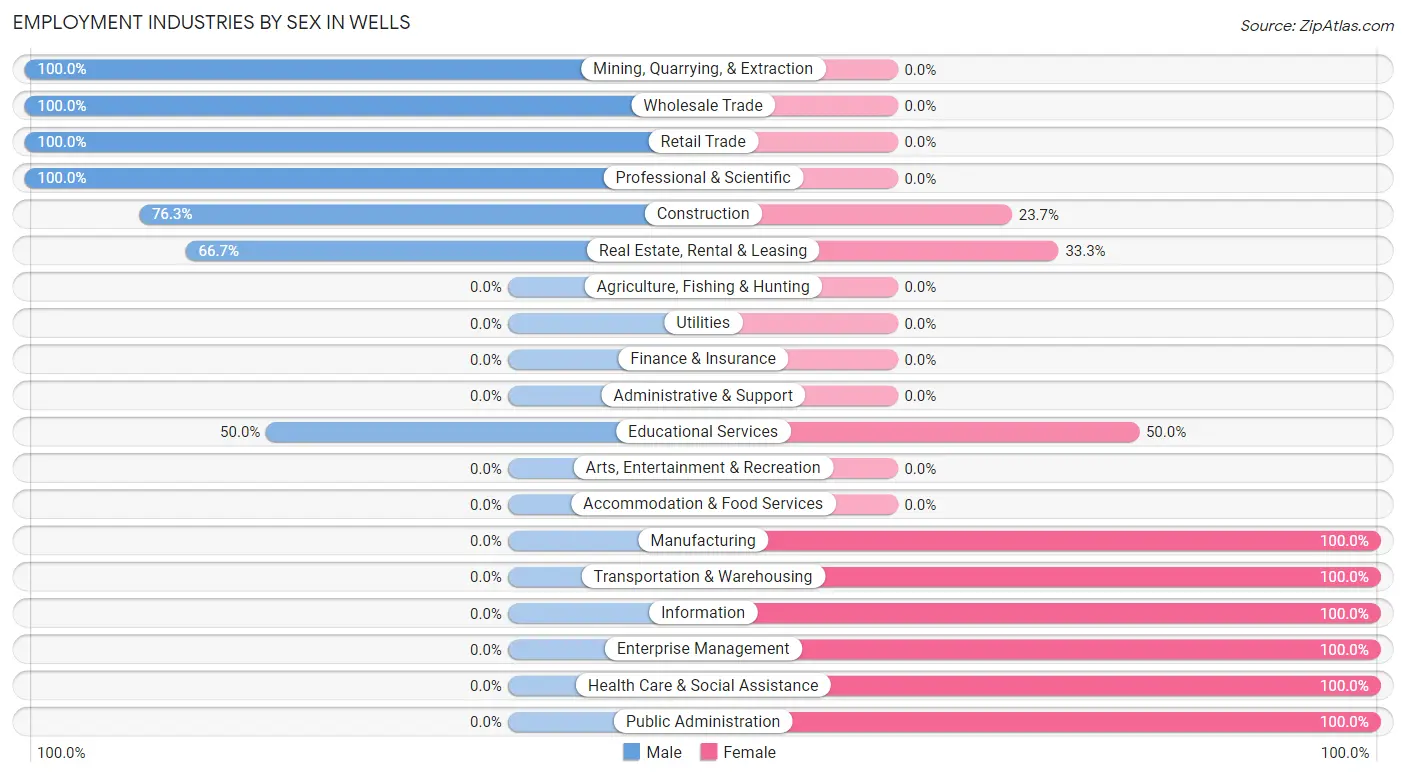
| Industry | Male | Female |
| Agriculture, Fishing & Hunting | 0 (0.0%) | 0 (0.0%) |
| Mining, Quarrying, & Extraction | 7 (100.0%) | 0 (0.0%) |
| Construction | 29 (76.3%) | 9 (23.7%) |
| Manufacturing | 0 (0.0%) | 8 (100.0%) |
| Wholesale Trade | 9 (100.0%) | 0 (0.0%) |
| Retail Trade | 39 (100.0%) | 0 (0.0%) |
| Transportation & Warehousing | 0 (0.0%) | 56 (100.0%) |
| Utilities | 0 (0.0%) | 0 (0.0%) |
| Information | 0 (0.0%) | 18 (100.0%) |
| Finance & Insurance | 0 (0.0%) | 0 (0.0%) |
| Real Estate, Rental & Leasing | 8 (66.7%) | 4 (33.3%) |
| Professional & Scientific | 3 (100.0%) | 0 (0.0%) |
| Enterprise Management | 0 (0.0%) | 8 (100.0%) |
| Administrative & Support | 0 (0.0%) | 0 (0.0%) |
| Educational Services | 3 (50.0%) | 3 (50.0%) |
| Health Care & Social Assistance | 0 (0.0%) | 9 (100.0%) |
| Arts, Entertainment & Recreation | 0 (0.0%) | 0 (0.0%) |
| Accommodation & Food Services | 0 (0.0%) | 0 (0.0%) |
| Public Administration | 0 (0.0%) | 2 (100.0%) |
| Total | 98 (43.8%) | 126 (56.2%) |
Education in Wells
School Enrollment in Wells
| School Level | # Students | % Students |
| Nursery / Preschool | 0 | 0.0% |
| Kindergarten | 0 | 0.0% |
| Elementary School | 0 | 0.0% |
| Middle School | 0 | 0.0% |
| High School | 0 | 0.0% |
| College / Undergraduate | 0 | 0.0% |
| Graduate / Professional | 0 | 0.0% |
| Total | 0 | 0.0% |
School Enrollment by Age by Funding Source in Wells
| Age Bracket | Public School | Private School |
| 3 to 4 Year Olds | 0 (0.0%) | 0 (0.0%) |
| 5 to 9 Year Old | 0 (0.0%) | 0 (0.0%) |
| 10 to 14 Year Olds | 0 (0.0%) | 0 (0.0%) |
| 15 to 17 Year Olds | 0 (0.0%) | 0 (0.0%) |
| 18 to 19 Year Olds | 0 (0.0%) | 0 (0.0%) |
| 20 to 24 Year Olds | 0 (0.0%) | 0 (0.0%) |
| 25 to 34 Year Olds | 0 (0.0%) | 0 (0.0%) |
| 35 Years and over | 0 (0.0%) | 0 (0.0%) |
| Total | 0 (0.0%) | 0 (0.0%) |
Educational Attainment by Field of Study in Wells
Visual & performing arts (26 | 51.0%), science & technology (9 | 17.6%), bio, nature & agricultural (6 | 11.8%), business (4 | 7.8%), and engineering (3 | 5.9%) are the most common fields of study among 51 individuals in Wells who have obtained a bachelor's degree or higher.
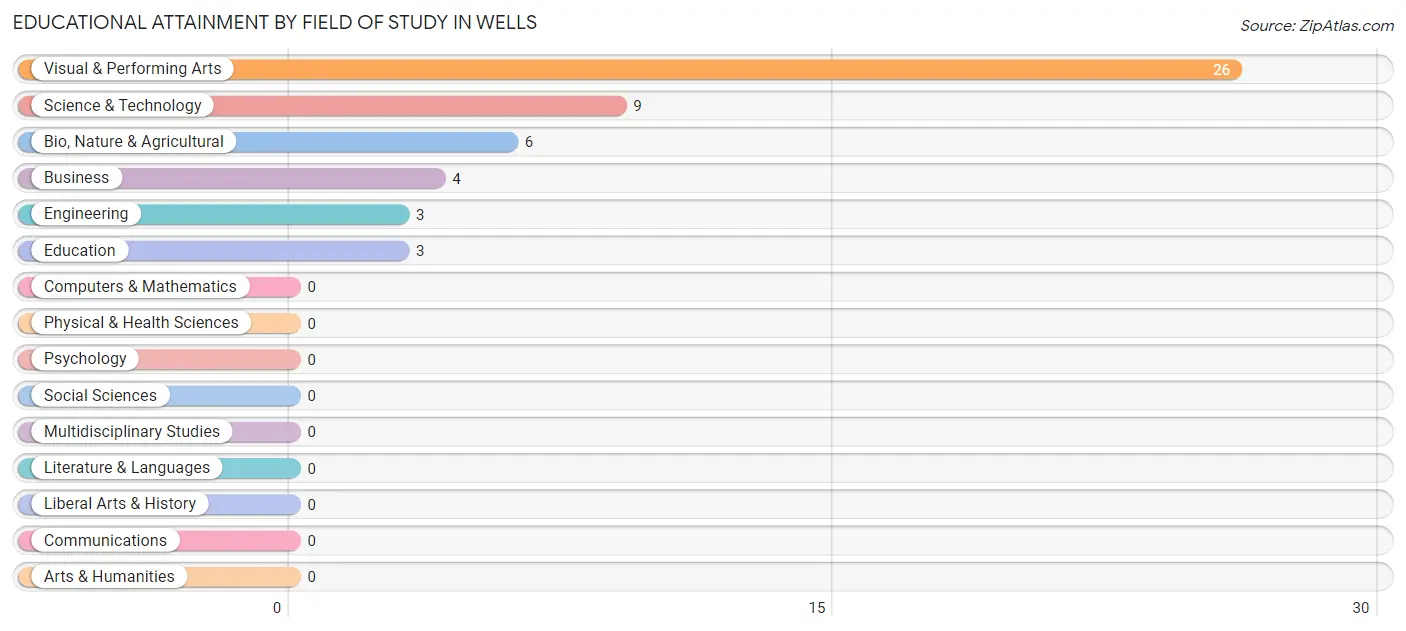
| Field of Study | # Graduates | % Graduates |
| Computers & Mathematics | 0 | 0.0% |
| Bio, Nature & Agricultural | 6 | 11.8% |
| Physical & Health Sciences | 0 | 0.0% |
| Psychology | 0 | 0.0% |
| Social Sciences | 0 | 0.0% |
| Engineering | 3 | 5.9% |
| Multidisciplinary Studies | 0 | 0.0% |
| Science & Technology | 9 | 17.6% |
| Business | 4 | 7.8% |
| Education | 3 | 5.9% |
| Literature & Languages | 0 | 0.0% |
| Liberal Arts & History | 0 | 0.0% |
| Visual & Performing Arts | 26 | 51.0% |
| Communications | 0 | 0.0% |
| Arts & Humanities | 0 | 0.0% |
| Total | 51 | 100.0% |
Transportation & Commute in Wells
Vehicle Availability by Sex in Wells
The most prevalent vehicle ownership categories in Wells are males with 3 vehicles (39, accounting for 39.8%) and females with 3 vehicles (31, making up 30.9%).
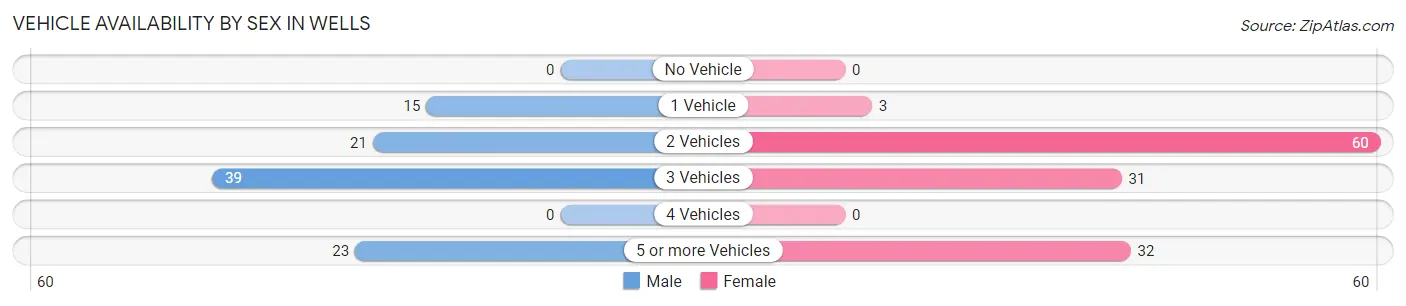
| Vehicles Available | Male | Female |
| No Vehicle | 0 (0.0%) | 0 (0.0%) |
| 1 Vehicle | 15 (15.3%) | 3 (2.4%) |
| 2 Vehicles | 21 (21.4%) | 60 (47.6%) |
| 3 Vehicles | 39 (39.8%) | 31 (24.6%) |
| 4 Vehicles | 0 (0.0%) | 0 (0.0%) |
| 5 or more Vehicles | 23 (23.5%) | 32 (25.4%) |
| Total | 98 (100.0%) | 126 (100.0%) |
Commute Time in Wells
The most frequently occuring commute durations in Wells are 20 to 24 minutes (69 commuters, 32.1%), 45 to 59 minutes (45 commuters, 20.9%), and 90 or more minutes (37 commuters, 17.2%).
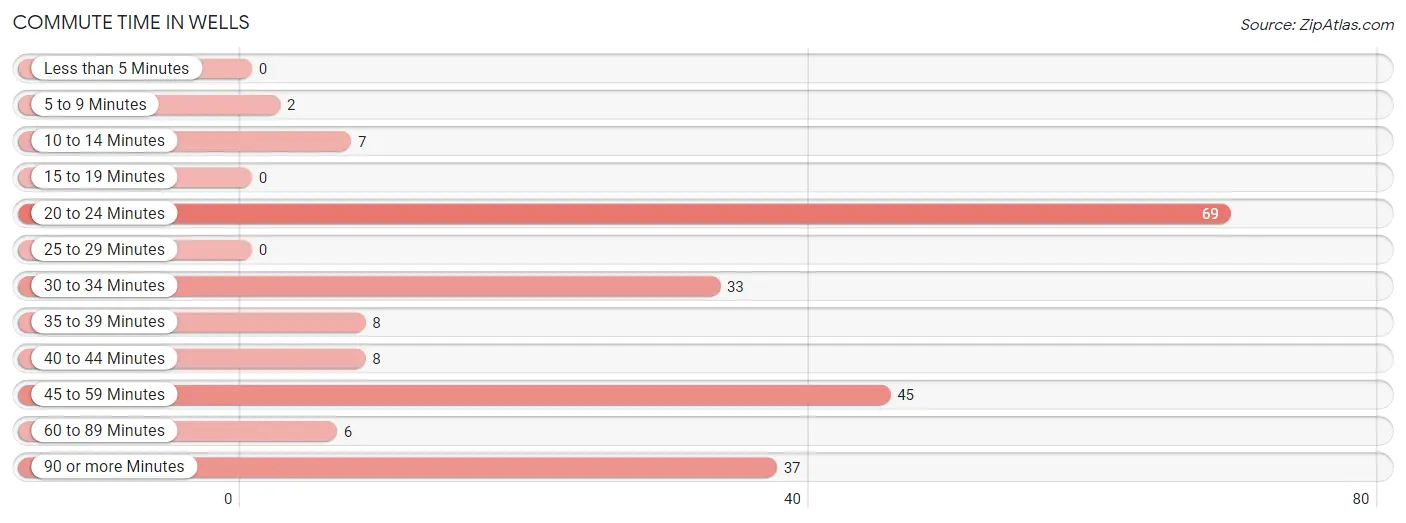
| Commute Time | # Commuters | % Commuters |
| Less than 5 Minutes | 0 | 0.0% |
| 5 to 9 Minutes | 2 | 0.9% |
| 10 to 14 Minutes | 7 | 3.3% |
| 15 to 19 Minutes | 0 | 0.0% |
| 20 to 24 Minutes | 69 | 32.1% |
| 25 to 29 Minutes | 0 | 0.0% |
| 30 to 34 Minutes | 33 | 15.3% |
| 35 to 39 Minutes | 8 | 3.7% |
| 40 to 44 Minutes | 8 | 3.7% |
| 45 to 59 Minutes | 45 | 20.9% |
| 60 to 89 Minutes | 6 | 2.8% |
| 90 or more Minutes | 37 | 17.2% |
Commute Time by Sex in Wells
The most common commute times in Wells are 30 to 34 minutes (29 commuters, 29.6%) for males and 20 to 24 minutes (43 commuters, 36.7%) for females.
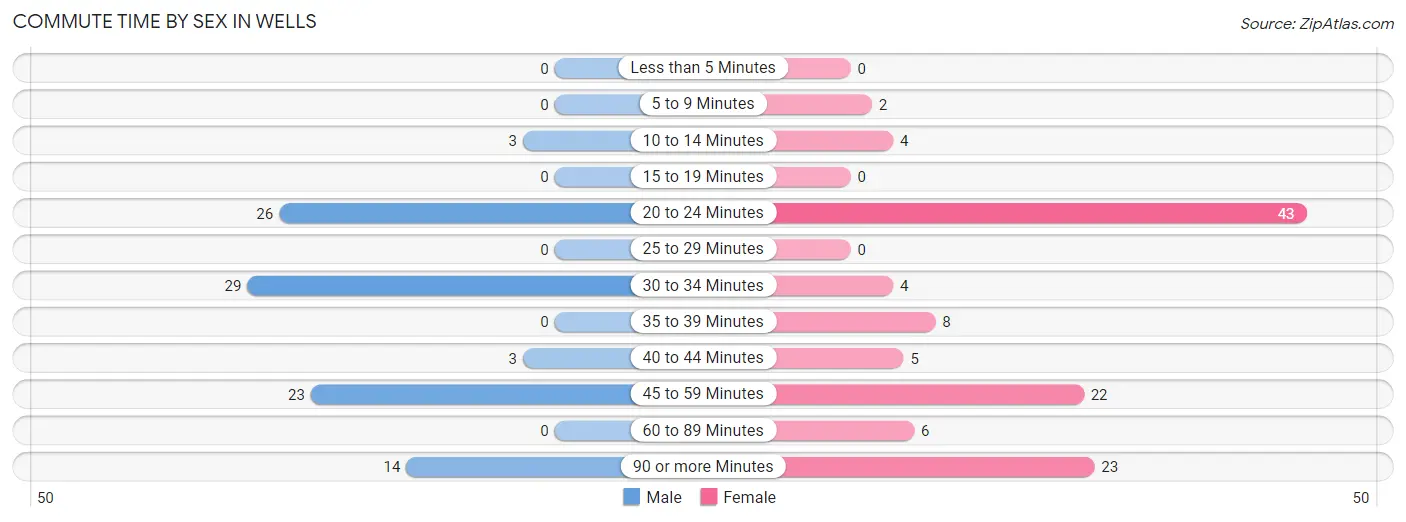
| Commute Time | Male | Female |
| Less than 5 Minutes | 0 (0.0%) | 0 (0.0%) |
| 5 to 9 Minutes | 0 (0.0%) | 2 (1.7%) |
| 10 to 14 Minutes | 3 (3.1%) | 4 (3.4%) |
| 15 to 19 Minutes | 0 (0.0%) | 0 (0.0%) |
| 20 to 24 Minutes | 26 (26.5%) | 43 (36.7%) |
| 25 to 29 Minutes | 0 (0.0%) | 0 (0.0%) |
| 30 to 34 Minutes | 29 (29.6%) | 4 (3.4%) |
| 35 to 39 Minutes | 0 (0.0%) | 8 (6.8%) |
| 40 to 44 Minutes | 3 (3.1%) | 5 (4.3%) |
| 45 to 59 Minutes | 23 (23.5%) | 22 (18.8%) |
| 60 to 89 Minutes | 0 (0.0%) | 6 (5.1%) |
| 90 or more Minutes | 14 (14.3%) | 23 (19.7%) |
Time of Departure to Work by Sex in Wells
The most frequent times of departure to work in Wells are 7:00 AM to 7:29 AM (24, 24.5%) for males and 7:00 AM to 7:29 AM (57, 48.7%) for females.
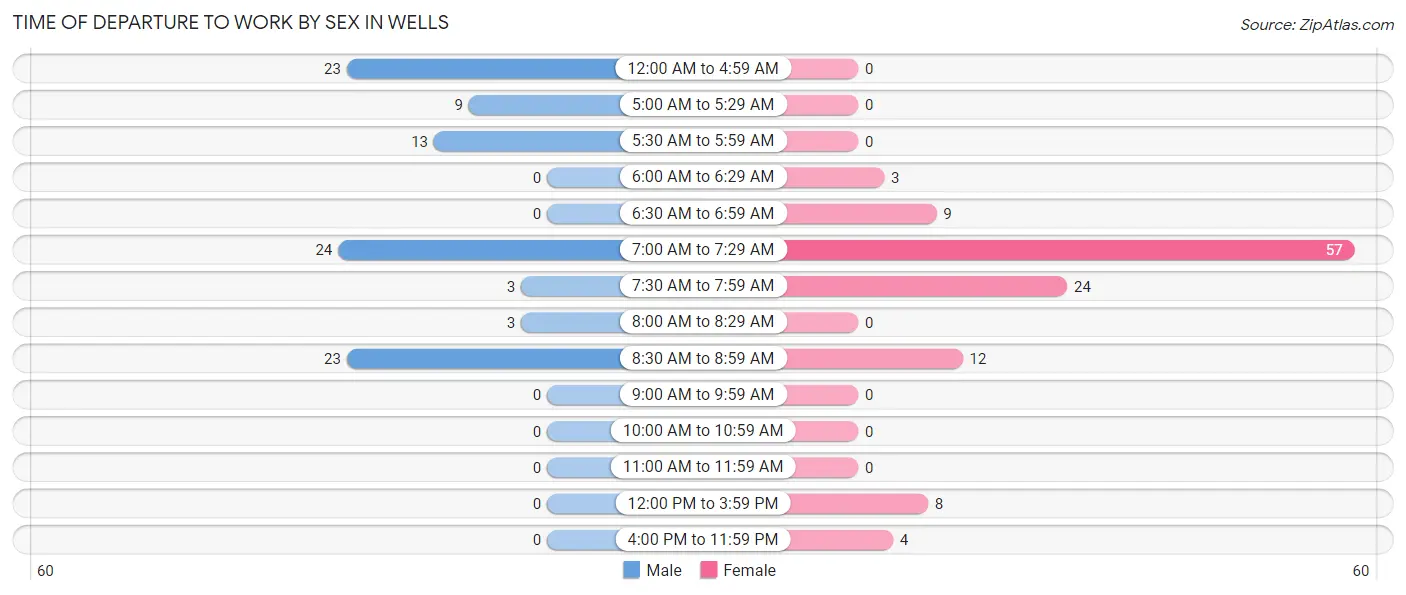
| Time of Departure | Male | Female |
| 12:00 AM to 4:59 AM | 23 (23.5%) | 0 (0.0%) |
| 5:00 AM to 5:29 AM | 9 (9.2%) | 0 (0.0%) |
| 5:30 AM to 5:59 AM | 13 (13.3%) | 0 (0.0%) |
| 6:00 AM to 6:29 AM | 0 (0.0%) | 3 (2.6%) |
| 6:30 AM to 6:59 AM | 0 (0.0%) | 9 (7.7%) |
| 7:00 AM to 7:29 AM | 24 (24.5%) | 57 (48.7%) |
| 7:30 AM to 7:59 AM | 3 (3.1%) | 24 (20.5%) |
| 8:00 AM to 8:29 AM | 3 (3.1%) | 0 (0.0%) |
| 8:30 AM to 8:59 AM | 23 (23.5%) | 12 (10.3%) |
| 9:00 AM to 9:59 AM | 0 (0.0%) | 0 (0.0%) |
| 10:00 AM to 10:59 AM | 0 (0.0%) | 0 (0.0%) |
| 11:00 AM to 11:59 AM | 0 (0.0%) | 0 (0.0%) |
| 12:00 PM to 3:59 PM | 0 (0.0%) | 8 (6.8%) |
| 4:00 PM to 11:59 PM | 0 (0.0%) | 4 (3.4%) |
| Total | 98 (100.0%) | 117 (100.0%) |
Housing Occupancy in Wells
Occupancy by Ownership in Wells
Of the total 145 dwellings in Wells, owner-occupied units account for 116 (80.0%), while renter-occupied units make up 29 (20.0%).
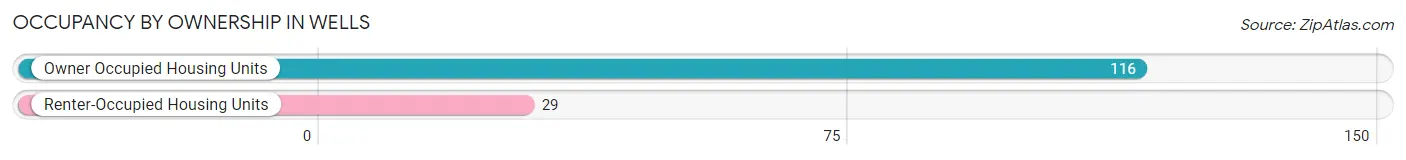
| Occupancy | # Housing Units | % Housing Units |
| Owner Occupied Housing Units | 116 | 80.0% |
| Renter-Occupied Housing Units | 29 | 20.0% |
| Total Occupied Housing Units | 145 | 100.0% |
Occupancy by Household Size in Wells
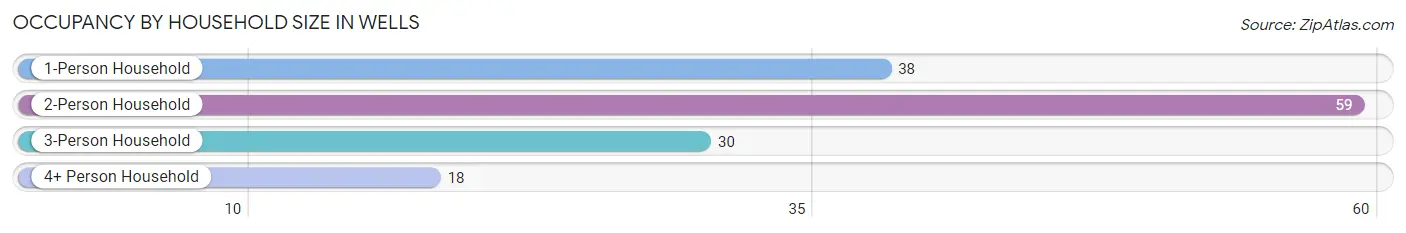
| Household Size | # Housing Units | % Housing Units |
| 1-Person Household | 38 | 26.2% |
| 2-Person Household | 59 | 40.7% |
| 3-Person Household | 30 | 20.7% |
| 4+ Person Household | 18 | 12.4% |
| Total Housing Units | 145 | 100.0% |
Occupancy by Ownership by Household Size in Wells
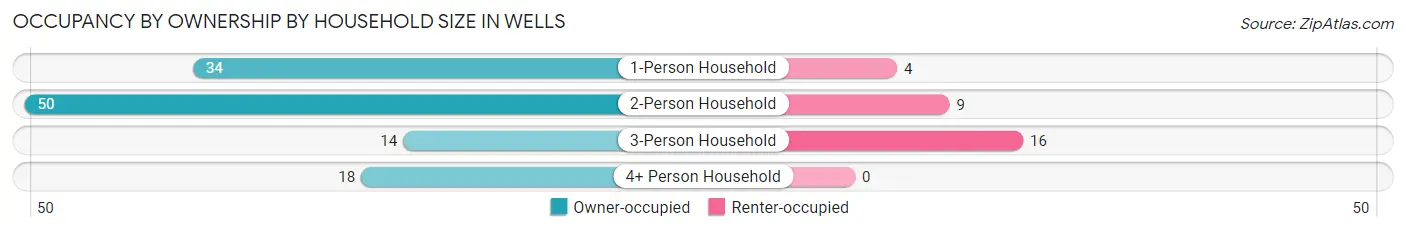
| Household Size | Owner-occupied | Renter-occupied |
| 1-Person Household | 34 (89.5%) | 4 (10.5%) |
| 2-Person Household | 50 (84.8%) | 9 (15.2%) |
| 3-Person Household | 14 (46.7%) | 16 (53.3%) |
| 4+ Person Household | 18 (100.0%) | 0 (0.0%) |
| Total Housing Units | 116 (80.0%) | 29 (20.0%) |
Occupancy by Educational Attainment in Wells
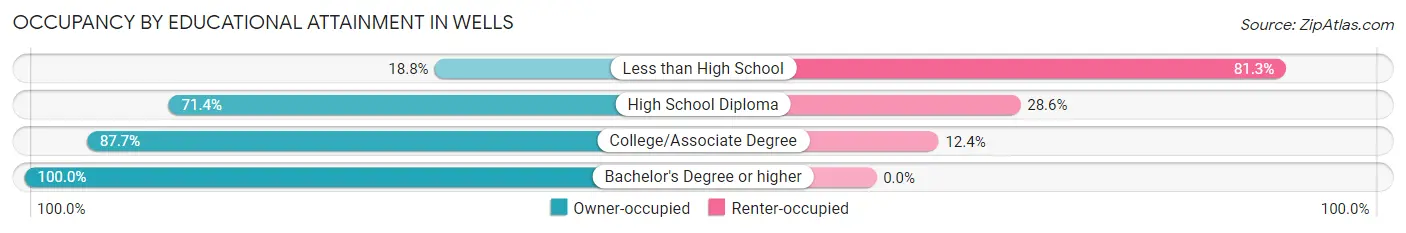
| Household Size | Owner-occupied | Renter-occupied |
| Less than High School | 3 (18.8%) | 13 (81.2%) |
| High School Diploma | 15 (71.4%) | 6 (28.6%) |
| College/Associate Degree | 71 (87.6%) | 10 (12.3%) |
| Bachelor's Degree or higher | 27 (100.0%) | 0 (0.0%) |
Occupancy by Age of Householder in Wells
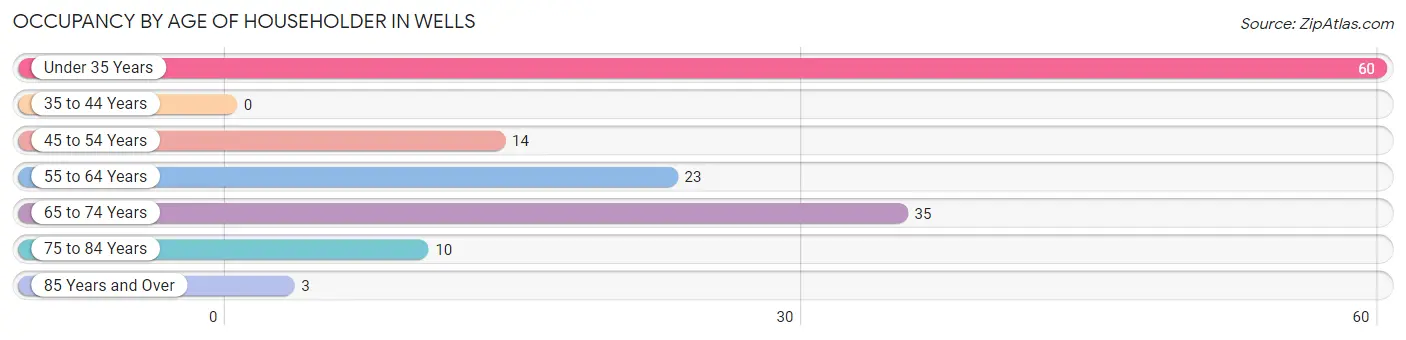
| Age Bracket | # Households | % Households |
| Under 35 Years | 60 | 41.4% |
| 35 to 44 Years | 0 | 0.0% |
| 45 to 54 Years | 14 | 9.7% |
| 55 to 64 Years | 23 | 15.9% |
| 65 to 74 Years | 35 | 24.1% |
| 75 to 84 Years | 10 | 6.9% |
| 85 Years and Over | 3 | 2.1% |
| Total | 145 | 100.0% |
Housing Finances in Wells
Median Income by Occupancy in Wells
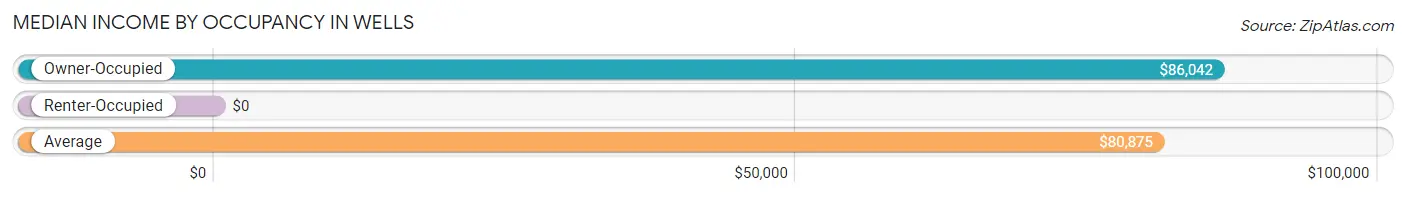
| Occupancy Type | # Households | Median Income |
| Owner-Occupied | 116 (80.0%) | $86,042 |
| Renter-Occupied | 29 (20.0%) | $0 |
| Average | 145 (100.0%) | $80,875 |
Occupancy by Householder Income Bracket in Wells
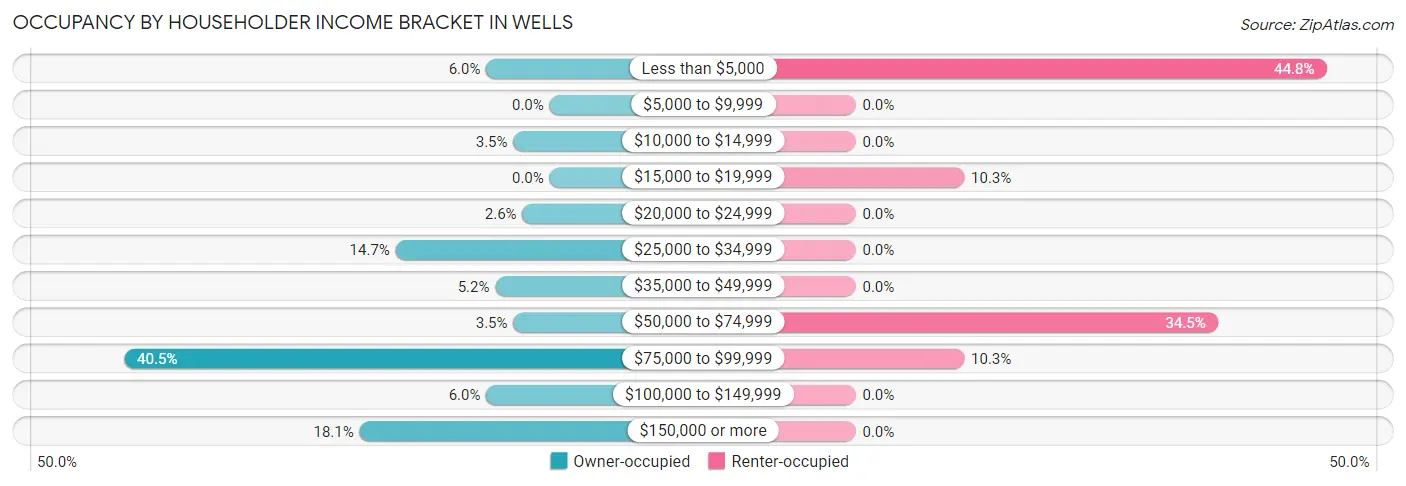
| Income Bracket | Owner-occupied | Renter-occupied |
| Less than $5,000 | 7 (6.0%) | 13 (44.8%) |
| $5,000 to $9,999 | 0 (0.0%) | 0 (0.0%) |
| $10,000 to $14,999 | 4 (3.5%) | 0 (0.0%) |
| $15,000 to $19,999 | 0 (0.0%) | 3 (10.3%) |
| $20,000 to $24,999 | 3 (2.6%) | 0 (0.0%) |
| $25,000 to $34,999 | 17 (14.7%) | 0 (0.0%) |
| $35,000 to $49,999 | 6 (5.2%) | 0 (0.0%) |
| $50,000 to $74,999 | 4 (3.5%) | 10 (34.5%) |
| $75,000 to $99,999 | 47 (40.5%) | 3 (10.3%) |
| $100,000 to $149,999 | 7 (6.0%) | 0 (0.0%) |
| $150,000 or more | 21 (18.1%) | 0 (0.0%) |
| Total | 116 (100.0%) | 29 (100.0%) |
Monthly Housing Cost Tiers in Wells
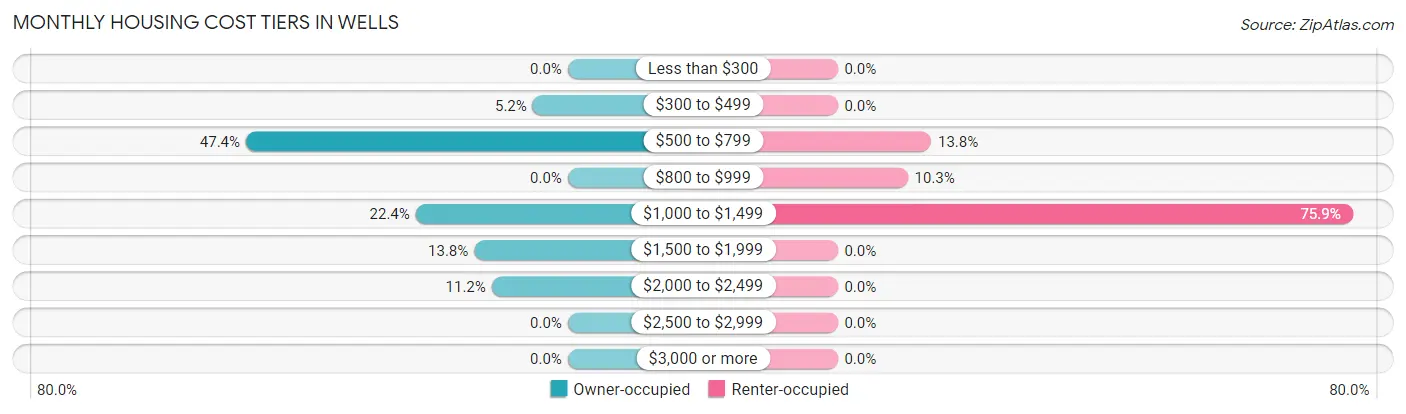
| Monthly Cost | Owner-occupied | Renter-occupied |
| Less than $300 | 0 (0.0%) | 0 (0.0%) |
| $300 to $499 | 6 (5.2%) | 0 (0.0%) |
| $500 to $799 | 55 (47.4%) | 4 (13.8%) |
| $800 to $999 | 0 (0.0%) | 3 (10.3%) |
| $1,000 to $1,499 | 26 (22.4%) | 22 (75.9%) |
| $1,500 to $1,999 | 16 (13.8%) | 0 (0.0%) |
| $2,000 to $2,499 | 13 (11.2%) | 0 (0.0%) |
| $2,500 to $2,999 | 0 (0.0%) | 0 (0.0%) |
| $3,000 or more | 0 (0.0%) | 0 (0.0%) |
| Total | 116 (100.0%) | 29 (100.0%) |
Physical Housing Characteristics in Wells
Housing Structures in Wells
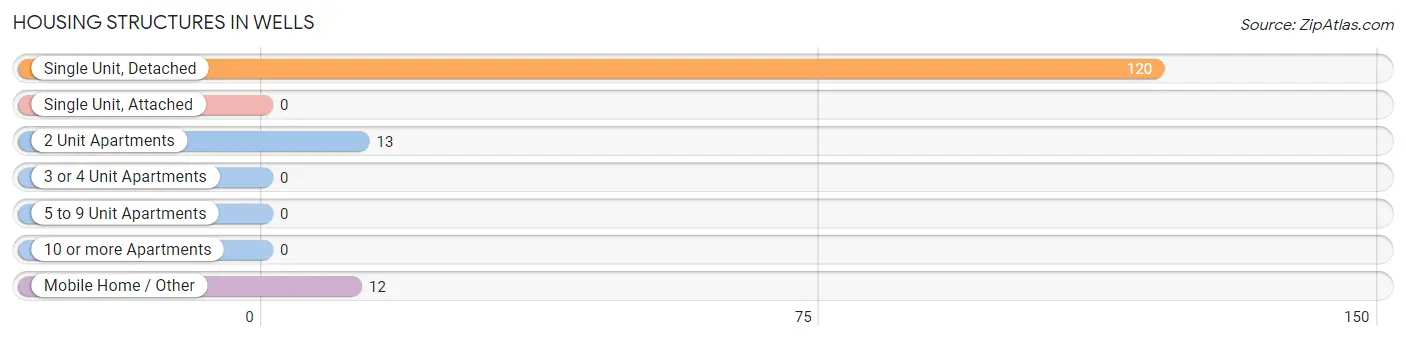
| Structure Type | # Housing Units | % Housing Units |
| Single Unit, Detached | 120 | 82.8% |
| Single Unit, Attached | 0 | 0.0% |
| 2 Unit Apartments | 13 | 9.0% |
| 3 or 4 Unit Apartments | 0 | 0.0% |
| 5 to 9 Unit Apartments | 0 | 0.0% |
| 10 or more Apartments | 0 | 0.0% |
| Mobile Home / Other | 12 | 8.3% |
| Total | 145 | 100.0% |
Housing Structures by Occupancy in Wells
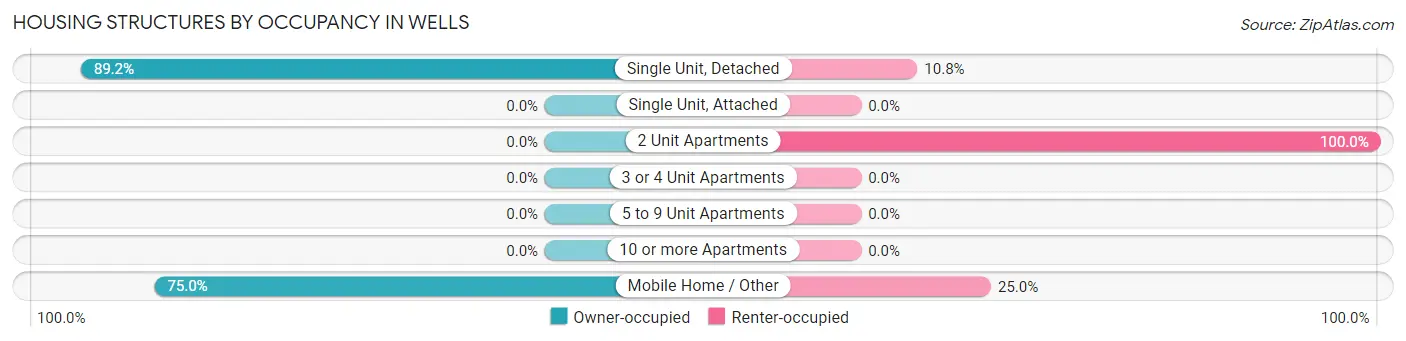
| Structure Type | Owner-occupied | Renter-occupied |
| Single Unit, Detached | 107 (89.2%) | 13 (10.8%) |
| Single Unit, Attached | 0 (0.0%) | 0 (0.0%) |
| 2 Unit Apartments | 0 (0.0%) | 13 (100.0%) |
| 3 or 4 Unit Apartments | 0 (0.0%) | 0 (0.0%) |
| 5 to 9 Unit Apartments | 0 (0.0%) | 0 (0.0%) |
| 10 or more Apartments | 0 (0.0%) | 0 (0.0%) |
| Mobile Home / Other | 9 (75.0%) | 3 (25.0%) |
| Total | 116 (80.0%) | 29 (20.0%) |
Housing Structures by Number of Rooms in Wells
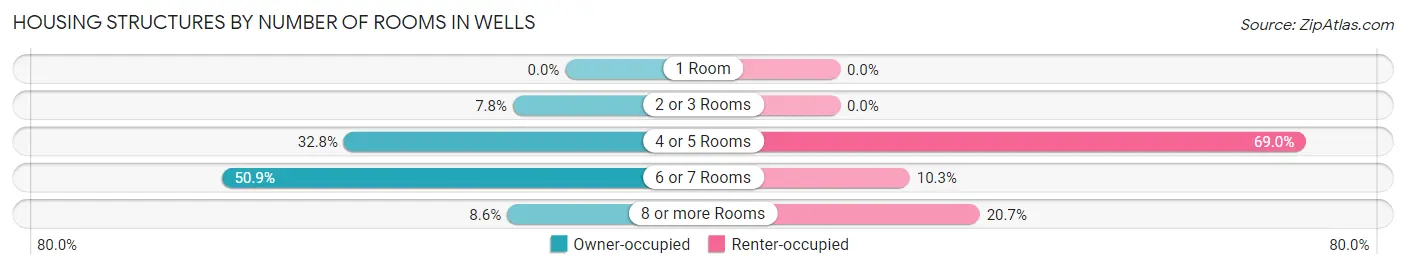
| Number of Rooms | Owner-occupied | Renter-occupied |
| 1 Room | 0 (0.0%) | 0 (0.0%) |
| 2 or 3 Rooms | 9 (7.8%) | 0 (0.0%) |
| 4 or 5 Rooms | 38 (32.8%) | 20 (69.0%) |
| 6 or 7 Rooms | 59 (50.9%) | 3 (10.3%) |
| 8 or more Rooms | 10 (8.6%) | 6 (20.7%) |
| Total | 116 (100.0%) | 29 (100.0%) |
Housing Structure by Heating Type in Wells
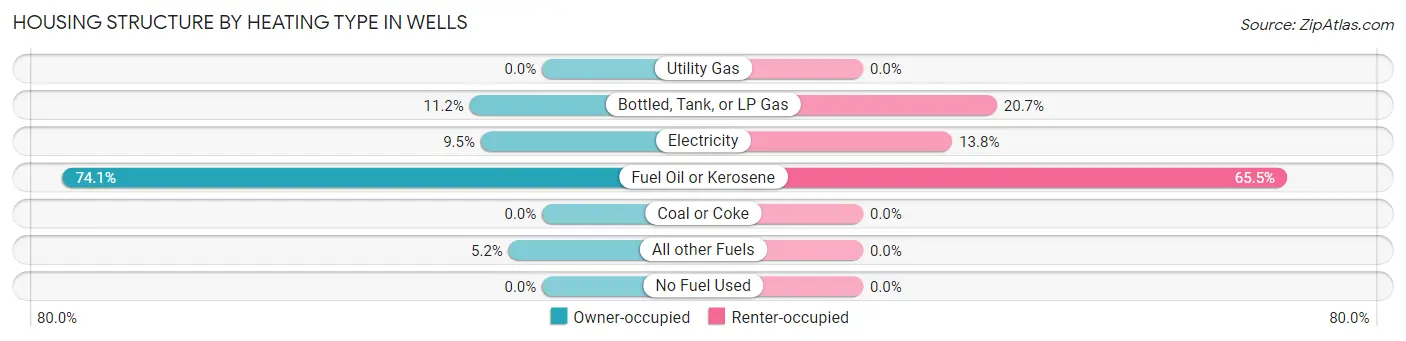
| Heating Type | Owner-occupied | Renter-occupied |
| Utility Gas | 0 (0.0%) | 0 (0.0%) |
| Bottled, Tank, or LP Gas | 13 (11.2%) | 6 (20.7%) |
| Electricity | 11 (9.5%) | 4 (13.8%) |
| Fuel Oil or Kerosene | 86 (74.1%) | 19 (65.5%) |
| Coal or Coke | 0 (0.0%) | 0 (0.0%) |
| All other Fuels | 6 (5.2%) | 0 (0.0%) |
| No Fuel Used | 0 (0.0%) | 0 (0.0%) |
| Total | 116 (100.0%) | 29 (100.0%) |
Household Vehicle Usage in Wells
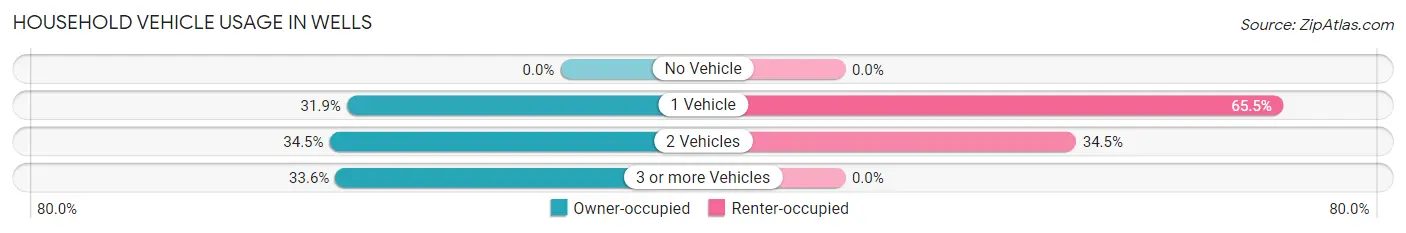
| Vehicles per Household | Owner-occupied | Renter-occupied |
| No Vehicle | 0 (0.0%) | 0 (0.0%) |
| 1 Vehicle | 37 (31.9%) | 19 (65.5%) |
| 2 Vehicles | 40 (34.5%) | 10 (34.5%) |
| 3 or more Vehicles | 39 (33.6%) | 0 (0.0%) |
| Total | 116 (100.0%) | 29 (100.0%) |
Real Estate & Mortgages in Wells
Real Estate and Mortgage Overview in Wells
| Characteristic | Without Mortgage | With Mortgage |
| Housing Units | 47 | 69 |
| Median Property Value | $196,900 | $162,500 |
| Median Household Income | - | - |
| Monthly Housing Costs | $583 | $0 |
| Real Estate Taxes | $2,904 | $0 |
Property Value by Mortgage Status in Wells
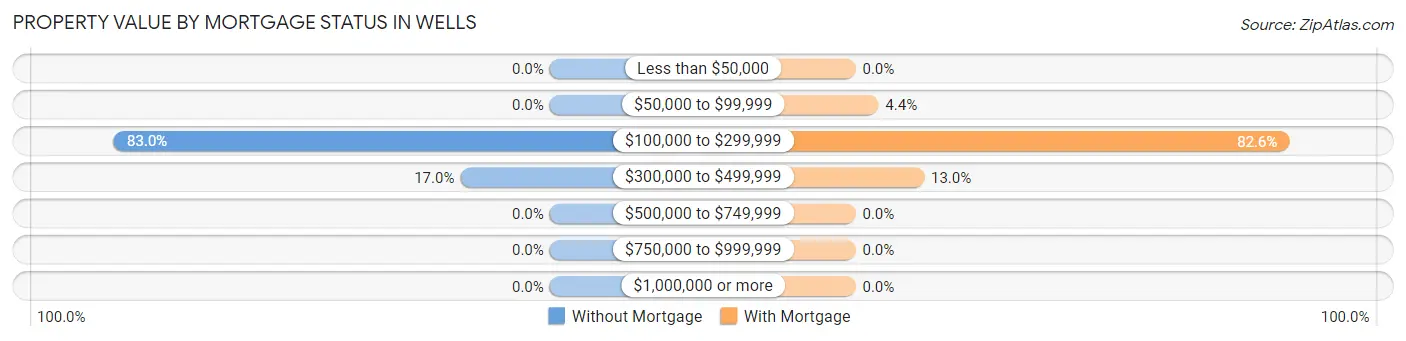
| Property Value | Without Mortgage | With Mortgage |
| Less than $50,000 | 0 (0.0%) | 0 (0.0%) |
| $50,000 to $99,999 | 0 (0.0%) | 3 (4.3%) |
| $100,000 to $299,999 | 39 (83.0%) | 57 (82.6%) |
| $300,000 to $499,999 | 8 (17.0%) | 9 (13.0%) |
| $500,000 to $749,999 | 0 (0.0%) | 0 (0.0%) |
| $750,000 to $999,999 | 0 (0.0%) | 0 (0.0%) |
| $1,000,000 or more | 0 (0.0%) | 0 (0.0%) |
| Total | 47 (100.0%) | 69 (100.0%) |
Household Income by Mortgage Status in Wells
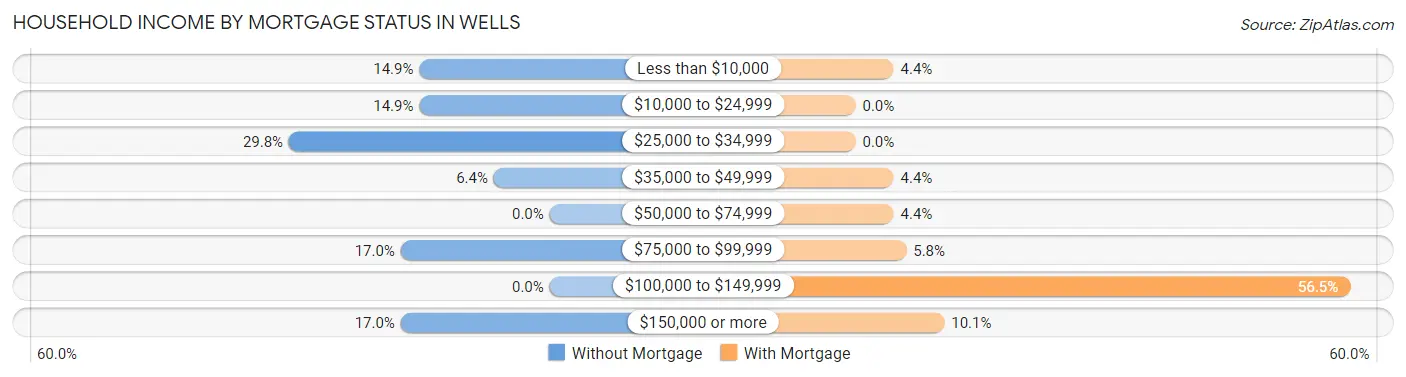
| Household Income | Without Mortgage | With Mortgage |
| Less than $10,000 | 7 (14.9%) | 3 (4.3%) |
| $10,000 to $24,999 | 7 (14.9%) | 0 (0.0%) |
| $25,000 to $34,999 | 14 (29.8%) | 0 (0.0%) |
| $35,000 to $49,999 | 3 (6.4%) | 3 (4.3%) |
| $50,000 to $74,999 | 0 (0.0%) | 3 (4.3%) |
| $75,000 to $99,999 | 8 (17.0%) | 4 (5.8%) |
| $100,000 to $149,999 | 0 (0.0%) | 39 (56.5%) |
| $150,000 or more | 8 (17.0%) | 7 (10.1%) |
| Total | 47 (100.0%) | 69 (100.0%) |
Property Value to Household Income Ratio in Wells
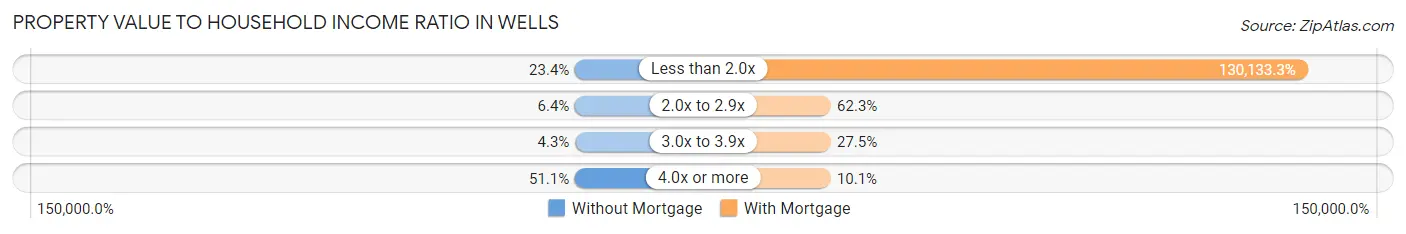
| Value-to-Income Ratio | Without Mortgage | With Mortgage |
| Less than 2.0x | 11 (23.4%) | 89,792 (130,133.3%) |
| 2.0x to 2.9x | 3 (6.4%) | 43 (62.3%) |
| 3.0x to 3.9x | 2 (4.3%) | 19 (27.5%) |
| 4.0x or more | 24 (51.1%) | 7 (10.1%) |
| Total | 47 (100.0%) | 69 (100.0%) |
Real Estate Taxes by Mortgage Status in Wells
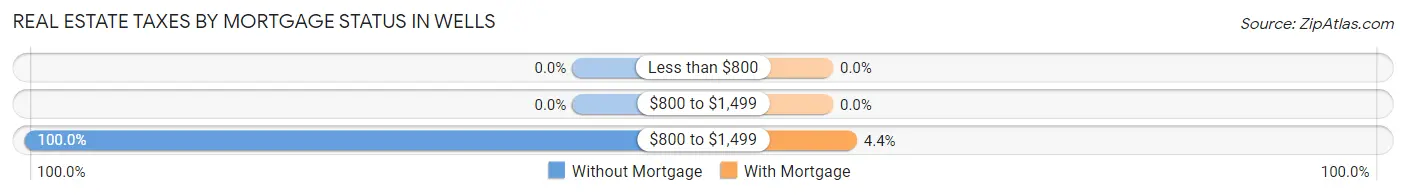
| Property Taxes | Without Mortgage | With Mortgage |
| Less than $800 | 0 (0.0%) | 0 (0.0%) |
| $800 to $1,499 | 0 (0.0%) | 0 (0.0%) |
| $800 to $1,499 | 47 (100.0%) | 3 (4.3%) |
| Total | 47 (100.0%) | 69 (100.0%) |
Health & Disability in Wells
Health Insurance Coverage by Age in Wells
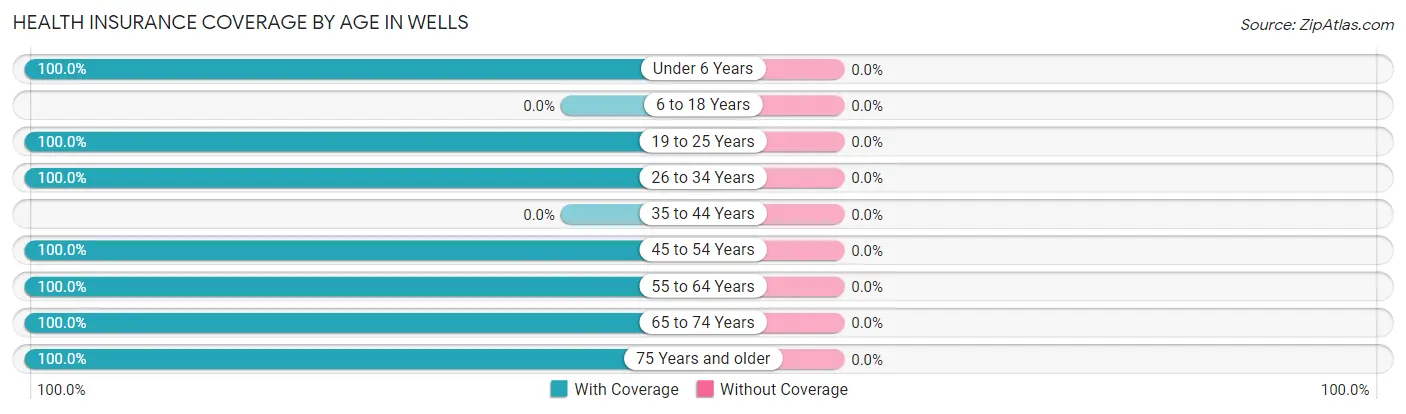
| Age Bracket | With Coverage | Without Coverage |
| Under 6 Years | 36 (100.0%) | 0 (0.0%) |
| 6 to 18 Years | 0 (0.0%) | 0 (0.0%) |
| 19 to 25 Years | 57 (100.0%) | 0 (0.0%) |
| 26 to 34 Years | 143 (100.0%) | 0 (0.0%) |
| 35 to 44 Years | 0 (0.0%) | 0 (0.0%) |
| 45 to 54 Years | 29 (100.0%) | 0 (0.0%) |
| 55 to 64 Years | 41 (100.0%) | 0 (0.0%) |
| 65 to 74 Years | 44 (100.0%) | 0 (0.0%) |
| 75 Years and older | 19 (100.0%) | 0 (0.0%) |
| Total | 369 (100.0%) | 0 (0.0%) |
Health Insurance Coverage by Citizenship Status in Wells
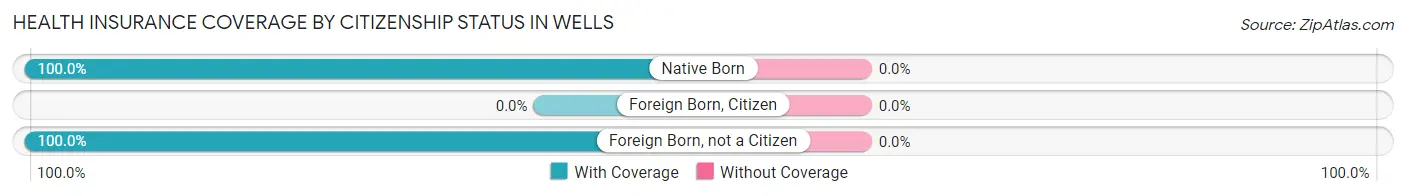
| Citizenship Status | With Coverage | Without Coverage |
| Native Born | 36 (100.0%) | 0 (0.0%) |
| Foreign Born, Citizen | 0 (0.0%) | 0 (0.0%) |
| Foreign Born, not a Citizen | 57 (100.0%) | 0 (0.0%) |
Health Insurance Coverage by Household Income in Wells
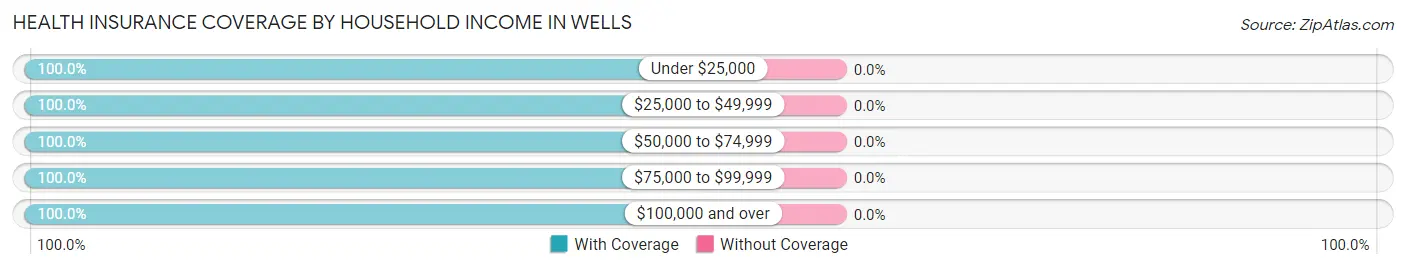
| Household Income | With Coverage | Without Coverage |
| Under $25,000 | 64 (100.0%) | 0 (0.0%) |
| $25,000 to $49,999 | 32 (100.0%) | 0 (0.0%) |
| $50,000 to $74,999 | 26 (100.0%) | 0 (0.0%) |
| $75,000 to $99,999 | 157 (100.0%) | 0 (0.0%) |
| $100,000 and over | 90 (100.0%) | 0 (0.0%) |
Public vs Private Health Insurance Coverage by Age in Wells
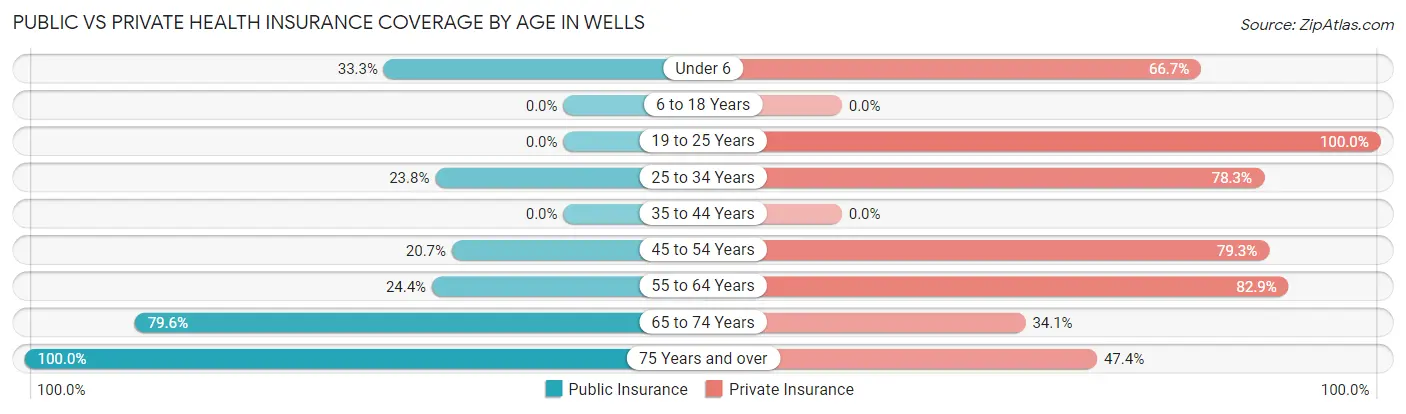
| Age Bracket | Public Insurance | Private Insurance |
| Under 6 | 12 (33.3%) | 24 (66.7%) |
| 6 to 18 Years | 0 (0.0%) | 0 (0.0%) |
| 19 to 25 Years | 0 (0.0%) | 57 (100.0%) |
| 25 to 34 Years | 34 (23.8%) | 112 (78.3%) |
| 35 to 44 Years | 0 (0.0%) | 0 (0.0%) |
| 45 to 54 Years | 6 (20.7%) | 23 (79.3%) |
| 55 to 64 Years | 10 (24.4%) | 34 (82.9%) |
| 65 to 74 Years | 35 (79.5%) | 15 (34.1%) |
| 75 Years and over | 19 (100.0%) | 9 (47.4%) |
| Total | 116 (31.4%) | 274 (74.3%) |
Disability Status by Sex by Age in Wells
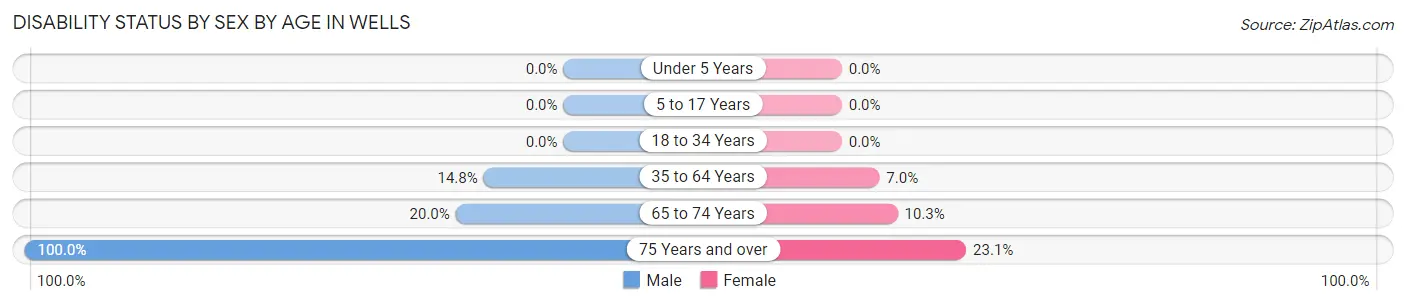
| Age Bracket | Male | Female |
| Under 5 Years | 0 (0.0%) | 0 (0.0%) |
| 5 to 17 Years | 0 (0.0%) | 0 (0.0%) |
| 18 to 34 Years | 0 (0.0%) | 0 (0.0%) |
| 35 to 64 Years | 4 (14.8%) | 3 (7.0%) |
| 65 to 74 Years | 3 (20.0%) | 3 (10.3%) |
| 75 Years and over | 6 (100.0%) | 3 (23.1%) |
Disability Class by Sex by Age in Wells
Disability Class: Hearing Difficulty
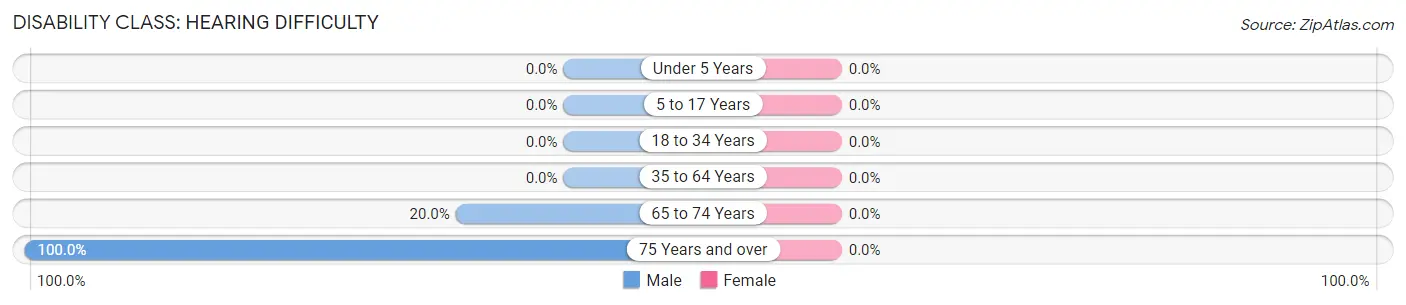
| Age Bracket | Male | Female |
| Under 5 Years | 0 (0.0%) | 0 (0.0%) |
| 5 to 17 Years | 0 (0.0%) | 0 (0.0%) |
| 18 to 34 Years | 0 (0.0%) | 0 (0.0%) |
| 35 to 64 Years | 0 (0.0%) | 0 (0.0%) |
| 65 to 74 Years | 3 (20.0%) | 0 (0.0%) |
| 75 Years and over | 6 (100.0%) | 0 (0.0%) |
Disability Class: Vision Difficulty
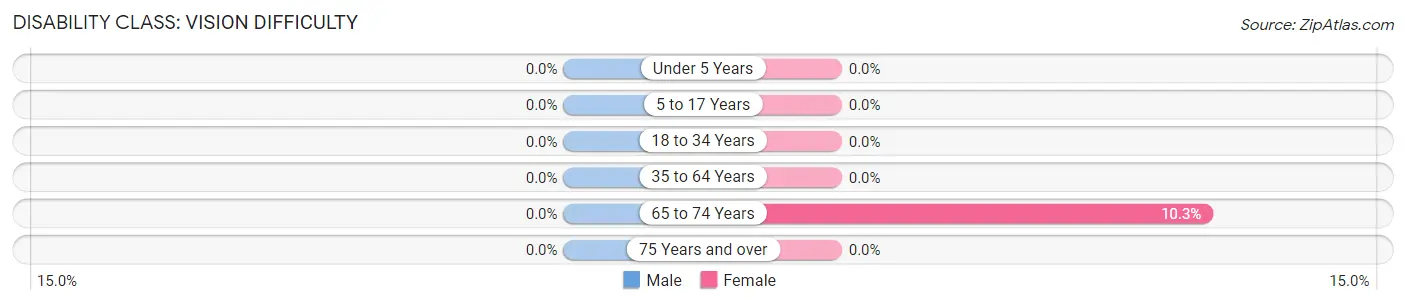
| Age Bracket | Male | Female |
| Under 5 Years | 0 (0.0%) | 0 (0.0%) |
| 5 to 17 Years | 0 (0.0%) | 0 (0.0%) |
| 18 to 34 Years | 0 (0.0%) | 0 (0.0%) |
| 35 to 64 Years | 0 (0.0%) | 0 (0.0%) |
| 65 to 74 Years | 0 (0.0%) | 3 (10.3%) |
| 75 Years and over | 0 (0.0%) | 0 (0.0%) |
Disability Class: Cognitive Difficulty
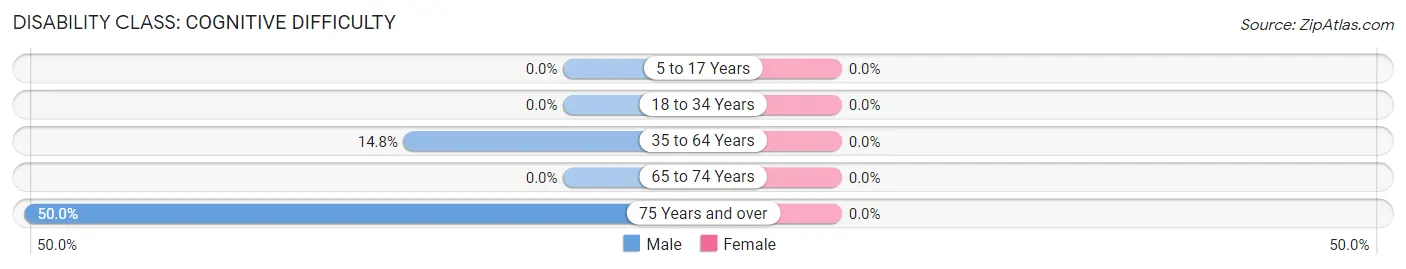
| Age Bracket | Male | Female |
| 5 to 17 Years | 0 (0.0%) | 0 (0.0%) |
| 18 to 34 Years | 0 (0.0%) | 0 (0.0%) |
| 35 to 64 Years | 4 (14.8%) | 0 (0.0%) |
| 65 to 74 Years | 0 (0.0%) | 0 (0.0%) |
| 75 Years and over | 3 (50.0%) | 0 (0.0%) |
Disability Class: Ambulatory Difficulty
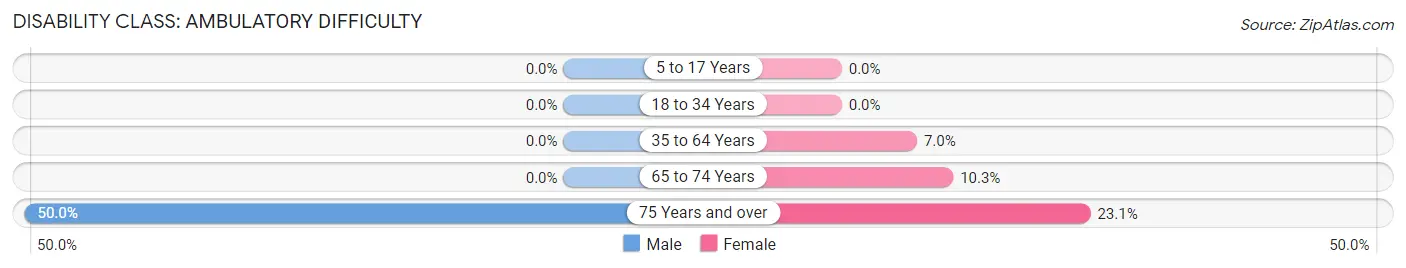
| Age Bracket | Male | Female |
| 5 to 17 Years | 0 (0.0%) | 0 (0.0%) |
| 18 to 34 Years | 0 (0.0%) | 0 (0.0%) |
| 35 to 64 Years | 0 (0.0%) | 3 (7.0%) |
| 65 to 74 Years | 0 (0.0%) | 3 (10.3%) |
| 75 Years and over | 3 (50.0%) | 3 (23.1%) |
Disability Class: Self-Care Difficulty
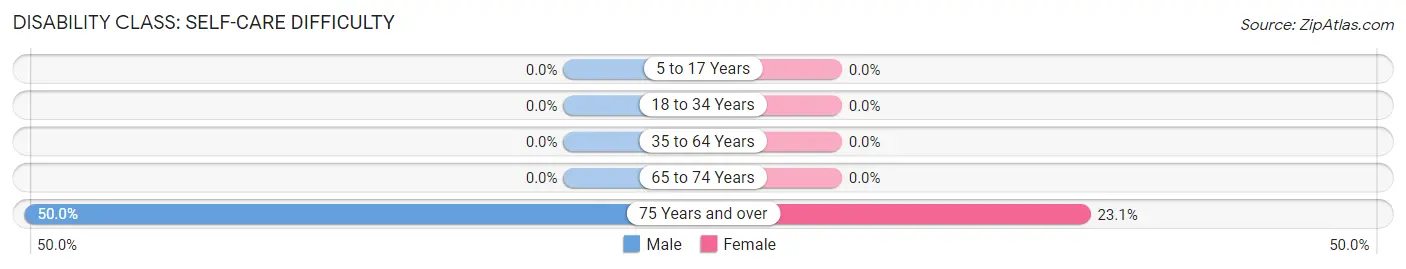
| Age Bracket | Male | Female |
| 5 to 17 Years | 0 (0.0%) | 0 (0.0%) |
| 18 to 34 Years | 0 (0.0%) | 0 (0.0%) |
| 35 to 64 Years | 0 (0.0%) | 0 (0.0%) |
| 65 to 74 Years | 0 (0.0%) | 0 (0.0%) |
| 75 Years and over | 3 (50.0%) | 3 (23.1%) |
Technology Access in Wells
Computing Device Access in Wells
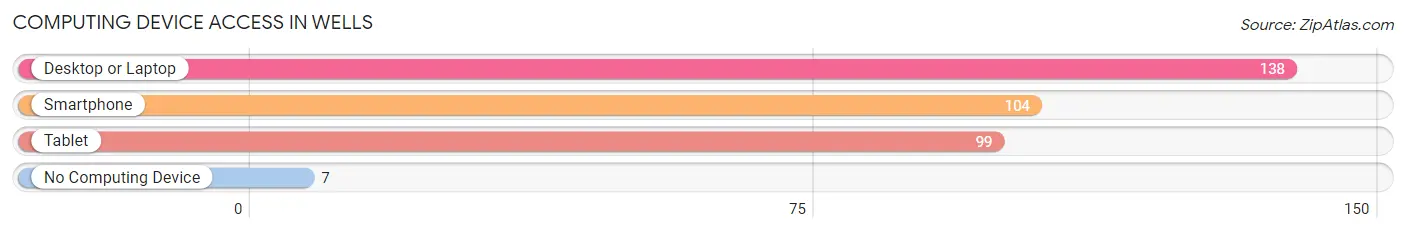
| Device Type | # Households | % Households |
| Desktop or Laptop | 138 | 95.2% |
| Smartphone | 104 | 71.7% |
| Tablet | 99 | 68.3% |
| No Computing Device | 7 | 4.8% |
| Total | 145 | 100.0% |
Internet Access in Wells
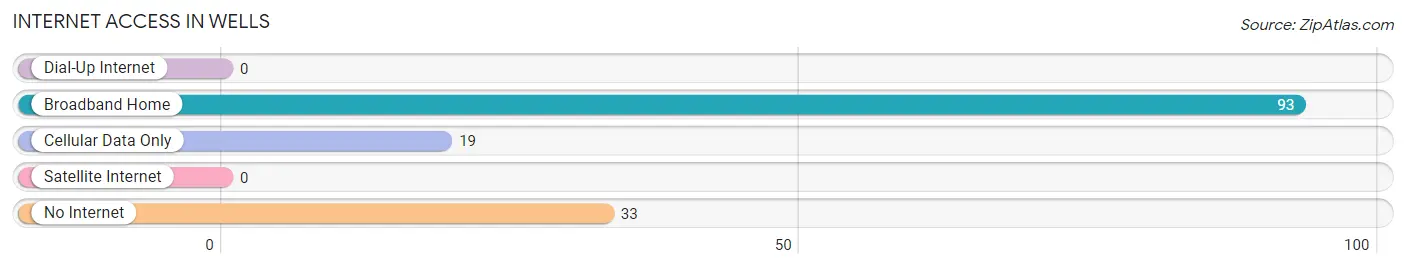
| Internet Type | # Households | % Households |
| Dial-Up Internet | 0 | 0.0% |
| Broadband Home | 93 | 64.1% |
| Cellular Data Only | 19 | 13.1% |
| Satellite Internet | 0 | 0.0% |
| No Internet | 33 | 22.8% |
| Total | 145 | 100.0% |
Wells Summary
Wells is a small town located in the state of Vermont, in the United States of America. It is situated in the northern part of the state, in the county of Rutland. The town has a population of approximately 1,400 people, and is located in the Green Mountains.
History
The town of Wells was first settled in 1780 by a group of settlers from Massachusetts. The town was named after the Wells family, who were among the first settlers. The town was incorporated in 1781, and the first town meeting was held in 1782.
The town of Wells was originally an agricultural community, with the main crops being wheat, corn, and potatoes. The town also had a number of sawmills, gristmills, and tanneries. In the late 19th century, the town began to develop a tourism industry, with the opening of several hotels and resorts.
Geography
Wells is located in the northern part of Vermont, in the county of Rutland. The town is situated in the Green Mountains, and is surrounded by the towns of Killington, Pittsfield, and Stockbridge. The town is located at an elevation of 1,400 feet above sea level.
The town of Wells is located in a rural area, and is surrounded by forests and mountains. The town is located near several lakes, including Lake St. Catherine, Lake Bomoseen, and Lake Hortonia. The town is also located near several ski resorts, including Killington, Pico, and Okemo.
Economy
The economy of Wells is largely based on tourism and agriculture. The town is home to several ski resorts, which attract visitors from all over the world. The town also has several farms, which produce a variety of crops, including wheat, corn, and potatoes.
The town also has several businesses, including restaurants, retail stores, and lodging establishments. The town also has a number of art galleries, which feature the work of local artists.
Demographics
As of the 2010 census, the population of Wells was 1,400 people. The town has a median household income of $45,000, and a median family income of $50,000. The town has a population that is predominantly white, with a small percentage of African Americans, Hispanics, and Asians.
The town of Wells is served by the Rutland County School District, which includes several elementary schools, a middle school, and a high school. The town also has a library, a post office, and a number of churches.
Conclusion
Wells is a small town located in the state of Vermont, in the United States of America. The town has a population of approximately 1,400 people, and is located in the Green Mountains. The town has a largely agricultural and tourism-based economy, and is served by the Rutland County School District. The town has a predominantly white population, with a small percentage of African Americans, Hispanics, and Asians.
Common Questions
What is Per Capita Income in Wells?
Per Capita income in Wells is $37,091.
What is the Median Family Income in Wells?
Median Family Income in Wells is $86,979.
What is the Median Household income in Wells?
Median Household Income in Wells is $80,875.
What is Income or Wage Gap in Wells?
Income or Wage Gap in Wells is 27.2%.
Women in Wells earn 72.8 cents for every dollar earned by a man.
What is Inequality or Gini Index in Wells?
Inequality or Gini Index in Wells is 0.46.
What is the Total Population of Wells?
Total Population of Wells is 369.
What is the Total Male Population of Wells?
Total Male Population of Wells is 164.
What is the Total Female Population of Wells?
Total Female Population of Wells is 205.
What is the Ratio of Males per 100 Females in Wells?
There are 80.00 Males per 100 Females in Wells.
What is the Ratio of Females per 100 Males in Wells?
There are 125.00 Females per 100 Males in Wells.
What is the Median Population Age in Wells?
Median Population Age in Wells is 30.2 Years.
What is the Average Family Size in Wells
Average Family Size in Wells is 3.0 People.
What is the Average Household Size in Wells
Average Household Size in Wells is 2.5 People.
How Large is the Labor Force in Wells?
There are 224 People in the Labor Forcein in Wells.
What is the Percentage of People in the Labor Force in Wells?
67.3% of People are in the Labor Force in Wells.