Manchester Center, VT Map & Demographics
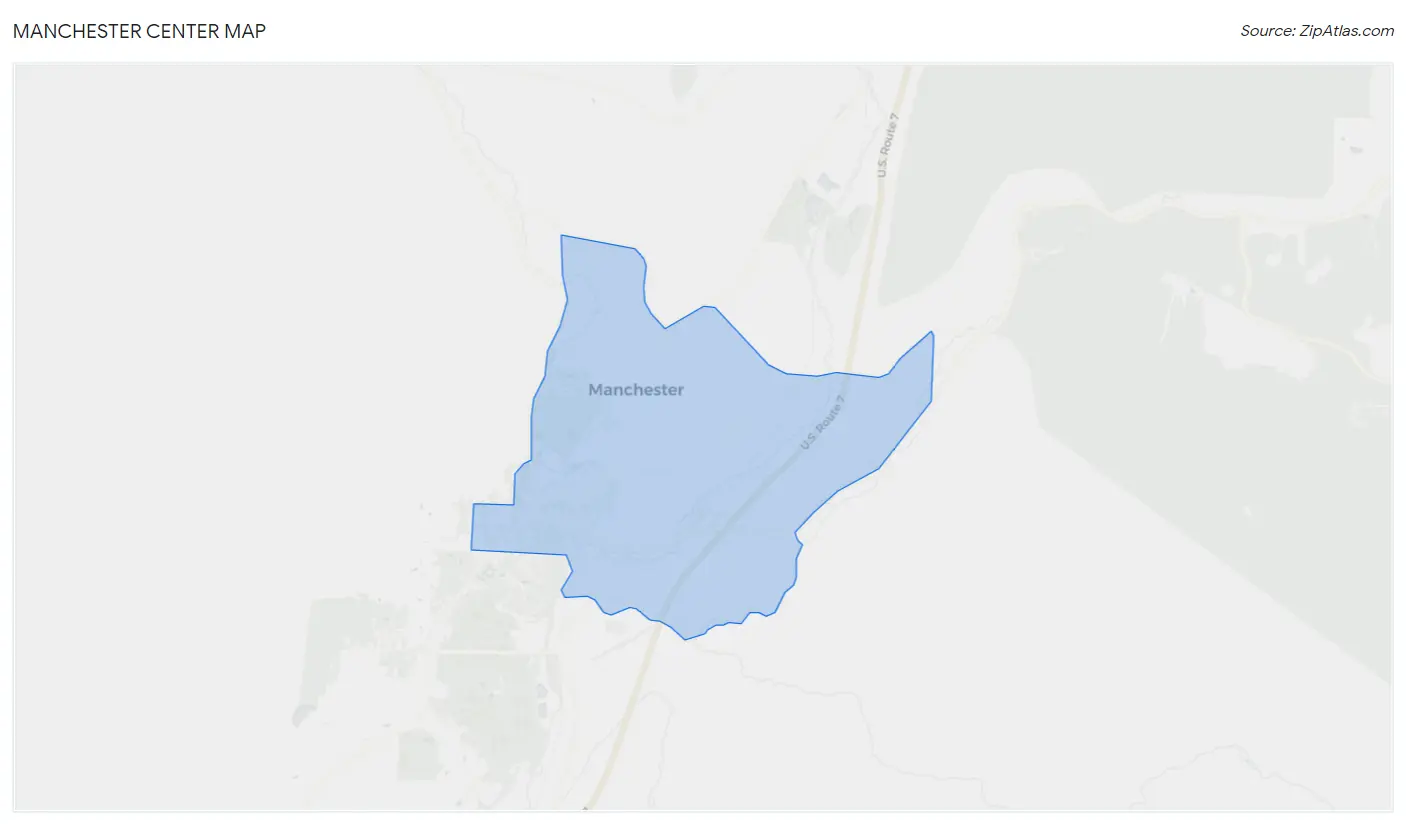
Manchester Center Map
Manchester Center Overview
$40,937
PER CAPITA INCOME
$97,971
AVG FAMILY INCOME
$73,333
AVG HOUSEHOLD INCOME
11.5%
WAGE / INCOME GAP [ % ]
88.5¢/ $1
WAGE / INCOME GAP [ $ ]
0.47
INEQUALITY / GINI INDEX
1,835
TOTAL POPULATION
744
MALE POPULATION
1,091
FEMALE POPULATION
68.19
MALES / 100 FEMALES
146.64
FEMALES / 100 MALES
49.6
MEDIAN AGE
3.0
AVG FAMILY SIZE
2.4
AVG HOUSEHOLD SIZE
981
LABOR FORCE [ PEOPLE ]
66.0%
PERCENT IN LABOR FORCE
3.4%
UNEMPLOYMENT RATE
Manchester Center Zip Codes
Manchester Center Area Codes
Income in Manchester Center
Income Overview in Manchester Center
Per Capita Income in Manchester Center is $40,937, while median incomes of families and households are $97,971 and $73,333 respectively.
| Characteristic | Number | Measure |
| Per Capita Income | 1,835 | $40,937 |
| Median Family Income | 453 | $97,971 |
| Mean Family Income | 453 | $109,667 |
| Median Household Income | 762 | $73,333 |
| Mean Household Income | 762 | $90,181 |
| Income Deficit | 453 | $0 |
| Wage / Income Gap (%) | 1,835 | 11.51% |
| Wage / Income Gap ($) | 1,835 | 88.49¢ per $1 |
| Gini / Inequality Index | 1,835 | 0.47 |
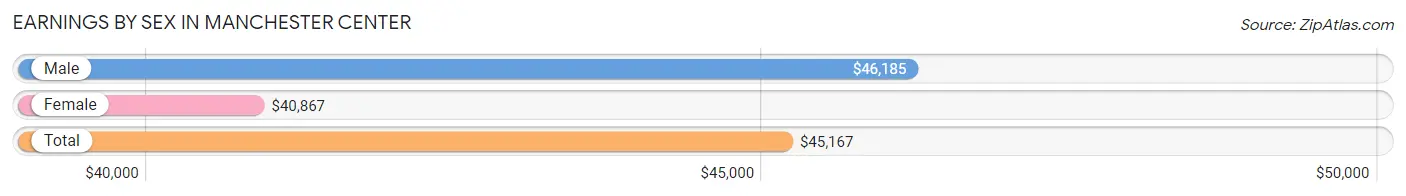
Earnings by Sex in Manchester Center
Average Earnings in Manchester Center are $45,167, $46,185 for men and $40,867 for women, a difference of 11.5%.
| Sex | Number | Average Earnings |
| Male | 500 (48.3%) | $46,185 |
| Female | 536 (51.7%) | $40,867 |
| Total | 1,036 (100.0%) | $45,167 |
Earnings by Sex by Income Bracket in Manchester Center
The most common earnings brackets in Manchester Center are $45,000 to $49,999 for men (135 | 27.0%) and $5,000 to $7,499 for women (106 | 19.8%).
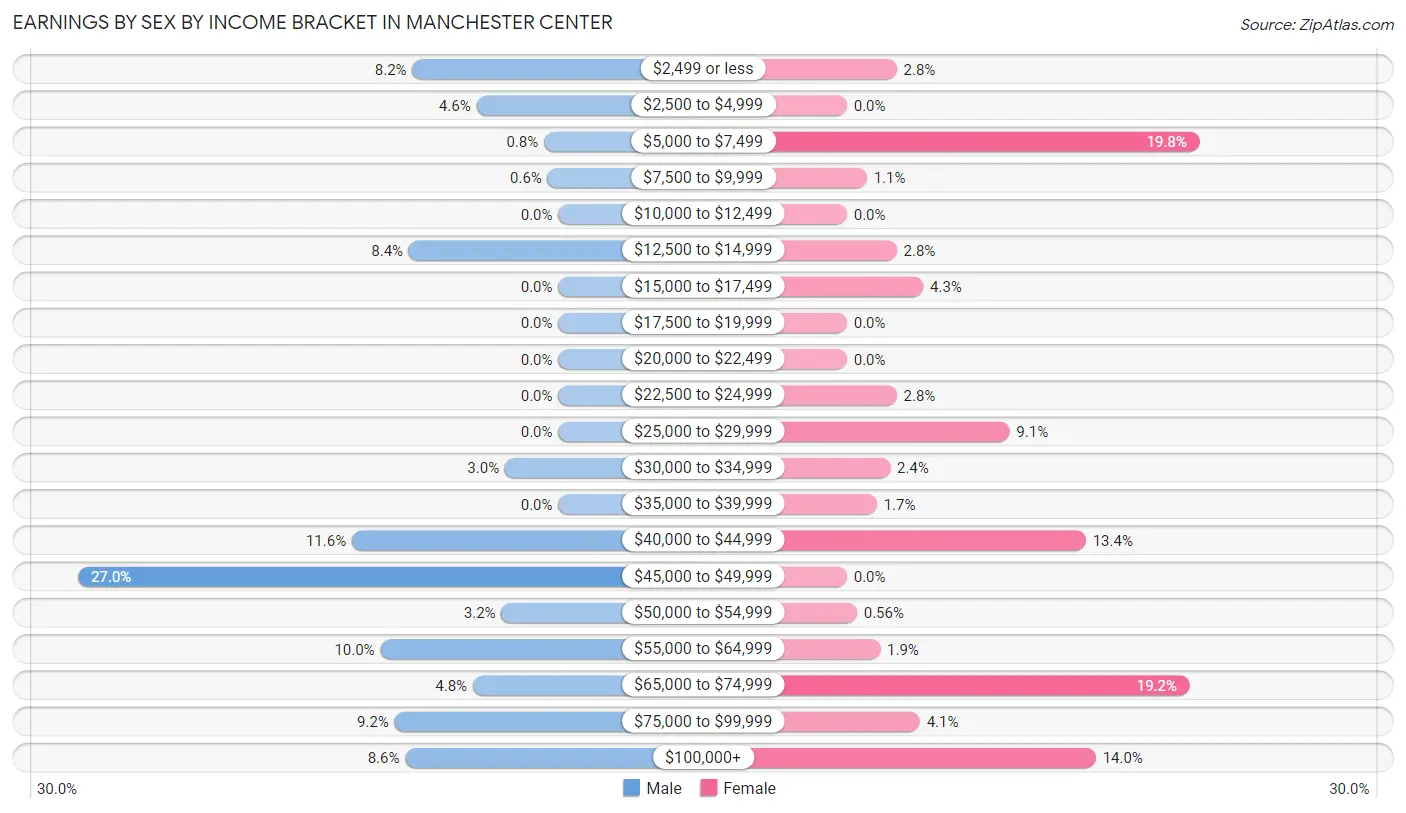
| Income | Male | Female |
| $2,499 or less | 41 (8.2%) | 15 (2.8%) |
| $2,500 to $4,999 | 23 (4.6%) | 0 (0.0%) |
| $5,000 to $7,499 | 4 (0.8%) | 106 (19.8%) |
| $7,500 to $9,999 | 3 (0.6%) | 6 (1.1%) |
| $10,000 to $12,499 | 0 (0.0%) | 0 (0.0%) |
| $12,500 to $14,999 | 42 (8.4%) | 15 (2.8%) |
| $15,000 to $17,499 | 0 (0.0%) | 23 (4.3%) |
| $17,500 to $19,999 | 0 (0.0%) | 0 (0.0%) |
| $20,000 to $22,499 | 0 (0.0%) | 0 (0.0%) |
| $22,500 to $24,999 | 0 (0.0%) | 15 (2.8%) |
| $25,000 to $29,999 | 0 (0.0%) | 49 (9.1%) |
| $30,000 to $34,999 | 15 (3.0%) | 13 (2.4%) |
| $35,000 to $39,999 | 0 (0.0%) | 9 (1.7%) |
| $40,000 to $44,999 | 58 (11.6%) | 72 (13.4%) |
| $45,000 to $49,999 | 135 (27.0%) | 0 (0.0%) |
| $50,000 to $54,999 | 16 (3.2%) | 3 (0.6%) |
| $55,000 to $64,999 | 50 (10.0%) | 10 (1.9%) |
| $65,000 to $74,999 | 24 (4.8%) | 103 (19.2%) |
| $75,000 to $99,999 | 46 (9.2%) | 22 (4.1%) |
| $100,000+ | 43 (8.6%) | 75 (14.0%) |
| Total | 500 (100.0%) | 536 (100.0%) |
Earnings by Sex by Educational Attainment in Manchester Center
Average earnings in Manchester Center are $46,852 for men and $43,043 for women, a difference of 8.1%. Men with an educational attainment of bachelor's degree enjoy the highest average annual earnings of $116,058, while those with high school diploma education earn the least with $46,200. Women with an educational attainment of graduate degree earn the most with the average annual earnings of $100,121, while those with high school diploma education have the smallest earnings of $37,361.
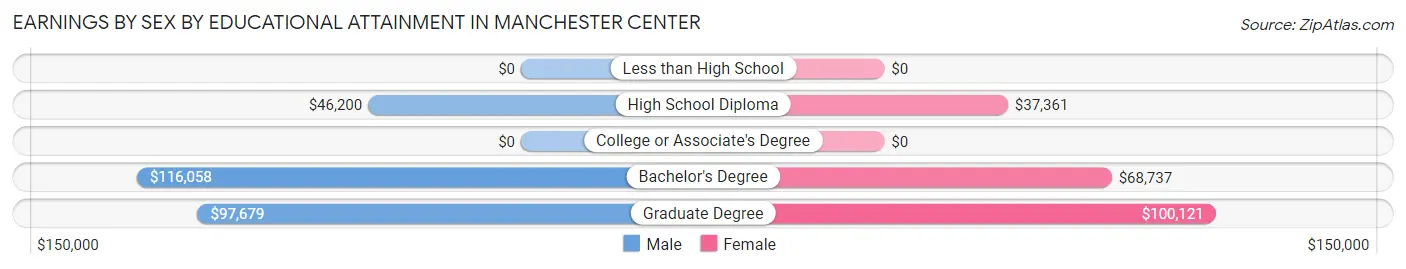
| Educational Attainment | Male Income | Female Income |
| Less than High School | - | - |
| High School Diploma | $46,200 | $37,361 |
| College or Associate's Degree | - | - |
| Bachelor's Degree | $116,058 | $68,737 |
| Graduate Degree | $97,679 | $100,121 |
| Total | $46,852 | $43,043 |
Family Income in Manchester Center
Family Income Brackets in Manchester Center
According to the Manchester Center family income data, there are 113 families falling into the $75,000 to $99,999 income range, which is the most common income bracket and makes up 24.9% of all families.
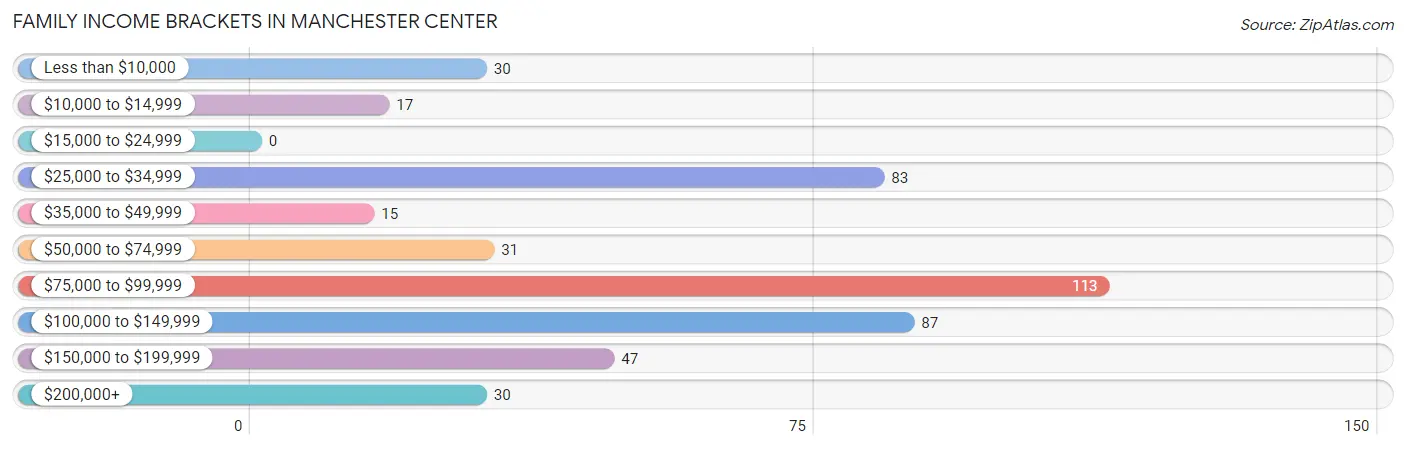
| Income Bracket | # Families | % Families |
| Less than $10,000 | 30 | 6.6% |
| $10,000 to $14,999 | 17 | 3.8% |
| $15,000 to $24,999 | 0 | 0.0% |
| $25,000 to $34,999 | 83 | 18.3% |
| $35,000 to $49,999 | 15 | 3.3% |
| $50,000 to $74,999 | 31 | 6.8% |
| $75,000 to $99,999 | 113 | 24.9% |
| $100,000 to $149,999 | 87 | 19.2% |
| $150,000 to $199,999 | 47 | 10.4% |
| $200,000+ | 30 | 6.6% |
Family Income by Famaliy Size in Manchester Center
2-person families (312 | 68.9%) account for the highest median family income in Manchester Center with $98,539 per family, while 2-person families (312 | 68.9%) have the highest median income of $49,270 per family member.
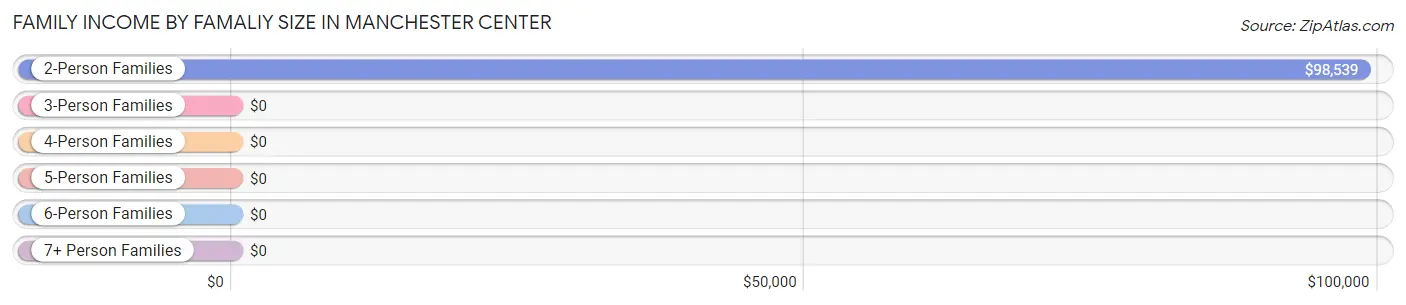
| Income Bracket | # Families | Median Income |
| 2-Person Families | 312 (68.9%) | $98,539 |
| 3-Person Families | 67 (14.8%) | $0 |
| 4-Person Families | 40 (8.8%) | $0 |
| 5-Person Families | 34 (7.5%) | $0 |
| 6-Person Families | 0 (0.0%) | $0 |
| 7+ Person Families | 0 (0.0%) | $0 |
| Total | 453 (100.0%) | $97,971 |
Family Income by Number of Earners in Manchester Center
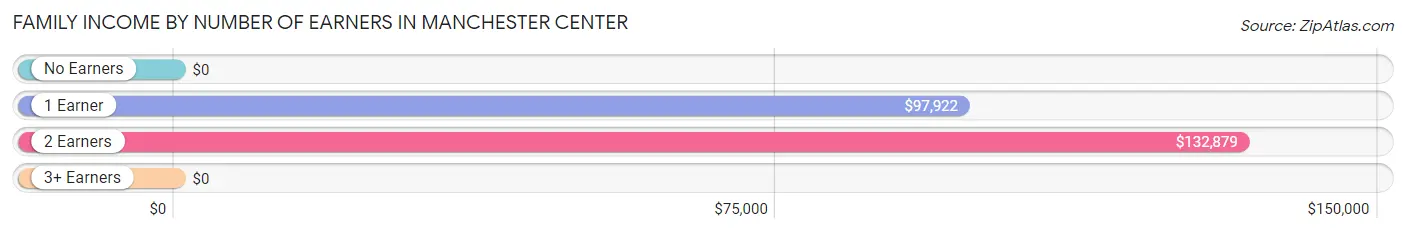
| Number of Earners | # Families | Median Income |
| No Earners | 79 (17.4%) | $0 |
| 1 Earner | 182 (40.2%) | $97,922 |
| 2 Earners | 174 (38.4%) | $132,879 |
| 3+ Earners | 18 (4.0%) | $0 |
| Total | 453 (100.0%) | $97,971 |
Household Income in Manchester Center
Household Income Brackets in Manchester Center
With 162 households falling in the category, the $100,000 to $149,999 income range is the most frequent in Manchester Center, accounting for 21.3% of all households.
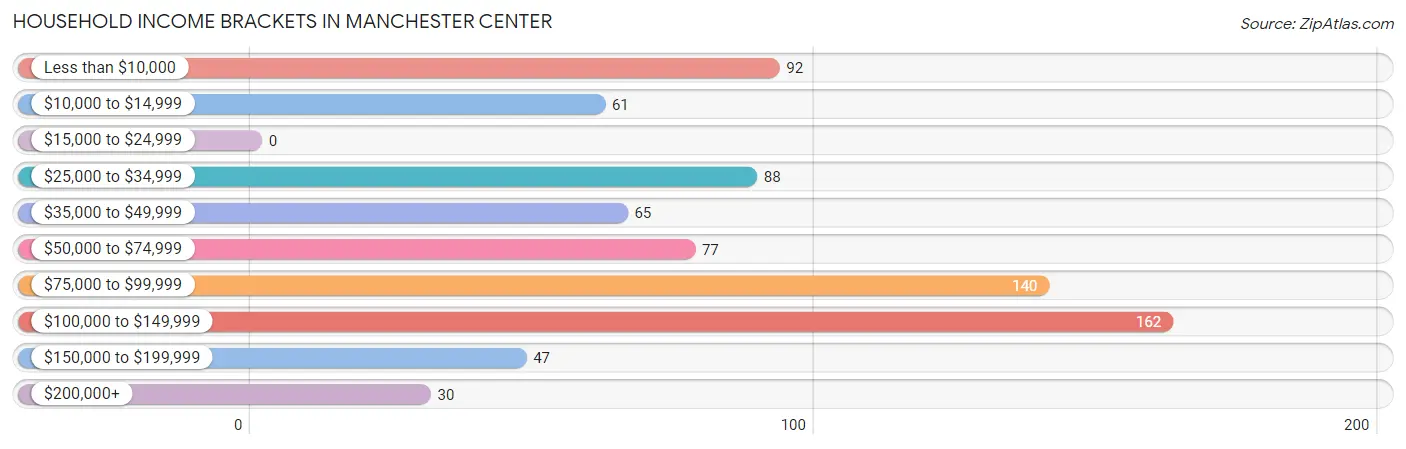
| Income Bracket | # Households | % Households |
| Less than $10,000 | 92 | 12.1% |
| $10,000 to $14,999 | 61 | 8.0% |
| $15,000 to $24,999 | 0 | 0.0% |
| $25,000 to $34,999 | 88 | 11.5% |
| $35,000 to $49,999 | 65 | 8.5% |
| $50,000 to $74,999 | 77 | 10.1% |
| $75,000 to $99,999 | 140 | 18.4% |
| $100,000 to $149,999 | 162 | 21.3% |
| $150,000 to $199,999 | 47 | 6.2% |
| $200,000+ | 30 | 3.9% |
Household Income by Householder Age in Manchester Center
The median household income in Manchester Center is $73,333, with the highest median household income of $99,481 found in the 65+ years age bracket for the primary householder. A total of 292 households (38.3%) fall into this category. Meanwhile, the 15 to 24 years age bracket for the primary householder has the lowest median household income of $0, with 48 households (6.3%) in this group.
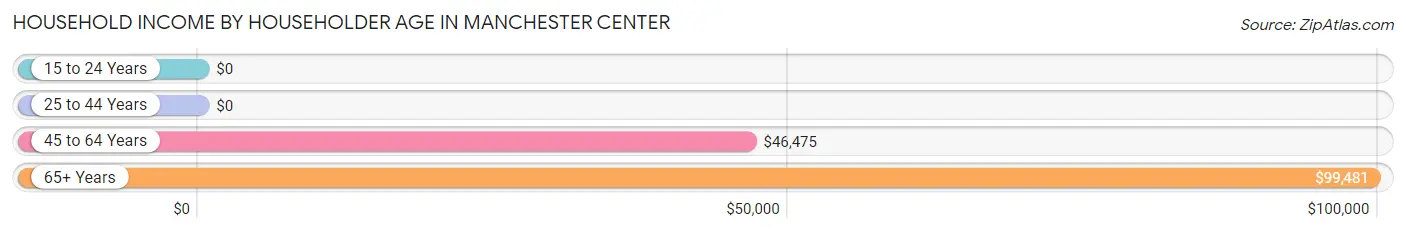
| Income Bracket | # Households | Median Income |
| 15 to 24 Years | 48 (6.3%) | $0 |
| 25 to 44 Years | 125 (16.4%) | $0 |
| 45 to 64 Years | 297 (39.0%) | $46,475 |
| 65+ Years | 292 (38.3%) | $99,481 |
| Total | 762 (100.0%) | $73,333 |
Poverty in Manchester Center
Income Below Poverty by Sex and Age in Manchester Center
With 18.7% poverty level for males and 28.3% for females among the residents of Manchester Center, 25 to 34 year old males and 25 to 34 year old females are the most vulnerable to poverty, with 46 males (49.5%) and 60 females (66.7%) in their respective age groups living below the poverty level.
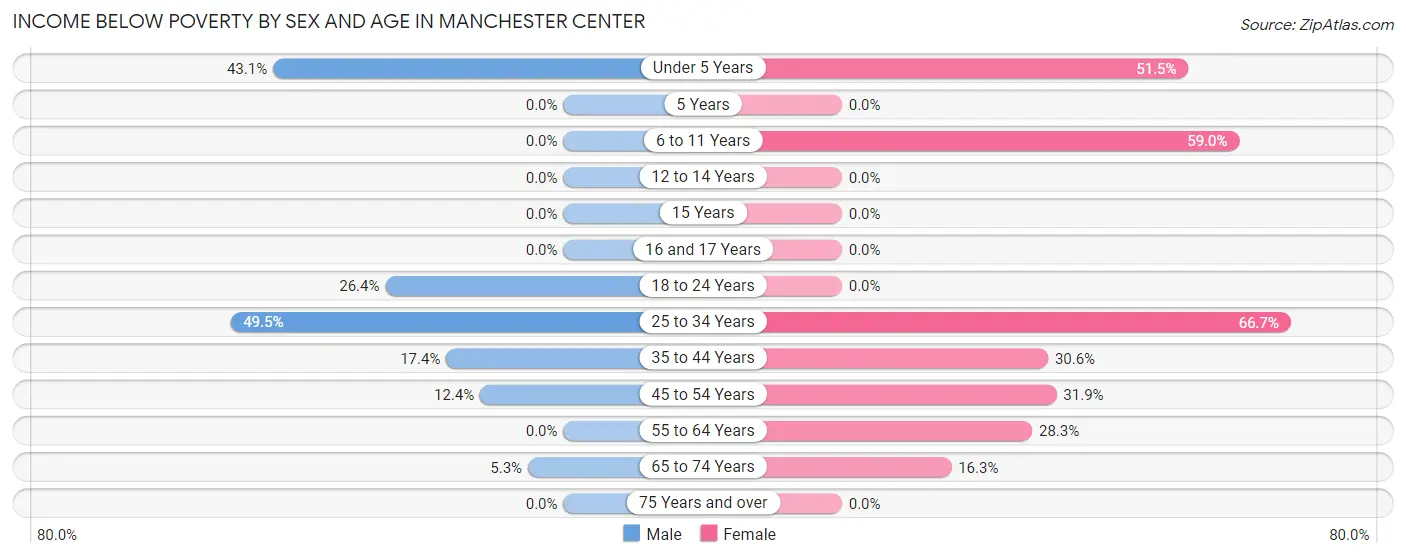
| Age Bracket | Male | Female |
| Under 5 Years | 47 (43.1%) | 53 (51.5%) |
| 5 Years | 0 (0.0%) | 0 (0.0%) |
| 6 to 11 Years | 0 (0.0%) | 36 (59.0%) |
| 12 to 14 Years | 0 (0.0%) | 0 (0.0%) |
| 15 Years | 0 (0.0%) | 0 (0.0%) |
| 16 and 17 Years | 0 (0.0%) | 0 (0.0%) |
| 18 to 24 Years | 23 (26.4%) | 0 (0.0%) |
| 25 to 34 Years | 46 (49.5%) | 60 (66.7%) |
| 35 to 44 Years | 8 (17.4%) | 15 (30.6%) |
| 45 to 54 Years | 11 (12.4%) | 80 (31.9%) |
| 55 to 64 Years | 0 (0.0%) | 50 (28.2%) |
| 65 to 74 Years | 4 (5.3%) | 13 (16.3%) |
| 75 Years and over | 0 (0.0%) | 0 (0.0%) |
| Total | 139 (18.7%) | 307 (28.3%) |
Income Above Poverty by Sex and Age in Manchester Center
According to the poverty statistics in Manchester Center, males aged 6 to 11 years and females aged 12 to 14 years are the age groups that are most secure financially, with 100.0% of males and 100.0% of females in these age groups living above the poverty line.
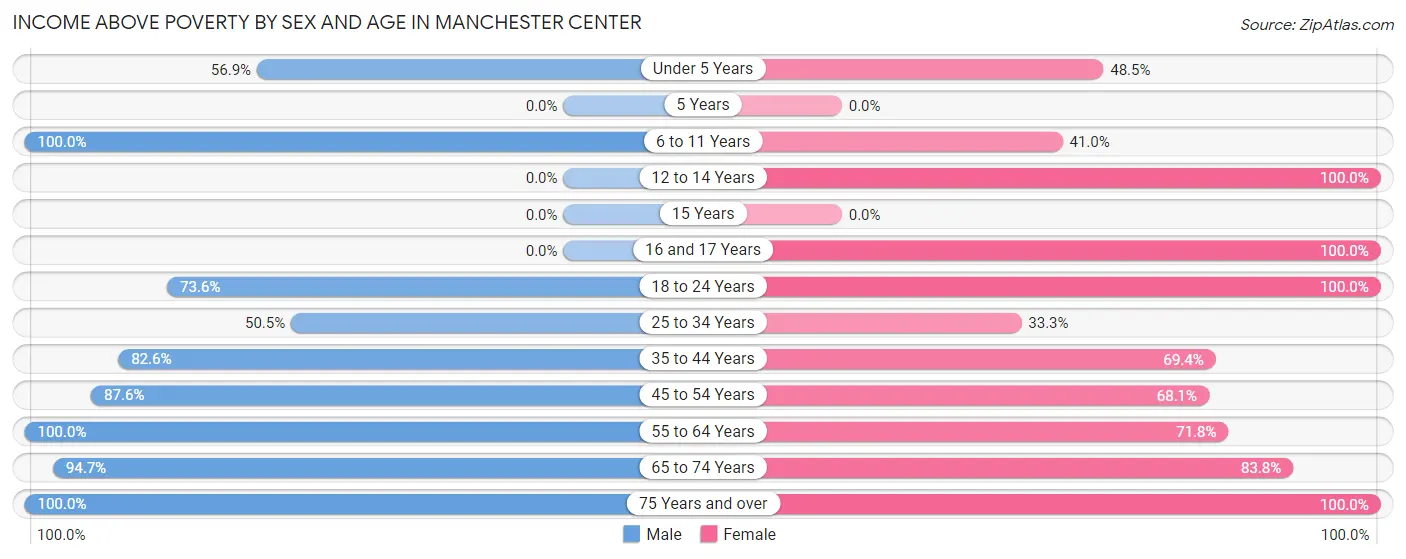
| Age Bracket | Male | Female |
| Under 5 Years | 62 (56.9%) | 50 (48.5%) |
| 5 Years | 0 (0.0%) | 0 (0.0%) |
| 6 to 11 Years | 31 (100.0%) | 25 (41.0%) |
| 12 to 14 Years | 0 (0.0%) | 45 (100.0%) |
| 15 Years | 0 (0.0%) | 0 (0.0%) |
| 16 and 17 Years | 0 (0.0%) | 16 (100.0%) |
| 18 to 24 Years | 64 (73.6%) | 74 (100.0%) |
| 25 to 34 Years | 47 (50.5%) | 30 (33.3%) |
| 35 to 44 Years | 38 (82.6%) | 34 (69.4%) |
| 45 to 54 Years | 78 (87.6%) | 171 (68.1%) |
| 55 to 64 Years | 168 (100.0%) | 127 (71.8%) |
| 65 to 74 Years | 72 (94.7%) | 67 (83.8%) |
| 75 Years and over | 45 (100.0%) | 139 (100.0%) |
| Total | 605 (81.3%) | 778 (71.7%) |
Income Below Poverty Among Married-Couple Families in Manchester Center
The poverty statistics for married-couple families in Manchester Center show that 6.7% or 18 of the total 270 families live below the poverty line. Families with 1 or 2 children have the highest poverty rate of 63.0%, comprising of 17 families. On the other hand, families with 3 or 4 children have the lowest poverty rate of 0.0%, which includes 0 families.
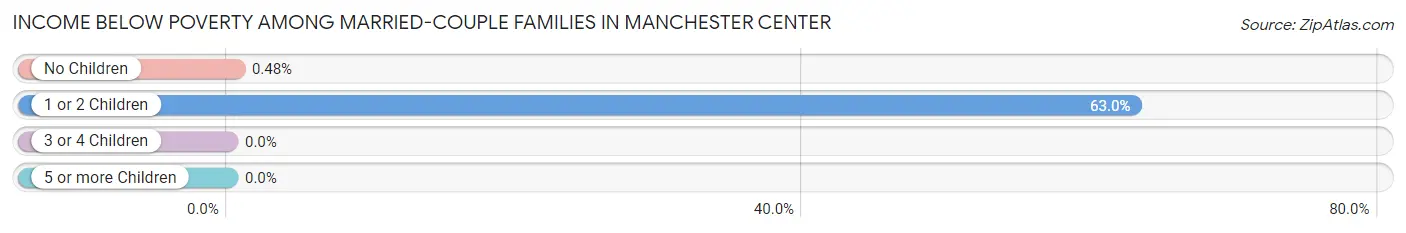
| Children | Above Poverty | Below Poverty |
| No Children | 208 (99.5%) | 1 (0.5%) |
| 1 or 2 Children | 10 (37.0%) | 17 (63.0%) |
| 3 or 4 Children | 34 (100.0%) | 0 (0.0%) |
| 5 or more Children | 0 (0.0%) | 0 (0.0%) |
| Total | 252 (93.3%) | 18 (6.7%) |
Income Below Poverty Among Single-Parent Households in Manchester Center
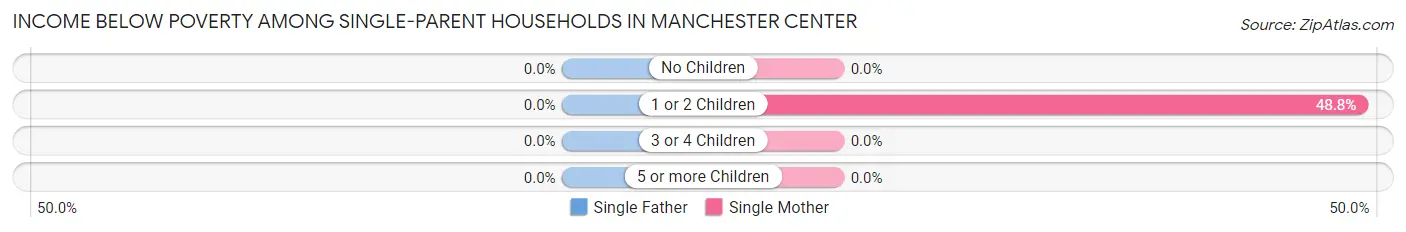
| Children | Single Father | Single Mother |
| No Children | 0 (0.0%) | 0 (0.0%) |
| 1 or 2 Children | 0 (0.0%) | 42 (48.8%) |
| 3 or 4 Children | 0 (0.0%) | 0 (0.0%) |
| 5 or more Children | 0 (0.0%) | 0 (0.0%) |
| Total | 0 (0.0%) | 42 (25.3%) |
Income Below Poverty Among Married-Couple vs Single-Parent Households in Manchester Center
The poverty data for Manchester Center shows that 18 of the married-couple family households (6.7%) and 42 of the single-parent households (23.0%) are living below the poverty level. Within the married-couple family households, those with 1 or 2 children have the highest poverty rate, with 17 households (63.0%) falling below the poverty line. Among the single-parent households, those with 1 or 2 children have the highest poverty rate, with 42 household (40.8%) living below poverty.
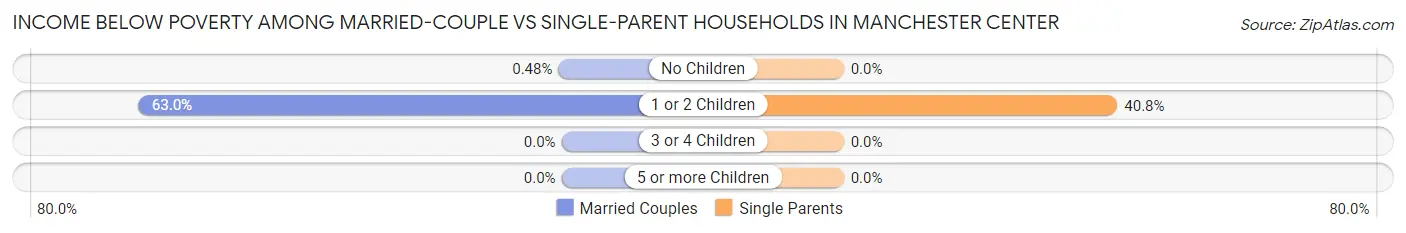
| Children | Married-Couple Families | Single-Parent Households |
| No Children | 1 (0.5%) | 0 (0.0%) |
| 1 or 2 Children | 17 (63.0%) | 42 (40.8%) |
| 3 or 4 Children | 0 (0.0%) | 0 (0.0%) |
| 5 or more Children | 0 (0.0%) | 0 (0.0%) |
| Total | 18 (6.7%) | 42 (23.0%) |
Race in Manchester Center
The most populous races in Manchester Center are White / Caucasian (1,777 | 96.8%), Two or more Races (39 | 2.1%), and Black / African American (15 | 0.8%).
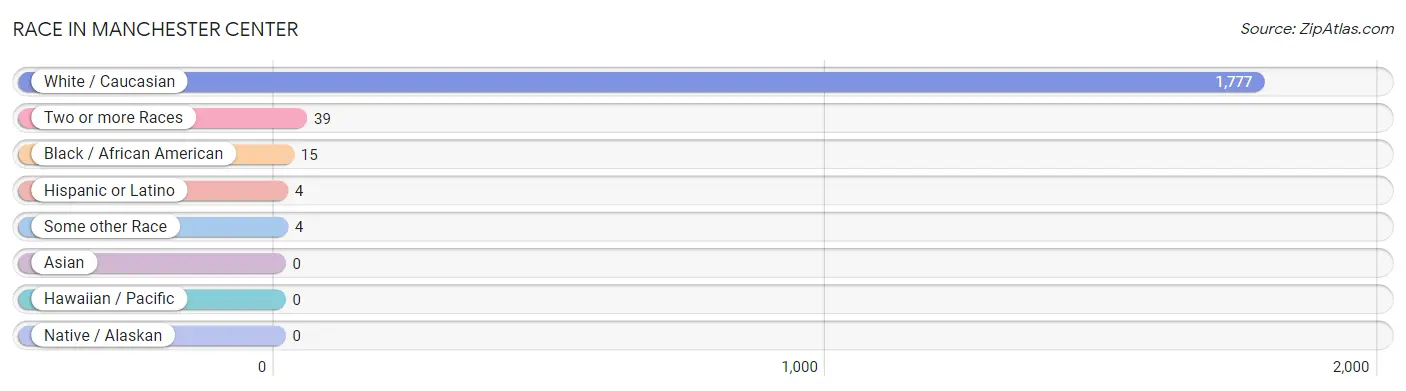
| Race | # Population | % Population |
| Asian | 0 | 0.0% |
| Black / African American | 15 | 0.8% |
| Hawaiian / Pacific | 0 | 0.0% |
| Hispanic or Latino | 4 | 0.2% |
| Native / Alaskan | 0 | 0.0% |
| White / Caucasian | 1,777 | 96.8% |
| Two or more Races | 39 | 2.1% |
| Some other Race | 4 | 0.2% |
| Total | 1,835 | 100.0% |
Ancestry in Manchester Center
The most populous ancestries reported in Manchester Center are Irish (577 | 31.4%), English (423 | 23.1%), German (214 | 11.7%), Italian (114 | 6.2%), and American (105 | 5.7%), together accounting for 78.1% of all Manchester Center residents.
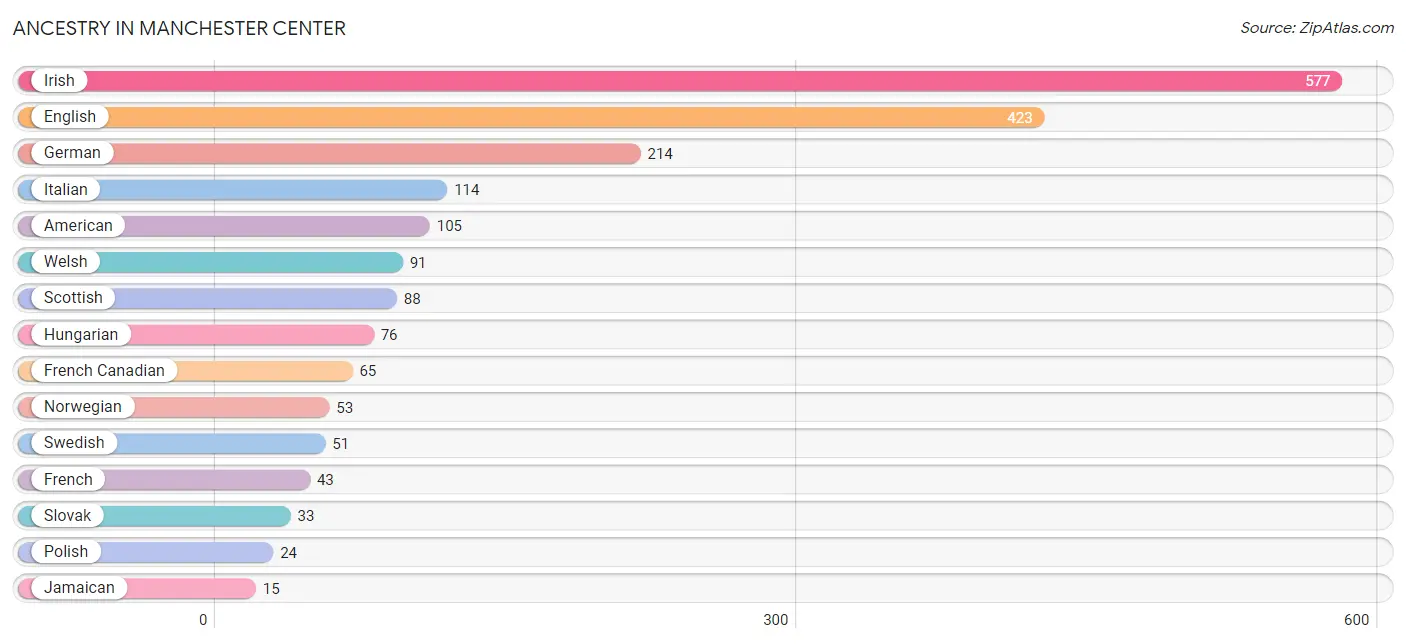
| Ancestry | # Population | % Population |
| American | 105 | 5.7% |
| Belgian | 3 | 0.2% |
| Czechoslovakian | 8 | 0.4% |
| English | 423 | 23.1% |
| French | 43 | 2.3% |
| French Canadian | 65 | 3.5% |
| German | 214 | 11.7% |
| Greek | 6 | 0.3% |
| Hungarian | 76 | 4.1% |
| Irish | 577 | 31.4% |
| Italian | 114 | 6.2% |
| Jamaican | 15 | 0.8% |
| Norwegian | 53 | 2.9% |
| Polish | 24 | 1.3% |
| Puerto Rican | 4 | 0.2% |
| Russian | 10 | 0.5% |
| Scottish | 88 | 4.8% |
| Slovak | 33 | 1.8% |
| Swedish | 51 | 2.8% |
| Welsh | 91 | 5.0% | View All 20 Rows |
Immigrants in Manchester Center
The most numerous immigrant groups reported in Manchester Center came from Europe (17 | 0.9%), Northern Europe (17 | 0.9%), Caribbean (15 | 0.8%), Jamaica (15 | 0.8%), and Latin America (15 | 0.8%), together accounting for 4.3% of all Manchester Center residents.
| Immigration Origin | # Population | % Population |
| Caribbean | 15 | 0.8% |
| Europe | 17 | 0.9% |
| Jamaica | 15 | 0.8% |
| Latin America | 15 | 0.8% |
| Northern Europe | 17 | 0.9% | View All 5 Rows |
Sex and Age in Manchester Center
Sex and Age in Manchester Center
The most populous age groups in Manchester Center are 60 to 64 Years (117 | 15.7%) for men and 60 to 64 Years (155 | 14.2%) for women.
| Age Bracket | Male | Female |
| Under 5 Years | 109 (14.6%) | 103 (9.4%) |
| 5 to 9 Years | 0 (0.0%) | 57 (5.2%) |
| 10 to 14 Years | 31 (4.2%) | 49 (4.5%) |
| 15 to 19 Years | 0 (0.0%) | 16 (1.5%) |
| 20 to 24 Years | 87 (11.7%) | 74 (6.8%) |
| 25 to 29 Years | 80 (10.7%) | 58 (5.3%) |
| 30 to 34 Years | 13 (1.8%) | 32 (2.9%) |
| 35 to 39 Years | 1 (0.1%) | 31 (2.8%) |
| 40 to 44 Years | 45 (6.0%) | 18 (1.7%) |
| 45 to 49 Years | 35 (4.7%) | 123 (11.3%) |
| 50 to 54 Years | 54 (7.3%) | 128 (11.7%) |
| 55 to 59 Years | 51 (6.9%) | 22 (2.0%) |
| 60 to 64 Years | 117 (15.7%) | 155 (14.2%) |
| 65 to 69 Years | 49 (6.6%) | 36 (3.3%) |
| 70 to 74 Years | 27 (3.6%) | 44 (4.0%) |
| 75 to 79 Years | 36 (4.8%) | 36 (3.3%) |
| 80 to 84 Years | 9 (1.2%) | 73 (6.7%) |
| 85 Years and over | 0 (0.0%) | 36 (3.3%) |
| Total | 744 (100.0%) | 1,091 (100.0%) |
Families and Households in Manchester Center
Median Family Size in Manchester Center
The median family size in Manchester Center is 2.96 persons per family, with single female/mother families (166 | 36.6%) accounting for the largest median family size of 3.12 persons per family. On the other hand, single male/father families (17 | 3.7%) represent the smallest median family size with 2.24 persons per family.
| Family Type | # Families | Family Size |
| Married-Couple | 270 (59.6%) | 2.90 |
| Single Male/Father | 17 (3.7%) | 2.24 |
| Single Female/Mother | 166 (36.6%) | 3.12 |
| Total Families | 453 (100.0%) | 2.96 |
Median Household Size in Manchester Center
The median household size in Manchester Center is 2.39 persons per household, with single female/mother households (166 | 21.8%) accounting for the largest median household size of 3.48 persons per household. non-family households (309 | 40.6%) represent the smallest median household size with 1.37 persons per household.
| Household Type | # Households | Household Size |
| Married-Couple | 270 (35.4%) | 2.90 |
| Single Male/Father | 17 (2.2%) | 2.24 |
| Single Female/Mother | 166 (21.8%) | 3.48 |
| Non-family | 309 (40.6%) | 1.37 |
| Total Households | 762 (100.0%) | 2.39 |
Household Size by Marriage Status in Manchester Center
Out of a total of 762 households in Manchester Center, 453 (59.5%) are family households, while 309 (40.6%) are nonfamily households. The most numerous type of family households are 2-person households, comprising 279, and the most common type of nonfamily households are 1-person households, comprising 252.
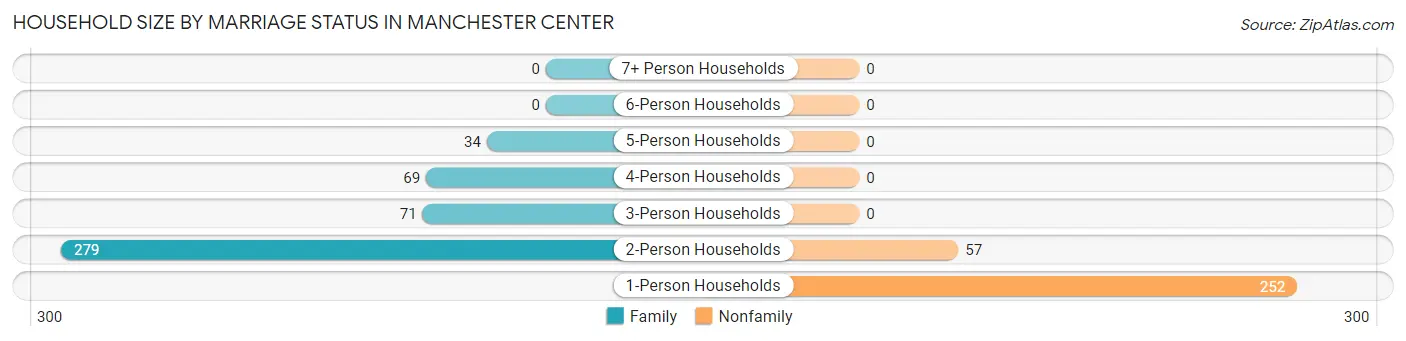
| Household Size | Family Households | Nonfamily Households |
| 1-Person Households | - | 252 (33.1%) |
| 2-Person Households | 279 (36.6%) | 57 (7.5%) |
| 3-Person Households | 71 (9.3%) | 0 (0.0%) |
| 4-Person Households | 69 (9.1%) | 0 (0.0%) |
| 5-Person Households | 34 (4.5%) | 0 (0.0%) |
| 6-Person Households | 0 (0.0%) | 0 (0.0%) |
| 7+ Person Households | 0 (0.0%) | 0 (0.0%) |
| Total | 453 (59.5%) | 309 (40.6%) |
Female Fertility in Manchester Center
Fertility by Age in Manchester Center
| Age Bracket | Women with Births | Births / 1,000 Women |
| 15 to 19 years | 0 (0.0%) | 0.0 |
| 20 to 34 years | 0 (0.0%) | 0.0 |
| 35 to 50 years | 0 (0.0%) | 0.0 |
| Total | 0 (0.0%) | 0.0 |
Fertility by Age by Marriage Status in Manchester Center
| Age Bracket | Married | Unmarried |
| 15 to 19 years | 0 (0.0%) | 0 (0.0%) |
| 20 to 34 years | 0 (0.0%) | 0 (0.0%) |
| 35 to 50 years | 0 (0.0%) | 0 (0.0%) |
| Total | 0 (0.0%) | 0 (0.0%) |
Fertility by Education in Manchester Center
| Educational Attainment | Women with Births | Births / 1,000 Women |
| Less than High School | 0 (0.0%) | 0.0 |
| High School Diploma | 0 (0.0%) | 0.0 |
| College or Associate's Degree | 0 (0.0%) | 0.0 |
| Bachelor's Degree | 0 (0.0%) | 0.0 |
| Graduate Degree | 0 (0.0%) | 0.0 |
| Total | 0 (0.0%) | 0.0 |
Fertility by Education by Marriage Status in Manchester Center
| Educational Attainment | Married | Unmarried |
| Less than High School | 0 (0.0%) | 0 (0.0%) |
| High School Diploma | 0 (0.0%) | 0 (0.0%) |
| College or Associate's Degree | 0 (0.0%) | 0 (0.0%) |
| Bachelor's Degree | 0 (0.0%) | 0 (0.0%) |
| Graduate Degree | 0 (0.0%) | 0 (0.0%) |
| Total | 0 (0.0%) | 0 (0.0%) |
Employment Characteristics in Manchester Center
Employment by Class of Employer in Manchester Center
Among the 948 employed individuals in Manchester Center, private company employees (642 | 67.7%), local government employees (103 | 10.9%), and self-employed (incorporated) (90 | 9.5%) make up the most common classes of employment.
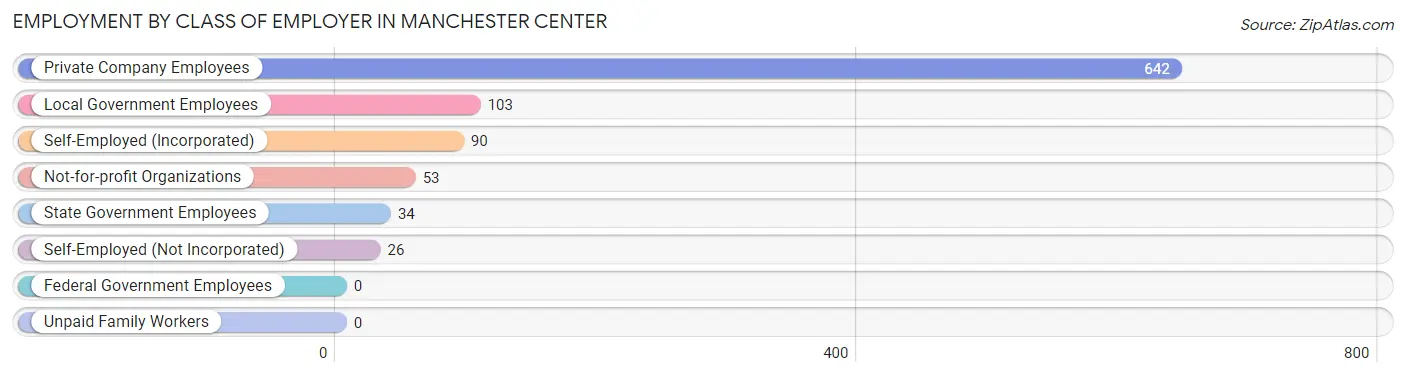
| Employer Class | # Employees | % Employees |
| Private Company Employees | 642 | 67.7% |
| Self-Employed (Incorporated) | 90 | 9.5% |
| Self-Employed (Not Incorporated) | 26 | 2.7% |
| Not-for-profit Organizations | 53 | 5.6% |
| Local Government Employees | 103 | 10.9% |
| State Government Employees | 34 | 3.6% |
| Federal Government Employees | 0 | 0.0% |
| Unpaid Family Workers | 0 | 0.0% |
| Total | 948 | 100.0% |
Employment Status by Age in Manchester Center
According to the labor force statistics for Manchester Center, out of the total population over 16 years of age (1,486), 66.0% or 981 individuals are in the labor force, with 3.4% or 33 of them unemployed. The age group with the highest labor force participation rate is 55 to 59 years, with 100.0% or 73 individuals in the labor force. Within the labor force, the 45 to 54 years age range has the highest percentage of unemployed individuals, with 11.0% or 33 of them being unemployed.
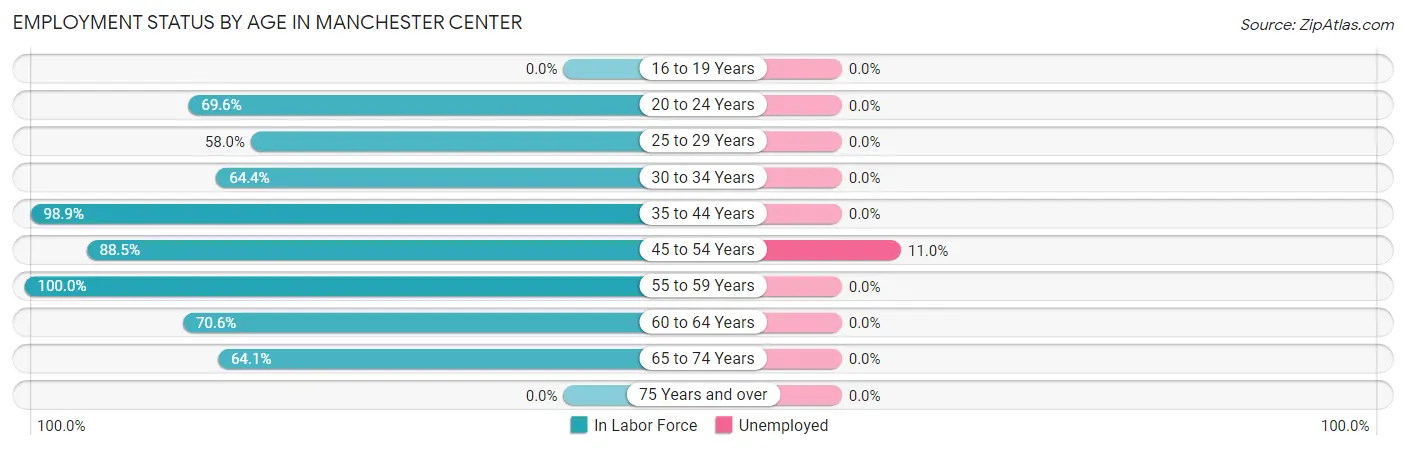
| Age Bracket | In Labor Force | Unemployed |
| 16 to 19 Years | 0 (0.0%) | 0 (0.0%) |
| 20 to 24 Years | 112 (69.6%) | 0 (0.0%) |
| 25 to 29 Years | 80 (58.0%) | 0 (0.0%) |
| 30 to 34 Years | 29 (64.4%) | 0 (0.0%) |
| 35 to 44 Years | 94 (98.9%) | 0 (0.0%) |
| 45 to 54 Years | 301 (88.5%) | 33 (11.0%) |
| 55 to 59 Years | 73 (100.0%) | 0 (0.0%) |
| 60 to 64 Years | 192 (70.6%) | 0 (0.0%) |
| 65 to 74 Years | 100 (64.1%) | 0 (0.0%) |
| 75 Years and over | 0 (0.0%) | 0 (0.0%) |
| Total | 981 (66.0%) | 33 (3.4%) |
Employment Status by Educational Attainment in Manchester Center
According to labor force statistics for Manchester Center, 79.9% of individuals (769) out of the total population between 25 and 64 years of age (963) are in the labor force, with 4.3% or 33 of them being unemployed. The group with the highest labor force participation rate are those with the educational attainment of bachelor's degree or higher, with 94.2% or 295 individuals in the labor force. Within the labor force, individuals with college / associate degree education have the highest percentage of unemployment, with 16.6% or 33 of them being unemployed.
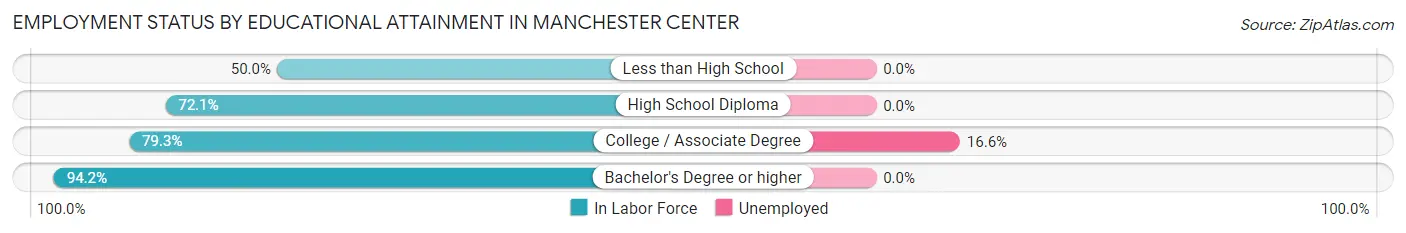
| Educational Attainment | In Labor Force | Unemployed |
| Less than High School | 29 (50.0%) | 0 (0.0%) |
| High School Diploma | 246 (72.1%) | 0 (0.0%) |
| College / Associate Degree | 199 (79.3%) | 42 (16.6%) |
| Bachelor's Degree or higher | 295 (94.2%) | 0 (0.0%) |
| Total | 769 (79.9%) | 41 (4.3%) |
Employment Occupations by Sex in Manchester Center
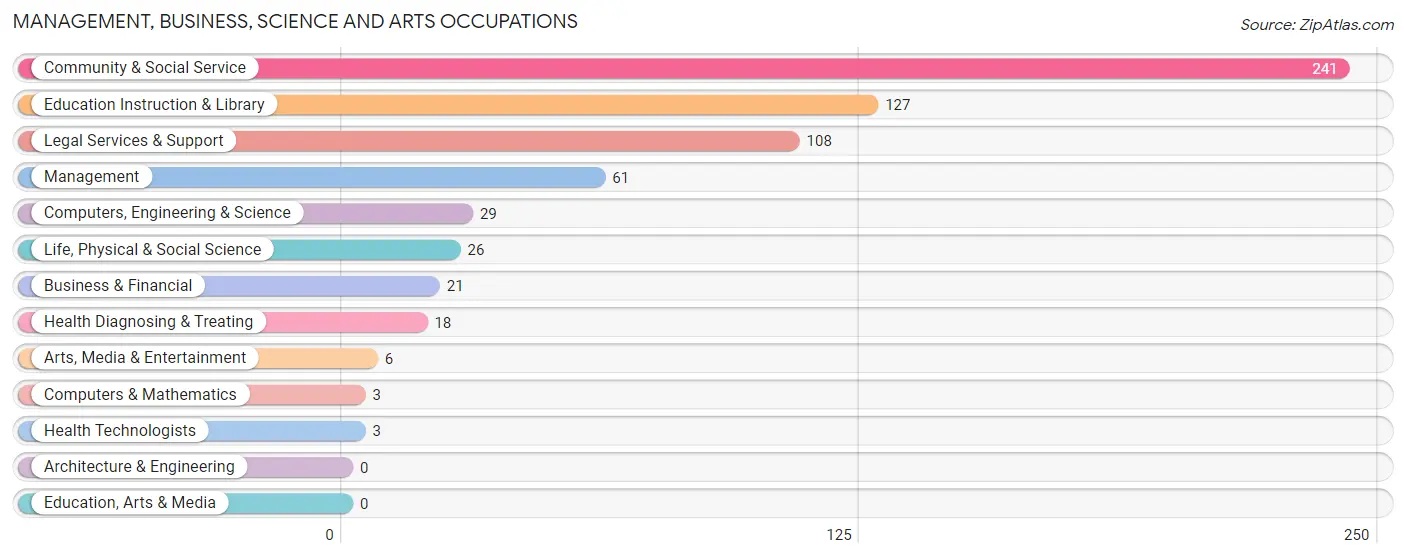
Management, Business, Science and Arts Occupations
The most common Management, Business, Science and Arts occupations in Manchester Center are Community & Social Service (241 | 25.4%), Education Instruction & Library (127 | 13.4%), Legal Services & Support (108 | 11.4%), Management (61 | 6.4%), and Computers, Engineering & Science (29 | 3.1%).
Management, Business, Science and Arts Occupations by Sex
Within the Management, Business, Science and Arts occupations in Manchester Center, the most male-oriented occupations are Business & Financial (100.0%), Computers & Mathematics (100.0%), and Arts, Media & Entertainment (100.0%), while the most female-oriented occupations are Life, Physical & Social Science (100.0%), Education Instruction & Library (97.6%), and Computers, Engineering & Science (89.7%).
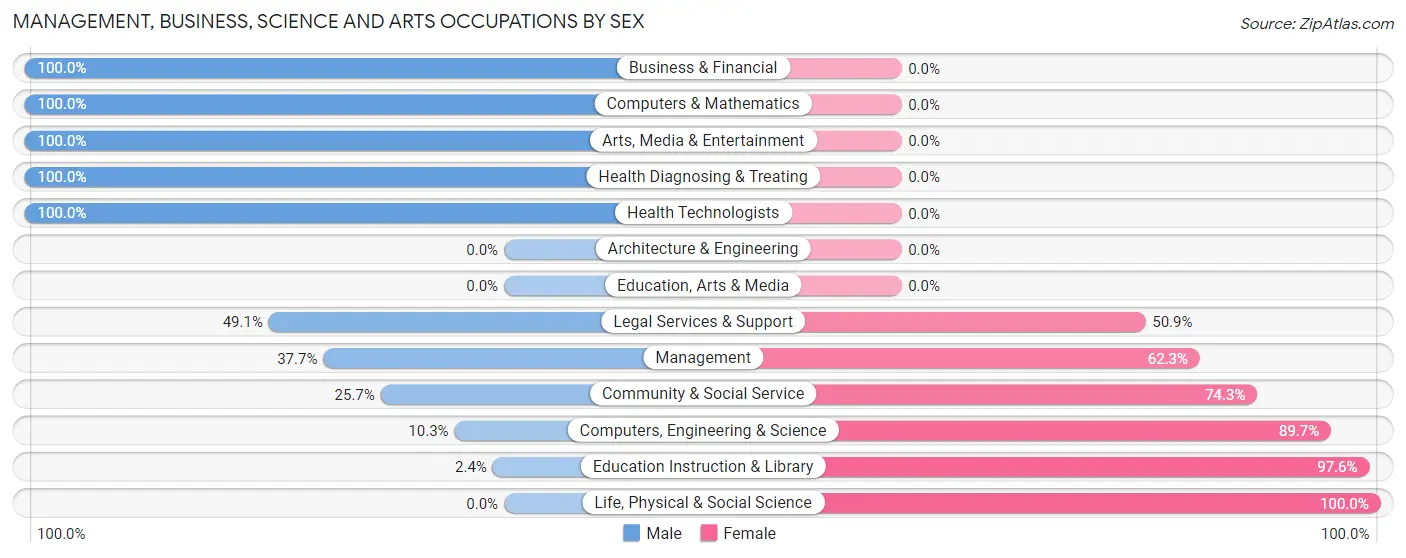
| Occupation | Male | Female |
| Management | 23 (37.7%) | 38 (62.3%) |
| Business & Financial | 21 (100.0%) | 0 (0.0%) |
| Computers, Engineering & Science | 3 (10.3%) | 26 (89.7%) |
| Computers & Mathematics | 3 (100.0%) | 0 (0.0%) |
| Architecture & Engineering | 0 (0.0%) | 0 (0.0%) |
| Life, Physical & Social Science | 0 (0.0%) | 26 (100.0%) |
| Community & Social Service | 62 (25.7%) | 179 (74.3%) |
| Education, Arts & Media | 0 (0.0%) | 0 (0.0%) |
| Legal Services & Support | 53 (49.1%) | 55 (50.9%) |
| Education Instruction & Library | 3 (2.4%) | 124 (97.6%) |
| Arts, Media & Entertainment | 6 (100.0%) | 0 (0.0%) |
| Health Diagnosing & Treating | 18 (100.0%) | 0 (0.0%) |
| Health Technologists | 3 (100.0%) | 0 (0.0%) |
| Total (Category) | 127 (34.3%) | 243 (65.7%) |
| Total (Overall) | 450 (47.5%) | 498 (52.5%) |
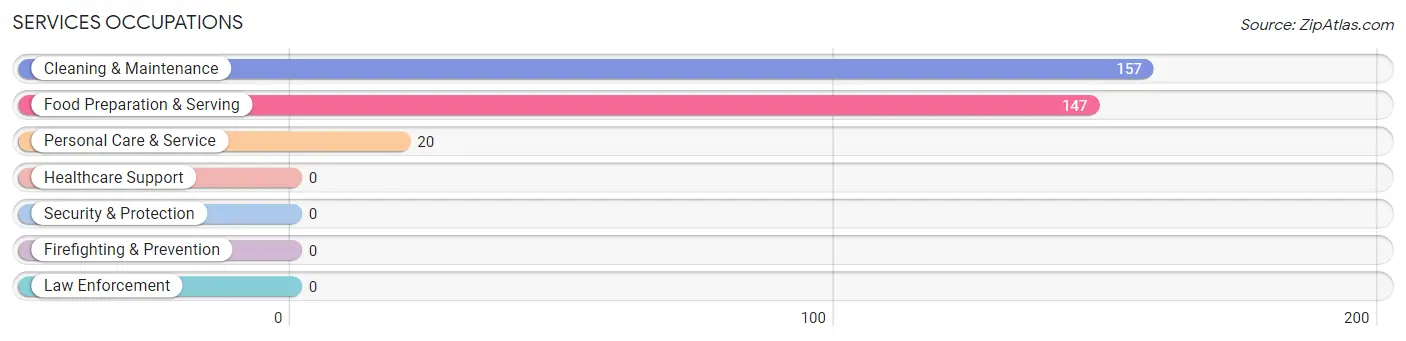
Services Occupations
The most common Services occupations in Manchester Center are Cleaning & Maintenance (157 | 16.6%), Food Preparation & Serving (147 | 15.5%), and Personal Care & Service (20 | 2.1%).
Services Occupations by Sex
Within the Services occupations in Manchester Center, the most male-oriented occupations are Cleaning & Maintenance (91.1%), Personal Care & Service (50.0%), and Food Preparation & Serving (14.3%), while the most female-oriented occupations are Food Preparation & Serving (85.7%), Personal Care & Service (50.0%), and Cleaning & Maintenance (8.9%).
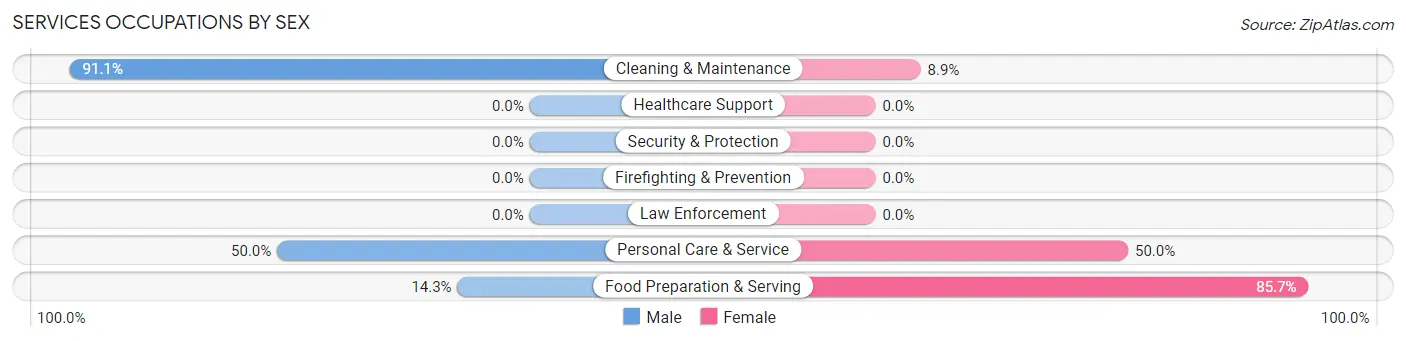
| Occupation | Male | Female |
| Healthcare Support | 0 (0.0%) | 0 (0.0%) |
| Security & Protection | 0 (0.0%) | 0 (0.0%) |
| Firefighting & Prevention | 0 (0.0%) | 0 (0.0%) |
| Law Enforcement | 0 (0.0%) | 0 (0.0%) |
| Food Preparation & Serving | 21 (14.3%) | 126 (85.7%) |
| Cleaning & Maintenance | 143 (91.1%) | 14 (8.9%) |
| Personal Care & Service | 10 (50.0%) | 10 (50.0%) |
| Total (Category) | 174 (53.7%) | 150 (46.3%) |
| Total (Overall) | 450 (47.5%) | 498 (52.5%) |
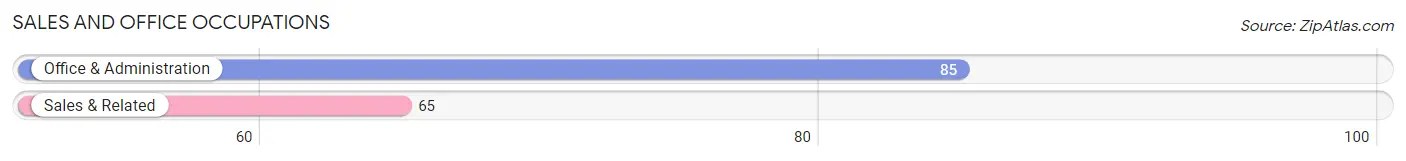
Sales and Office Occupations
The most common Sales and Office occupations in Manchester Center are Office & Administration (85 | 9.0%), and Sales & Related (65 | 6.9%).
Sales and Office Occupations by Sex
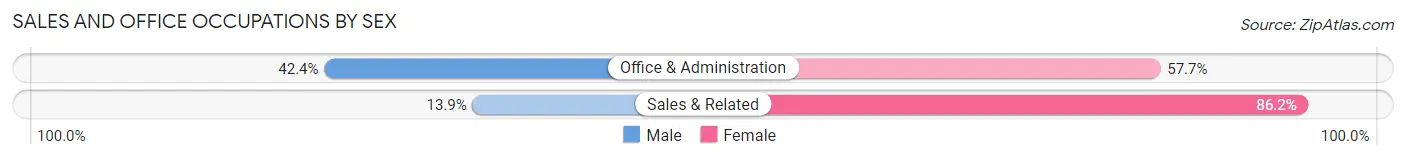
| Occupation | Male | Female |
| Sales & Related | 9 (13.9%) | 56 (86.2%) |
| Office & Administration | 36 (42.3%) | 49 (57.7%) |
| Total (Category) | 45 (30.0%) | 105 (70.0%) |
| Total (Overall) | 450 (47.5%) | 498 (52.5%) |
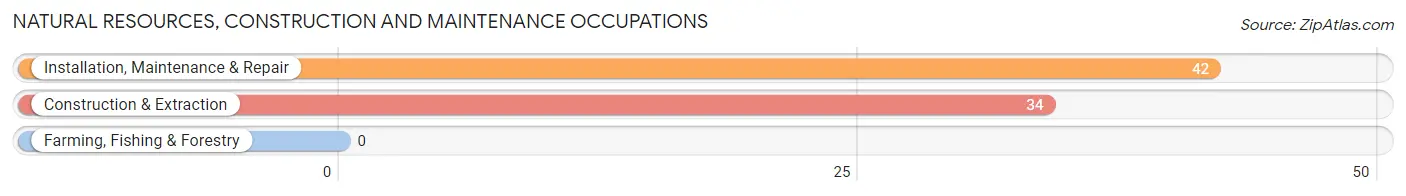
Natural Resources, Construction and Maintenance Occupations
The most common Natural Resources, Construction and Maintenance occupations in Manchester Center are Installation, Maintenance & Repair (42 | 4.4%), and Construction & Extraction (34 | 3.6%).
Natural Resources, Construction and Maintenance Occupations by Sex
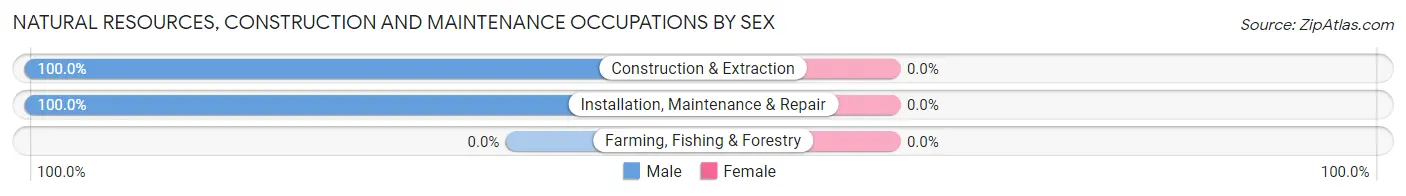
| Occupation | Male | Female |
| Farming, Fishing & Forestry | 0 (0.0%) | 0 (0.0%) |
| Construction & Extraction | 34 (100.0%) | 0 (0.0%) |
| Installation, Maintenance & Repair | 42 (100.0%) | 0 (0.0%) |
| Total (Category) | 76 (100.0%) | 0 (0.0%) |
| Total (Overall) | 450 (47.5%) | 498 (52.5%) |
Production, Transportation and Moving Occupations
The most common Production, Transportation and Moving occupations in Manchester Center are , and Production (28 | 2.9%).
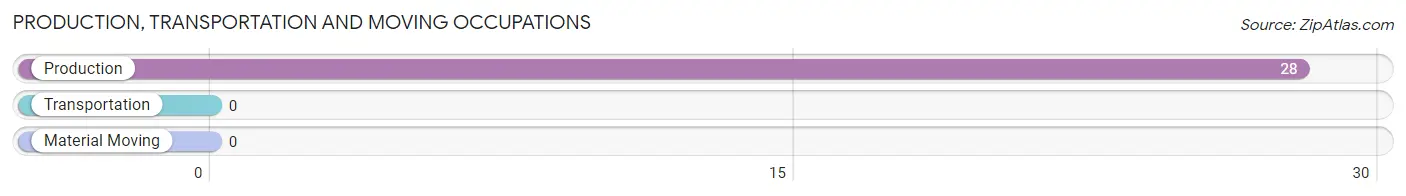
Production, Transportation and Moving Occupations by Sex
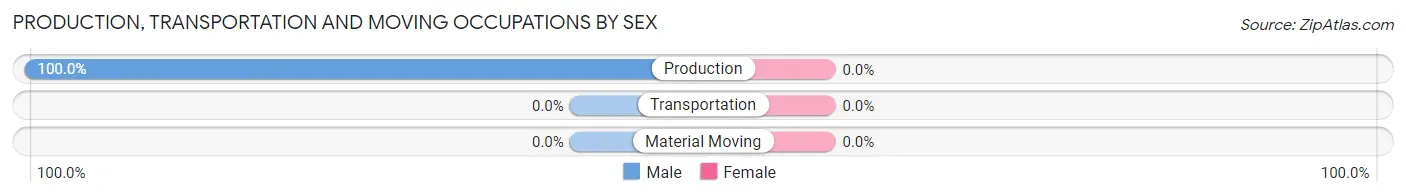
| Occupation | Male | Female |
| Production | 28 (100.0%) | 0 (0.0%) |
| Transportation | 0 (0.0%) | 0 (0.0%) |
| Material Moving | 0 (0.0%) | 0 (0.0%) |
| Total (Category) | 28 (100.0%) | 0 (0.0%) |
| Total (Overall) | 450 (47.5%) | 498 (52.5%) |
Employment Industries by Sex in Manchester Center
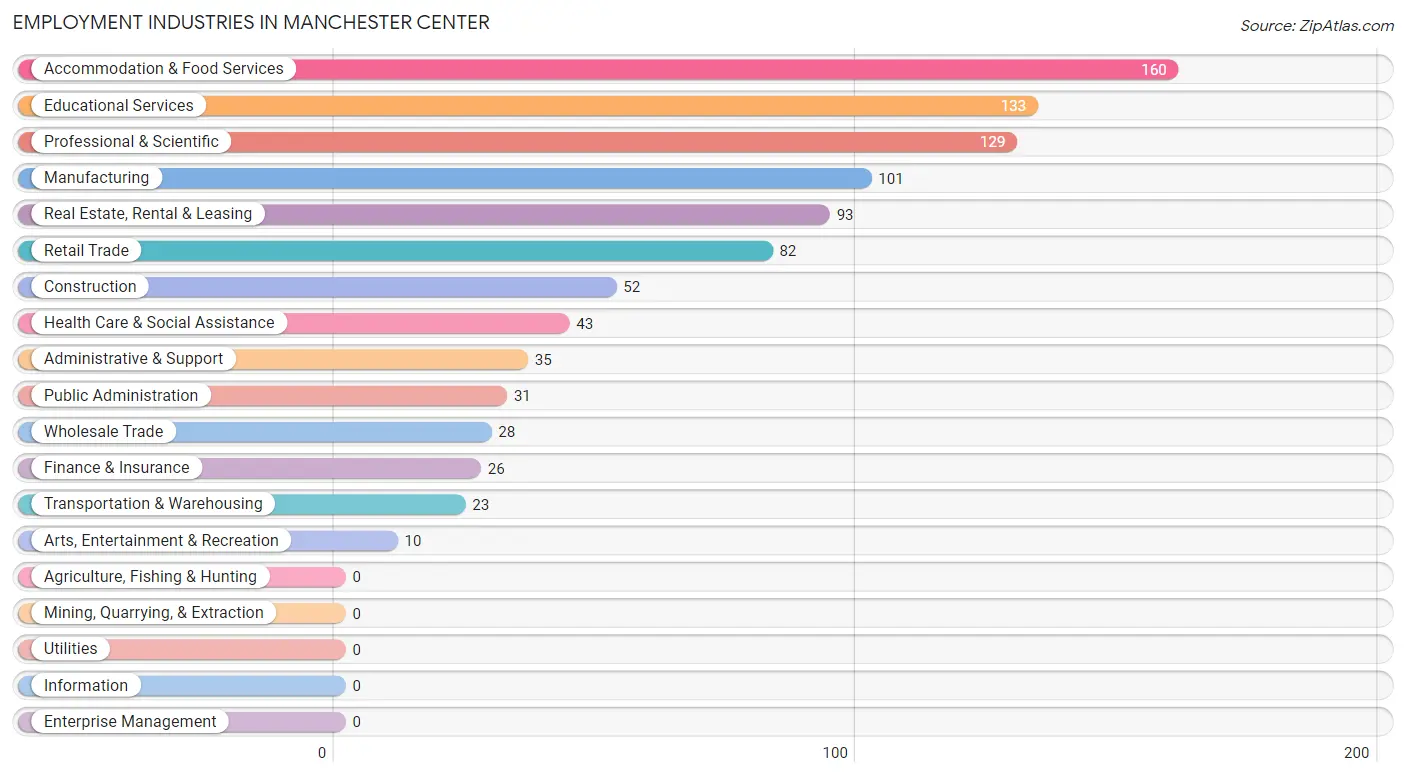
Employment Industries in Manchester Center
The major employment industries in Manchester Center include Accommodation & Food Services (160 | 16.9%), Educational Services (133 | 14.0%), Professional & Scientific (129 | 13.6%), Manufacturing (101 | 10.6%), and Real Estate, Rental & Leasing (93 | 9.8%).
Employment Industries by Sex in Manchester Center
The Manchester Center industries that see more men than women are Construction (100.0%), Manufacturing (100.0%), and Wholesale Trade (100.0%), whereas the industries that tend to have a higher number of women are Arts, Entertainment & Recreation (100.0%), Public Administration (100.0%), and Educational Services (90.2%).
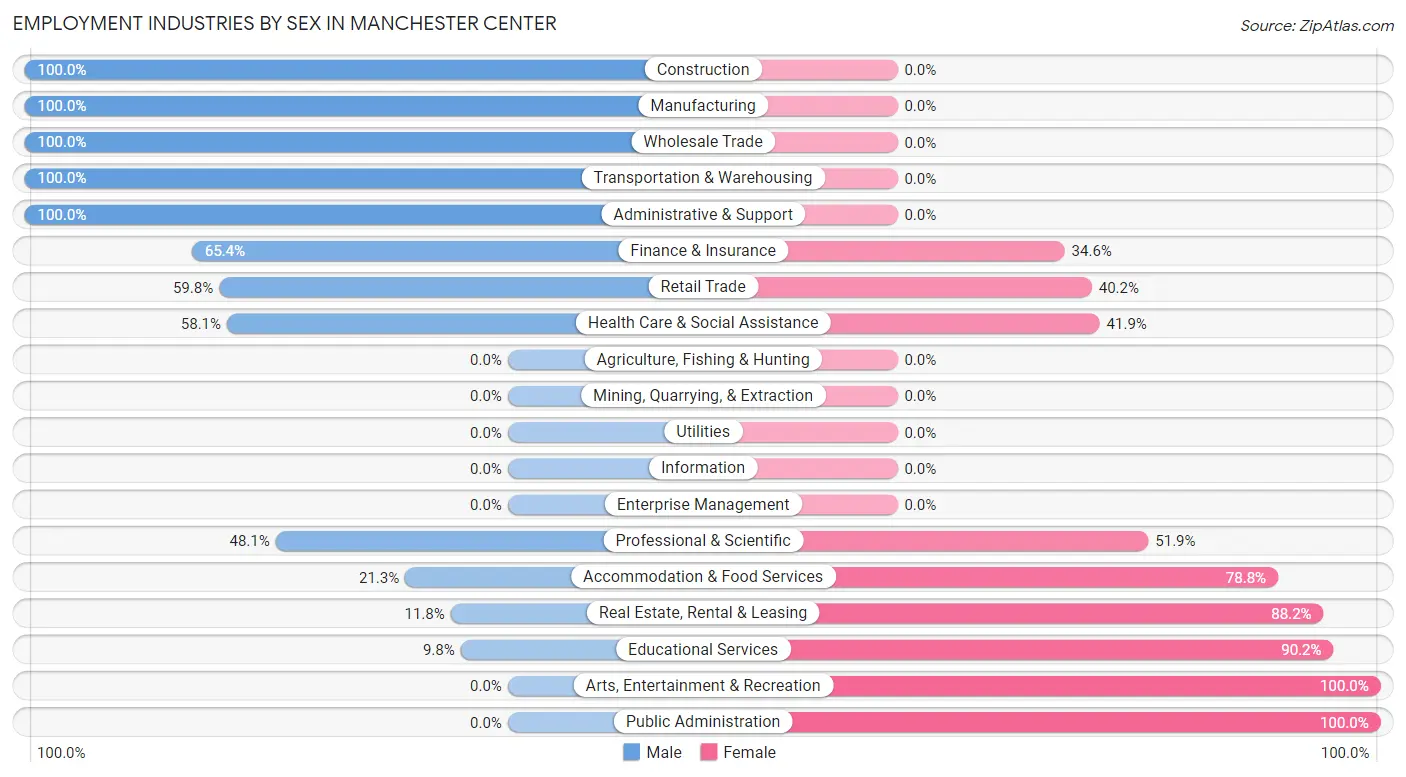
| Industry | Male | Female |
| Agriculture, Fishing & Hunting | 0 (0.0%) | 0 (0.0%) |
| Mining, Quarrying, & Extraction | 0 (0.0%) | 0 (0.0%) |
| Construction | 52 (100.0%) | 0 (0.0%) |
| Manufacturing | 101 (100.0%) | 0 (0.0%) |
| Wholesale Trade | 28 (100.0%) | 0 (0.0%) |
| Retail Trade | 49 (59.8%) | 33 (40.2%) |
| Transportation & Warehousing | 23 (100.0%) | 0 (0.0%) |
| Utilities | 0 (0.0%) | 0 (0.0%) |
| Information | 0 (0.0%) | 0 (0.0%) |
| Finance & Insurance | 17 (65.4%) | 9 (34.6%) |
| Real Estate, Rental & Leasing | 11 (11.8%) | 82 (88.2%) |
| Professional & Scientific | 62 (48.1%) | 67 (51.9%) |
| Enterprise Management | 0 (0.0%) | 0 (0.0%) |
| Administrative & Support | 35 (100.0%) | 0 (0.0%) |
| Educational Services | 13 (9.8%) | 120 (90.2%) |
| Health Care & Social Assistance | 25 (58.1%) | 18 (41.9%) |
| Arts, Entertainment & Recreation | 0 (0.0%) | 10 (100.0%) |
| Accommodation & Food Services | 34 (21.2%) | 126 (78.7%) |
| Public Administration | 0 (0.0%) | 31 (100.0%) |
| Total | 450 (47.5%) | 498 (52.5%) |
Education in Manchester Center
School Enrollment in Manchester Center
The most common levels of schooling among the 285 students in Manchester Center are college / undergraduate (82 | 28.8%), middle school (80 | 28.1%), and elementary school (57 | 20.0%).
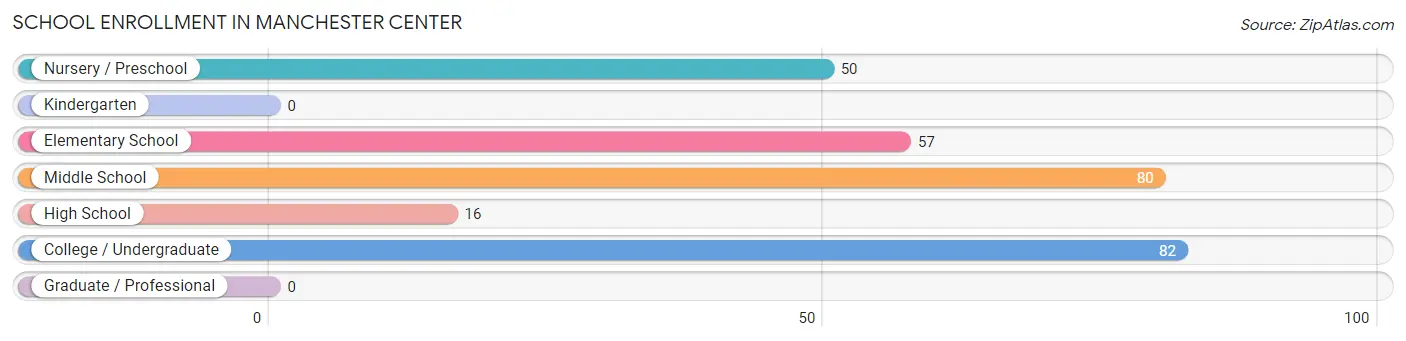
| School Level | # Students | % Students |
| Nursery / Preschool | 50 | 17.5% |
| Kindergarten | 0 | 0.0% |
| Elementary School | 57 | 20.0% |
| Middle School | 80 | 28.1% |
| High School | 16 | 5.6% |
| College / Undergraduate | 82 | 28.8% |
| Graduate / Professional | 0 | 0.0% |
| Total | 285 | 100.0% |
School Enrollment by Age by Funding Source in Manchester Center
Out of a total of 285 students who are enrolled in schools in Manchester Center, 117 (41.1%) attend a private institution, while the remaining 168 (58.9%) are enrolled in public schools. The age group of 3 to 4 year olds has the highest likelihood of being enrolled in private schools, with 50 (100.0% in the age bracket) enrolled. Conversely, the age group of 5 to 9 year old has the lowest likelihood of being enrolled in a private school, with 57 (100.0% in the age bracket) attending a public institution.
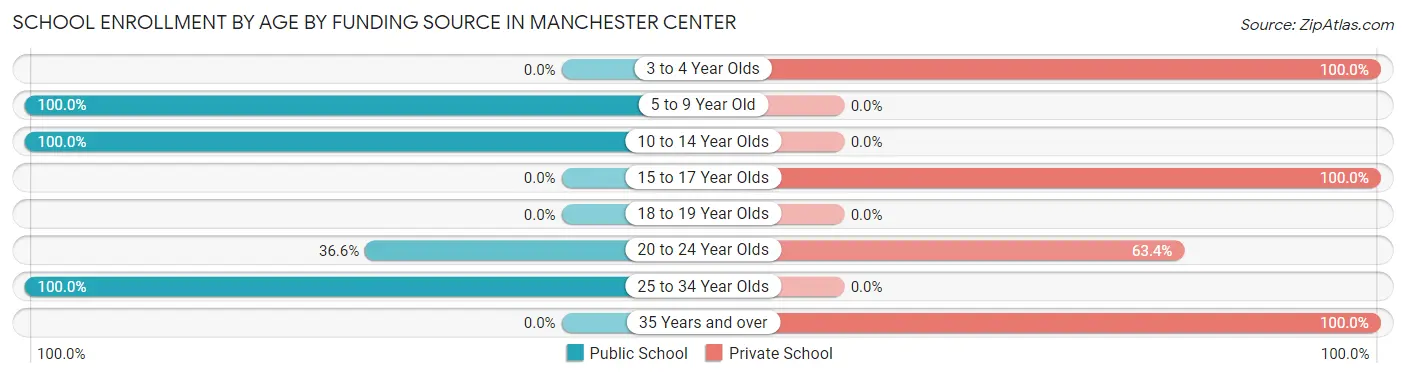
| Age Bracket | Public School | Private School |
| 3 to 4 Year Olds | 0 (0.0%) | 50 (100.0%) |
| 5 to 9 Year Old | 57 (100.0%) | 0 (0.0%) |
| 10 to 14 Year Olds | 80 (100.0%) | 0 (0.0%) |
| 15 to 17 Year Olds | 0 (0.0%) | 16 (100.0%) |
| 18 to 19 Year Olds | 0 (0.0%) | 0 (0.0%) |
| 20 to 24 Year Olds | 15 (36.6%) | 26 (63.4%) |
| 25 to 34 Year Olds | 16 (100.0%) | 0 (0.0%) |
| 35 Years and over | 0 (0.0%) | 25 (100.0%) |
| Total | 168 (58.9%) | 117 (41.1%) |
Educational Attainment by Field of Study in Manchester Center
Education (152 | 31.5%), social sciences (91 | 18.8%), liberal arts & history (77 | 15.9%), literature & languages (41 | 8.5%), and multidisciplinary studies (31 | 6.4%) are the most common fields of study among 483 individuals in Manchester Center who have obtained a bachelor's degree or higher.
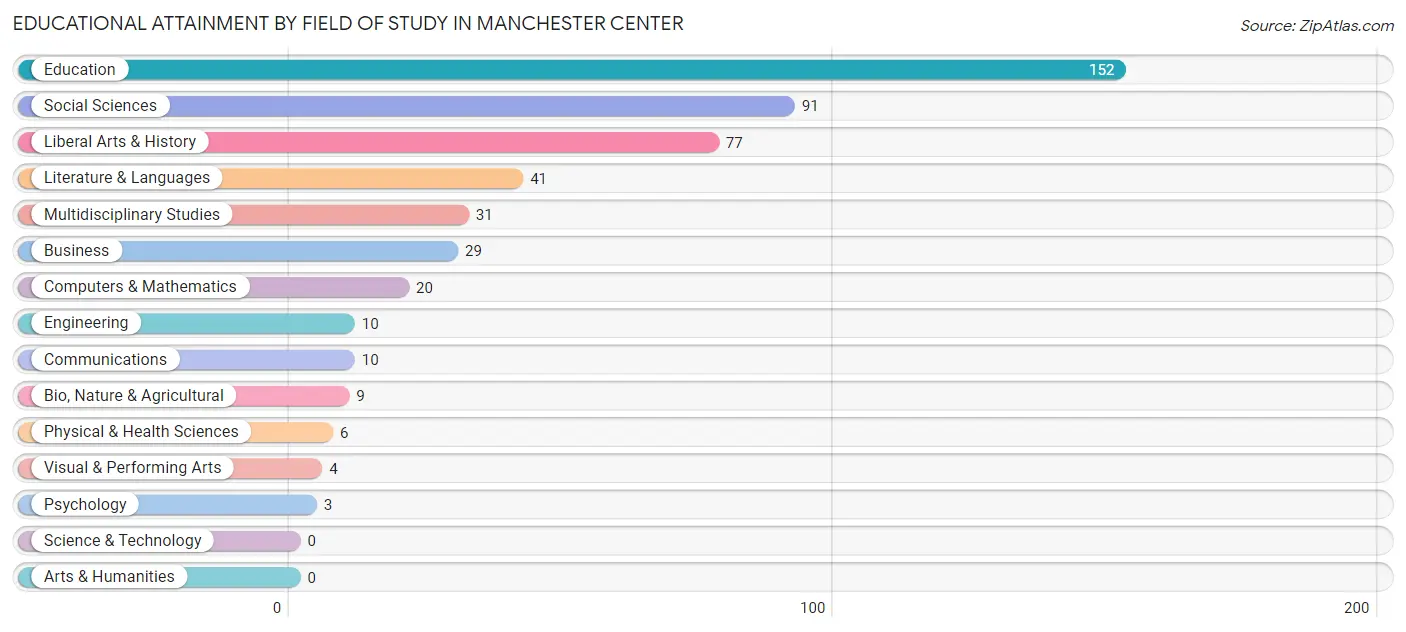
| Field of Study | # Graduates | % Graduates |
| Computers & Mathematics | 20 | 4.1% |
| Bio, Nature & Agricultural | 9 | 1.9% |
| Physical & Health Sciences | 6 | 1.2% |
| Psychology | 3 | 0.6% |
| Social Sciences | 91 | 18.8% |
| Engineering | 10 | 2.1% |
| Multidisciplinary Studies | 31 | 6.4% |
| Science & Technology | 0 | 0.0% |
| Business | 29 | 6.0% |
| Education | 152 | 31.5% |
| Literature & Languages | 41 | 8.5% |
| Liberal Arts & History | 77 | 15.9% |
| Visual & Performing Arts | 4 | 0.8% |
| Communications | 10 | 2.1% |
| Arts & Humanities | 0 | 0.0% |
| Total | 483 | 100.0% |
Transportation & Commute in Manchester Center
Vehicle Availability by Sex in Manchester Center
The most prevalent vehicle ownership categories in Manchester Center are males with 1 vehicle (185, accounting for 41.5%) and females with 1 vehicle (209, making up 37.1%).
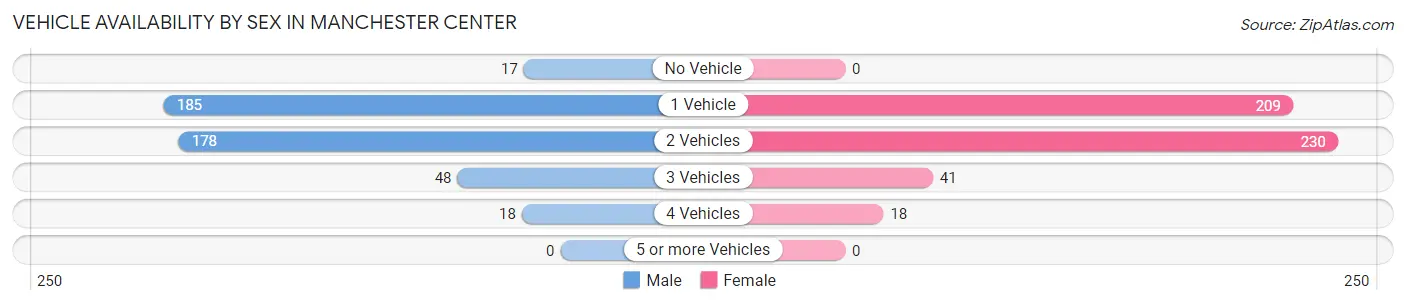
| Vehicles Available | Male | Female |
| No Vehicle | 17 (3.8%) | 0 (0.0%) |
| 1 Vehicle | 185 (41.5%) | 209 (42.0%) |
| 2 Vehicles | 178 (39.9%) | 230 (46.2%) |
| 3 Vehicles | 48 (10.8%) | 41 (8.2%) |
| 4 Vehicles | 18 (4.0%) | 18 (3.6%) |
| 5 or more Vehicles | 0 (0.0%) | 0 (0.0%) |
| Total | 446 (100.0%) | 498 (100.0%) |
Commute Time in Manchester Center
The most frequently occuring commute durations in Manchester Center are 5 to 9 minutes (262 commuters, 29.9%), 15 to 19 minutes (182 commuters, 20.8%), and 20 to 24 minutes (101 commuters, 11.5%).
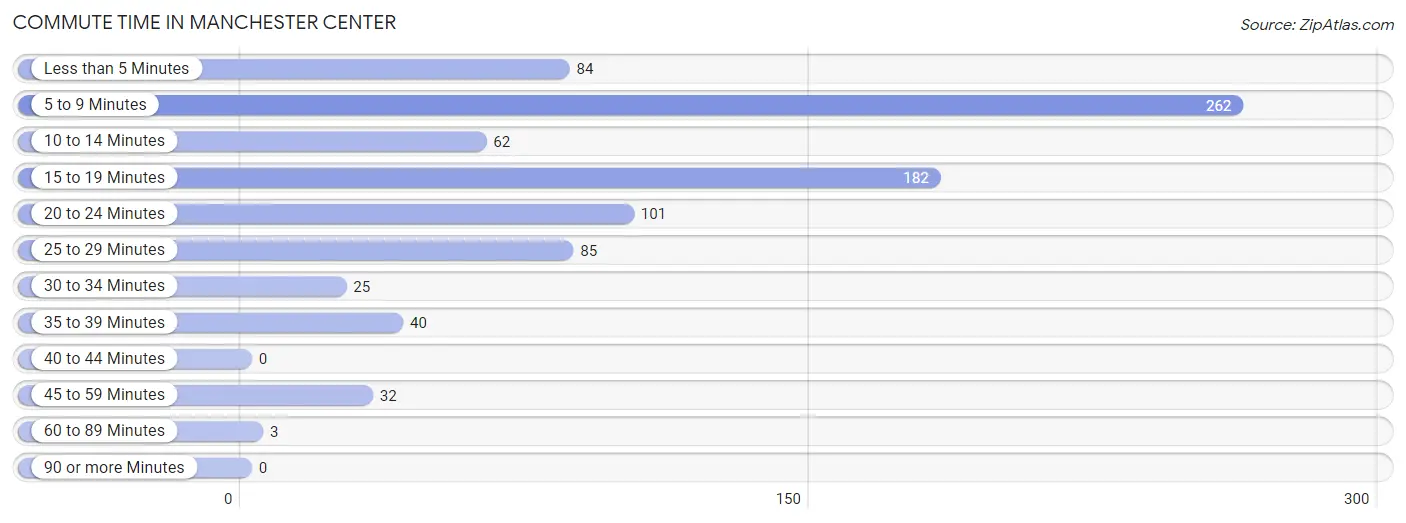
| Commute Time | # Commuters | % Commuters |
| Less than 5 Minutes | 84 | 9.6% |
| 5 to 9 Minutes | 262 | 29.9% |
| 10 to 14 Minutes | 62 | 7.1% |
| 15 to 19 Minutes | 182 | 20.8% |
| 20 to 24 Minutes | 101 | 11.5% |
| 25 to 29 Minutes | 85 | 9.7% |
| 30 to 34 Minutes | 25 | 2.9% |
| 35 to 39 Minutes | 40 | 4.6% |
| 40 to 44 Minutes | 0 | 0.0% |
| 45 to 59 Minutes | 32 | 3.6% |
| 60 to 89 Minutes | 3 | 0.3% |
| 90 or more Minutes | 0 | 0.0% |
Commute Time by Sex in Manchester Center
The most common commute times in Manchester Center are 20 to 24 minutes (101 commuters, 24.3%) for males and 5 to 9 minutes (191 commuters, 41.5%) for females.
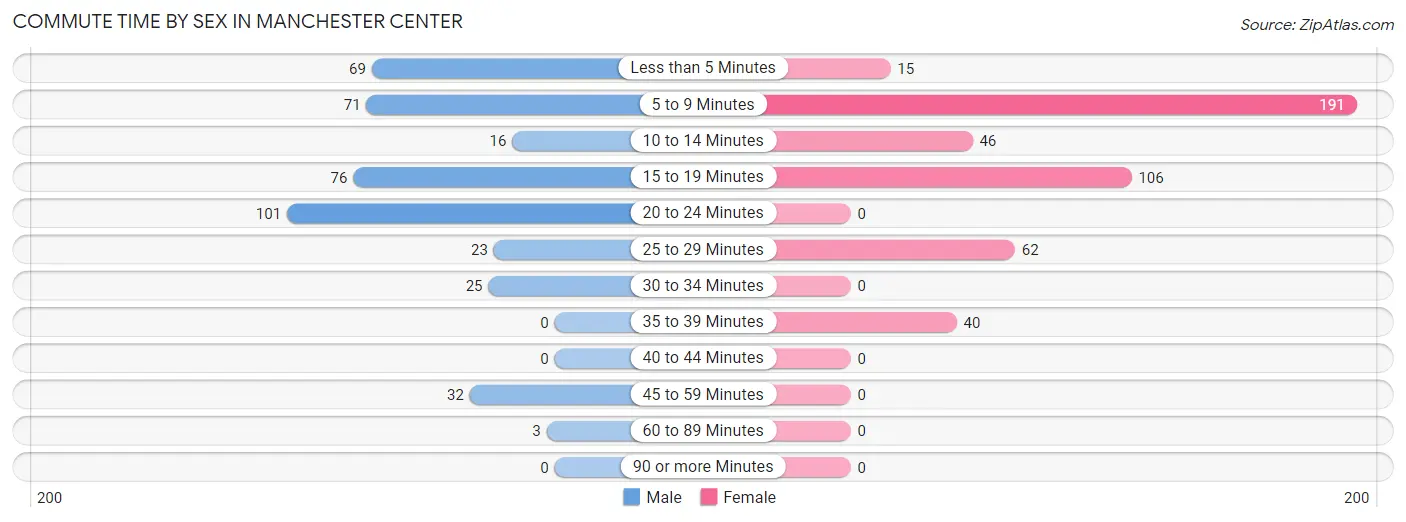
| Commute Time | Male | Female |
| Less than 5 Minutes | 69 (16.6%) | 15 (3.3%) |
| 5 to 9 Minutes | 71 (17.1%) | 191 (41.5%) |
| 10 to 14 Minutes | 16 (3.8%) | 46 (10.0%) |
| 15 to 19 Minutes | 76 (18.3%) | 106 (23.0%) |
| 20 to 24 Minutes | 101 (24.3%) | 0 (0.0%) |
| 25 to 29 Minutes | 23 (5.5%) | 62 (13.5%) |
| 30 to 34 Minutes | 25 (6.0%) | 0 (0.0%) |
| 35 to 39 Minutes | 0 (0.0%) | 40 (8.7%) |
| 40 to 44 Minutes | 0 (0.0%) | 0 (0.0%) |
| 45 to 59 Minutes | 32 (7.7%) | 0 (0.0%) |
| 60 to 89 Minutes | 3 (0.7%) | 0 (0.0%) |
| 90 or more Minutes | 0 (0.0%) | 0 (0.0%) |
Time of Departure to Work by Sex in Manchester Center
The most frequent times of departure to work in Manchester Center are 9:00 AM to 9:59 AM (119, 28.6%) for males and 7:30 AM to 7:59 AM (135, 29.3%) for females.
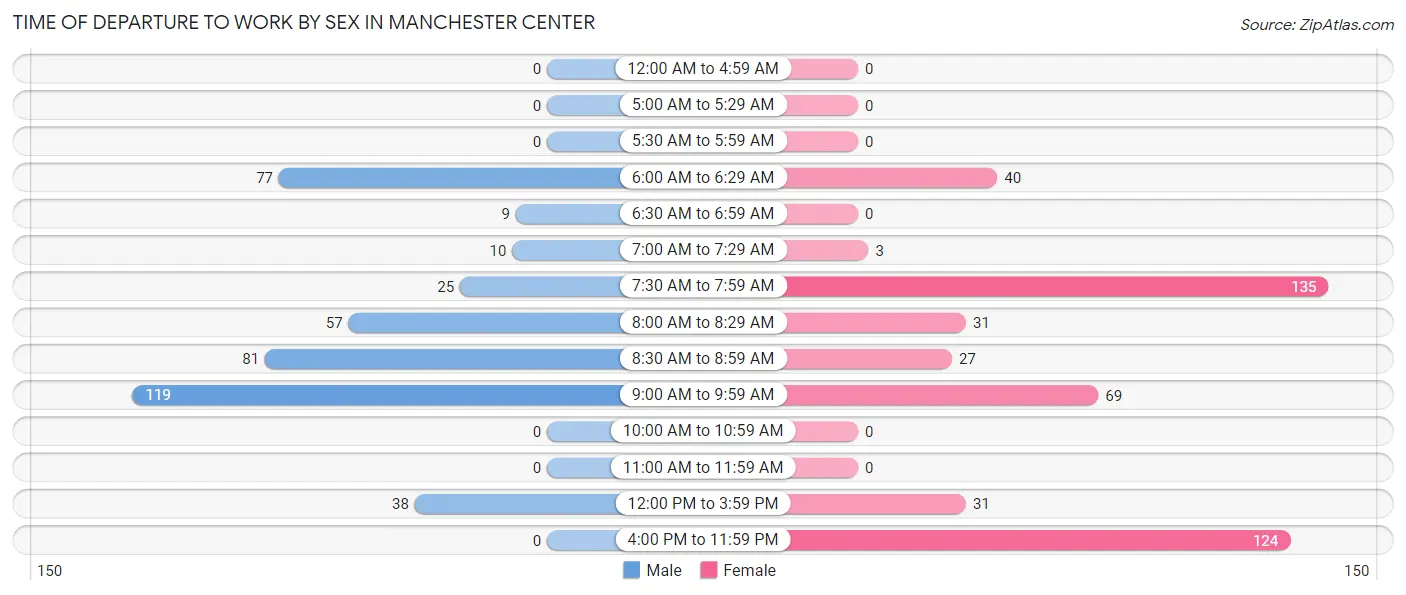
| Time of Departure | Male | Female |
| 12:00 AM to 4:59 AM | 0 (0.0%) | 0 (0.0%) |
| 5:00 AM to 5:29 AM | 0 (0.0%) | 0 (0.0%) |
| 5:30 AM to 5:59 AM | 0 (0.0%) | 0 (0.0%) |
| 6:00 AM to 6:29 AM | 77 (18.5%) | 40 (8.7%) |
| 6:30 AM to 6:59 AM | 9 (2.2%) | 0 (0.0%) |
| 7:00 AM to 7:29 AM | 10 (2.4%) | 3 (0.6%) |
| 7:30 AM to 7:59 AM | 25 (6.0%) | 135 (29.3%) |
| 8:00 AM to 8:29 AM | 57 (13.7%) | 31 (6.7%) |
| 8:30 AM to 8:59 AM | 81 (19.5%) | 27 (5.9%) |
| 9:00 AM to 9:59 AM | 119 (28.6%) | 69 (15.0%) |
| 10:00 AM to 10:59 AM | 0 (0.0%) | 0 (0.0%) |
| 11:00 AM to 11:59 AM | 0 (0.0%) | 0 (0.0%) |
| 12:00 PM to 3:59 PM | 38 (9.1%) | 31 (6.7%) |
| 4:00 PM to 11:59 PM | 0 (0.0%) | 124 (27.0%) |
| Total | 416 (100.0%) | 460 (100.0%) |
Housing Occupancy in Manchester Center
Occupancy by Ownership in Manchester Center
Of the total 762 dwellings in Manchester Center, owner-occupied units account for 539 (70.7%), while renter-occupied units make up 223 (29.3%).
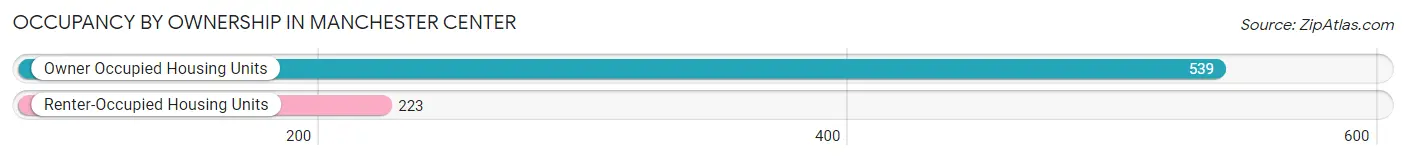
| Occupancy | # Housing Units | % Housing Units |
| Owner Occupied Housing Units | 539 | 70.7% |
| Renter-Occupied Housing Units | 223 | 29.3% |
| Total Occupied Housing Units | 762 | 100.0% |
Occupancy by Household Size in Manchester Center
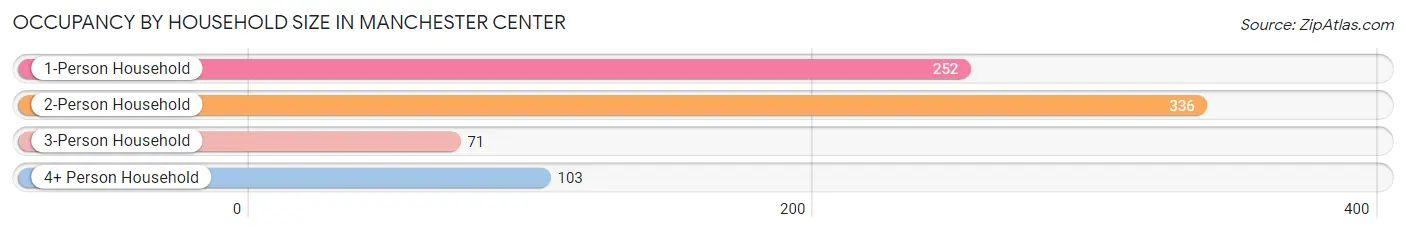
| Household Size | # Housing Units | % Housing Units |
| 1-Person Household | 252 | 33.1% |
| 2-Person Household | 336 | 44.1% |
| 3-Person Household | 71 | 9.3% |
| 4+ Person Household | 103 | 13.5% |
| Total Housing Units | 762 | 100.0% |
Occupancy by Ownership by Household Size in Manchester Center
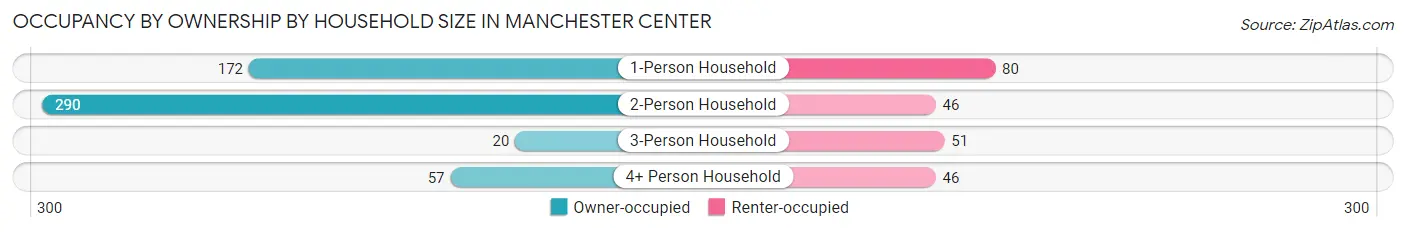
| Household Size | Owner-occupied | Renter-occupied |
| 1-Person Household | 172 (68.2%) | 80 (31.8%) |
| 2-Person Household | 290 (86.3%) | 46 (13.7%) |
| 3-Person Household | 20 (28.2%) | 51 (71.8%) |
| 4+ Person Household | 57 (55.3%) | 46 (44.7%) |
| Total Housing Units | 539 (70.7%) | 223 (29.3%) |
Occupancy by Educational Attainment in Manchester Center
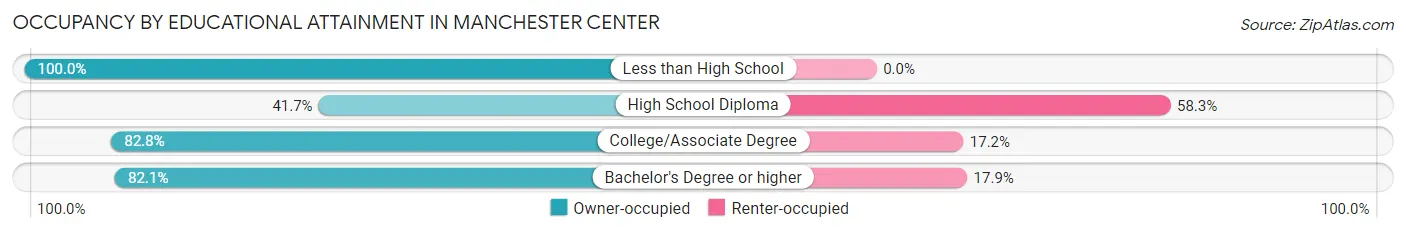
| Household Size | Owner-occupied | Renter-occupied |
| Less than High School | 24 (100.0%) | 0 (0.0%) |
| High School Diploma | 96 (41.7%) | 134 (58.3%) |
| College/Associate Degree | 236 (82.8%) | 49 (17.2%) |
| Bachelor's Degree or higher | 183 (82.1%) | 40 (17.9%) |
Occupancy by Age of Householder in Manchester Center
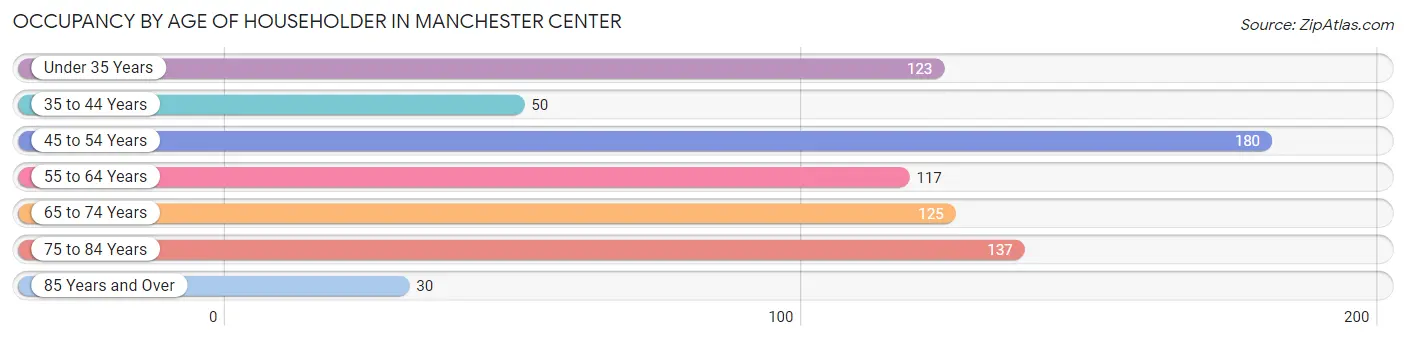
| Age Bracket | # Households | % Households |
| Under 35 Years | 123 | 16.1% |
| 35 to 44 Years | 50 | 6.6% |
| 45 to 54 Years | 180 | 23.6% |
| 55 to 64 Years | 117 | 15.3% |
| 65 to 74 Years | 125 | 16.4% |
| 75 to 84 Years | 137 | 18.0% |
| 85 Years and Over | 30 | 3.9% |
| Total | 762 | 100.0% |
Housing Finances in Manchester Center
Median Income by Occupancy in Manchester Center
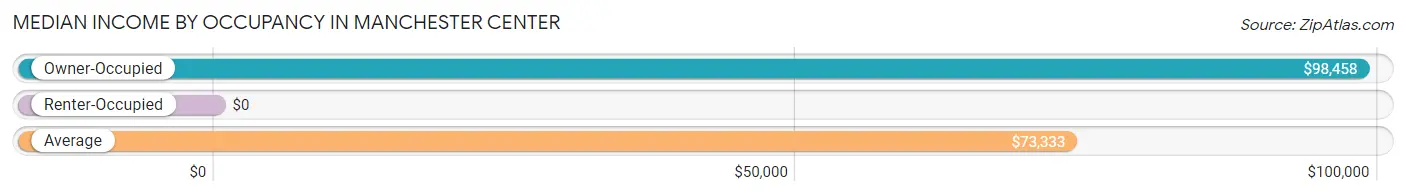
| Occupancy Type | # Households | Median Income |
| Owner-Occupied | 539 (70.7%) | $98,458 |
| Renter-Occupied | 223 (29.3%) | $0 |
| Average | 762 (100.0%) | $73,333 |
Occupancy by Householder Income Bracket in Manchester Center
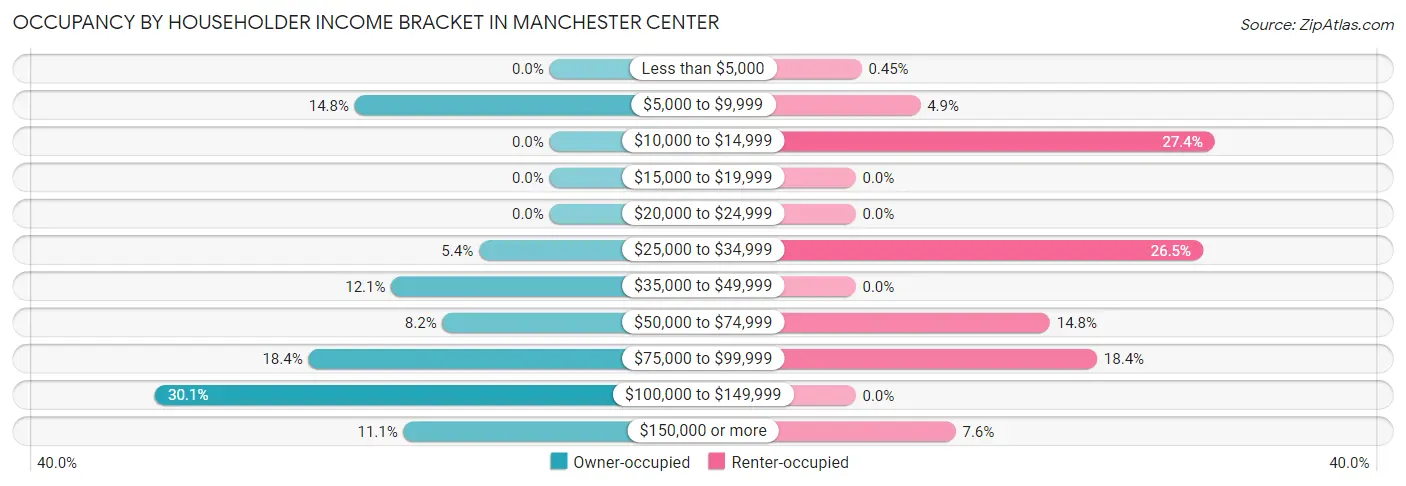
| Income Bracket | Owner-occupied | Renter-occupied |
| Less than $5,000 | 0 (0.0%) | 1 (0.4%) |
| $5,000 to $9,999 | 80 (14.8%) | 11 (4.9%) |
| $10,000 to $14,999 | 0 (0.0%) | 61 (27.4%) |
| $15,000 to $19,999 | 0 (0.0%) | 0 (0.0%) |
| $20,000 to $24,999 | 0 (0.0%) | 0 (0.0%) |
| $25,000 to $34,999 | 29 (5.4%) | 59 (26.5%) |
| $35,000 to $49,999 | 65 (12.1%) | 0 (0.0%) |
| $50,000 to $74,999 | 44 (8.2%) | 33 (14.8%) |
| $75,000 to $99,999 | 99 (18.4%) | 41 (18.4%) |
| $100,000 to $149,999 | 162 (30.1%) | 0 (0.0%) |
| $150,000 or more | 60 (11.1%) | 17 (7.6%) |
| Total | 539 (100.0%) | 223 (100.0%) |
Monthly Housing Cost Tiers in Manchester Center
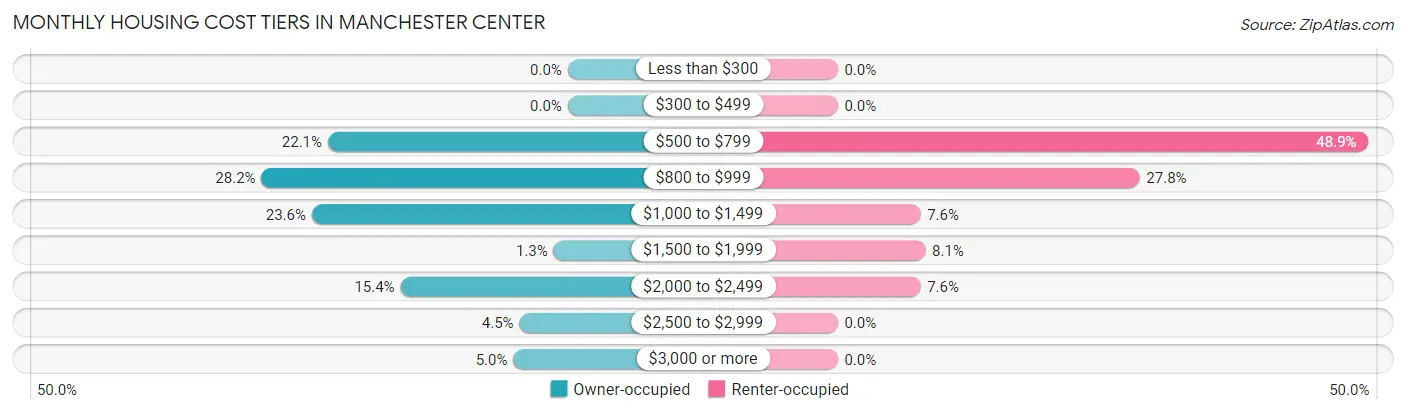
| Monthly Cost | Owner-occupied | Renter-occupied |
| Less than $300 | 0 (0.0%) | 0 (0.0%) |
| $300 to $499 | 0 (0.0%) | 0 (0.0%) |
| $500 to $799 | 119 (22.1%) | 109 (48.9%) |
| $800 to $999 | 152 (28.2%) | 62 (27.8%) |
| $1,000 to $1,499 | 127 (23.6%) | 17 (7.6%) |
| $1,500 to $1,999 | 7 (1.3%) | 18 (8.1%) |
| $2,000 to $2,499 | 83 (15.4%) | 17 (7.6%) |
| $2,500 to $2,999 | 24 (4.4%) | 0 (0.0%) |
| $3,000 or more | 27 (5.0%) | 0 (0.0%) |
| Total | 539 (100.0%) | 223 (100.0%) |
Physical Housing Characteristics in Manchester Center
Housing Structures in Manchester Center
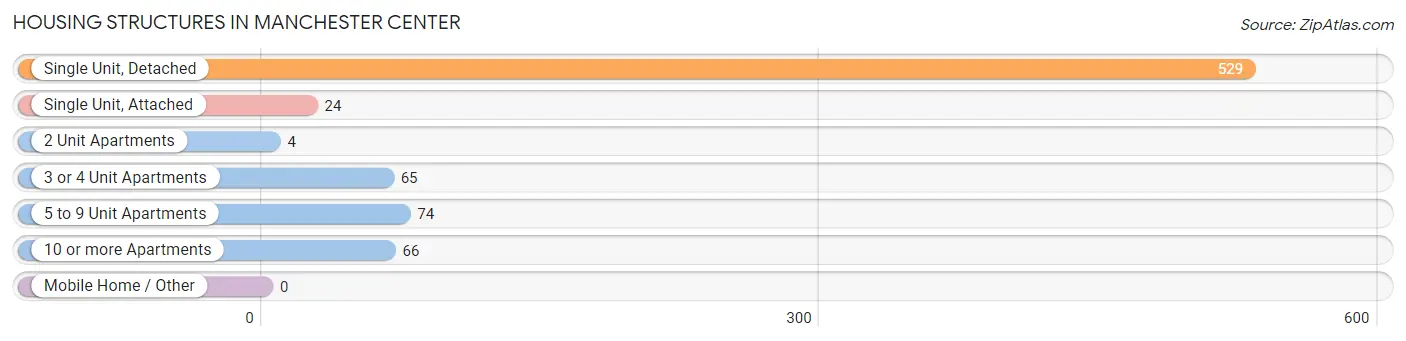
| Structure Type | # Housing Units | % Housing Units |
| Single Unit, Detached | 529 | 69.4% |
| Single Unit, Attached | 24 | 3.2% |
| 2 Unit Apartments | 4 | 0.5% |
| 3 or 4 Unit Apartments | 65 | 8.5% |
| 5 to 9 Unit Apartments | 74 | 9.7% |
| 10 or more Apartments | 66 | 8.7% |
| Mobile Home / Other | 0 | 0.0% |
| Total | 762 | 100.0% |
Housing Structures by Occupancy in Manchester Center
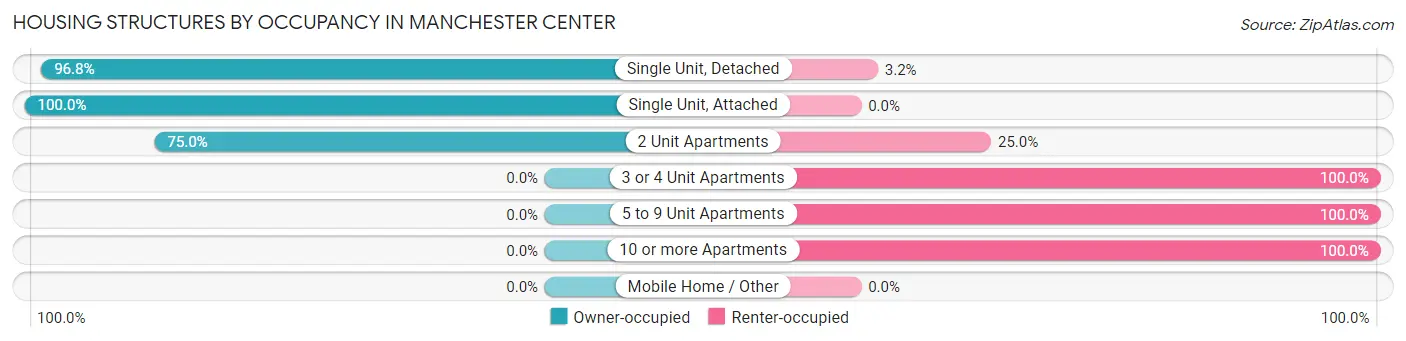
| Structure Type | Owner-occupied | Renter-occupied |
| Single Unit, Detached | 512 (96.8%) | 17 (3.2%) |
| Single Unit, Attached | 24 (100.0%) | 0 (0.0%) |
| 2 Unit Apartments | 3 (75.0%) | 1 (25.0%) |
| 3 or 4 Unit Apartments | 0 (0.0%) | 65 (100.0%) |
| 5 to 9 Unit Apartments | 0 (0.0%) | 74 (100.0%) |
| 10 or more Apartments | 0 (0.0%) | 66 (100.0%) |
| Mobile Home / Other | 0 (0.0%) | 0 (0.0%) |
| Total | 539 (70.7%) | 223 (29.3%) |
Housing Structures by Number of Rooms in Manchester Center
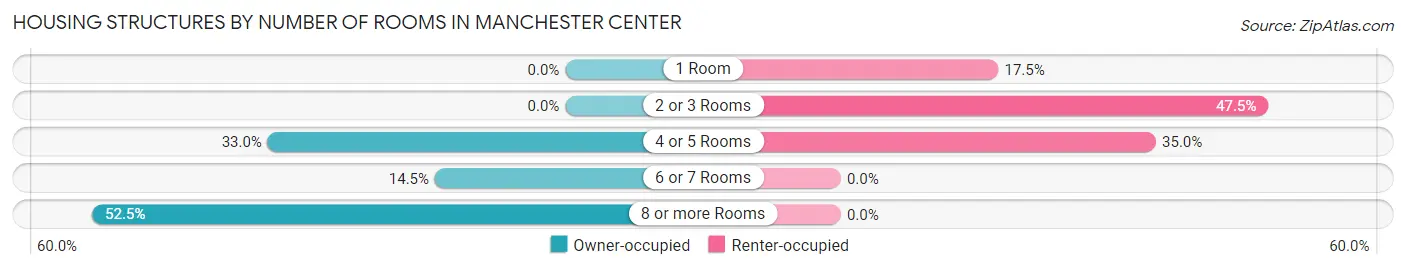
| Number of Rooms | Owner-occupied | Renter-occupied |
| 1 Room | 0 (0.0%) | 39 (17.5%) |
| 2 or 3 Rooms | 0 (0.0%) | 106 (47.5%) |
| 4 or 5 Rooms | 178 (33.0%) | 78 (35.0%) |
| 6 or 7 Rooms | 78 (14.5%) | 0 (0.0%) |
| 8 or more Rooms | 283 (52.5%) | 0 (0.0%) |
| Total | 539 (100.0%) | 223 (100.0%) |
Housing Structure by Heating Type in Manchester Center
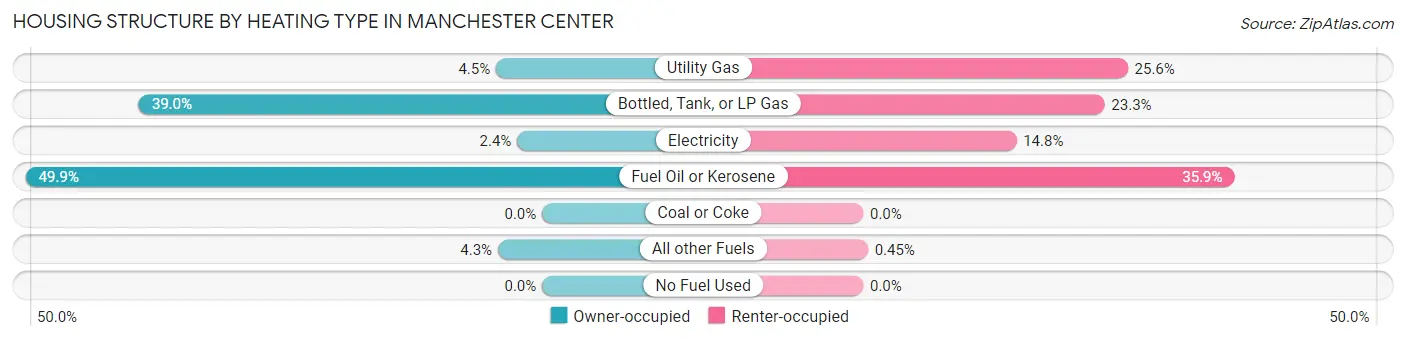
| Heating Type | Owner-occupied | Renter-occupied |
| Utility Gas | 24 (4.4%) | 57 (25.6%) |
| Bottled, Tank, or LP Gas | 210 (39.0%) | 52 (23.3%) |
| Electricity | 13 (2.4%) | 33 (14.8%) |
| Fuel Oil or Kerosene | 269 (49.9%) | 80 (35.9%) |
| Coal or Coke | 0 (0.0%) | 0 (0.0%) |
| All other Fuels | 23 (4.3%) | 1 (0.4%) |
| No Fuel Used | 0 (0.0%) | 0 (0.0%) |
| Total | 539 (100.0%) | 223 (100.0%) |
Household Vehicle Usage in Manchester Center
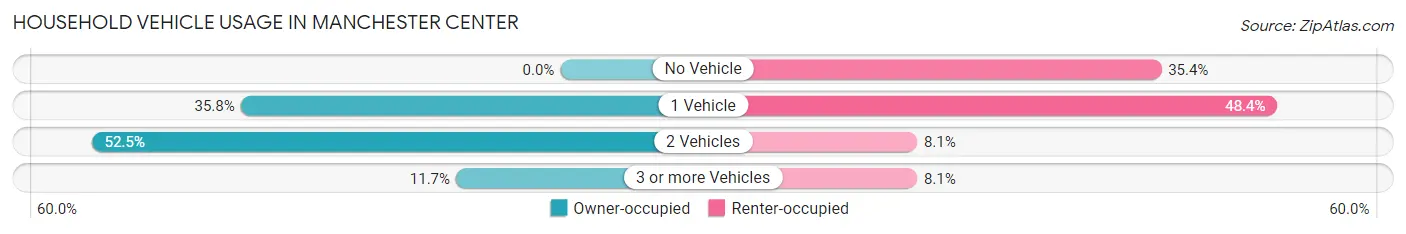
| Vehicles per Household | Owner-occupied | Renter-occupied |
| No Vehicle | 0 (0.0%) | 79 (35.4%) |
| 1 Vehicle | 193 (35.8%) | 108 (48.4%) |
| 2 Vehicles | 283 (52.5%) | 18 (8.1%) |
| 3 or more Vehicles | 63 (11.7%) | 18 (8.1%) |
| Total | 539 (100.0%) | 223 (100.0%) |
Real Estate & Mortgages in Manchester Center
Real Estate and Mortgage Overview in Manchester Center
| Characteristic | Without Mortgage | With Mortgage |
| Housing Units | 240 | 299 |
| Median Property Value | $294,200 | $322,100 |
| Median Household Income | $99,351 | $60 |
| Monthly Housing Costs | $828 | $27 |
| Real Estate Taxes | $4,807 | $3 |
Property Value by Mortgage Status in Manchester Center
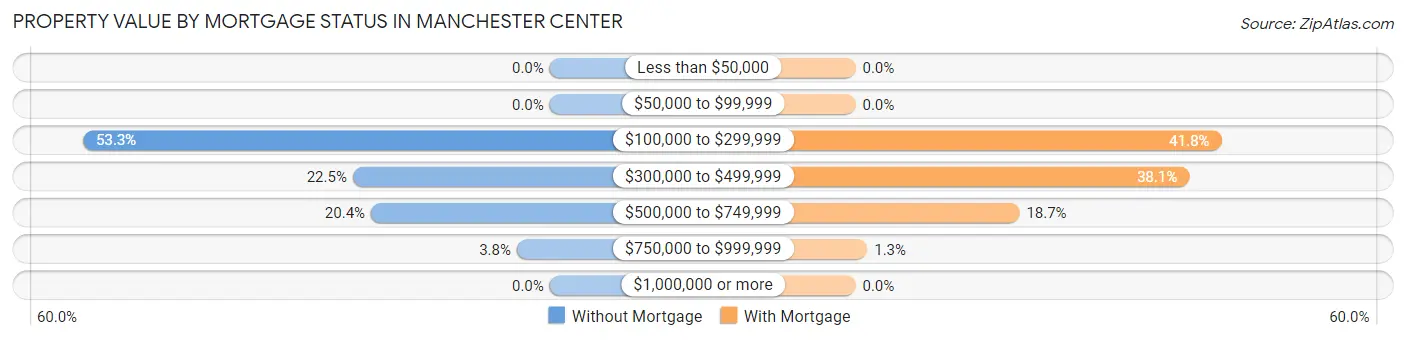
| Property Value | Without Mortgage | With Mortgage |
| Less than $50,000 | 0 (0.0%) | 0 (0.0%) |
| $50,000 to $99,999 | 0 (0.0%) | 0 (0.0%) |
| $100,000 to $299,999 | 128 (53.3%) | 125 (41.8%) |
| $300,000 to $499,999 | 54 (22.5%) | 114 (38.1%) |
| $500,000 to $749,999 | 49 (20.4%) | 56 (18.7%) |
| $750,000 to $999,999 | 9 (3.7%) | 4 (1.3%) |
| $1,000,000 or more | 0 (0.0%) | 0 (0.0%) |
| Total | 240 (100.0%) | 299 (100.0%) |
Household Income by Mortgage Status in Manchester Center
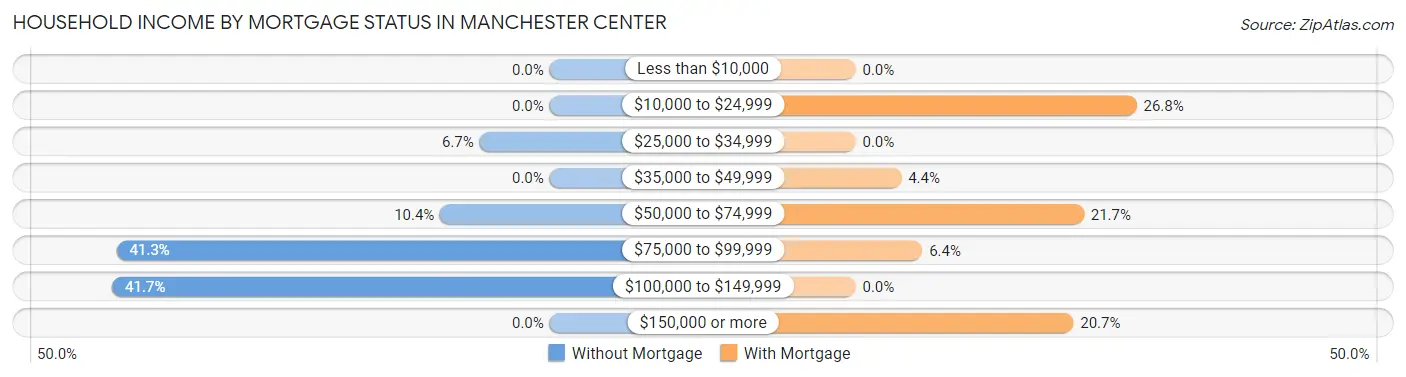
| Household Income | Without Mortgage | With Mortgage |
| Less than $10,000 | 0 (0.0%) | 0 (0.0%) |
| $10,000 to $24,999 | 0 (0.0%) | 80 (26.8%) |
| $25,000 to $34,999 | 16 (6.7%) | 0 (0.0%) |
| $35,000 to $49,999 | 0 (0.0%) | 13 (4.3%) |
| $50,000 to $74,999 | 25 (10.4%) | 65 (21.7%) |
| $75,000 to $99,999 | 99 (41.2%) | 19 (6.4%) |
| $100,000 to $149,999 | 100 (41.7%) | 0 (0.0%) |
| $150,000 or more | 0 (0.0%) | 62 (20.7%) |
| Total | 240 (100.0%) | 299 (100.0%) |
Property Value to Household Income Ratio in Manchester Center
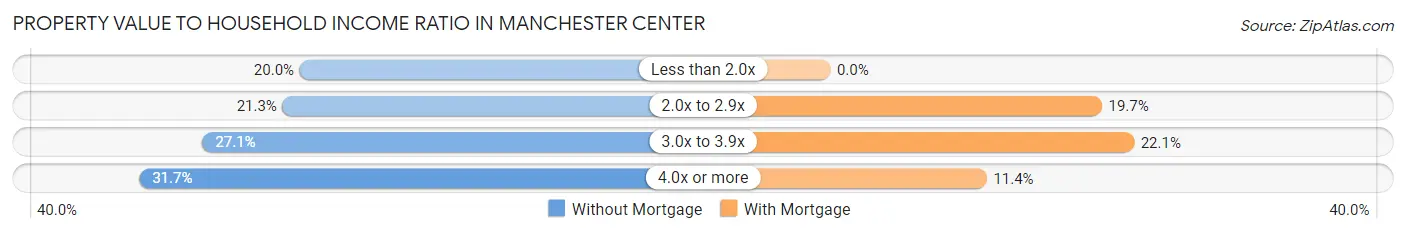
| Value-to-Income Ratio | Without Mortgage | With Mortgage |
| Less than 2.0x | 48 (20.0%) | 0 (0.0%) |
| 2.0x to 2.9x | 51 (21.2%) | 59 (19.7%) |
| 3.0x to 3.9x | 65 (27.1%) | 66 (22.1%) |
| 4.0x or more | 76 (31.7%) | 34 (11.4%) |
| Total | 240 (100.0%) | 299 (100.0%) |
Real Estate Taxes by Mortgage Status in Manchester Center
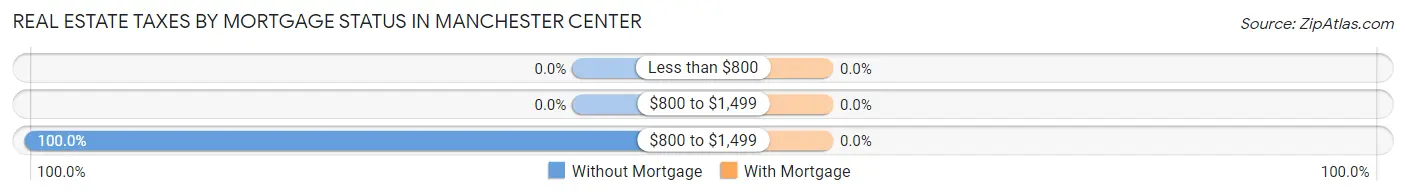
| Property Taxes | Without Mortgage | With Mortgage |
| Less than $800 | 0 (0.0%) | 0 (0.0%) |
| $800 to $1,499 | 0 (0.0%) | 0 (0.0%) |
| $800 to $1,499 | 240 (100.0%) | 0 (0.0%) |
| Total | 240 (100.0%) | 299 (100.0%) |
Health & Disability in Manchester Center
Health Insurance Coverage by Age in Manchester Center
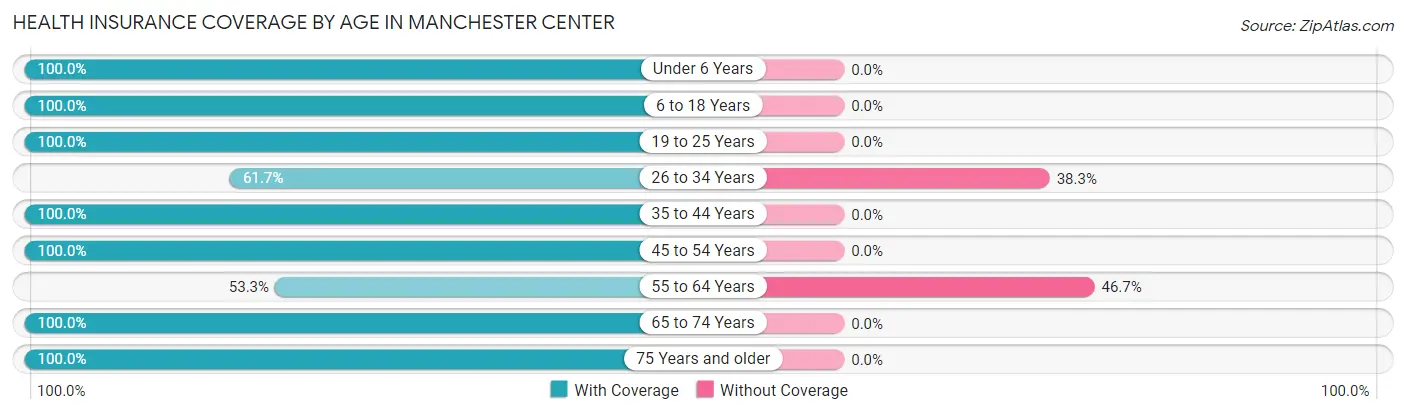
| Age Bracket | With Coverage | Without Coverage |
| Under 6 Years | 212 (100.0%) | 0 (0.0%) |
| 6 to 18 Years | 153 (100.0%) | 0 (0.0%) |
| 19 to 25 Years | 190 (100.0%) | 0 (0.0%) |
| 26 to 34 Years | 95 (61.7%) | 59 (38.3%) |
| 35 to 44 Years | 95 (100.0%) | 0 (0.0%) |
| 45 to 54 Years | 340 (100.0%) | 0 (0.0%) |
| 55 to 64 Years | 184 (53.3%) | 161 (46.7%) |
| 65 to 74 Years | 156 (100.0%) | 0 (0.0%) |
| 75 Years and older | 184 (100.0%) | 0 (0.0%) |
| Total | 1,609 (88.0%) | 220 (12.0%) |
Health Insurance Coverage by Citizenship Status in Manchester Center
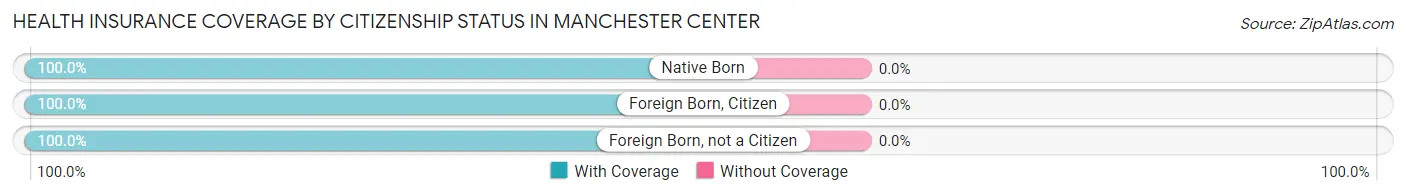
| Citizenship Status | With Coverage | Without Coverage |
| Native Born | 212 (100.0%) | 0 (0.0%) |
| Foreign Born, Citizen | 153 (100.0%) | 0 (0.0%) |
| Foreign Born, not a Citizen | 190 (100.0%) | 0 (0.0%) |
Health Insurance Coverage by Household Income in Manchester Center
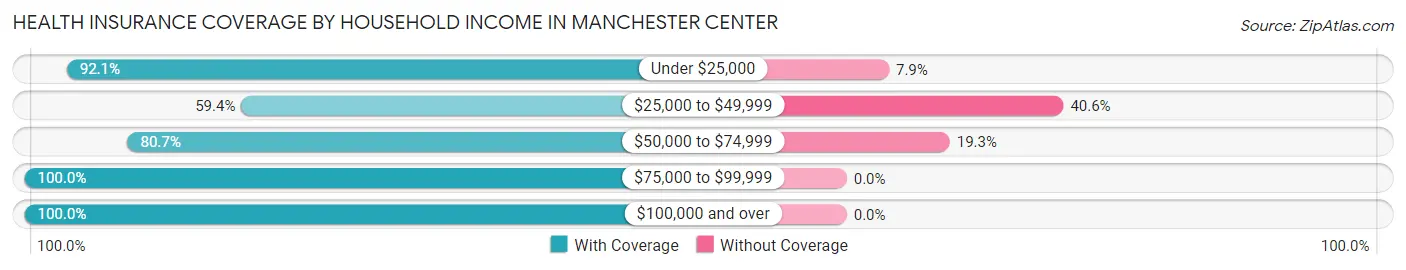
| Household Income | With Coverage | Without Coverage |
| Under $25,000 | 291 (92.1%) | 25 (7.9%) |
| $25,000 to $49,999 | 221 (59.4%) | 151 (40.6%) |
| $50,000 to $74,999 | 184 (80.7%) | 44 (19.3%) |
| $75,000 to $99,999 | 337 (100.0%) | 0 (0.0%) |
| $100,000 and over | 568 (100.0%) | 0 (0.0%) |
Public vs Private Health Insurance Coverage by Age in Manchester Center
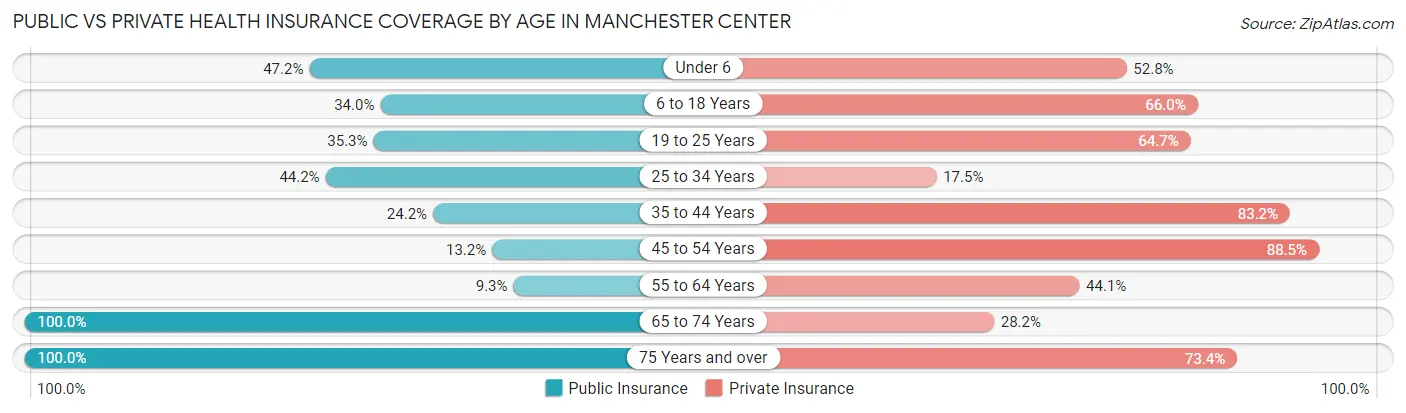
| Age Bracket | Public Insurance | Private Insurance |
| Under 6 | 100 (47.2%) | 112 (52.8%) |
| 6 to 18 Years | 52 (34.0%) | 101 (66.0%) |
| 19 to 25 Years | 67 (35.3%) | 123 (64.7%) |
| 25 to 34 Years | 68 (44.2%) | 27 (17.5%) |
| 35 to 44 Years | 23 (24.2%) | 79 (83.2%) |
| 45 to 54 Years | 45 (13.2%) | 301 (88.5%) |
| 55 to 64 Years | 32 (9.3%) | 152 (44.1%) |
| 65 to 74 Years | 156 (100.0%) | 44 (28.2%) |
| 75 Years and over | 184 (100.0%) | 135 (73.4%) |
| Total | 727 (39.8%) | 1,074 (58.7%) |
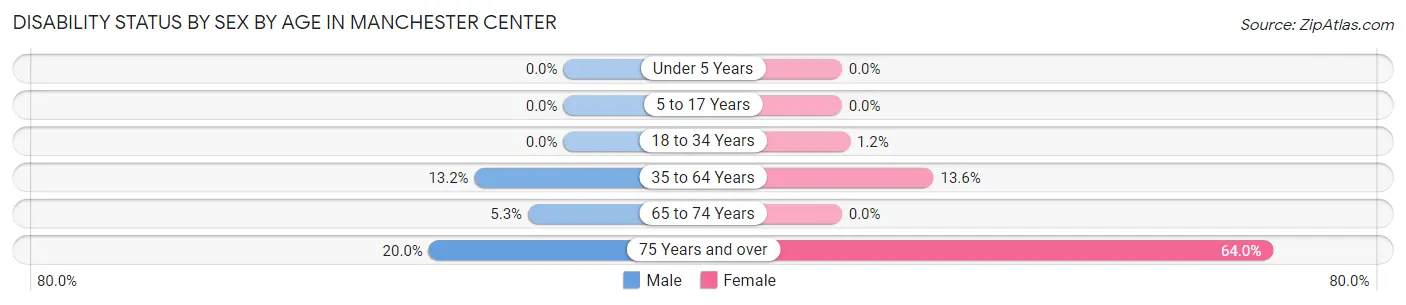
Disability Status by Sex by Age in Manchester Center
| Age Bracket | Male | Female |
| Under 5 Years | 0 (0.0%) | 0 (0.0%) |
| 5 to 17 Years | 0 (0.0%) | 0 (0.0%) |
| 18 to 34 Years | 0 (0.0%) | 2 (1.2%) |
| 35 to 64 Years | 40 (13.2%) | 65 (13.6%) |
| 65 to 74 Years | 4 (5.3%) | 0 (0.0%) |
| 75 Years and over | 9 (20.0%) | 89 (64.0%) |
Disability Class by Sex by Age in Manchester Center
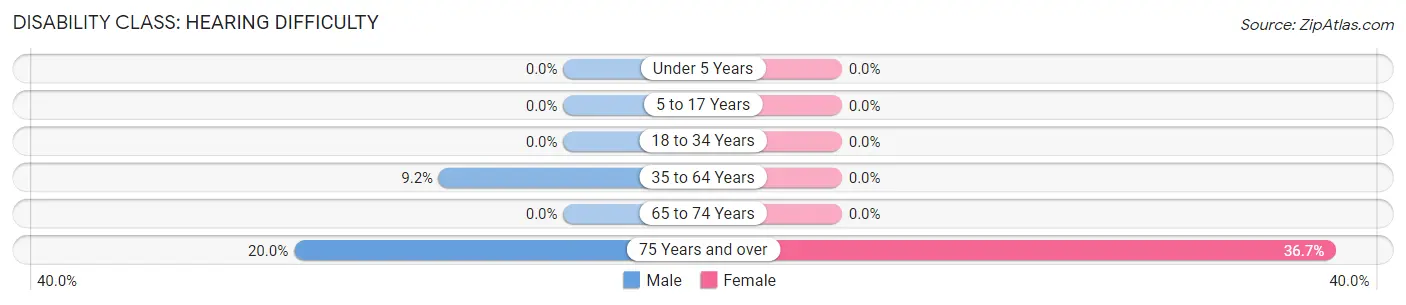
Disability Class: Hearing Difficulty
| Age Bracket | Male | Female |
| Under 5 Years | 0 (0.0%) | 0 (0.0%) |
| 5 to 17 Years | 0 (0.0%) | 0 (0.0%) |
| 18 to 34 Years | 0 (0.0%) | 0 (0.0%) |
| 35 to 64 Years | 28 (9.2%) | 0 (0.0%) |
| 65 to 74 Years | 0 (0.0%) | 0 (0.0%) |
| 75 Years and over | 9 (20.0%) | 51 (36.7%) |
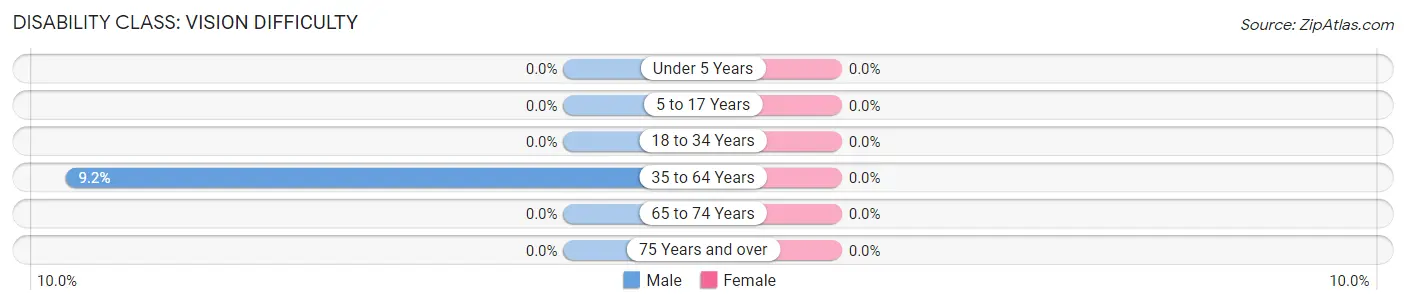
Disability Class: Vision Difficulty
| Age Bracket | Male | Female |
| Under 5 Years | 0 (0.0%) | 0 (0.0%) |
| 5 to 17 Years | 0 (0.0%) | 0 (0.0%) |
| 18 to 34 Years | 0 (0.0%) | 0 (0.0%) |
| 35 to 64 Years | 28 (9.2%) | 0 (0.0%) |
| 65 to 74 Years | 0 (0.0%) | 0 (0.0%) |
| 75 Years and over | 0 (0.0%) | 0 (0.0%) |
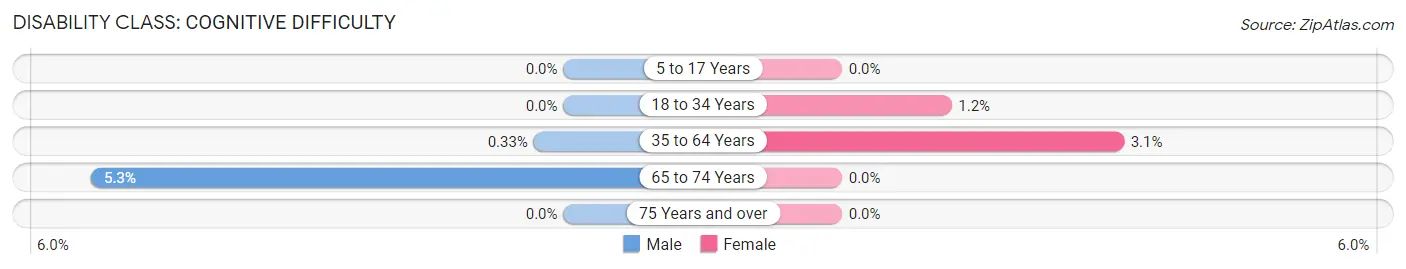
Disability Class: Cognitive Difficulty
| Age Bracket | Male | Female |
| 5 to 17 Years | 0 (0.0%) | 0 (0.0%) |
| 18 to 34 Years | 0 (0.0%) | 2 (1.2%) |
| 35 to 64 Years | 1 (0.3%) | 15 (3.1%) |
| 65 to 74 Years | 4 (5.3%) | 0 (0.0%) |
| 75 Years and over | 0 (0.0%) | 0 (0.0%) |
Disability Class: Ambulatory Difficulty
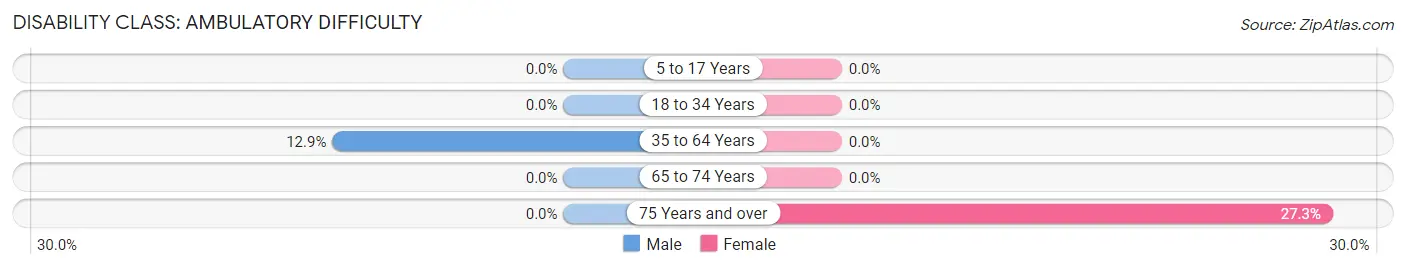
| Age Bracket | Male | Female |
| 5 to 17 Years | 0 (0.0%) | 0 (0.0%) |
| 18 to 34 Years | 0 (0.0%) | 0 (0.0%) |
| 35 to 64 Years | 39 (12.9%) | 0 (0.0%) |
| 65 to 74 Years | 0 (0.0%) | 0 (0.0%) |
| 75 Years and over | 0 (0.0%) | 38 (27.3%) |
Disability Class: Self-Care Difficulty
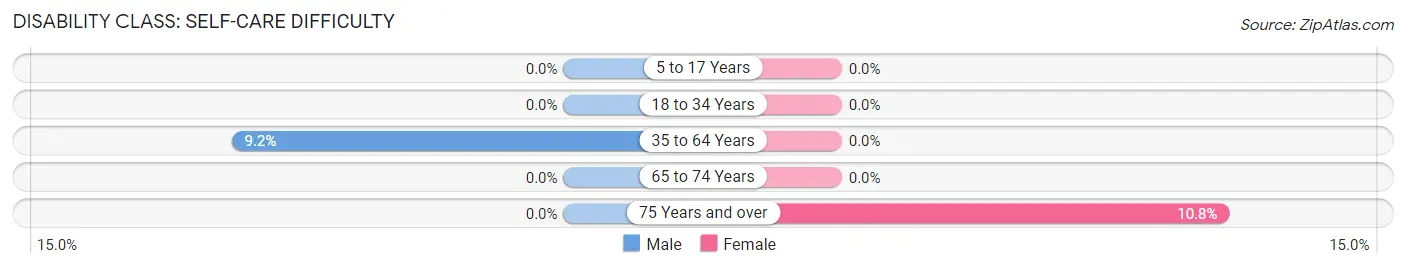
| Age Bracket | Male | Female |
| 5 to 17 Years | 0 (0.0%) | 0 (0.0%) |
| 18 to 34 Years | 0 (0.0%) | 0 (0.0%) |
| 35 to 64 Years | 28 (9.2%) | 0 (0.0%) |
| 65 to 74 Years | 0 (0.0%) | 0 (0.0%) |
| 75 Years and over | 0 (0.0%) | 15 (10.8%) |
Technology Access in Manchester Center
Computing Device Access in Manchester Center
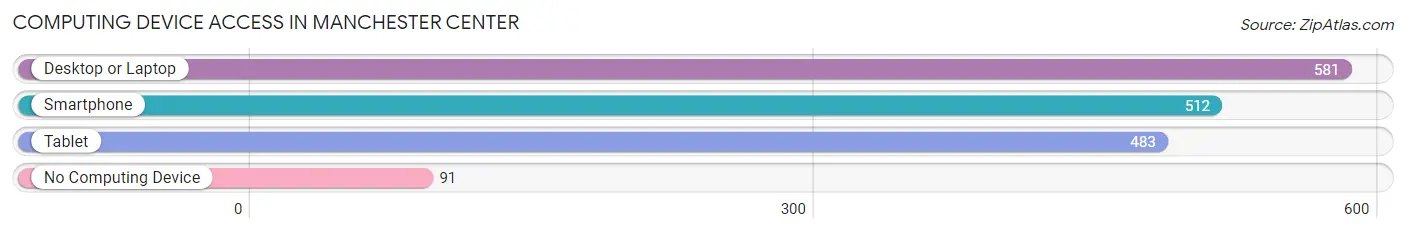
| Device Type | # Households | % Households |
| Desktop or Laptop | 581 | 76.2% |
| Smartphone | 512 | 67.2% |
| Tablet | 483 | 63.4% |
| No Computing Device | 91 | 11.9% |
| Total | 762 | 100.0% |
Internet Access in Manchester Center
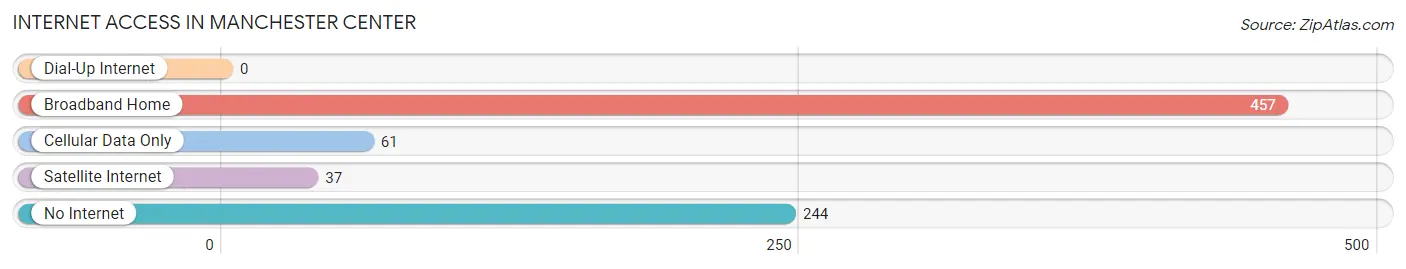
| Internet Type | # Households | % Households |
| Dial-Up Internet | 0 | 0.0% |
| Broadband Home | 457 | 60.0% |
| Cellular Data Only | 61 | 8.0% |
| Satellite Internet | 37 | 4.9% |
| No Internet | 244 | 32.0% |
| Total | 762 | 100.0% |
Manchester Center Summary
Introduction
Manchester Center is a town located in the state of Vermont in the United States. It is located in the southwestern part of the state, in the Green Mountains region. The town is home to about 4,000 people and is the largest town in the county of Bennington. Manchester Center is known for its picturesque scenery, outdoor activities, and its vibrant downtown area.
History
The area that is now Manchester Center was first settled in 1764 by a group of settlers from Massachusetts. The town was originally called Manchester, but the name was changed to Manchester Center in 1807. The town was an important stop on the stagecoach route between Albany, New York and Bennington, Vermont. The town was also an important stop on the railroad line that ran between Rutland and Bennington.
The town was an important center of industry in the 19th century. The town was home to several mills, including a paper mill, a woolen mill, and a sawmill. The town was also home to several factories, including a shoe factory and a furniture factory.
The town was also an important center of education in the 19th century. The town was home to several schools, including the Manchester Academy, which was founded in 1819. The academy was an important center of learning for the region and was attended by many prominent figures, including President Chester A. Arthur.
Geography
Manchester Center is located in the southwestern part of the state of Vermont. The town is located in the Green Mountains region of the state. The town is bordered by the towns of Dorset to the north, Sunderland to the east, and Arlington to the south. The town is located about 25 miles south of the state capital of Montpelier.
The town is located in a valley surrounded by the Green Mountains. The town is located at the confluence of the Batten Kill and the Walloomsac Rivers. The town is located at an elevation of about 1,000 feet above sea level.
Economy
The economy of Manchester Center is largely based on tourism. The town is home to several ski resorts, including Bromley Mountain and Stratton Mountain. The town is also home to several golf courses, including the Manchester Country Club. The town is also home to several shops and restaurants, as well as several art galleries.
The town is also home to several manufacturing companies, including a paper mill, a furniture factory, and a shoe factory. The town is also home to several small businesses, including several retail stores and restaurants.
Demographics
As of the 2010 census, the population of Manchester Center was 4,180. The population is largely white, with about 95% of the population being white. The median household income in the town is about $50,000. The median age in the town is about 44 years old.
Conclusion
Manchester Center is a town located in the southwestern part of the state of Vermont. The town is known for its picturesque scenery, outdoor activities, and its vibrant downtown area. The town is home to several ski resorts, golf courses, shops, and restaurants. The town is also home to several manufacturing companies and small businesses. The population of the town is largely white, with a median household income of about $50,000.
Common Questions
What is Per Capita Income in Manchester Center?
Per Capita income in Manchester Center is $40,937.
What is the Median Family Income in Manchester Center?
Median Family Income in Manchester Center is $97,971.
What is the Median Household income in Manchester Center?
Median Household Income in Manchester Center is $73,333.
What is Income or Wage Gap in Manchester Center?
Income or Wage Gap in Manchester Center is 11.5%.
Women in Manchester Center earn 88.5 cents for every dollar earned by a man.
What is Inequality or Gini Index in Manchester Center?
Inequality or Gini Index in Manchester Center is 0.47.
What is the Total Population of Manchester Center?
Total Population of Manchester Center is 1,835.
What is the Total Male Population of Manchester Center?
Total Male Population of Manchester Center is 744.
What is the Total Female Population of Manchester Center?
Total Female Population of Manchester Center is 1,091.
What is the Ratio of Males per 100 Females in Manchester Center?
There are 68.19 Males per 100 Females in Manchester Center.
What is the Ratio of Females per 100 Males in Manchester Center?
There are 146.64 Females per 100 Males in Manchester Center.
What is the Median Population Age in Manchester Center?
Median Population Age in Manchester Center is 49.6 Years.
What is the Average Family Size in Manchester Center
Average Family Size in Manchester Center is 3.0 People.
What is the Average Household Size in Manchester Center
Average Household Size in Manchester Center is 2.4 People.
How Large is the Labor Force in Manchester Center?
There are 981 People in the Labor Forcein in Manchester Center.
What is the Percentage of People in the Labor Force in Manchester Center?
66.0% of People are in the Labor Force in Manchester Center.
What is the Unemployment Rate in Manchester Center?
Unemployment Rate in Manchester Center is 3.4%.