Johnson, VT Map & Demographics
Johnson Map
Johnson Overview
$23,989
PER CAPITA INCOME
$48,856
AVG FAMILY INCOME
$49,016
AVG HOUSEHOLD INCOME
61.7%
WAGE / INCOME GAP [ % ]
38.3¢/ $1
WAGE / INCOME GAP [ $ ]
$12,630
FAMILY INCOME DEFICIT
0.40
INEQUALITY / GINI INDEX
1,347
TOTAL POPULATION
589
MALE POPULATION
758
FEMALE POPULATION
77.70
MALES / 100 FEMALES
128.69
FEMALES / 100 MALES
22.1
MEDIAN AGE
2.7
AVG FAMILY SIZE
2.2
AVG HOUSEHOLD SIZE
783
LABOR FORCE [ PEOPLE ]
73.7%
PERCENT IN LABOR FORCE
10.1%
UNEMPLOYMENT RATE
Johnson Zip Codes
Johnson Area Codes
Income in Johnson
Income Overview in Johnson
Per Capita Income in Johnson is $23,989, while median incomes of families and households are $48,856 and $49,016 respectively.
| Characteristic | Number | Measure |
| Per Capita Income | 1,347 | $23,989 |
| Median Family Income | 261 | $48,856 |
| Mean Family Income | 261 | $64,216 |
| Median Household Income | 457 | $49,016 |
| Mean Household Income | 457 | $56,366 |
| Income Deficit | 261 | $12,630 |
| Wage / Income Gap (%) | 1,347 | 61.70% |
| Wage / Income Gap ($) | 1,347 | 38.30¢ per $1 |
| Gini / Inequality Index | 1,347 | 0.40 |
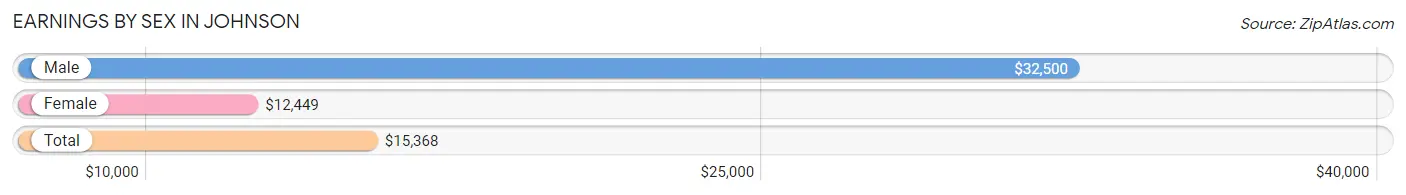
Earnings by Sex in Johnson
Average Earnings in Johnson are $15,368, $32,500 for men and $12,449 for women, a difference of 61.7%.
| Sex | Number | Average Earnings |
| Male | 346 (39.8%) | $32,500 |
| Female | 523 (60.2%) | $12,449 |
| Total | 869 (100.0%) | $15,368 |
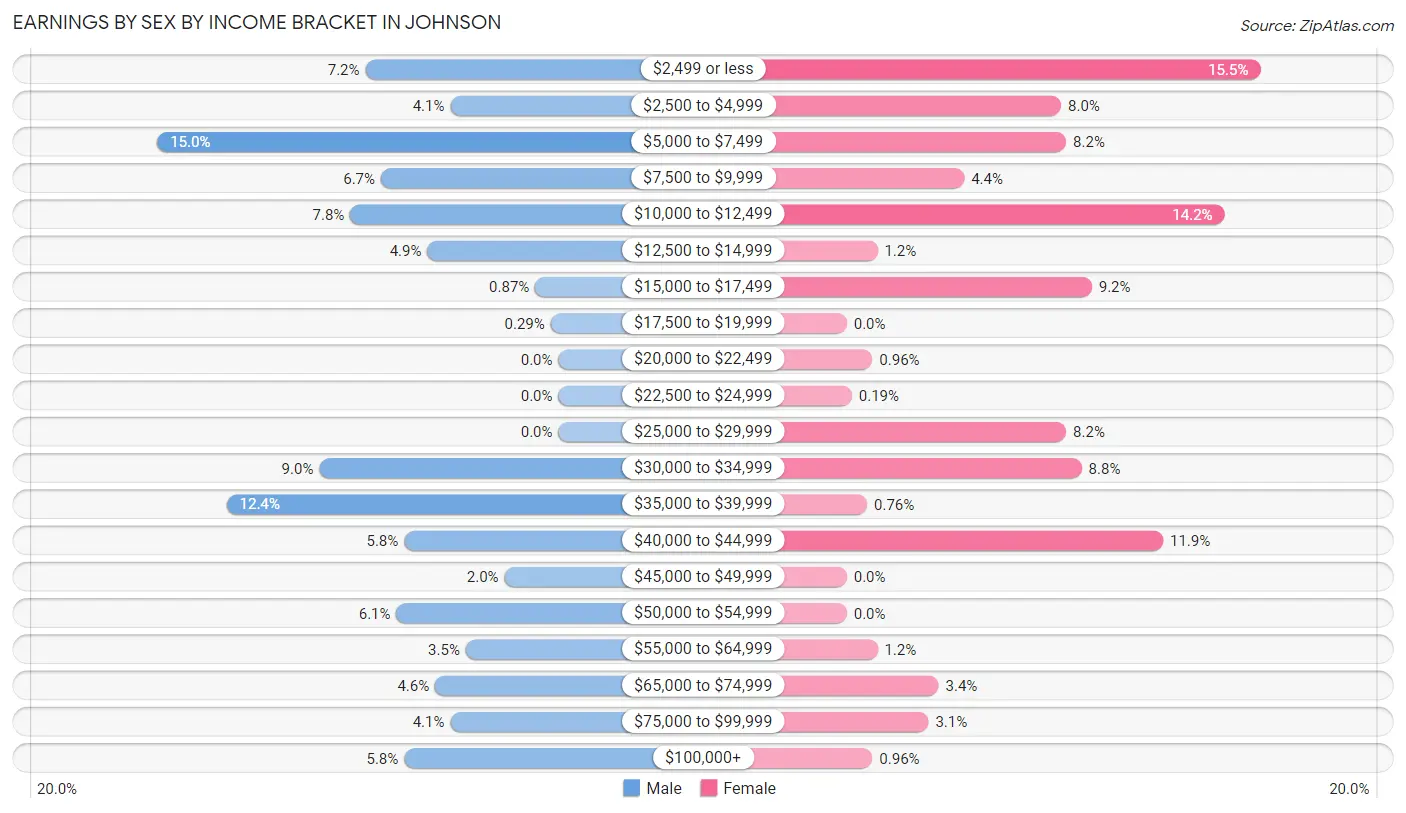
Earnings by Sex by Income Bracket in Johnson
The most common earnings brackets in Johnson are $5,000 to $7,499 for men (52 | 15.0%) and $2,499 or less for women (81 | 15.5%).
| Income | Male | Female |
| $2,499 or less | 25 (7.2%) | 81 (15.5%) |
| $2,500 to $4,999 | 14 (4.1%) | 42 (8.0%) |
| $5,000 to $7,499 | 52 (15.0%) | 43 (8.2%) |
| $7,500 to $9,999 | 23 (6.7%) | 23 (4.4%) |
| $10,000 to $12,499 | 27 (7.8%) | 74 (14.1%) |
| $12,500 to $14,999 | 17 (4.9%) | 6 (1.1%) |
| $15,000 to $17,499 | 3 (0.9%) | 48 (9.2%) |
| $17,500 to $19,999 | 1 (0.3%) | 0 (0.0%) |
| $20,000 to $22,499 | 0 (0.0%) | 5 (1.0%) |
| $22,500 to $24,999 | 0 (0.0%) | 1 (0.2%) |
| $25,000 to $29,999 | 0 (0.0%) | 43 (8.2%) |
| $30,000 to $34,999 | 31 (9.0%) | 46 (8.8%) |
| $35,000 to $39,999 | 43 (12.4%) | 4 (0.8%) |
| $40,000 to $44,999 | 20 (5.8%) | 62 (11.8%) |
| $45,000 to $49,999 | 7 (2.0%) | 0 (0.0%) |
| $50,000 to $54,999 | 21 (6.1%) | 0 (0.0%) |
| $55,000 to $64,999 | 12 (3.5%) | 6 (1.1%) |
| $65,000 to $74,999 | 16 (4.6%) | 18 (3.4%) |
| $75,000 to $99,999 | 14 (4.1%) | 16 (3.1%) |
| $100,000+ | 20 (5.8%) | 5 (1.0%) |
| Total | 346 (100.0%) | 523 (100.0%) |
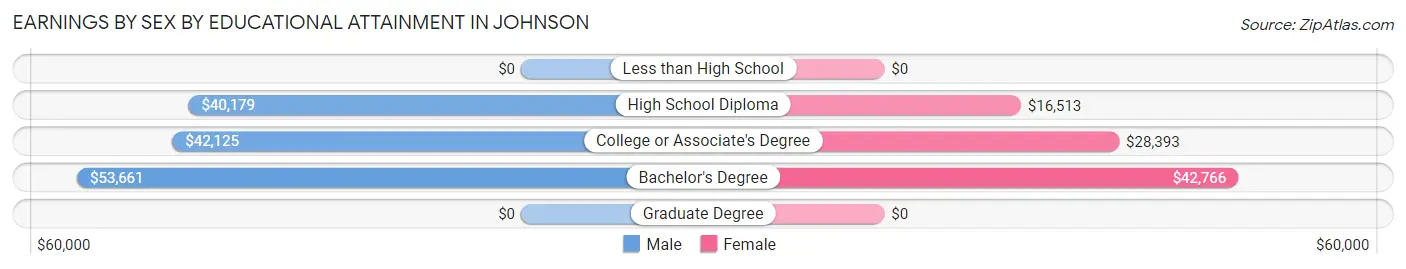
Earnings by Sex by Educational Attainment in Johnson
Average earnings in Johnson are $46,429 for men and $28,125 for women, a difference of 39.4%. Men with an educational attainment of bachelor's degree enjoy the highest average annual earnings of $53,661, while those with high school diploma education earn the least with $40,179. Women with an educational attainment of bachelor's degree earn the most with the average annual earnings of $42,766, while those with high school diploma education have the smallest earnings of $16,513.
| Educational Attainment | Male Income | Female Income |
| Less than High School | - | - |
| High School Diploma | $40,179 | $16,513 |
| College or Associate's Degree | $42,125 | $28,393 |
| Bachelor's Degree | $53,661 | $42,766 |
| Graduate Degree | - | - |
| Total | $46,429 | $28,125 |
Family Income in Johnson
Family Income Brackets in Johnson
According to the Johnson family income data, there are 103 families falling into the $35,000 to $49,999 income range, which is the most common income bracket and makes up 39.5% of all families.
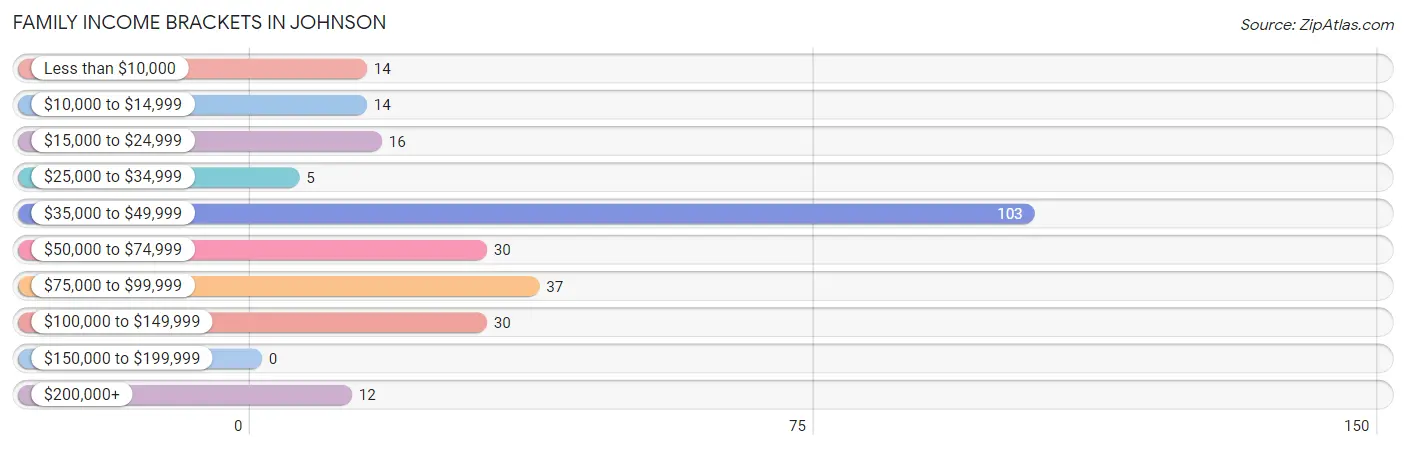
| Income Bracket | # Families | % Families |
| Less than $10,000 | 14 | 5.4% |
| $10,000 to $14,999 | 14 | 5.4% |
| $15,000 to $24,999 | 16 | 6.1% |
| $25,000 to $34,999 | 5 | 1.9% |
| $35,000 to $49,999 | 103 | 39.5% |
| $50,000 to $74,999 | 30 | 11.5% |
| $75,000 to $99,999 | 37 | 14.2% |
| $100,000 to $149,999 | 30 | 11.5% |
| $150,000 to $199,999 | 0 | 0.0% |
| $200,000+ | 12 | 4.6% |
Family Income by Famaliy Size in Johnson
3-person families (26 | 10.0%) account for the highest median family income in Johnson with $61,667 per family, while 2-person families (145 | 55.6%) have the highest median income of $22,176 per family member.
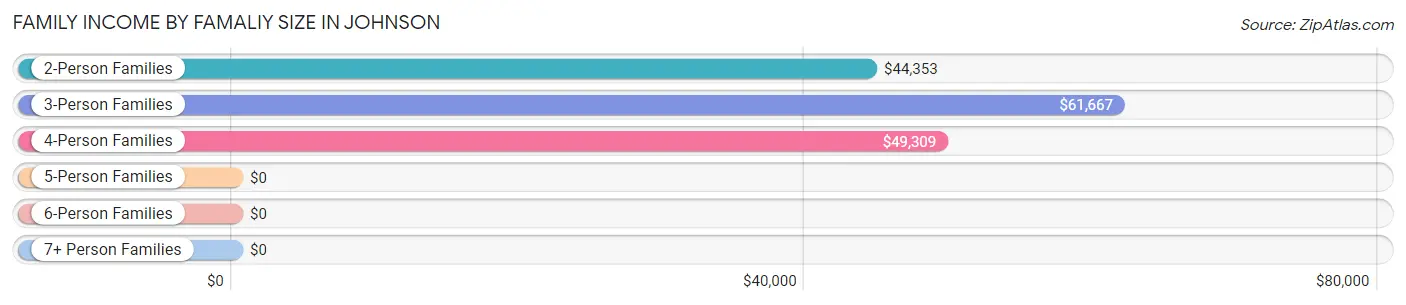
| Income Bracket | # Families | Median Income |
| 2-Person Families | 145 (55.6%) | $44,353 |
| 3-Person Families | 26 (10.0%) | $61,667 |
| 4-Person Families | 88 (33.7%) | $49,309 |
| 5-Person Families | 2 (0.8%) | $0 |
| 6-Person Families | 0 (0.0%) | $0 |
| 7+ Person Families | 0 (0.0%) | $0 |
| Total | 261 (100.0%) | $48,856 |
Family Income by Number of Earners in Johnson
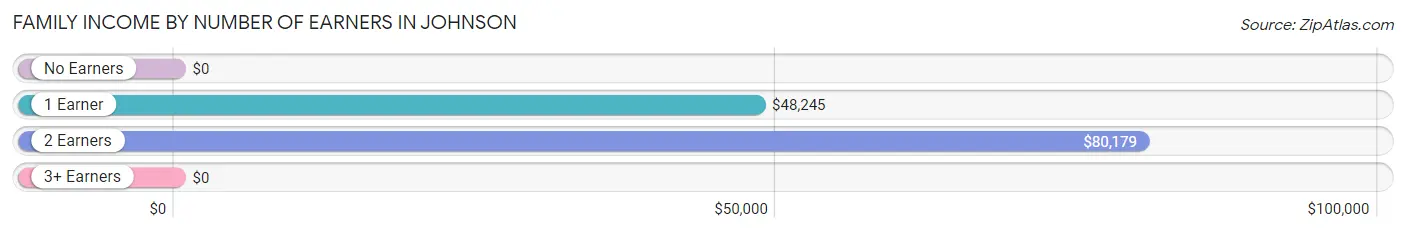
| Number of Earners | # Families | Median Income |
| No Earners | 30 (11.5%) | $0 |
| 1 Earner | 116 (44.4%) | $48,245 |
| 2 Earners | 113 (43.3%) | $80,179 |
| 3+ Earners | 2 (0.8%) | $0 |
| Total | 261 (100.0%) | $48,856 |
Household Income in Johnson
Household Income Brackets in Johnson
With 109 households falling in the category, the $50,000 to $74,999 income range is the most frequent in Johnson, accounting for 23.8% of all households. In contrast, only 3 households (0.7%) fall into the $150,000 to $199,999 income bracket, making it the least populous group.
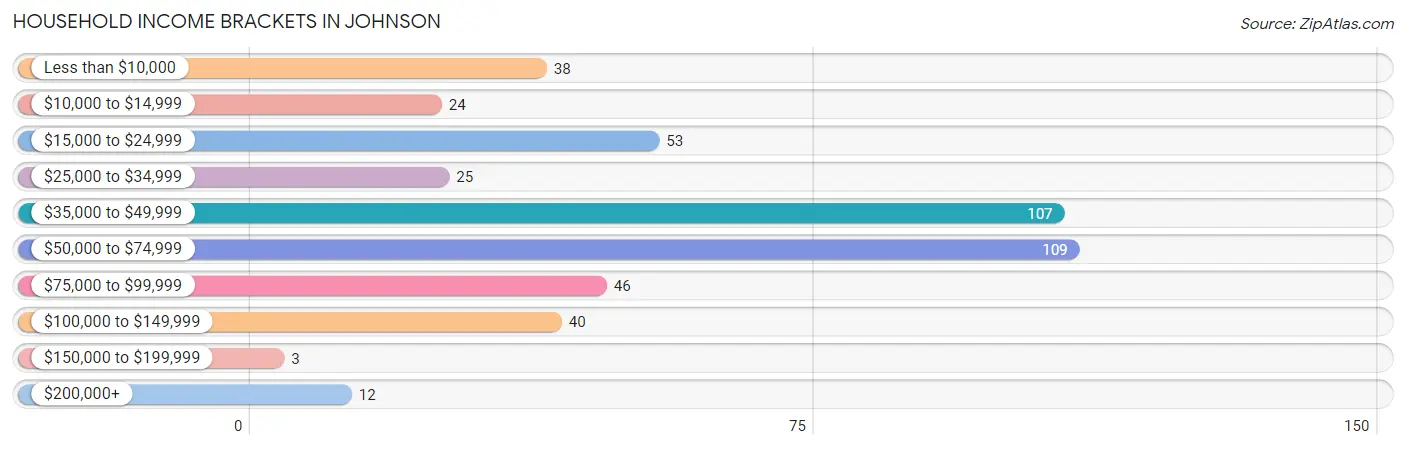
| Income Bracket | # Households | % Households |
| Less than $10,000 | 38 | 8.3% |
| $10,000 to $14,999 | 24 | 5.3% |
| $15,000 to $24,999 | 53 | 11.6% |
| $25,000 to $34,999 | 25 | 5.5% |
| $35,000 to $49,999 | 107 | 23.4% |
| $50,000 to $74,999 | 109 | 23.9% |
| $75,000 to $99,999 | 46 | 10.1% |
| $100,000 to $149,999 | 40 | 8.8% |
| $150,000 to $199,999 | 3 | 0.7% |
| $200,000+ | 12 | 2.6% |
Household Income by Householder Age in Johnson
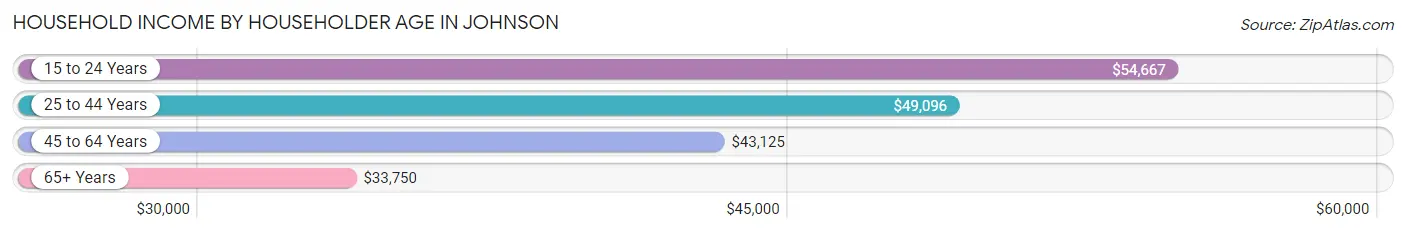
The median household income in Johnson is $49,016, with the highest median household income of $54,667 found in the 15 to 24 years age bracket for the primary householder. A total of 74 households (16.2%) fall into this category. Meanwhile, the 65+ years age bracket for the primary householder has the lowest median household income of $33,750, with 57 households (12.5%) in this group.
| Income Bracket | # Households | Median Income |
| 15 to 24 Years | 74 (16.2%) | $54,667 |
| 25 to 44 Years | 202 (44.2%) | $49,096 |
| 45 to 64 Years | 124 (27.1%) | $43,125 |
| 65+ Years | 57 (12.5%) | $33,750 |
| Total | 457 (100.0%) | $49,016 |
Poverty in Johnson
Income Below Poverty by Sex and Age in Johnson
With 15.8% poverty level for males and 21.1% for females among the residents of Johnson, 16 and 17 year old males and 65 to 74 year old females are the most vulnerable to poverty, with 3 males (100.0%) and 5 females (50.0%) in their respective age groups living below the poverty level.
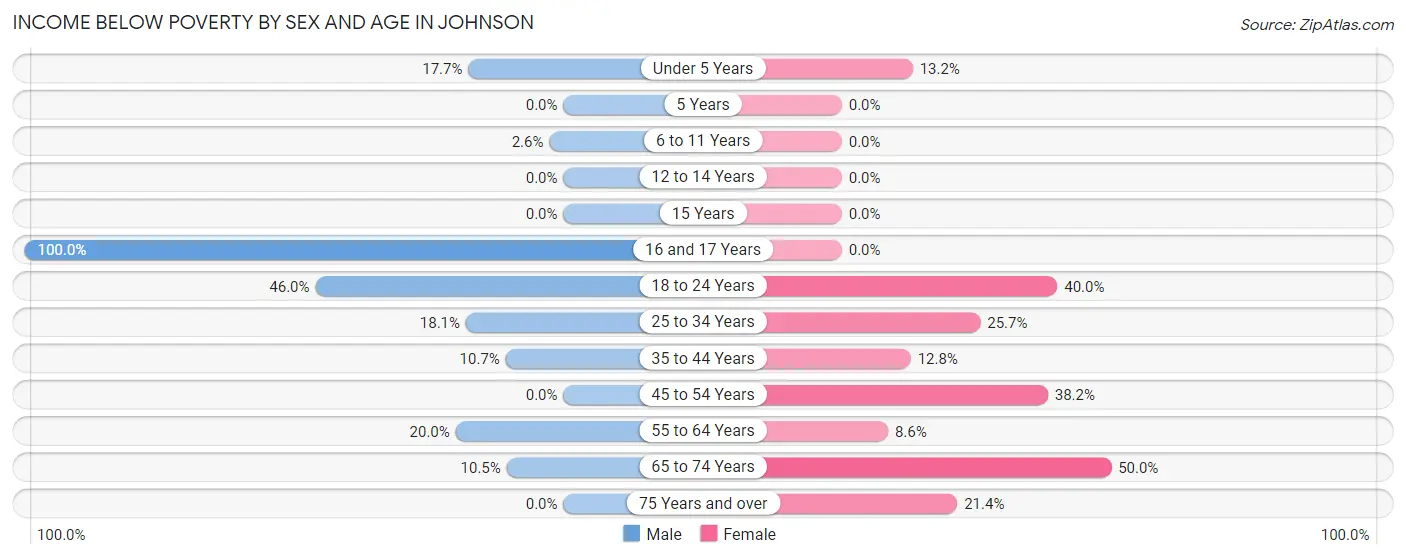
| Age Bracket | Male | Female |
| Under 5 Years | 6 (17.6%) | 10 (13.2%) |
| 5 Years | 0 (0.0%) | 0 (0.0%) |
| 6 to 11 Years | 2 (2.6%) | 0 (0.0%) |
| 12 to 14 Years | 0 (0.0%) | 0 (0.0%) |
| 15 Years | 0 (0.0%) | 0 (0.0%) |
| 16 and 17 Years | 3 (100.0%) | 0 (0.0%) |
| 18 to 24 Years | 29 (46.0%) | 42 (40.0%) |
| 25 to 34 Years | 21 (18.1%) | 27 (25.7%) |
| 35 to 44 Years | 3 (10.7%) | 11 (12.8%) |
| 45 to 54 Years | 0 (0.0%) | 13 (38.2%) |
| 55 to 64 Years | 4 (20.0%) | 6 (8.6%) |
| 65 to 74 Years | 4 (10.5%) | 5 (50.0%) |
| 75 Years and over | 0 (0.0%) | 3 (21.4%) |
| Total | 72 (15.8%) | 117 (21.1%) |
Income Above Poverty by Sex and Age in Johnson
According to the poverty statistics in Johnson, males aged 5 years and females aged 6 to 11 years are the age groups that are most secure financially, with 100.0% of males and 100.0% of females in these age groups living above the poverty line.
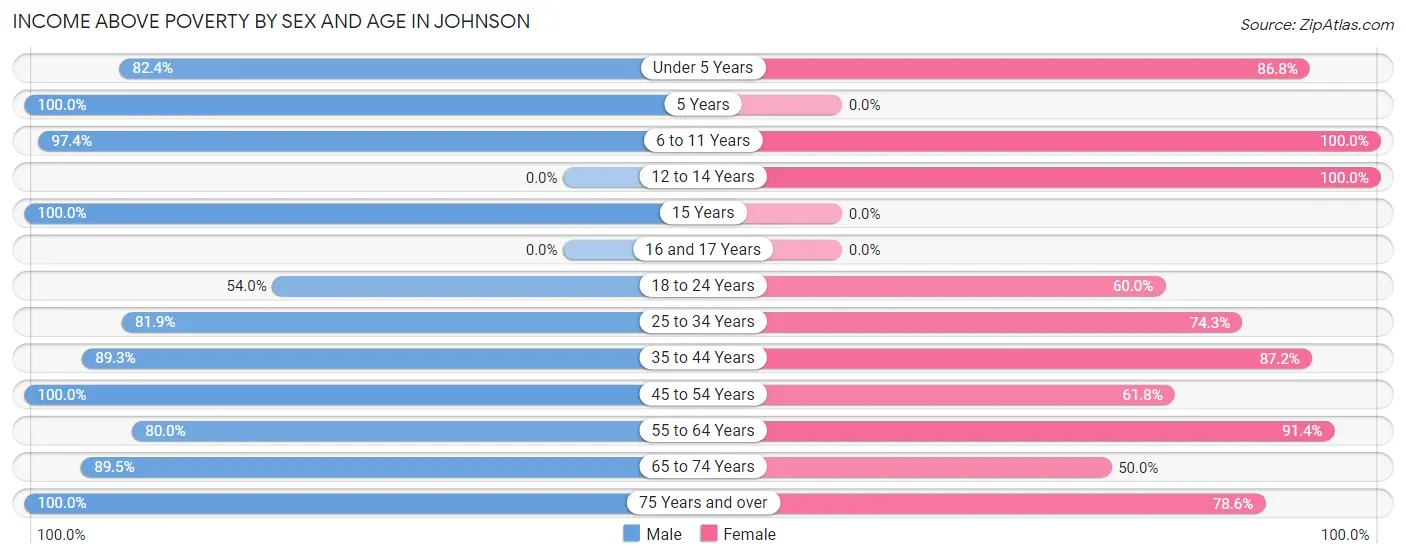
| Age Bracket | Male | Female |
| Under 5 Years | 28 (82.4%) | 66 (86.8%) |
| 5 Years | 40 (100.0%) | 0 (0.0%) |
| 6 to 11 Years | 75 (97.4%) | 47 (100.0%) |
| 12 to 14 Years | 0 (0.0%) | 8 (100.0%) |
| 15 Years | 3 (100.0%) | 0 (0.0%) |
| 16 and 17 Years | 0 (0.0%) | 0 (0.0%) |
| 18 to 24 Years | 34 (54.0%) | 63 (60.0%) |
| 25 to 34 Years | 95 (81.9%) | 78 (74.3%) |
| 35 to 44 Years | 25 (89.3%) | 75 (87.2%) |
| 45 to 54 Years | 31 (100.0%) | 21 (61.8%) |
| 55 to 64 Years | 16 (80.0%) | 64 (91.4%) |
| 65 to 74 Years | 34 (89.5%) | 5 (50.0%) |
| 75 Years and over | 3 (100.0%) | 11 (78.6%) |
| Total | 384 (84.2%) | 438 (78.9%) |
Income Below Poverty Among Married-Couple Families in Johnson
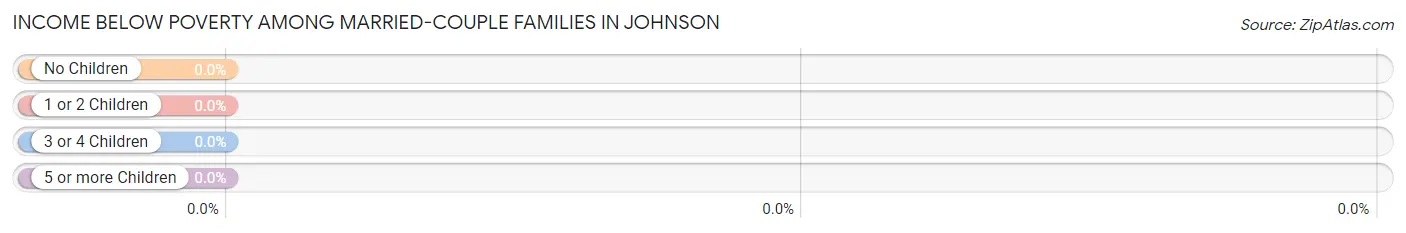
| Children | Above Poverty | Below Poverty |
| No Children | 64 (100.0%) | 0 (0.0%) |
| 1 or 2 Children | 49 (100.0%) | 0 (0.0%) |
| 3 or 4 Children | 0 (0.0%) | 0 (0.0%) |
| 5 or more Children | 0 (0.0%) | 0 (0.0%) |
| Total | 113 (100.0%) | 0 (0.0%) |
Income Below Poverty Among Single-Parent Households in Johnson
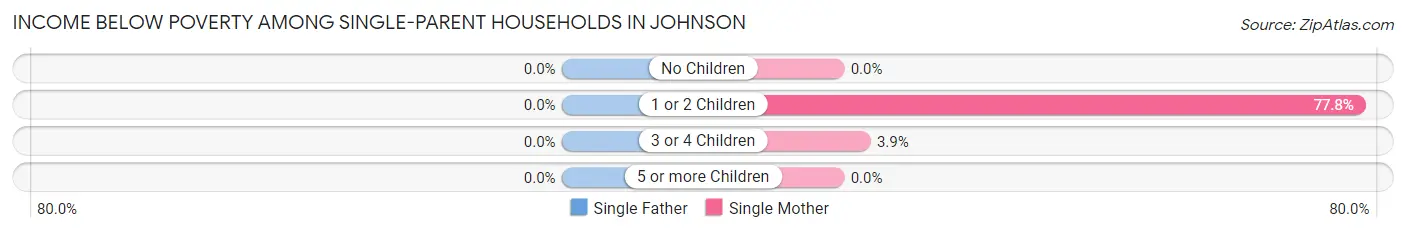
| Children | Single Father | Single Mother |
| No Children | 0 (0.0%) | 0 (0.0%) |
| 1 or 2 Children | 0 (0.0%) | 28 (77.8%) |
| 3 or 4 Children | 0 (0.0%) | 2 (3.9%) |
| 5 or more Children | 0 (0.0%) | 0 (0.0%) |
| Total | 0 (0.0%) | 30 (25.9%) |
Income Below Poverty Among Married-Couple vs Single-Parent Households in Johnson
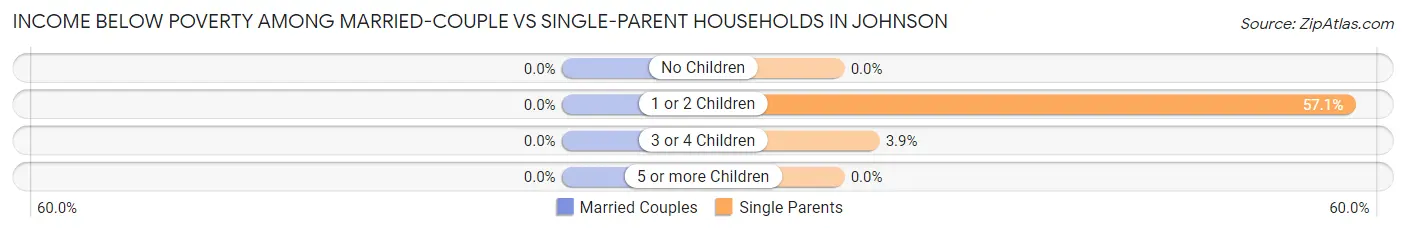
| Children | Married-Couple Families | Single-Parent Households |
| No Children | 0 (0.0%) | 0 (0.0%) |
| 1 or 2 Children | 0 (0.0%) | 28 (57.1%) |
| 3 or 4 Children | 0 (0.0%) | 2 (3.9%) |
| 5 or more Children | 0 (0.0%) | 0 (0.0%) |
| Total | 0 (0.0%) | 30 (20.3%) |
Race in Johnson
The most populous races in Johnson are White / Caucasian (1,242 | 92.2%), Two or more Races (57 | 4.2%), and Hispanic or Latino (37 | 2.8%).
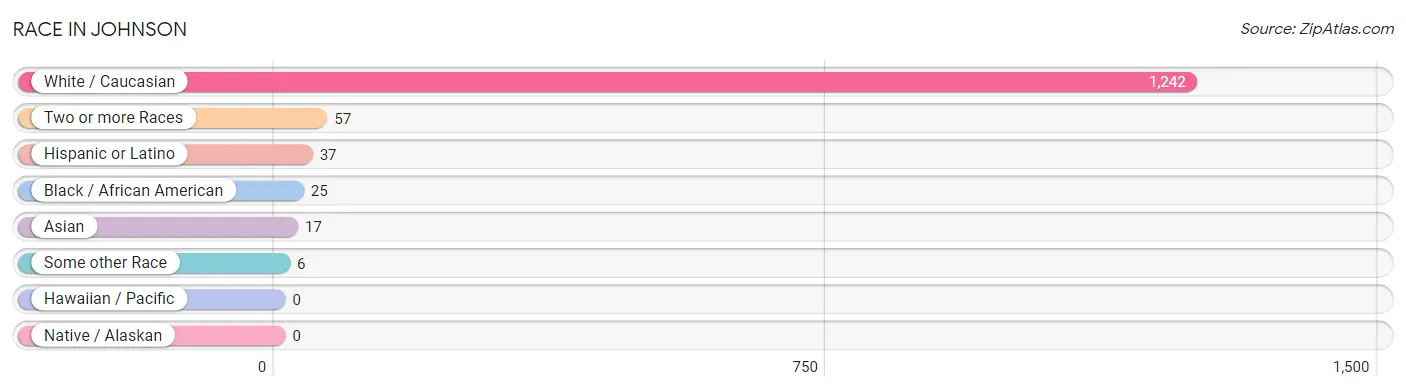
| Race | # Population | % Population |
| Asian | 17 | 1.3% |
| Black / African American | 25 | 1.9% |
| Hawaiian / Pacific | 0 | 0.0% |
| Hispanic or Latino | 37 | 2.8% |
| Native / Alaskan | 0 | 0.0% |
| White / Caucasian | 1,242 | 92.2% |
| Two or more Races | 57 | 4.2% |
| Some other Race | 6 | 0.4% |
| Total | 1,347 | 100.0% |
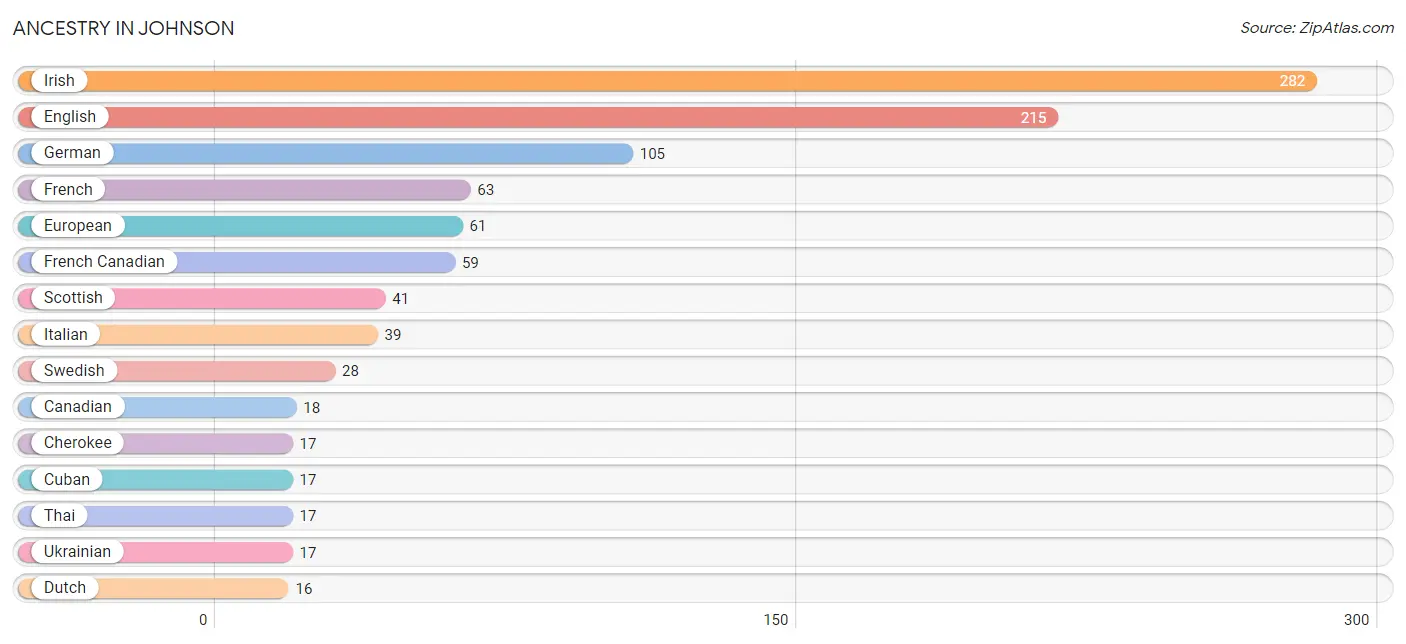
Ancestry in Johnson
The most populous ancestries reported in Johnson are Irish (282 | 20.9%), English (215 | 16.0%), German (105 | 7.8%), French (63 | 4.7%), and European (61 | 4.5%), together accounting for 53.9% of all Johnson residents.
| Ancestry | # Population | % Population |
| American | 13 | 1.0% |
| Arab | 2 | 0.2% |
| Austrian | 11 | 0.8% |
| British | 14 | 1.0% |
| British West Indian | 4 | 0.3% |
| Bulgarian | 2 | 0.2% |
| Canadian | 18 | 1.3% |
| Cherokee | 17 | 1.3% |
| Cuban | 17 | 1.3% |
| Czech | 3 | 0.2% |
| Danish | 4 | 0.3% |
| Dutch | 16 | 1.2% |
| Eastern European | 9 | 0.7% |
| English | 215 | 16.0% |
| European | 61 | 4.5% |
| Finnish | 2 | 0.2% |
| French | 63 | 4.7% |
| French Canadian | 59 | 4.4% |
| German | 105 | 7.8% |
| Greek | 4 | 0.3% |
| Haitian | 5 | 0.4% |
| Hungarian | 6 | 0.4% |
| Irish | 282 | 20.9% |
| Italian | 39 | 2.9% |
| Kenyan | 5 | 0.4% |
| Korean | 4 | 0.3% |
| Lebanese | 2 | 0.2% |
| Native Hawaiian | 15 | 1.1% |
| Peruvian | 4 | 0.3% |
| Polish | 7 | 0.5% |
| Portuguese | 5 | 0.4% |
| Puerto Rican | 6 | 0.4% |
| Scotch-Irish | 14 | 1.0% |
| Scottish | 41 | 3.0% |
| Somali | 5 | 0.4% |
| South American | 4 | 0.3% |
| Spanish | 4 | 0.3% |
| Subsaharan African | 5 | 0.4% |
| Swedish | 28 | 2.1% |
| Thai | 17 | 1.3% |
| Ukrainian | 17 | 1.3% |
| Welsh | 10 | 0.7% | View All 42 Rows |
Immigrants in Johnson
The most numerous immigrant groups reported in Johnson came from Asia (17 | 1.3%), India (17 | 1.3%), South Central Asia (17 | 1.3%), Africa (5 | 0.4%), and Caribbean (5 | 0.4%), together accounting for 4.5% of all Johnson residents.
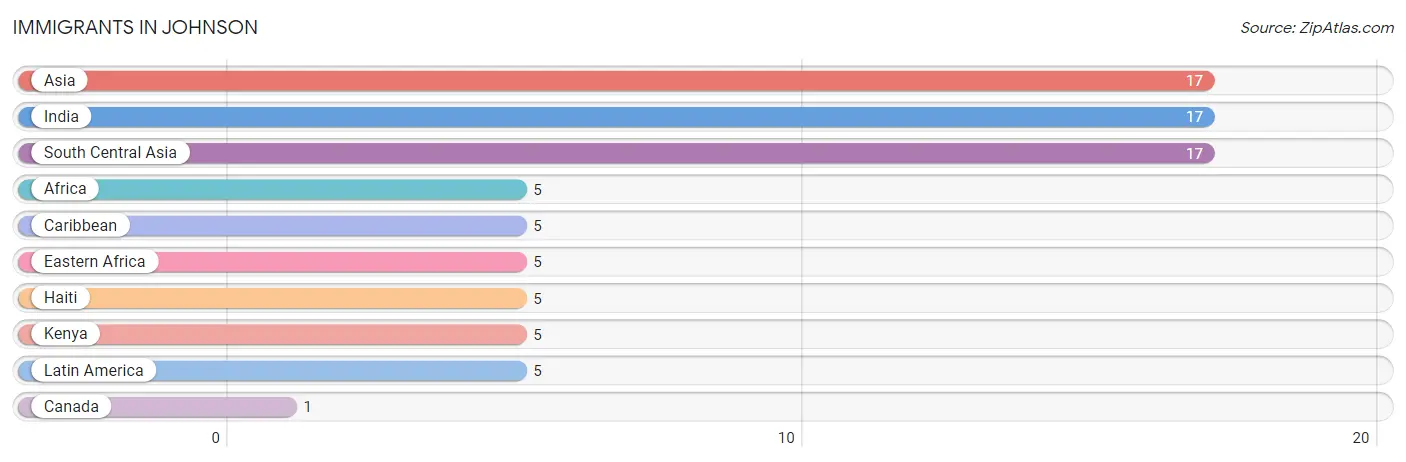
| Immigration Origin | # Population | % Population |
| Africa | 5 | 0.4% |
| Asia | 17 | 1.3% |
| Canada | 1 | 0.1% |
| Caribbean | 5 | 0.4% |
| Eastern Africa | 5 | 0.4% |
| Haiti | 5 | 0.4% |
| India | 17 | 1.3% |
| Kenya | 5 | 0.4% |
| Latin America | 5 | 0.4% |
| South Central Asia | 17 | 1.3% | View All 10 Rows |
Sex and Age in Johnson
Sex and Age in Johnson
The most populous age groups in Johnson are 20 to 24 Years (157 | 26.7%) for men and 20 to 24 Years (177 | 23.4%) for women.
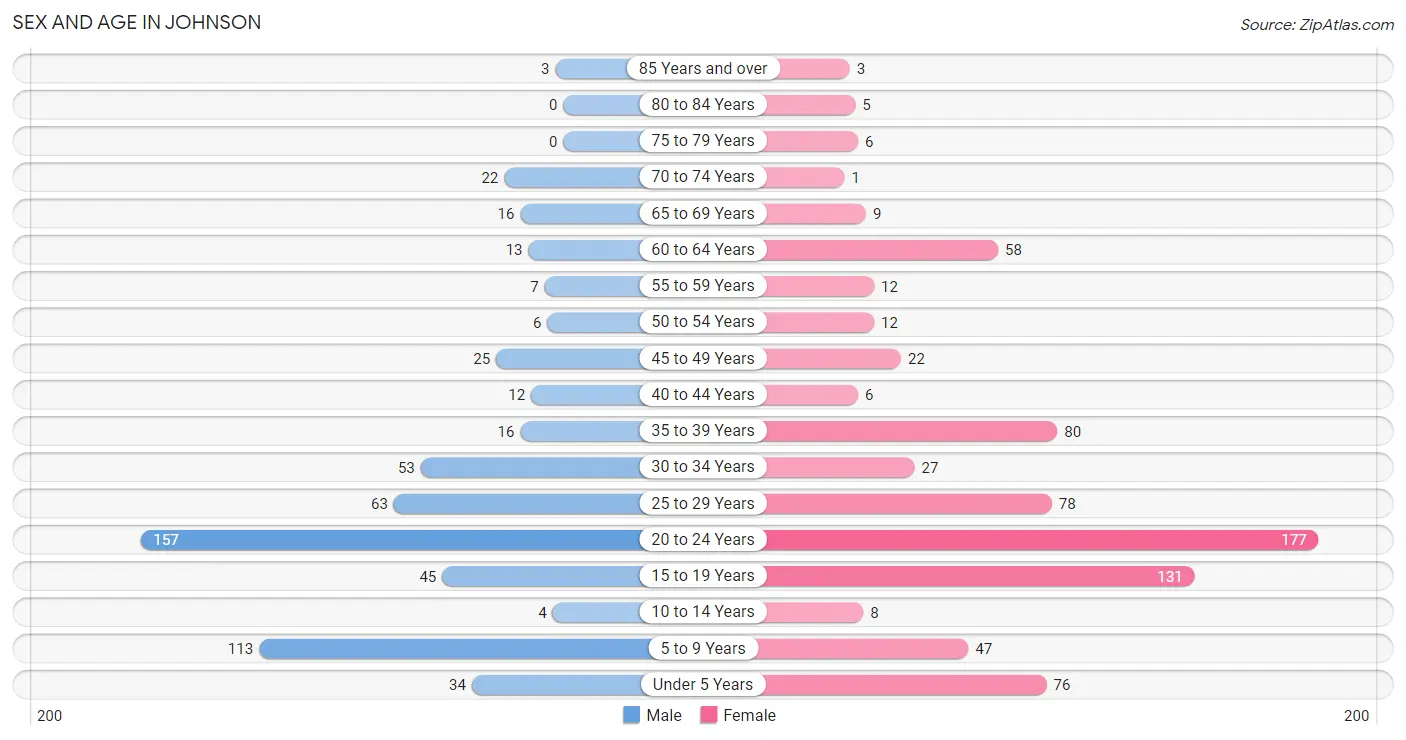
| Age Bracket | Male | Female |
| Under 5 Years | 34 (5.8%) | 76 (10.0%) |
| 5 to 9 Years | 113 (19.2%) | 47 (6.2%) |
| 10 to 14 Years | 4 (0.7%) | 8 (1.1%) |
| 15 to 19 Years | 45 (7.6%) | 131 (17.3%) |
| 20 to 24 Years | 157 (26.7%) | 177 (23.4%) |
| 25 to 29 Years | 63 (10.7%) | 78 (10.3%) |
| 30 to 34 Years | 53 (9.0%) | 27 (3.6%) |
| 35 to 39 Years | 16 (2.7%) | 80 (10.5%) |
| 40 to 44 Years | 12 (2.0%) | 6 (0.8%) |
| 45 to 49 Years | 25 (4.2%) | 22 (2.9%) |
| 50 to 54 Years | 6 (1.0%) | 12 (1.6%) |
| 55 to 59 Years | 7 (1.2%) | 12 (1.6%) |
| 60 to 64 Years | 13 (2.2%) | 58 (7.6%) |
| 65 to 69 Years | 16 (2.7%) | 9 (1.2%) |
| 70 to 74 Years | 22 (3.7%) | 1 (0.1%) |
| 75 to 79 Years | 0 (0.0%) | 6 (0.8%) |
| 80 to 84 Years | 0 (0.0%) | 5 (0.7%) |
| 85 Years and over | 3 (0.5%) | 3 (0.4%) |
| Total | 589 (100.0%) | 758 (100.0%) |
Families and Households in Johnson
Median Family Size in Johnson
The median family size in Johnson is 2.70 persons per family, with married-couple families (113 | 43.3%) accounting for the largest median family size of 2.96 persons per family. On the other hand, single male/father families (32 | 12.3%) represent the smallest median family size with 2.19 persons per family.
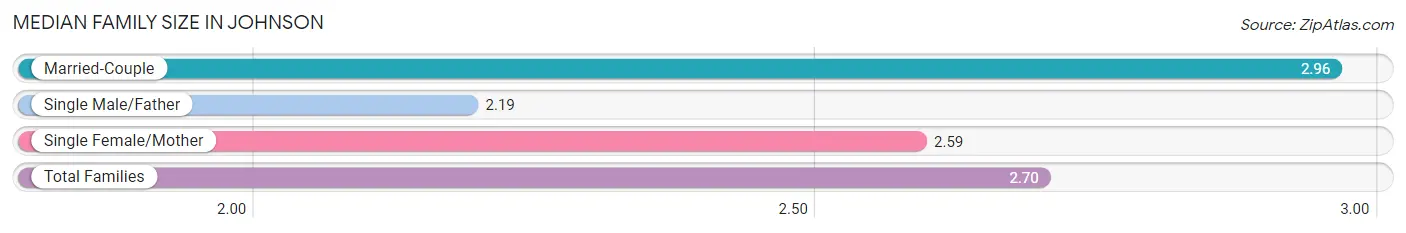
| Family Type | # Families | Family Size |
| Married-Couple | 113 (43.3%) | 2.96 |
| Single Male/Father | 32 (12.3%) | 2.19 |
| Single Female/Mother | 116 (44.4%) | 2.59 |
| Total Families | 261 (100.0%) | 2.70 |
Median Household Size in Johnson
The median household size in Johnson is 2.21 persons per household, with married-couple households (113 | 24.7%) accounting for the largest median household size of 2.96 persons per household. non-family households (196 | 42.9%) represent the smallest median household size with 1.44 persons per household.
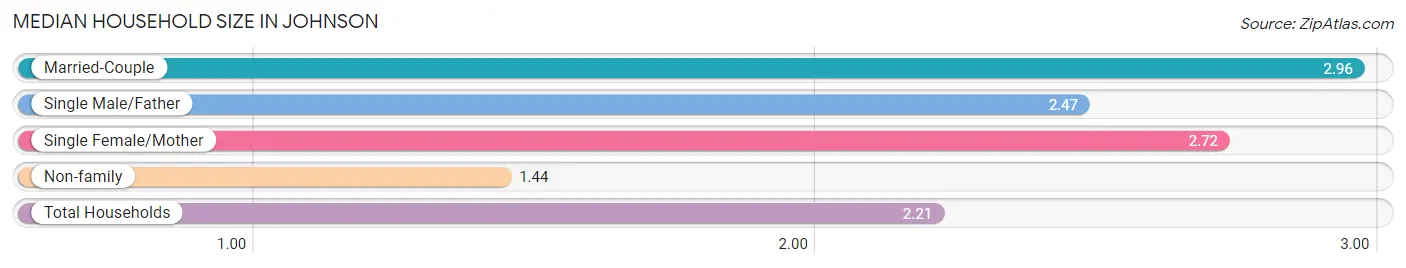
| Household Type | # Households | Household Size |
| Married-Couple | 113 (24.7%) | 2.96 |
| Single Male/Father | 32 (7.0%) | 2.47 |
| Single Female/Mother | 116 (25.4%) | 2.72 |
| Non-family | 196 (42.9%) | 1.44 |
| Total Households | 457 (100.0%) | 2.21 |
Household Size by Marriage Status in Johnson
Out of a total of 457 households in Johnson, 261 (57.1%) are family households, while 196 (42.9%) are nonfamily households. The most numerous type of family households are 2-person households, comprising 125, and the most common type of nonfamily households are 1-person households, comprising 124.
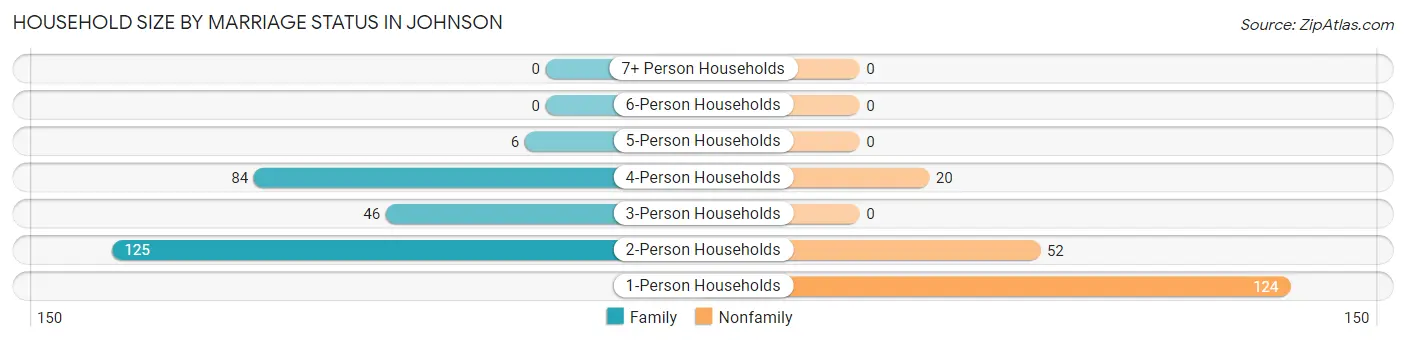
| Household Size | Family Households | Nonfamily Households |
| 1-Person Households | - | 124 (27.1%) |
| 2-Person Households | 125 (27.4%) | 52 (11.4%) |
| 3-Person Households | 46 (10.1%) | 0 (0.0%) |
| 4-Person Households | 84 (18.4%) | 20 (4.4%) |
| 5-Person Households | 6 (1.3%) | 0 (0.0%) |
| 6-Person Households | 0 (0.0%) | 0 (0.0%) |
| 7+ Person Households | 0 (0.0%) | 0 (0.0%) |
| Total | 261 (57.1%) | 196 (42.9%) |
Female Fertility in Johnson
Fertility by Age in Johnson
Average fertility rate in Johnson is 47.0 births per 1,000 women. Women in the age bracket of 20 to 34 years have the highest fertility rate with 78.0 births per 1,000 women. Women in the age bracket of 20 to 34 years acount for 88.0% of all women with births.
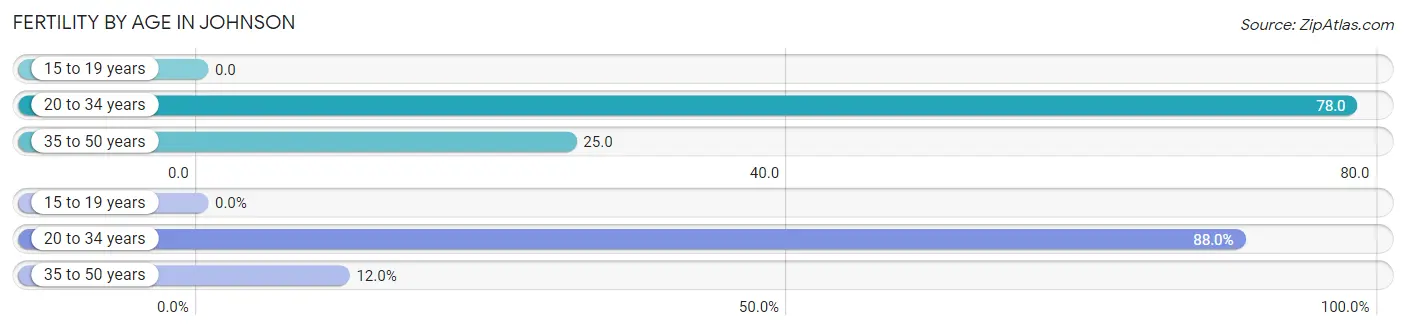
| Age Bracket | Women with Births | Births / 1,000 Women |
| 15 to 19 years | 0 (0.0%) | 0.0 |
| 20 to 34 years | 22 (88.0%) | 78.0 |
| 35 to 50 years | 3 (12.0%) | 25.0 |
| Total | 25 (100.0%) | 47.0 |
Fertility by Age by Marriage Status in Johnson
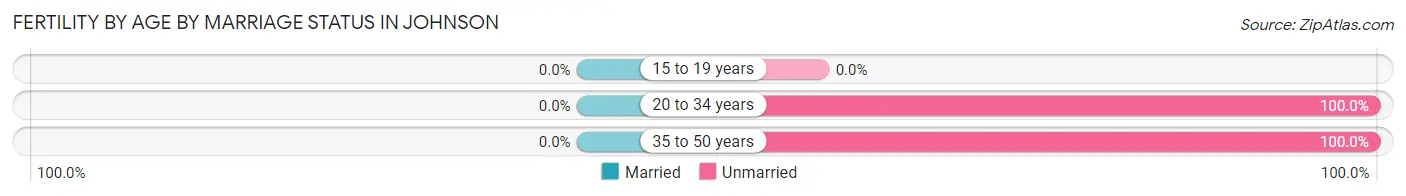
| Age Bracket | Married | Unmarried |
| 15 to 19 years | 0 (0.0%) | 0 (0.0%) |
| 20 to 34 years | 0 (0.0%) | 22 (100.0%) |
| 35 to 50 years | 0 (0.0%) | 3 (100.0%) |
| Total | 0 (0.0%) | 25 (100.0%) |
Fertility by Education in Johnson

| Educational Attainment | Women with Births | Births / 1,000 Women |
| Less than High School | 0 (0.0%) | 0.0 |
| High School Diploma | 22 (88.0%) | 162.0 |
| College or Associate's Degree | 0 (0.0%) | 0.0 |
| Bachelor's Degree | 0 (0.0%) | 0.0 |
| Graduate Degree | 3 (12.0%) | 176.0 |
| Total | 25 (100.0%) | 47.0 |
Fertility by Education by Marriage Status in Johnson
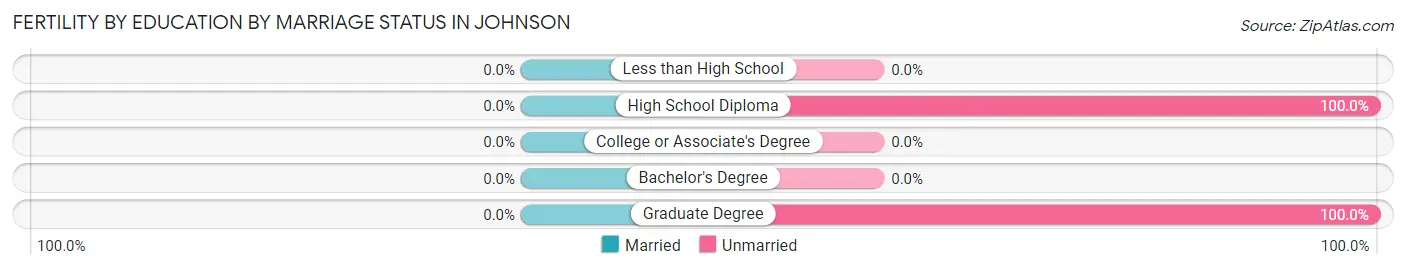
| Educational Attainment | Married | Unmarried |
| Less than High School | 0 (0.0%) | 0 (0.0%) |
| High School Diploma | 0 (0.0%) | 22 (100.0%) |
| College or Associate's Degree | 0 (0.0%) | 0 (0.0%) |
| Bachelor's Degree | 0 (0.0%) | 0 (0.0%) |
| Graduate Degree | 0 (0.0%) | 3 (100.0%) |
| Total | 0 (0.0%) | 25 (100.0%) |
Employment Characteristics in Johnson
Employment by Class of Employer in Johnson
Among the 679 employed individuals in Johnson, private company employees (517 | 76.1%), state government employees (44 | 6.5%), and not-for-profit organizations (42 | 6.2%) make up the most common classes of employment.
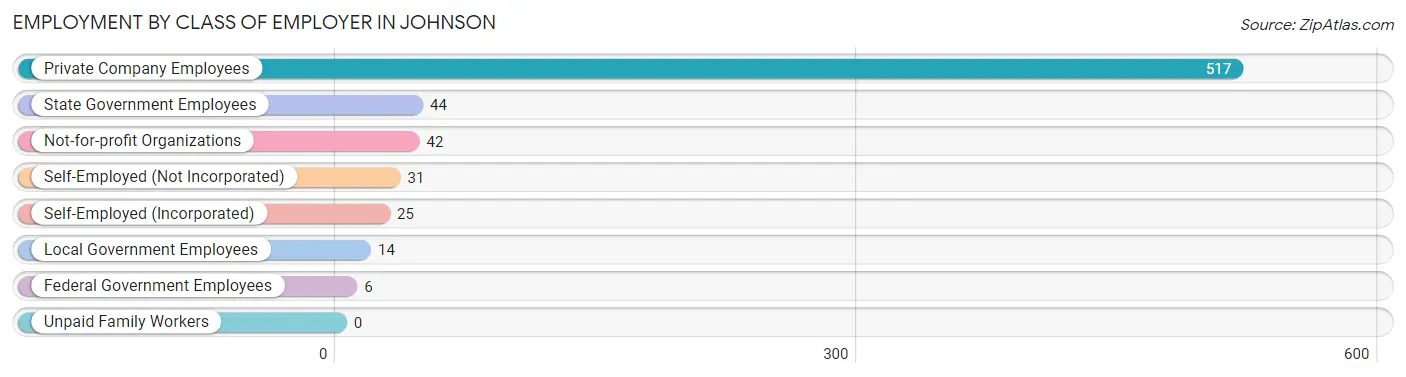
| Employer Class | # Employees | % Employees |
| Private Company Employees | 517 | 76.1% |
| Self-Employed (Incorporated) | 25 | 3.7% |
| Self-Employed (Not Incorporated) | 31 | 4.6% |
| Not-for-profit Organizations | 42 | 6.2% |
| Local Government Employees | 14 | 2.1% |
| State Government Employees | 44 | 6.5% |
| Federal Government Employees | 6 | 0.9% |
| Unpaid Family Workers | 0 | 0.0% |
| Total | 679 | 100.0% |
Employment Status by Age in Johnson
According to the labor force statistics for Johnson, out of the total population over 16 years of age (1,062), 73.7% or 783 individuals are in the labor force, with 10.1% or 79 of them unemployed. The age group with the highest labor force participation rate is 35 to 44 years, with 97.4% or 111 individuals in the labor force. Within the labor force, the 30 to 34 years age range has the highest percentage of unemployed individuals, with 73.7% or 42 of them being unemployed.
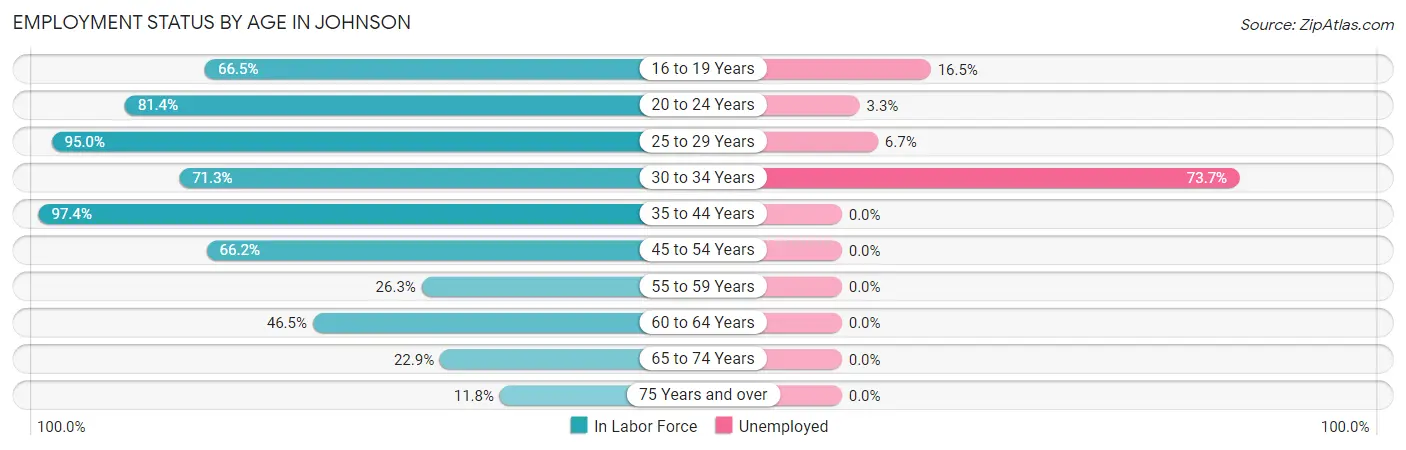
| Age Bracket | In Labor Force | Unemployed |
| 16 to 19 Years | 115 (66.5%) | 19 (16.5%) |
| 20 to 24 Years | 272 (81.4%) | 9 (3.3%) |
| 25 to 29 Years | 134 (95.0%) | 9 (6.7%) |
| 30 to 34 Years | 57 (71.3%) | 42 (73.7%) |
| 35 to 44 Years | 111 (97.4%) | 0 (0.0%) |
| 45 to 54 Years | 43 (66.2%) | 0 (0.0%) |
| 55 to 59 Years | 5 (26.3%) | 0 (0.0%) |
| 60 to 64 Years | 33 (46.5%) | 0 (0.0%) |
| 65 to 74 Years | 11 (22.9%) | 0 (0.0%) |
| 75 Years and over | 2 (11.8%) | 0 (0.0%) |
| Total | 783 (73.7%) | 79 (10.1%) |
Employment Status by Educational Attainment in Johnson
According to labor force statistics for Johnson, 78.2% of individuals (383) out of the total population between 25 and 64 years of age (490) are in the labor force, with 13.3% or 51 of them being unemployed. The group with the highest labor force participation rate are those with the educational attainment of college / associate degree, with 84.6% or 99 individuals in the labor force. Within the labor force, individuals with high school diploma education have the highest percentage of unemployment, with 30.1% or 41 of them being unemployed.
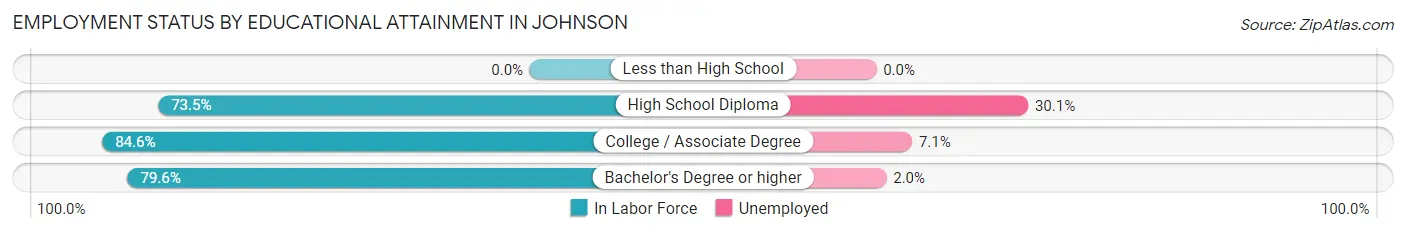
| Educational Attainment | In Labor Force | Unemployed |
| Less than High School | 0 (0.0%) | 0 (0.0%) |
| High School Diploma | 136 (73.5%) | 56 (30.1%) |
| College / Associate Degree | 99 (84.6%) | 8 (7.1%) |
| Bachelor's Degree or higher | 148 (79.6%) | 4 (2.0%) |
| Total | 383 (78.2%) | 65 (13.3%) |
Employment Occupations by Sex in Johnson
Management, Business, Science and Arts Occupations
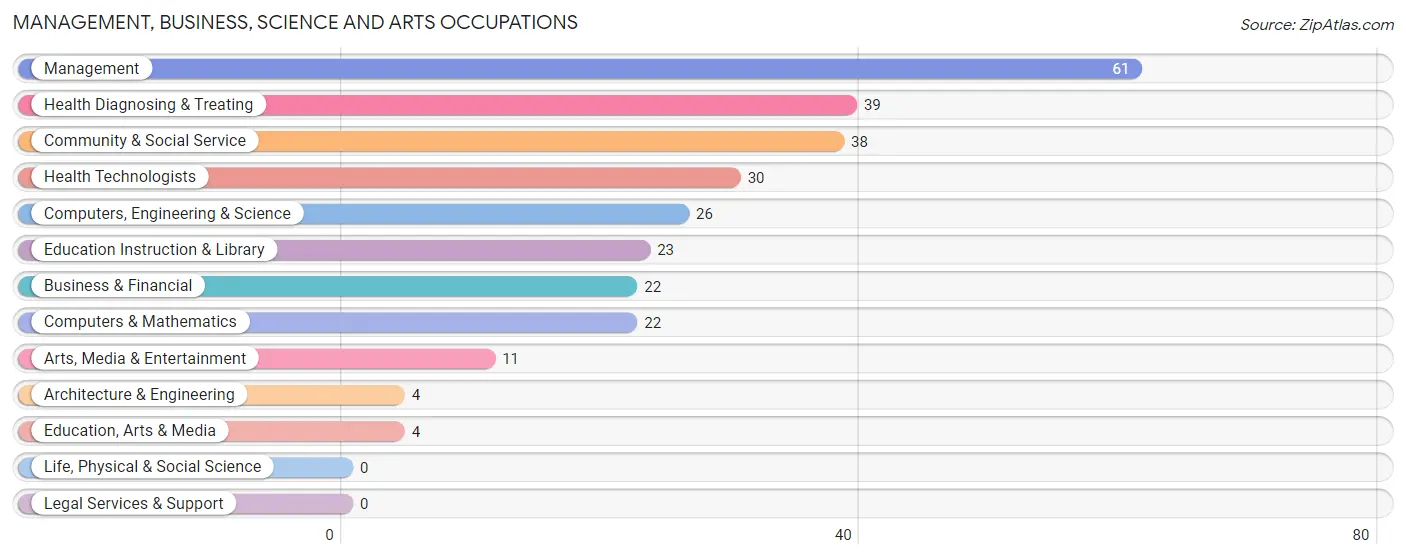
The most common Management, Business, Science and Arts occupations in Johnson are Management (61 | 8.7%), Health Diagnosing & Treating (39 | 5.5%), Community & Social Service (38 | 5.4%), Health Technologists (30 | 4.3%), and Computers, Engineering & Science (26 | 3.7%).
Management, Business, Science and Arts Occupations by Sex
Within the Management, Business, Science and Arts occupations in Johnson, the most male-oriented occupations are Computers, Engineering & Science (100.0%), Computers & Mathematics (100.0%), and Architecture & Engineering (100.0%), while the most female-oriented occupations are Community & Social Service (100.0%), Education, Arts & Media (100.0%), and Education Instruction & Library (100.0%).
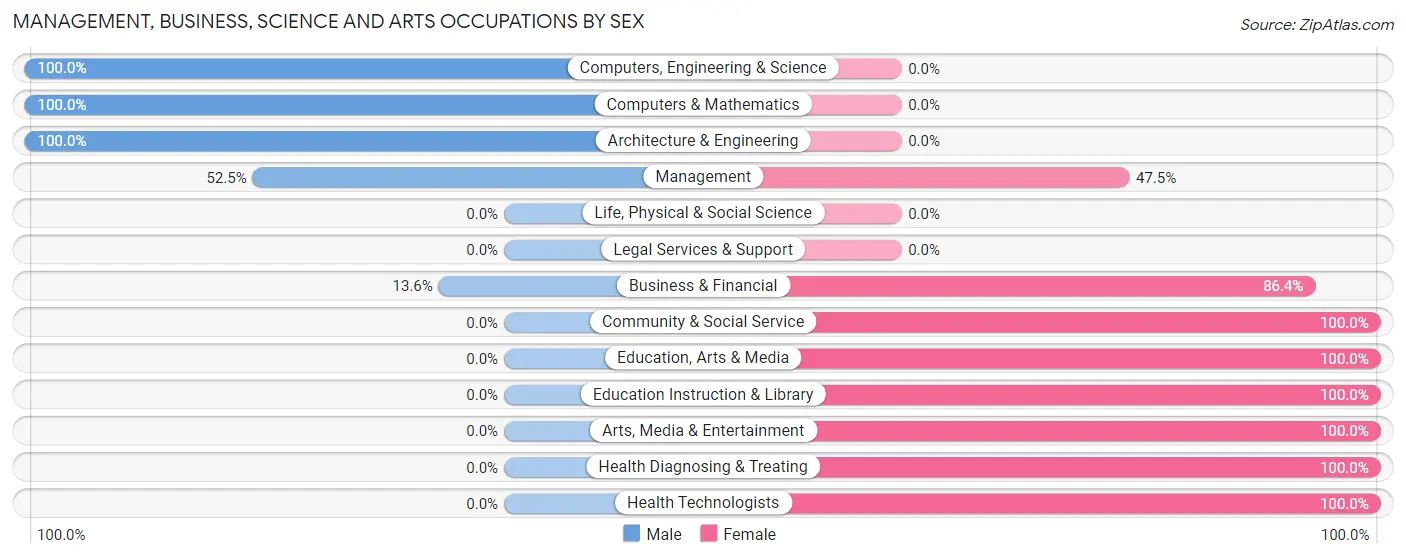
| Occupation | Male | Female |
| Management | 32 (52.5%) | 29 (47.5%) |
| Business & Financial | 3 (13.6%) | 19 (86.4%) |
| Computers, Engineering & Science | 26 (100.0%) | 0 (0.0%) |
| Computers & Mathematics | 22 (100.0%) | 0 (0.0%) |
| Architecture & Engineering | 4 (100.0%) | 0 (0.0%) |
| Life, Physical & Social Science | 0 (0.0%) | 0 (0.0%) |
| Community & Social Service | 0 (0.0%) | 38 (100.0%) |
| Education, Arts & Media | 0 (0.0%) | 4 (100.0%) |
| Legal Services & Support | 0 (0.0%) | 0 (0.0%) |
| Education Instruction & Library | 0 (0.0%) | 23 (100.0%) |
| Arts, Media & Entertainment | 0 (0.0%) | 11 (100.0%) |
| Health Diagnosing & Treating | 0 (0.0%) | 39 (100.0%) |
| Health Technologists | 0 (0.0%) | 30 (100.0%) |
| Total (Category) | 61 (32.8%) | 125 (67.2%) |
| Total (Overall) | 269 (38.2%) | 435 (61.8%) |
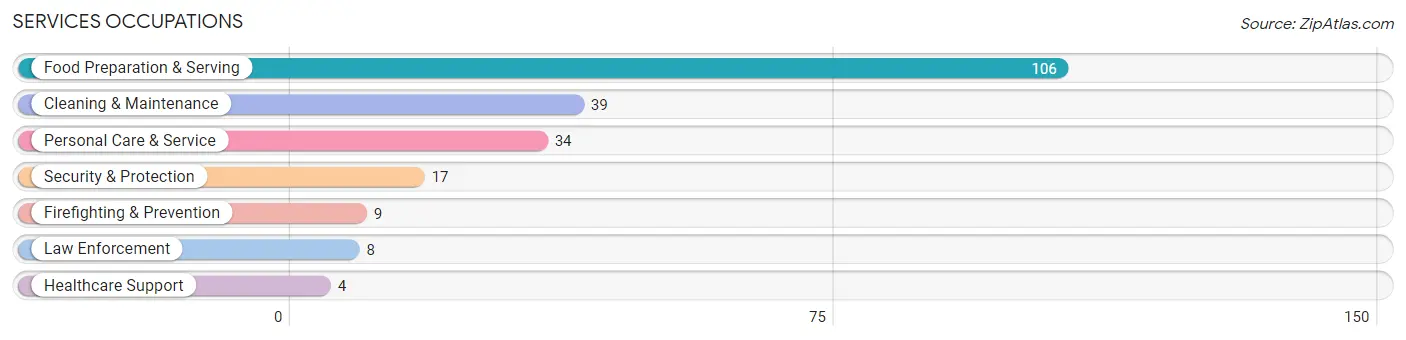
Services Occupations
The most common Services occupations in Johnson are Food Preparation & Serving (106 | 15.1%), Cleaning & Maintenance (39 | 5.5%), Personal Care & Service (34 | 4.8%), Security & Protection (17 | 2.4%), and Firefighting & Prevention (9 | 1.3%).
Services Occupations by Sex
Within the Services occupations in Johnson, the most male-oriented occupations are Food Preparation & Serving (55.7%), Law Enforcement (37.5%), and Security & Protection (35.3%), while the most female-oriented occupations are Healthcare Support (100.0%), Cleaning & Maintenance (69.2%), and Personal Care & Service (67.6%).
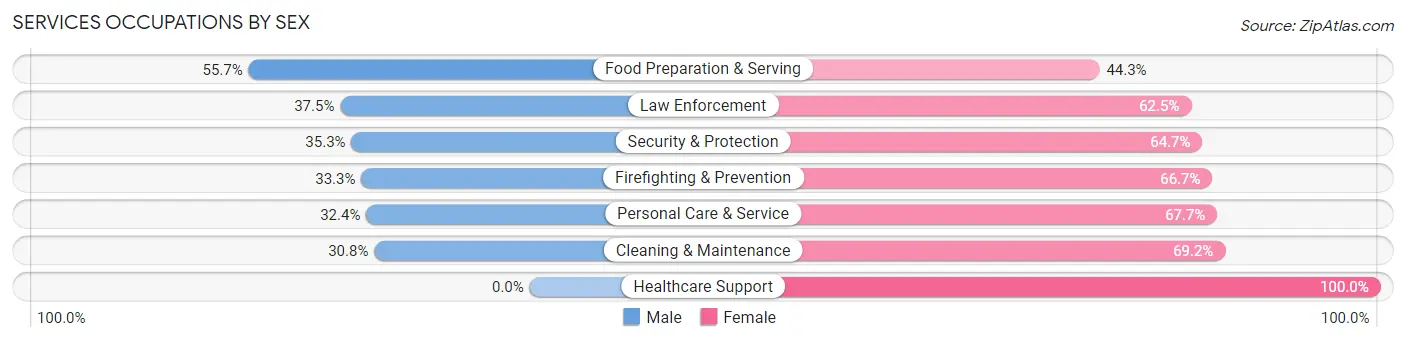
| Occupation | Male | Female |
| Healthcare Support | 0 (0.0%) | 4 (100.0%) |
| Security & Protection | 6 (35.3%) | 11 (64.7%) |
| Firefighting & Prevention | 3 (33.3%) | 6 (66.7%) |
| Law Enforcement | 3 (37.5%) | 5 (62.5%) |
| Food Preparation & Serving | 59 (55.7%) | 47 (44.3%) |
| Cleaning & Maintenance | 12 (30.8%) | 27 (69.2%) |
| Personal Care & Service | 11 (32.4%) | 23 (67.6%) |
| Total (Category) | 88 (44.0%) | 112 (56.0%) |
| Total (Overall) | 269 (38.2%) | 435 (61.8%) |
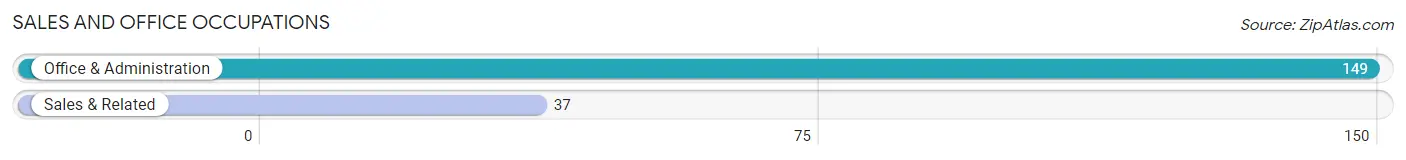
Sales and Office Occupations
The most common Sales and Office occupations in Johnson are Office & Administration (149 | 21.2%), and Sales & Related (37 | 5.3%).
Sales and Office Occupations by Sex
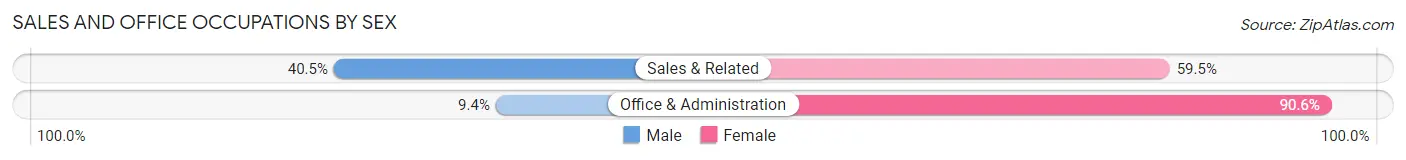
| Occupation | Male | Female |
| Sales & Related | 15 (40.5%) | 22 (59.5%) |
| Office & Administration | 14 (9.4%) | 135 (90.6%) |
| Total (Category) | 29 (15.6%) | 157 (84.4%) |
| Total (Overall) | 269 (38.2%) | 435 (61.8%) |
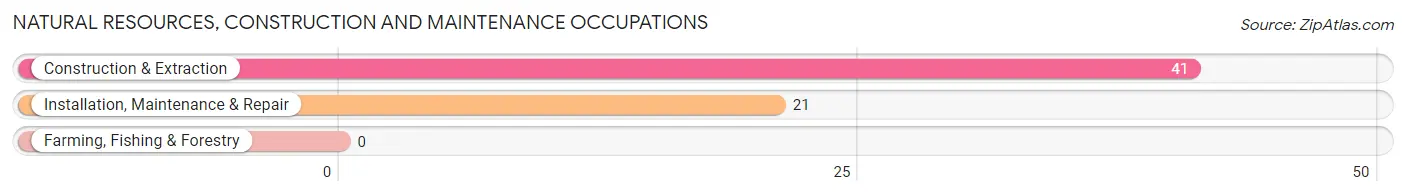
Natural Resources, Construction and Maintenance Occupations
The most common Natural Resources, Construction and Maintenance occupations in Johnson are Construction & Extraction (41 | 5.8%), and Installation, Maintenance & Repair (21 | 3.0%).
Natural Resources, Construction and Maintenance Occupations by Sex
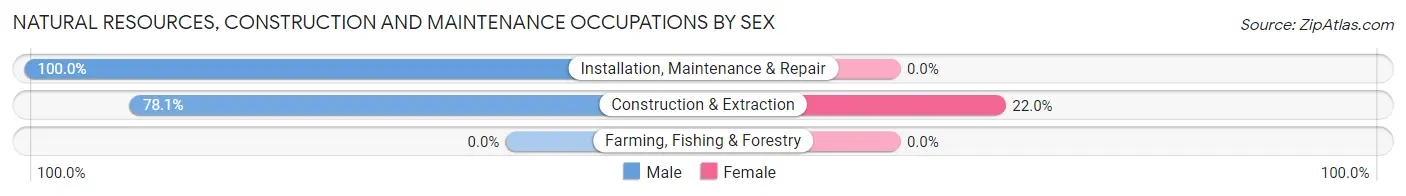
| Occupation | Male | Female |
| Farming, Fishing & Forestry | 0 (0.0%) | 0 (0.0%) |
| Construction & Extraction | 32 (78.0%) | 9 (22.0%) |
| Installation, Maintenance & Repair | 21 (100.0%) | 0 (0.0%) |
| Total (Category) | 53 (85.5%) | 9 (14.5%) |
| Total (Overall) | 269 (38.2%) | 435 (61.8%) |
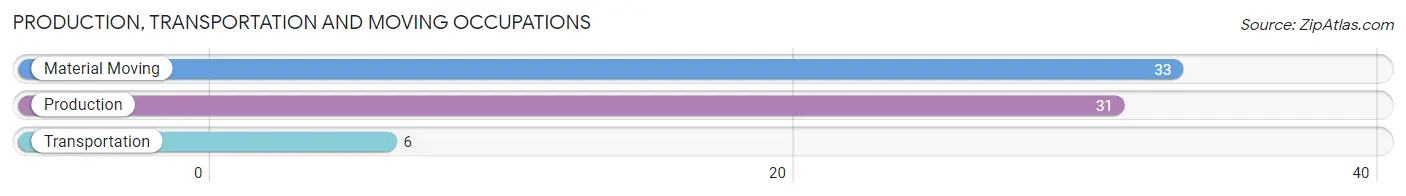
Production, Transportation and Moving Occupations
The most common Production, Transportation and Moving occupations in Johnson are Material Moving (33 | 4.7%), Production (31 | 4.4%), and Transportation (6 | 0.9%).
Production, Transportation and Moving Occupations by Sex
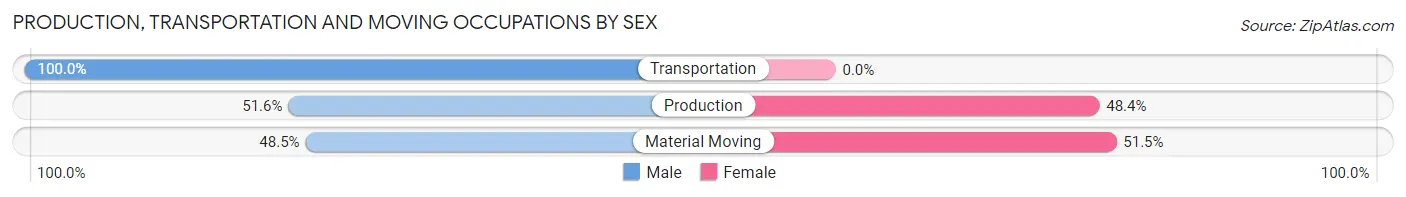
| Occupation | Male | Female |
| Production | 16 (51.6%) | 15 (48.4%) |
| Transportation | 6 (100.0%) | 0 (0.0%) |
| Material Moving | 16 (48.5%) | 17 (51.5%) |
| Total (Category) | 38 (54.3%) | 32 (45.7%) |
| Total (Overall) | 269 (38.2%) | 435 (61.8%) |
Employment Industries by Sex in Johnson
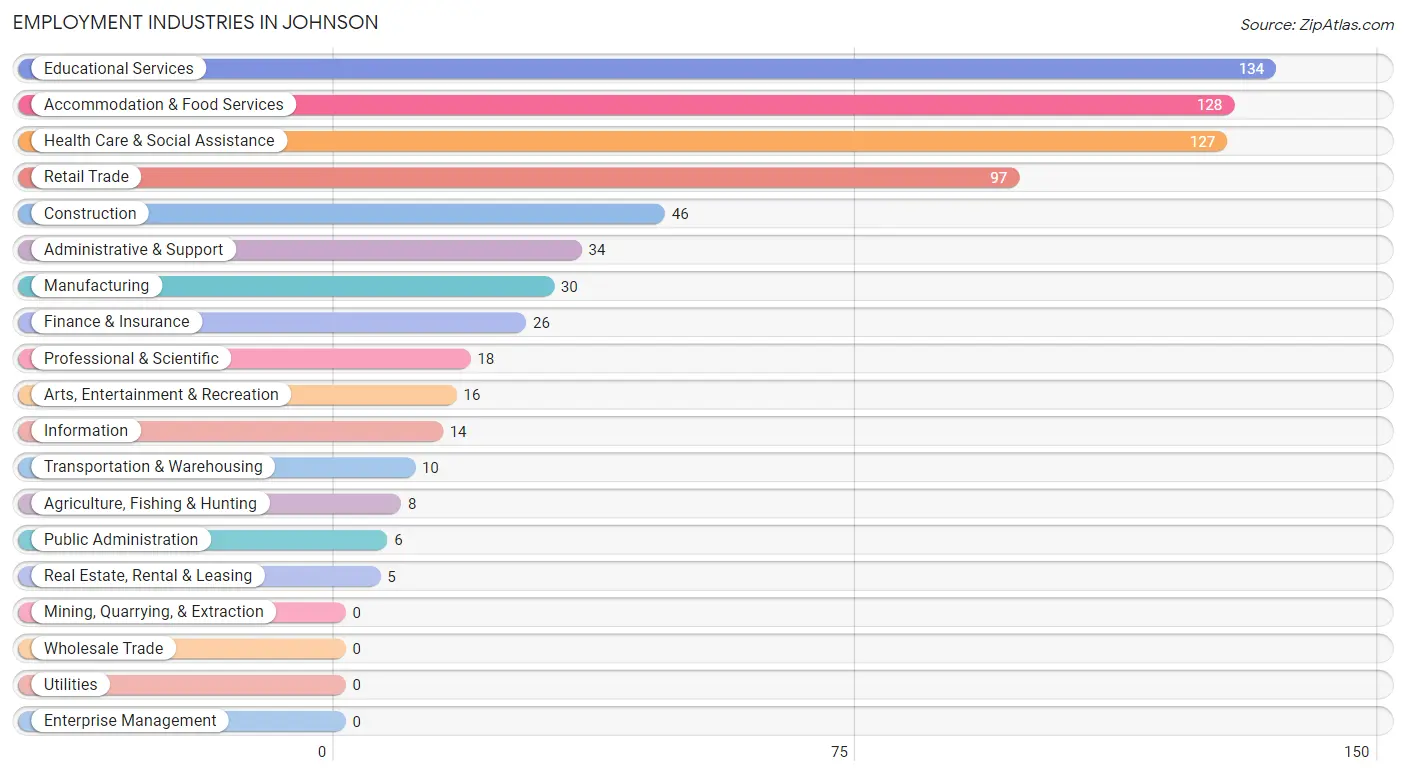
Employment Industries in Johnson
The major employment industries in Johnson include Educational Services (134 | 19.0%), Accommodation & Food Services (128 | 18.2%), Health Care & Social Assistance (127 | 18.0%), Retail Trade (97 | 13.8%), and Construction (46 | 6.5%).
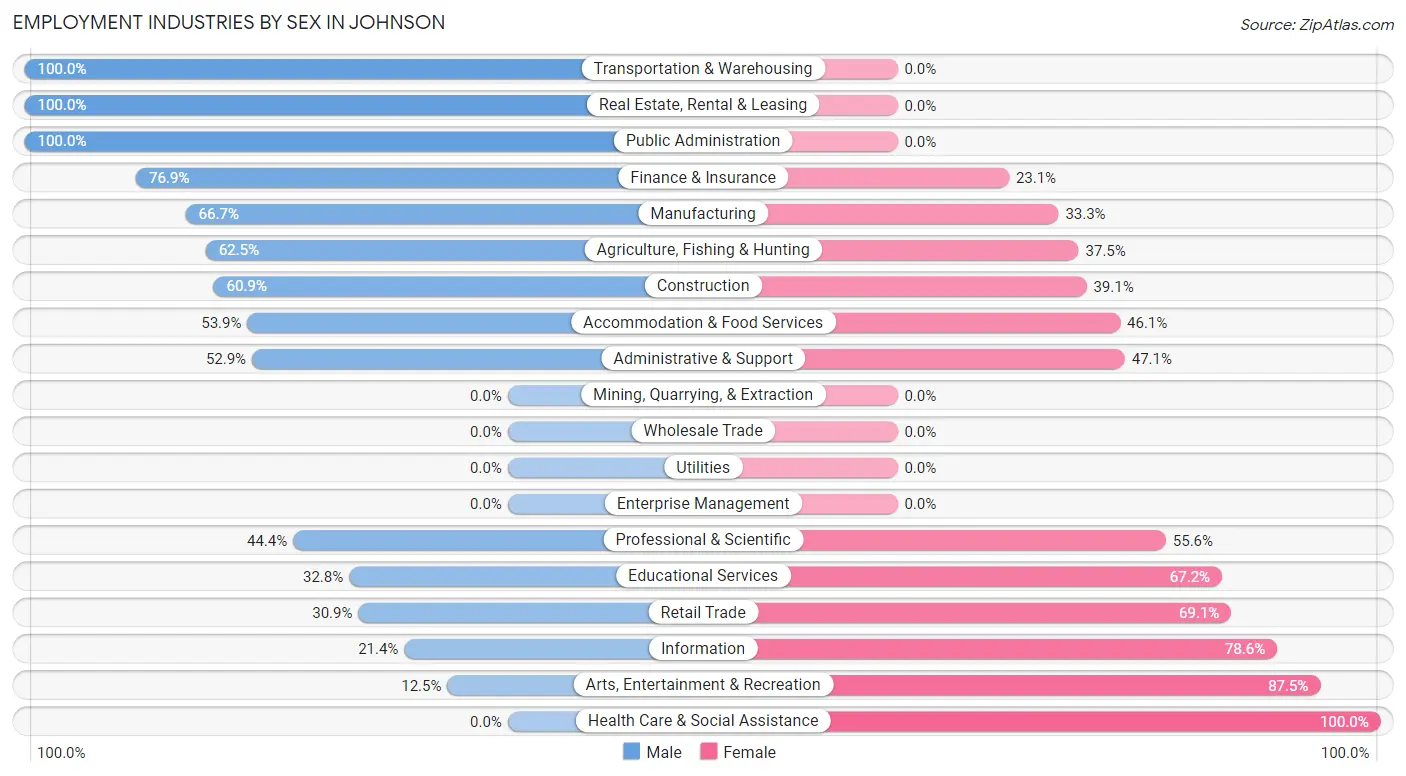
Employment Industries by Sex in Johnson
The Johnson industries that see more men than women are Transportation & Warehousing (100.0%), Real Estate, Rental & Leasing (100.0%), and Public Administration (100.0%), whereas the industries that tend to have a higher number of women are Health Care & Social Assistance (100.0%), Arts, Entertainment & Recreation (87.5%), and Information (78.6%).
| Industry | Male | Female |
| Agriculture, Fishing & Hunting | 5 (62.5%) | 3 (37.5%) |
| Mining, Quarrying, & Extraction | 0 (0.0%) | 0 (0.0%) |
| Construction | 28 (60.9%) | 18 (39.1%) |
| Manufacturing | 20 (66.7%) | 10 (33.3%) |
| Wholesale Trade | 0 (0.0%) | 0 (0.0%) |
| Retail Trade | 30 (30.9%) | 67 (69.1%) |
| Transportation & Warehousing | 10 (100.0%) | 0 (0.0%) |
| Utilities | 0 (0.0%) | 0 (0.0%) |
| Information | 3 (21.4%) | 11 (78.6%) |
| Finance & Insurance | 20 (76.9%) | 6 (23.1%) |
| Real Estate, Rental & Leasing | 5 (100.0%) | 0 (0.0%) |
| Professional & Scientific | 8 (44.4%) | 10 (55.6%) |
| Enterprise Management | 0 (0.0%) | 0 (0.0%) |
| Administrative & Support | 18 (52.9%) | 16 (47.1%) |
| Educational Services | 44 (32.8%) | 90 (67.2%) |
| Health Care & Social Assistance | 0 (0.0%) | 127 (100.0%) |
| Arts, Entertainment & Recreation | 2 (12.5%) | 14 (87.5%) |
| Accommodation & Food Services | 69 (53.9%) | 59 (46.1%) |
| Public Administration | 6 (100.0%) | 0 (0.0%) |
| Total | 269 (38.2%) | 435 (61.8%) |
Education in Johnson
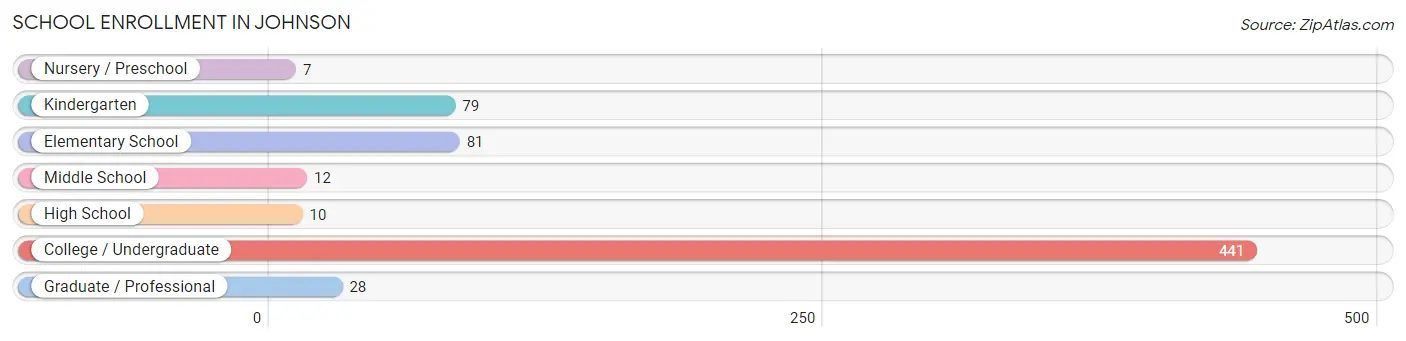
School Enrollment in Johnson
The most common levels of schooling among the 658 students in Johnson are college / undergraduate (441 | 67.0%), elementary school (81 | 12.3%), and kindergarten (79 | 12.0%).
| School Level | # Students | % Students |
| Nursery / Preschool | 7 | 1.1% |
| Kindergarten | 79 | 12.0% |
| Elementary School | 81 | 12.3% |
| Middle School | 12 | 1.8% |
| High School | 10 | 1.5% |
| College / Undergraduate | 441 | 67.0% |
| Graduate / Professional | 28 | 4.3% |
| Total | 658 | 100.0% |
School Enrollment by Age by Funding Source in Johnson
Out of a total of 658 students who are enrolled in schools in Johnson, 23 (3.5%) attend a private institution, while the remaining 635 (96.5%) are enrolled in public schools. The age group of 25 to 34 year olds has the highest likelihood of being enrolled in private schools, with 14 (56.0% in the age bracket) enrolled. Conversely, the age group of 3 to 4 year olds has the lowest likelihood of being enrolled in a private school, with 7 (100.0% in the age bracket) attending a public institution.
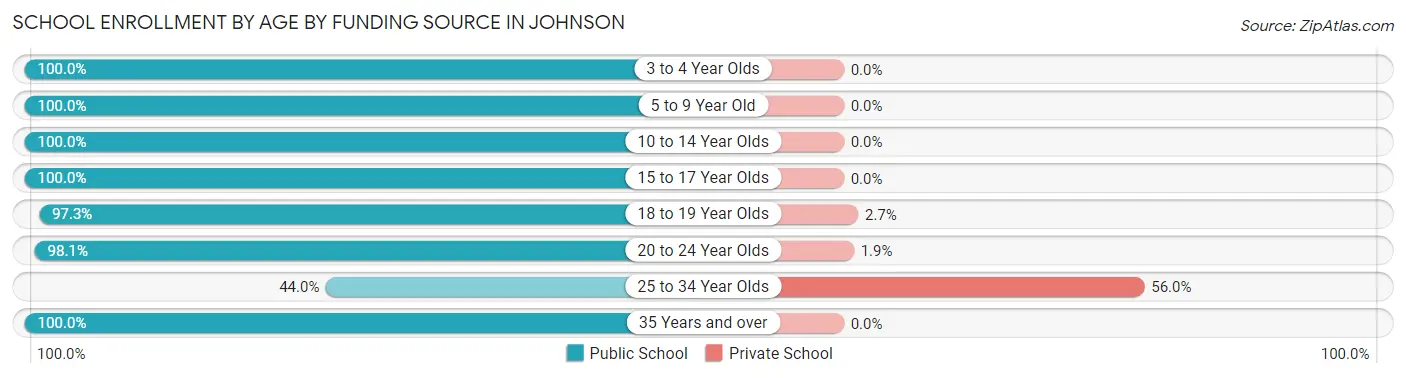
| Age Bracket | Public School | Private School |
| 3 to 4 Year Olds | 7 (100.0%) | 0 (0.0%) |
| 5 to 9 Year Old | 160 (100.0%) | 0 (0.0%) |
| 10 to 14 Year Olds | 12 (100.0%) | 0 (0.0%) |
| 15 to 17 Year Olds | 23 (100.0%) | 0 (0.0%) |
| 18 to 19 Year Olds | 145 (97.3%) | 4 (2.7%) |
| 20 to 24 Year Olds | 263 (98.1%) | 5 (1.9%) |
| 25 to 34 Year Olds | 11 (44.0%) | 14 (56.0%) |
| 35 Years and over | 14 (100.0%) | 0 (0.0%) |
| Total | 635 (96.5%) | 23 (3.5%) |
Educational Attainment by Field of Study in Johnson
Liberal arts & history (72 | 33.2%), bio, nature & agricultural (31 | 14.3%), social sciences (31 | 14.3%), visual & performing arts (24 | 11.1%), and computers & mathematics (21 | 9.7%) are the most common fields of study among 217 individuals in Johnson who have obtained a bachelor's degree or higher.
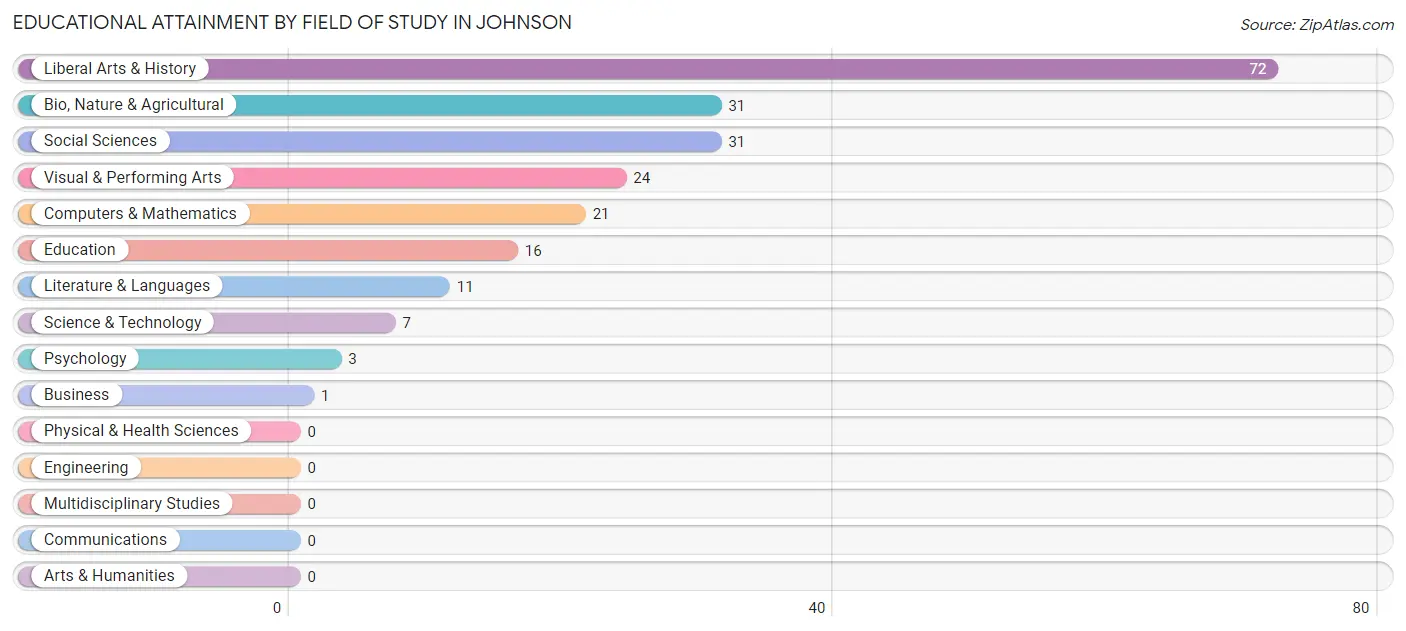
| Field of Study | # Graduates | % Graduates |
| Computers & Mathematics | 21 | 9.7% |
| Bio, Nature & Agricultural | 31 | 14.3% |
| Physical & Health Sciences | 0 | 0.0% |
| Psychology | 3 | 1.4% |
| Social Sciences | 31 | 14.3% |
| Engineering | 0 | 0.0% |
| Multidisciplinary Studies | 0 | 0.0% |
| Science & Technology | 7 | 3.2% |
| Business | 1 | 0.5% |
| Education | 16 | 7.4% |
| Literature & Languages | 11 | 5.1% |
| Liberal Arts & History | 72 | 33.2% |
| Visual & Performing Arts | 24 | 11.1% |
| Communications | 0 | 0.0% |
| Arts & Humanities | 0 | 0.0% |
| Total | 217 | 100.0% |
Transportation & Commute in Johnson
Vehicle Availability by Sex in Johnson
The most prevalent vehicle ownership categories in Johnson are males with 2 vehicles (127, accounting for 66.1%) and females with 2 vehicles (91, making up 42.3%).
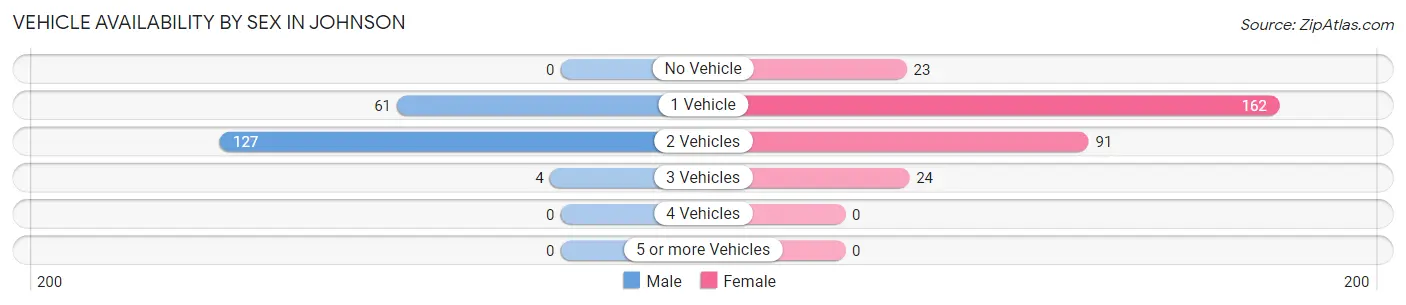
| Vehicles Available | Male | Female |
| No Vehicle | 0 (0.0%) | 23 (7.7%) |
| 1 Vehicle | 61 (31.8%) | 162 (54.0%) |
| 2 Vehicles | 127 (66.1%) | 91 (30.3%) |
| 3 Vehicles | 4 (2.1%) | 24 (8.0%) |
| 4 Vehicles | 0 (0.0%) | 0 (0.0%) |
| 5 or more Vehicles | 0 (0.0%) | 0 (0.0%) |
| Total | 192 (100.0%) | 300 (100.0%) |
Commute Time in Johnson
The most frequently occuring commute durations in Johnson are 5 to 9 minutes (130 commuters, 22.5%), 15 to 19 minutes (100 commuters, 17.3%), and 20 to 24 minutes (86 commuters, 14.9%).
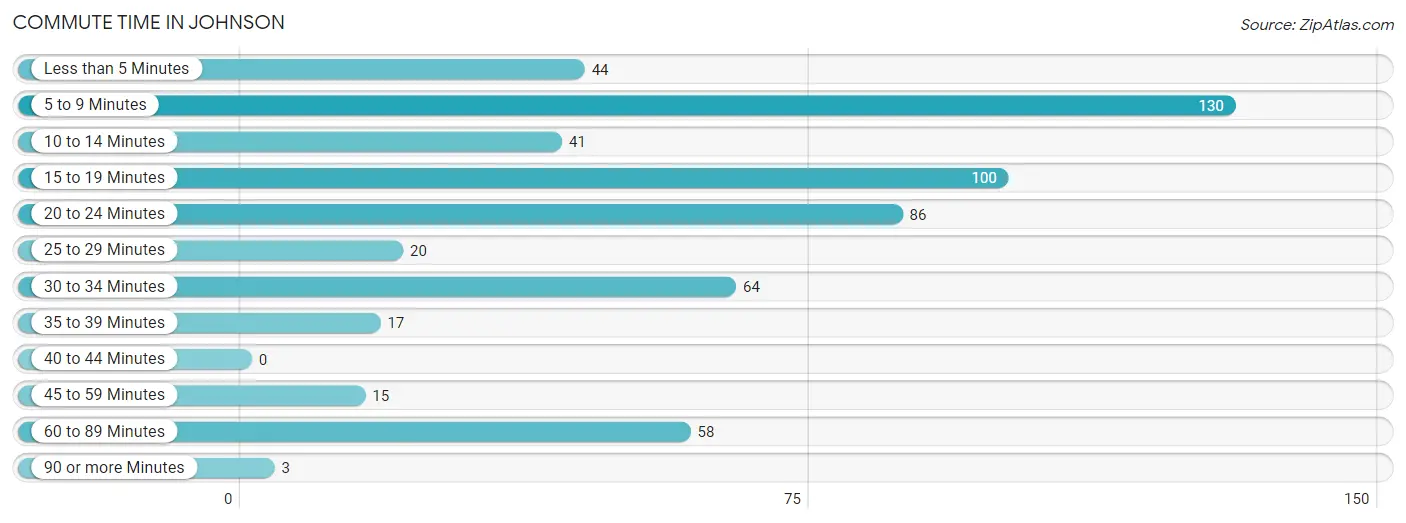
| Commute Time | # Commuters | % Commuters |
| Less than 5 Minutes | 44 | 7.6% |
| 5 to 9 Minutes | 130 | 22.5% |
| 10 to 14 Minutes | 41 | 7.1% |
| 15 to 19 Minutes | 100 | 17.3% |
| 20 to 24 Minutes | 86 | 14.9% |
| 25 to 29 Minutes | 20 | 3.5% |
| 30 to 34 Minutes | 64 | 11.1% |
| 35 to 39 Minutes | 17 | 2.9% |
| 40 to 44 Minutes | 0 | 0.0% |
| 45 to 59 Minutes | 15 | 2.6% |
| 60 to 89 Minutes | 58 | 10.0% |
| 90 or more Minutes | 3 | 0.5% |
Commute Time by Sex in Johnson
The most common commute times in Johnson are 60 to 89 minutes (52 commuters, 21.8%) for males and 5 to 9 minutes (96 commuters, 28.2%) for females.
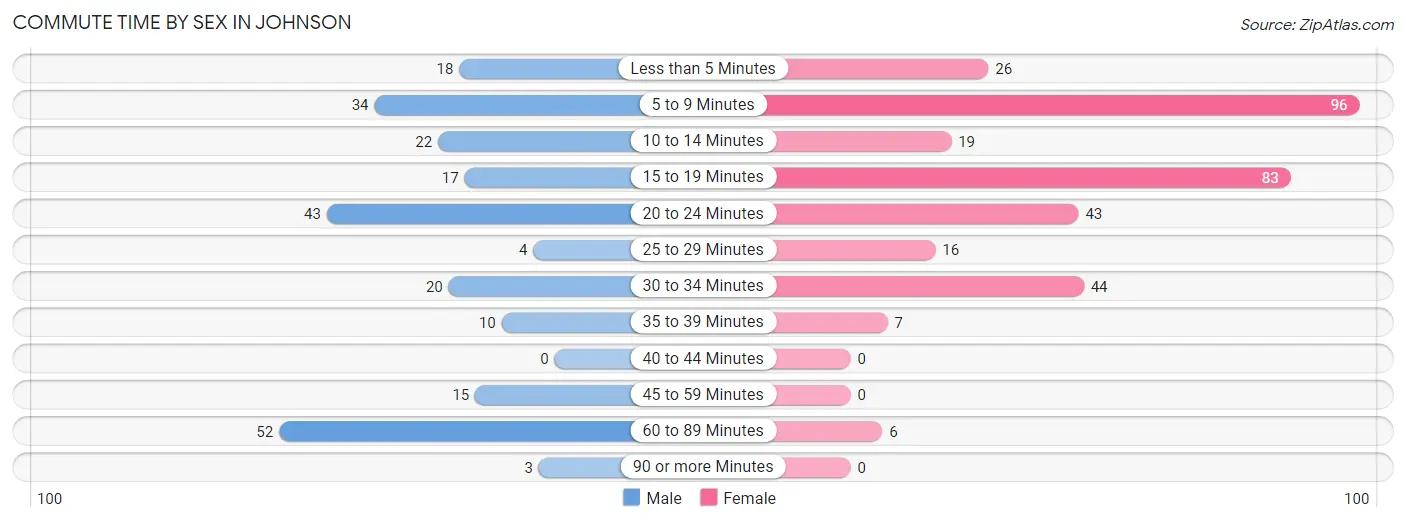
| Commute Time | Male | Female |
| Less than 5 Minutes | 18 (7.6%) | 26 (7.6%) |
| 5 to 9 Minutes | 34 (14.3%) | 96 (28.2%) |
| 10 to 14 Minutes | 22 (9.2%) | 19 (5.6%) |
| 15 to 19 Minutes | 17 (7.1%) | 83 (24.4%) |
| 20 to 24 Minutes | 43 (18.1%) | 43 (12.7%) |
| 25 to 29 Minutes | 4 (1.7%) | 16 (4.7%) |
| 30 to 34 Minutes | 20 (8.4%) | 44 (12.9%) |
| 35 to 39 Minutes | 10 (4.2%) | 7 (2.1%) |
| 40 to 44 Minutes | 0 (0.0%) | 0 (0.0%) |
| 45 to 59 Minutes | 15 (6.3%) | 0 (0.0%) |
| 60 to 89 Minutes | 52 (21.8%) | 6 (1.8%) |
| 90 or more Minutes | 3 (1.3%) | 0 (0.0%) |
Time of Departure to Work by Sex in Johnson
The most frequent times of departure to work in Johnson are 10:00 AM to 10:59 AM (38, 16.0%) for males and 8:00 AM to 8:29 AM (86, 25.3%) for females.
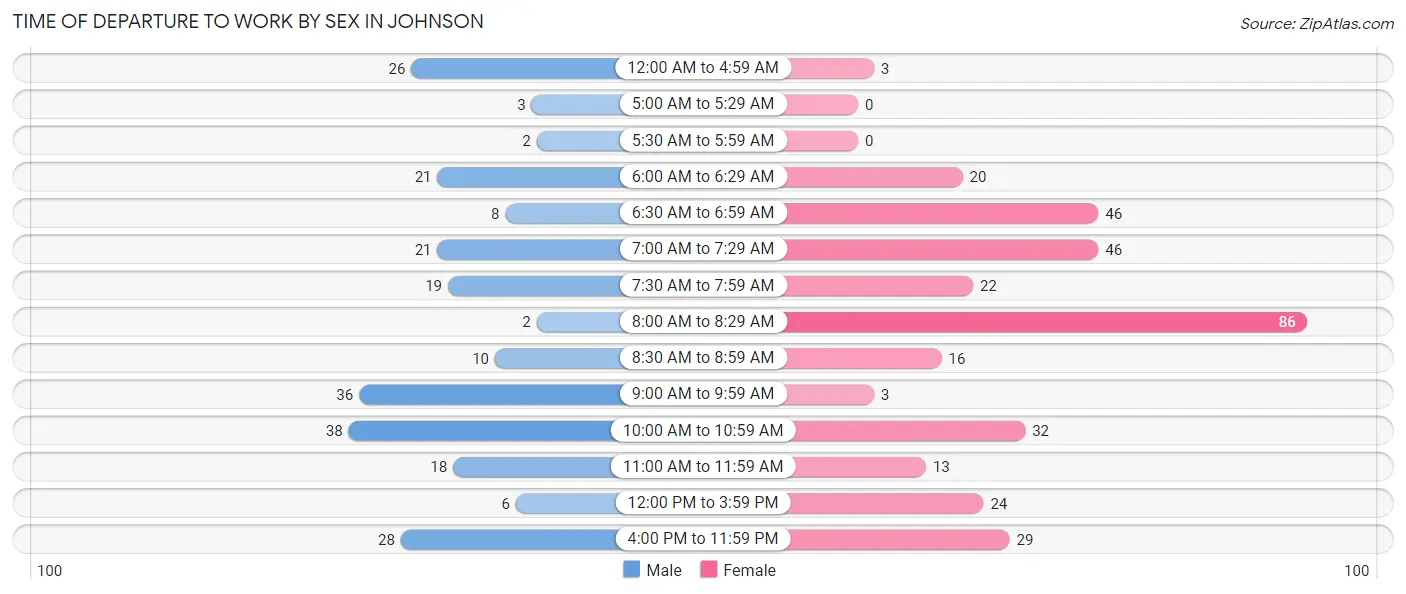
| Time of Departure | Male | Female |
| 12:00 AM to 4:59 AM | 26 (10.9%) | 3 (0.9%) |
| 5:00 AM to 5:29 AM | 3 (1.3%) | 0 (0.0%) |
| 5:30 AM to 5:59 AM | 2 (0.8%) | 0 (0.0%) |
| 6:00 AM to 6:29 AM | 21 (8.8%) | 20 (5.9%) |
| 6:30 AM to 6:59 AM | 8 (3.4%) | 46 (13.5%) |
| 7:00 AM to 7:29 AM | 21 (8.8%) | 46 (13.5%) |
| 7:30 AM to 7:59 AM | 19 (8.0%) | 22 (6.5%) |
| 8:00 AM to 8:29 AM | 2 (0.8%) | 86 (25.3%) |
| 8:30 AM to 8:59 AM | 10 (4.2%) | 16 (4.7%) |
| 9:00 AM to 9:59 AM | 36 (15.1%) | 3 (0.9%) |
| 10:00 AM to 10:59 AM | 38 (16.0%) | 32 (9.4%) |
| 11:00 AM to 11:59 AM | 18 (7.6%) | 13 (3.8%) |
| 12:00 PM to 3:59 PM | 6 (2.5%) | 24 (7.1%) |
| 4:00 PM to 11:59 PM | 28 (11.8%) | 29 (8.5%) |
| Total | 238 (100.0%) | 340 (100.0%) |
Housing Occupancy in Johnson
Occupancy by Ownership in Johnson
Of the total 457 dwellings in Johnson, owner-occupied units account for 173 (37.9%), while renter-occupied units make up 284 (62.1%).
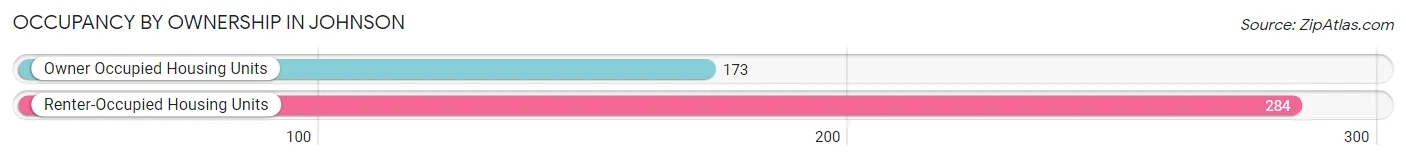
| Occupancy | # Housing Units | % Housing Units |
| Owner Occupied Housing Units | 173 | 37.9% |
| Renter-Occupied Housing Units | 284 | 62.1% |
| Total Occupied Housing Units | 457 | 100.0% |
Occupancy by Household Size in Johnson
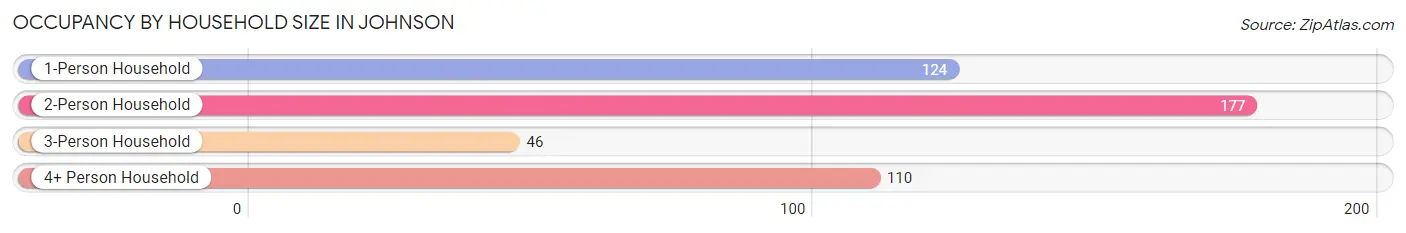
| Household Size | # Housing Units | % Housing Units |
| 1-Person Household | 124 | 27.1% |
| 2-Person Household | 177 | 38.7% |
| 3-Person Household | 46 | 10.1% |
| 4+ Person Household | 110 | 24.1% |
| Total Housing Units | 457 | 100.0% |
Occupancy by Ownership by Household Size in Johnson
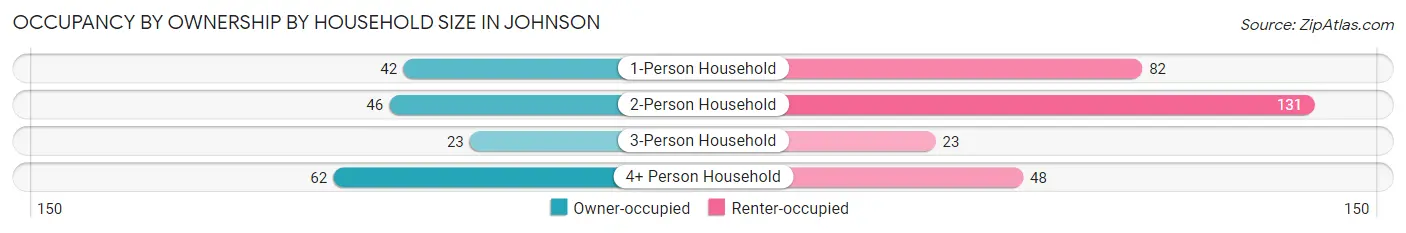
| Household Size | Owner-occupied | Renter-occupied |
| 1-Person Household | 42 (33.9%) | 82 (66.1%) |
| 2-Person Household | 46 (26.0%) | 131 (74.0%) |
| 3-Person Household | 23 (50.0%) | 23 (50.0%) |
| 4+ Person Household | 62 (56.4%) | 48 (43.6%) |
| Total Housing Units | 173 (37.9%) | 284 (62.1%) |
Occupancy by Educational Attainment in Johnson
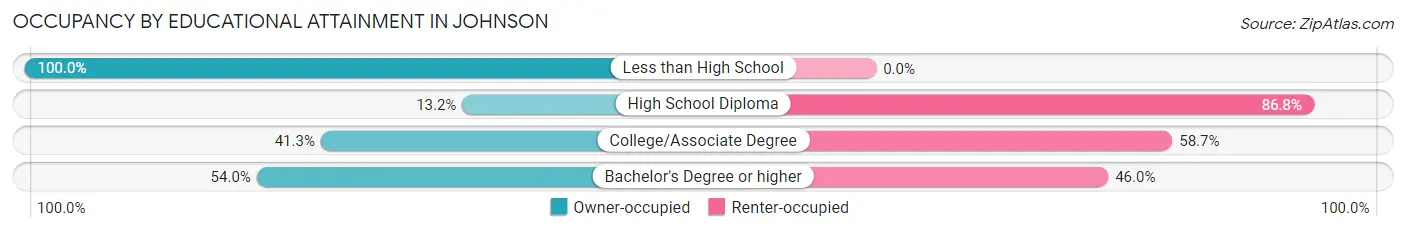
| Household Size | Owner-occupied | Renter-occupied |
| Less than High School | 3 (100.0%) | 0 (0.0%) |
| High School Diploma | 18 (13.2%) | 118 (86.8%) |
| College/Associate Degree | 64 (41.3%) | 91 (58.7%) |
| Bachelor's Degree or higher | 88 (54.0%) | 75 (46.0%) |
Occupancy by Age of Householder in Johnson
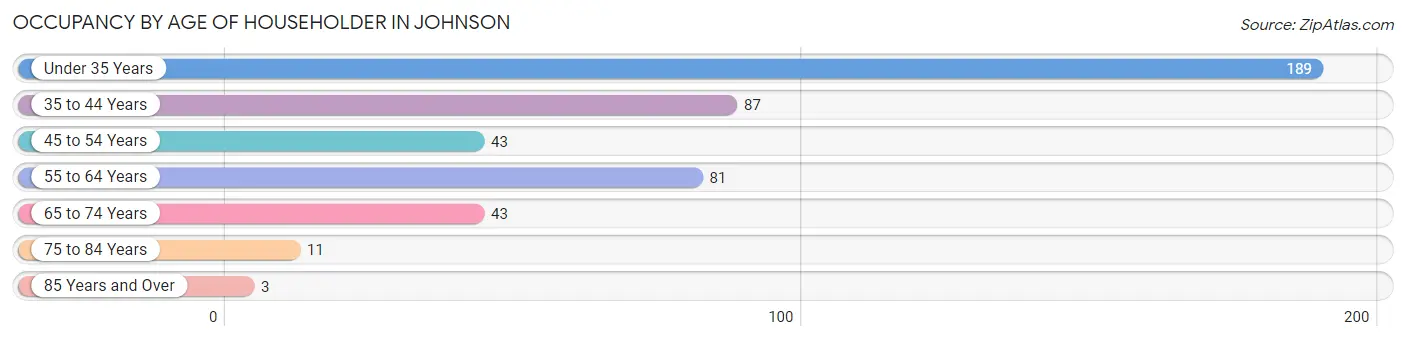
| Age Bracket | # Households | % Households |
| Under 35 Years | 189 | 41.4% |
| 35 to 44 Years | 87 | 19.0% |
| 45 to 54 Years | 43 | 9.4% |
| 55 to 64 Years | 81 | 17.7% |
| 65 to 74 Years | 43 | 9.4% |
| 75 to 84 Years | 11 | 2.4% |
| 85 Years and Over | 3 | 0.7% |
| Total | 457 | 100.0% |
Housing Finances in Johnson
Median Income by Occupancy in Johnson
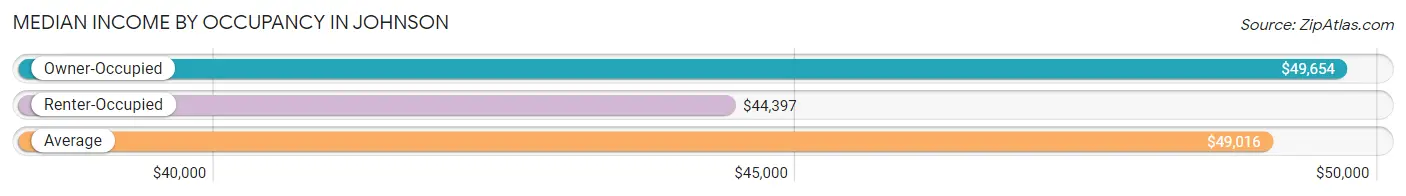
| Occupancy Type | # Households | Median Income |
| Owner-Occupied | 173 (37.9%) | $49,654 |
| Renter-Occupied | 284 (62.1%) | $44,397 |
| Average | 457 (100.0%) | $49,016 |
Occupancy by Householder Income Bracket in Johnson
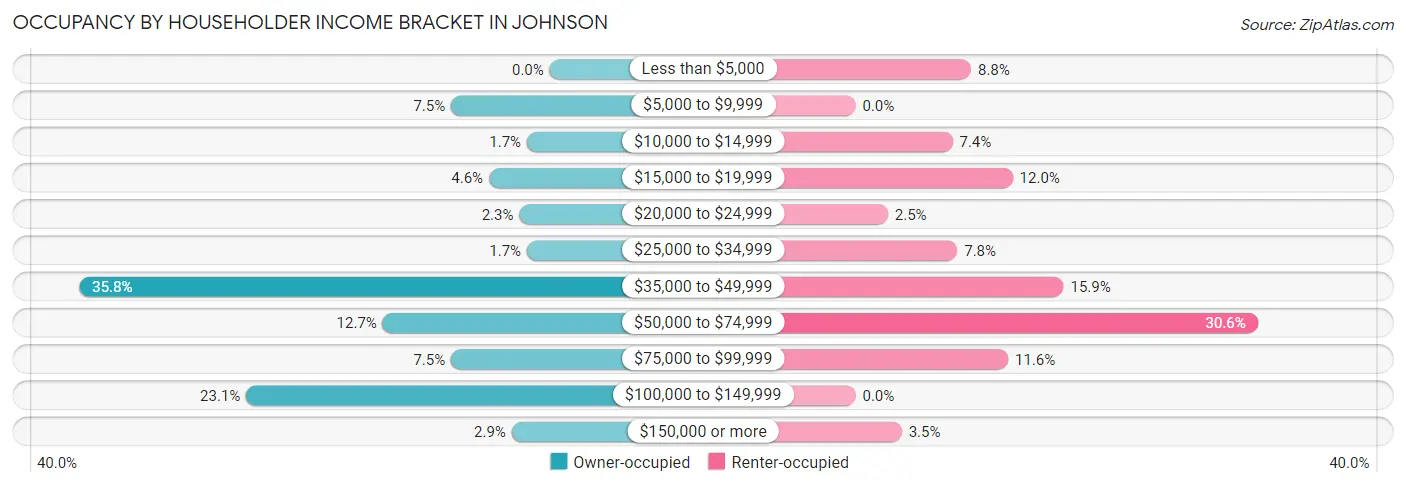
| Income Bracket | Owner-occupied | Renter-occupied |
| Less than $5,000 | 0 (0.0%) | 25 (8.8%) |
| $5,000 to $9,999 | 13 (7.5%) | 0 (0.0%) |
| $10,000 to $14,999 | 3 (1.7%) | 21 (7.4%) |
| $15,000 to $19,999 | 8 (4.6%) | 34 (12.0%) |
| $20,000 to $24,999 | 4 (2.3%) | 7 (2.5%) |
| $25,000 to $34,999 | 3 (1.7%) | 22 (7.7%) |
| $35,000 to $49,999 | 62 (35.8%) | 45 (15.9%) |
| $50,000 to $74,999 | 22 (12.7%) | 87 (30.6%) |
| $75,000 to $99,999 | 13 (7.5%) | 33 (11.6%) |
| $100,000 to $149,999 | 40 (23.1%) | 0 (0.0%) |
| $150,000 or more | 5 (2.9%) | 10 (3.5%) |
| Total | 173 (100.0%) | 284 (100.0%) |
Monthly Housing Cost Tiers in Johnson
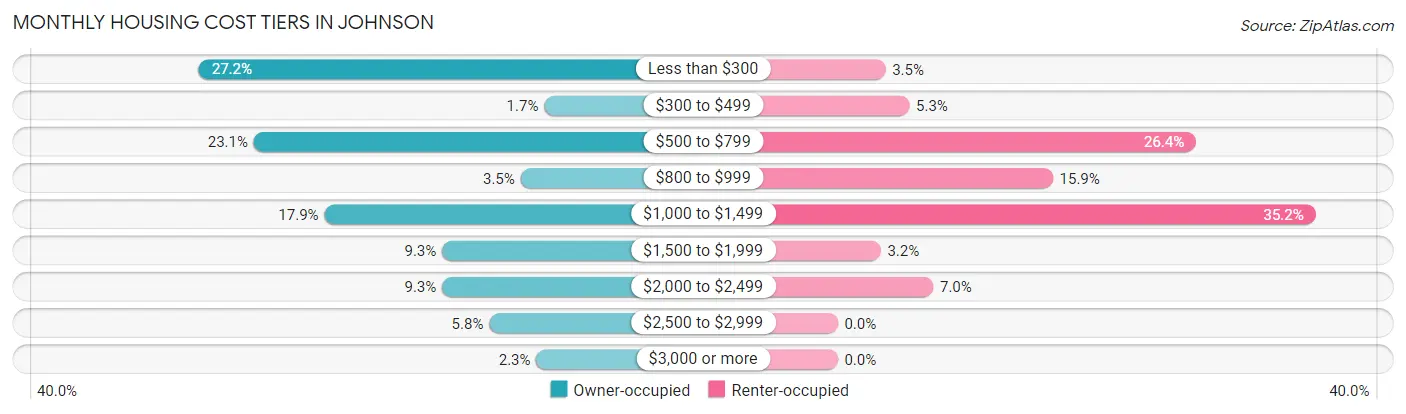
| Monthly Cost | Owner-occupied | Renter-occupied |
| Less than $300 | 47 (27.2%) | 10 (3.5%) |
| $300 to $499 | 3 (1.7%) | 15 (5.3%) |
| $500 to $799 | 40 (23.1%) | 75 (26.4%) |
| $800 to $999 | 6 (3.5%) | 45 (15.9%) |
| $1,000 to $1,499 | 31 (17.9%) | 100 (35.2%) |
| $1,500 to $1,999 | 16 (9.2%) | 9 (3.2%) |
| $2,000 to $2,499 | 16 (9.2%) | 20 (7.0%) |
| $2,500 to $2,999 | 10 (5.8%) | 0 (0.0%) |
| $3,000 or more | 4 (2.3%) | 0 (0.0%) |
| Total | 173 (100.0%) | 284 (100.0%) |
Physical Housing Characteristics in Johnson
Housing Structures in Johnson
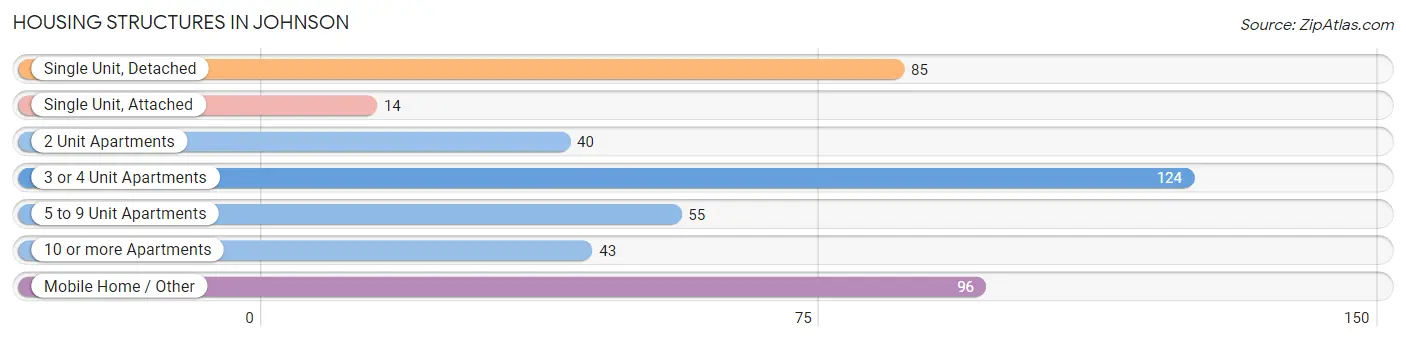
| Structure Type | # Housing Units | % Housing Units |
| Single Unit, Detached | 85 | 18.6% |
| Single Unit, Attached | 14 | 3.1% |
| 2 Unit Apartments | 40 | 8.7% |
| 3 or 4 Unit Apartments | 124 | 27.1% |
| 5 to 9 Unit Apartments | 55 | 12.0% |
| 10 or more Apartments | 43 | 9.4% |
| Mobile Home / Other | 96 | 21.0% |
| Total | 457 | 100.0% |
Housing Structures by Occupancy in Johnson
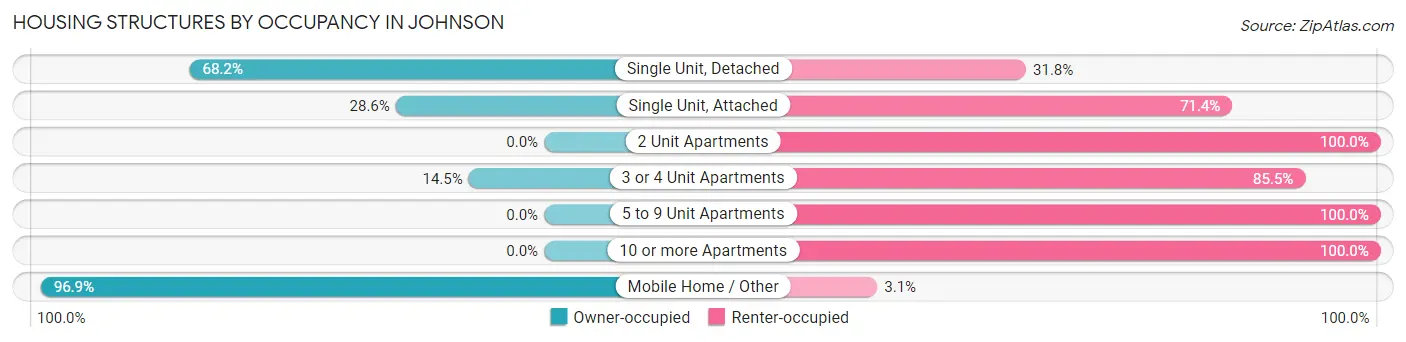
| Structure Type | Owner-occupied | Renter-occupied |
| Single Unit, Detached | 58 (68.2%) | 27 (31.8%) |
| Single Unit, Attached | 4 (28.6%) | 10 (71.4%) |
| 2 Unit Apartments | 0 (0.0%) | 40 (100.0%) |
| 3 or 4 Unit Apartments | 18 (14.5%) | 106 (85.5%) |
| 5 to 9 Unit Apartments | 0 (0.0%) | 55 (100.0%) |
| 10 or more Apartments | 0 (0.0%) | 43 (100.0%) |
| Mobile Home / Other | 93 (96.9%) | 3 (3.1%) |
| Total | 173 (37.9%) | 284 (62.1%) |
Housing Structures by Number of Rooms in Johnson
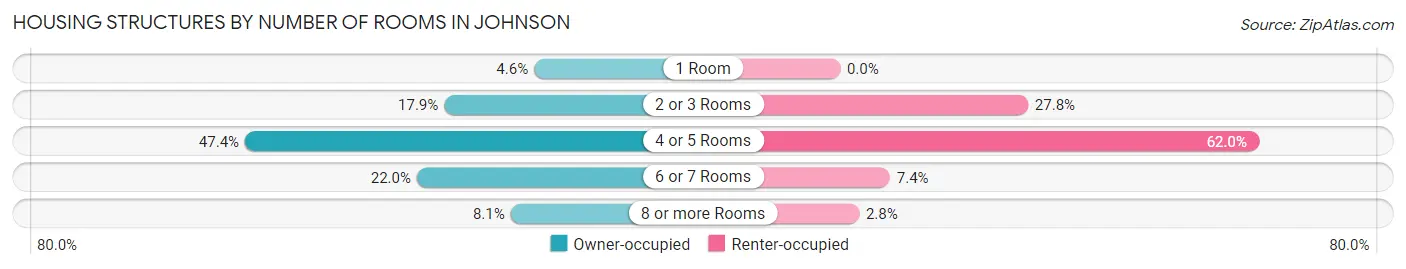
| Number of Rooms | Owner-occupied | Renter-occupied |
| 1 Room | 8 (4.6%) | 0 (0.0%) |
| 2 or 3 Rooms | 31 (17.9%) | 79 (27.8%) |
| 4 or 5 Rooms | 82 (47.4%) | 176 (62.0%) |
| 6 or 7 Rooms | 38 (22.0%) | 21 (7.4%) |
| 8 or more Rooms | 14 (8.1%) | 8 (2.8%) |
| Total | 173 (100.0%) | 284 (100.0%) |
Housing Structure by Heating Type in Johnson
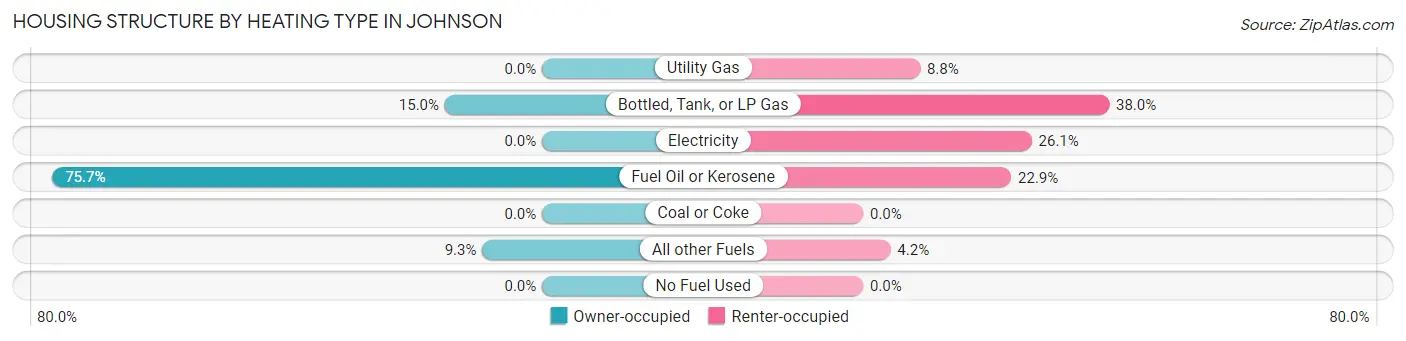
| Heating Type | Owner-occupied | Renter-occupied |
| Utility Gas | 0 (0.0%) | 25 (8.8%) |
| Bottled, Tank, or LP Gas | 26 (15.0%) | 108 (38.0%) |
| Electricity | 0 (0.0%) | 74 (26.1%) |
| Fuel Oil or Kerosene | 131 (75.7%) | 65 (22.9%) |
| Coal or Coke | 0 (0.0%) | 0 (0.0%) |
| All other Fuels | 16 (9.2%) | 12 (4.2%) |
| No Fuel Used | 0 (0.0%) | 0 (0.0%) |
| Total | 173 (100.0%) | 284 (100.0%) |
Household Vehicle Usage in Johnson
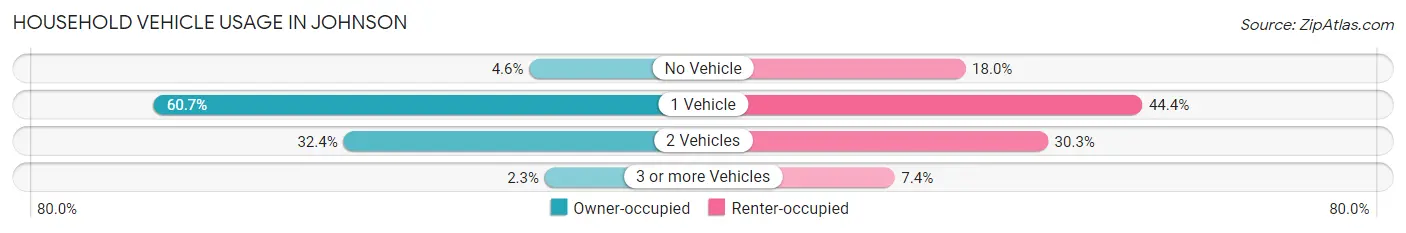
| Vehicles per Household | Owner-occupied | Renter-occupied |
| No Vehicle | 8 (4.6%) | 51 (18.0%) |
| 1 Vehicle | 105 (60.7%) | 126 (44.4%) |
| 2 Vehicles | 56 (32.4%) | 86 (30.3%) |
| 3 or more Vehicles | 4 (2.3%) | 21 (7.4%) |
| Total | 173 (100.0%) | 284 (100.0%) |
Real Estate & Mortgages in Johnson
Real Estate and Mortgage Overview in Johnson
| Characteristic | Without Mortgage | With Mortgage |
| Housing Units | 92 | 81 |
| Median Property Value | - | - |
| Median Household Income | $47,926 | $5 |
| Monthly Housing Costs | - | - |
| Real Estate Taxes | - | - |
Property Value by Mortgage Status in Johnson
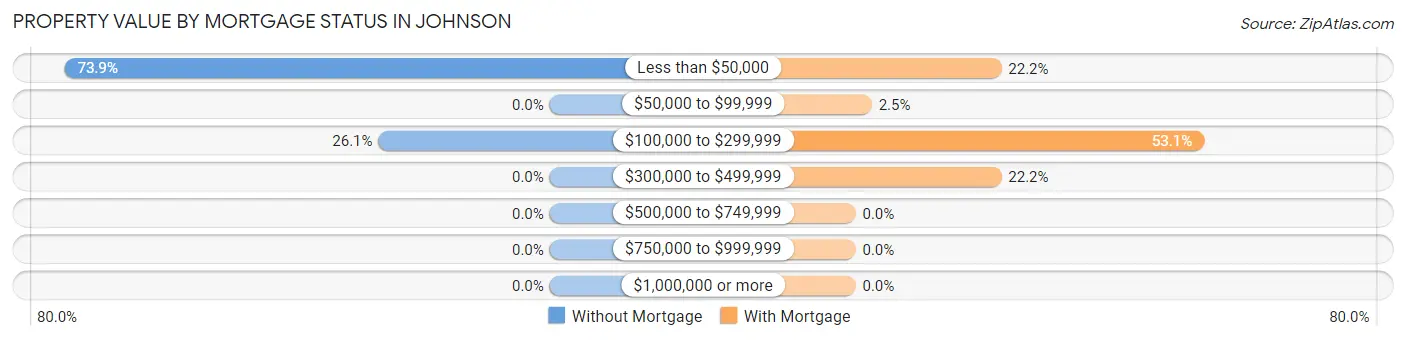
| Property Value | Without Mortgage | With Mortgage |
| Less than $50,000 | 68 (73.9%) | 18 (22.2%) |
| $50,000 to $99,999 | 0 (0.0%) | 2 (2.5%) |
| $100,000 to $299,999 | 24 (26.1%) | 43 (53.1%) |
| $300,000 to $499,999 | 0 (0.0%) | 18 (22.2%) |
| $500,000 to $749,999 | 0 (0.0%) | 0 (0.0%) |
| $750,000 to $999,999 | 0 (0.0%) | 0 (0.0%) |
| $1,000,000 or more | 0 (0.0%) | 0 (0.0%) |
| Total | 92 (100.0%) | 81 (100.0%) |
Household Income by Mortgage Status in Johnson
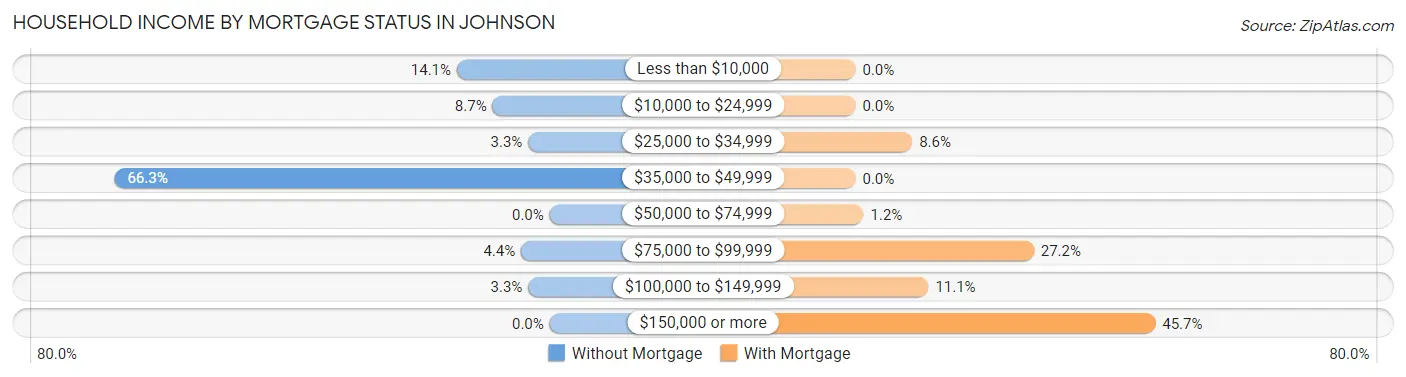
| Household Income | Without Mortgage | With Mortgage |
| Less than $10,000 | 13 (14.1%) | 0 (0.0%) |
| $10,000 to $24,999 | 8 (8.7%) | 0 (0.0%) |
| $25,000 to $34,999 | 3 (3.3%) | 7 (8.6%) |
| $35,000 to $49,999 | 61 (66.3%) | 0 (0.0%) |
| $50,000 to $74,999 | 0 (0.0%) | 1 (1.2%) |
| $75,000 to $99,999 | 4 (4.3%) | 22 (27.2%) |
| $100,000 to $149,999 | 3 (3.3%) | 9 (11.1%) |
| $150,000 or more | 0 (0.0%) | 37 (45.7%) |
| Total | 92 (100.0%) | 81 (100.0%) |
Property Value to Household Income Ratio in Johnson
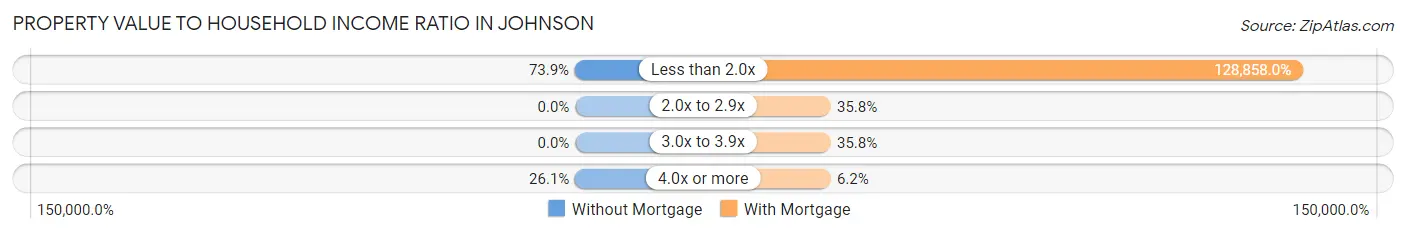
| Value-to-Income Ratio | Without Mortgage | With Mortgage |
| Less than 2.0x | 68 (73.9%) | 104,375 (128,858.0%) |
| 2.0x to 2.9x | 0 (0.0%) | 29 (35.8%) |
| 3.0x to 3.9x | 0 (0.0%) | 29 (35.8%) |
| 4.0x or more | 24 (26.1%) | 5 (6.2%) |
| Total | 92 (100.0%) | 81 (100.0%) |
Real Estate Taxes by Mortgage Status in Johnson
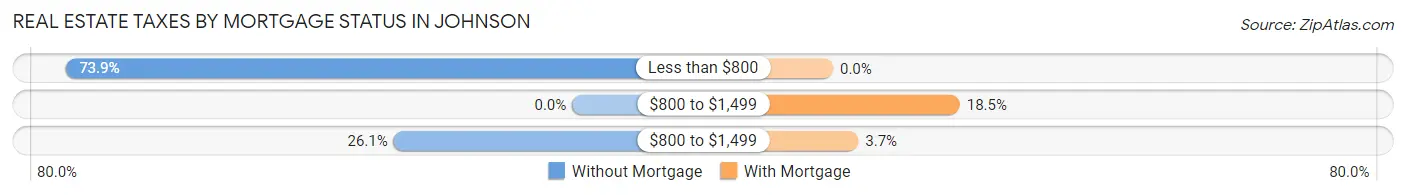
| Property Taxes | Without Mortgage | With Mortgage |
| Less than $800 | 68 (73.9%) | 0 (0.0%) |
| $800 to $1,499 | 0 (0.0%) | 15 (18.5%) |
| $800 to $1,499 | 24 (26.1%) | 3 (3.7%) |
| Total | 92 (100.0%) | 81 (100.0%) |
Health & Disability in Johnson
Health Insurance Coverage by Age in Johnson
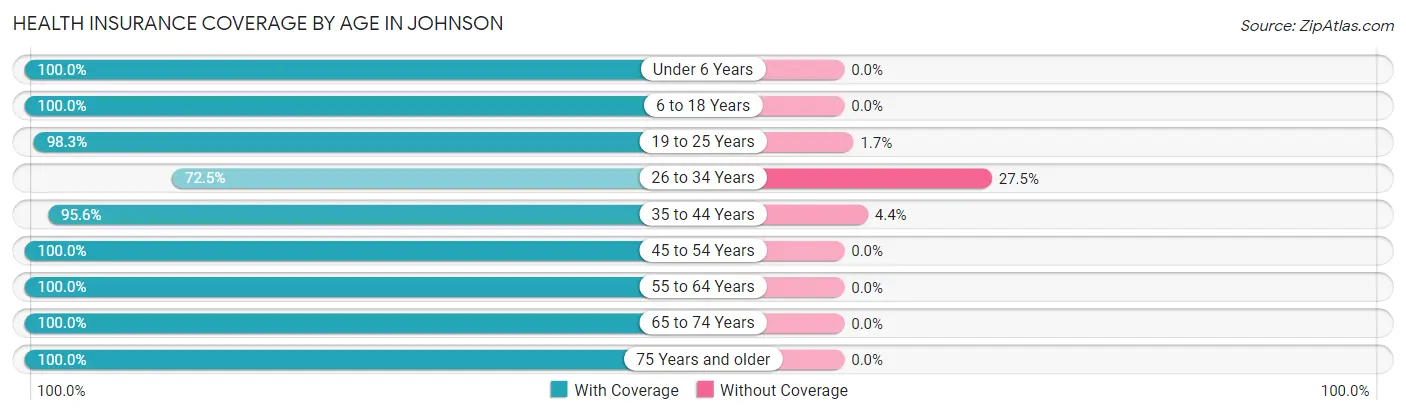
| Age Bracket | With Coverage | Without Coverage |
| Under 6 Years | 150 (100.0%) | 0 (0.0%) |
| 6 to 18 Years | 205 (100.0%) | 0 (0.0%) |
| 19 to 25 Years | 461 (98.3%) | 8 (1.7%) |
| 26 to 34 Years | 137 (72.5%) | 52 (27.5%) |
| 35 to 44 Years | 109 (95.6%) | 5 (4.4%) |
| 45 to 54 Years | 65 (100.0%) | 0 (0.0%) |
| 55 to 64 Years | 90 (100.0%) | 0 (0.0%) |
| 65 to 74 Years | 48 (100.0%) | 0 (0.0%) |
| 75 Years and older | 17 (100.0%) | 0 (0.0%) |
| Total | 1,282 (95.2%) | 65 (4.8%) |
Health Insurance Coverage by Citizenship Status in Johnson
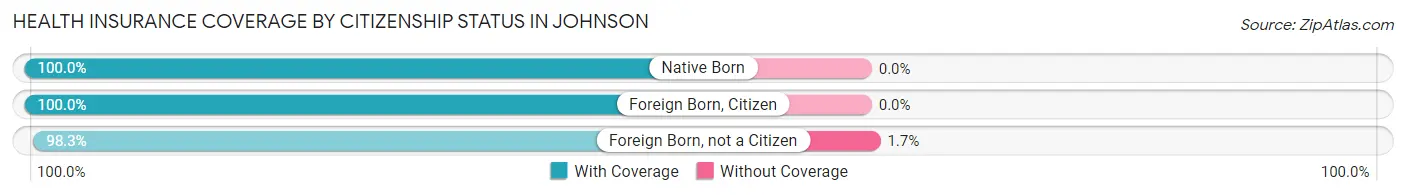
| Citizenship Status | With Coverage | Without Coverage |
| Native Born | 150 (100.0%) | 0 (0.0%) |
| Foreign Born, Citizen | 205 (100.0%) | 0 (0.0%) |
| Foreign Born, not a Citizen | 461 (98.3%) | 8 (1.7%) |
Health Insurance Coverage by Household Income in Johnson
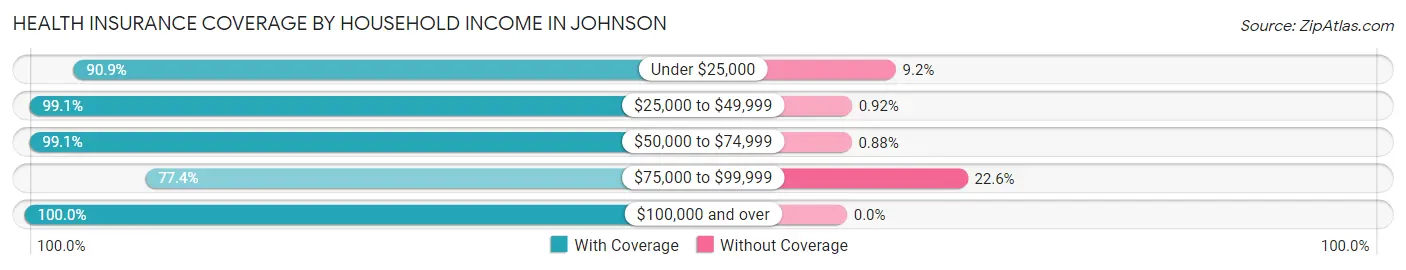
| Household Income | With Coverage | Without Coverage |
| Under $25,000 | 139 (90.8%) | 14 (9.1%) |
| $25,000 to $49,999 | 323 (99.1%) | 3 (0.9%) |
| $50,000 to $74,999 | 226 (99.1%) | 2 (0.9%) |
| $75,000 to $99,999 | 137 (77.4%) | 40 (22.6%) |
| $100,000 and over | 127 (100.0%) | 0 (0.0%) |
Public vs Private Health Insurance Coverage by Age in Johnson
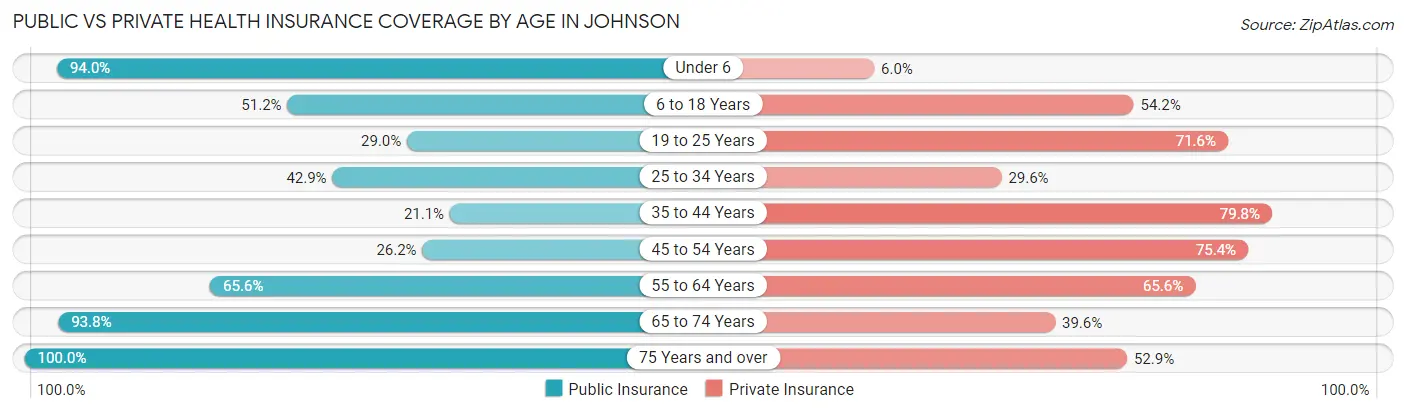
| Age Bracket | Public Insurance | Private Insurance |
| Under 6 | 141 (94.0%) | 9 (6.0%) |
| 6 to 18 Years | 105 (51.2%) | 111 (54.1%) |
| 19 to 25 Years | 136 (29.0%) | 336 (71.6%) |
| 25 to 34 Years | 81 (42.9%) | 56 (29.6%) |
| 35 to 44 Years | 24 (21.0%) | 91 (79.8%) |
| 45 to 54 Years | 17 (26.2%) | 49 (75.4%) |
| 55 to 64 Years | 59 (65.6%) | 59 (65.6%) |
| 65 to 74 Years | 45 (93.8%) | 19 (39.6%) |
| 75 Years and over | 17 (100.0%) | 9 (52.9%) |
| Total | 625 (46.4%) | 739 (54.9%) |
Disability Status by Sex by Age in Johnson
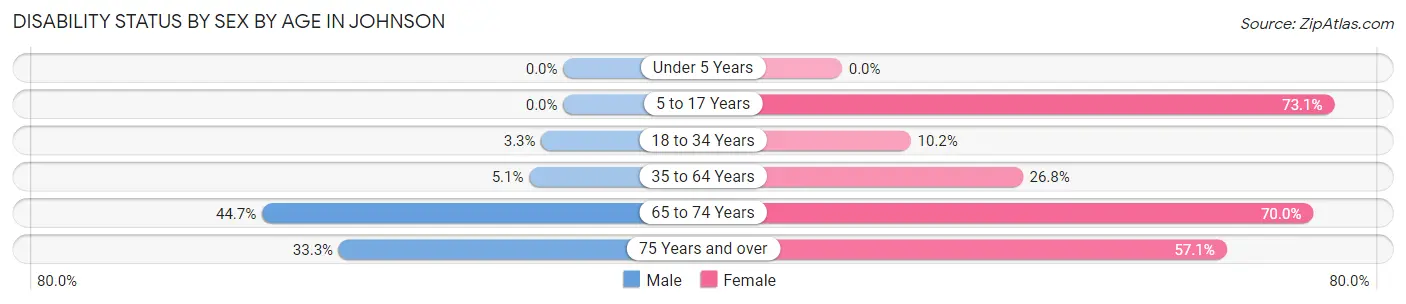
| Age Bracket | Male | Female |
| Under 5 Years | 0 (0.0%) | 0 (0.0%) |
| 5 to 17 Years | 0 (0.0%) | 49 (73.1%) |
| 18 to 34 Years | 10 (3.3%) | 41 (10.2%) |
| 35 to 64 Years | 4 (5.1%) | 51 (26.8%) |
| 65 to 74 Years | 17 (44.7%) | 7 (70.0%) |
| 75 Years and over | 1 (33.3%) | 8 (57.1%) |
Disability Class by Sex by Age in Johnson
Disability Class: Hearing Difficulty
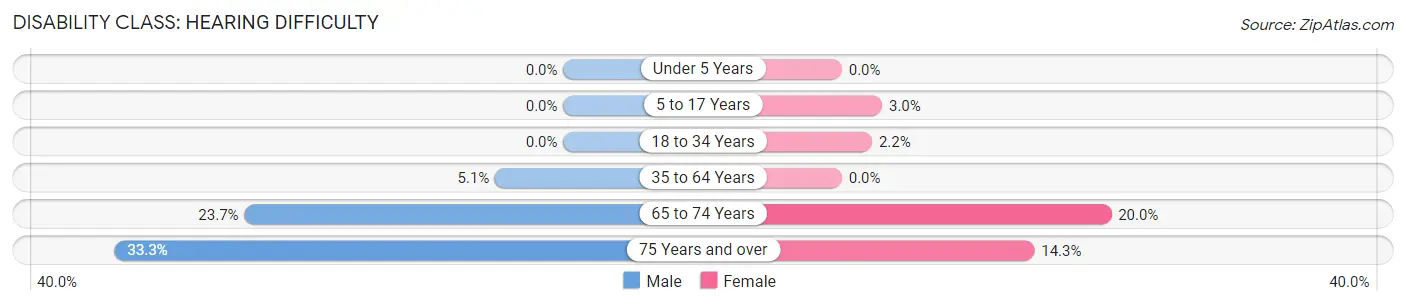
| Age Bracket | Male | Female |
| Under 5 Years | 0 (0.0%) | 0 (0.0%) |
| 5 to 17 Years | 0 (0.0%) | 2 (3.0%) |
| 18 to 34 Years | 0 (0.0%) | 9 (2.2%) |
| 35 to 64 Years | 4 (5.1%) | 0 (0.0%) |
| 65 to 74 Years | 9 (23.7%) | 2 (20.0%) |
| 75 Years and over | 1 (33.3%) | 2 (14.3%) |
Disability Class: Vision Difficulty
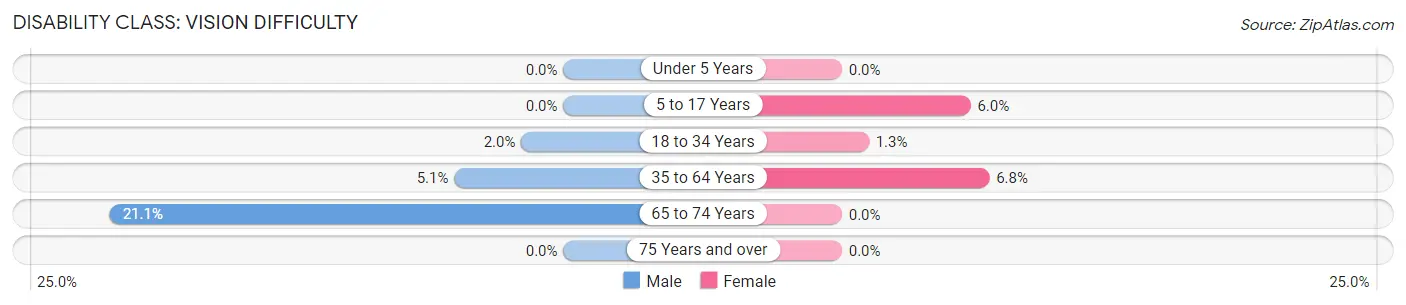
| Age Bracket | Male | Female |
| Under 5 Years | 0 (0.0%) | 0 (0.0%) |
| 5 to 17 Years | 0 (0.0%) | 4 (6.0%) |
| 18 to 34 Years | 6 (1.9%) | 5 (1.3%) |
| 35 to 64 Years | 4 (5.1%) | 13 (6.8%) |
| 65 to 74 Years | 8 (21.0%) | 0 (0.0%) |
| 75 Years and over | 0 (0.0%) | 0 (0.0%) |
Disability Class: Cognitive Difficulty
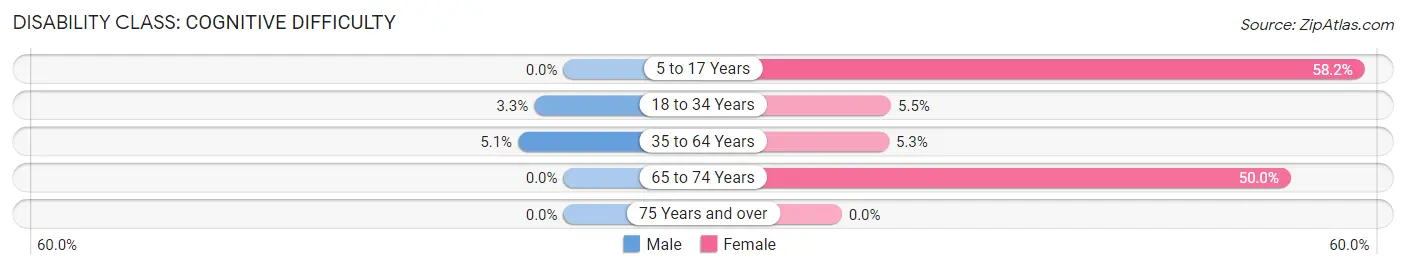
| Age Bracket | Male | Female |
| 5 to 17 Years | 0 (0.0%) | 39 (58.2%) |
| 18 to 34 Years | 10 (3.3%) | 22 (5.5%) |
| 35 to 64 Years | 4 (5.1%) | 10 (5.3%) |
| 65 to 74 Years | 0 (0.0%) | 5 (50.0%) |
| 75 Years and over | 0 (0.0%) | 0 (0.0%) |
Disability Class: Ambulatory Difficulty
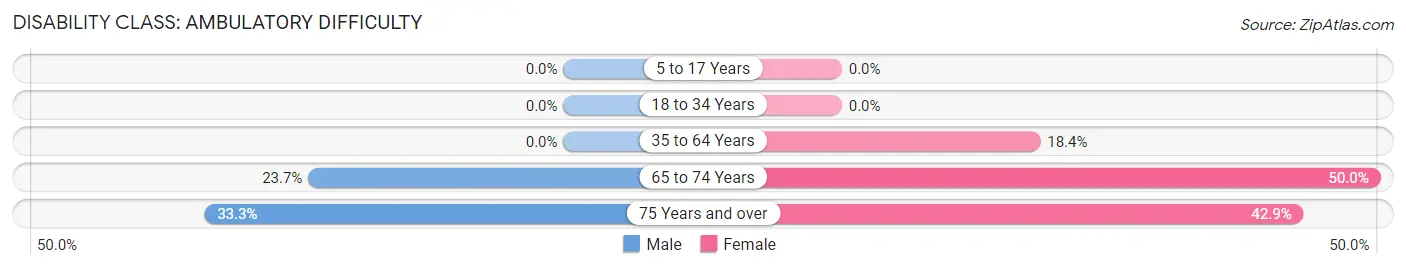
| Age Bracket | Male | Female |
| 5 to 17 Years | 0 (0.0%) | 0 (0.0%) |
| 18 to 34 Years | 0 (0.0%) | 0 (0.0%) |
| 35 to 64 Years | 0 (0.0%) | 35 (18.4%) |
| 65 to 74 Years | 9 (23.7%) | 5 (50.0%) |
| 75 Years and over | 1 (33.3%) | 6 (42.9%) |
Disability Class: Self-Care Difficulty
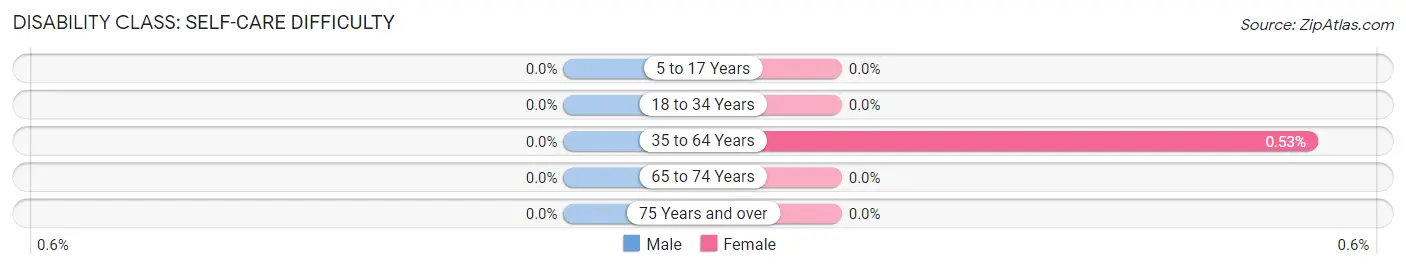
| Age Bracket | Male | Female |
| 5 to 17 Years | 0 (0.0%) | 0 (0.0%) |
| 18 to 34 Years | 0 (0.0%) | 0 (0.0%) |
| 35 to 64 Years | 0 (0.0%) | 1 (0.5%) |
| 65 to 74 Years | 0 (0.0%) | 0 (0.0%) |
| 75 Years and over | 0 (0.0%) | 0 (0.0%) |
Technology Access in Johnson
Computing Device Access in Johnson
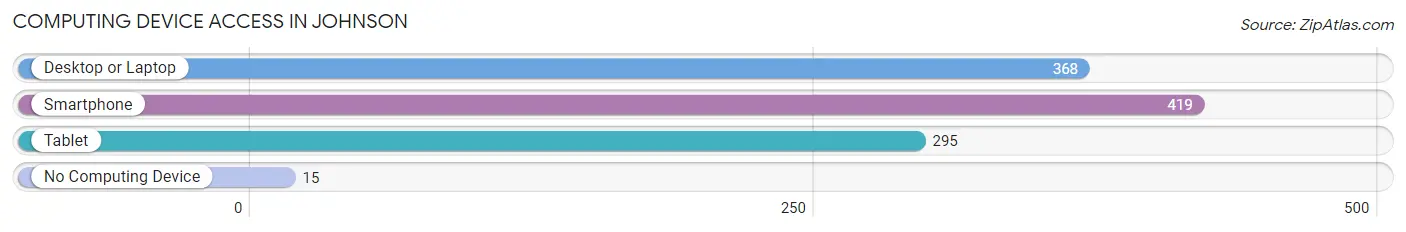
| Device Type | # Households | % Households |
| Desktop or Laptop | 368 | 80.5% |
| Smartphone | 419 | 91.7% |
| Tablet | 295 | 64.5% |
| No Computing Device | 15 | 3.3% |
| Total | 457 | 100.0% |
Internet Access in Johnson
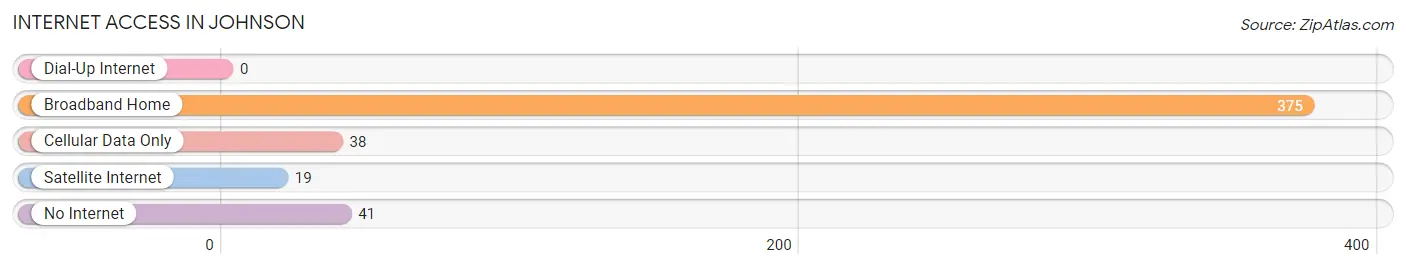
| Internet Type | # Households | % Households |
| Dial-Up Internet | 0 | 0.0% |
| Broadband Home | 375 | 82.1% |
| Cellular Data Only | 38 | 8.3% |
| Satellite Internet | 19 | 4.2% |
| No Internet | 41 | 9.0% |
| Total | 457 | 100.0% |
Johnson Summary
Johnson, Vermont is a small town located in Lamoille County in the state of Vermont. It is situated in the Green Mountains and is home to a population of approximately 2,000 people. The town was founded in 1780 and is named after the first settler, William Johnson.
Geography
Johnson is located in the Green Mountains of Vermont, approximately 20 miles east of Burlington. The town is situated in a valley surrounded by mountains, with the highest peak being Mount Mansfield at 4,393 feet. The town is located on the Lamoille River, which is a tributary of the Winooski River. The town is also home to several small lakes, including Lake Elmore, Lake Eden, and Lake Lamoille.
Economy
The economy of Johnson is largely based on tourism and agriculture. The town is home to several ski resorts, including Stowe Mountain Resort, Smugglers' Notch Resort, and Bolton Valley Resort. These resorts attract visitors from all over the world and provide jobs for many of the town's residents. Agriculture is also an important part of the local economy, with dairy farming being the primary source of income for many of the town's farmers.
Demographics
As of the 2010 census, the population of Johnson was 2,037. The racial makeup of the town was 95.3% White, 0.7% African American, 0.3% Native American, 0.7% Asian, 0.1% Pacific Islander, and 2.0% from two or more races. The median household income was $45,938, and the median family income was $51,938. The per capita income was $22,938.
The town is home to several churches, including the United Church of Johnson, the Johnson Congregational Church, and the Johnson United Methodist Church. There are also several schools in the town, including Johnson Elementary School, Johnson Middle School, and Johnson High School.
Conclusion
Johnson, Vermont is a small town located in the Green Mountains of Vermont. It is home to a population of approximately 2,000 people and is largely based on tourism and agriculture. The town is home to several ski resorts, churches, and schools, and the median household income is $45,938. Johnson is a great place to live and visit, and its residents are proud of their town's history and culture.
Common Questions
What is Per Capita Income in Johnson?
Per Capita income in Johnson is $23,989.
What is the Median Family Income in Johnson?
Median Family Income in Johnson is $48,856.
What is the Median Household income in Johnson?
Median Household Income in Johnson is $49,016.
What is Income or Wage Gap in Johnson?
Income or Wage Gap in Johnson is 61.7%.
Women in Johnson earn 38.3 cents for every dollar earned by a man.
What is Family Income Deficit in Johnson?
Family Income Deficit in Johnson is $12,630.
Families that are below poverty line in Johnson earn $12,630 less on average than the poverty threshold level.
What is Inequality or Gini Index in Johnson?
Inequality or Gini Index in Johnson is 0.40.
What is the Total Population of Johnson?
Total Population of Johnson is 1,347.
What is the Total Male Population of Johnson?
Total Male Population of Johnson is 589.
What is the Total Female Population of Johnson?
Total Female Population of Johnson is 758.
What is the Ratio of Males per 100 Females in Johnson?
There are 77.70 Males per 100 Females in Johnson.
What is the Ratio of Females per 100 Males in Johnson?
There are 128.69 Females per 100 Males in Johnson.
What is the Median Population Age in Johnson?
Median Population Age in Johnson is 22.1 Years.
What is the Average Family Size in Johnson
Average Family Size in Johnson is 2.7 People.
What is the Average Household Size in Johnson
Average Household Size in Johnson is 2.2 People.
How Large is the Labor Force in Johnson?
There are 783 People in the Labor Forcein in Johnson.
What is the Percentage of People in the Labor Force in Johnson?
73.7% of People are in the Labor Force in Johnson.
What is the Unemployment Rate in Johnson?
Unemployment Rate in Johnson is 10.1%.