Bethel, VT Map & Demographics
Bethel Map
Bethel Overview
$34,148
PER CAPITA INCOME
$54,861
AVG FAMILY INCOME
$63,182
AVG HOUSEHOLD INCOME
13.8%
WAGE / INCOME GAP [ % ]
86.2¢/ $1
WAGE / INCOME GAP [ $ ]
0.36
INEQUALITY / GINI INDEX
666
TOTAL POPULATION
339
MALE POPULATION
327
FEMALE POPULATION
103.67
MALES / 100 FEMALES
96.46
FEMALES / 100 MALES
39.2
MEDIAN AGE
3.4
AVG FAMILY SIZE
2.5
AVG HOUSEHOLD SIZE
389
LABOR FORCE [ PEOPLE ]
74.5%
PERCENT IN LABOR FORCE
6.7%
UNEMPLOYMENT RATE
Bethel Zip Codes
Bethel Area Codes
Income in Bethel
Income Overview in Bethel
Per Capita Income in Bethel is $34,148, while median incomes of families and households are $54,861 and $63,182 respectively.
| Characteristic | Number | Measure |
| Per Capita Income | 666 | $34,148 |
| Median Family Income | 127 | $54,861 |
| Mean Family Income | 127 | $86,785 |
| Median Household Income | 264 | $63,182 |
| Mean Household Income | 264 | $79,145 |
| Income Deficit | 127 | $0 |
| Wage / Income Gap (%) | 666 | 13.79% |
| Wage / Income Gap ($) | 666 | 86.21¢ per $1 |
| Gini / Inequality Index | 666 | 0.36 |
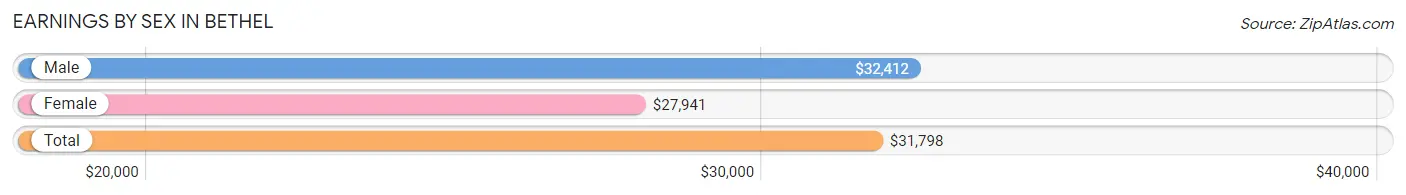
Earnings by Sex in Bethel
Average Earnings in Bethel are $31,798, $32,412 for men and $27,941 for women, a difference of 13.8%.
| Sex | Number | Average Earnings |
| Male | 208 (46.6%) | $32,412 |
| Female | 238 (53.4%) | $27,941 |
| Total | 446 (100.0%) | $31,798 |
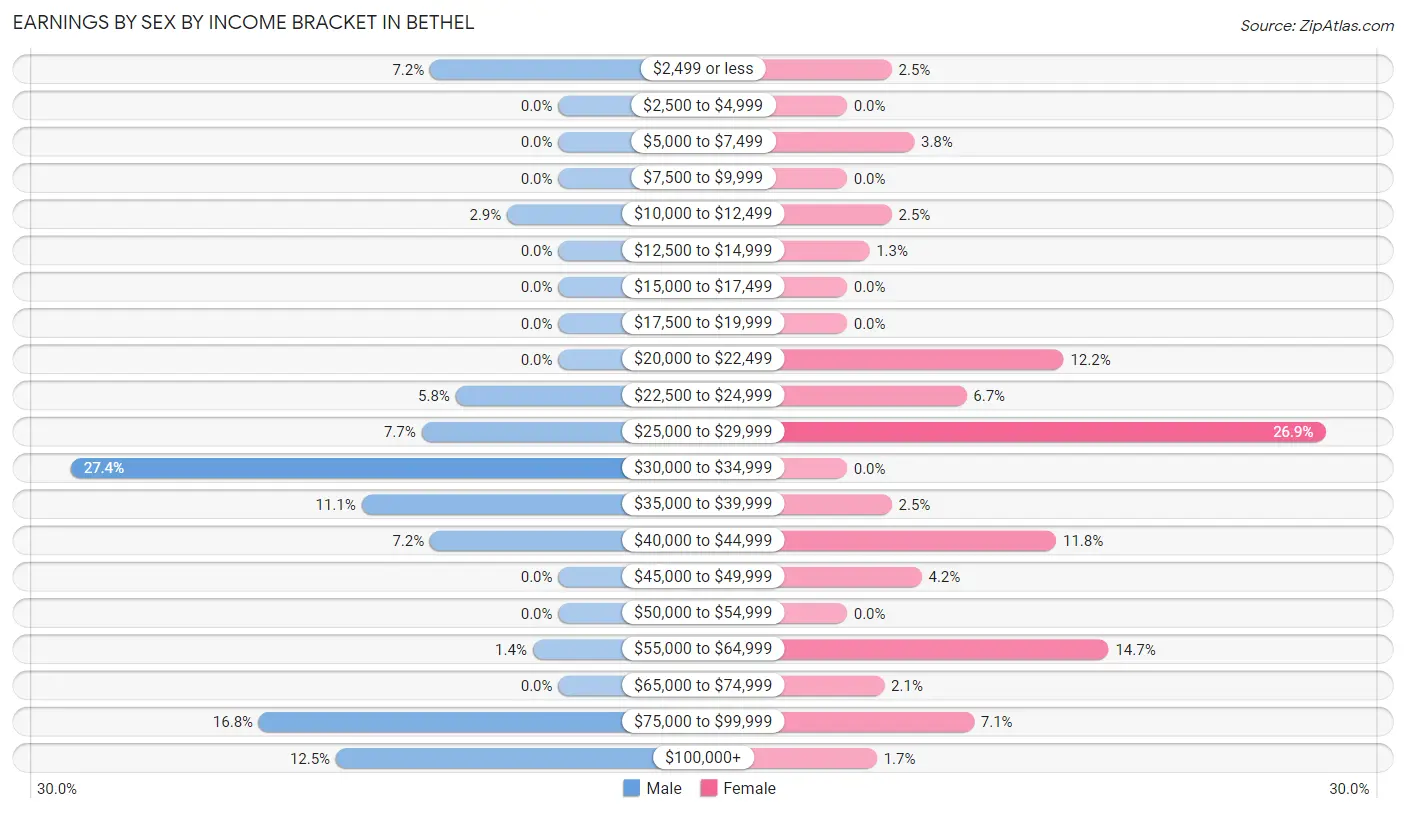
Earnings by Sex by Income Bracket in Bethel
The most common earnings brackets in Bethel are $30,000 to $34,999 for men (57 | 27.4%) and $25,000 to $29,999 for women (64 | 26.9%).
| Income | Male | Female |
| $2,499 or less | 15 (7.2%) | 6 (2.5%) |
| $2,500 to $4,999 | 0 (0.0%) | 0 (0.0%) |
| $5,000 to $7,499 | 0 (0.0%) | 9 (3.8%) |
| $7,500 to $9,999 | 0 (0.0%) | 0 (0.0%) |
| $10,000 to $12,499 | 6 (2.9%) | 6 (2.5%) |
| $12,500 to $14,999 | 0 (0.0%) | 3 (1.3%) |
| $15,000 to $17,499 | 0 (0.0%) | 0 (0.0%) |
| $17,500 to $19,999 | 0 (0.0%) | 0 (0.0%) |
| $20,000 to $22,499 | 0 (0.0%) | 29 (12.2%) |
| $22,500 to $24,999 | 12 (5.8%) | 16 (6.7%) |
| $25,000 to $29,999 | 16 (7.7%) | 64 (26.9%) |
| $30,000 to $34,999 | 57 (27.4%) | 0 (0.0%) |
| $35,000 to $39,999 | 23 (11.1%) | 6 (2.5%) |
| $40,000 to $44,999 | 15 (7.2%) | 28 (11.8%) |
| $45,000 to $49,999 | 0 (0.0%) | 10 (4.2%) |
| $50,000 to $54,999 | 0 (0.0%) | 0 (0.0%) |
| $55,000 to $64,999 | 3 (1.4%) | 35 (14.7%) |
| $65,000 to $74,999 | 0 (0.0%) | 5 (2.1%) |
| $75,000 to $99,999 | 35 (16.8%) | 17 (7.1%) |
| $100,000+ | 26 (12.5%) | 4 (1.7%) |
| Total | 208 (100.0%) | 238 (100.0%) |
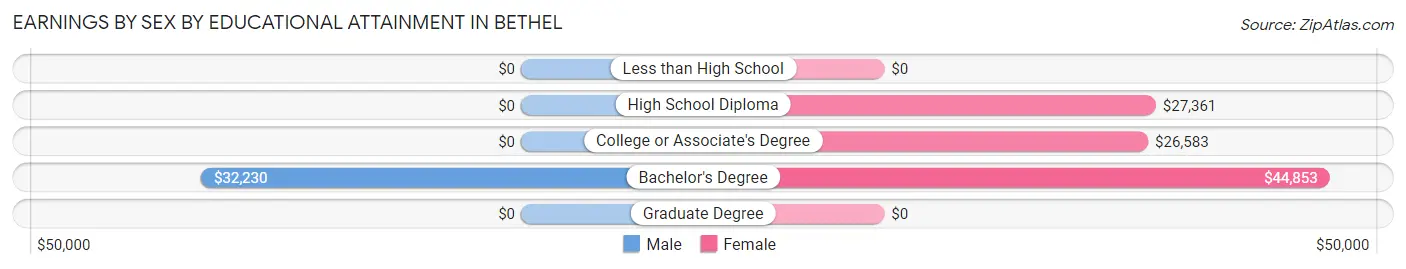
Earnings by Sex by Educational Attainment in Bethel
Average earnings in Bethel are $36,250 for men and $28,971 for women, a difference of 20.1%. Men with an educational attainment of bachelor's degree enjoy the highest average annual earnings of $32,230, while those with bachelor's degree education earn the least with $32,230. Women with an educational attainment of bachelor's degree earn the most with the average annual earnings of $44,853, while those with college or associate's degree education have the smallest earnings of $26,583.
| Educational Attainment | Male Income | Female Income |
| Less than High School | - | - |
| High School Diploma | - | - |
| College or Associate's Degree | - | - |
| Bachelor's Degree | $32,230 | $44,853 |
| Graduate Degree | - | - |
| Total | $36,250 | $28,971 |
Family Income in Bethel
Family Income Brackets in Bethel
According to the Bethel family income data, there are 39 families falling into the $50,000 to $74,999 income range, which is the most common income bracket and makes up 30.7% of all families.
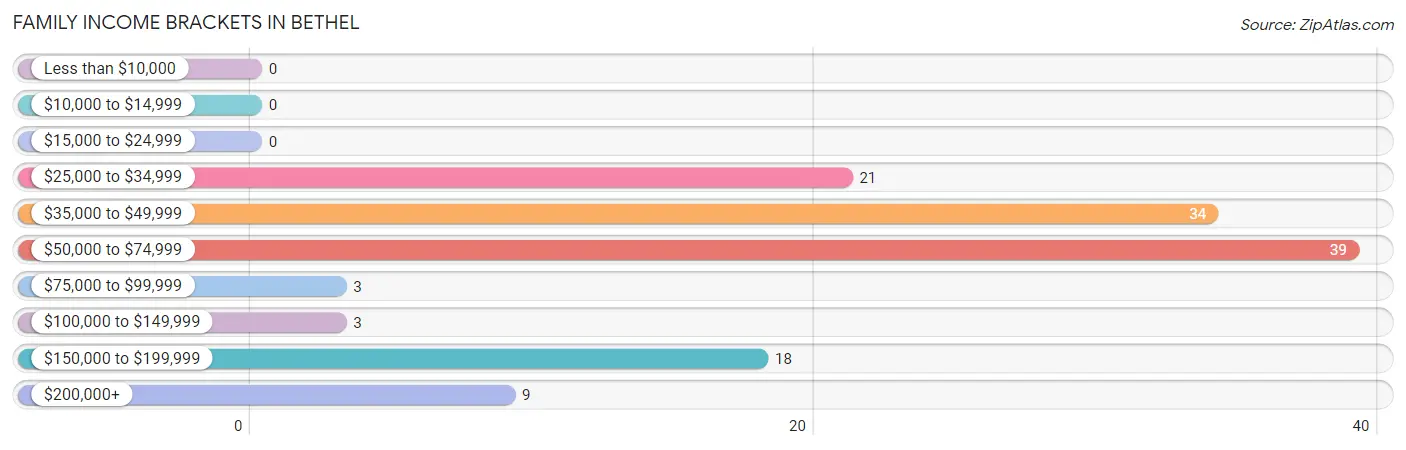
| Income Bracket | # Families | % Families |
| Less than $10,000 | 0 | 0.0% |
| $10,000 to $14,999 | 0 | 0.0% |
| $15,000 to $24,999 | 0 | 0.0% |
| $25,000 to $34,999 | 21 | 16.5% |
| $35,000 to $49,999 | 34 | 26.8% |
| $50,000 to $74,999 | 39 | 30.7% |
| $75,000 to $99,999 | 3 | 2.4% |
| $100,000 to $149,999 | 3 | 2.4% |
| $150,000 to $199,999 | 18 | 14.2% |
| $200,000+ | 9 | 7.1% |
Family Income by Famaliy Size in Bethel
2-person families (73 | 57.5%) account for the highest median family income in Bethel with $53,750 per family, while 2-person families (73 | 57.5%) have the highest median income of $26,875 per family member.
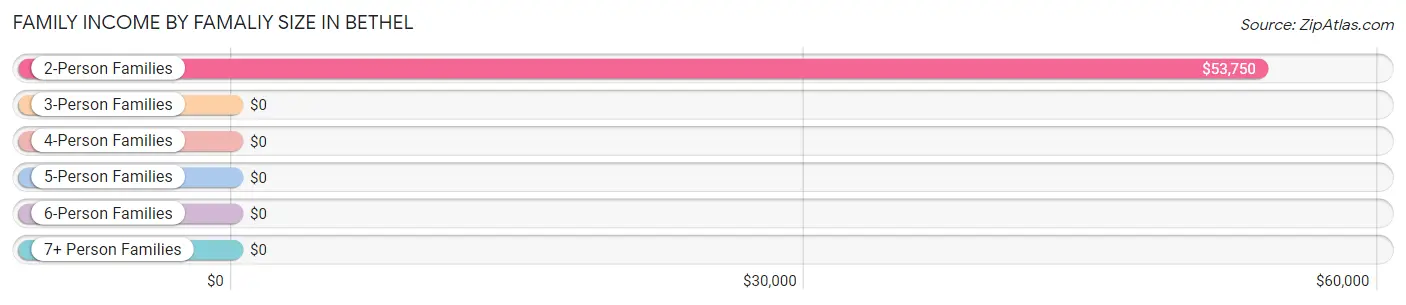
| Income Bracket | # Families | Median Income |
| 2-Person Families | 73 (57.5%) | $53,750 |
| 3-Person Families | 27 (21.3%) | $0 |
| 4-Person Families | 12 (9.5%) | $0 |
| 5-Person Families | 10 (7.9%) | $0 |
| 6-Person Families | 5 (3.9%) | $0 |
| 7+ Person Families | 0 (0.0%) | $0 |
| Total | 127 (100.0%) | $54,861 |
Family Income by Number of Earners in Bethel
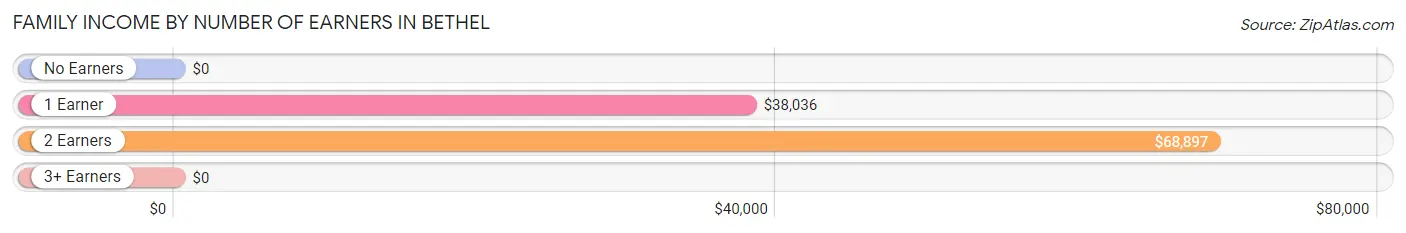
| Number of Earners | # Families | Median Income |
| No Earners | 3 (2.4%) | $0 |
| 1 Earner | 42 (33.1%) | $38,036 |
| 2 Earners | 77 (60.6%) | $68,897 |
| 3+ Earners | 5 (3.9%) | $0 |
| Total | 127 (100.0%) | $54,861 |
Household Income in Bethel
Household Income Brackets in Bethel
With 88 households falling in the category, the $50,000 to $74,999 income range is the most frequent in Bethel, accounting for 33.3% of all households.
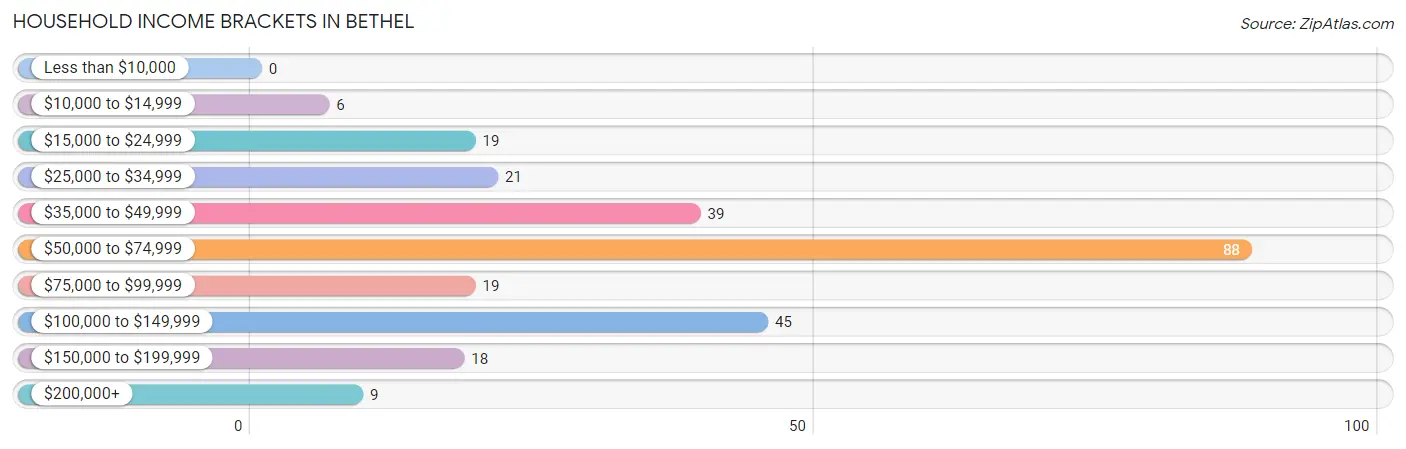
| Income Bracket | # Households | % Households |
| Less than $10,000 | 0 | 0.0% |
| $10,000 to $14,999 | 6 | 2.3% |
| $15,000 to $24,999 | 19 | 7.2% |
| $25,000 to $34,999 | 21 | 8.0% |
| $35,000 to $49,999 | 39 | 14.8% |
| $50,000 to $74,999 | 88 | 33.3% |
| $75,000 to $99,999 | 19 | 7.2% |
| $100,000 to $149,999 | 45 | 17.0% |
| $150,000 to $199,999 | 18 | 6.8% |
| $200,000+ | 9 | 3.4% |
Household Income by Householder Age in Bethel
The median household income in Bethel is $63,182, with the highest median household income of $114,583 found in the 45 to 64 years age bracket for the primary householder. A total of 117 households (44.3%) fall into this category. Meanwhile, the 25 to 44 years age bracket for the primary householder has the lowest median household income of $46,000, with 92 households (34.8%) in this group.
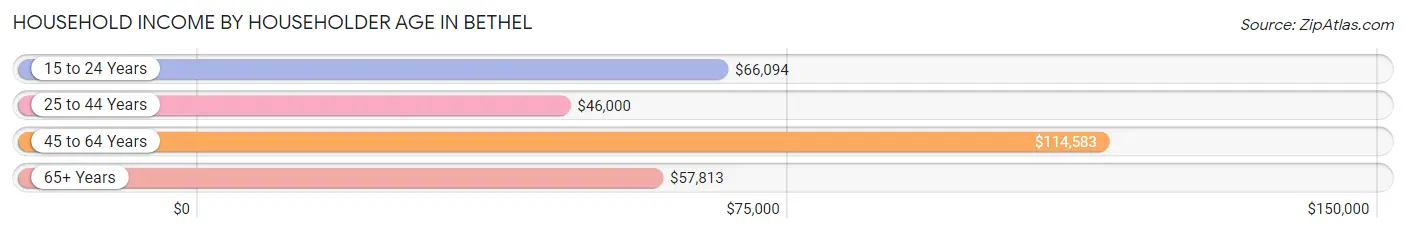
| Income Bracket | # Households | Median Income |
| 15 to 24 Years | 19 (7.2%) | $66,094 |
| 25 to 44 Years | 92 (34.8%) | $46,000 |
| 45 to 64 Years | 117 (44.3%) | $114,583 |
| 65+ Years | 36 (13.6%) | $57,813 |
| Total | 264 (100.0%) | $63,182 |
Poverty in Bethel
Income Below Poverty by Sex and Age in Bethel
With 2.7% poverty level for males and 1.8% for females among the residents of Bethel, 55 to 64 year old males and 25 to 34 year old females are the most vulnerable to poverty, with 3 males (6.8%) and 6 females (6.1%) in their respective age groups living below the poverty level.
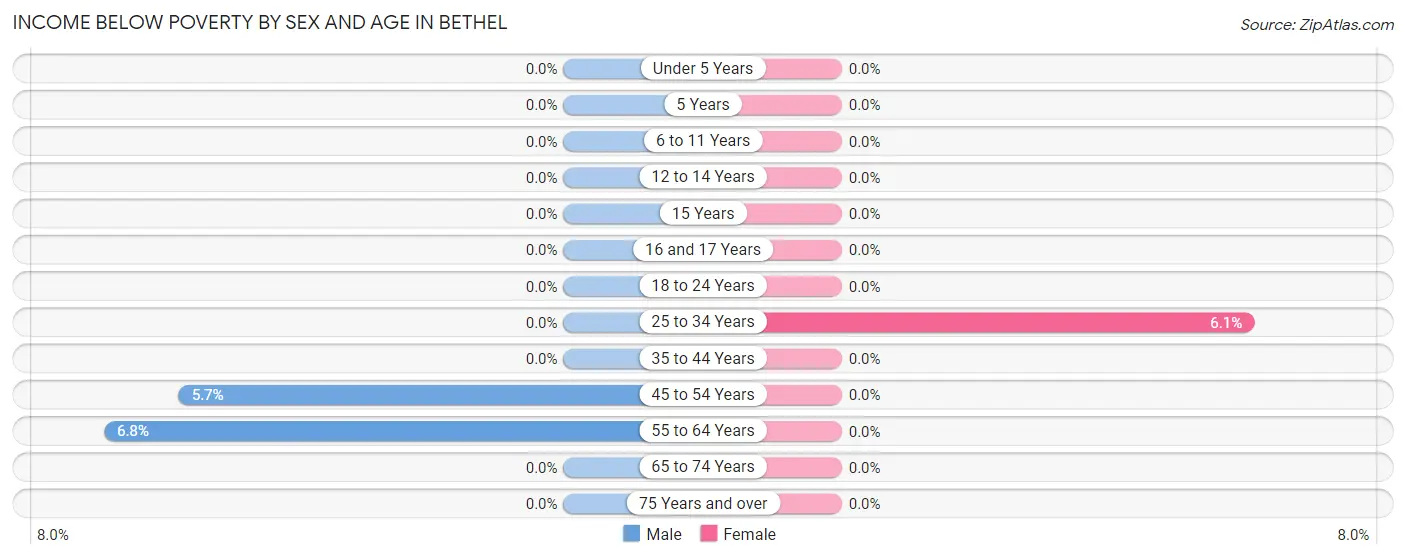
| Age Bracket | Male | Female |
| Under 5 Years | 0 (0.0%) | 0 (0.0%) |
| 5 Years | 0 (0.0%) | 0 (0.0%) |
| 6 to 11 Years | 0 (0.0%) | 0 (0.0%) |
| 12 to 14 Years | 0 (0.0%) | 0 (0.0%) |
| 15 Years | 0 (0.0%) | 0 (0.0%) |
| 16 and 17 Years | 0 (0.0%) | 0 (0.0%) |
| 18 to 24 Years | 0 (0.0%) | 0 (0.0%) |
| 25 to 34 Years | 0 (0.0%) | 6 (6.1%) |
| 35 to 44 Years | 0 (0.0%) | 0 (0.0%) |
| 45 to 54 Years | 6 (5.7%) | 0 (0.0%) |
| 55 to 64 Years | 3 (6.8%) | 0 (0.0%) |
| 65 to 74 Years | 0 (0.0%) | 0 (0.0%) |
| 75 Years and over | 0 (0.0%) | 0 (0.0%) |
| Total | 9 (2.7%) | 6 (1.8%) |
Income Above Poverty by Sex and Age in Bethel
According to the poverty statistics in Bethel, males aged under 5 years and females aged under 5 years are the age groups that are most secure financially, with 100.0% of males and 100.0% of females in these age groups living above the poverty line.
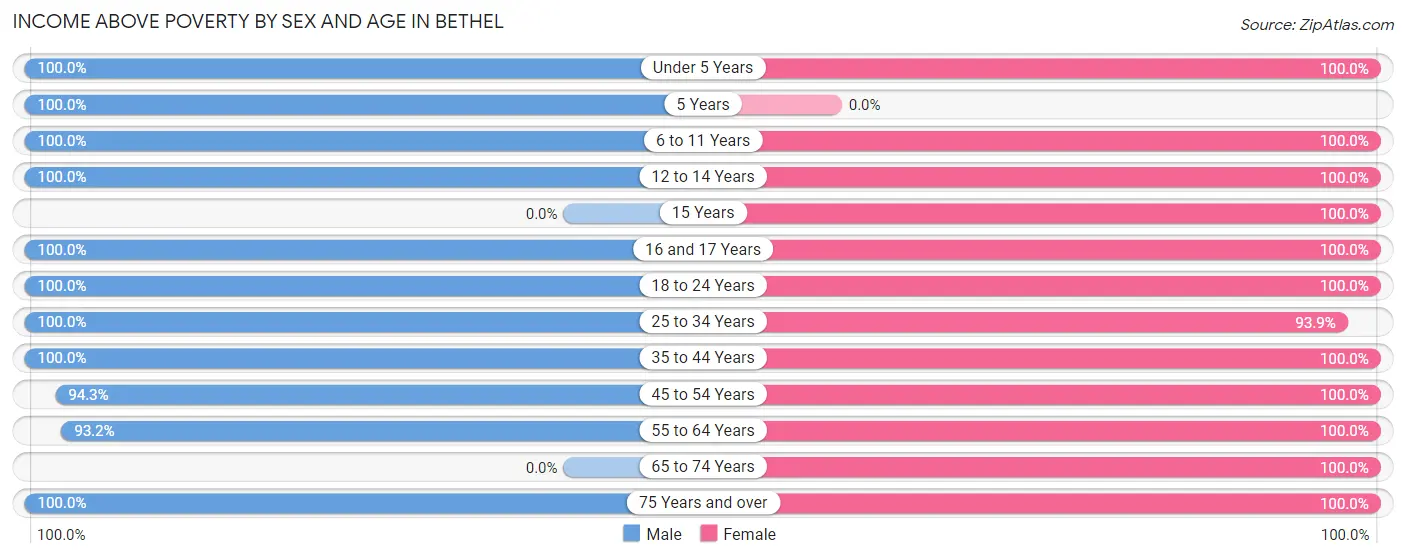
| Age Bracket | Male | Female |
| Under 5 Years | 9 (100.0%) | 6 (100.0%) |
| 5 Years | 14 (100.0%) | 0 (0.0%) |
| 6 to 11 Years | 24 (100.0%) | 22 (100.0%) |
| 12 to 14 Years | 30 (100.0%) | 23 (100.0%) |
| 15 Years | 0 (0.0%) | 7 (100.0%) |
| 16 and 17 Years | 4 (100.0%) | 6 (100.0%) |
| 18 to 24 Years | 23 (100.0%) | 8 (100.0%) |
| 25 to 34 Years | 43 (100.0%) | 92 (93.9%) |
| 35 to 44 Years | 5 (100.0%) | 23 (100.0%) |
| 45 to 54 Years | 99 (94.3%) | 36 (100.0%) |
| 55 to 64 Years | 41 (93.2%) | 48 (100.0%) |
| 65 to 74 Years | 0 (0.0%) | 33 (100.0%) |
| 75 Years and over | 29 (100.0%) | 17 (100.0%) |
| Total | 321 (97.3%) | 321 (98.2%) |
Income Below Poverty Among Married-Couple Families in Bethel
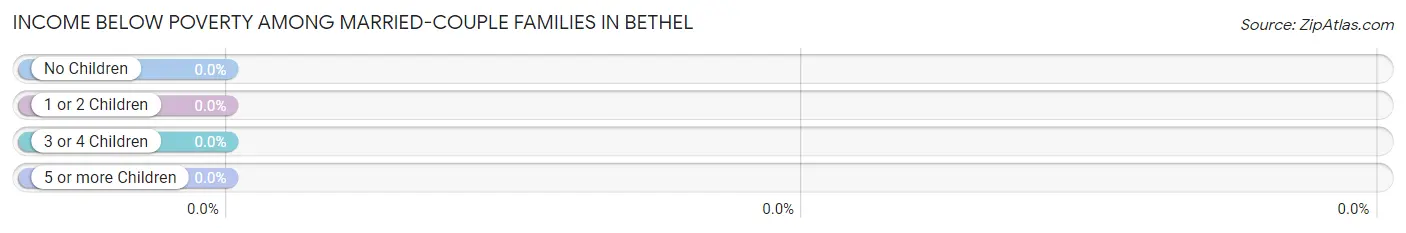
| Children | Above Poverty | Below Poverty |
| No Children | 55 (100.0%) | 0 (0.0%) |
| 1 or 2 Children | 3 (100.0%) | 0 (0.0%) |
| 3 or 4 Children | 10 (100.0%) | 0 (0.0%) |
| 5 or more Children | 0 (0.0%) | 0 (0.0%) |
| Total | 68 (100.0%) | 0 (0.0%) |
Income Below Poverty Among Single-Parent Households in Bethel
| Children | Single Father | Single Mother |
| No Children | 0 (0.0%) | 0 (0.0%) |
| 1 or 2 Children | 0 (0.0%) | 0 (0.0%) |
| 3 or 4 Children | 0 (0.0%) | 0 (0.0%) |
| 5 or more Children | 0 (0.0%) | 0 (0.0%) |
| Total | 0 (0.0%) | 0 (0.0%) |
Income Below Poverty Among Married-Couple vs Single-Parent Households in Bethel
| Children | Married-Couple Families | Single-Parent Households |
| No Children | 0 (0.0%) | 0 (0.0%) |
| 1 or 2 Children | 0 (0.0%) | 0 (0.0%) |
| 3 or 4 Children | 0 (0.0%) | 0 (0.0%) |
| 5 or more Children | 0 (0.0%) | 0 (0.0%) |
| Total | 0 (0.0%) | 0 (0.0%) |
Race in Bethel
The most populous races in Bethel are White / Caucasian (656 | 98.5%), and Asian (10 | 1.5%).
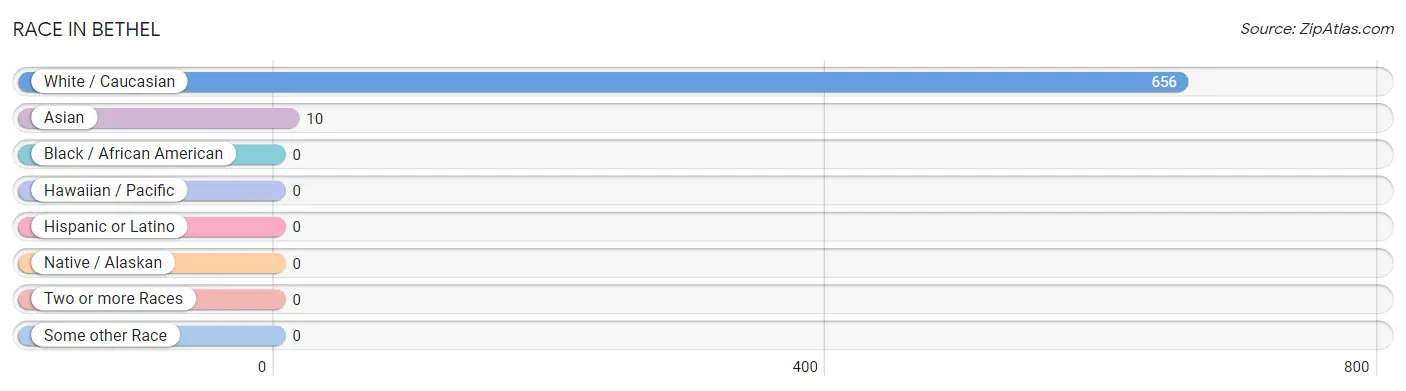
| Race | # Population | % Population |
| Asian | 10 | 1.5% |
| Black / African American | 0 | 0.0% |
| Hawaiian / Pacific | 0 | 0.0% |
| Hispanic or Latino | 0 | 0.0% |
| Native / Alaskan | 0 | 0.0% |
| White / Caucasian | 656 | 98.5% |
| Two or more Races | 0 | 0.0% |
| Some other Race | 0 | 0.0% |
| Total | 666 | 100.0% |
Ancestry in Bethel
The most populous ancestries reported in Bethel are English (135 | 20.3%), American (75 | 11.3%), French (73 | 11.0%), French Canadian (72 | 10.8%), and Irish (36 | 5.4%), together accounting for 58.7% of all Bethel residents.
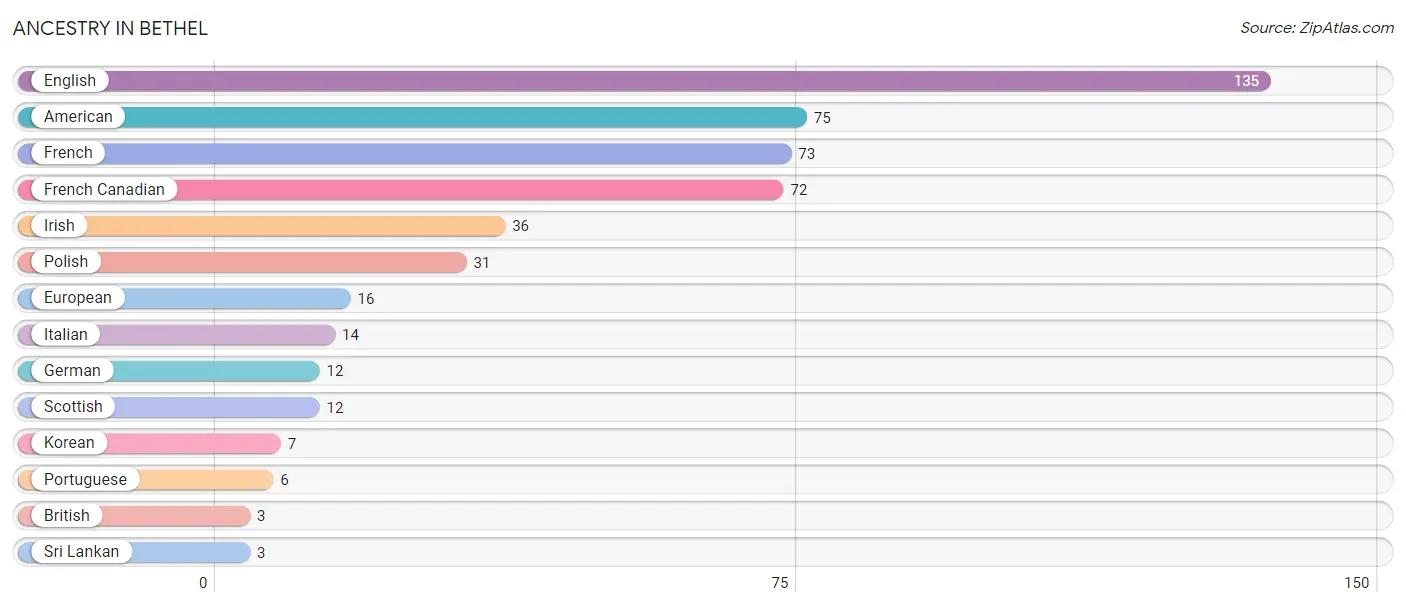
| Ancestry | # Population | % Population |
| American | 75 | 11.3% |
| British | 3 | 0.4% |
| English | 135 | 20.3% |
| European | 16 | 2.4% |
| French | 73 | 11.0% |
| French Canadian | 72 | 10.8% |
| German | 12 | 1.8% |
| Irish | 36 | 5.4% |
| Italian | 14 | 2.1% |
| Korean | 7 | 1.1% |
| Polish | 31 | 4.6% |
| Portuguese | 6 | 0.9% |
| Scottish | 12 | 1.8% |
| Sri Lankan | 3 | 0.4% | View All 14 Rows |
Immigrants in Bethel
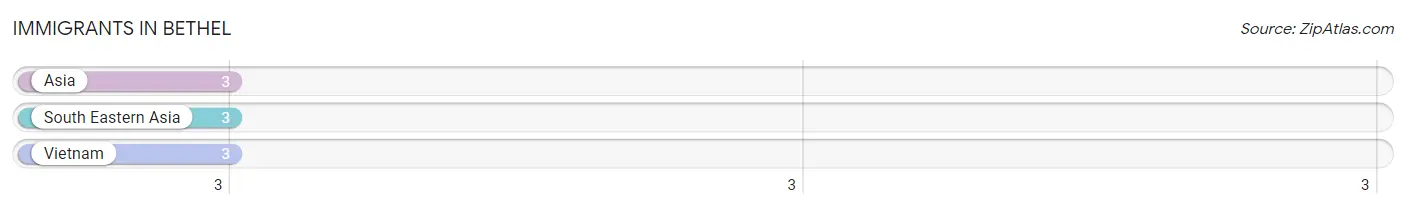
The most numerous immigrant groups reported in Bethel came from Asia (3 | 0.4%), South Eastern Asia (3 | 0.4%), and Vietnam (3 | 0.4%), together accounting for 1.3% of all Bethel residents.
| Immigration Origin | # Population | % Population |
| Asia | 3 | 0.4% |
| South Eastern Asia | 3 | 0.4% |
| Vietnam | 3 | 0.4% | View All 3 Rows |
Sex and Age in Bethel
Sex and Age in Bethel
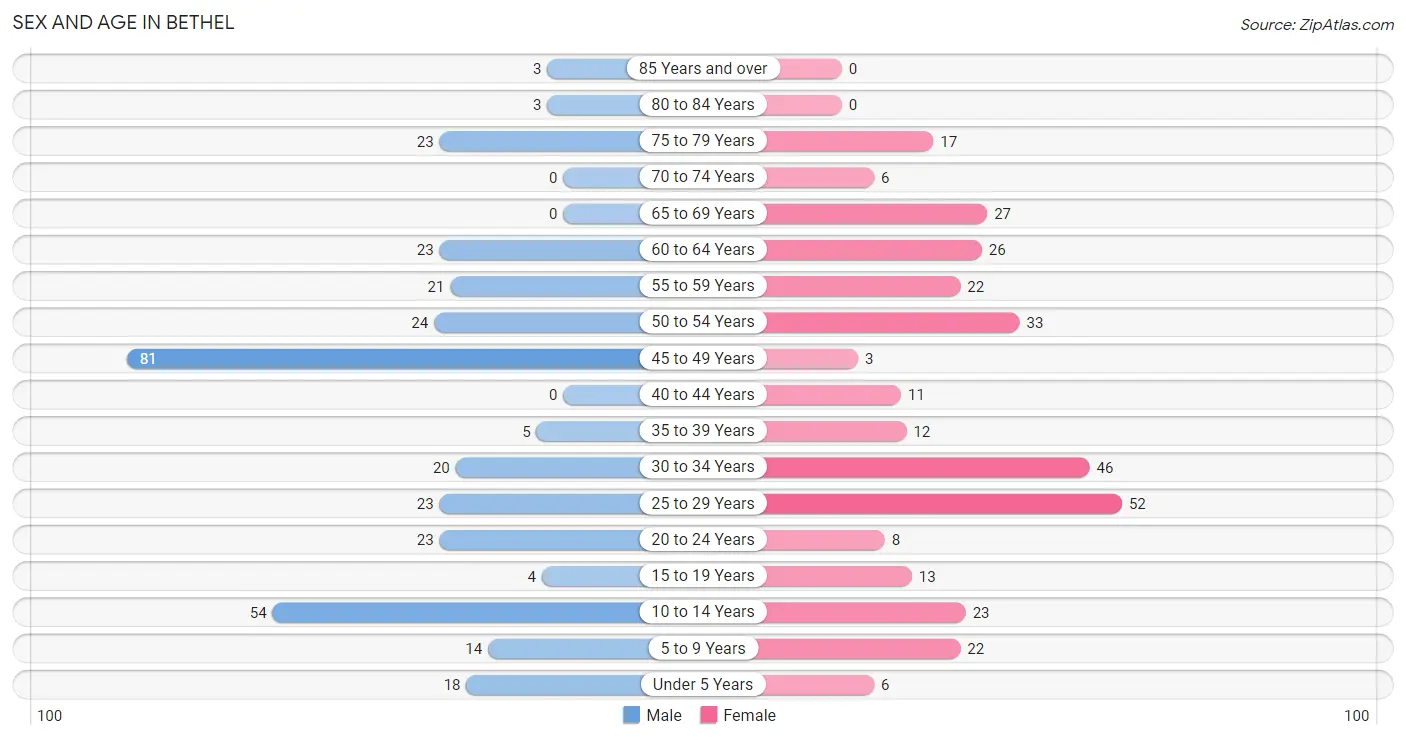
The most populous age groups in Bethel are 45 to 49 Years (81 | 23.9%) for men and 25 to 29 Years (52 | 15.9%) for women.
| Age Bracket | Male | Female |
| Under 5 Years | 18 (5.3%) | 6 (1.8%) |
| 5 to 9 Years | 14 (4.1%) | 22 (6.7%) |
| 10 to 14 Years | 54 (15.9%) | 23 (7.0%) |
| 15 to 19 Years | 4 (1.2%) | 13 (4.0%) |
| 20 to 24 Years | 23 (6.8%) | 8 (2.5%) |
| 25 to 29 Years | 23 (6.8%) | 52 (15.9%) |
| 30 to 34 Years | 20 (5.9%) | 46 (14.1%) |
| 35 to 39 Years | 5 (1.5%) | 12 (3.7%) |
| 40 to 44 Years | 0 (0.0%) | 11 (3.4%) |
| 45 to 49 Years | 81 (23.9%) | 3 (0.9%) |
| 50 to 54 Years | 24 (7.1%) | 33 (10.1%) |
| 55 to 59 Years | 21 (6.2%) | 22 (6.7%) |
| 60 to 64 Years | 23 (6.8%) | 26 (8.0%) |
| 65 to 69 Years | 0 (0.0%) | 27 (8.3%) |
| 70 to 74 Years | 0 (0.0%) | 6 (1.8%) |
| 75 to 79 Years | 23 (6.8%) | 17 (5.2%) |
| 80 to 84 Years | 3 (0.9%) | 0 (0.0%) |
| 85 Years and over | 3 (0.9%) | 0 (0.0%) |
| Total | 339 (100.0%) | 327 (100.0%) |
Families and Households in Bethel
Median Family Size in Bethel
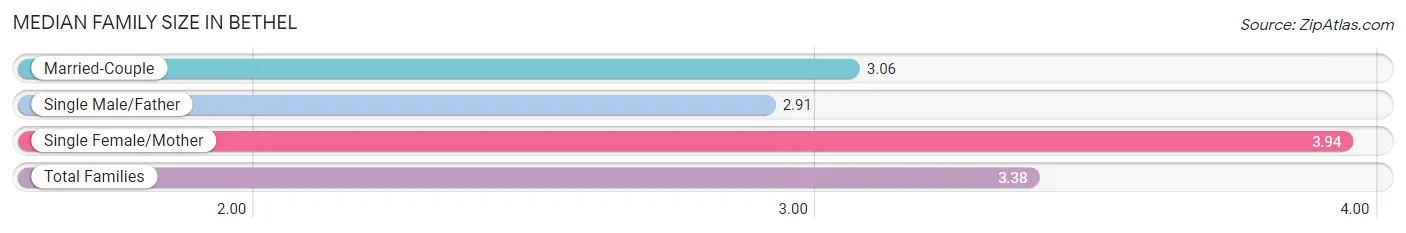
The median family size in Bethel is 3.38 persons per family, with single female/mother families (48 | 37.8%) accounting for the largest median family size of 3.94 persons per family. On the other hand, single male/father families (11 | 8.7%) represent the smallest median family size with 2.91 persons per family.
| Family Type | # Families | Family Size |
| Married-Couple | 68 (53.5%) | 3.06 |
| Single Male/Father | 11 (8.7%) | 2.91 |
| Single Female/Mother | 48 (37.8%) | 3.94 |
| Total Families | 127 (100.0%) | 3.38 |
Median Household Size in Bethel
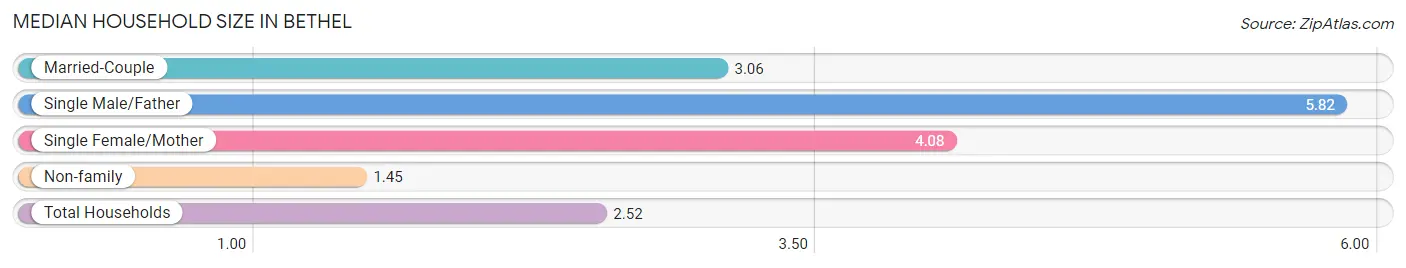
The median household size in Bethel is 2.52 persons per household, with single male/father households (11 | 4.2%) accounting for the largest median household size of 5.82 persons per household. non-family households (137 | 51.9%) represent the smallest median household size with 1.45 persons per household.
| Household Type | # Households | Household Size |
| Married-Couple | 68 (25.8%) | 3.06 |
| Single Male/Father | 11 (4.2%) | 5.82 |
| Single Female/Mother | 48 (18.2%) | 4.08 |
| Non-family | 137 (51.9%) | 1.45 |
| Total Households | 264 (100.0%) | 2.52 |
Household Size by Marriage Status in Bethel
Out of a total of 264 households in Bethel, 127 (48.1%) are family households, while 137 (51.9%) are nonfamily households. The most numerous type of family households are 2-person households, comprising 59, and the most common type of nonfamily households are 1-person households, comprising 96.
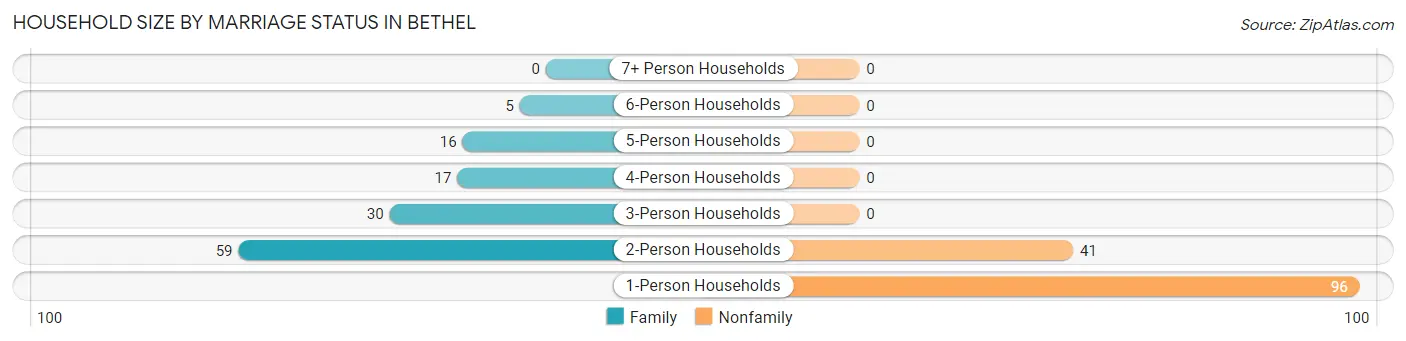
| Household Size | Family Households | Nonfamily Households |
| 1-Person Households | - | 96 (36.4%) |
| 2-Person Households | 59 (22.4%) | 41 (15.5%) |
| 3-Person Households | 30 (11.4%) | 0 (0.0%) |
| 4-Person Households | 17 (6.4%) | 0 (0.0%) |
| 5-Person Households | 16 (6.1%) | 0 (0.0%) |
| 6-Person Households | 5 (1.9%) | 0 (0.0%) |
| 7+ Person Households | 0 (0.0%) | 0 (0.0%) |
| Total | 127 (48.1%) | 137 (51.9%) |
Female Fertility in Bethel
Fertility by Age in Bethel
Average fertility rate in Bethel is 34.0 births per 1,000 women. Women in the age bracket of 20 to 34 years have the highest fertility rate with 47.0 births per 1,000 women. Women in the age bracket of 20 to 34 years acount for 100.0% of all women with births.
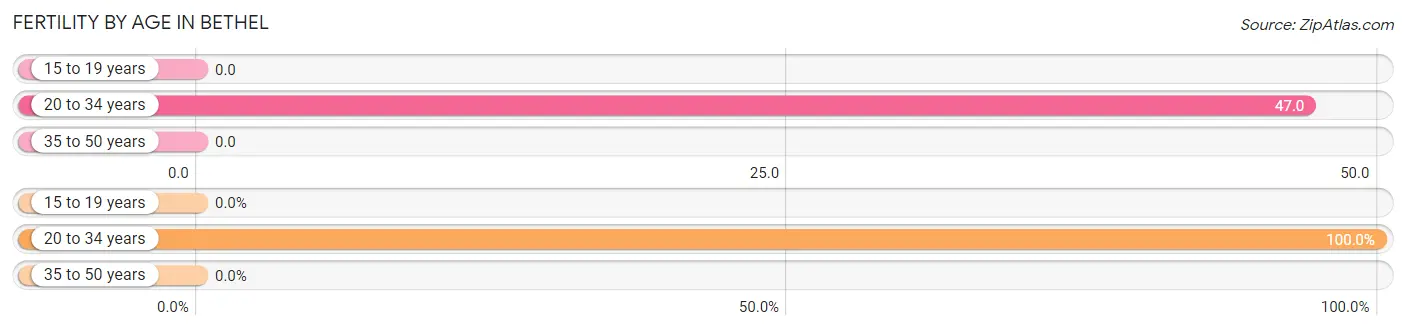
| Age Bracket | Women with Births | Births / 1,000 Women |
| 15 to 19 years | 0 (0.0%) | 0.0 |
| 20 to 34 years | 5 (100.0%) | 47.0 |
| 35 to 50 years | 0 (0.0%) | 0.0 |
| Total | 5 (100.0%) | 34.0 |
Fertility by Age by Marriage Status in Bethel
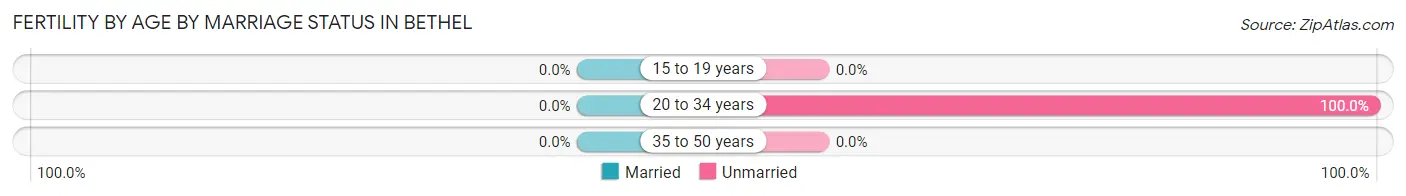
| Age Bracket | Married | Unmarried |
| 15 to 19 years | 0 (0.0%) | 0 (0.0%) |
| 20 to 34 years | 0 (0.0%) | 5 (100.0%) |
| 35 to 50 years | 0 (0.0%) | 0 (0.0%) |
| Total | 0 (0.0%) | 5 (100.0%) |
Fertility by Education in Bethel
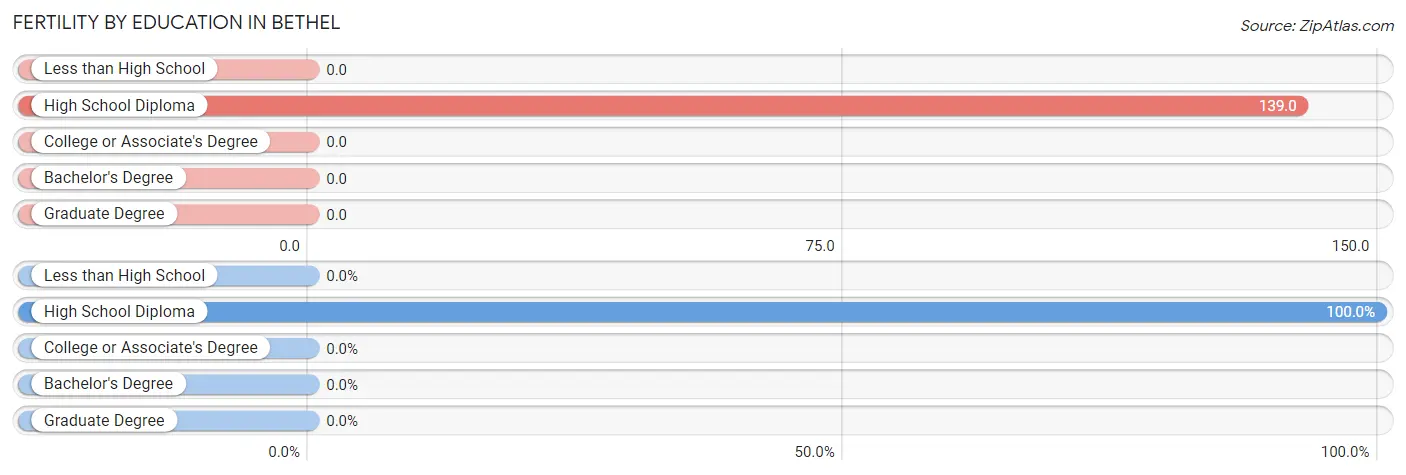
| Educational Attainment | Women with Births | Births / 1,000 Women |
| Less than High School | 0 (0.0%) | 0.0 |
| High School Diploma | 5 (100.0%) | 139.0 |
| College or Associate's Degree | 0 (0.0%) | 0.0 |
| Bachelor's Degree | 0 (0.0%) | 0.0 |
| Graduate Degree | 0 (0.0%) | 0.0 |
| Total | 5 (100.0%) | 34.0 |
Fertility by Education by Marriage Status in Bethel
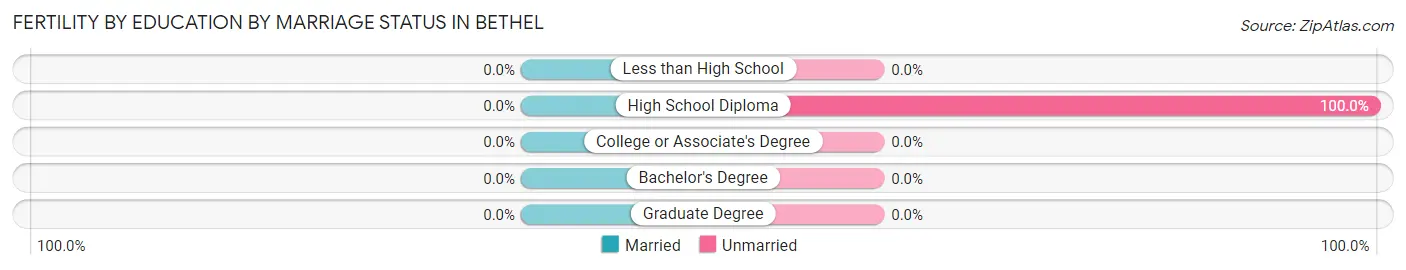
| Educational Attainment | Married | Unmarried |
| Less than High School | 0 (0.0%) | 0 (0.0%) |
| High School Diploma | 0 (0.0%) | 5 (100.0%) |
| College or Associate's Degree | 0 (0.0%) | 0 (0.0%) |
| Bachelor's Degree | 0 (0.0%) | 0 (0.0%) |
| Graduate Degree | 0 (0.0%) | 0 (0.0%) |
| Total | 0 (0.0%) | 5 (100.0%) |
Employment Characteristics in Bethel
Employment by Class of Employer in Bethel
Among the 357 employed individuals in Bethel, private company employees (153 | 42.9%), not-for-profit organizations (76 | 21.3%), and self-employed (not incorporated) (65 | 18.2%) make up the most common classes of employment.
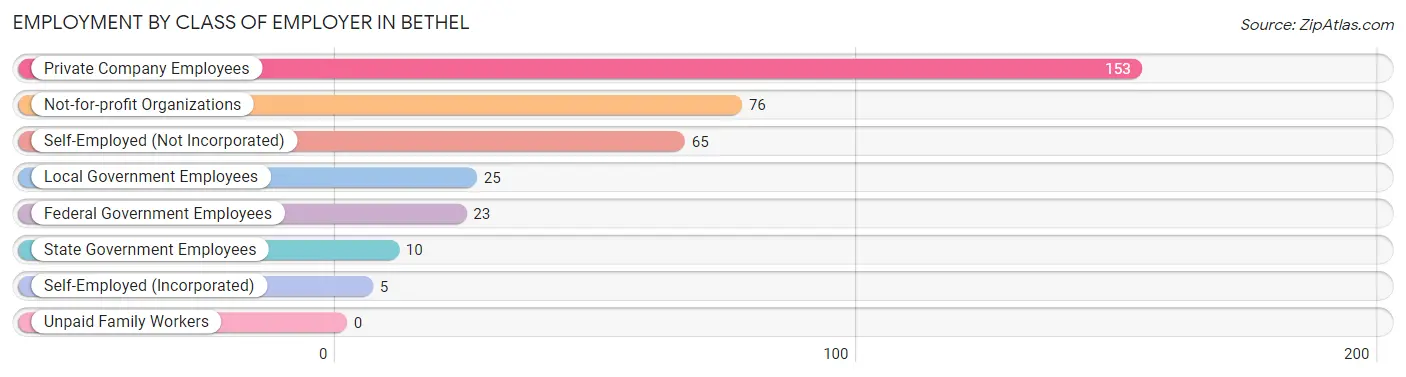
| Employer Class | # Employees | % Employees |
| Private Company Employees | 153 | 42.9% |
| Self-Employed (Incorporated) | 5 | 1.4% |
| Self-Employed (Not Incorporated) | 65 | 18.2% |
| Not-for-profit Organizations | 76 | 21.3% |
| Local Government Employees | 25 | 7.0% |
| State Government Employees | 10 | 2.8% |
| Federal Government Employees | 23 | 6.4% |
| Unpaid Family Workers | 0 | 0.0% |
| Total | 357 | 100.0% |
Employment Status by Age in Bethel
According to the labor force statistics for Bethel, out of the total population over 16 years of age (522), 74.5% or 389 individuals are in the labor force, with 6.7% or 26 of them unemployed. The age group with the highest labor force participation rate is 20 to 24 years, with 100.0% or 31 individuals in the labor force. Within the labor force, the 35 to 44 years age range has the highest percentage of unemployed individuals, with 52.2% or 12 of them being unemployed.
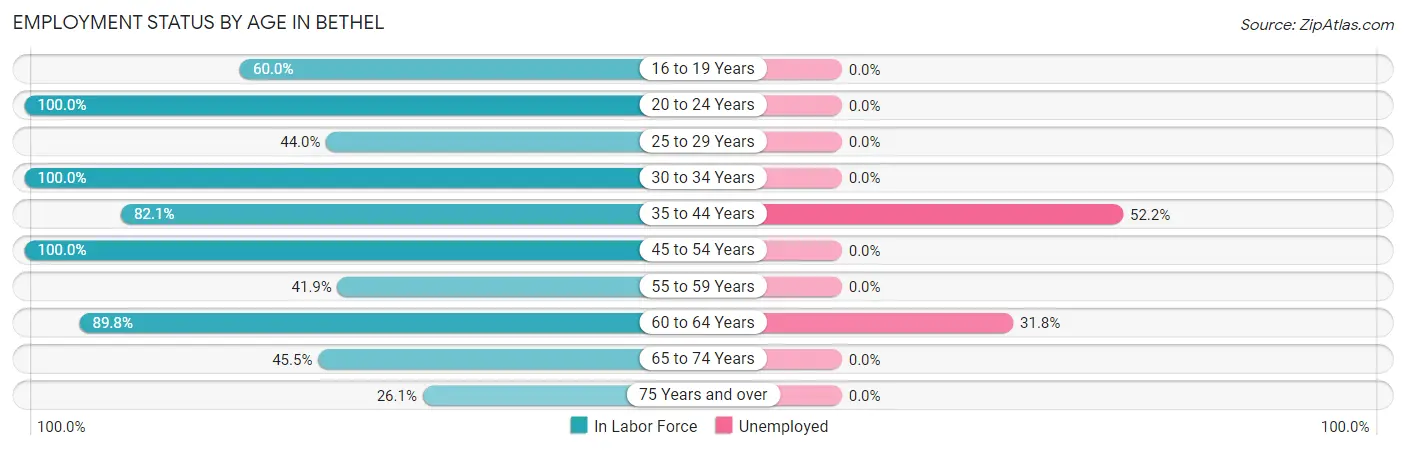
| Age Bracket | In Labor Force | Unemployed |
| 16 to 19 Years | 6 (60.0%) | 0 (0.0%) |
| 20 to 24 Years | 31 (100.0%) | 0 (0.0%) |
| 25 to 29 Years | 33 (44.0%) | 0 (0.0%) |
| 30 to 34 Years | 66 (100.0%) | 0 (0.0%) |
| 35 to 44 Years | 23 (82.1%) | 12 (52.2%) |
| 45 to 54 Years | 141 (100.0%) | 0 (0.0%) |
| 55 to 59 Years | 18 (41.9%) | 0 (0.0%) |
| 60 to 64 Years | 44 (89.8%) | 14 (31.8%) |
| 65 to 74 Years | 15 (45.5%) | 0 (0.0%) |
| 75 Years and over | 12 (26.1%) | 0 (0.0%) |
| Total | 389 (74.5%) | 26 (6.7%) |
Employment Status by Educational Attainment in Bethel
According to labor force statistics for Bethel, 80.8% of individuals (325) out of the total population between 25 and 64 years of age (402) are in the labor force, with 8.0% or 26 of them being unemployed. The group with the highest labor force participation rate are those with the educational attainment of less than high school, with 100.0% or 6 individuals in the labor force. Within the labor force, individuals with high school diploma education have the highest percentage of unemployment, with 29.1% or 23 of them being unemployed.

| Educational Attainment | In Labor Force | Unemployed |
| Less than High School | 6 (100.0%) | 0 (0.0%) |
| High School Diploma | 79 (90.8%) | 25 (29.1%) |
| College / Associate Degree | 115 (62.5%) | 5 (2.6%) |
| Bachelor's Degree or higher | 125 (100.0%) | 0 (0.0%) |
| Total | 325 (80.8%) | 32 (8.0%) |
Employment Occupations by Sex in Bethel
Management, Business, Science and Arts Occupations
The most common Management, Business, Science and Arts occupations in Bethel are Management (102 | 28.1%), Health Diagnosing & Treating (47 | 13.0%), Community & Social Service (40 | 11.0%), Arts, Media & Entertainment (19 | 5.2%), and Computers, Engineering & Science (18 | 5.0%).
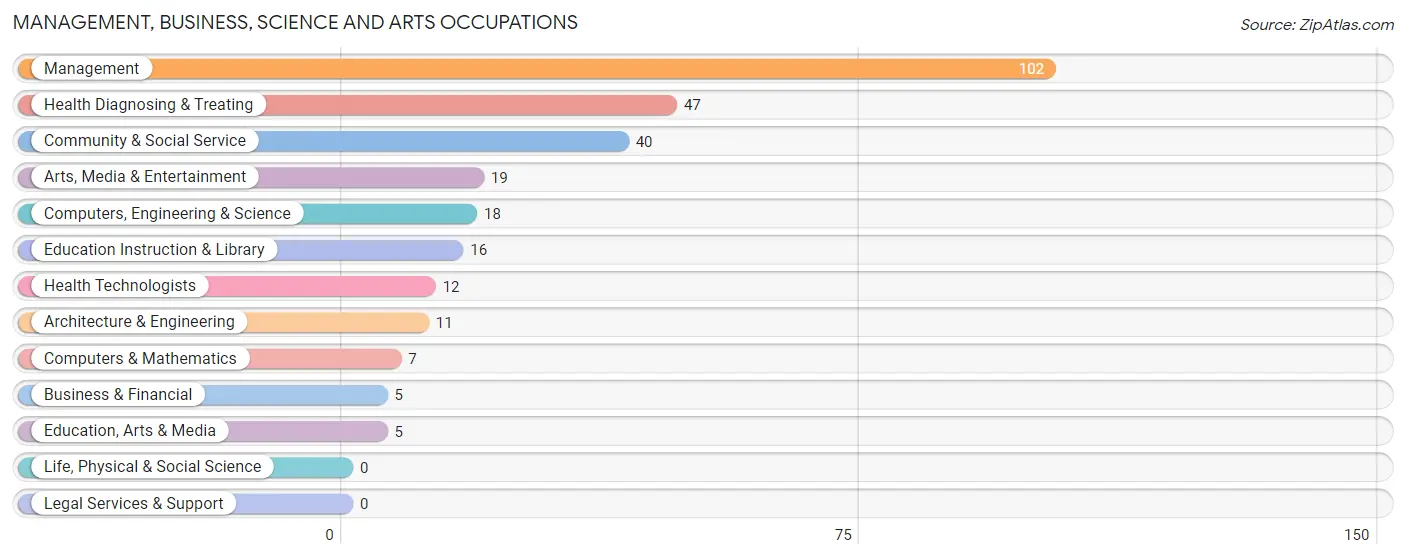
Management, Business, Science and Arts Occupations by Sex
Within the Management, Business, Science and Arts occupations in Bethel, the most male-oriented occupations are Management (96.1%), Architecture & Engineering (45.5%), and Health Technologists (33.3%), while the most female-oriented occupations are Business & Financial (100.0%), Computers & Mathematics (100.0%), and Community & Social Service (100.0%).
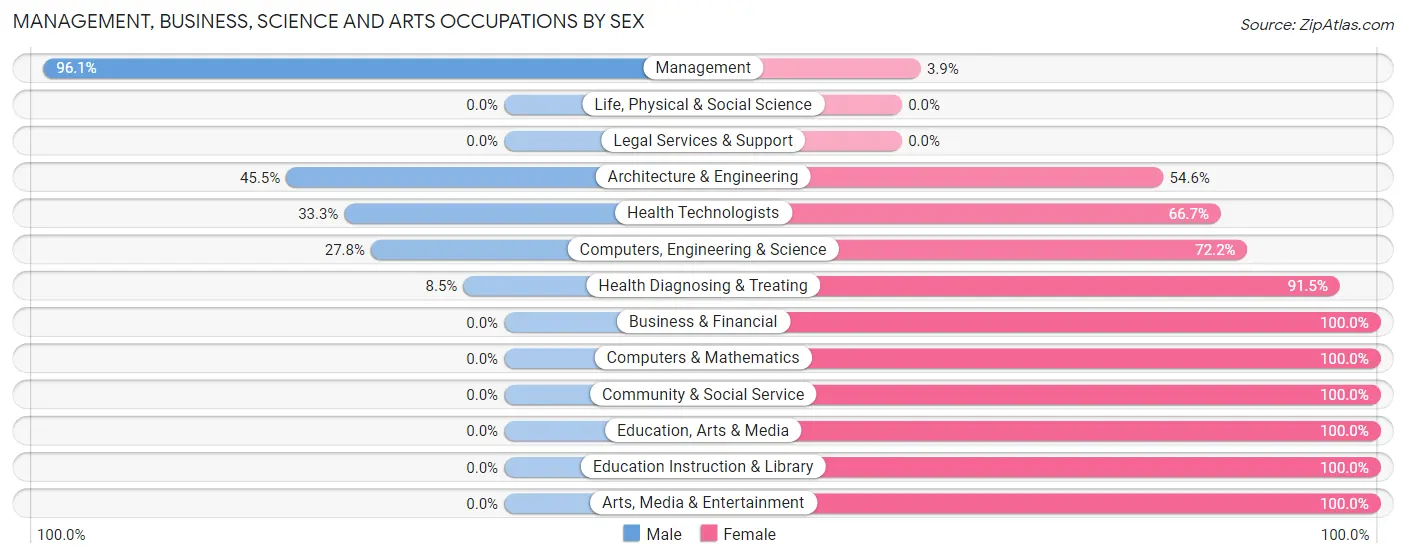
| Occupation | Male | Female |
| Management | 98 (96.1%) | 4 (3.9%) |
| Business & Financial | 0 (0.0%) | 5 (100.0%) |
| Computers, Engineering & Science | 5 (27.8%) | 13 (72.2%) |
| Computers & Mathematics | 0 (0.0%) | 7 (100.0%) |
| Architecture & Engineering | 5 (45.5%) | 6 (54.5%) |
| Life, Physical & Social Science | 0 (0.0%) | 0 (0.0%) |
| Community & Social Service | 0 (0.0%) | 40 (100.0%) |
| Education, Arts & Media | 0 (0.0%) | 5 (100.0%) |
| Legal Services & Support | 0 (0.0%) | 0 (0.0%) |
| Education Instruction & Library | 0 (0.0%) | 16 (100.0%) |
| Arts, Media & Entertainment | 0 (0.0%) | 19 (100.0%) |
| Health Diagnosing & Treating | 4 (8.5%) | 43 (91.5%) |
| Health Technologists | 4 (33.3%) | 8 (66.7%) |
| Total (Category) | 107 (50.5%) | 105 (49.5%) |
| Total (Overall) | 180 (49.6%) | 183 (50.4%) |
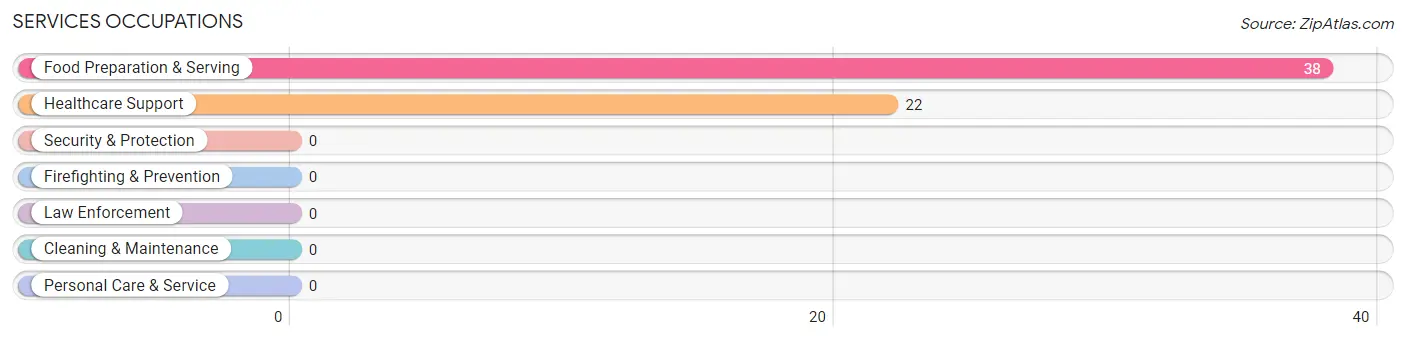
Services Occupations
The most common Services occupations in Bethel are Food Preparation & Serving (38 | 10.5%), and Healthcare Support (22 | 6.1%).
Services Occupations by Sex
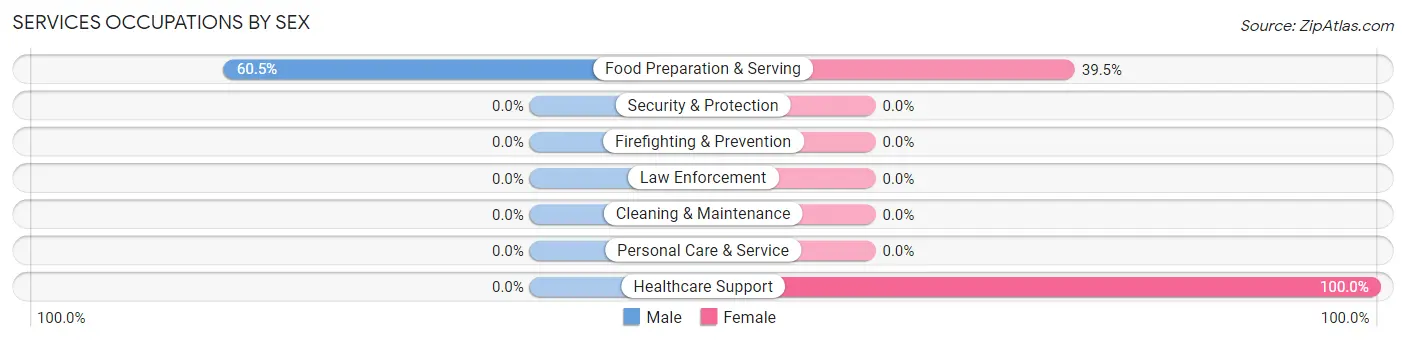
| Occupation | Male | Female |
| Healthcare Support | 0 (0.0%) | 22 (100.0%) |
| Security & Protection | 0 (0.0%) | 0 (0.0%) |
| Firefighting & Prevention | 0 (0.0%) | 0 (0.0%) |
| Law Enforcement | 0 (0.0%) | 0 (0.0%) |
| Food Preparation & Serving | 23 (60.5%) | 15 (39.5%) |
| Cleaning & Maintenance | 0 (0.0%) | 0 (0.0%) |
| Personal Care & Service | 0 (0.0%) | 0 (0.0%) |
| Total (Category) | 23 (38.3%) | 37 (61.7%) |
| Total (Overall) | 180 (49.6%) | 183 (50.4%) |
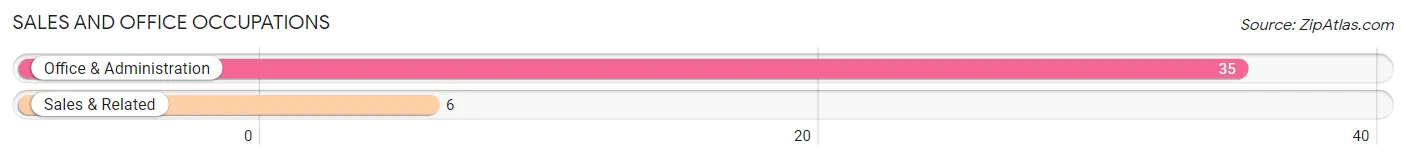
Sales and Office Occupations
The most common Sales and Office occupations in Bethel are Office & Administration (35 | 9.6%), and Sales & Related (6 | 1.7%).
Sales and Office Occupations by Sex
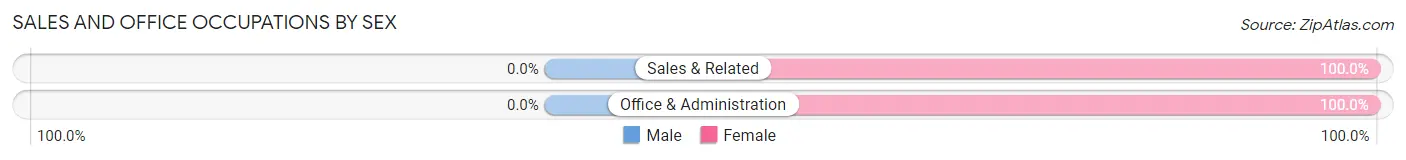
| Occupation | Male | Female |
| Sales & Related | 0 (0.0%) | 6 (100.0%) |
| Office & Administration | 0 (0.0%) | 35 (100.0%) |
| Total (Category) | 0 (0.0%) | 41 (100.0%) |
| Total (Overall) | 180 (49.6%) | 183 (50.4%) |
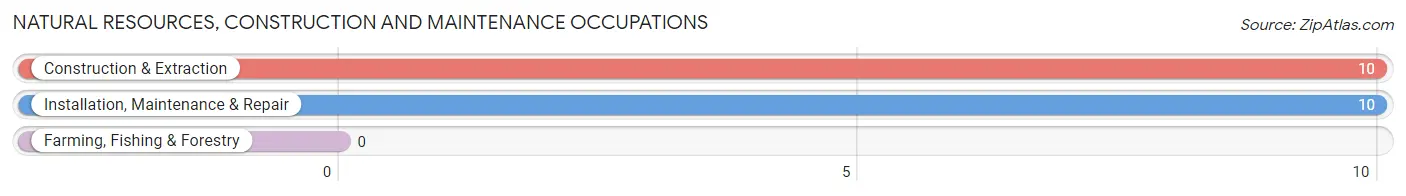
Natural Resources, Construction and Maintenance Occupations
The most common Natural Resources, Construction and Maintenance occupations in Bethel are Construction & Extraction (10 | 2.8%), and Installation, Maintenance & Repair (10 | 2.8%).
Natural Resources, Construction and Maintenance Occupations by Sex
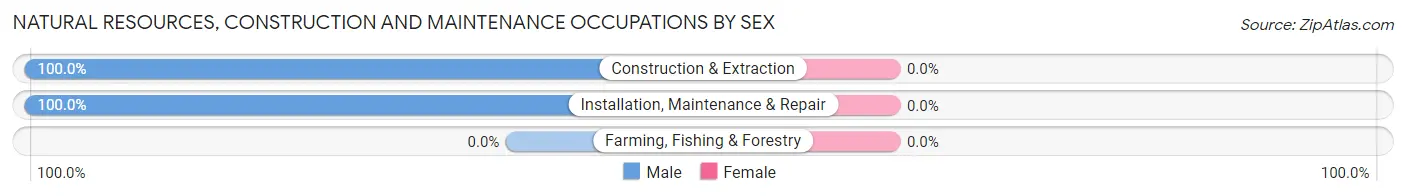
| Occupation | Male | Female |
| Farming, Fishing & Forestry | 0 (0.0%) | 0 (0.0%) |
| Construction & Extraction | 10 (100.0%) | 0 (0.0%) |
| Installation, Maintenance & Repair | 10 (100.0%) | 0 (0.0%) |
| Total (Category) | 20 (100.0%) | 0 (0.0%) |
| Total (Overall) | 180 (49.6%) | 183 (50.4%) |
Production, Transportation and Moving Occupations
The most common Production, Transportation and Moving occupations in Bethel are Production (24 | 6.6%), and Transportation (6 | 1.7%).
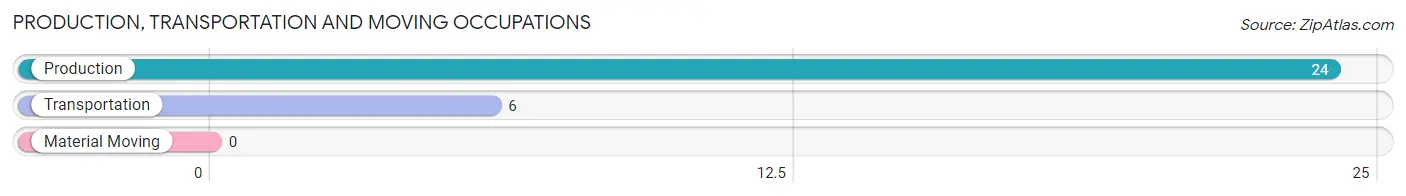
Production, Transportation and Moving Occupations by Sex
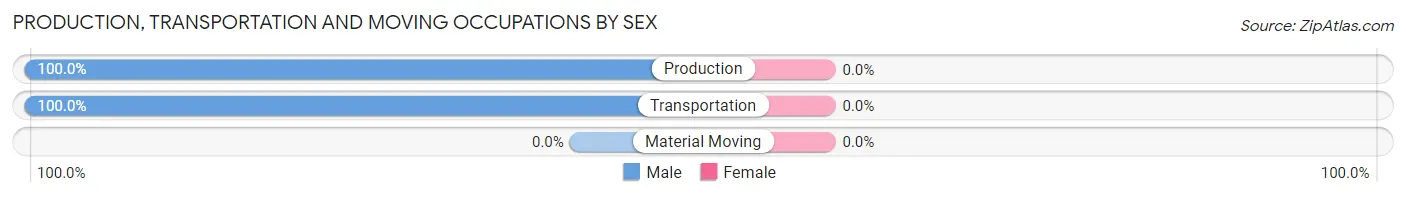
| Occupation | Male | Female |
| Production | 24 (100.0%) | 0 (0.0%) |
| Transportation | 6 (100.0%) | 0 (0.0%) |
| Material Moving | 0 (0.0%) | 0 (0.0%) |
| Total (Category) | 30 (100.0%) | 0 (0.0%) |
| Total (Overall) | 180 (49.6%) | 183 (50.4%) |
Employment Industries by Sex in Bethel
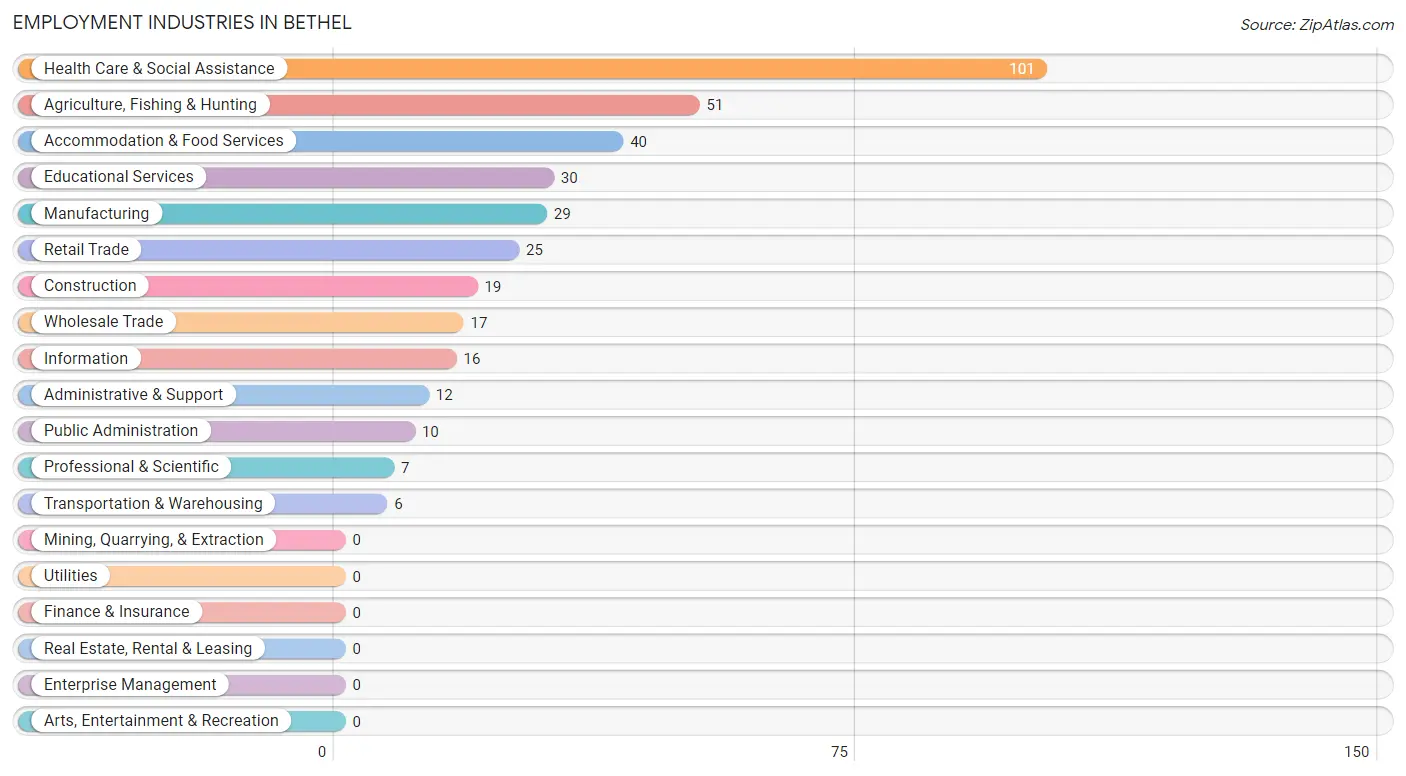
Employment Industries in Bethel
The major employment industries in Bethel include Health Care & Social Assistance (101 | 27.8%), Agriculture, Fishing & Hunting (51 | 14.1%), Accommodation & Food Services (40 | 11.0%), Educational Services (30 | 8.3%), and Manufacturing (29 | 8.0%).
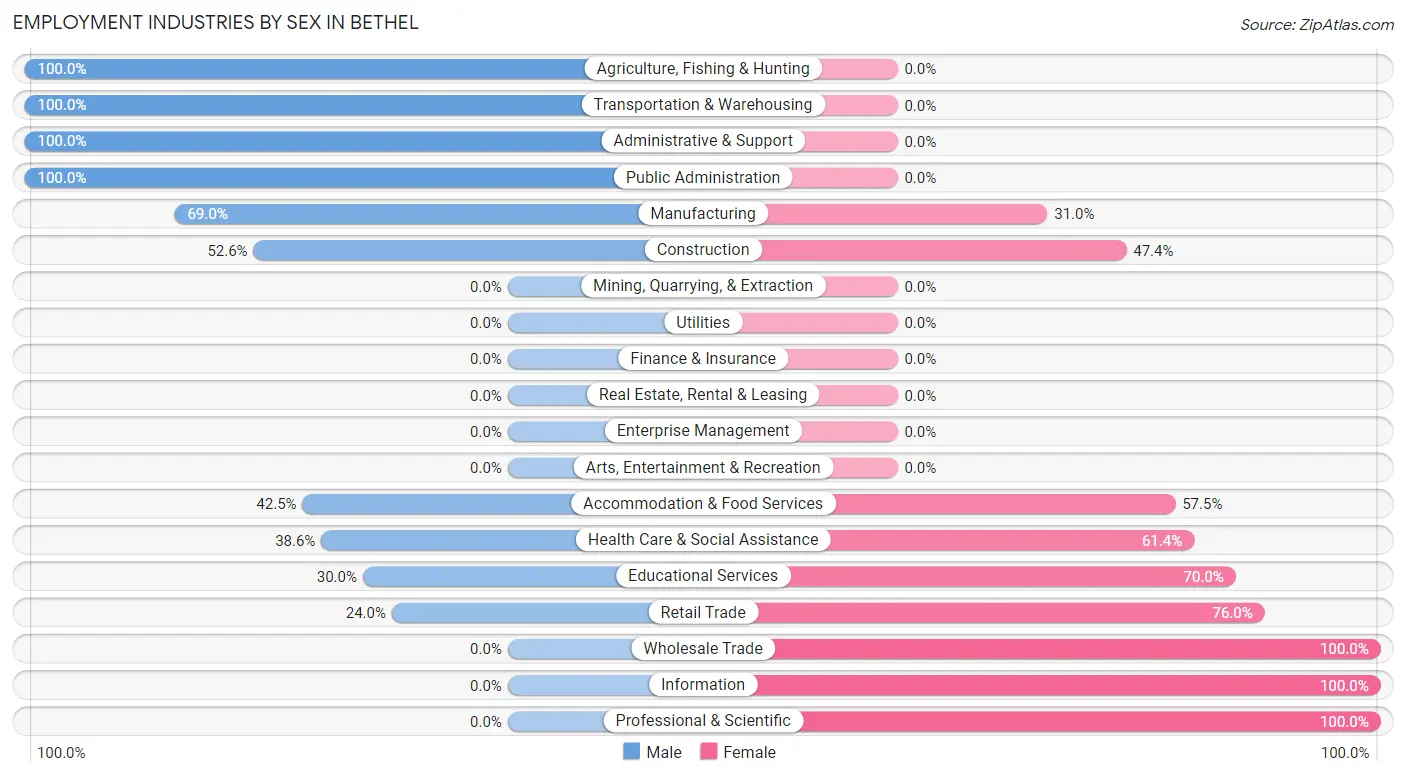
Employment Industries by Sex in Bethel
The Bethel industries that see more men than women are Agriculture, Fishing & Hunting (100.0%), Transportation & Warehousing (100.0%), and Administrative & Support (100.0%), whereas the industries that tend to have a higher number of women are Wholesale Trade (100.0%), Information (100.0%), and Professional & Scientific (100.0%).
| Industry | Male | Female |
| Agriculture, Fishing & Hunting | 51 (100.0%) | 0 (0.0%) |
| Mining, Quarrying, & Extraction | 0 (0.0%) | 0 (0.0%) |
| Construction | 10 (52.6%) | 9 (47.4%) |
| Manufacturing | 20 (69.0%) | 9 (31.0%) |
| Wholesale Trade | 0 (0.0%) | 17 (100.0%) |
| Retail Trade | 6 (24.0%) | 19 (76.0%) |
| Transportation & Warehousing | 6 (100.0%) | 0 (0.0%) |
| Utilities | 0 (0.0%) | 0 (0.0%) |
| Information | 0 (0.0%) | 16 (100.0%) |
| Finance & Insurance | 0 (0.0%) | 0 (0.0%) |
| Real Estate, Rental & Leasing | 0 (0.0%) | 0 (0.0%) |
| Professional & Scientific | 0 (0.0%) | 7 (100.0%) |
| Enterprise Management | 0 (0.0%) | 0 (0.0%) |
| Administrative & Support | 12 (100.0%) | 0 (0.0%) |
| Educational Services | 9 (30.0%) | 21 (70.0%) |
| Health Care & Social Assistance | 39 (38.6%) | 62 (61.4%) |
| Arts, Entertainment & Recreation | 0 (0.0%) | 0 (0.0%) |
| Accommodation & Food Services | 17 (42.5%) | 23 (57.5%) |
| Public Administration | 10 (100.0%) | 0 (0.0%) |
| Total | 180 (49.6%) | 183 (50.4%) |
Education in Bethel
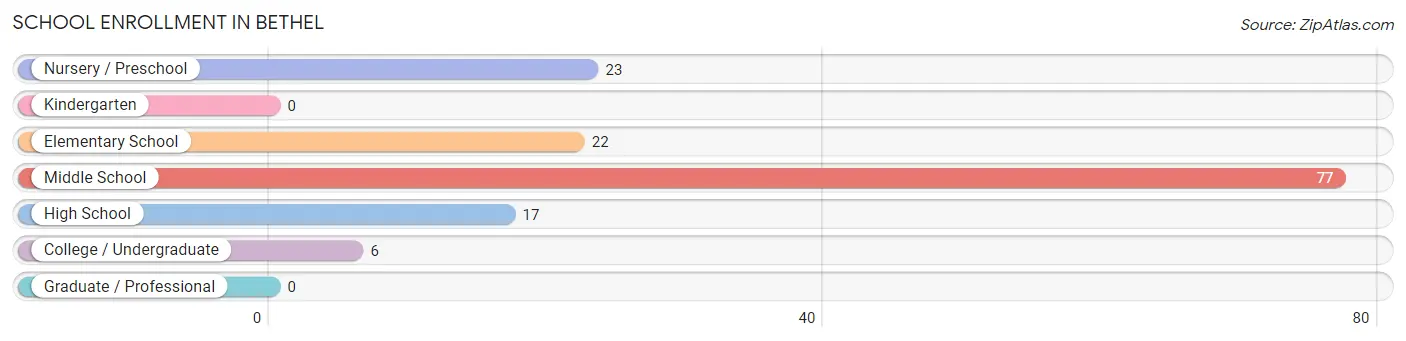
School Enrollment in Bethel
The most common levels of schooling among the 145 students in Bethel are middle school (77 | 53.1%), nursery / preschool (23 | 15.9%), and elementary school (22 | 15.2%).
| School Level | # Students | % Students |
| Nursery / Preschool | 23 | 15.9% |
| Kindergarten | 0 | 0.0% |
| Elementary School | 22 | 15.2% |
| Middle School | 77 | 53.1% |
| High School | 17 | 11.7% |
| College / Undergraduate | 6 | 4.1% |
| Graduate / Professional | 0 | 0.0% |
| Total | 145 | 100.0% |
School Enrollment by Age by Funding Source in Bethel
Out of a total of 145 students who are enrolled in schools in Bethel, 33 (22.8%) attend a private institution, while the remaining 112 (77.2%) are enrolled in public schools. The age group of 3 to 4 year olds has the highest likelihood of being enrolled in private schools, with 9 (100.0% in the age bracket) enrolled. Conversely, the age group of 10 to 14 year olds has the lowest likelihood of being enrolled in a private school, with 70 (90.9% in the age bracket) attending a public institution.
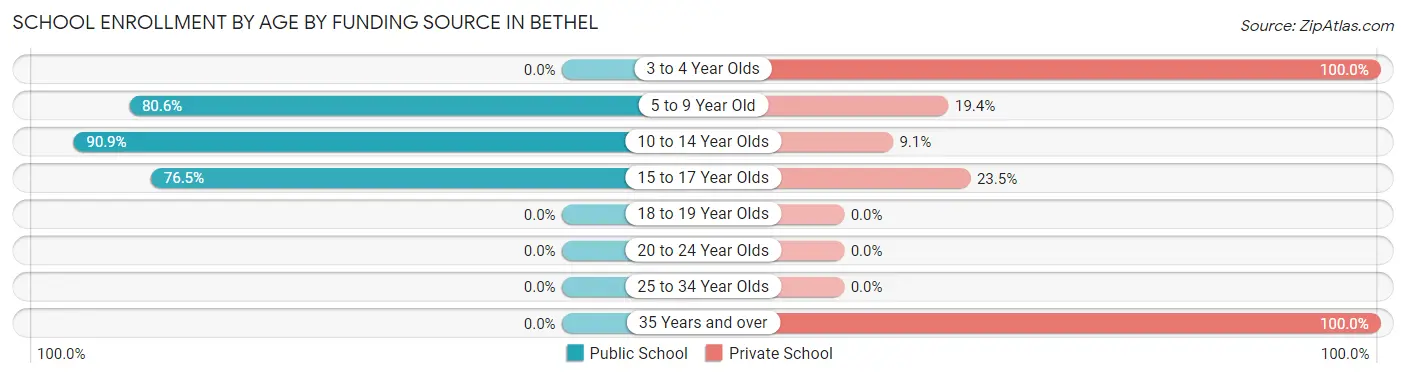
| Age Bracket | Public School | Private School |
| 3 to 4 Year Olds | 0 (0.0%) | 9 (100.0%) |
| 5 to 9 Year Old | 29 (80.6%) | 7 (19.4%) |
| 10 to 14 Year Olds | 70 (90.9%) | 7 (9.1%) |
| 15 to 17 Year Olds | 13 (76.5%) | 4 (23.5%) |
| 18 to 19 Year Olds | 0 (0.0%) | 0 (0.0%) |
| 20 to 24 Year Olds | 0 (0.0%) | 0 (0.0%) |
| 25 to 34 Year Olds | 0 (0.0%) | 0 (0.0%) |
| 35 Years and over | 0 (0.0%) | 6 (100.0%) |
| Total | 112 (77.2%) | 33 (22.8%) |
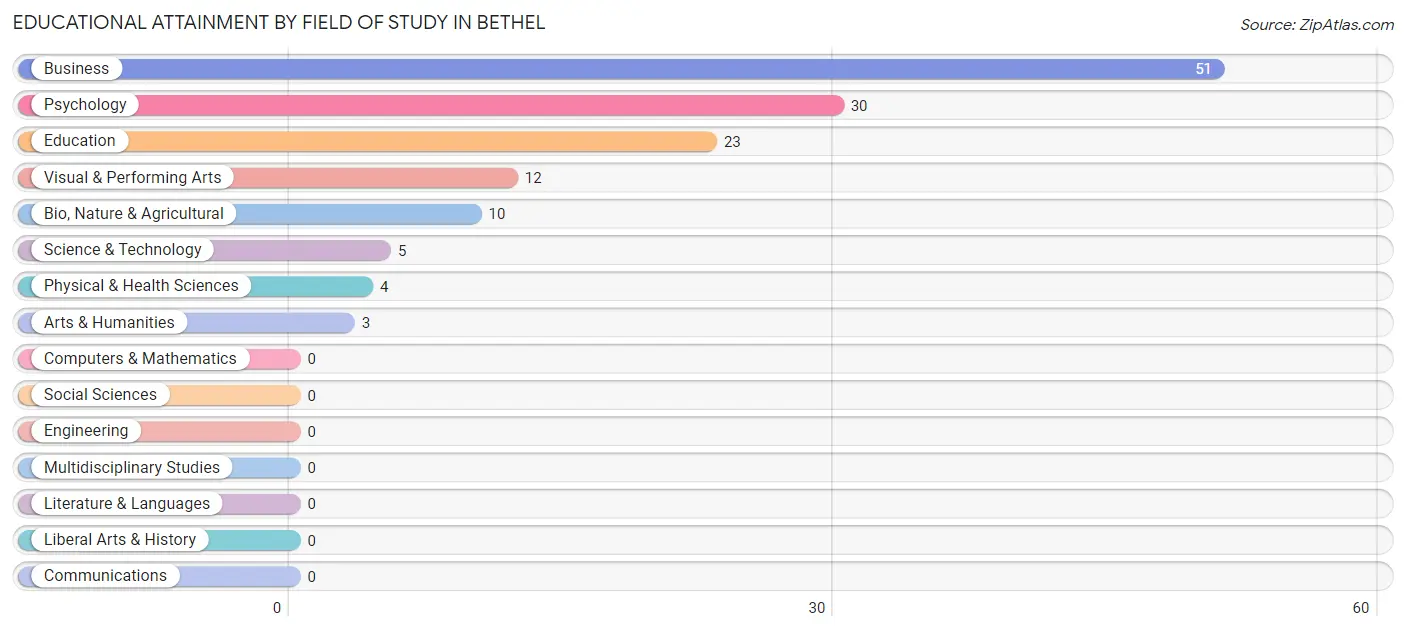
Educational Attainment by Field of Study in Bethel
Business (51 | 37.0%), psychology (30 | 21.7%), education (23 | 16.7%), visual & performing arts (12 | 8.7%), and bio, nature & agricultural (10 | 7.2%) are the most common fields of study among 138 individuals in Bethel who have obtained a bachelor's degree or higher.
| Field of Study | # Graduates | % Graduates |
| Computers & Mathematics | 0 | 0.0% |
| Bio, Nature & Agricultural | 10 | 7.2% |
| Physical & Health Sciences | 4 | 2.9% |
| Psychology | 30 | 21.7% |
| Social Sciences | 0 | 0.0% |
| Engineering | 0 | 0.0% |
| Multidisciplinary Studies | 0 | 0.0% |
| Science & Technology | 5 | 3.6% |
| Business | 51 | 37.0% |
| Education | 23 | 16.7% |
| Literature & Languages | 0 | 0.0% |
| Liberal Arts & History | 0 | 0.0% |
| Visual & Performing Arts | 12 | 8.7% |
| Communications | 0 | 0.0% |
| Arts & Humanities | 3 | 2.2% |
| Total | 138 | 100.0% |
Transportation & Commute in Bethel
Vehicle Availability by Sex in Bethel
The most prevalent vehicle ownership categories in Bethel are males with 2 vehicles (134, accounting for 77.0%) and females with 2 vehicles (72, making up 73.2%).
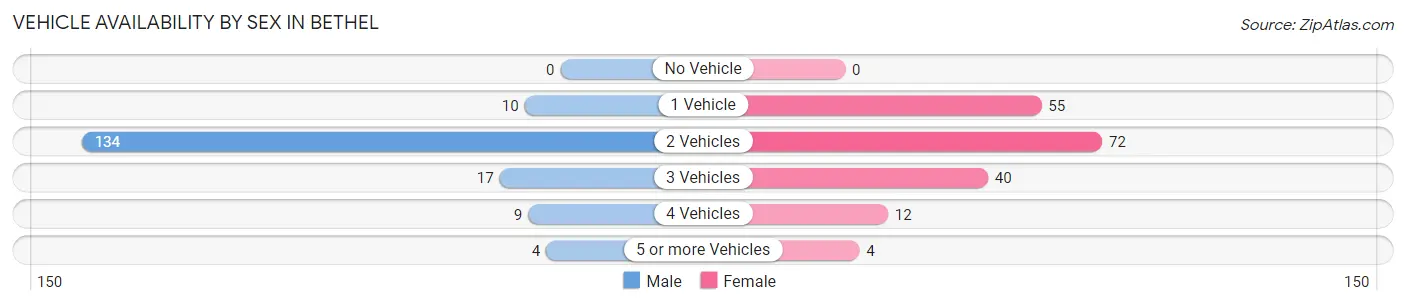
| Vehicles Available | Male | Female |
| No Vehicle | 0 (0.0%) | 0 (0.0%) |
| 1 Vehicle | 10 (5.8%) | 55 (30.0%) |
| 2 Vehicles | 134 (77.0%) | 72 (39.3%) |
| 3 Vehicles | 17 (9.8%) | 40 (21.9%) |
| 4 Vehicles | 9 (5.2%) | 12 (6.6%) |
| 5 or more Vehicles | 4 (2.3%) | 4 (2.2%) |
| Total | 174 (100.0%) | 183 (100.0%) |
Commute Time in Bethel
The most frequently occuring commute durations in Bethel are 30 to 34 minutes (59 commuters, 16.5%), 60 to 89 minutes (51 commuters, 14.3%), and less than 5 minutes (40 commuters, 11.2%).
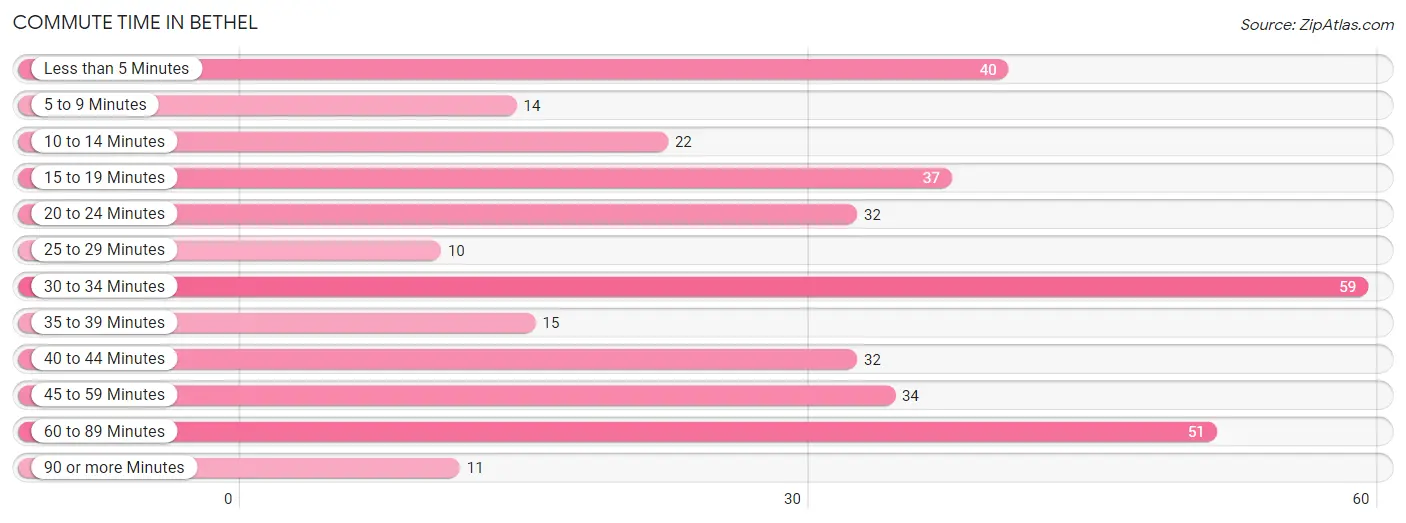
| Commute Time | # Commuters | % Commuters |
| Less than 5 Minutes | 40 | 11.2% |
| 5 to 9 Minutes | 14 | 3.9% |
| 10 to 14 Minutes | 22 | 6.2% |
| 15 to 19 Minutes | 37 | 10.4% |
| 20 to 24 Minutes | 32 | 9.0% |
| 25 to 29 Minutes | 10 | 2.8% |
| 30 to 34 Minutes | 59 | 16.5% |
| 35 to 39 Minutes | 15 | 4.2% |
| 40 to 44 Minutes | 32 | 9.0% |
| 45 to 59 Minutes | 34 | 9.5% |
| 60 to 89 Minutes | 51 | 14.3% |
| 90 or more Minutes | 11 | 3.1% |
Commute Time by Sex in Bethel
The most common commute times in Bethel are 60 to 89 minutes (51 commuters, 29.3%) for males and 30 to 34 minutes (45 commuters, 24.6%) for females.
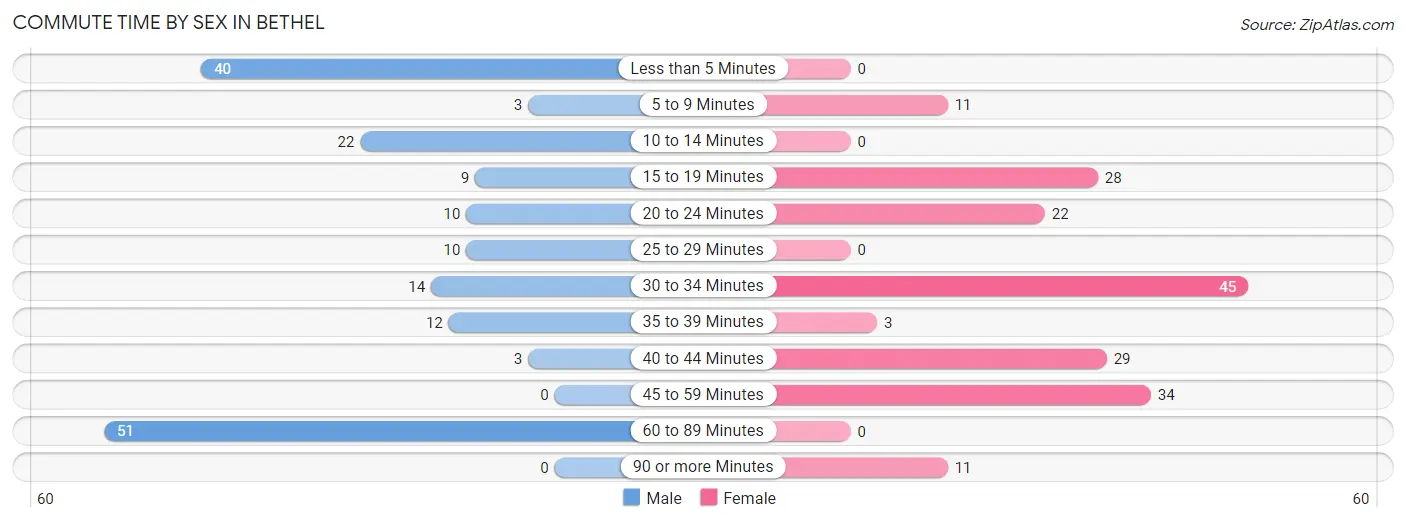
| Commute Time | Male | Female |
| Less than 5 Minutes | 40 (23.0%) | 0 (0.0%) |
| 5 to 9 Minutes | 3 (1.7%) | 11 (6.0%) |
| 10 to 14 Minutes | 22 (12.6%) | 0 (0.0%) |
| 15 to 19 Minutes | 9 (5.2%) | 28 (15.3%) |
| 20 to 24 Minutes | 10 (5.8%) | 22 (12.0%) |
| 25 to 29 Minutes | 10 (5.8%) | 0 (0.0%) |
| 30 to 34 Minutes | 14 (8.1%) | 45 (24.6%) |
| 35 to 39 Minutes | 12 (6.9%) | 3 (1.6%) |
| 40 to 44 Minutes | 3 (1.7%) | 29 (15.9%) |
| 45 to 59 Minutes | 0 (0.0%) | 34 (18.6%) |
| 60 to 89 Minutes | 51 (29.3%) | 0 (0.0%) |
| 90 or more Minutes | 0 (0.0%) | 11 (6.0%) |
Time of Departure to Work by Sex in Bethel
The most frequent times of departure to work in Bethel are 7:00 AM to 7:29 AM (61, 35.1%) for males and 7:30 AM to 7:59 AM (52, 28.4%) for females.
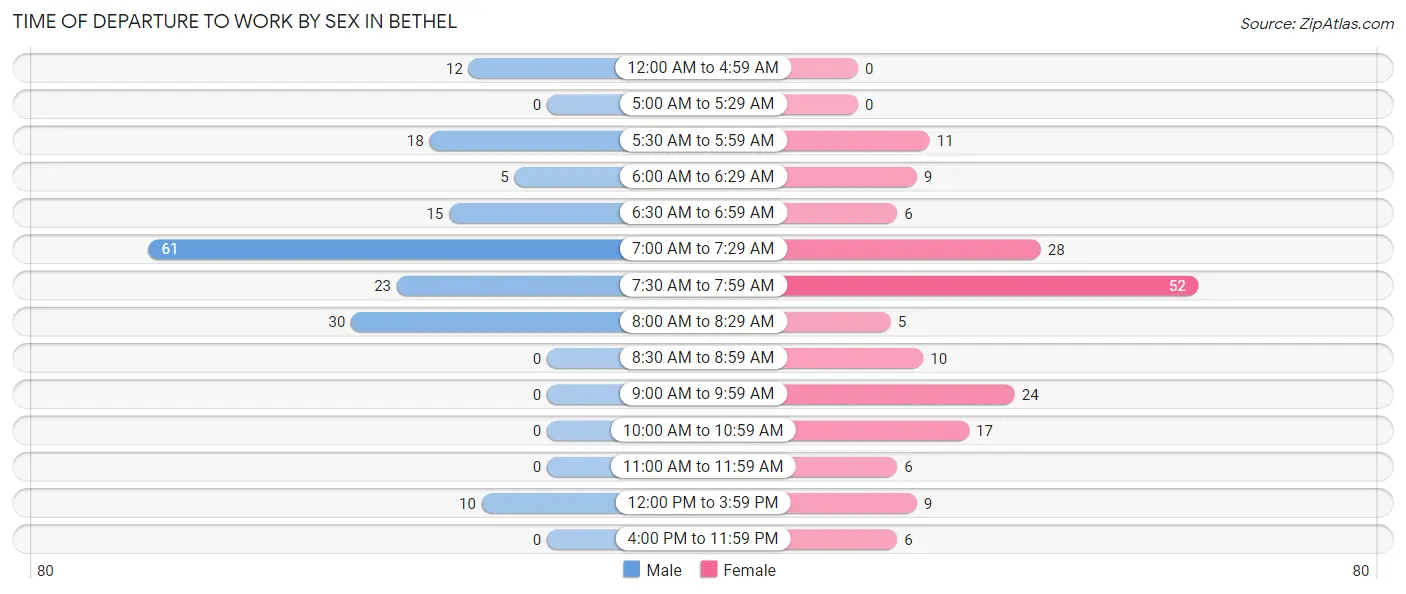
| Time of Departure | Male | Female |
| 12:00 AM to 4:59 AM | 12 (6.9%) | 0 (0.0%) |
| 5:00 AM to 5:29 AM | 0 (0.0%) | 0 (0.0%) |
| 5:30 AM to 5:59 AM | 18 (10.3%) | 11 (6.0%) |
| 6:00 AM to 6:29 AM | 5 (2.9%) | 9 (4.9%) |
| 6:30 AM to 6:59 AM | 15 (8.6%) | 6 (3.3%) |
| 7:00 AM to 7:29 AM | 61 (35.1%) | 28 (15.3%) |
| 7:30 AM to 7:59 AM | 23 (13.2%) | 52 (28.4%) |
| 8:00 AM to 8:29 AM | 30 (17.2%) | 5 (2.7%) |
| 8:30 AM to 8:59 AM | 0 (0.0%) | 10 (5.5%) |
| 9:00 AM to 9:59 AM | 0 (0.0%) | 24 (13.1%) |
| 10:00 AM to 10:59 AM | 0 (0.0%) | 17 (9.3%) |
| 11:00 AM to 11:59 AM | 0 (0.0%) | 6 (3.3%) |
| 12:00 PM to 3:59 PM | 10 (5.8%) | 9 (4.9%) |
| 4:00 PM to 11:59 PM | 0 (0.0%) | 6 (3.3%) |
| Total | 174 (100.0%) | 183 (100.0%) |
Housing Occupancy in Bethel
Occupancy by Ownership in Bethel
Of the total 264 dwellings in Bethel, owner-occupied units account for 150 (56.8%), while renter-occupied units make up 114 (43.2%).
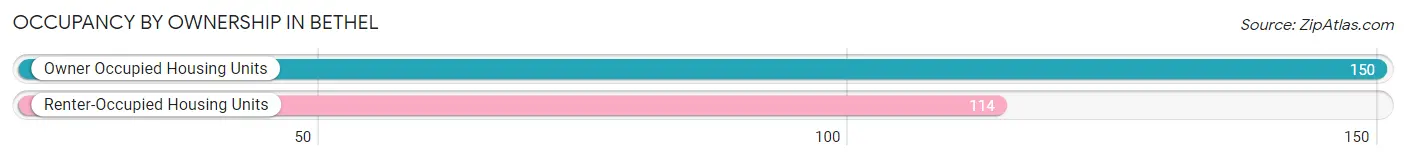
| Occupancy | # Housing Units | % Housing Units |
| Owner Occupied Housing Units | 150 | 56.8% |
| Renter-Occupied Housing Units | 114 | 43.2% |
| Total Occupied Housing Units | 264 | 100.0% |
Occupancy by Household Size in Bethel
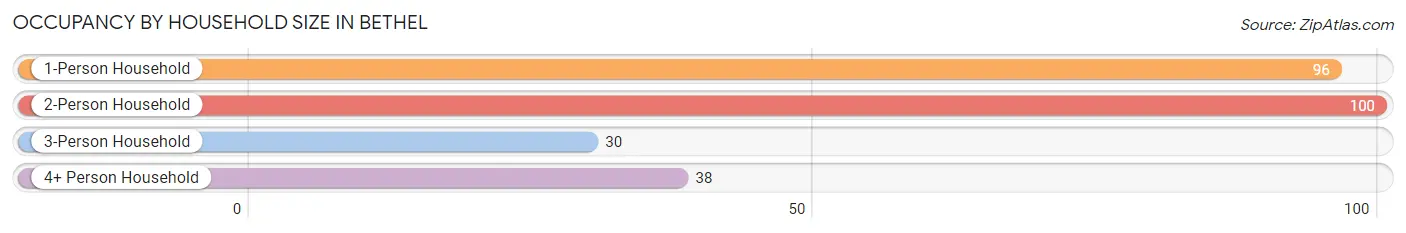
| Household Size | # Housing Units | % Housing Units |
| 1-Person Household | 96 | 36.4% |
| 2-Person Household | 100 | 37.9% |
| 3-Person Household | 30 | 11.4% |
| 4+ Person Household | 38 | 14.4% |
| Total Housing Units | 264 | 100.0% |
Occupancy by Ownership by Household Size in Bethel
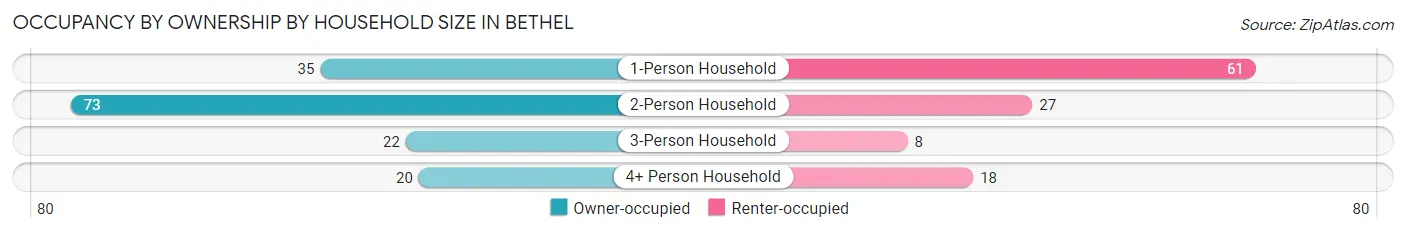
| Household Size | Owner-occupied | Renter-occupied |
| 1-Person Household | 35 (36.5%) | 61 (63.5%) |
| 2-Person Household | 73 (73.0%) | 27 (27.0%) |
| 3-Person Household | 22 (73.3%) | 8 (26.7%) |
| 4+ Person Household | 20 (52.6%) | 18 (47.4%) |
| Total Housing Units | 150 (56.8%) | 114 (43.2%) |
Occupancy by Educational Attainment in Bethel
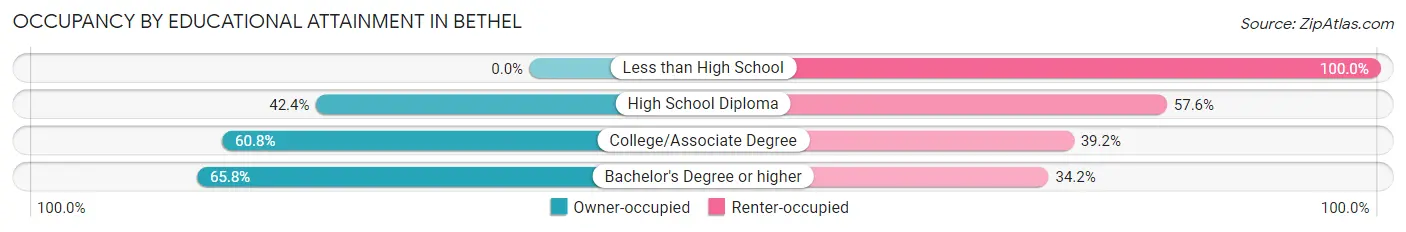
| Household Size | Owner-occupied | Renter-occupied |
| Less than High School | 0 (0.0%) | 6 (100.0%) |
| High School Diploma | 25 (42.4%) | 34 (57.6%) |
| College/Associate Degree | 73 (60.8%) | 47 (39.2%) |
| Bachelor's Degree or higher | 52 (65.8%) | 27 (34.2%) |
Occupancy by Age of Householder in Bethel
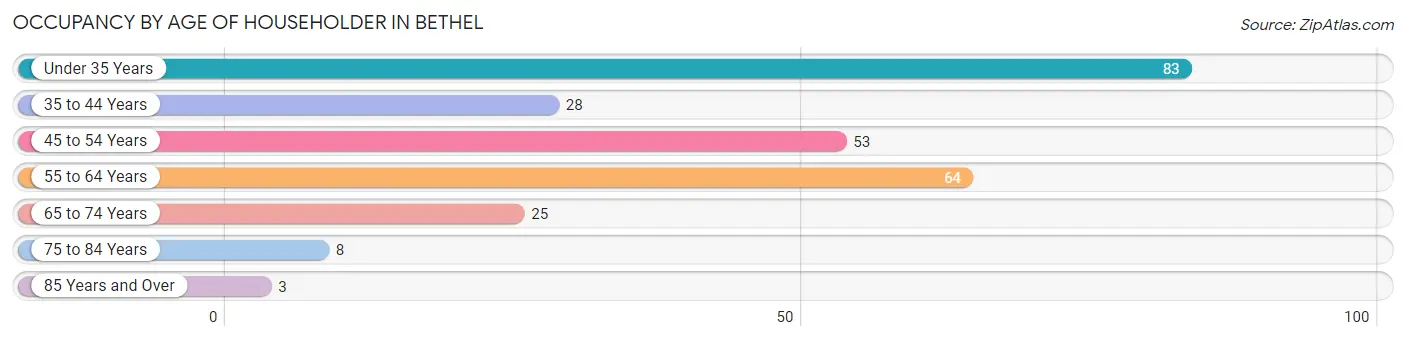
| Age Bracket | # Households | % Households |
| Under 35 Years | 83 | 31.4% |
| 35 to 44 Years | 28 | 10.6% |
| 45 to 54 Years | 53 | 20.1% |
| 55 to 64 Years | 64 | 24.2% |
| 65 to 74 Years | 25 | 9.5% |
| 75 to 84 Years | 8 | 3.0% |
| 85 Years and Over | 3 | 1.1% |
| Total | 264 | 100.0% |
Housing Finances in Bethel
Median Income by Occupancy in Bethel
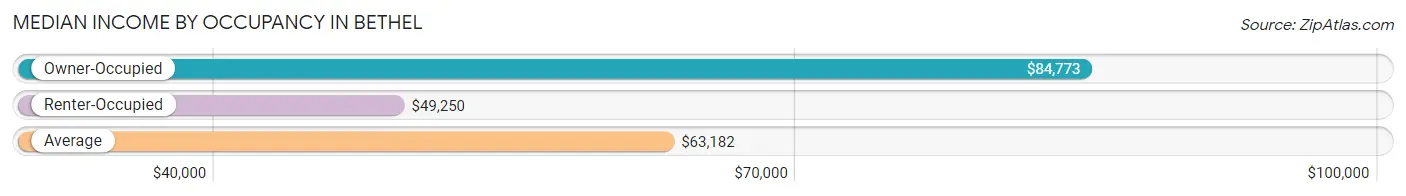
| Occupancy Type | # Households | Median Income |
| Owner-Occupied | 150 (56.8%) | $84,773 |
| Renter-Occupied | 114 (43.2%) | $49,250 |
| Average | 264 (100.0%) | $63,182 |
Occupancy by Householder Income Bracket in Bethel
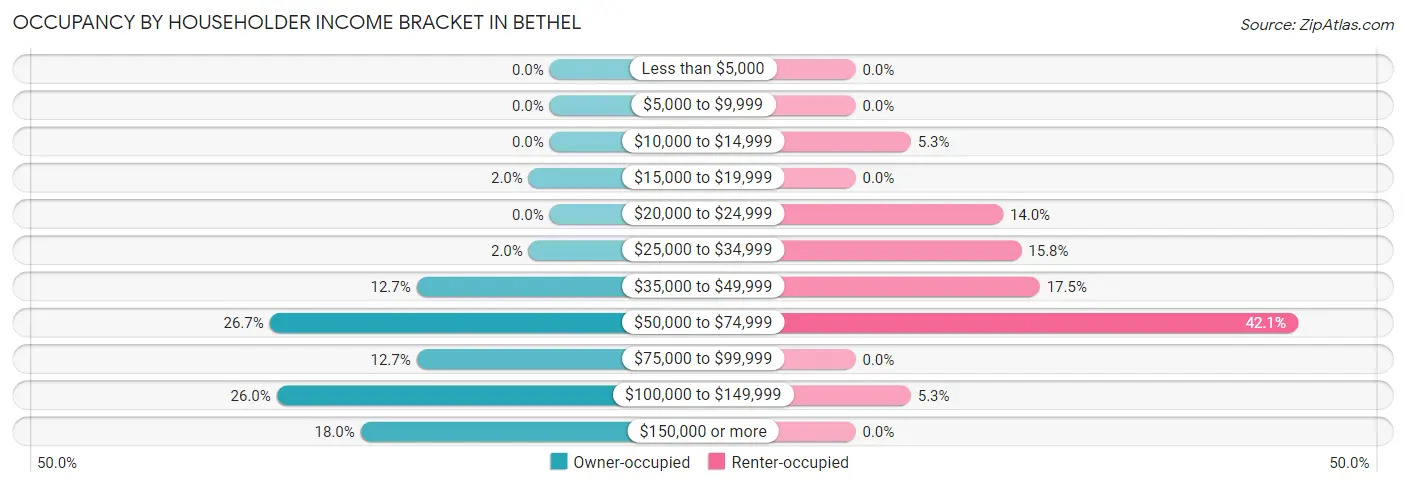
| Income Bracket | Owner-occupied | Renter-occupied |
| Less than $5,000 | 0 (0.0%) | 0 (0.0%) |
| $5,000 to $9,999 | 0 (0.0%) | 0 (0.0%) |
| $10,000 to $14,999 | 0 (0.0%) | 6 (5.3%) |
| $15,000 to $19,999 | 3 (2.0%) | 0 (0.0%) |
| $20,000 to $24,999 | 0 (0.0%) | 16 (14.0%) |
| $25,000 to $34,999 | 3 (2.0%) | 18 (15.8%) |
| $35,000 to $49,999 | 19 (12.7%) | 20 (17.5%) |
| $50,000 to $74,999 | 40 (26.7%) | 48 (42.1%) |
| $75,000 to $99,999 | 19 (12.7%) | 0 (0.0%) |
| $100,000 to $149,999 | 39 (26.0%) | 6 (5.3%) |
| $150,000 or more | 27 (18.0%) | 0 (0.0%) |
| Total | 150 (100.0%) | 114 (100.0%) |
Monthly Housing Cost Tiers in Bethel
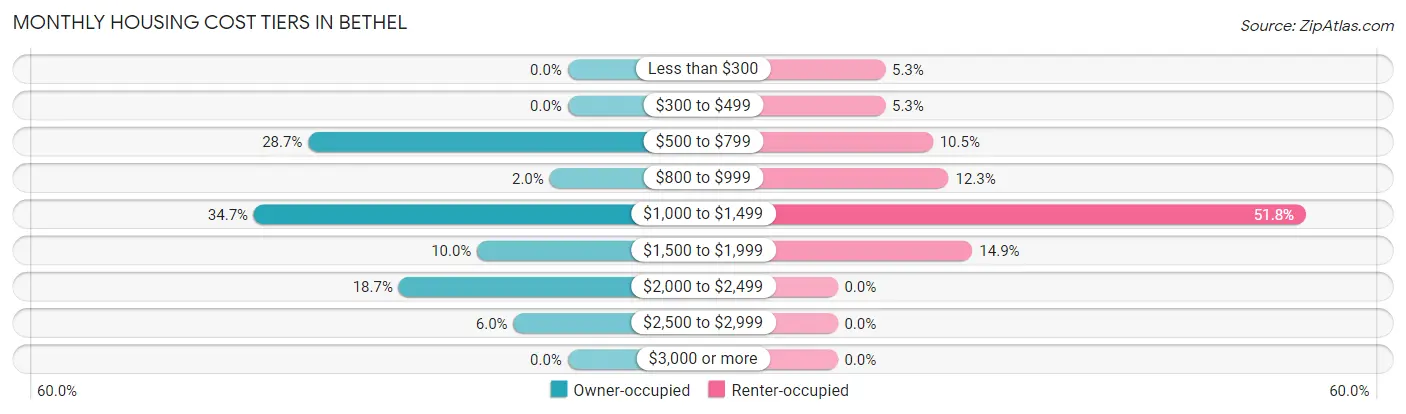
| Monthly Cost | Owner-occupied | Renter-occupied |
| Less than $300 | 0 (0.0%) | 6 (5.3%) |
| $300 to $499 | 0 (0.0%) | 6 (5.3%) |
| $500 to $799 | 43 (28.7%) | 12 (10.5%) |
| $800 to $999 | 3 (2.0%) | 14 (12.3%) |
| $1,000 to $1,499 | 52 (34.7%) | 59 (51.7%) |
| $1,500 to $1,999 | 15 (10.0%) | 17 (14.9%) |
| $2,000 to $2,499 | 28 (18.7%) | 0 (0.0%) |
| $2,500 to $2,999 | 9 (6.0%) | 0 (0.0%) |
| $3,000 or more | 0 (0.0%) | 0 (0.0%) |
| Total | 150 (100.0%) | 114 (100.0%) |
Physical Housing Characteristics in Bethel
Housing Structures in Bethel
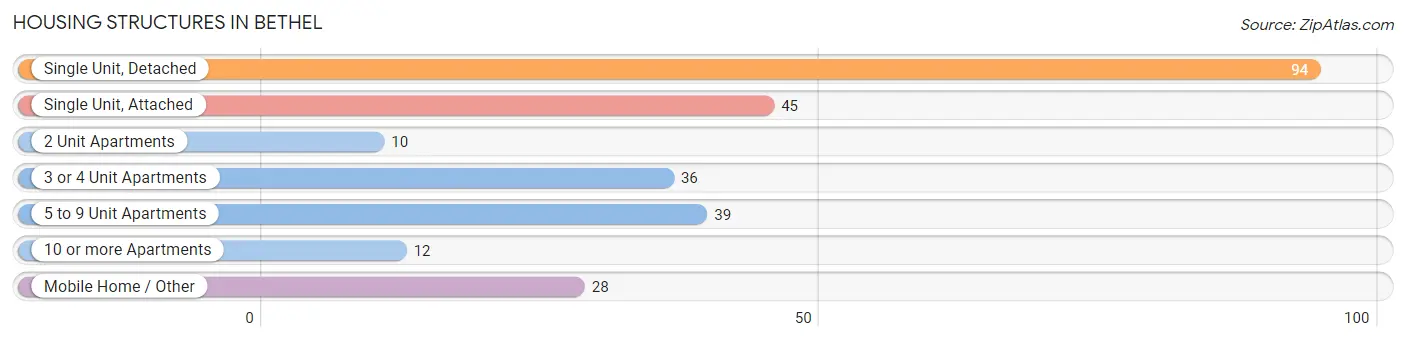
| Structure Type | # Housing Units | % Housing Units |
| Single Unit, Detached | 94 | 35.6% |
| Single Unit, Attached | 45 | 17.1% |
| 2 Unit Apartments | 10 | 3.8% |
| 3 or 4 Unit Apartments | 36 | 13.6% |
| 5 to 9 Unit Apartments | 39 | 14.8% |
| 10 or more Apartments | 12 | 4.5% |
| Mobile Home / Other | 28 | 10.6% |
| Total | 264 | 100.0% |
Housing Structures by Occupancy in Bethel
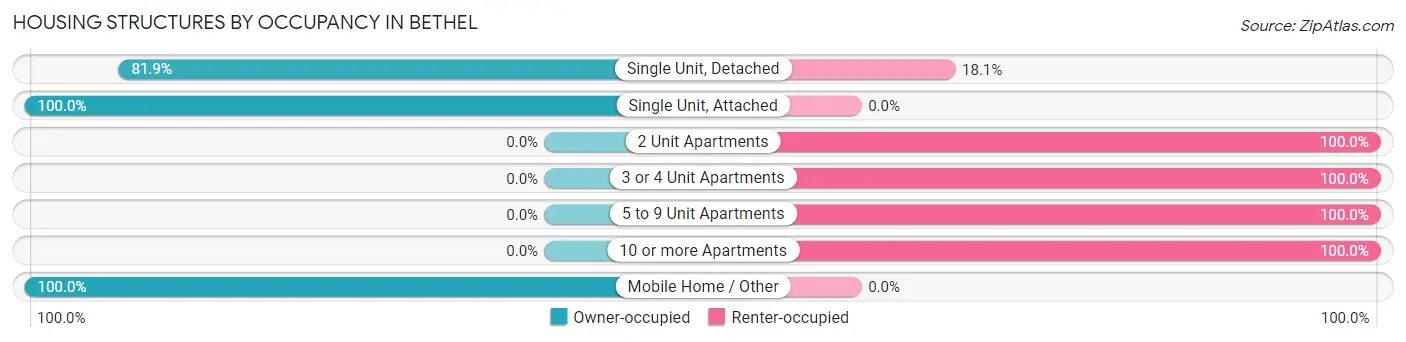
| Structure Type | Owner-occupied | Renter-occupied |
| Single Unit, Detached | 77 (81.9%) | 17 (18.1%) |
| Single Unit, Attached | 45 (100.0%) | 0 (0.0%) |
| 2 Unit Apartments | 0 (0.0%) | 10 (100.0%) |
| 3 or 4 Unit Apartments | 0 (0.0%) | 36 (100.0%) |
| 5 to 9 Unit Apartments | 0 (0.0%) | 39 (100.0%) |
| 10 or more Apartments | 0 (0.0%) | 12 (100.0%) |
| Mobile Home / Other | 28 (100.0%) | 0 (0.0%) |
| Total | 150 (56.8%) | 114 (43.2%) |
Housing Structures by Number of Rooms in Bethel
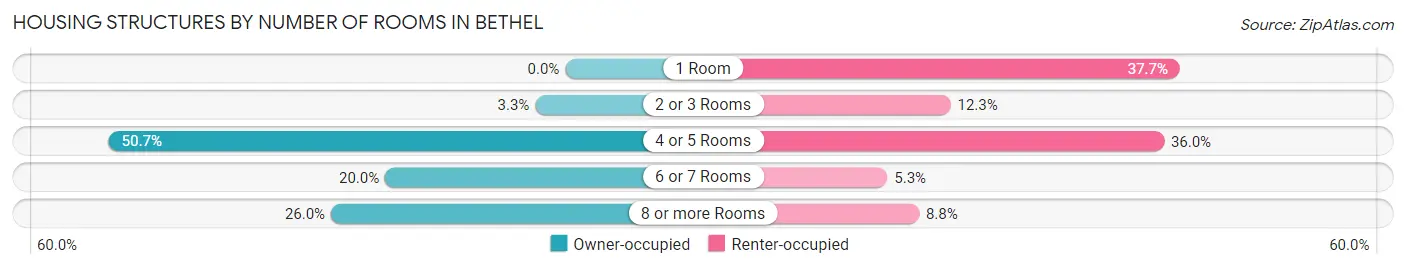
| Number of Rooms | Owner-occupied | Renter-occupied |
| 1 Room | 0 (0.0%) | 43 (37.7%) |
| 2 or 3 Rooms | 5 (3.3%) | 14 (12.3%) |
| 4 or 5 Rooms | 76 (50.7%) | 41 (36.0%) |
| 6 or 7 Rooms | 30 (20.0%) | 6 (5.3%) |
| 8 or more Rooms | 39 (26.0%) | 10 (8.8%) |
| Total | 150 (100.0%) | 114 (100.0%) |
Housing Structure by Heating Type in Bethel
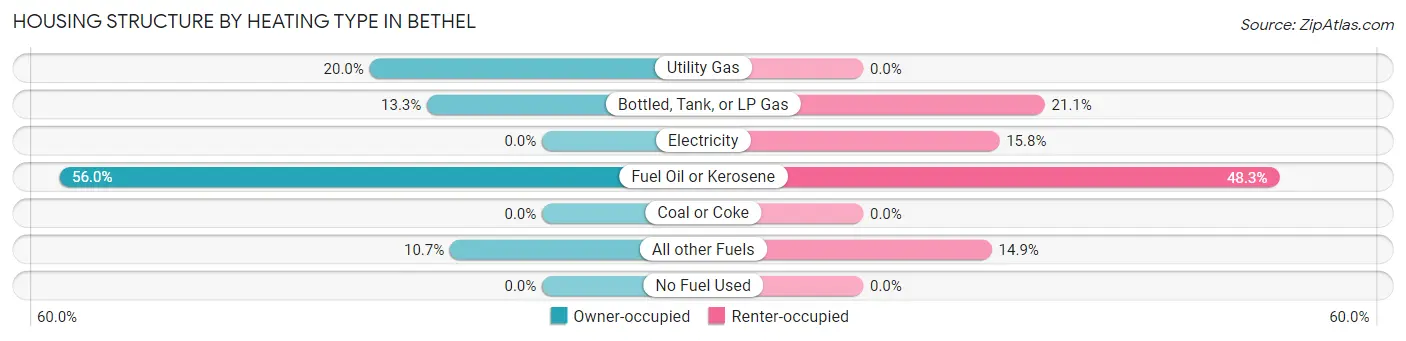
| Heating Type | Owner-occupied | Renter-occupied |
| Utility Gas | 30 (20.0%) | 0 (0.0%) |
| Bottled, Tank, or LP Gas | 20 (13.3%) | 24 (21.0%) |
| Electricity | 0 (0.0%) | 18 (15.8%) |
| Fuel Oil or Kerosene | 84 (56.0%) | 55 (48.2%) |
| Coal or Coke | 0 (0.0%) | 0 (0.0%) |
| All other Fuels | 16 (10.7%) | 17 (14.9%) |
| No Fuel Used | 0 (0.0%) | 0 (0.0%) |
| Total | 150 (100.0%) | 114 (100.0%) |
Household Vehicle Usage in Bethel
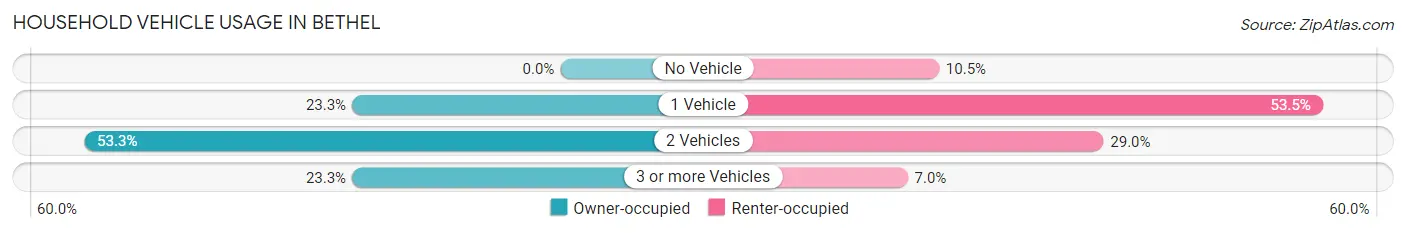
| Vehicles per Household | Owner-occupied | Renter-occupied |
| No Vehicle | 0 (0.0%) | 12 (10.5%) |
| 1 Vehicle | 35 (23.3%) | 61 (53.5%) |
| 2 Vehicles | 80 (53.3%) | 33 (28.9%) |
| 3 or more Vehicles | 35 (23.3%) | 8 (7.0%) |
| Total | 150 (100.0%) | 114 (100.0%) |
Real Estate & Mortgages in Bethel
Real Estate and Mortgage Overview in Bethel
| Characteristic | Without Mortgage | With Mortgage |
| Housing Units | 57 | 93 |
| Median Property Value | - | - |
| Median Household Income | $58,281 | $27 |
| Monthly Housing Costs | $728 | $0 |
| Real Estate Taxes | - | - |
Property Value by Mortgage Status in Bethel
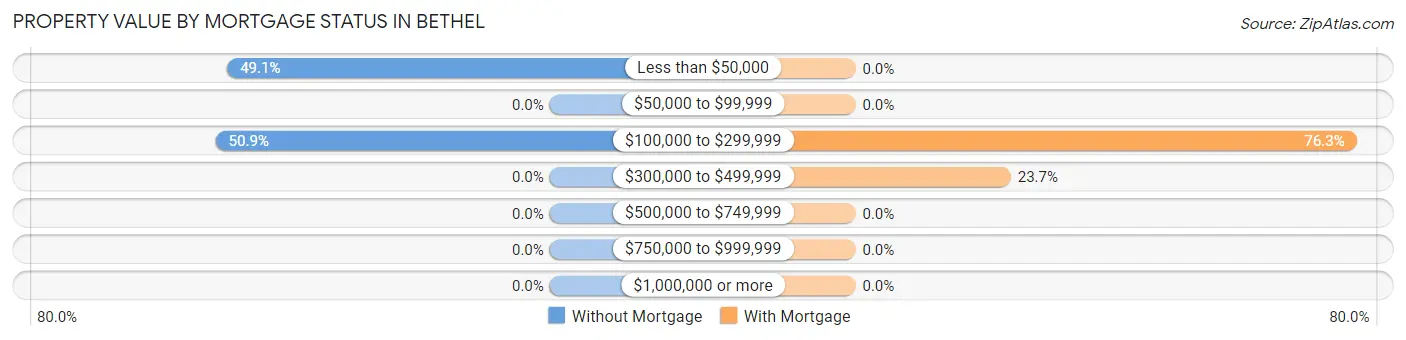
| Property Value | Without Mortgage | With Mortgage |
| Less than $50,000 | 28 (49.1%) | 0 (0.0%) |
| $50,000 to $99,999 | 0 (0.0%) | 0 (0.0%) |
| $100,000 to $299,999 | 29 (50.9%) | 71 (76.3%) |
| $300,000 to $499,999 | 0 (0.0%) | 22 (23.7%) |
| $500,000 to $749,999 | 0 (0.0%) | 0 (0.0%) |
| $750,000 to $999,999 | 0 (0.0%) | 0 (0.0%) |
| $1,000,000 or more | 0 (0.0%) | 0 (0.0%) |
| Total | 57 (100.0%) | 93 (100.0%) |
Household Income by Mortgage Status in Bethel
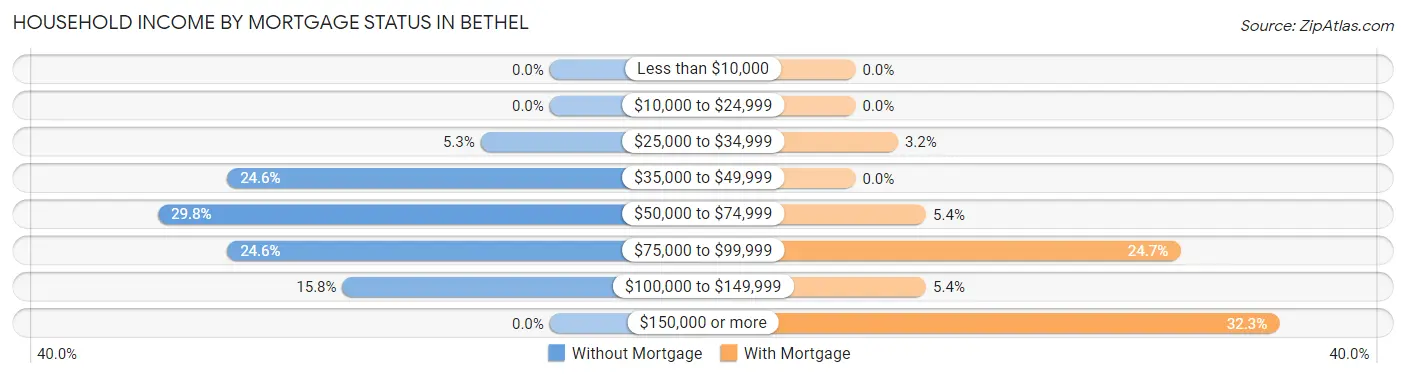
| Household Income | Without Mortgage | With Mortgage |
| Less than $10,000 | 0 (0.0%) | 0 (0.0%) |
| $10,000 to $24,999 | 0 (0.0%) | 0 (0.0%) |
| $25,000 to $34,999 | 3 (5.3%) | 3 (3.2%) |
| $35,000 to $49,999 | 14 (24.6%) | 0 (0.0%) |
| $50,000 to $74,999 | 17 (29.8%) | 5 (5.4%) |
| $75,000 to $99,999 | 14 (24.6%) | 23 (24.7%) |
| $100,000 to $149,999 | 9 (15.8%) | 5 (5.4%) |
| $150,000 or more | 0 (0.0%) | 30 (32.3%) |
| Total | 57 (100.0%) | 93 (100.0%) |
Property Value to Household Income Ratio in Bethel
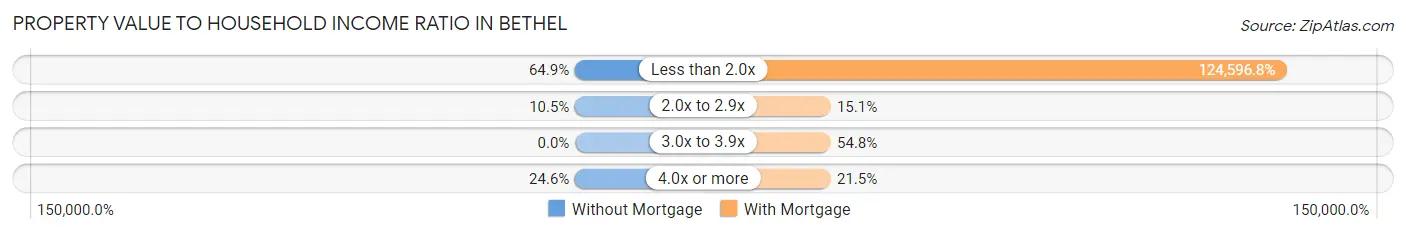
| Value-to-Income Ratio | Without Mortgage | With Mortgage |
| Less than 2.0x | 37 (64.9%) | 115,875 (124,596.8%) |
| 2.0x to 2.9x | 6 (10.5%) | 14 (15.0%) |
| 3.0x to 3.9x | 0 (0.0%) | 51 (54.8%) |
| 4.0x or more | 14 (24.6%) | 20 (21.5%) |
| Total | 57 (100.0%) | 93 (100.0%) |
Real Estate Taxes by Mortgage Status in Bethel
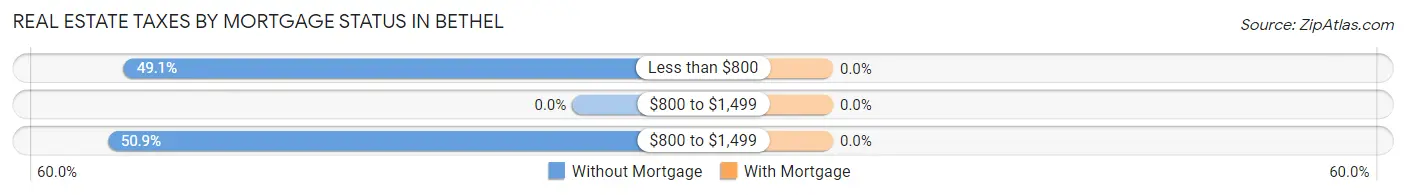
| Property Taxes | Without Mortgage | With Mortgage |
| Less than $800 | 28 (49.1%) | 0 (0.0%) |
| $800 to $1,499 | 0 (0.0%) | 0 (0.0%) |
| $800 to $1,499 | 29 (50.9%) | 0 (0.0%) |
| Total | 57 (100.0%) | 93 (100.0%) |
Health & Disability in Bethel
Health Insurance Coverage by Age in Bethel
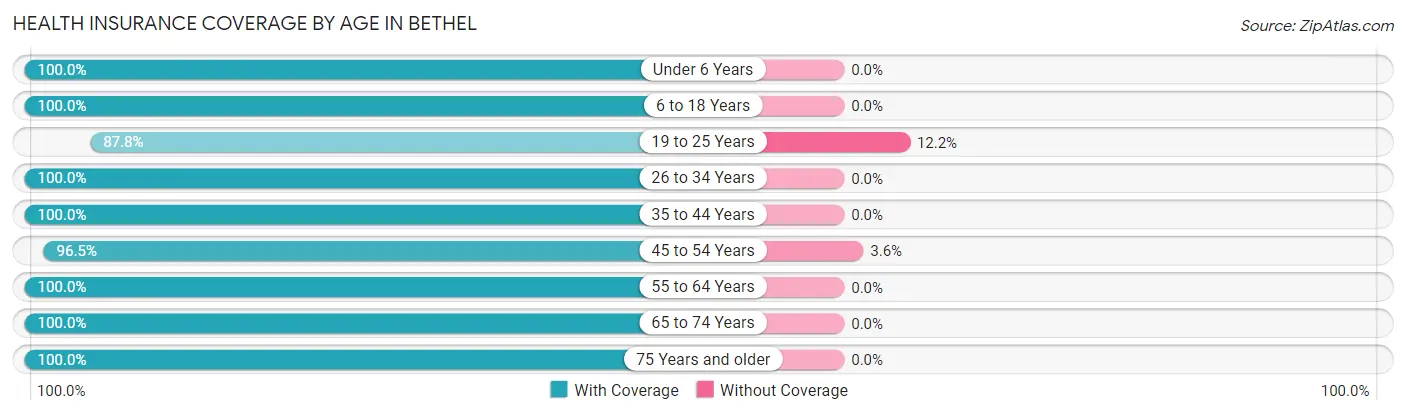
| Age Bracket | With Coverage | Without Coverage |
| Under 6 Years | 38 (100.0%) | 0 (0.0%) |
| 6 to 18 Years | 116 (100.0%) | 0 (0.0%) |
| 19 to 25 Years | 43 (87.8%) | 6 (12.2%) |
| 26 to 34 Years | 123 (100.0%) | 0 (0.0%) |
| 35 to 44 Years | 28 (100.0%) | 0 (0.0%) |
| 45 to 54 Years | 136 (96.5%) | 5 (3.5%) |
| 55 to 64 Years | 92 (100.0%) | 0 (0.0%) |
| 65 to 74 Years | 33 (100.0%) | 0 (0.0%) |
| 75 Years and older | 46 (100.0%) | 0 (0.0%) |
| Total | 655 (98.4%) | 11 (1.7%) |
Health Insurance Coverage by Citizenship Status in Bethel
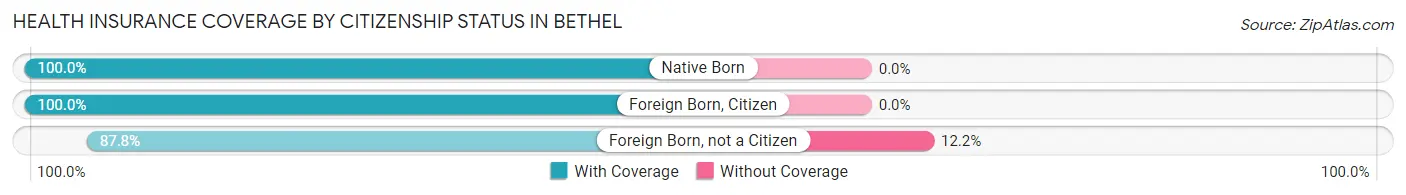
| Citizenship Status | With Coverage | Without Coverage |
| Native Born | 38 (100.0%) | 0 (0.0%) |
| Foreign Born, Citizen | 116 (100.0%) | 0 (0.0%) |
| Foreign Born, not a Citizen | 43 (87.8%) | 6 (12.2%) |
Health Insurance Coverage by Household Income in Bethel
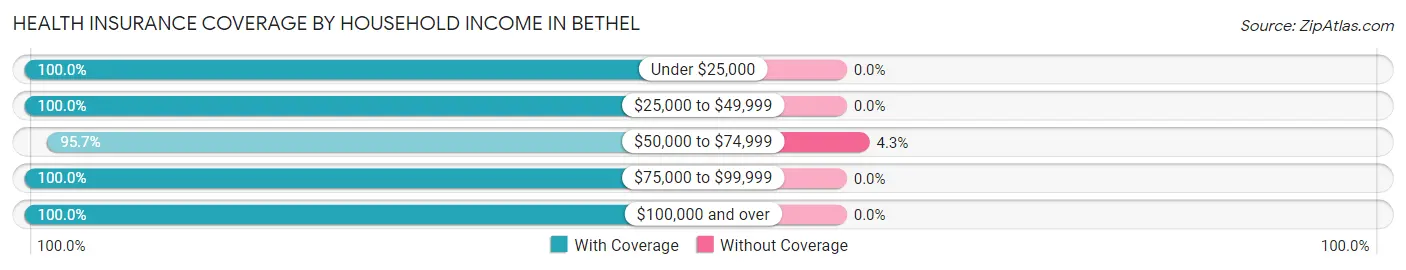
| Household Income | With Coverage | Without Coverage |
| Under $25,000 | 25 (100.0%) | 0 (0.0%) |
| $25,000 to $49,999 | 145 (100.0%) | 0 (0.0%) |
| $50,000 to $74,999 | 247 (95.7%) | 11 (4.3%) |
| $75,000 to $99,999 | 33 (100.0%) | 0 (0.0%) |
| $100,000 and over | 205 (100.0%) | 0 (0.0%) |
Public vs Private Health Insurance Coverage by Age in Bethel
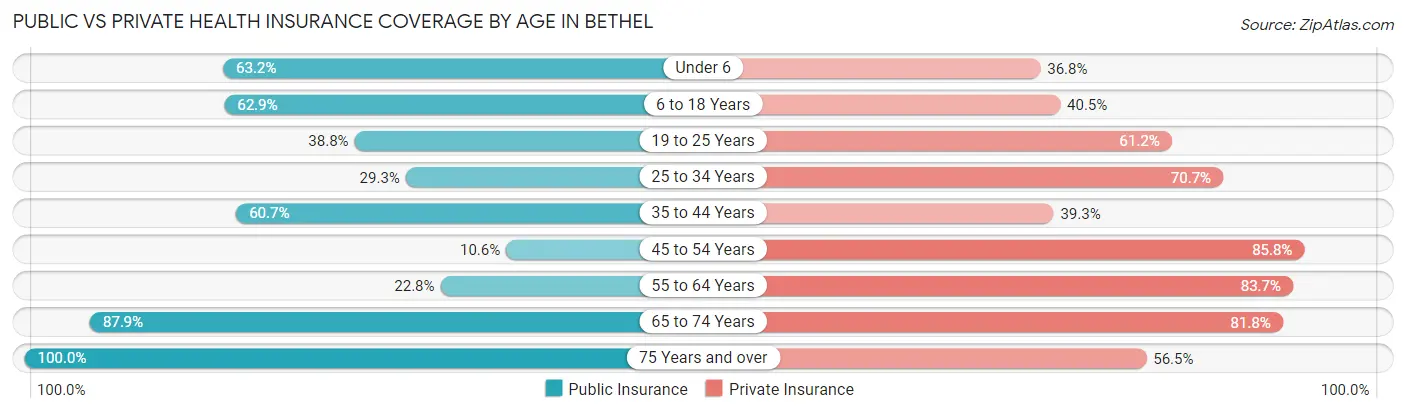
| Age Bracket | Public Insurance | Private Insurance |
| Under 6 | 24 (63.2%) | 14 (36.8%) |
| 6 to 18 Years | 73 (62.9%) | 47 (40.5%) |
| 19 to 25 Years | 19 (38.8%) | 30 (61.2%) |
| 25 to 34 Years | 36 (29.3%) | 87 (70.7%) |
| 35 to 44 Years | 17 (60.7%) | 11 (39.3%) |
| 45 to 54 Years | 15 (10.6%) | 121 (85.8%) |
| 55 to 64 Years | 21 (22.8%) | 77 (83.7%) |
| 65 to 74 Years | 29 (87.9%) | 27 (81.8%) |
| 75 Years and over | 46 (100.0%) | 26 (56.5%) |
| Total | 280 (42.0%) | 440 (66.1%) |
Disability Status by Sex by Age in Bethel
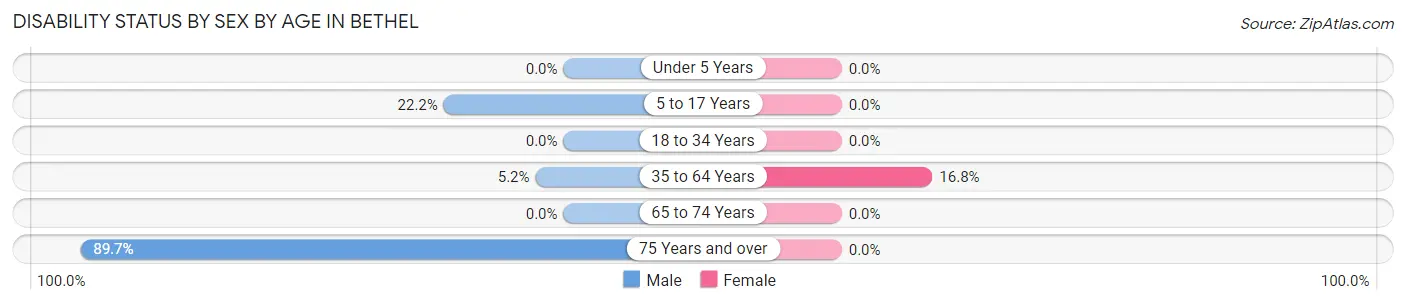
| Age Bracket | Male | Female |
| Under 5 Years | 0 (0.0%) | 0 (0.0%) |
| 5 to 17 Years | 16 (22.2%) | 0 (0.0%) |
| 18 to 34 Years | 0 (0.0%) | 0 (0.0%) |
| 35 to 64 Years | 8 (5.2%) | 18 (16.8%) |
| 65 to 74 Years | 0 (0.0%) | 0 (0.0%) |
| 75 Years and over | 26 (89.7%) | 0 (0.0%) |
Disability Class by Sex by Age in Bethel
Disability Class: Hearing Difficulty
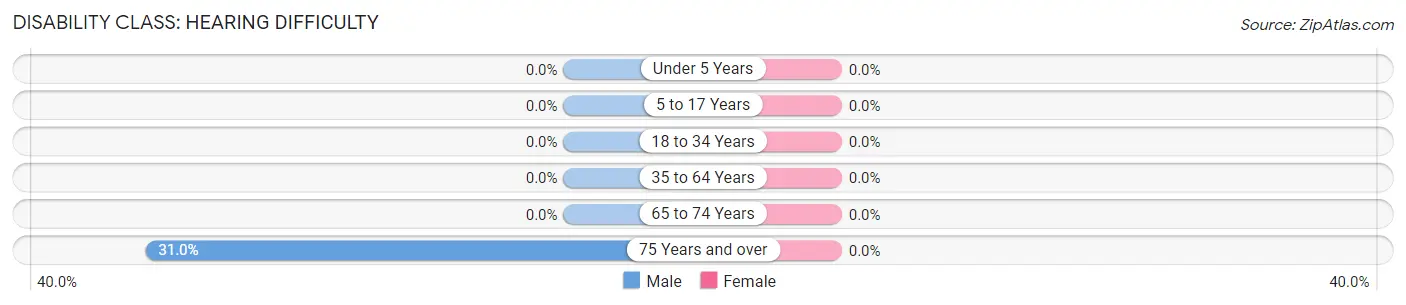
| Age Bracket | Male | Female |
| Under 5 Years | 0 (0.0%) | 0 (0.0%) |
| 5 to 17 Years | 0 (0.0%) | 0 (0.0%) |
| 18 to 34 Years | 0 (0.0%) | 0 (0.0%) |
| 35 to 64 Years | 0 (0.0%) | 0 (0.0%) |
| 65 to 74 Years | 0 (0.0%) | 0 (0.0%) |
| 75 Years and over | 9 (31.0%) | 0 (0.0%) |
Disability Class: Vision Difficulty
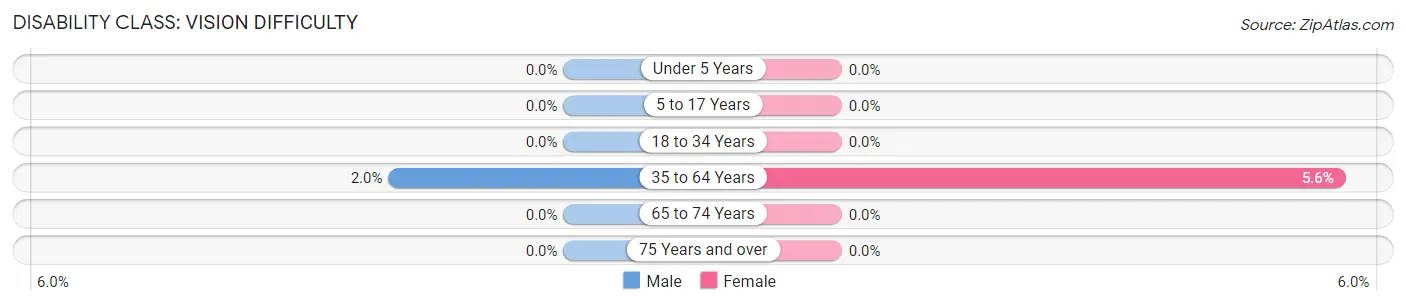
| Age Bracket | Male | Female |
| Under 5 Years | 0 (0.0%) | 0 (0.0%) |
| 5 to 17 Years | 0 (0.0%) | 0 (0.0%) |
| 18 to 34 Years | 0 (0.0%) | 0 (0.0%) |
| 35 to 64 Years | 3 (1.9%) | 6 (5.6%) |
| 65 to 74 Years | 0 (0.0%) | 0 (0.0%) |
| 75 Years and over | 0 (0.0%) | 0 (0.0%) |
Disability Class: Cognitive Difficulty
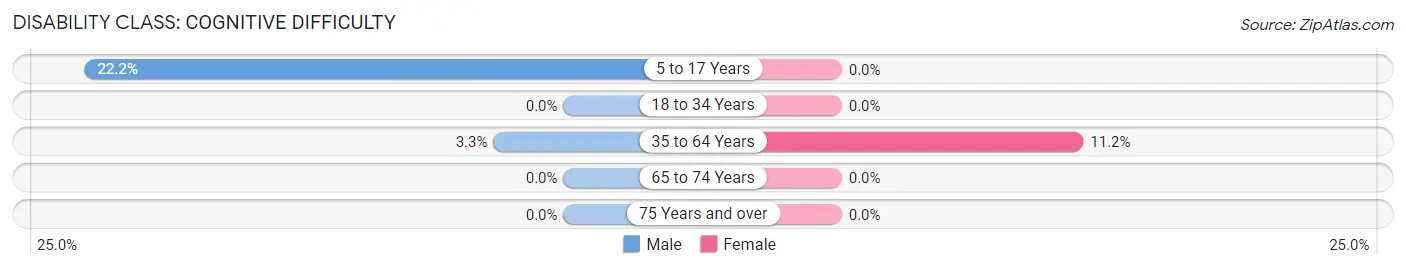
| Age Bracket | Male | Female |
| 5 to 17 Years | 16 (22.2%) | 0 (0.0%) |
| 18 to 34 Years | 0 (0.0%) | 0 (0.0%) |
| 35 to 64 Years | 5 (3.3%) | 12 (11.2%) |
| 65 to 74 Years | 0 (0.0%) | 0 (0.0%) |
| 75 Years and over | 0 (0.0%) | 0 (0.0%) |
Disability Class: Ambulatory Difficulty
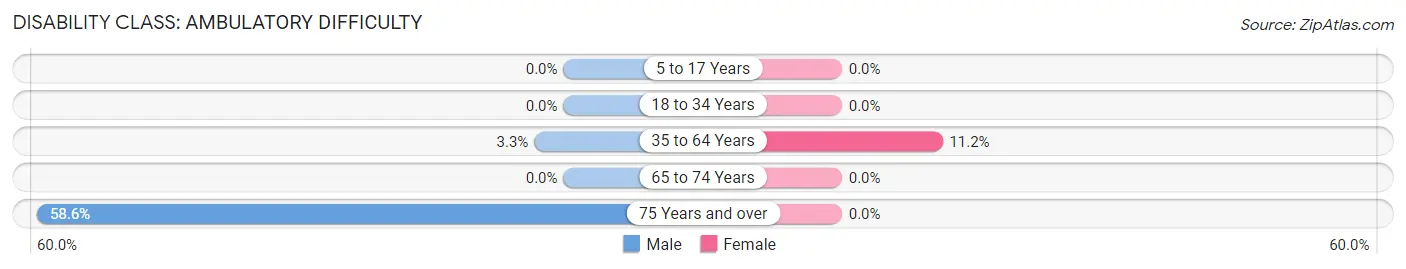
| Age Bracket | Male | Female |
| 5 to 17 Years | 0 (0.0%) | 0 (0.0%) |
| 18 to 34 Years | 0 (0.0%) | 0 (0.0%) |
| 35 to 64 Years | 5 (3.3%) | 12 (11.2%) |
| 65 to 74 Years | 0 (0.0%) | 0 (0.0%) |
| 75 Years and over | 17 (58.6%) | 0 (0.0%) |
Disability Class: Self-Care Difficulty
| Age Bracket | Male | Female |
| 5 to 17 Years | 0 (0.0%) | 0 (0.0%) |
| 18 to 34 Years | 0 (0.0%) | 0 (0.0%) |
| 35 to 64 Years | 0 (0.0%) | 0 (0.0%) |
| 65 to 74 Years | 0 (0.0%) | 0 (0.0%) |
| 75 Years and over | 0 (0.0%) | 0 (0.0%) |
Technology Access in Bethel
Computing Device Access in Bethel
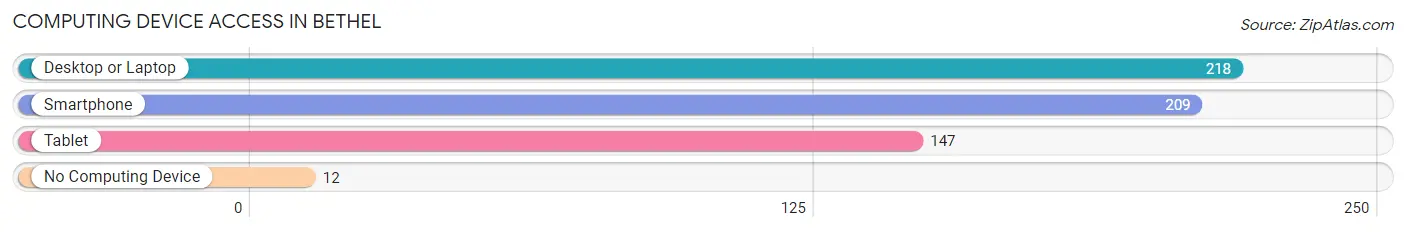
| Device Type | # Households | % Households |
| Desktop or Laptop | 218 | 82.6% |
| Smartphone | 209 | 79.2% |
| Tablet | 147 | 55.7% |
| No Computing Device | 12 | 4.5% |
| Total | 264 | 100.0% |
Internet Access in Bethel
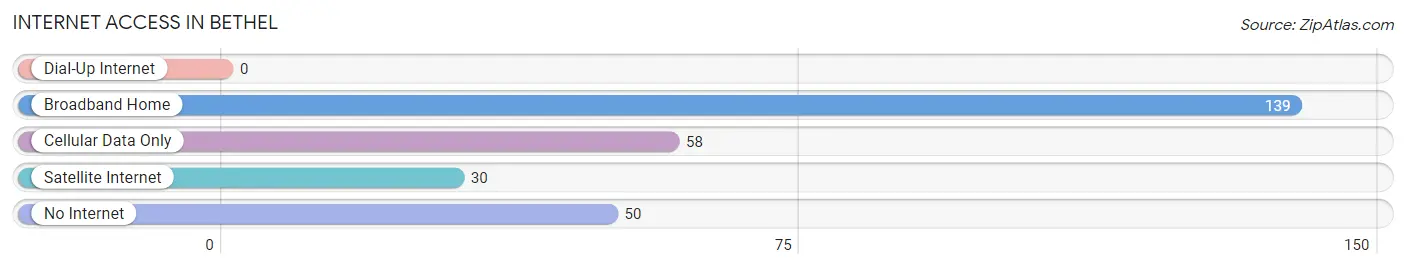
| Internet Type | # Households | % Households |
| Dial-Up Internet | 0 | 0.0% |
| Broadband Home | 139 | 52.6% |
| Cellular Data Only | 58 | 22.0% |
| Satellite Internet | 30 | 11.4% |
| No Internet | 50 | 18.9% |
| Total | 264 | 100.0% |
Bethel Summary
Bethel, Vermont is a small town located in the White River Valley of the Green Mountains in the state of Vermont. It is situated in the southeastern corner of the state, just north of the Connecticut River. Bethel is a rural community with a population of 1,717 people as of the 2010 census.
History
Bethel was first settled in 1780 by a group of settlers from Connecticut. The town was named after Bethel, Connecticut, the hometown of the settlers. The town was incorporated in 1781 and was the first town in the state to be incorporated.
The town was originally an agricultural community, with the main crops being wheat, corn, and potatoes. In the late 19th century, the town began to develop a small manufacturing industry, with the first factory being built in 1876. The factory produced wooden furniture and other wooden products.
In the early 20th century, the town began to develop a tourism industry, with the first hotel being built in 1910. The town also became a popular destination for skiing, with the first ski resort being built in the 1930s.
Geography
Bethel is located in the White River Valley of the Green Mountains in the southeastern corner of the state. The town is bordered by the towns of Randolph to the north, Rochester to the east, Stockbridge to the south, and Rochester to the west. The White River runs through the town, and the town is located at the base of the Green Mountains.
The town has a total area of 24.2 square miles, of which 24.1 square miles is land and 0.1 square miles is water. The town is located at an elevation of 1,000 feet above sea level.
Economy
The economy of Bethel is largely based on tourism and agriculture. The town is home to several ski resorts, including the Bethel Mountain Resort, which is the largest ski resort in the state. The town also has several small businesses, including restaurants, shops, and lodging.
Agriculture is also an important part of the economy, with the main crops being wheat, corn, and potatoes. The town also has several dairy farms, and the town is home to the Bethel Creamery, which produces a variety of cheeses.
Demographics
As of the 2010 census, the population of Bethel was 1,717 people. The racial makeup of the town was 97.3% White, 0.5% African American, 0.3% Native American, 0.3% Asian, 0.2% from other races, and 1.4% from two or more races. Hispanic or Latino of any race were 0.9% of the population.
The median household income in Bethel was $45,938, and the median family income was $51,250. The per capita income for the town was $22,945. About 8.3% of families and 10.7% of the population were below the poverty line, including 14.2% of those under age 18 and 5.2% of those age 65 or over.
Common Questions
What is Per Capita Income in Bethel?
Per Capita income in Bethel is $34,148.
What is the Median Family Income in Bethel?
Median Family Income in Bethel is $54,861.
What is the Median Household income in Bethel?
Median Household Income in Bethel is $63,182.
What is Income or Wage Gap in Bethel?
Income or Wage Gap in Bethel is 13.8%.
Women in Bethel earn 86.2 cents for every dollar earned by a man.
What is Inequality or Gini Index in Bethel?
Inequality or Gini Index in Bethel is 0.36.
What is the Total Population of Bethel?
Total Population of Bethel is 666.
What is the Total Male Population of Bethel?
Total Male Population of Bethel is 339.
What is the Total Female Population of Bethel?
Total Female Population of Bethel is 327.
What is the Ratio of Males per 100 Females in Bethel?
There are 103.67 Males per 100 Females in Bethel.
What is the Ratio of Females per 100 Males in Bethel?
There are 96.46 Females per 100 Males in Bethel.
What is the Median Population Age in Bethel?
Median Population Age in Bethel is 39.2 Years.
What is the Average Family Size in Bethel
Average Family Size in Bethel is 3.4 People.
What is the Average Household Size in Bethel
Average Household Size in Bethel is 2.5 People.
How Large is the Labor Force in Bethel?
There are 389 People in the Labor Forcein in Bethel.
What is the Percentage of People in the Labor Force in Bethel?
74.5% of People are in the Labor Force in Bethel.
What is the Unemployment Rate in Bethel?
Unemployment Rate in Bethel is 6.7%.