St Johnsbury, VT Map & Demographics
St Johnsbury Map
St Johnsbury Overview
$34,206
PER CAPITA INCOME
$83,686
AVG FAMILY INCOME
$48,542
AVG HOUSEHOLD INCOME
1.8%
WAGE / INCOME GAP [ % ]
98.2¢/ $1
WAGE / INCOME GAP [ $ ]
0.49
INEQUALITY / GINI INDEX
5,963
TOTAL POPULATION
3,052
MALE POPULATION
2,911
FEMALE POPULATION
104.84
MALES / 100 FEMALES
95.38
FEMALES / 100 MALES
48.5
MEDIAN AGE
2.7
AVG FAMILY SIZE
2.0
AVG HOUSEHOLD SIZE
3,092
LABOR FORCE [ PEOPLE ]
61.5%
PERCENT IN LABOR FORCE
4.6%
UNEMPLOYMENT RATE
St Johnsbury Area Codes
Income in St Johnsbury
Income Overview in St Johnsbury
Per Capita Income in St Johnsbury is $34,206, while median incomes of families and households are $83,686 and $48,542 respectively.
| Characteristic | Number | Measure |
| Per Capita Income | 5,963 | $34,206 |
| Median Family Income | 1,365 | $83,686 |
| Mean Family Income | 1,365 | $86,888 |
| Median Household Income | 2,763 | $48,542 |
| Mean Household Income | 2,763 | $70,565 |
| Income Deficit | 1,365 | $0 |
| Wage / Income Gap (%) | 5,963 | 1.82% |
| Wage / Income Gap ($) | 5,963 | 98.18¢ per $1 |
| Gini / Inequality Index | 5,963 | 0.49 |
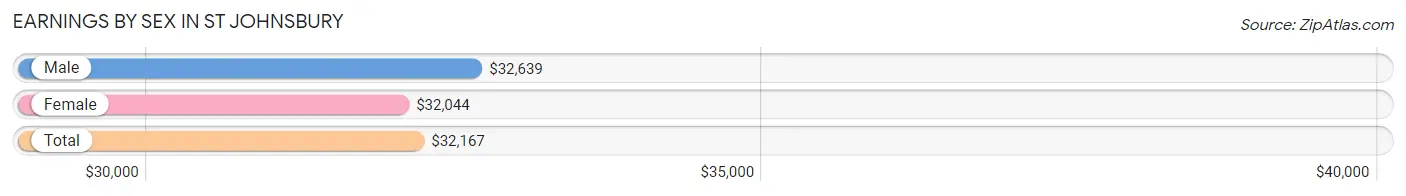
Earnings by Sex in St Johnsbury
Average Earnings in St Johnsbury are $32,167, $32,639 for men and $32,044 for women, a difference of 1.8%.
| Sex | Number | Average Earnings |
| Male | 1,785 (52.7%) | $32,639 |
| Female | 1,600 (47.3%) | $32,044 |
| Total | 3,385 (100.0%) | $32,167 |
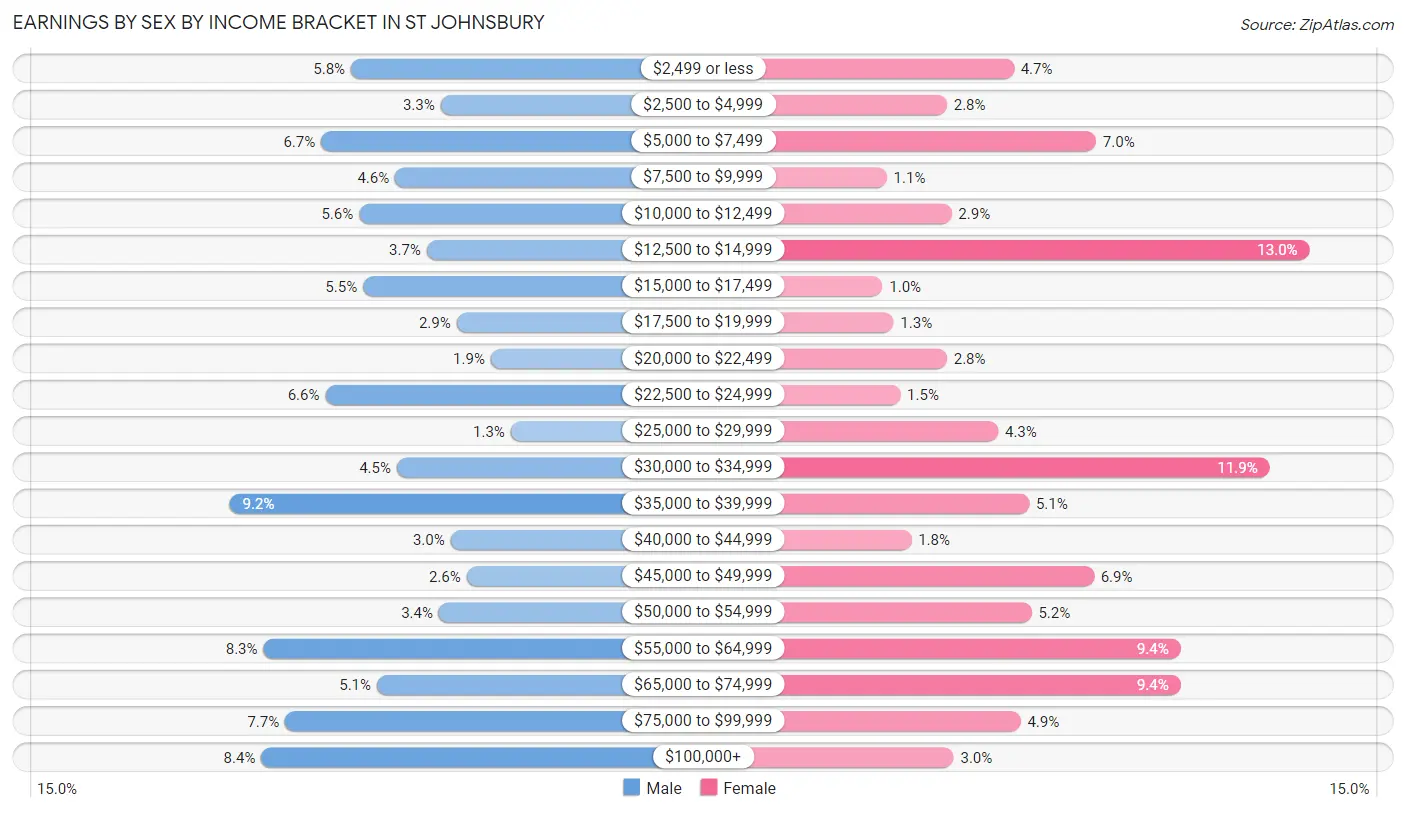
Earnings by Sex by Income Bracket in St Johnsbury
The most common earnings brackets in St Johnsbury are $35,000 to $39,999 for men (165 | 9.2%) and $12,500 to $14,999 for women (208 | 13.0%).
| Income | Male | Female |
| $2,499 or less | 104 (5.8%) | 75 (4.7%) |
| $2,500 to $4,999 | 59 (3.3%) | 45 (2.8%) |
| $5,000 to $7,499 | 119 (6.7%) | 112 (7.0%) |
| $7,500 to $9,999 | 82 (4.6%) | 18 (1.1%) |
| $10,000 to $12,499 | 100 (5.6%) | 47 (2.9%) |
| $12,500 to $14,999 | 66 (3.7%) | 208 (13.0%) |
| $15,000 to $17,499 | 98 (5.5%) | 16 (1.0%) |
| $17,500 to $19,999 | 51 (2.9%) | 21 (1.3%) |
| $20,000 to $22,499 | 34 (1.9%) | 45 (2.8%) |
| $22,500 to $24,999 | 117 (6.6%) | 24 (1.5%) |
| $25,000 to $29,999 | 24 (1.3%) | 68 (4.3%) |
| $30,000 to $34,999 | 81 (4.5%) | 190 (11.9%) |
| $35,000 to $39,999 | 165 (9.2%) | 82 (5.1%) |
| $40,000 to $44,999 | 54 (3.0%) | 29 (1.8%) |
| $45,000 to $49,999 | 46 (2.6%) | 111 (6.9%) |
| $50,000 to $54,999 | 60 (3.4%) | 83 (5.2%) |
| $55,000 to $64,999 | 148 (8.3%) | 150 (9.4%) |
| $65,000 to $74,999 | 91 (5.1%) | 150 (9.4%) |
| $75,000 to $99,999 | 137 (7.7%) | 78 (4.9%) |
| $100,000+ | 149 (8.4%) | 48 (3.0%) |
| Total | 1,785 (100.0%) | 1,600 (100.0%) |
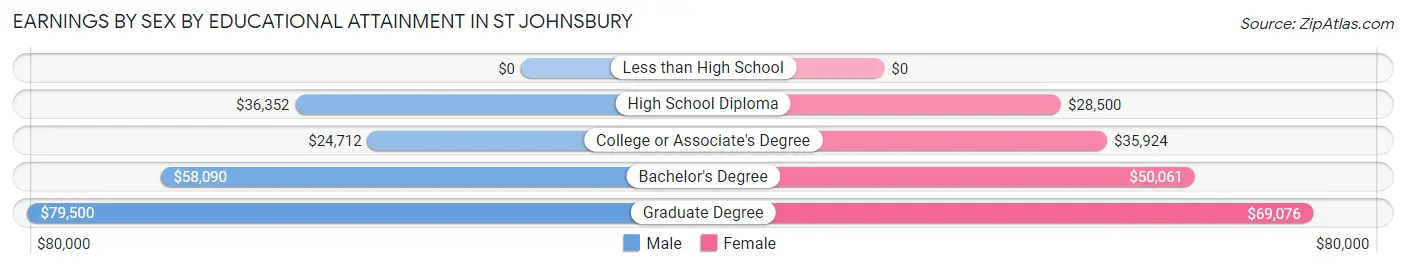
Earnings by Sex by Educational Attainment in St Johnsbury
Average earnings in St Johnsbury are $37,147 for men and $36,848 for women, a difference of 0.8%. Men with an educational attainment of graduate degree enjoy the highest average annual earnings of $79,500, while those with college or associate's degree education earn the least with $24,712. Women with an educational attainment of graduate degree earn the most with the average annual earnings of $69,076, while those with high school diploma education have the smallest earnings of $28,500.
| Educational Attainment | Male Income | Female Income |
| Less than High School | - | - |
| High School Diploma | $36,352 | $28,500 |
| College or Associate's Degree | $24,712 | $35,924 |
| Bachelor's Degree | $58,090 | $50,061 |
| Graduate Degree | $79,500 | $69,076 |
| Total | $37,147 | $36,848 |
Family Income in St Johnsbury
Family Income Brackets in St Johnsbury
According to the St Johnsbury family income data, there are 304 families falling into the $100,000 to $149,999 income range, which is the most common income bracket and makes up 22.3% of all families. Conversely, the $15,000 to $24,999 income bracket is the least frequent group with only 51 families (3.7%) belonging to this category.
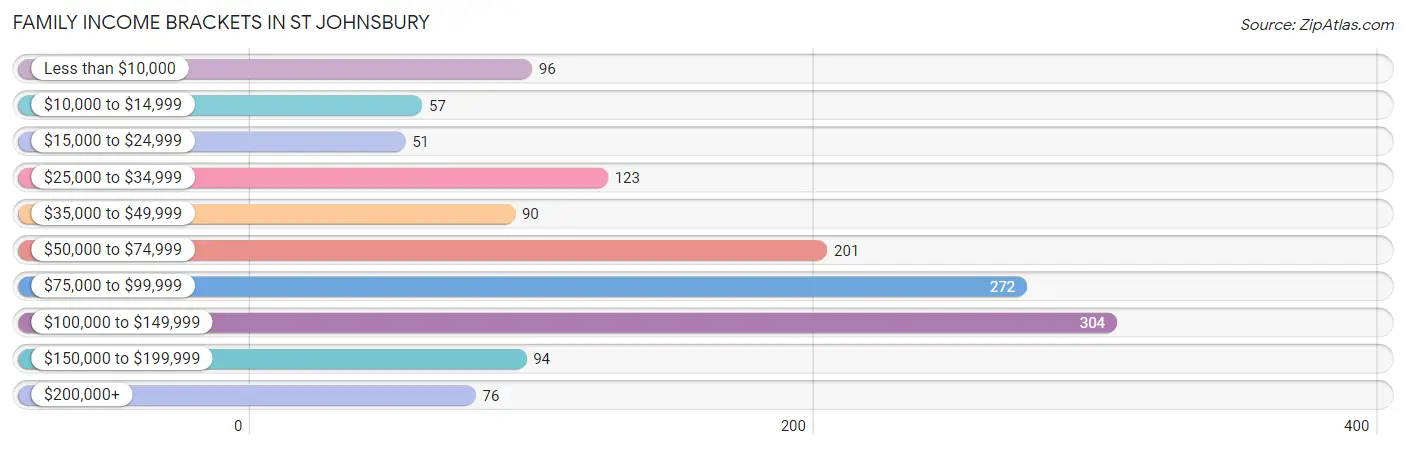
| Income Bracket | # Families | % Families |
| Less than $10,000 | 96 | 7.0% |
| $10,000 to $14,999 | 57 | 4.2% |
| $15,000 to $24,999 | 51 | 3.7% |
| $25,000 to $34,999 | 123 | 9.0% |
| $35,000 to $49,999 | 90 | 6.6% |
| $50,000 to $74,999 | 201 | 14.7% |
| $75,000 to $99,999 | 272 | 19.9% |
| $100,000 to $149,999 | 304 | 22.3% |
| $150,000 to $199,999 | 94 | 6.9% |
| $200,000+ | 76 | 5.6% |
Family Income by Famaliy Size in St Johnsbury
4-person families (151 | 11.1%) account for the highest median family income in St Johnsbury with $121,635 per family, while 2-person families (732 | 53.6%) have the highest median income of $41,125 per family member.
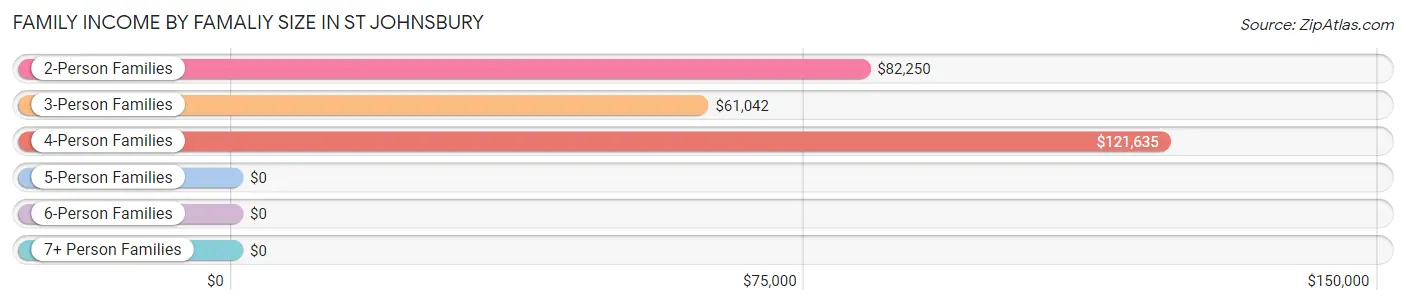
| Income Bracket | # Families | Median Income |
| 2-Person Families | 732 (53.6%) | $82,250 |
| 3-Person Families | 398 (29.2%) | $61,042 |
| 4-Person Families | 151 (11.1%) | $121,635 |
| 5-Person Families | 32 (2.3%) | $0 |
| 6-Person Families | 45 (3.3%) | $0 |
| 7+ Person Families | 7 (0.5%) | $0 |
| Total | 1,365 (100.0%) | $83,686 |
Family Income by Number of Earners in St Johnsbury
The median family income in St Johnsbury is $83,686, with families comprising 3+ earners (75) having the highest median family income of $122,404, while families with no earners (309) have the lowest median family income of $25,938, accounting for 5.5% and 22.6% of families, respectively.
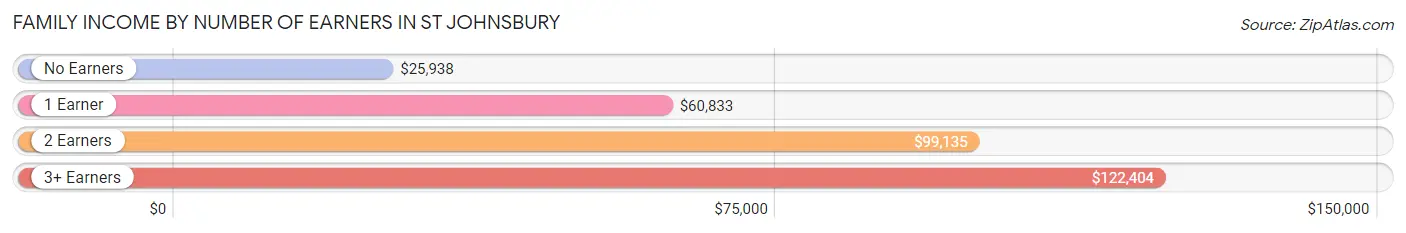
| Number of Earners | # Families | Median Income |
| No Earners | 309 (22.6%) | $25,938 |
| 1 Earner | 364 (26.7%) | $60,833 |
| 2 Earners | 617 (45.2%) | $99,135 |
| 3+ Earners | 75 (5.5%) | $122,404 |
| Total | 1,365 (100.0%) | $83,686 |
Household Income in St Johnsbury
Household Income Brackets in St Johnsbury
With 406 households falling in the category, the $50,000 to $74,999 income range is the most frequent in St Johnsbury, accounting for 14.7% of all households. In contrast, only 127 households (4.6%) fall into the $200,000+ income bracket, making it the least populous group.
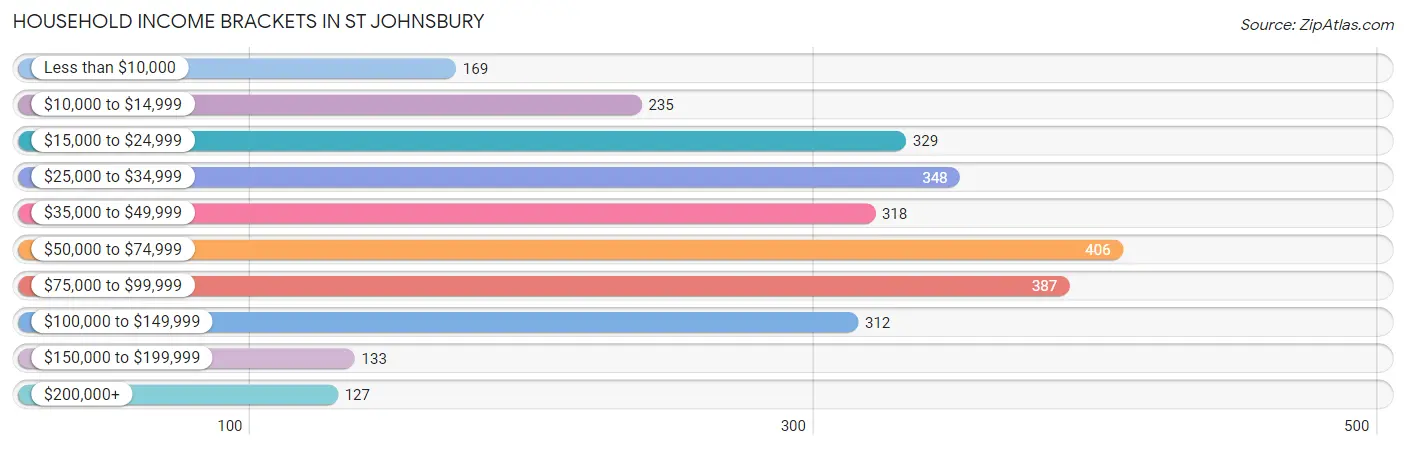
| Income Bracket | # Households | % Households |
| Less than $10,000 | 169 | 6.1% |
| $10,000 to $14,999 | 235 | 8.5% |
| $15,000 to $24,999 | 329 | 11.9% |
| $25,000 to $34,999 | 348 | 12.6% |
| $35,000 to $49,999 | 318 | 11.5% |
| $50,000 to $74,999 | 406 | 14.7% |
| $75,000 to $99,999 | 387 | 14.0% |
| $100,000 to $149,999 | 312 | 11.3% |
| $150,000 to $199,999 | 133 | 4.8% |
| $200,000+ | 127 | 4.6% |
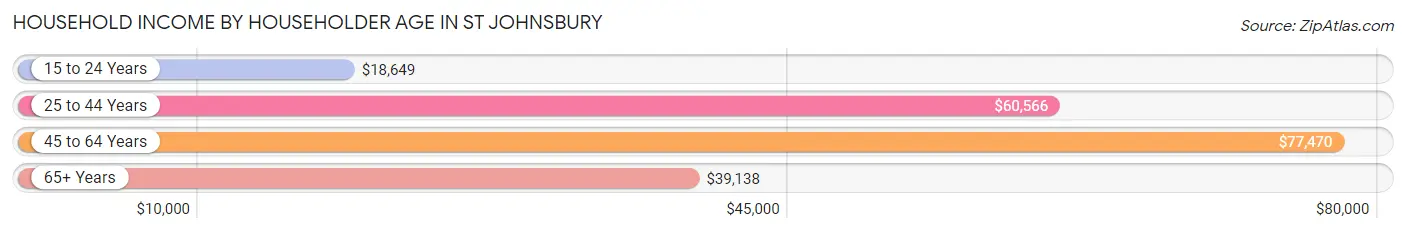
Household Income by Householder Age in St Johnsbury
The median household income in St Johnsbury is $48,542, with the highest median household income of $77,470 found in the 45 to 64 years age bracket for the primary householder. A total of 971 households (35.1%) fall into this category. Meanwhile, the 15 to 24 years age bracket for the primary householder has the lowest median household income of $18,649, with 210 households (7.6%) in this group.
| Income Bracket | # Households | Median Income |
| 15 to 24 Years | 210 (7.6%) | $18,649 |
| 25 to 44 Years | 622 (22.5%) | $60,566 |
| 45 to 64 Years | 971 (35.1%) | $77,470 |
| 65+ Years | 960 (34.7%) | $39,138 |
| Total | 2,763 (100.0%) | $48,542 |
Poverty in St Johnsbury
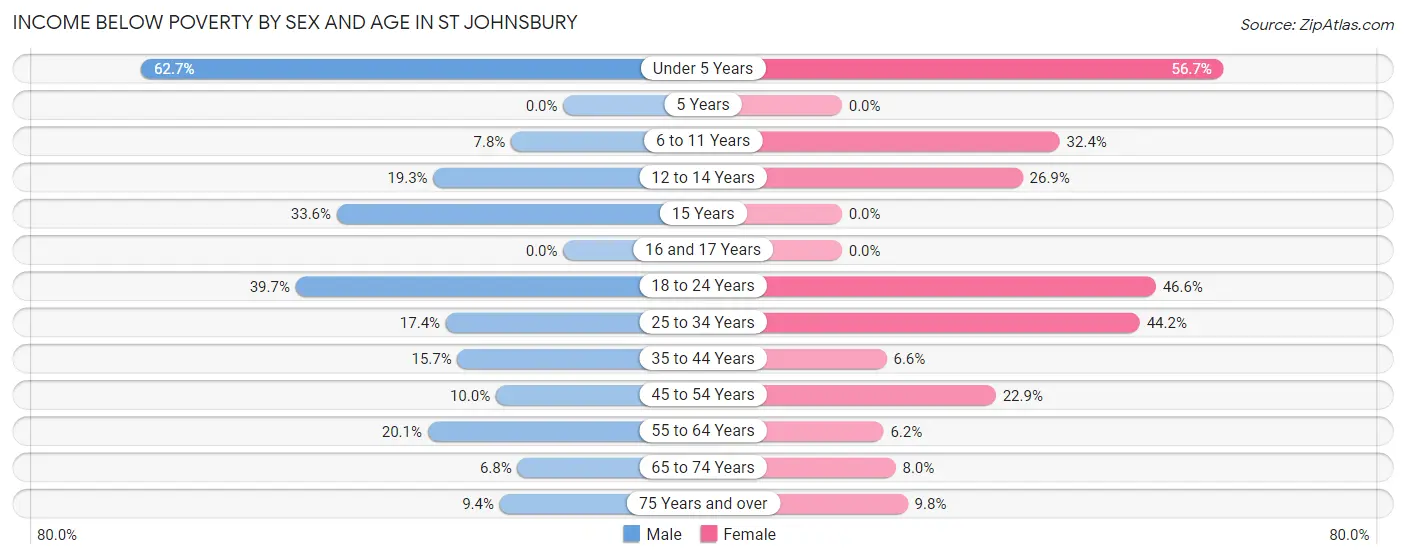
Income Below Poverty by Sex and Age in St Johnsbury
With 18.7% poverty level for males and 19.1% for females among the residents of St Johnsbury, under 5 year old males and under 5 year old females are the most vulnerable to poverty, with 74 males (62.7%) and 55 females (56.7%) in their respective age groups living below the poverty level.
| Age Bracket | Male | Female |
| Under 5 Years | 74 (62.7%) | 55 (56.7%) |
| 5 Years | 0 (0.0%) | 0 (0.0%) |
| 6 to 11 Years | 11 (7.7%) | 33 (32.4%) |
| 12 to 14 Years | 27 (19.3%) | 40 (26.9%) |
| 15 Years | 38 (33.6%) | 0 (0.0%) |
| 16 and 17 Years | 0 (0.0%) | 0 (0.0%) |
| 18 to 24 Years | 122 (39.7%) | 103 (46.6%) |
| 25 to 34 Years | 30 (17.4%) | 96 (44.2%) |
| 35 to 44 Years | 49 (15.7%) | 19 (6.6%) |
| 45 to 54 Years | 33 (10.0%) | 112 (22.9%) |
| 55 to 64 Years | 93 (20.1%) | 26 (6.2%) |
| 65 to 74 Years | 28 (6.8%) | 36 (8.0%) |
| 75 Years and over | 27 (9.4%) | 35 (9.8%) |
| Total | 532 (18.7%) | 555 (19.1%) |
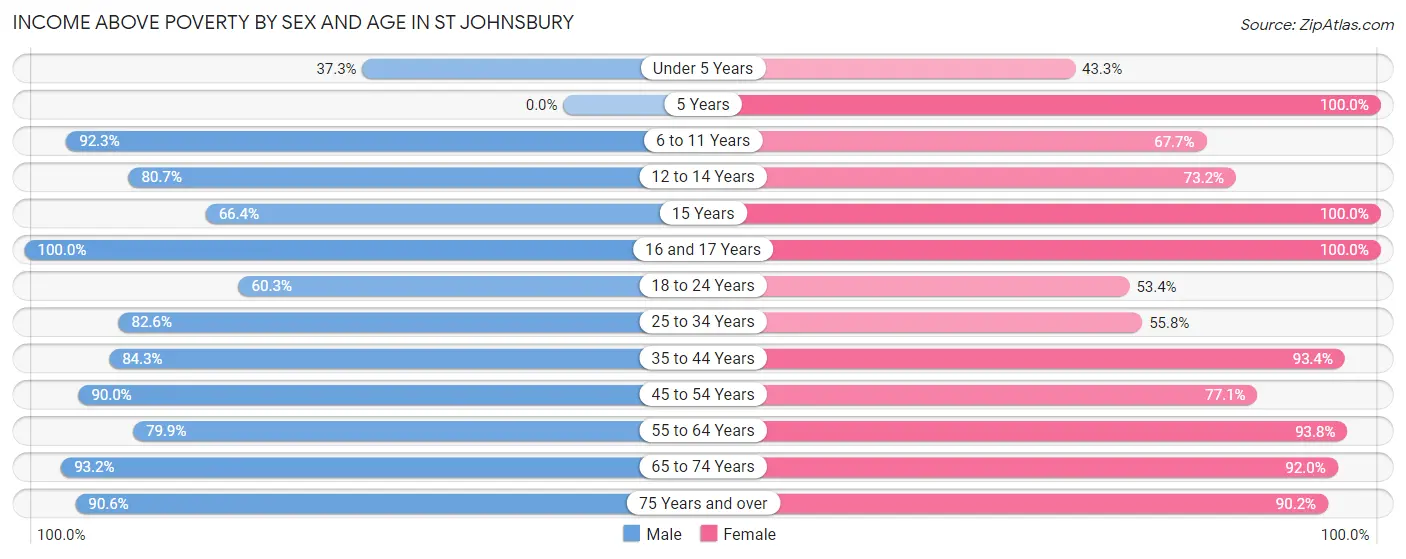
Income Above Poverty by Sex and Age in St Johnsbury
According to the poverty statistics in St Johnsbury, males aged 16 and 17 years and females aged 5 years are the age groups that are most secure financially, with 100.0% of males and 100.0% of females in these age groups living above the poverty line.
| Age Bracket | Male | Female |
| Under 5 Years | 44 (37.3%) | 42 (43.3%) |
| 5 Years | 0 (0.0%) | 29 (100.0%) |
| 6 to 11 Years | 131 (92.2%) | 69 (67.6%) |
| 12 to 14 Years | 113 (80.7%) | 109 (73.2%) |
| 15 Years | 75 (66.4%) | 8 (100.0%) |
| 16 and 17 Years | 55 (100.0%) | 83 (100.0%) |
| 18 to 24 Years | 185 (60.3%) | 118 (53.4%) |
| 25 to 34 Years | 142 (82.6%) | 121 (55.8%) |
| 35 to 44 Years | 263 (84.3%) | 267 (93.4%) |
| 45 to 54 Years | 297 (90.0%) | 378 (77.1%) |
| 55 to 64 Years | 369 (79.9%) | 394 (93.8%) |
| 65 to 74 Years | 384 (93.2%) | 415 (92.0%) |
| 75 Years and over | 259 (90.6%) | 323 (90.2%) |
| Total | 2,317 (81.3%) | 2,356 (80.9%) |
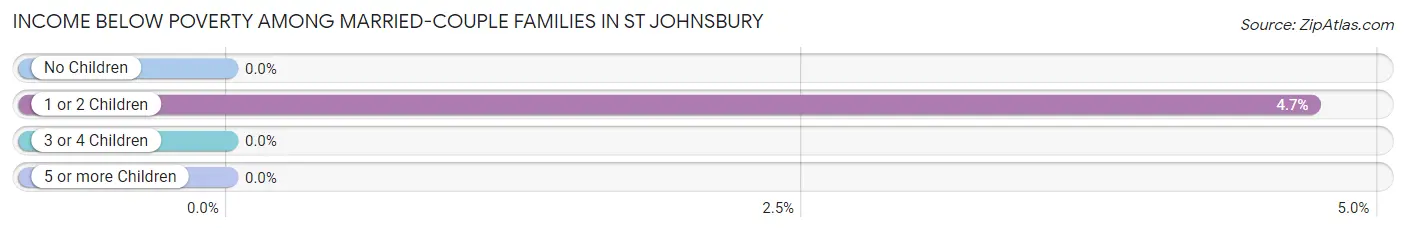
Income Below Poverty Among Married-Couple Families in St Johnsbury
The poverty statistics for married-couple families in St Johnsbury show that 1.4% or 12 of the total 847 families live below the poverty line. Families with 1 or 2 children have the highest poverty rate of 4.7%, comprising of 12 families. On the other hand, families with no children have the lowest poverty rate of 0.0%, which includes 0 families.
| Children | Above Poverty | Below Poverty |
| No Children | 534 (100.0%) | 0 (0.0%) |
| 1 or 2 Children | 243 (95.3%) | 12 (4.7%) |
| 3 or 4 Children | 51 (100.0%) | 0 (0.0%) |
| 5 or more Children | 7 (100.0%) | 0 (0.0%) |
| Total | 835 (98.6%) | 12 (1.4%) |
Income Below Poverty Among Single-Parent Households in St Johnsbury
According to the poverty data in St Johnsbury, 15.3% or 17 single-father households and 38.6% or 157 single-mother households are living below the poverty line. Among single-father households, those with no children have the highest poverty rate, with 17 households (33.3%) experiencing poverty. Likewise, among single-mother households, those with 1 or 2 children have the highest poverty rate, with 152 households (47.2%) falling below the poverty line.
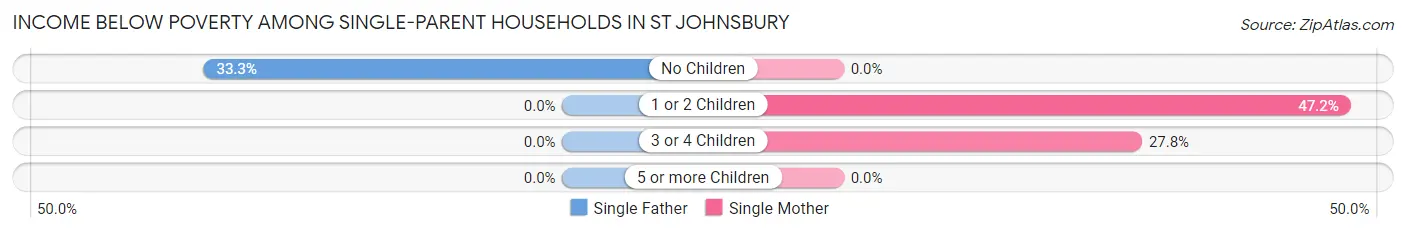
| Children | Single Father | Single Mother |
| No Children | 17 (33.3%) | 0 (0.0%) |
| 1 or 2 Children | 0 (0.0%) | 152 (47.2%) |
| 3 or 4 Children | 0 (0.0%) | 5 (27.8%) |
| 5 or more Children | 0 (0.0%) | 0 (0.0%) |
| Total | 17 (15.3%) | 157 (38.6%) |
Income Below Poverty Among Married-Couple vs Single-Parent Households in St Johnsbury
The poverty data for St Johnsbury shows that 12 of the married-couple family households (1.4%) and 174 of the single-parent households (33.6%) are living below the poverty level. Within the married-couple family households, those with 1 or 2 children have the highest poverty rate, with 12 households (4.7%) falling below the poverty line. Among the single-parent households, those with 1 or 2 children have the highest poverty rate, with 152 household (39.8%) living below poverty.
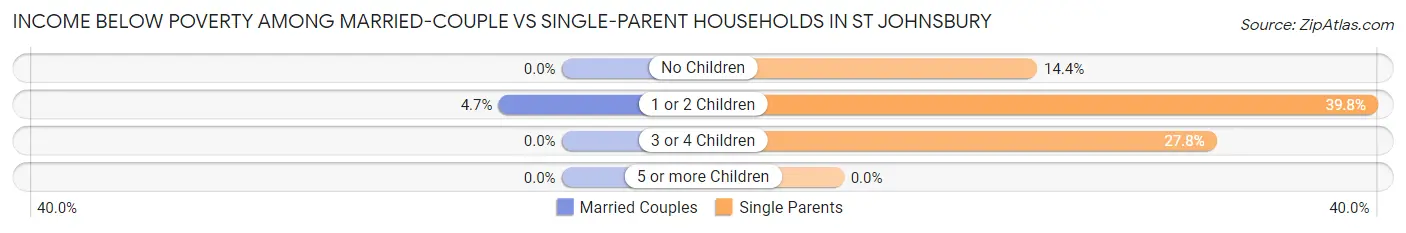
| Children | Married-Couple Families | Single-Parent Households |
| No Children | 0 (0.0%) | 17 (14.4%) |
| 1 or 2 Children | 12 (4.7%) | 152 (39.8%) |
| 3 or 4 Children | 0 (0.0%) | 5 (27.8%) |
| 5 or more Children | 0 (0.0%) | 0 (0.0%) |
| Total | 12 (1.4%) | 174 (33.6%) |
Race in St Johnsbury
The most populous races in St Johnsbury are White / Caucasian (5,534 | 92.8%), Two or more Races (189 | 3.2%), and Some other Race (143 | 2.4%).
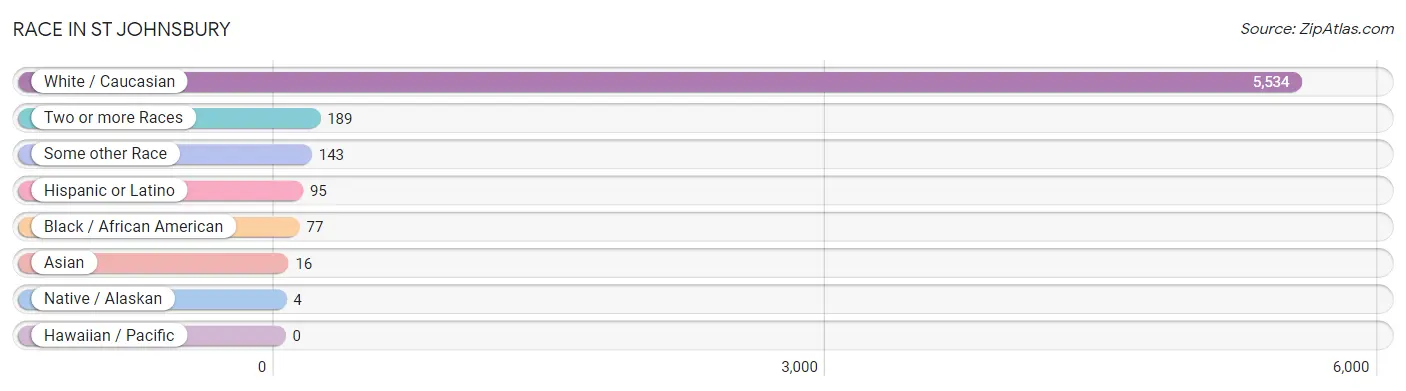
| Race | # Population | % Population |
| Asian | 16 | 0.3% |
| Black / African American | 77 | 1.3% |
| Hawaiian / Pacific | 0 | 0.0% |
| Hispanic or Latino | 95 | 1.6% |
| Native / Alaskan | 4 | 0.1% |
| White / Caucasian | 5,534 | 92.8% |
| Two or more Races | 189 | 3.2% |
| Some other Race | 143 | 2.4% |
| Total | 5,963 | 100.0% |
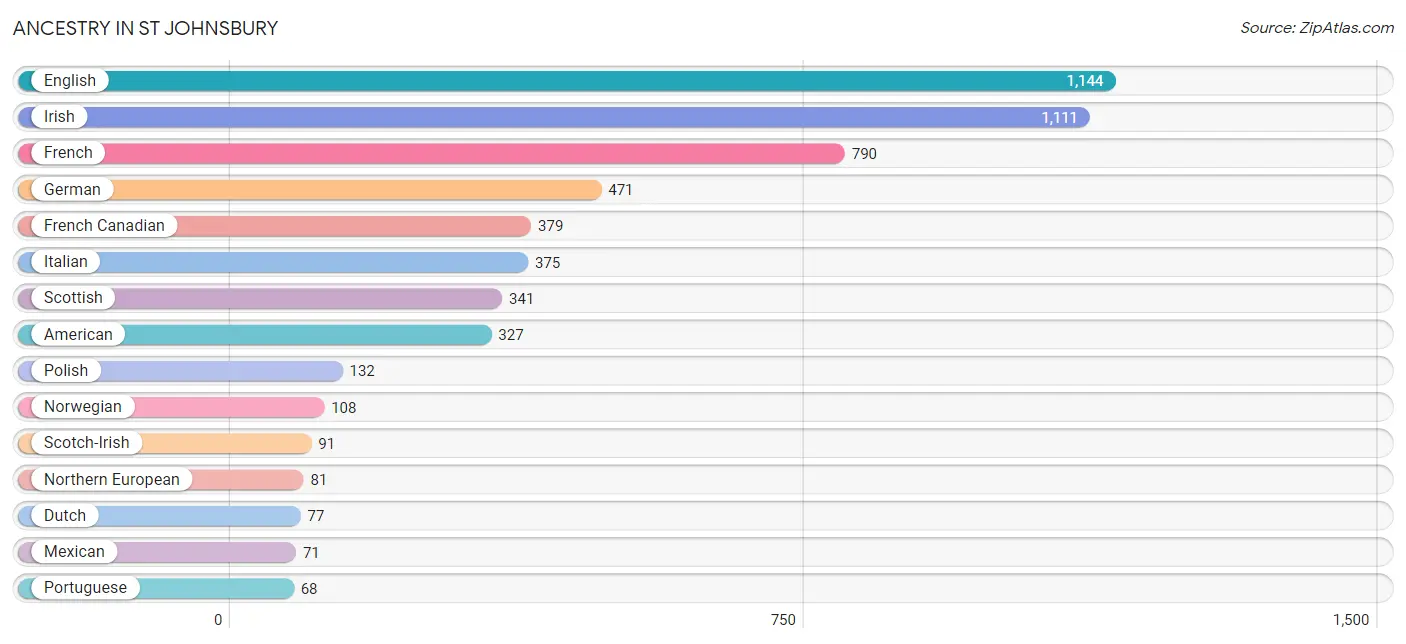
Ancestry in St Johnsbury
The most populous ancestries reported in St Johnsbury are English (1,144 | 19.2%), Irish (1,111 | 18.6%), French (790 | 13.3%), German (471 | 7.9%), and French Canadian (379 | 6.4%), together accounting for 65.3% of all St Johnsbury residents.
| Ancestry | # Population | % Population |
| African | 27 | 0.4% |
| American | 327 | 5.5% |
| Arab | 13 | 0.2% |
| Belgian | 20 | 0.3% |
| Bhutanese | 23 | 0.4% |
| British | 25 | 0.4% |
| Canadian | 43 | 0.7% |
| Cherokee | 29 | 0.5% |
| Choctaw | 9 | 0.2% |
| Croatian | 7 | 0.1% |
| Czech | 24 | 0.4% |
| Dominican | 9 | 0.2% |
| Dutch | 77 | 1.3% |
| English | 1,144 | 19.2% |
| Ethiopian | 10 | 0.2% |
| European | 52 | 0.9% |
| Finnish | 55 | 0.9% |
| French | 790 | 13.3% |
| French American Indian | 28 | 0.5% |
| French Canadian | 379 | 6.4% |
| German | 471 | 7.9% |
| Greek | 10 | 0.2% |
| Hungarian | 23 | 0.4% |
| Irish | 1,111 | 18.6% |
| Italian | 375 | 6.3% |
| Japanese | 12 | 0.2% |
| Korean | 4 | 0.1% |
| Lebanese | 13 | 0.2% |
| Lithuanian | 62 | 1.0% |
| Mexican | 71 | 1.2% |
| Native Hawaiian | 23 | 0.4% |
| Navajo | 25 | 0.4% |
| Northern European | 81 | 1.4% |
| Norwegian | 108 | 1.8% |
| Polish | 132 | 2.2% |
| Portuguese | 68 | 1.1% |
| Pueblo | 25 | 0.4% |
| Puerto Rican | 15 | 0.3% |
| Russian | 39 | 0.6% |
| Scandinavian | 15 | 0.3% |
| Scotch-Irish | 91 | 1.5% |
| Scottish | 341 | 5.7% |
| Serbian | 13 | 0.2% |
| Subsaharan African | 37 | 0.6% |
| Swedish | 40 | 0.7% |
| Swiss | 14 | 0.2% |
| Thai | 23 | 0.4% |
| Welsh | 57 | 1.0% |
| West Indian | 9 | 0.2% | View All 49 Rows |
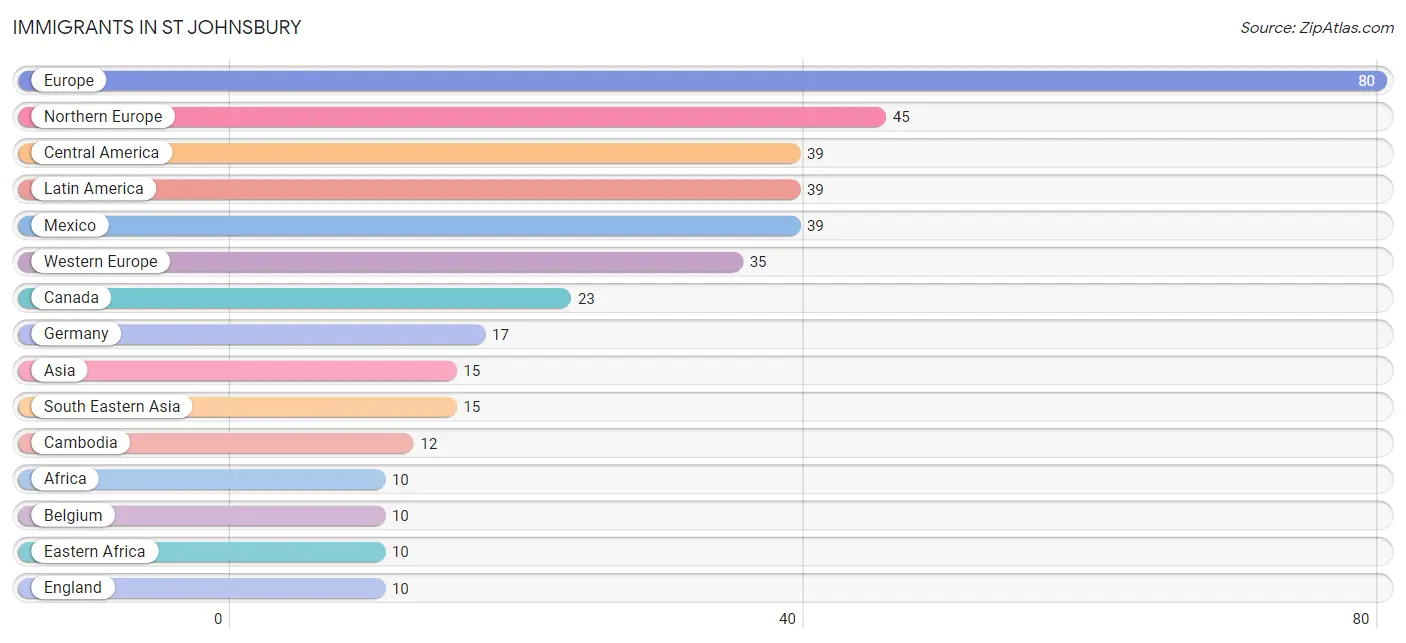
Immigrants in St Johnsbury
The most numerous immigrant groups reported in St Johnsbury came from Europe (80 | 1.3%), Northern Europe (45 | 0.7%), Central America (39 | 0.6%), Latin America (39 | 0.6%), and Mexico (39 | 0.6%), together accounting for 4.0% of all St Johnsbury residents.
| Immigration Origin | # Population | % Population |
| Africa | 10 | 0.2% |
| Asia | 15 | 0.3% |
| Belgium | 10 | 0.2% |
| Cambodia | 12 | 0.2% |
| Canada | 23 | 0.4% |
| Central America | 39 | 0.6% |
| Eastern Africa | 10 | 0.2% |
| England | 10 | 0.2% |
| Ethiopia | 10 | 0.2% |
| Europe | 80 | 1.3% |
| Germany | 17 | 0.3% |
| Latin America | 39 | 0.6% |
| Mexico | 39 | 0.6% |
| Northern Europe | 45 | 0.7% |
| Philippines | 3 | 0.1% |
| South Eastern Asia | 15 | 0.3% |
| Switzerland | 8 | 0.1% |
| Western Europe | 35 | 0.6% | View All 18 Rows |
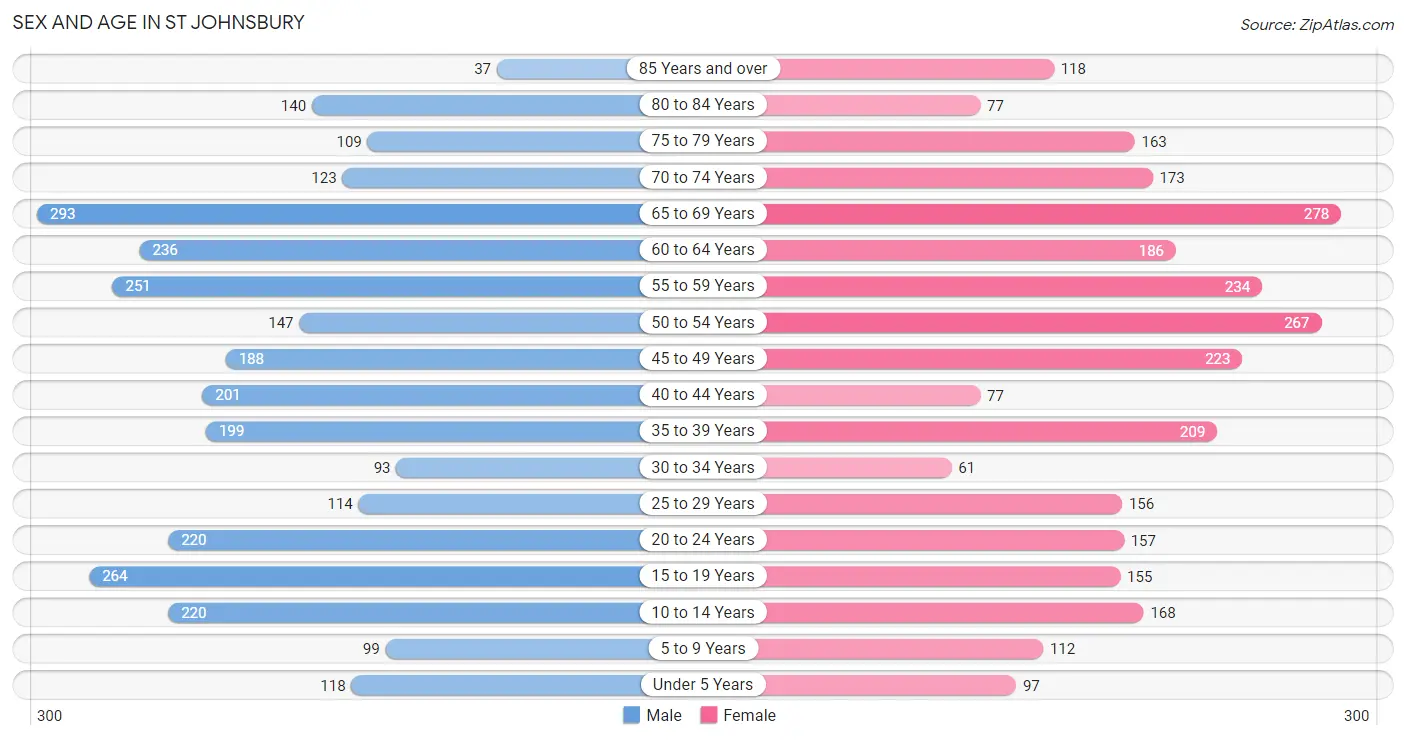
Sex and Age in St Johnsbury
Sex and Age in St Johnsbury
The most populous age groups in St Johnsbury are 65 to 69 Years (293 | 9.6%) for men and 65 to 69 Years (278 | 9.6%) for women.
| Age Bracket | Male | Female |
| Under 5 Years | 118 (3.9%) | 97 (3.3%) |
| 5 to 9 Years | 99 (3.2%) | 112 (3.8%) |
| 10 to 14 Years | 220 (7.2%) | 168 (5.8%) |
| 15 to 19 Years | 264 (8.6%) | 155 (5.3%) |
| 20 to 24 Years | 220 (7.2%) | 157 (5.4%) |
| 25 to 29 Years | 114 (3.7%) | 156 (5.4%) |
| 30 to 34 Years | 93 (3.0%) | 61 (2.1%) |
| 35 to 39 Years | 199 (6.5%) | 209 (7.2%) |
| 40 to 44 Years | 201 (6.6%) | 77 (2.6%) |
| 45 to 49 Years | 188 (6.2%) | 223 (7.7%) |
| 50 to 54 Years | 147 (4.8%) | 267 (9.2%) |
| 55 to 59 Years | 251 (8.2%) | 234 (8.0%) |
| 60 to 64 Years | 236 (7.7%) | 186 (6.4%) |
| 65 to 69 Years | 293 (9.6%) | 278 (9.6%) |
| 70 to 74 Years | 123 (4.0%) | 173 (5.9%) |
| 75 to 79 Years | 109 (3.6%) | 163 (5.6%) |
| 80 to 84 Years | 140 (4.6%) | 77 (2.6%) |
| 85 Years and over | 37 (1.2%) | 118 (4.1%) |
| Total | 3,052 (100.0%) | 2,911 (100.0%) |
Families and Households in St Johnsbury
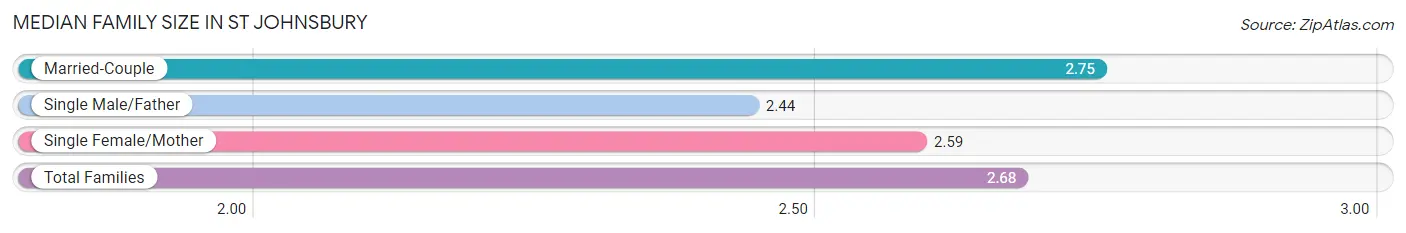
Median Family Size in St Johnsbury
The median family size in St Johnsbury is 2.68 persons per family, with married-couple families (847 | 62.1%) accounting for the largest median family size of 2.75 persons per family. On the other hand, single male/father families (111 | 8.1%) represent the smallest median family size with 2.44 persons per family.
| Family Type | # Families | Family Size |
| Married-Couple | 847 (62.1%) | 2.75 |
| Single Male/Father | 111 (8.1%) | 2.44 |
| Single Female/Mother | 407 (29.8%) | 2.59 |
| Total Families | 1,365 (100.0%) | 2.68 |
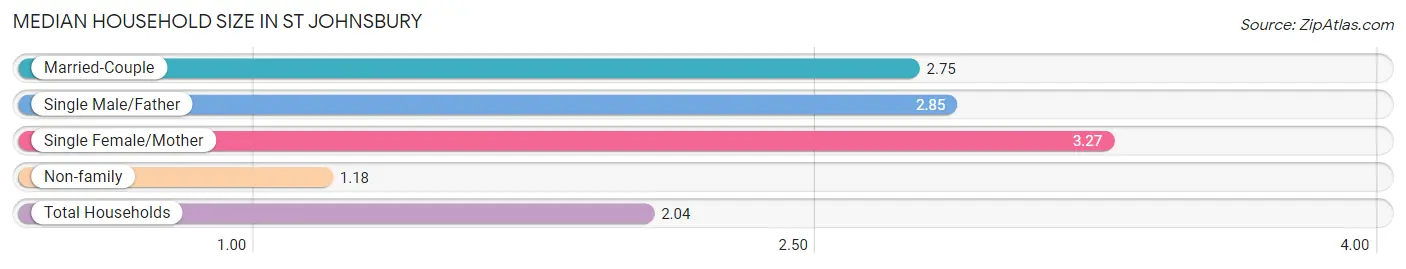
Median Household Size in St Johnsbury
The median household size in St Johnsbury is 2.04 persons per household, with single female/mother households (407 | 14.7%) accounting for the largest median household size of 3.27 persons per household. non-family households (1,398 | 50.6%) represent the smallest median household size with 1.18 persons per household.
| Household Type | # Households | Household Size |
| Married-Couple | 847 (30.7%) | 2.75 |
| Single Male/Father | 111 (4.0%) | 2.85 |
| Single Female/Mother | 407 (14.7%) | 3.27 |
| Non-family | 1,398 (50.6%) | 1.18 |
| Total Households | 2,763 (100.0%) | 2.04 |
Household Size by Marriage Status in St Johnsbury
Out of a total of 2,763 households in St Johnsbury, 1,365 (49.4%) are family households, while 1,398 (50.6%) are nonfamily households. The most numerous type of family households are 2-person households, comprising 670, and the most common type of nonfamily households are 1-person households, comprising 1,210.
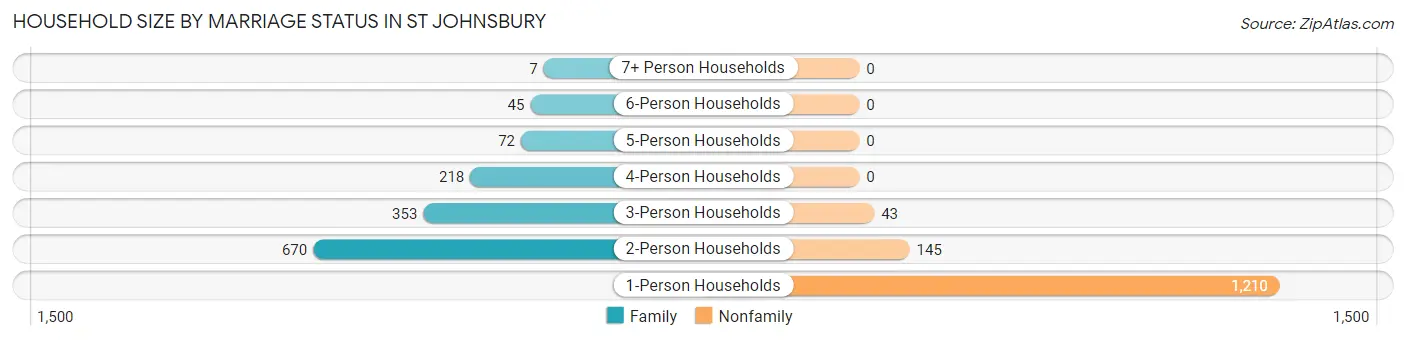
| Household Size | Family Households | Nonfamily Households |
| 1-Person Households | - | 1,210 (43.8%) |
| 2-Person Households | 670 (24.2%) | 145 (5.2%) |
| 3-Person Households | 353 (12.8%) | 43 (1.6%) |
| 4-Person Households | 218 (7.9%) | 0 (0.0%) |
| 5-Person Households | 72 (2.6%) | 0 (0.0%) |
| 6-Person Households | 45 (1.6%) | 0 (0.0%) |
| 7+ Person Households | 7 (0.3%) | 0 (0.0%) |
| Total | 1,365 (49.4%) | 1,398 (50.6%) |
Female Fertility in St Johnsbury
Fertility by Age in St Johnsbury
Average fertility rate in St Johnsbury is 39.0 births per 1,000 women. Women in the age bracket of 20 to 34 years have the highest fertility rate with 115.0 births per 1,000 women. Women in the age bracket of 20 to 34 years acount for 100.0% of all women with births.
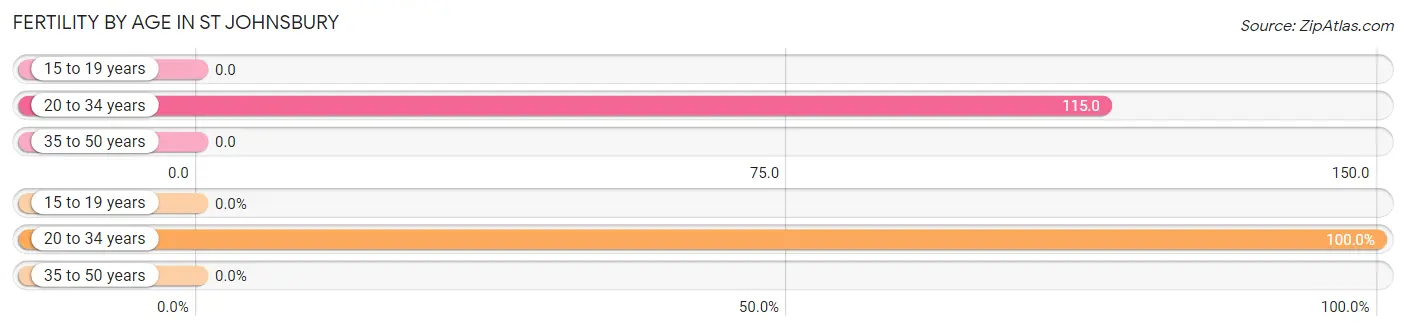
| Age Bracket | Women with Births | Births / 1,000 Women |
| 15 to 19 years | 0 (0.0%) | 0.0 |
| 20 to 34 years | 43 (100.0%) | 115.0 |
| 35 to 50 years | 0 (0.0%) | 0.0 |
| Total | 43 (100.0%) | 39.0 |
Fertility by Age by Marriage Status in St Johnsbury
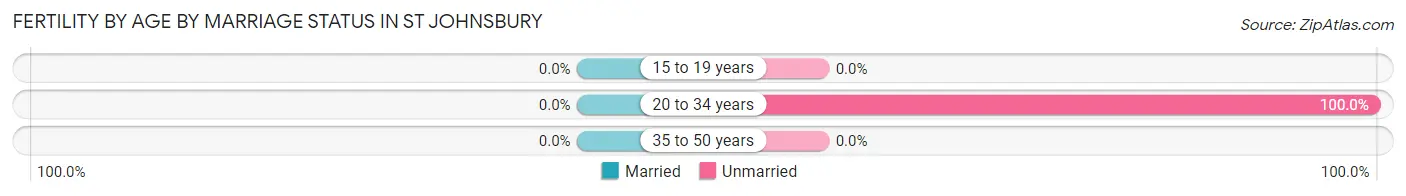
| Age Bracket | Married | Unmarried |
| 15 to 19 years | 0 (0.0%) | 0 (0.0%) |
| 20 to 34 years | 0 (0.0%) | 43 (100.0%) |
| 35 to 50 years | 0 (0.0%) | 0 (0.0%) |
| Total | 0 (0.0%) | 43 (100.0%) |
Fertility by Education in St Johnsbury
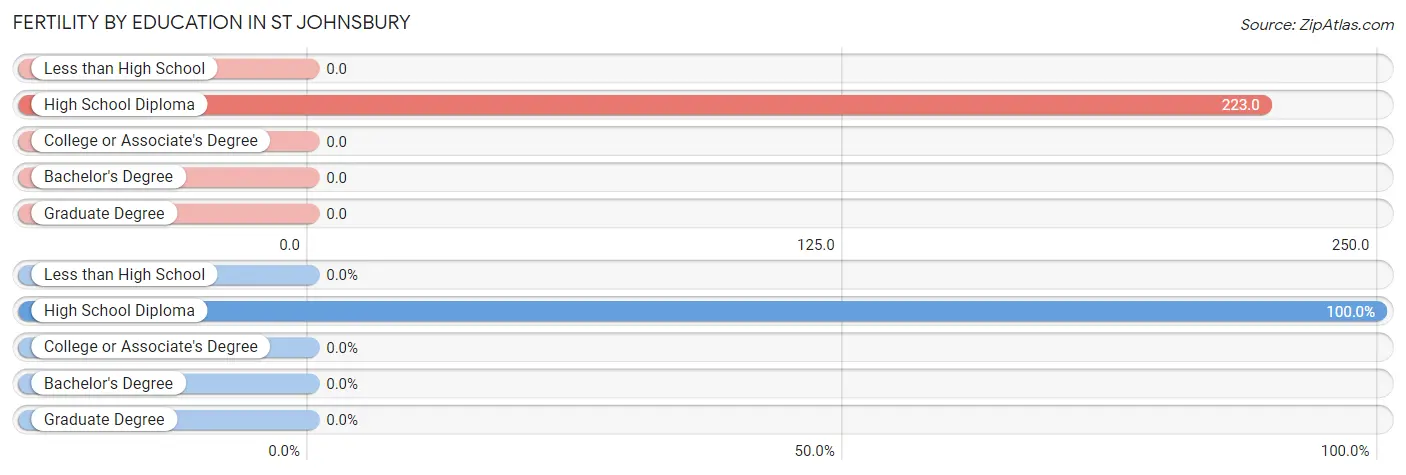
| Educational Attainment | Women with Births | Births / 1,000 Women |
| Less than High School | 0 (0.0%) | 0.0 |
| High School Diploma | 43 (100.0%) | 223.0 |
| College or Associate's Degree | 0 (0.0%) | 0.0 |
| Bachelor's Degree | 0 (0.0%) | 0.0 |
| Graduate Degree | 0 (0.0%) | 0.0 |
| Total | 43 (100.0%) | 39.0 |
Fertility by Education by Marriage Status in St Johnsbury
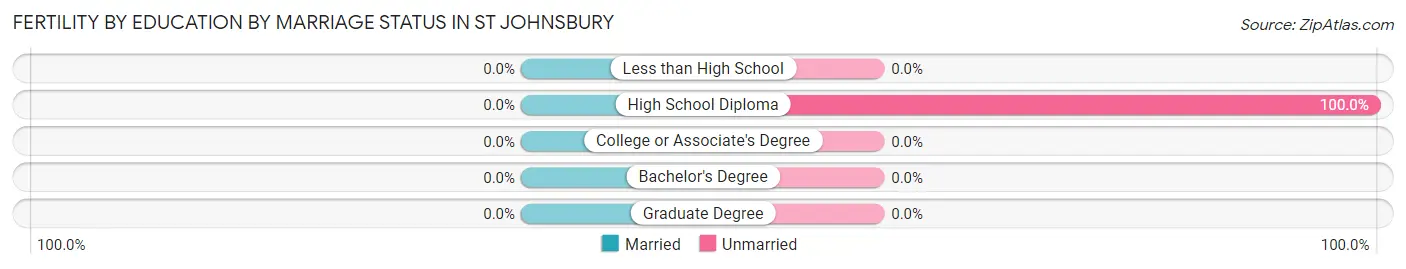
| Educational Attainment | Married | Unmarried |
| Less than High School | 0 (0.0%) | 0 (0.0%) |
| High School Diploma | 0 (0.0%) | 43 (100.0%) |
| College or Associate's Degree | 0 (0.0%) | 0 (0.0%) |
| Bachelor's Degree | 0 (0.0%) | 0 (0.0%) |
| Graduate Degree | 0 (0.0%) | 0 (0.0%) |
| Total | 0 (0.0%) | 43 (100.0%) |
Employment Characteristics in St Johnsbury
Employment by Class of Employer in St Johnsbury
Among the 2,826 employed individuals in St Johnsbury, private company employees (1,741 | 61.6%), not-for-profit organizations (457 | 16.2%), and local government employees (356 | 12.6%) make up the most common classes of employment.
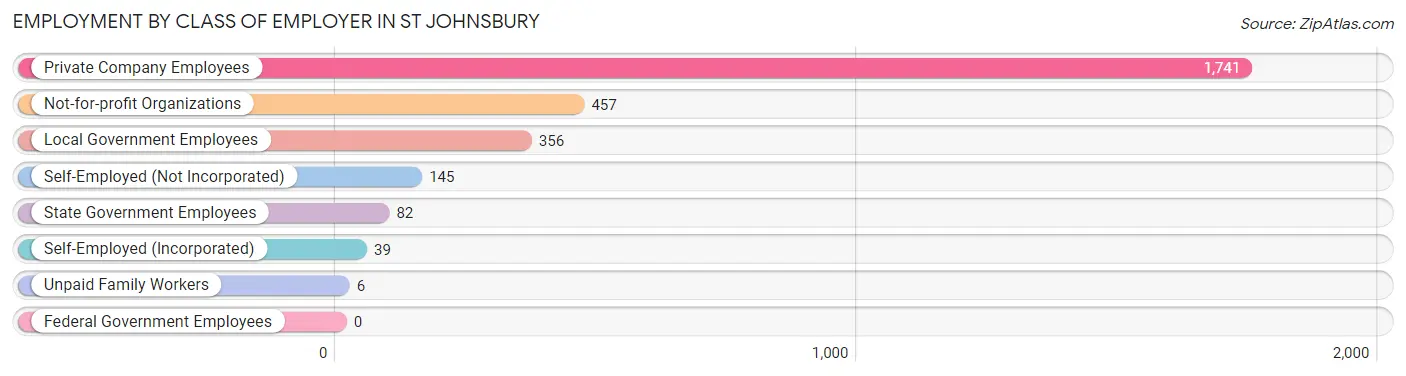
| Employer Class | # Employees | % Employees |
| Private Company Employees | 1,741 | 61.6% |
| Self-Employed (Incorporated) | 39 | 1.4% |
| Self-Employed (Not Incorporated) | 145 | 5.1% |
| Not-for-profit Organizations | 457 | 16.2% |
| Local Government Employees | 356 | 12.6% |
| State Government Employees | 82 | 2.9% |
| Federal Government Employees | 0 | 0.0% |
| Unpaid Family Workers | 6 | 0.2% |
| Total | 2,826 | 100.0% |
Employment Status by Age in St Johnsbury
According to the labor force statistics for St Johnsbury, out of the total population over 16 years of age (5,028), 61.5% or 3,092 individuals are in the labor force, with 4.6% or 142 of them unemployed. The age group with the highest labor force participation rate is 20 to 24 years, with 85.7% or 323 individuals in the labor force. Within the labor force, the 16 to 19 years age range has the highest percentage of unemployed individuals, with 15.7% or 30 of them being unemployed.
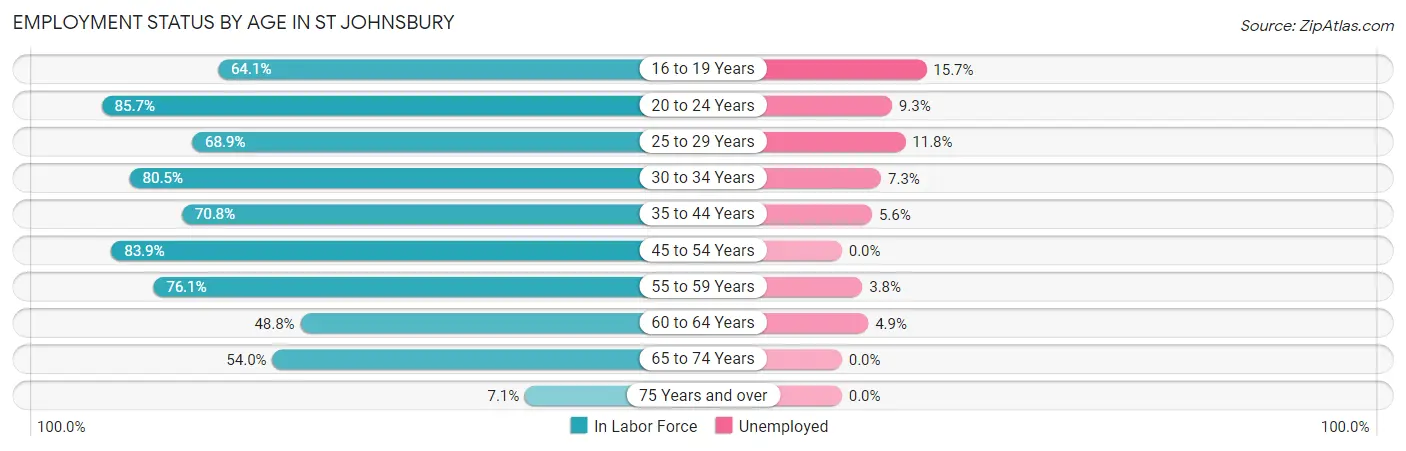
| Age Bracket | In Labor Force | Unemployed |
| 16 to 19 Years | 191 (64.1%) | 30 (15.7%) |
| 20 to 24 Years | 323 (85.7%) | 30 (9.3%) |
| 25 to 29 Years | 186 (68.9%) | 22 (11.8%) |
| 30 to 34 Years | 124 (80.5%) | 9 (7.3%) |
| 35 to 44 Years | 486 (70.8%) | 27 (5.6%) |
| 45 to 54 Years | 692 (83.9%) | 0 (0.0%) |
| 55 to 59 Years | 369 (76.1%) | 14 (3.8%) |
| 60 to 64 Years | 206 (48.8%) | 10 (4.9%) |
| 65 to 74 Years | 468 (54.0%) | 0 (0.0%) |
| 75 Years and over | 46 (7.1%) | 0 (0.0%) |
| Total | 3,092 (61.5%) | 142 (4.6%) |
Employment Status by Educational Attainment in St Johnsbury
According to labor force statistics for St Johnsbury, 72.6% of individuals (2,063) out of the total population between 25 and 64 years of age (2,842) are in the labor force, with 4.0% or 83 of them being unemployed. The group with the highest labor force participation rate are those with the educational attainment of bachelor's degree or higher, with 88.9% or 804 individuals in the labor force. Within the labor force, individuals with less than high school education have the highest percentage of unemployment, with 18.6% or 22 of them being unemployed.
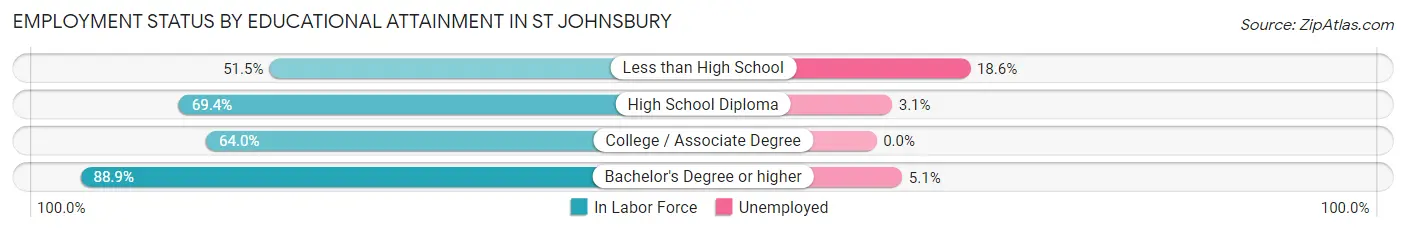
| Educational Attainment | In Labor Force | Unemployed |
| Less than High School | 118 (51.5%) | 43 (18.6%) |
| High School Diploma | 607 (69.4%) | 27 (3.1%) |
| College / Associate Degree | 534 (64.0%) | 0 (0.0%) |
| Bachelor's Degree or higher | 804 (88.9%) | 46 (5.1%) |
| Total | 2,063 (72.6%) | 114 (4.0%) |
Employment Occupations by Sex in St Johnsbury
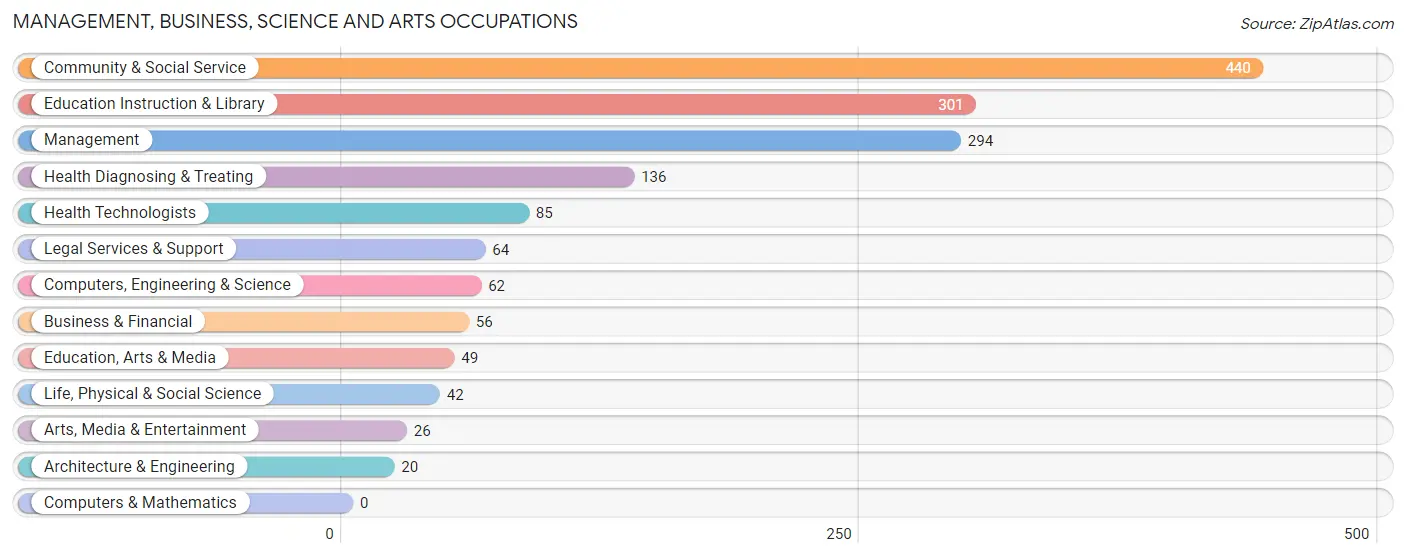
Management, Business, Science and Arts Occupations
The most common Management, Business, Science and Arts occupations in St Johnsbury are Community & Social Service (440 | 14.9%), Education Instruction & Library (301 | 10.2%), Management (294 | 10.0%), Health Diagnosing & Treating (136 | 4.6%), and Health Technologists (85 | 2.9%).
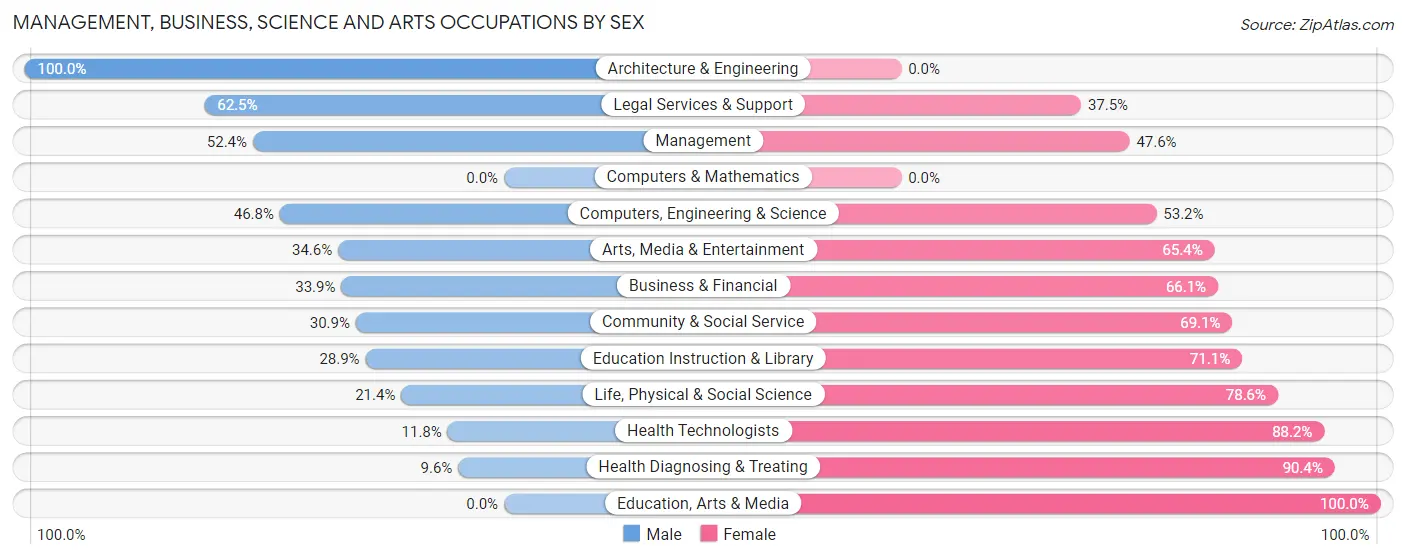
Management, Business, Science and Arts Occupations by Sex
Within the Management, Business, Science and Arts occupations in St Johnsbury, the most male-oriented occupations are Architecture & Engineering (100.0%), Legal Services & Support (62.5%), and Management (52.4%), while the most female-oriented occupations are Education, Arts & Media (100.0%), Health Diagnosing & Treating (90.4%), and Health Technologists (88.2%).
| Occupation | Male | Female |
| Management | 154 (52.4%) | 140 (47.6%) |
| Business & Financial | 19 (33.9%) | 37 (66.1%) |
| Computers, Engineering & Science | 29 (46.8%) | 33 (53.2%) |
| Computers & Mathematics | 0 (0.0%) | 0 (0.0%) |
| Architecture & Engineering | 20 (100.0%) | 0 (0.0%) |
| Life, Physical & Social Science | 9 (21.4%) | 33 (78.6%) |
| Community & Social Service | 136 (30.9%) | 304 (69.1%) |
| Education, Arts & Media | 0 (0.0%) | 49 (100.0%) |
| Legal Services & Support | 40 (62.5%) | 24 (37.5%) |
| Education Instruction & Library | 87 (28.9%) | 214 (71.1%) |
| Arts, Media & Entertainment | 9 (34.6%) | 17 (65.4%) |
| Health Diagnosing & Treating | 13 (9.6%) | 123 (90.4%) |
| Health Technologists | 10 (11.8%) | 75 (88.2%) |
| Total (Category) | 351 (35.5%) | 637 (64.5%) |
| Total (Overall) | 1,474 (50.0%) | 1,475 (50.0%) |
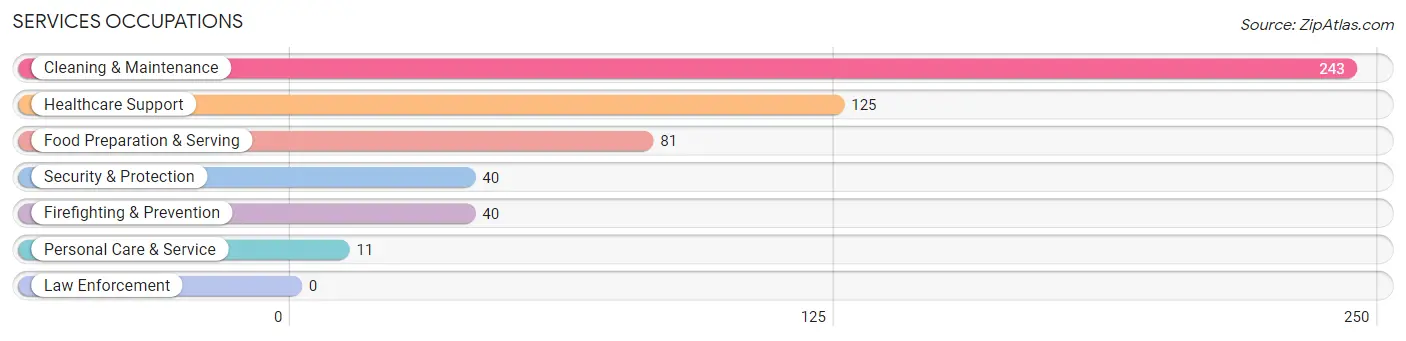
Services Occupations
The most common Services occupations in St Johnsbury are Cleaning & Maintenance (243 | 8.2%), Healthcare Support (125 | 4.2%), Food Preparation & Serving (81 | 2.8%), Security & Protection (40 | 1.4%), and Firefighting & Prevention (40 | 1.4%).
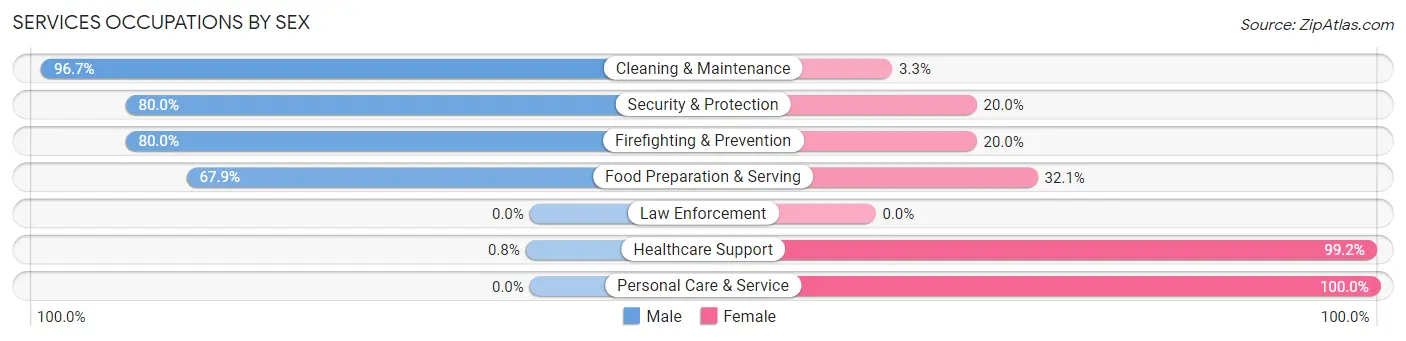
Services Occupations by Sex
Within the Services occupations in St Johnsbury, the most male-oriented occupations are Cleaning & Maintenance (96.7%), Security & Protection (80.0%), and Firefighting & Prevention (80.0%), while the most female-oriented occupations are Personal Care & Service (100.0%), Healthcare Support (99.2%), and Food Preparation & Serving (32.1%).
| Occupation | Male | Female |
| Healthcare Support | 1 (0.8%) | 124 (99.2%) |
| Security & Protection | 32 (80.0%) | 8 (20.0%) |
| Firefighting & Prevention | 32 (80.0%) | 8 (20.0%) |
| Law Enforcement | 0 (0.0%) | 0 (0.0%) |
| Food Preparation & Serving | 55 (67.9%) | 26 (32.1%) |
| Cleaning & Maintenance | 235 (96.7%) | 8 (3.3%) |
| Personal Care & Service | 0 (0.0%) | 11 (100.0%) |
| Total (Category) | 323 (64.6%) | 177 (35.4%) |
| Total (Overall) | 1,474 (50.0%) | 1,475 (50.0%) |
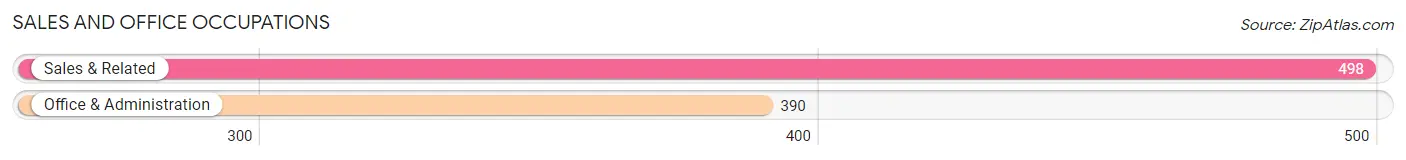
Sales and Office Occupations
The most common Sales and Office occupations in St Johnsbury are Sales & Related (498 | 16.9%), and Office & Administration (390 | 13.2%).
Sales and Office Occupations by Sex
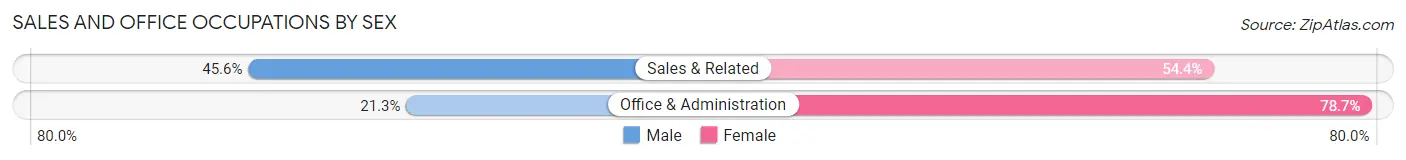
| Occupation | Male | Female |
| Sales & Related | 227 (45.6%) | 271 (54.4%) |
| Office & Administration | 83 (21.3%) | 307 (78.7%) |
| Total (Category) | 310 (34.9%) | 578 (65.1%) |
| Total (Overall) | 1,474 (50.0%) | 1,475 (50.0%) |
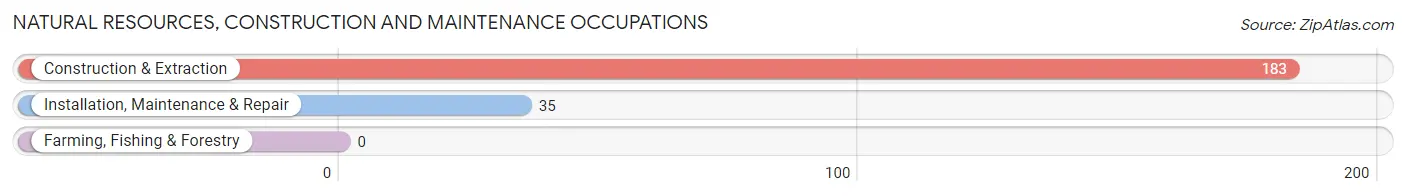
Natural Resources, Construction and Maintenance Occupations
The most common Natural Resources, Construction and Maintenance occupations in St Johnsbury are Construction & Extraction (183 | 6.2%), and Installation, Maintenance & Repair (35 | 1.2%).
Natural Resources, Construction and Maintenance Occupations by Sex
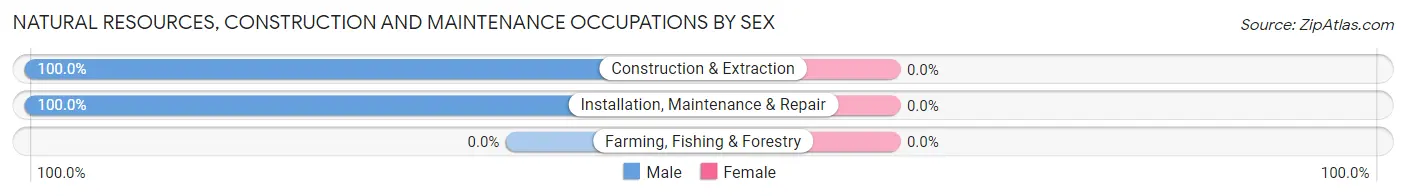
| Occupation | Male | Female |
| Farming, Fishing & Forestry | 0 (0.0%) | 0 (0.0%) |
| Construction & Extraction | 183 (100.0%) | 0 (0.0%) |
| Installation, Maintenance & Repair | 35 (100.0%) | 0 (0.0%) |
| Total (Category) | 218 (100.0%) | 0 (0.0%) |
| Total (Overall) | 1,474 (50.0%) | 1,475 (50.0%) |
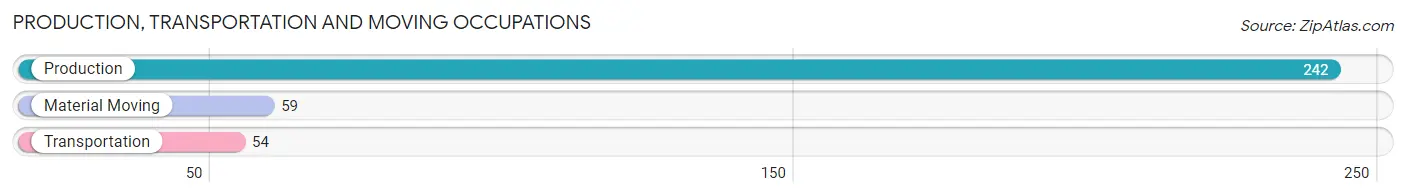
Production, Transportation and Moving Occupations
The most common Production, Transportation and Moving occupations in St Johnsbury are Production (242 | 8.2%), Material Moving (59 | 2.0%), and Transportation (54 | 1.8%).
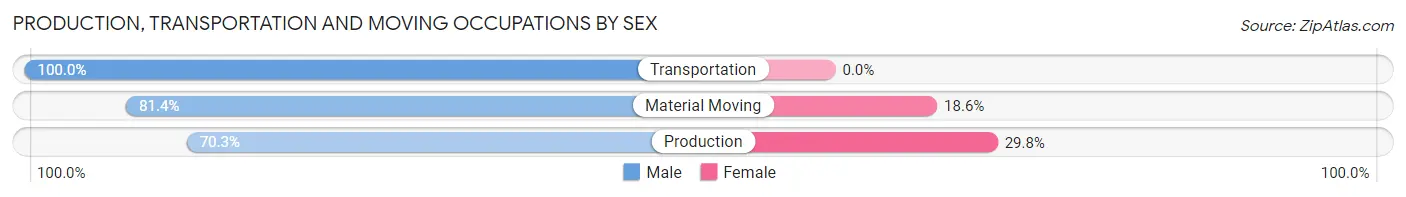
Production, Transportation and Moving Occupations by Sex
| Occupation | Male | Female |
| Production | 170 (70.3%) | 72 (29.7%) |
| Transportation | 54 (100.0%) | 0 (0.0%) |
| Material Moving | 48 (81.4%) | 11 (18.6%) |
| Total (Category) | 272 (76.6%) | 83 (23.4%) |
| Total (Overall) | 1,474 (50.0%) | 1,475 (50.0%) |
Employment Industries by Sex in St Johnsbury
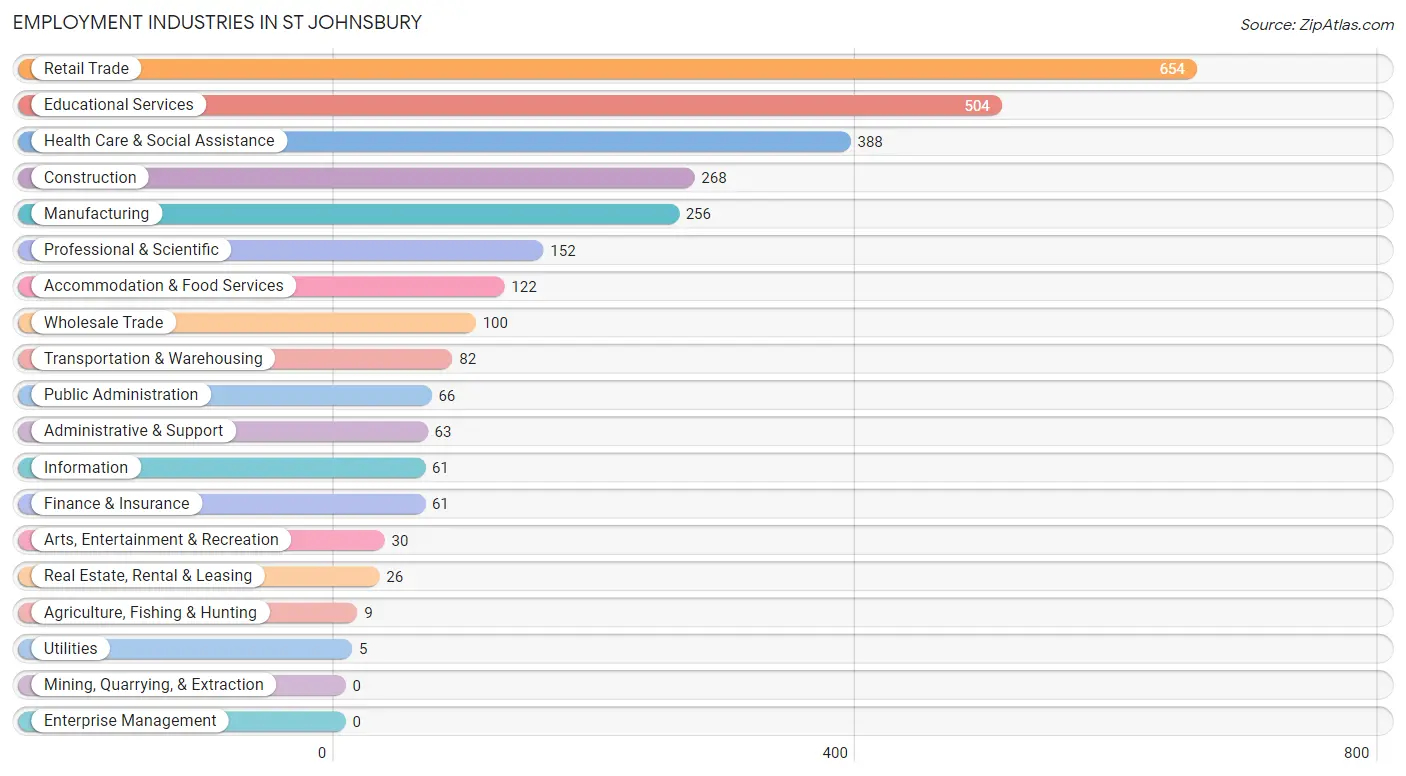
Employment Industries in St Johnsbury
The major employment industries in St Johnsbury include Retail Trade (654 | 22.2%), Educational Services (504 | 17.1%), Health Care & Social Assistance (388 | 13.2%), Construction (268 | 9.1%), and Manufacturing (256 | 8.7%).
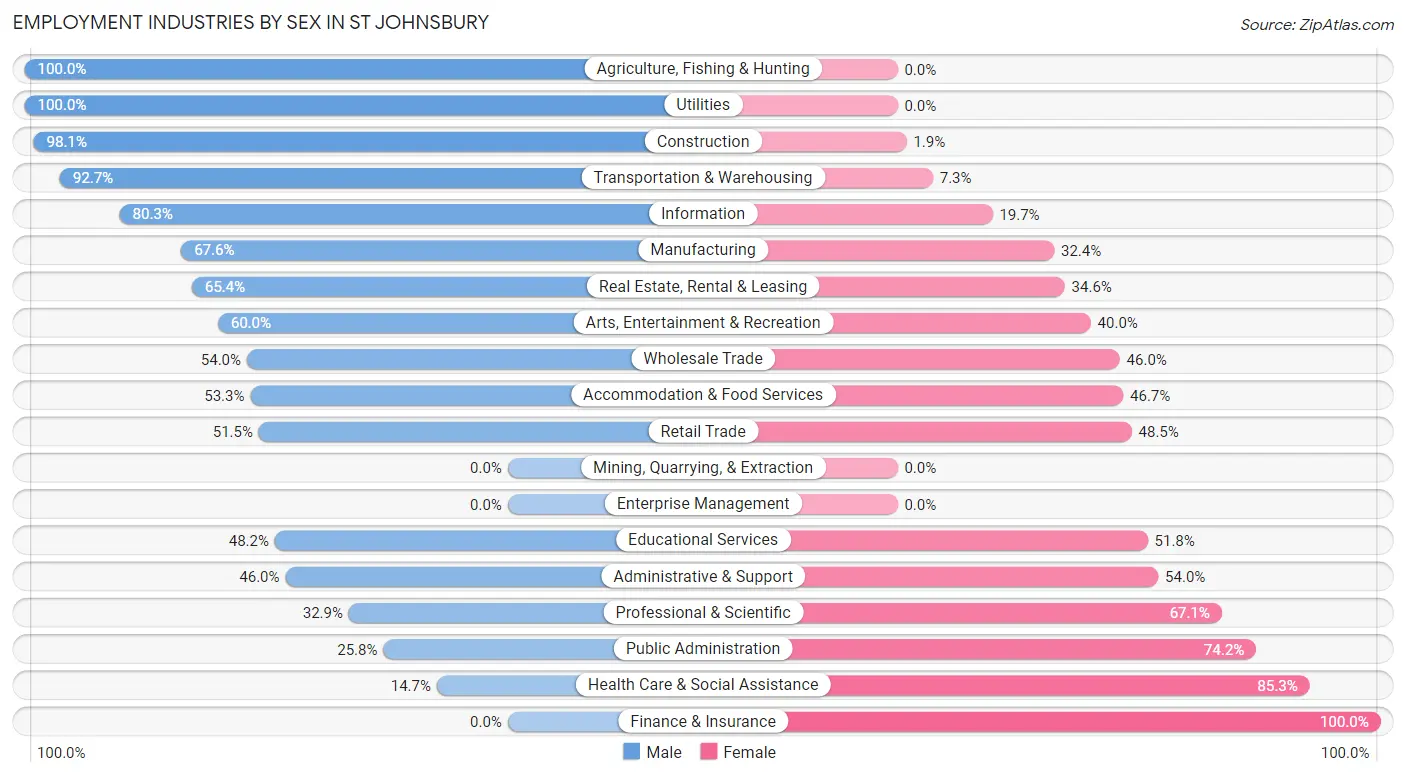
Employment Industries by Sex in St Johnsbury
The St Johnsbury industries that see more men than women are Agriculture, Fishing & Hunting (100.0%), Utilities (100.0%), and Construction (98.1%), whereas the industries that tend to have a higher number of women are Finance & Insurance (100.0%), Health Care & Social Assistance (85.3%), and Public Administration (74.2%).
| Industry | Male | Female |
| Agriculture, Fishing & Hunting | 9 (100.0%) | 0 (0.0%) |
| Mining, Quarrying, & Extraction | 0 (0.0%) | 0 (0.0%) |
| Construction | 263 (98.1%) | 5 (1.9%) |
| Manufacturing | 173 (67.6%) | 83 (32.4%) |
| Wholesale Trade | 54 (54.0%) | 46 (46.0%) |
| Retail Trade | 337 (51.5%) | 317 (48.5%) |
| Transportation & Warehousing | 76 (92.7%) | 6 (7.3%) |
| Utilities | 5 (100.0%) | 0 (0.0%) |
| Information | 49 (80.3%) | 12 (19.7%) |
| Finance & Insurance | 0 (0.0%) | 61 (100.0%) |
| Real Estate, Rental & Leasing | 17 (65.4%) | 9 (34.6%) |
| Professional & Scientific | 50 (32.9%) | 102 (67.1%) |
| Enterprise Management | 0 (0.0%) | 0 (0.0%) |
| Administrative & Support | 29 (46.0%) | 34 (54.0%) |
| Educational Services | 243 (48.2%) | 261 (51.8%) |
| Health Care & Social Assistance | 57 (14.7%) | 331 (85.3%) |
| Arts, Entertainment & Recreation | 18 (60.0%) | 12 (40.0%) |
| Accommodation & Food Services | 65 (53.3%) | 57 (46.7%) |
| Public Administration | 17 (25.8%) | 49 (74.2%) |
| Total | 1,474 (50.0%) | 1,475 (50.0%) |
Education in St Johnsbury
School Enrollment in St Johnsbury
The most common levels of schooling among the 1,288 students in St Johnsbury are high school (388 | 30.1%), middle school (300 | 23.3%), and college / undergraduate (236 | 18.3%).
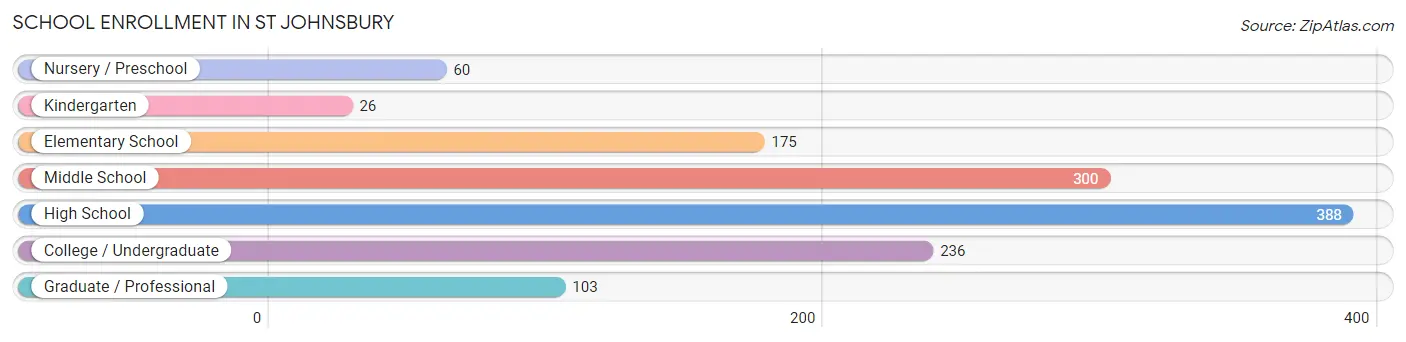
| School Level | # Students | % Students |
| Nursery / Preschool | 60 | 4.7% |
| Kindergarten | 26 | 2.0% |
| Elementary School | 175 | 13.6% |
| Middle School | 300 | 23.3% |
| High School | 388 | 30.1% |
| College / Undergraduate | 236 | 18.3% |
| Graduate / Professional | 103 | 8.0% |
| Total | 1,288 | 100.0% |
School Enrollment by Age by Funding Source in St Johnsbury
Out of a total of 1,288 students who are enrolled in schools in St Johnsbury, 380 (29.5%) attend a private institution, while the remaining 908 (70.5%) are enrolled in public schools. The age group of 10 to 14 year olds has the highest likelihood of being enrolled in private schools, with 183 (47.2% in the age bracket) enrolled. Conversely, the age group of 18 to 19 year olds has the lowest likelihood of being enrolled in a private school, with 106 (100.0% in the age bracket) attending a public institution.
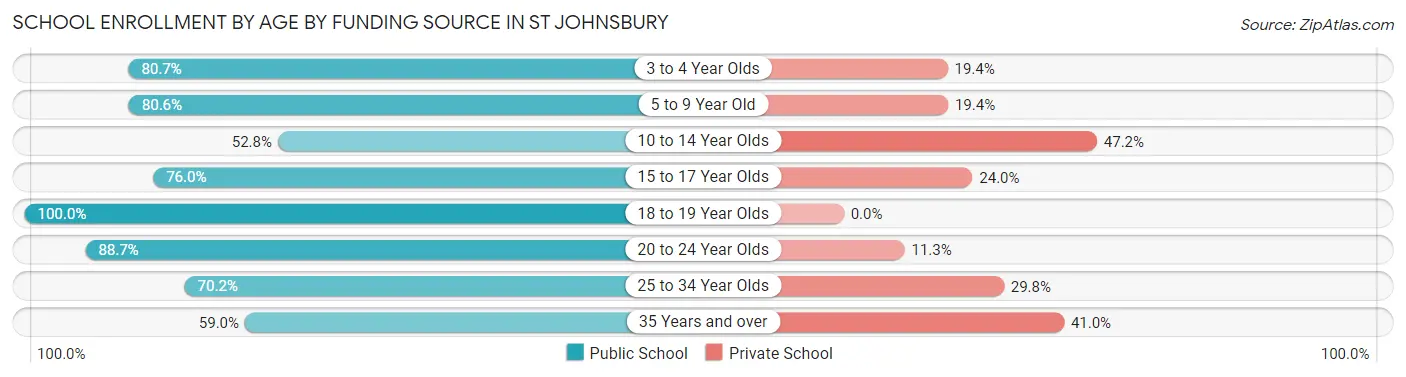
| Age Bracket | Public School | Private School |
| 3 to 4 Year Olds | 25 (80.6%) | 6 (19.4%) |
| 5 to 9 Year Old | 170 (80.6%) | 41 (19.4%) |
| 10 to 14 Year Olds | 205 (52.8%) | 183 (47.2%) |
| 15 to 17 Year Olds | 184 (76.0%) | 58 (24.0%) |
| 18 to 19 Year Olds | 106 (100.0%) | 0 (0.0%) |
| 20 to 24 Year Olds | 86 (88.7%) | 11 (11.3%) |
| 25 to 34 Year Olds | 40 (70.2%) | 17 (29.8%) |
| 35 Years and over | 92 (59.0%) | 64 (41.0%) |
| Total | 908 (70.5%) | 380 (29.5%) |
Educational Attainment by Field of Study in St Johnsbury
Education (249 | 16.1%), social sciences (167 | 10.8%), business (147 | 9.5%), science & technology (141 | 9.1%), and visual & performing arts (129 | 8.3%) are the most common fields of study among 1,551 individuals in St Johnsbury who have obtained a bachelor's degree or higher.
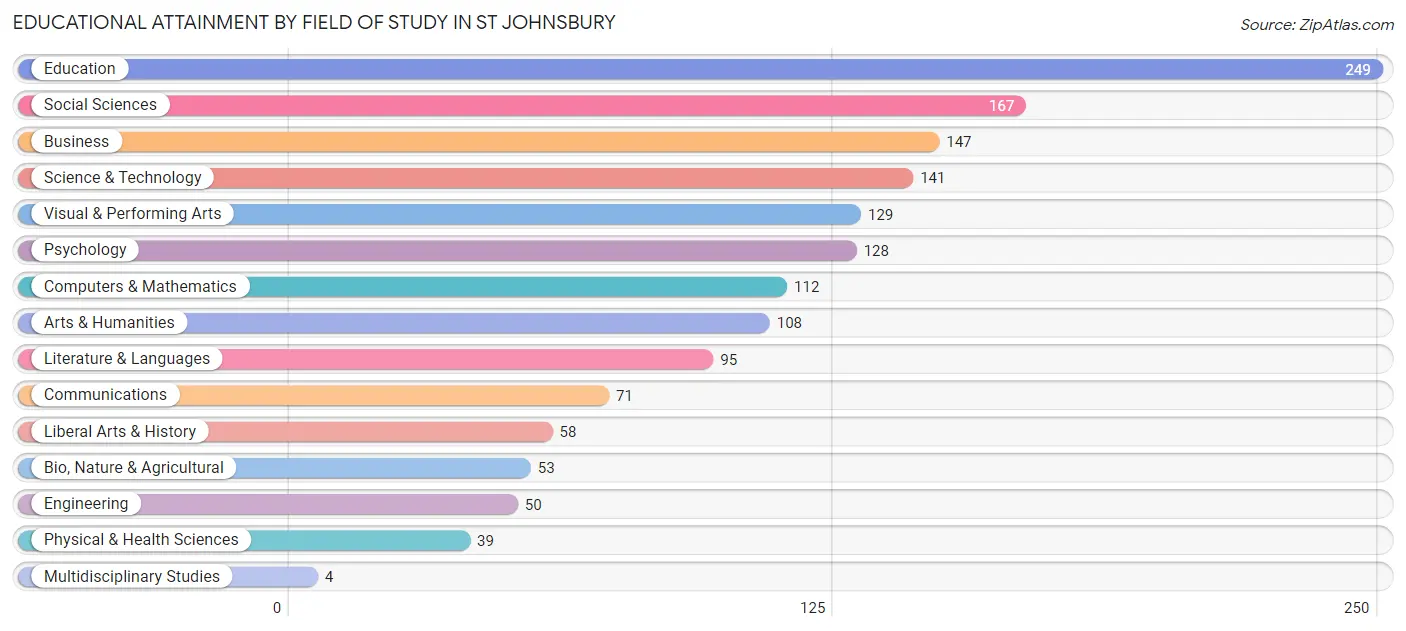
| Field of Study | # Graduates | % Graduates |
| Computers & Mathematics | 112 | 7.2% |
| Bio, Nature & Agricultural | 53 | 3.4% |
| Physical & Health Sciences | 39 | 2.5% |
| Psychology | 128 | 8.3% |
| Social Sciences | 167 | 10.8% |
| Engineering | 50 | 3.2% |
| Multidisciplinary Studies | 4 | 0.3% |
| Science & Technology | 141 | 9.1% |
| Business | 147 | 9.5% |
| Education | 249 | 16.1% |
| Literature & Languages | 95 | 6.1% |
| Liberal Arts & History | 58 | 3.7% |
| Visual & Performing Arts | 129 | 8.3% |
| Communications | 71 | 4.6% |
| Arts & Humanities | 108 | 7.0% |
| Total | 1,551 | 100.0% |
Transportation & Commute in St Johnsbury
Vehicle Availability by Sex in St Johnsbury
The most prevalent vehicle ownership categories in St Johnsbury are males with 2 vehicles (586, accounting for 40.6%) and females with 2 vehicles (632, making up 42.8%).
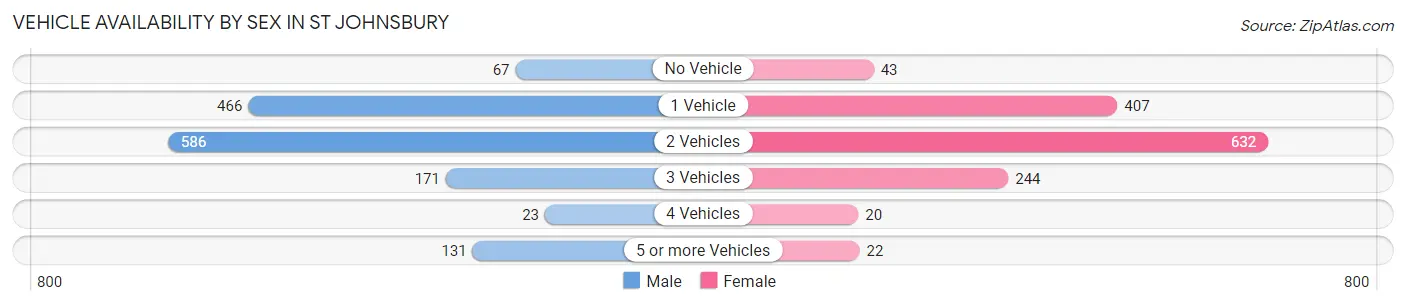
| Vehicles Available | Male | Female |
| No Vehicle | 67 (4.6%) | 43 (3.1%) |
| 1 Vehicle | 466 (32.3%) | 407 (29.7%) |
| 2 Vehicles | 586 (40.6%) | 632 (46.2%) |
| 3 Vehicles | 171 (11.8%) | 244 (17.8%) |
| 4 Vehicles | 23 (1.6%) | 20 (1.5%) |
| 5 or more Vehicles | 131 (9.1%) | 22 (1.6%) |
| Total | 1,444 (100.0%) | 1,368 (100.0%) |
Commute Time in St Johnsbury
The most frequently occuring commute durations in St Johnsbury are 5 to 9 minutes (593 commuters, 23.4%), 10 to 14 minutes (431 commuters, 17.0%), and less than 5 minutes (286 commuters, 11.3%).
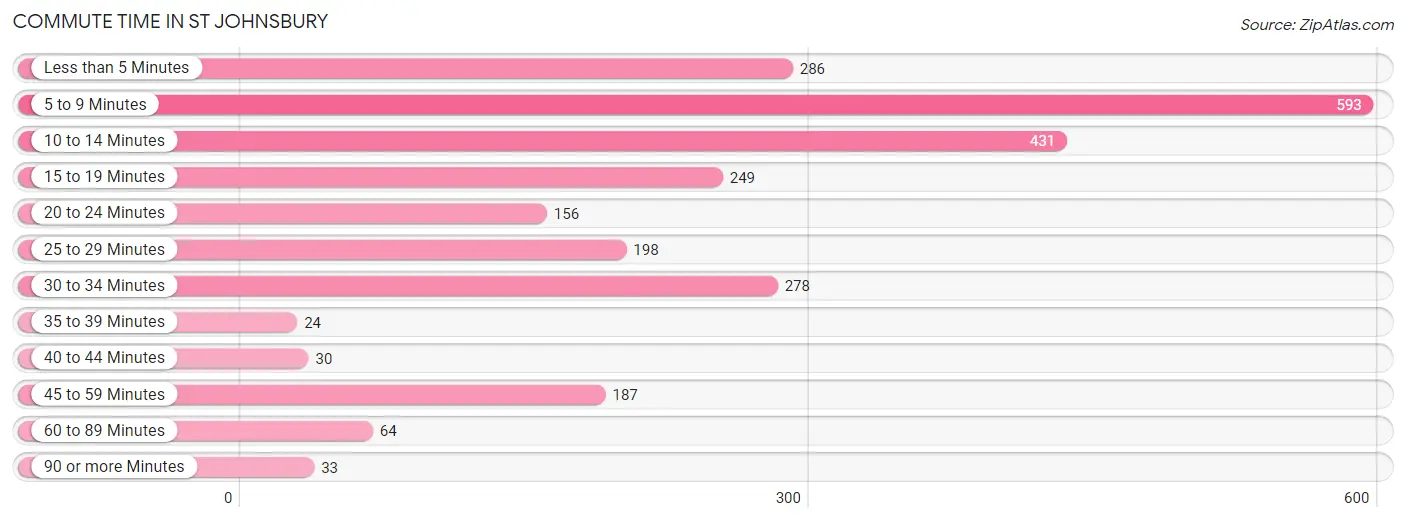
| Commute Time | # Commuters | % Commuters |
| Less than 5 Minutes | 286 | 11.3% |
| 5 to 9 Minutes | 593 | 23.4% |
| 10 to 14 Minutes | 431 | 17.0% |
| 15 to 19 Minutes | 249 | 9.9% |
| 20 to 24 Minutes | 156 | 6.2% |
| 25 to 29 Minutes | 198 | 7.8% |
| 30 to 34 Minutes | 278 | 11.0% |
| 35 to 39 Minutes | 24 | 0.9% |
| 40 to 44 Minutes | 30 | 1.2% |
| 45 to 59 Minutes | 187 | 7.4% |
| 60 to 89 Minutes | 64 | 2.5% |
| 90 or more Minutes | 33 | 1.3% |
Commute Time by Sex in St Johnsbury
The most common commute times in St Johnsbury are 5 to 9 minutes (313 commuters, 25.0%) for males and 5 to 9 minutes (280 commuters, 22.0%) for females.
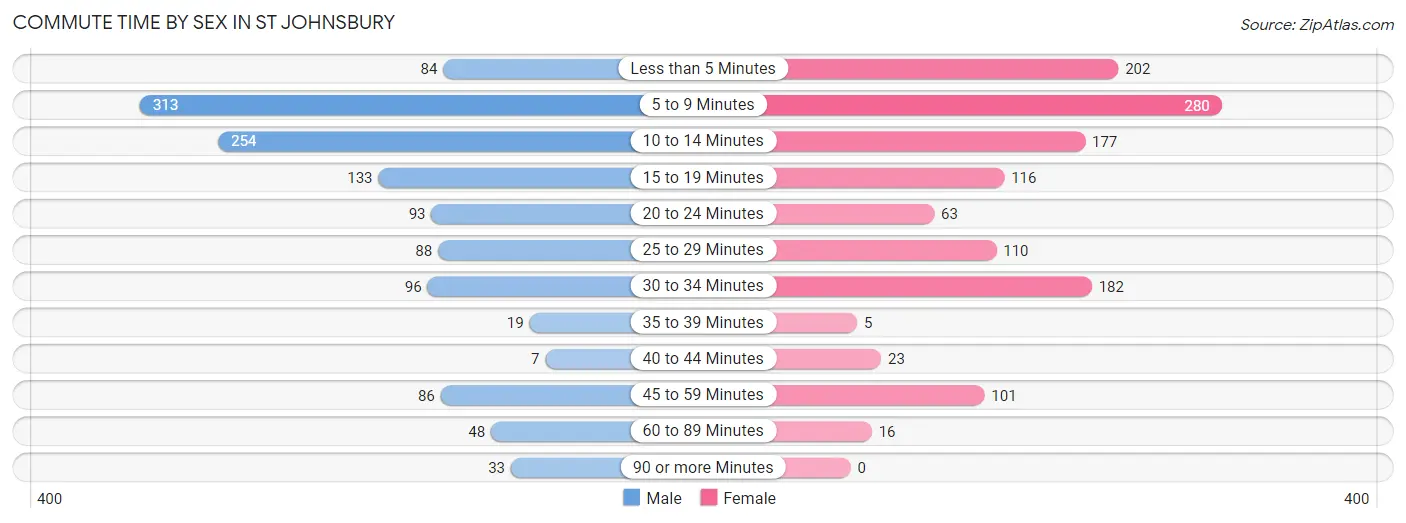
| Commute Time | Male | Female |
| Less than 5 Minutes | 84 (6.7%) | 202 (15.8%) |
| 5 to 9 Minutes | 313 (25.0%) | 280 (22.0%) |
| 10 to 14 Minutes | 254 (20.3%) | 177 (13.9%) |
| 15 to 19 Minutes | 133 (10.6%) | 116 (9.1%) |
| 20 to 24 Minutes | 93 (7.4%) | 63 (4.9%) |
| 25 to 29 Minutes | 88 (7.0%) | 110 (8.6%) |
| 30 to 34 Minutes | 96 (7.7%) | 182 (14.3%) |
| 35 to 39 Minutes | 19 (1.5%) | 5 (0.4%) |
| 40 to 44 Minutes | 7 (0.6%) | 23 (1.8%) |
| 45 to 59 Minutes | 86 (6.9%) | 101 (7.9%) |
| 60 to 89 Minutes | 48 (3.8%) | 16 (1.3%) |
| 90 or more Minutes | 33 (2.6%) | 0 (0.0%) |
Time of Departure to Work by Sex in St Johnsbury
The most frequent times of departure to work in St Johnsbury are 7:30 AM to 7:59 AM (290, 23.1%) for males and 9:00 AM to 9:59 AM (215, 16.9%) for females.
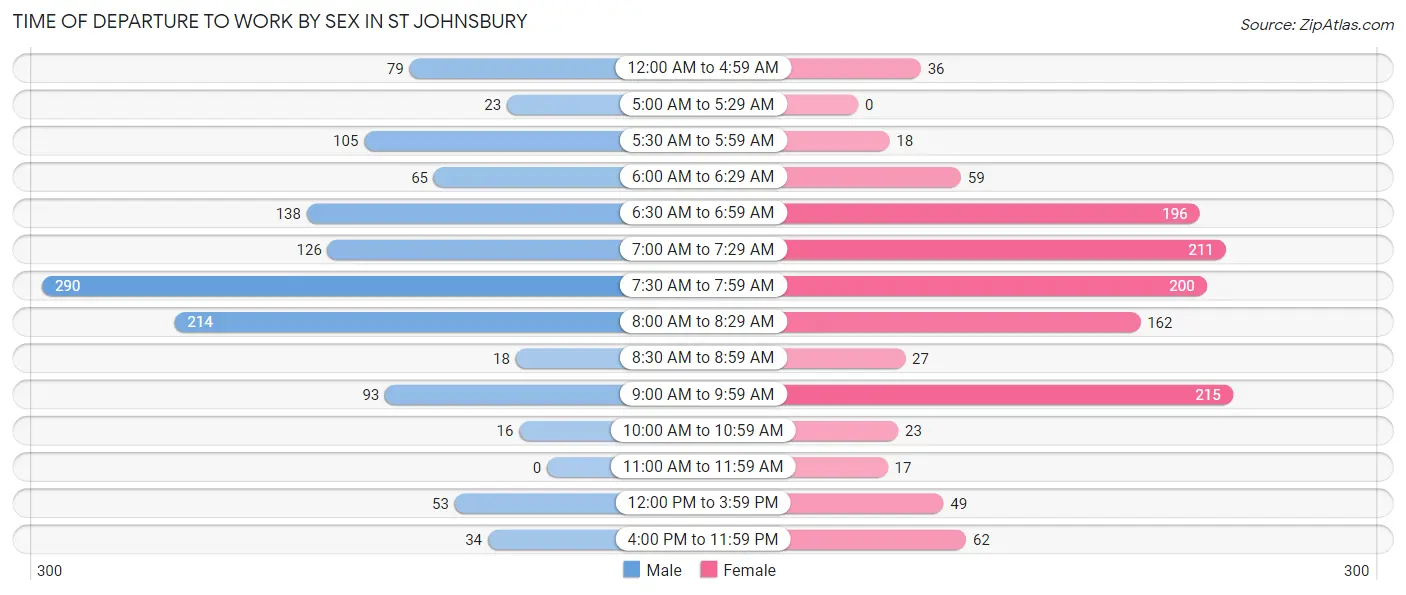
| Time of Departure | Male | Female |
| 12:00 AM to 4:59 AM | 79 (6.3%) | 36 (2.8%) |
| 5:00 AM to 5:29 AM | 23 (1.8%) | 0 (0.0%) |
| 5:30 AM to 5:59 AM | 105 (8.4%) | 18 (1.4%) |
| 6:00 AM to 6:29 AM | 65 (5.2%) | 59 (4.6%) |
| 6:30 AM to 6:59 AM | 138 (11.0%) | 196 (15.4%) |
| 7:00 AM to 7:29 AM | 126 (10.1%) | 211 (16.6%) |
| 7:30 AM to 7:59 AM | 290 (23.1%) | 200 (15.7%) |
| 8:00 AM to 8:29 AM | 214 (17.1%) | 162 (12.7%) |
| 8:30 AM to 8:59 AM | 18 (1.4%) | 27 (2.1%) |
| 9:00 AM to 9:59 AM | 93 (7.4%) | 215 (16.9%) |
| 10:00 AM to 10:59 AM | 16 (1.3%) | 23 (1.8%) |
| 11:00 AM to 11:59 AM | 0 (0.0%) | 17 (1.3%) |
| 12:00 PM to 3:59 PM | 53 (4.2%) | 49 (3.8%) |
| 4:00 PM to 11:59 PM | 34 (2.7%) | 62 (4.9%) |
| Total | 1,254 (100.0%) | 1,275 (100.0%) |
Housing Occupancy in St Johnsbury
Occupancy by Ownership in St Johnsbury
Of the total 2,763 dwellings in St Johnsbury, owner-occupied units account for 1,513 (54.8%), while renter-occupied units make up 1,250 (45.2%).
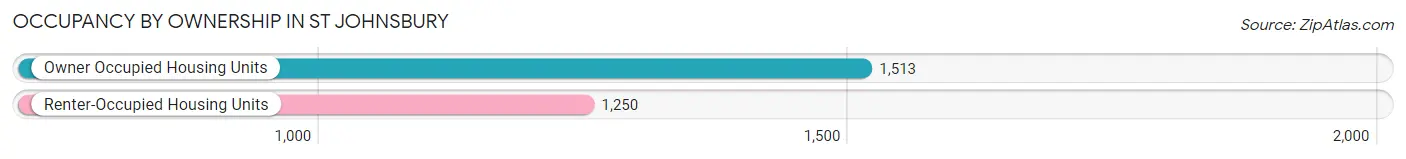
| Occupancy | # Housing Units | % Housing Units |
| Owner Occupied Housing Units | 1,513 | 54.8% |
| Renter-Occupied Housing Units | 1,250 | 45.2% |
| Total Occupied Housing Units | 2,763 | 100.0% |
Occupancy by Household Size in St Johnsbury
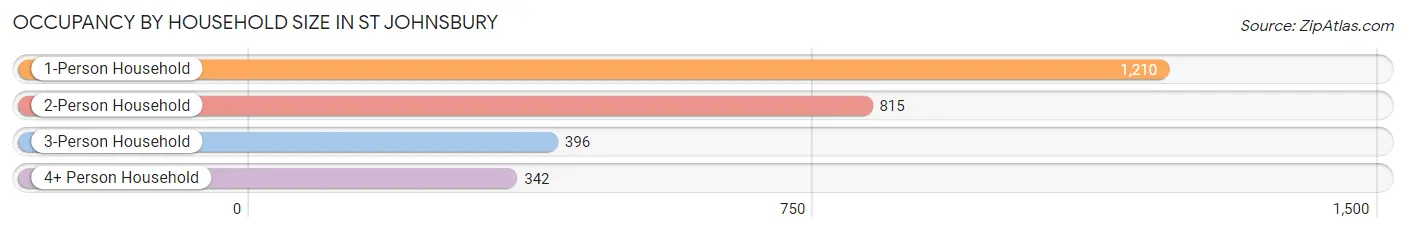
| Household Size | # Housing Units | % Housing Units |
| 1-Person Household | 1,210 | 43.8% |
| 2-Person Household | 815 | 29.5% |
| 3-Person Household | 396 | 14.3% |
| 4+ Person Household | 342 | 12.4% |
| Total Housing Units | 2,763 | 100.0% |
Occupancy by Ownership by Household Size in St Johnsbury
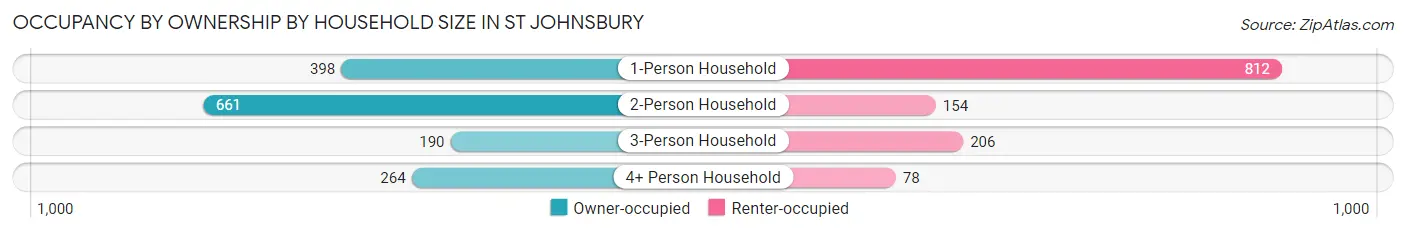
| Household Size | Owner-occupied | Renter-occupied |
| 1-Person Household | 398 (32.9%) | 812 (67.1%) |
| 2-Person Household | 661 (81.1%) | 154 (18.9%) |
| 3-Person Household | 190 (48.0%) | 206 (52.0%) |
| 4+ Person Household | 264 (77.2%) | 78 (22.8%) |
| Total Housing Units | 1,513 (54.8%) | 1,250 (45.2%) |
Occupancy by Educational Attainment in St Johnsbury
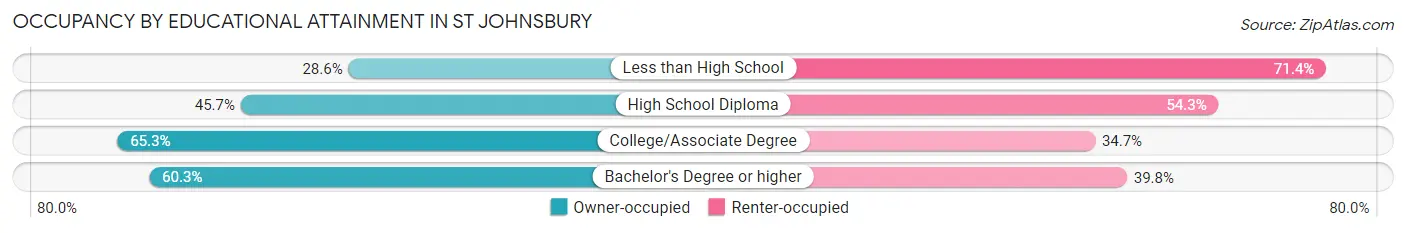
| Household Size | Owner-occupied | Renter-occupied |
| Less than High School | 67 (28.6%) | 167 (71.4%) |
| High School Diploma | 357 (45.7%) | 424 (54.3%) |
| College/Associate Degree | 463 (65.3%) | 246 (34.7%) |
| Bachelor's Degree or higher | 626 (60.3%) | 413 (39.8%) |
Occupancy by Age of Householder in St Johnsbury
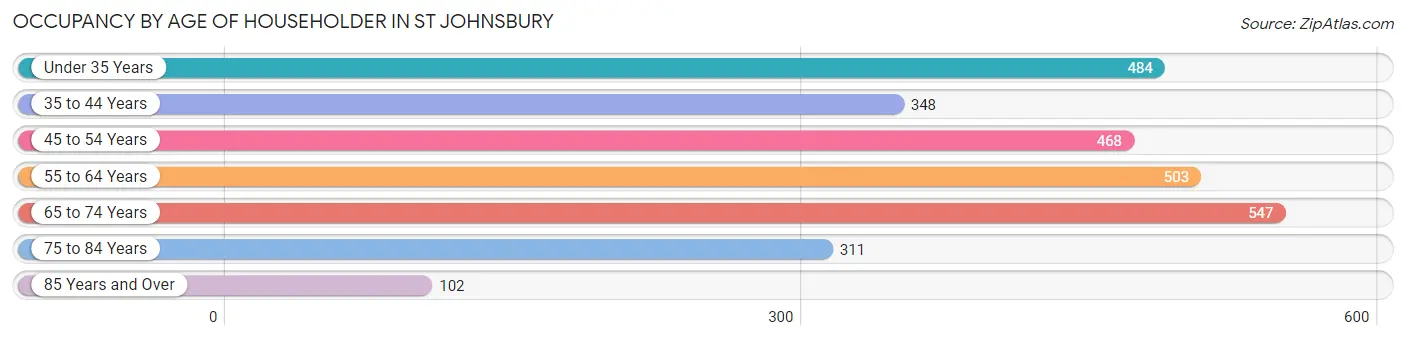
| Age Bracket | # Households | % Households |
| Under 35 Years | 484 | 17.5% |
| 35 to 44 Years | 348 | 12.6% |
| 45 to 54 Years | 468 | 16.9% |
| 55 to 64 Years | 503 | 18.2% |
| 65 to 74 Years | 547 | 19.8% |
| 75 to 84 Years | 311 | 11.3% |
| 85 Years and Over | 102 | 3.7% |
| Total | 2,763 | 100.0% |
Housing Finances in St Johnsbury
Median Income by Occupancy in St Johnsbury
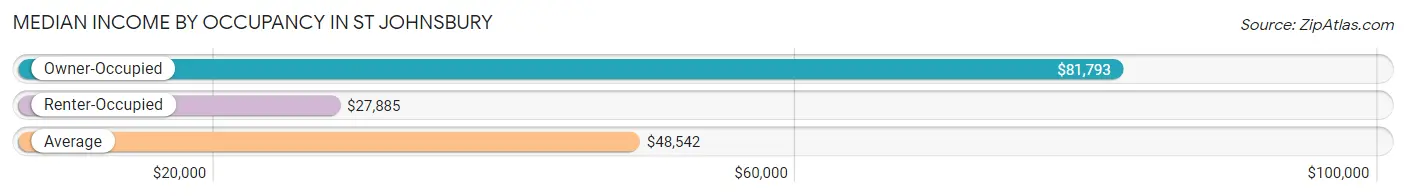
| Occupancy Type | # Households | Median Income |
| Owner-Occupied | 1,513 (54.8%) | $81,793 |
| Renter-Occupied | 1,250 (45.2%) | $27,885 |
| Average | 2,763 (100.0%) | $48,542 |
Occupancy by Householder Income Bracket in St Johnsbury
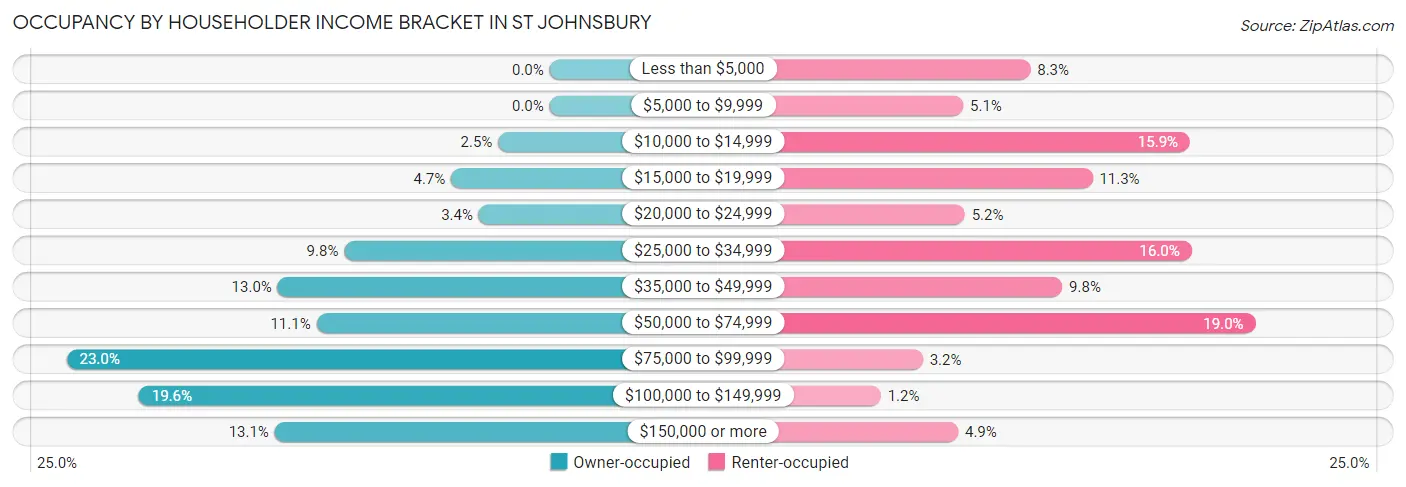
| Income Bracket | Owner-occupied | Renter-occupied |
| Less than $5,000 | 0 (0.0%) | 104 (8.3%) |
| $5,000 to $9,999 | 0 (0.0%) | 64 (5.1%) |
| $10,000 to $14,999 | 37 (2.5%) | 199 (15.9%) |
| $15,000 to $19,999 | 71 (4.7%) | 141 (11.3%) |
| $20,000 to $24,999 | 51 (3.4%) | 65 (5.2%) |
| $25,000 to $34,999 | 148 (9.8%) | 200 (16.0%) |
| $35,000 to $49,999 | 196 (13.0%) | 123 (9.8%) |
| $50,000 to $74,999 | 168 (11.1%) | 238 (19.0%) |
| $75,000 to $99,999 | 348 (23.0%) | 40 (3.2%) |
| $100,000 to $149,999 | 296 (19.6%) | 15 (1.2%) |
| $150,000 or more | 198 (13.1%) | 61 (4.9%) |
| Total | 1,513 (100.0%) | 1,250 (100.0%) |
Monthly Housing Cost Tiers in St Johnsbury
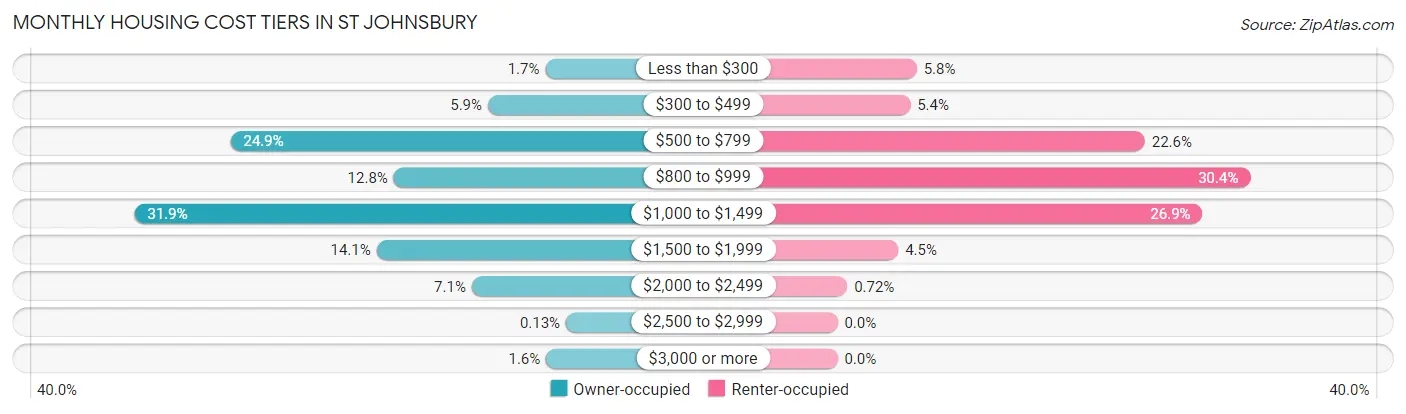
| Monthly Cost | Owner-occupied | Renter-occupied |
| Less than $300 | 25 (1.7%) | 73 (5.8%) |
| $300 to $499 | 89 (5.9%) | 67 (5.4%) |
| $500 to $799 | 376 (24.8%) | 283 (22.6%) |
| $800 to $999 | 194 (12.8%) | 380 (30.4%) |
| $1,000 to $1,499 | 483 (31.9%) | 336 (26.9%) |
| $1,500 to $1,999 | 213 (14.1%) | 56 (4.5%) |
| $2,000 to $2,499 | 107 (7.1%) | 9 (0.7%) |
| $2,500 to $2,999 | 2 (0.1%) | 0 (0.0%) |
| $3,000 or more | 24 (1.6%) | 0 (0.0%) |
| Total | 1,513 (100.0%) | 1,250 (100.0%) |
Physical Housing Characteristics in St Johnsbury
Housing Structures in St Johnsbury
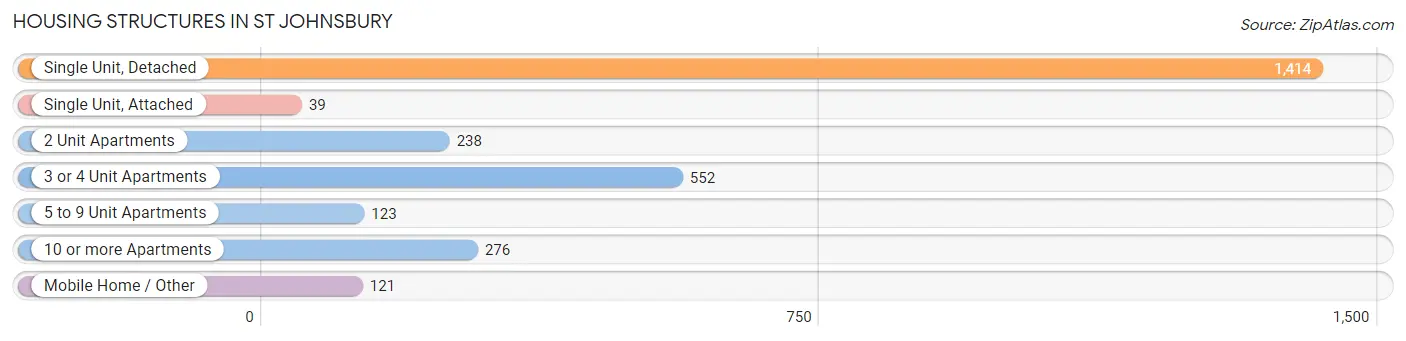
| Structure Type | # Housing Units | % Housing Units |
| Single Unit, Detached | 1,414 | 51.2% |
| Single Unit, Attached | 39 | 1.4% |
| 2 Unit Apartments | 238 | 8.6% |
| 3 or 4 Unit Apartments | 552 | 20.0% |
| 5 to 9 Unit Apartments | 123 | 4.4% |
| 10 or more Apartments | 276 | 10.0% |
| Mobile Home / Other | 121 | 4.4% |
| Total | 2,763 | 100.0% |
Housing Structures by Occupancy in St Johnsbury
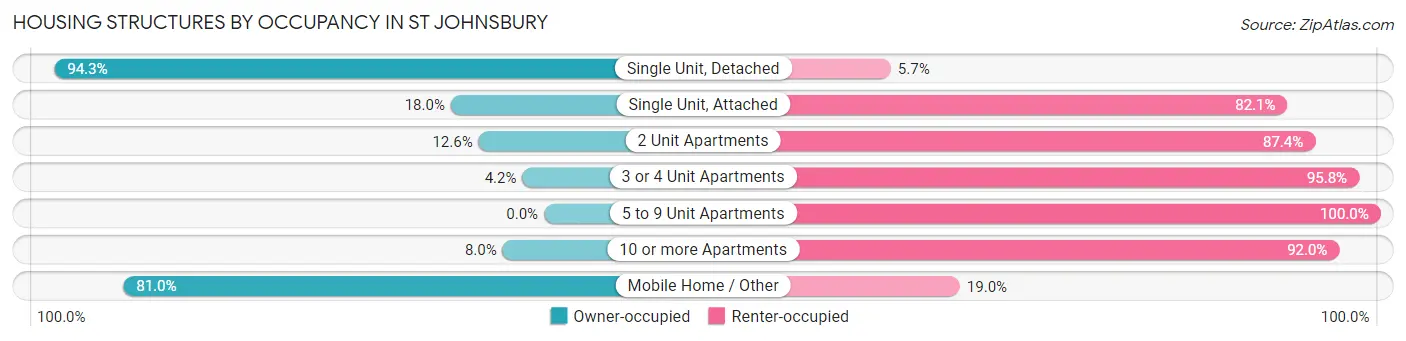
| Structure Type | Owner-occupied | Renter-occupied |
| Single Unit, Detached | 1,333 (94.3%) | 81 (5.7%) |
| Single Unit, Attached | 7 (17.9%) | 32 (82.1%) |
| 2 Unit Apartments | 30 (12.6%) | 208 (87.4%) |
| 3 or 4 Unit Apartments | 23 (4.2%) | 529 (95.8%) |
| 5 to 9 Unit Apartments | 0 (0.0%) | 123 (100.0%) |
| 10 or more Apartments | 22 (8.0%) | 254 (92.0%) |
| Mobile Home / Other | 98 (81.0%) | 23 (19.0%) |
| Total | 1,513 (54.8%) | 1,250 (45.2%) |
Housing Structures by Number of Rooms in St Johnsbury
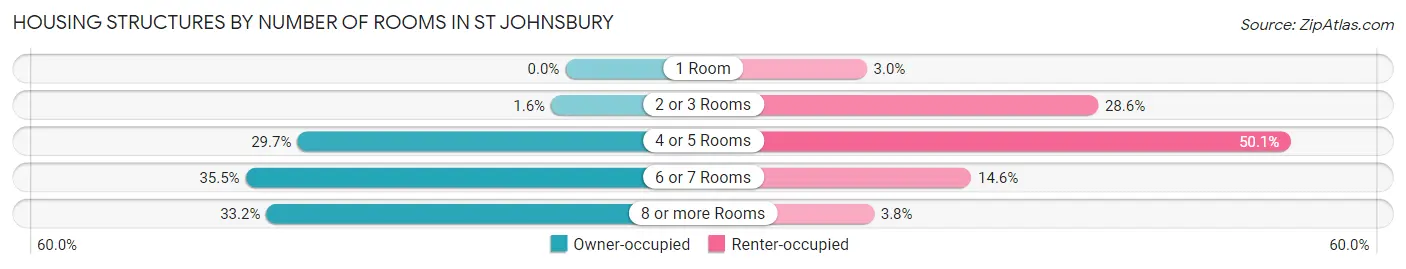
| Number of Rooms | Owner-occupied | Renter-occupied |
| 1 Room | 0 (0.0%) | 37 (3.0%) |
| 2 or 3 Rooms | 24 (1.6%) | 358 (28.6%) |
| 4 or 5 Rooms | 450 (29.7%) | 626 (50.1%) |
| 6 or 7 Rooms | 537 (35.5%) | 182 (14.6%) |
| 8 or more Rooms | 502 (33.2%) | 47 (3.8%) |
| Total | 1,513 (100.0%) | 1,250 (100.0%) |
Housing Structure by Heating Type in St Johnsbury
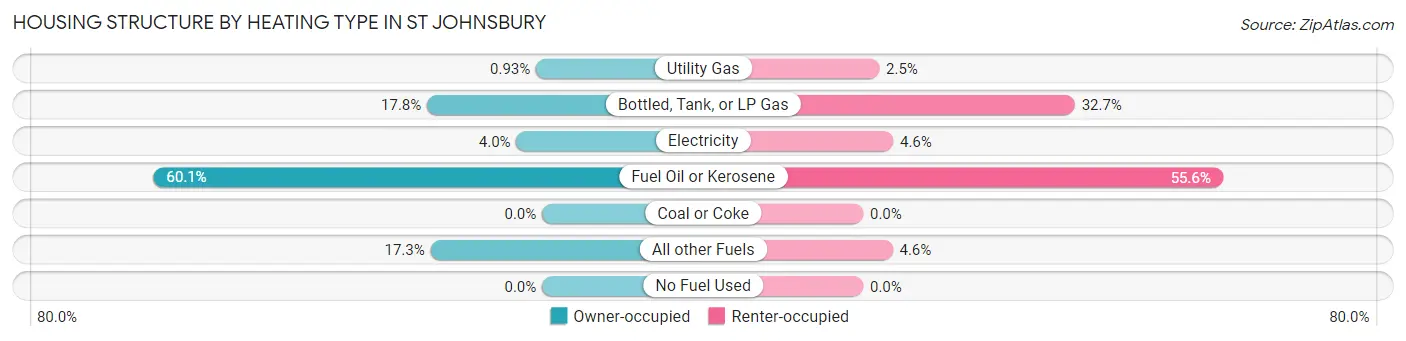
| Heating Type | Owner-occupied | Renter-occupied |
| Utility Gas | 14 (0.9%) | 31 (2.5%) |
| Bottled, Tank, or LP Gas | 269 (17.8%) | 409 (32.7%) |
| Electricity | 60 (4.0%) | 58 (4.6%) |
| Fuel Oil or Kerosene | 909 (60.1%) | 695 (55.6%) |
| Coal or Coke | 0 (0.0%) | 0 (0.0%) |
| All other Fuels | 261 (17.2%) | 57 (4.6%) |
| No Fuel Used | 0 (0.0%) | 0 (0.0%) |
| Total | 1,513 (100.0%) | 1,250 (100.0%) |
Household Vehicle Usage in St Johnsbury
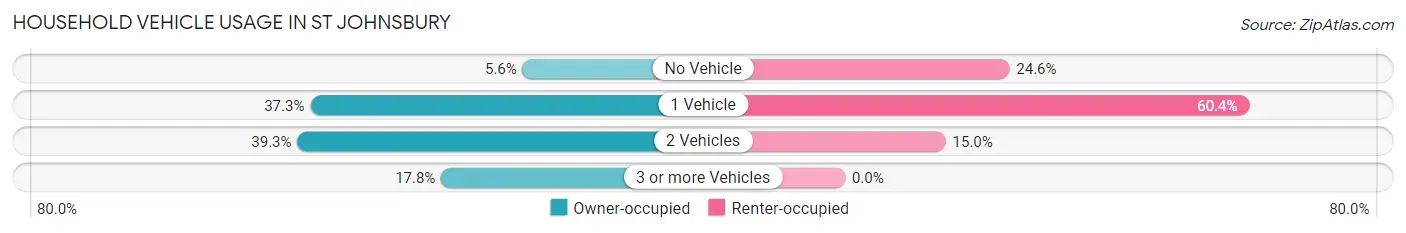
| Vehicles per Household | Owner-occupied | Renter-occupied |
| No Vehicle | 85 (5.6%) | 307 (24.6%) |
| 1 Vehicle | 565 (37.3%) | 755 (60.4%) |
| 2 Vehicles | 594 (39.3%) | 188 (15.0%) |
| 3 or more Vehicles | 269 (17.8%) | 0 (0.0%) |
| Total | 1,513 (100.0%) | 1,250 (100.0%) |
Real Estate & Mortgages in St Johnsbury
Real Estate and Mortgage Overview in St Johnsbury
| Characteristic | Without Mortgage | With Mortgage |
| Housing Units | 657 | 856 |
| Median Property Value | $157,200 | $163,400 |
| Median Household Income | $46,412 | $129 |
| Monthly Housing Costs | $651 | $24 |
| Real Estate Taxes | $3,186 | $7 |
Property Value by Mortgage Status in St Johnsbury
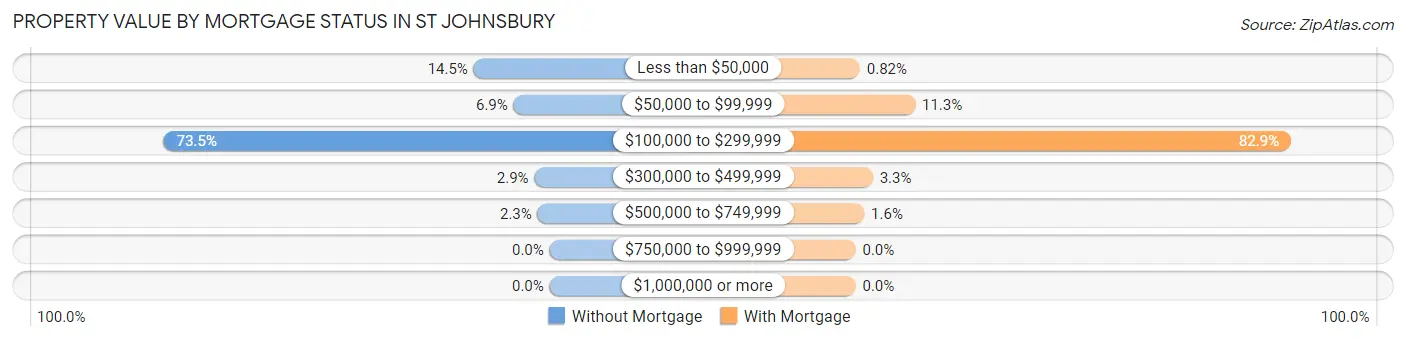
| Property Value | Without Mortgage | With Mortgage |
| Less than $50,000 | 95 (14.5%) | 7 (0.8%) |
| $50,000 to $99,999 | 45 (6.9%) | 97 (11.3%) |
| $100,000 to $299,999 | 483 (73.5%) | 710 (82.9%) |
| $300,000 to $499,999 | 19 (2.9%) | 28 (3.3%) |
| $500,000 to $749,999 | 15 (2.3%) | 14 (1.6%) |
| $750,000 to $999,999 | 0 (0.0%) | 0 (0.0%) |
| $1,000,000 or more | 0 (0.0%) | 0 (0.0%) |
| Total | 657 (100.0%) | 856 (100.0%) |
Household Income by Mortgage Status in St Johnsbury
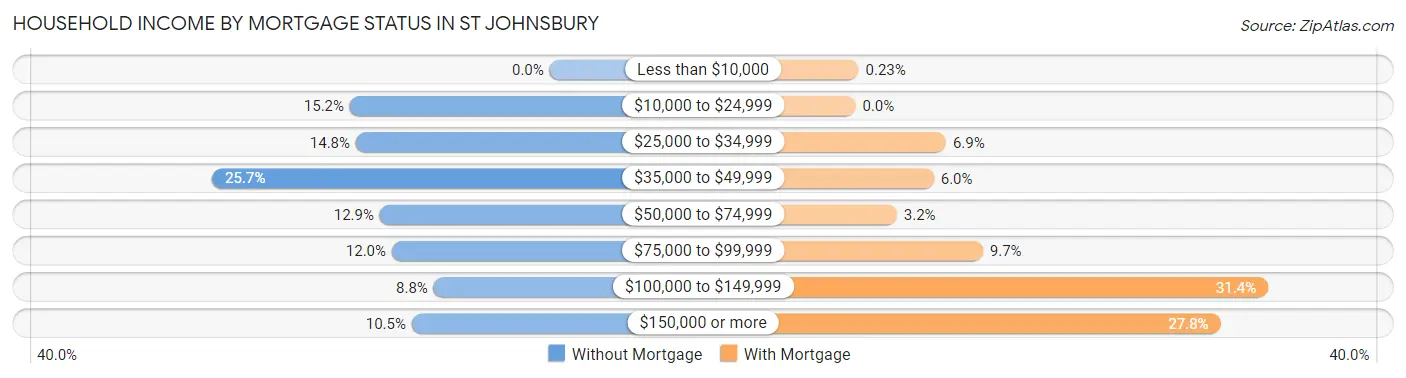
| Household Income | Without Mortgage | With Mortgage |
| Less than $10,000 | 0 (0.0%) | 2 (0.2%) |
| $10,000 to $24,999 | 100 (15.2%) | 0 (0.0%) |
| $25,000 to $34,999 | 97 (14.8%) | 59 (6.9%) |
| $35,000 to $49,999 | 169 (25.7%) | 51 (6.0%) |
| $50,000 to $74,999 | 85 (12.9%) | 27 (3.2%) |
| $75,000 to $99,999 | 79 (12.0%) | 83 (9.7%) |
| $100,000 to $149,999 | 58 (8.8%) | 269 (31.4%) |
| $150,000 or more | 69 (10.5%) | 238 (27.8%) |
| Total | 657 (100.0%) | 856 (100.0%) |
Property Value to Household Income Ratio in St Johnsbury
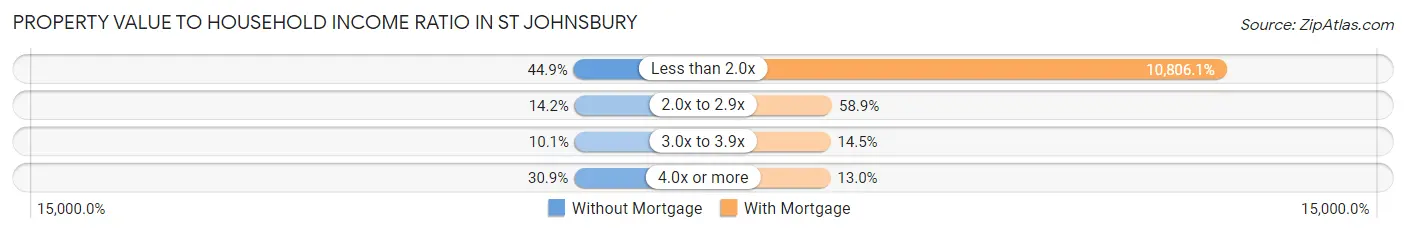
| Value-to-Income Ratio | Without Mortgage | With Mortgage |
| Less than 2.0x | 295 (44.9%) | 92,500 (10,806.1%) |
| 2.0x to 2.9x | 93 (14.2%) | 504 (58.9%) |
| 3.0x to 3.9x | 66 (10.1%) | 124 (14.5%) |
| 4.0x or more | 203 (30.9%) | 111 (13.0%) |
| Total | 657 (100.0%) | 856 (100.0%) |
Real Estate Taxes by Mortgage Status in St Johnsbury
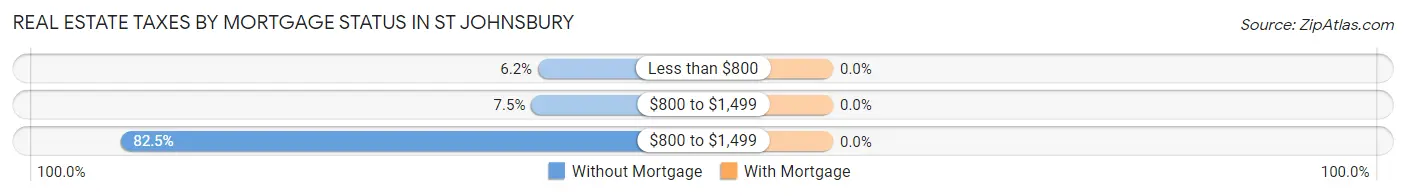
| Property Taxes | Without Mortgage | With Mortgage |
| Less than $800 | 41 (6.2%) | 0 (0.0%) |
| $800 to $1,499 | 49 (7.5%) | 0 (0.0%) |
| $800 to $1,499 | 542 (82.5%) | 0 (0.0%) |
| Total | 657 (100.0%) | 856 (100.0%) |
Health & Disability in St Johnsbury
Health Insurance Coverage by Age in St Johnsbury
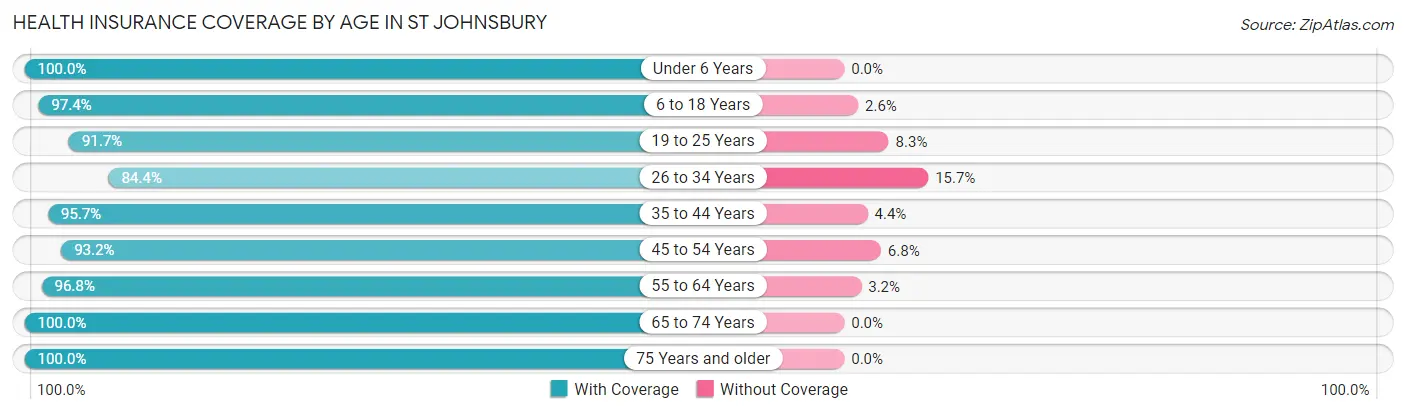
| Age Bracket | With Coverage | Without Coverage |
| Under 6 Years | 244 (100.0%) | 0 (0.0%) |
| 6 to 18 Years | 870 (97.4%) | 23 (2.6%) |
| 19 to 25 Years | 466 (91.7%) | 42 (8.3%) |
| 26 to 34 Years | 291 (84.4%) | 54 (15.7%) |
| 35 to 44 Years | 572 (95.7%) | 26 (4.3%) |
| 45 to 54 Years | 764 (93.2%) | 56 (6.8%) |
| 55 to 64 Years | 854 (96.8%) | 28 (3.2%) |
| 65 to 74 Years | 863 (100.0%) | 0 (0.0%) |
| 75 Years and older | 644 (100.0%) | 0 (0.0%) |
| Total | 5,568 (96.1%) | 229 (4.0%) |
Health Insurance Coverage by Citizenship Status in St Johnsbury
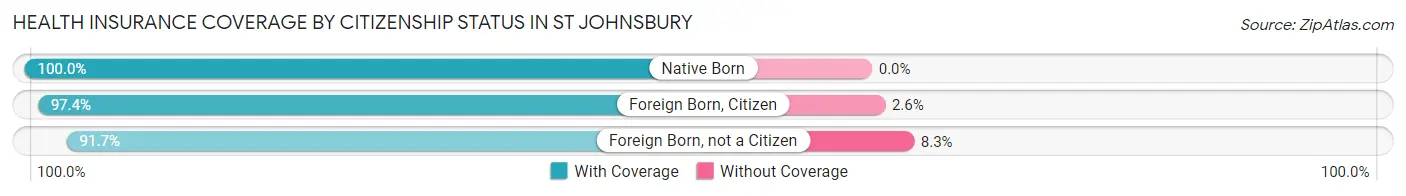
| Citizenship Status | With Coverage | Without Coverage |
| Native Born | 244 (100.0%) | 0 (0.0%) |
| Foreign Born, Citizen | 870 (97.4%) | 23 (2.6%) |
| Foreign Born, not a Citizen | 466 (91.7%) | 42 (8.3%) |
Health Insurance Coverage by Household Income in St Johnsbury
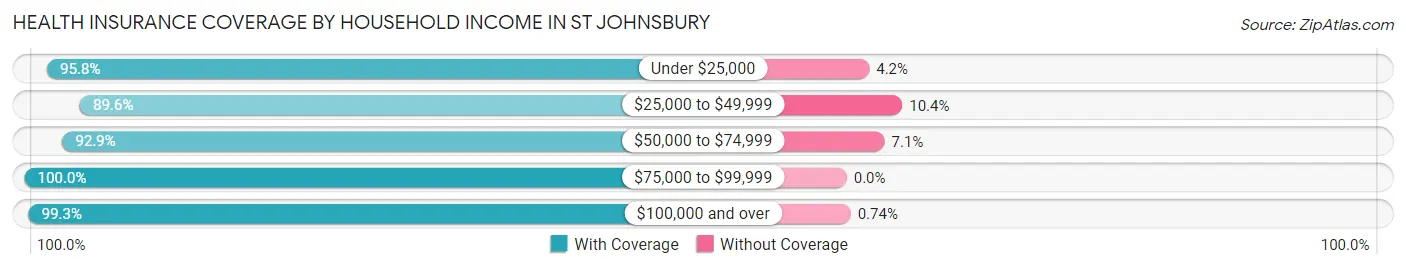
| Household Income | With Coverage | Without Coverage |
| Under $25,000 | 979 (95.8%) | 43 (4.2%) |
| $25,000 to $49,999 | 1,034 (89.6%) | 120 (10.4%) |
| $50,000 to $74,999 | 709 (92.9%) | 54 (7.1%) |
| $75,000 to $99,999 | 1,063 (100.0%) | 0 (0.0%) |
| $100,000 and over | 1,613 (99.3%) | 12 (0.7%) |
Public vs Private Health Insurance Coverage by Age in St Johnsbury
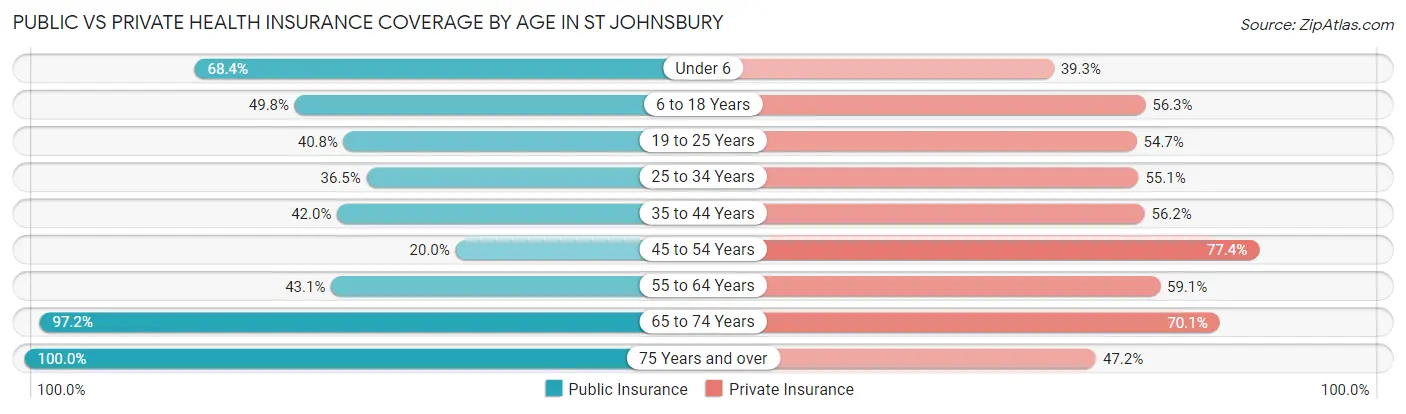
| Age Bracket | Public Insurance | Private Insurance |
| Under 6 | 167 (68.4%) | 96 (39.3%) |
| 6 to 18 Years | 445 (49.8%) | 503 (56.3%) |
| 19 to 25 Years | 207 (40.7%) | 278 (54.7%) |
| 25 to 34 Years | 126 (36.5%) | 190 (55.1%) |
| 35 to 44 Years | 251 (42.0%) | 336 (56.2%) |
| 45 to 54 Years | 164 (20.0%) | 635 (77.4%) |
| 55 to 64 Years | 380 (43.1%) | 521 (59.1%) |
| 65 to 74 Years | 839 (97.2%) | 605 (70.1%) |
| 75 Years and over | 644 (100.0%) | 304 (47.2%) |
| Total | 3,223 (55.6%) | 3,468 (59.8%) |
Disability Status by Sex by Age in St Johnsbury
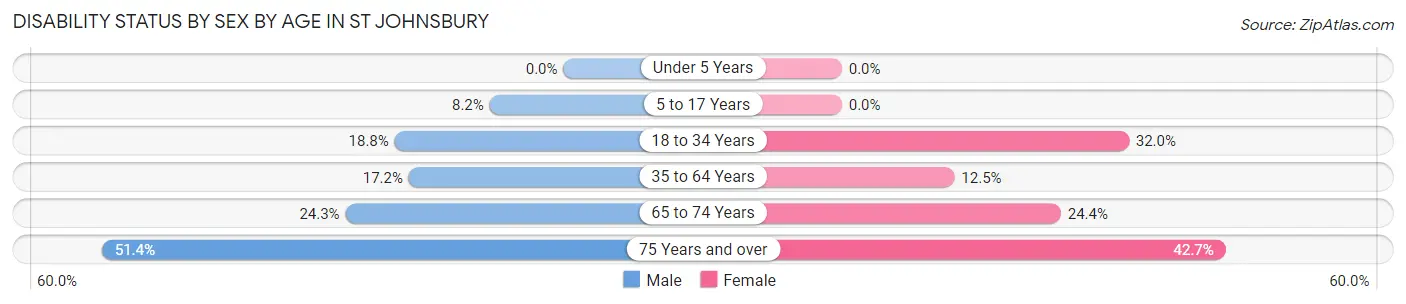
| Age Bracket | Male | Female |
| Under 5 Years | 0 (0.0%) | 0 (0.0%) |
| 5 to 17 Years | 40 (8.2%) | 0 (0.0%) |
| 18 to 34 Years | 90 (18.8%) | 140 (32.0%) |
| 35 to 64 Years | 190 (17.2%) | 150 (12.5%) |
| 65 to 74 Years | 100 (24.3%) | 110 (24.4%) |
| 75 Years and over | 147 (51.4%) | 153 (42.7%) |
Disability Class by Sex by Age in St Johnsbury
Disability Class: Hearing Difficulty

| Age Bracket | Male | Female |
| Under 5 Years | 0 (0.0%) | 0 (0.0%) |
| 5 to 17 Years | 0 (0.0%) | 0 (0.0%) |
| 18 to 34 Years | 0 (0.0%) | 60 (13.7%) |
| 35 to 64 Years | 46 (4.2%) | 12 (1.0%) |
| 65 to 74 Years | 30 (7.3%) | 73 (16.2%) |
| 75 Years and over | 73 (25.5%) | 89 (24.9%) |
Disability Class: Vision Difficulty
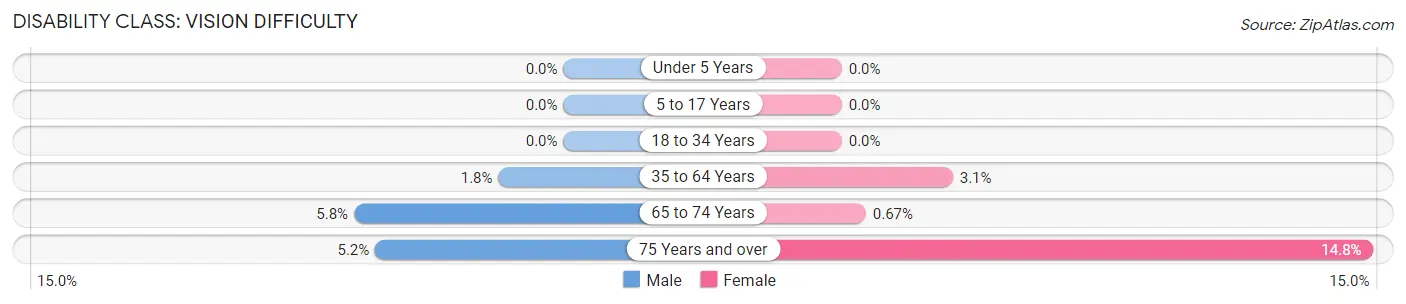
| Age Bracket | Male | Female |
| Under 5 Years | 0 (0.0%) | 0 (0.0%) |
| 5 to 17 Years | 0 (0.0%) | 0 (0.0%) |
| 18 to 34 Years | 0 (0.0%) | 0 (0.0%) |
| 35 to 64 Years | 20 (1.8%) | 37 (3.1%) |
| 65 to 74 Years | 24 (5.8%) | 3 (0.7%) |
| 75 Years and over | 15 (5.2%) | 53 (14.8%) |
Disability Class: Cognitive Difficulty
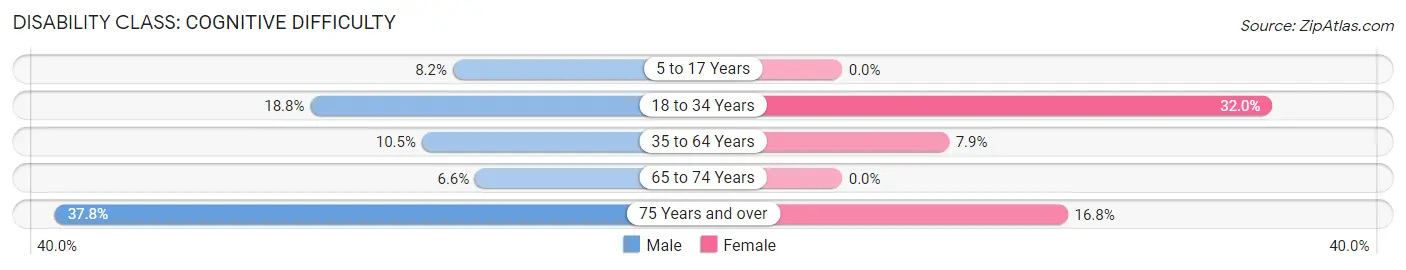
| Age Bracket | Male | Female |
| 5 to 17 Years | 40 (8.2%) | 0 (0.0%) |
| 18 to 34 Years | 90 (18.8%) | 140 (32.0%) |
| 35 to 64 Years | 116 (10.5%) | 95 (7.9%) |
| 65 to 74 Years | 27 (6.6%) | 0 (0.0%) |
| 75 Years and over | 108 (37.8%) | 60 (16.8%) |
Disability Class: Ambulatory Difficulty
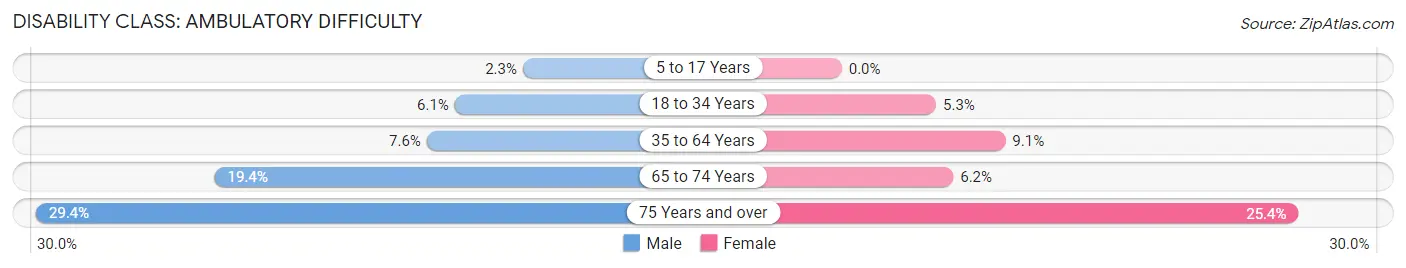
| Age Bracket | Male | Female |
| 5 to 17 Years | 11 (2.3%) | 0 (0.0%) |
| 18 to 34 Years | 29 (6.0%) | 23 (5.2%) |
| 35 to 64 Years | 84 (7.6%) | 109 (9.1%) |
| 65 to 74 Years | 80 (19.4%) | 28 (6.2%) |
| 75 Years and over | 84 (29.4%) | 91 (25.4%) |
Disability Class: Self-Care Difficulty
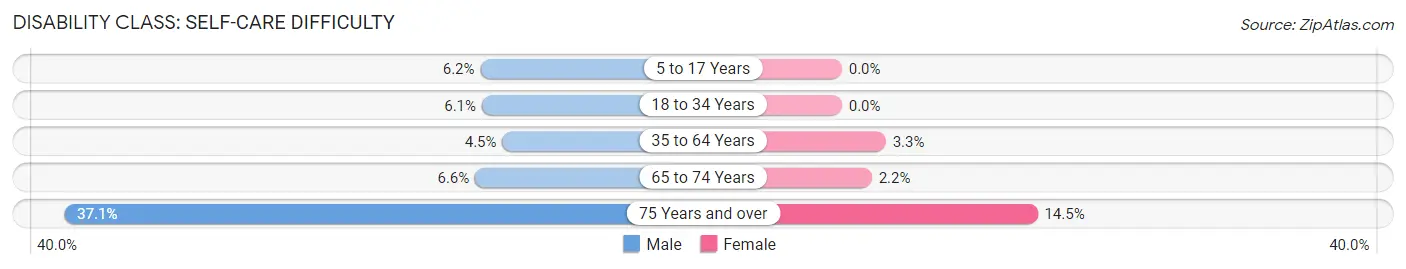
| Age Bracket | Male | Female |
| 5 to 17 Years | 30 (6.2%) | 0 (0.0%) |
| 18 to 34 Years | 29 (6.0%) | 0 (0.0%) |
| 35 to 64 Years | 50 (4.5%) | 39 (3.3%) |
| 65 to 74 Years | 27 (6.6%) | 10 (2.2%) |
| 75 Years and over | 106 (37.1%) | 52 (14.5%) |
Technology Access in St Johnsbury
Computing Device Access in St Johnsbury
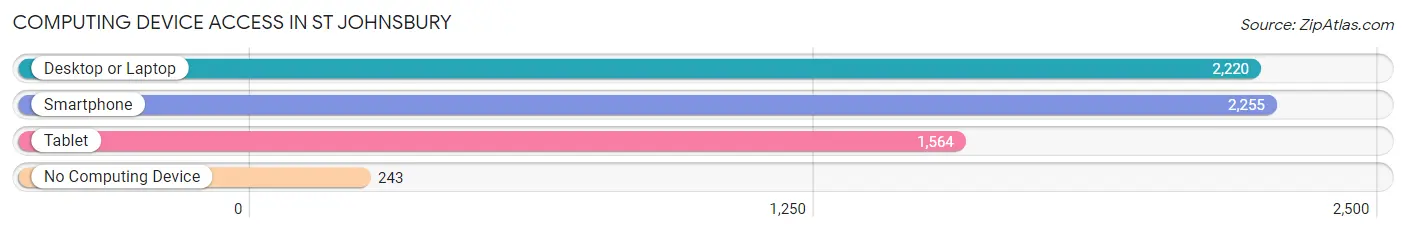
| Device Type | # Households | % Households |
| Desktop or Laptop | 2,220 | 80.3% |
| Smartphone | 2,255 | 81.6% |
| Tablet | 1,564 | 56.6% |
| No Computing Device | 243 | 8.8% |
| Total | 2,763 | 100.0% |
Internet Access in St Johnsbury
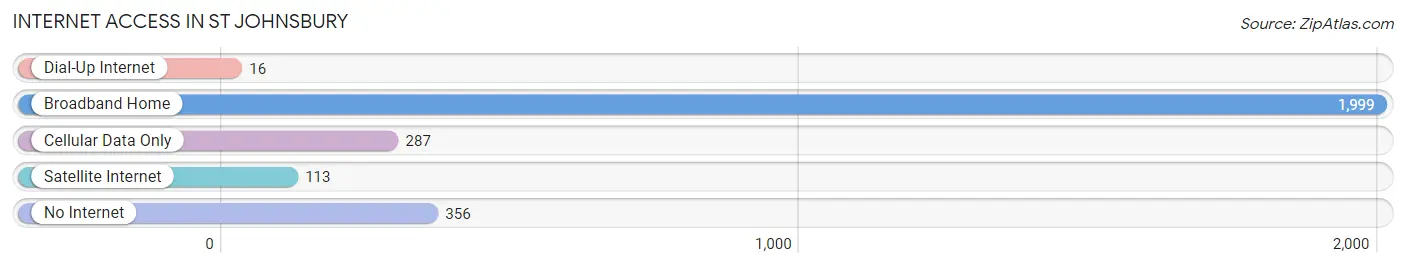
| Internet Type | # Households | % Households |
| Dial-Up Internet | 16 | 0.6% |
| Broadband Home | 1,999 | 72.4% |
| Cellular Data Only | 287 | 10.4% |
| Satellite Internet | 113 | 4.1% |
| No Internet | 356 | 12.9% |
| Total | 2,763 | 100.0% |
St Johnsbury Summary
St Johnsbury, Vermont is a small town located in the northeastern part of the United States. It is the largest town in Caledonia County and is the shire town of the county. The town is situated in the Connecticut River Valley and is surrounded by the Green Mountains. The town has a population of 7,603 as of the 2010 census.
History
St Johnsbury was first settled in 1786 by Ira Allen and his brother Ethan Allen. The town was named after their father, John Allen. The town was incorporated in 1787 and was the first town in the state to be incorporated. The town was an important center of commerce and industry in the 19th century. It was home to several factories, including a woolen mill, a paper mill, a sawmill, and a gristmill. The town was also home to the St. Johnsbury Academy, which was founded in 1842 and is still in operation today.
Geography
St Johnsbury is located in the Connecticut River Valley in the northeastern part of the state. The town is bordered by the towns of Lyndon, Danville, and Barnet to the north, Peacham to the east, and Concord to the south. The town is situated at the confluence of the Passumpsic and Moose Rivers. The town is located at an elevation of 890 feet above sea level.
Economy
St Johnsbury has a diverse economy that is based on manufacturing, retail, and tourism. The town is home to several factories, including a paper mill, a sawmill, and a gristmill. The town is also home to several retail stores, restaurants, and other businesses. Tourism is also an important part of the local economy, as the town is home to several attractions, including the St. Johnsbury Athenaeum, the Fairbanks Museum and Planetarium, and the Catamount Arts Center.
Demographics
As of the 2010 census, the population of St Johnsbury was 7,603. The racial makeup of the town was 95.3% White, 0.7% African American, 0.4% Native American, 0.7% Asian, 0.1% Pacific Islander, 0.7% from other races, and 1.9% from two or more races. The median household income was $41,945 and the median family income was $50,945. The per capita income was $20,945. The town has a poverty rate of 11.3%.
St Johnsbury is a small town with a rich history and a diverse economy. The town is home to several factories, retail stores, restaurants, and other businesses. The town is also home to several attractions, including the St. Johnsbury Athenaeum, the Fairbanks Museum and Planetarium, and the Catamount Arts Center. The town has a population of 7,603 and a median household income of $41,945.
Common Questions
What is Per Capita Income in St Johnsbury?
Per Capita income in St Johnsbury is $34,206.
What is the Median Family Income in St Johnsbury?
Median Family Income in St Johnsbury is $83,686.
What is the Median Household income in St Johnsbury?
Median Household Income in St Johnsbury is $48,542.
What is Income or Wage Gap in St Johnsbury?
Income or Wage Gap in St Johnsbury is 1.8%.
Women in St Johnsbury earn 98.2 cents for every dollar earned by a man.
What is Inequality or Gini Index in St Johnsbury?
Inequality or Gini Index in St Johnsbury is 0.49.
What is the Total Population of St Johnsbury?
Total Population of St Johnsbury is 5,963.
What is the Total Male Population of St Johnsbury?
Total Male Population of St Johnsbury is 3,052.
What is the Total Female Population of St Johnsbury?
Total Female Population of St Johnsbury is 2,911.
What is the Ratio of Males per 100 Females in St Johnsbury?
There are 104.84 Males per 100 Females in St Johnsbury.
What is the Ratio of Females per 100 Males in St Johnsbury?
There are 95.38 Females per 100 Males in St Johnsbury.
What is the Median Population Age in St Johnsbury?
Median Population Age in St Johnsbury is 48.5 Years.
What is the Average Family Size in St Johnsbury
Average Family Size in St Johnsbury is 2.7 People.
What is the Average Household Size in St Johnsbury
Average Household Size in St Johnsbury is 2.0 People.
How Large is the Labor Force in St Johnsbury?
There are 3,092 People in the Labor Forcein in St Johnsbury.
What is the Percentage of People in the Labor Force in St Johnsbury?
61.5% of People are in the Labor Force in St Johnsbury.
What is the Unemployment Rate in St Johnsbury?
Unemployment Rate in St Johnsbury is 4.6%.