Bristol, VT Map & Demographics
Bristol Map
Bristol Overview
$38,675
PER CAPITA INCOME
$83,793
AVG FAMILY INCOME
$65,536
AVG HOUSEHOLD INCOME
5.3%
WAGE / INCOME GAP [ % ]
94.7¢/ $1
WAGE / INCOME GAP [ $ ]
0.38
INEQUALITY / GINI INDEX
1,956
TOTAL POPULATION
927
MALE POPULATION
1,029
FEMALE POPULATION
90.09
MALES / 100 FEMALES
111.00
FEMALES / 100 MALES
50.7
MEDIAN AGE
2.6
AVG FAMILY SIZE
2.0
AVG HOUSEHOLD SIZE
1,104
LABOR FORCE [ PEOPLE ]
67.5%
PERCENT IN LABOR FORCE
8.0%
UNEMPLOYMENT RATE
Bristol Zip Codes
Bristol Area Codes
Income in Bristol
Income Overview in Bristol
Per Capita Income in Bristol is $38,675, while median incomes of families and households are $83,793 and $65,536 respectively.
| Characteristic | Number | Measure |
| Per Capita Income | 1,956 | $38,675 |
| Median Family Income | 460 | $83,793 |
| Mean Family Income | 460 | $97,032 |
| Median Household Income | 943 | $65,536 |
| Mean Household Income | 943 | $75,499 |
| Income Deficit | 460 | $0 |
| Wage / Income Gap (%) | 1,956 | 5.33% |
| Wage / Income Gap ($) | 1,956 | 94.67¢ per $1 |
| Gini / Inequality Index | 1,956 | 0.38 |
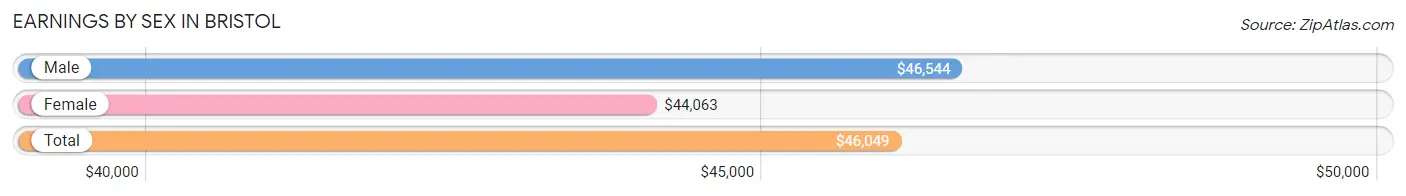
Earnings by Sex in Bristol
Average Earnings in Bristol are $46,049, $46,544 for men and $44,063 for women, a difference of 5.3%.
| Sex | Number | Average Earnings |
| Male | 579 (52.1%) | $46,544 |
| Female | 532 (47.9%) | $44,063 |
| Total | 1,111 (100.0%) | $46,049 |
Earnings by Sex by Income Bracket in Bristol
The most common earnings brackets in Bristol are $100,000+ for men (118 | 20.4%) and $45,000 to $49,999 for women (81 | 15.2%).
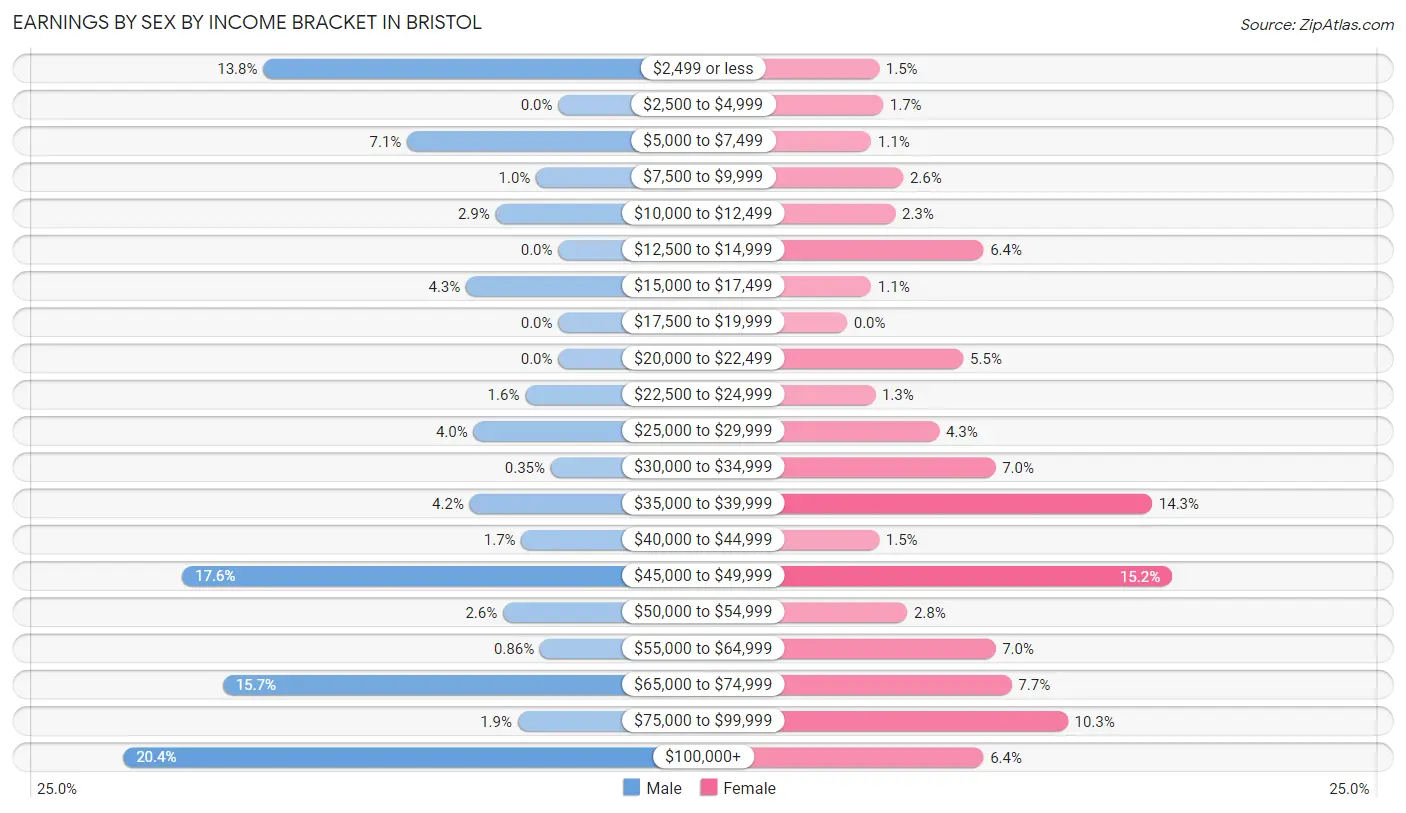
| Income | Male | Female |
| $2,499 or less | 80 (13.8%) | 8 (1.5%) |
| $2,500 to $4,999 | 0 (0.0%) | 9 (1.7%) |
| $5,000 to $7,499 | 41 (7.1%) | 6 (1.1%) |
| $7,500 to $9,999 | 6 (1.0%) | 14 (2.6%) |
| $10,000 to $12,499 | 17 (2.9%) | 12 (2.3%) |
| $12,500 to $14,999 | 0 (0.0%) | 34 (6.4%) |
| $15,000 to $17,499 | 25 (4.3%) | 6 (1.1%) |
| $17,500 to $19,999 | 0 (0.0%) | 0 (0.0%) |
| $20,000 to $22,499 | 0 (0.0%) | 29 (5.4%) |
| $22,500 to $24,999 | 9 (1.5%) | 7 (1.3%) |
| $25,000 to $29,999 | 23 (4.0%) | 23 (4.3%) |
| $30,000 to $34,999 | 2 (0.4%) | 37 (7.0%) |
| $35,000 to $39,999 | 24 (4.2%) | 76 (14.3%) |
| $40,000 to $44,999 | 10 (1.7%) | 8 (1.5%) |
| $45,000 to $49,999 | 102 (17.6%) | 81 (15.2%) |
| $50,000 to $54,999 | 15 (2.6%) | 15 (2.8%) |
| $55,000 to $64,999 | 5 (0.9%) | 37 (7.0%) |
| $65,000 to $74,999 | 91 (15.7%) | 41 (7.7%) |
| $75,000 to $99,999 | 11 (1.9%) | 55 (10.3%) |
| $100,000+ | 118 (20.4%) | 34 (6.4%) |
| Total | 579 (100.0%) | 532 (100.0%) |
Earnings by Sex by Educational Attainment in Bristol
Average earnings in Bristol are $47,574 for men and $47,311 for women, a difference of 0.5%. Men with an educational attainment of high school diploma enjoy the highest average annual earnings of $58,000, while those with college or associate's degree education earn the least with $46,250. Women with an educational attainment of graduate degree earn the most with the average annual earnings of $57,621, while those with bachelor's degree education have the smallest earnings of $29,306.
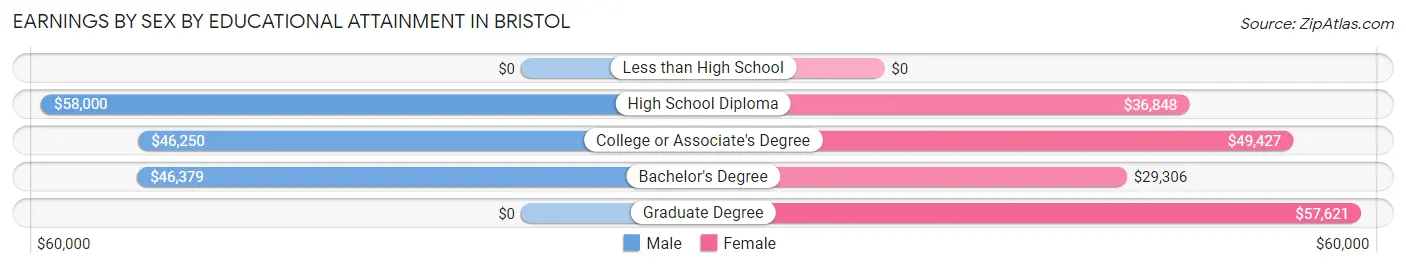
| Educational Attainment | Male Income | Female Income |
| Less than High School | - | - |
| High School Diploma | $58,000 | $36,848 |
| College or Associate's Degree | $46,250 | $49,427 |
| Bachelor's Degree | $46,379 | $29,306 |
| Graduate Degree | - | - |
| Total | $47,574 | $47,311 |
Family Income in Bristol
Family Income Brackets in Bristol
According to the Bristol family income data, there are 125 families falling into the $50,000 to $74,999 income range, which is the most common income bracket and makes up 27.2% of all families.
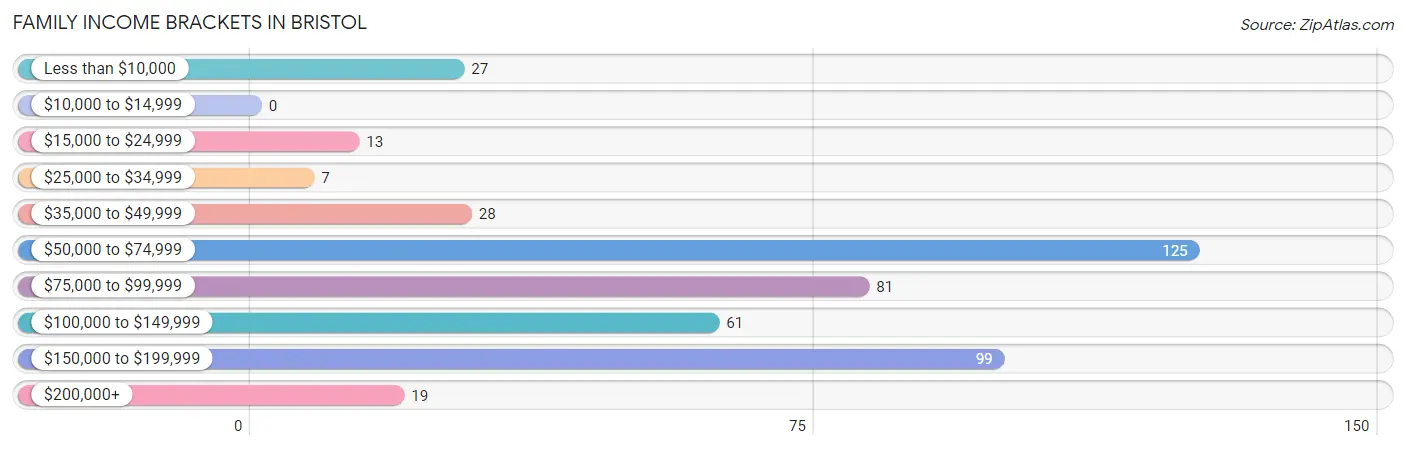
| Income Bracket | # Families | % Families |
| Less than $10,000 | 27 | 5.9% |
| $10,000 to $14,999 | 0 | 0.0% |
| $15,000 to $24,999 | 13 | 2.8% |
| $25,000 to $34,999 | 7 | 1.5% |
| $35,000 to $49,999 | 28 | 6.1% |
| $50,000 to $74,999 | 125 | 27.2% |
| $75,000 to $99,999 | 81 | 17.6% |
| $100,000 to $149,999 | 61 | 13.3% |
| $150,000 to $199,999 | 99 | 21.5% |
| $200,000+ | 19 | 4.1% |
Family Income by Famaliy Size in Bristol
2-person families (334 | 72.6%) account for the highest median family income in Bristol with $78,750 per family, while 2-person families (334 | 72.6%) have the highest median income of $39,375 per family member.
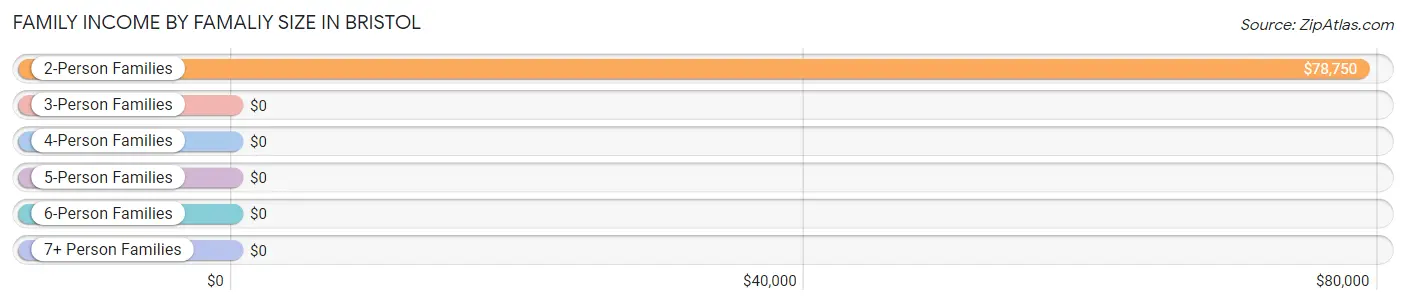
| Income Bracket | # Families | Median Income |
| 2-Person Families | 334 (72.6%) | $78,750 |
| 3-Person Families | 62 (13.5%) | $0 |
| 4-Person Families | 25 (5.4%) | $0 |
| 5-Person Families | 9 (2.0%) | $0 |
| 6-Person Families | 30 (6.5%) | $0 |
| 7+ Person Families | 0 (0.0%) | $0 |
| Total | 460 (100.0%) | $83,793 |
Family Income by Number of Earners in Bristol
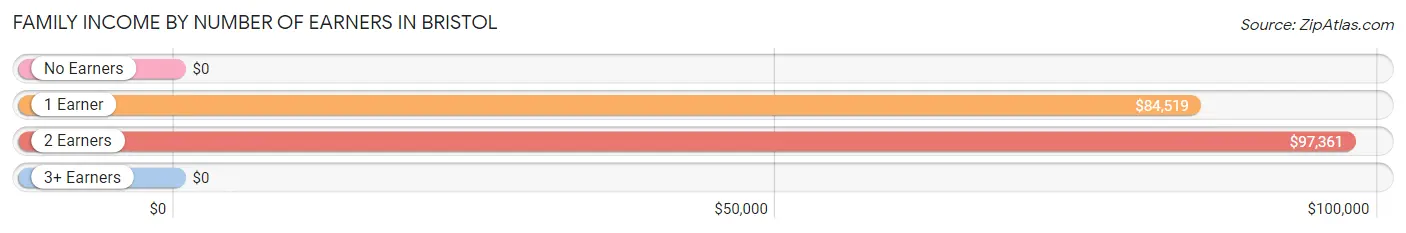
| Number of Earners | # Families | Median Income |
| No Earners | 80 (17.4%) | $0 |
| 1 Earner | 123 (26.7%) | $84,519 |
| 2 Earners | 251 (54.6%) | $97,361 |
| 3+ Earners | 6 (1.3%) | $0 |
| Total | 460 (100.0%) | $83,793 |
Household Income in Bristol
Household Income Brackets in Bristol
With 248 households falling in the category, the $50,000 to $74,999 income range is the most frequent in Bristol, accounting for 26.3% of all households. In contrast, only 21 households (2.2%) fall into the $10,000 to $14,999 income bracket, making it the least populous group.
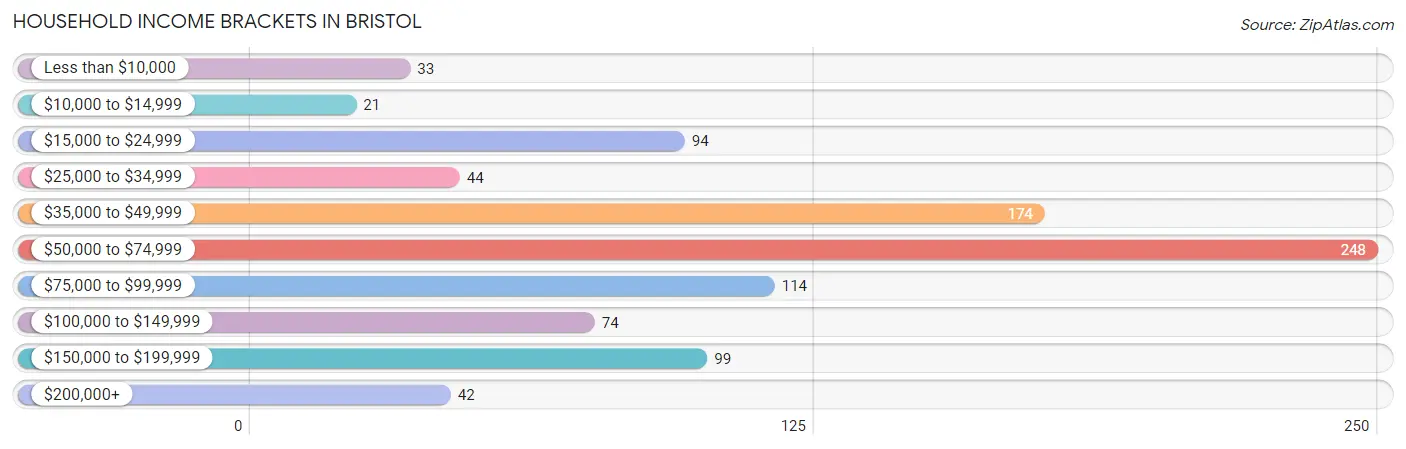
| Income Bracket | # Households | % Households |
| Less than $10,000 | 33 | 3.5% |
| $10,000 to $14,999 | 21 | 2.2% |
| $15,000 to $24,999 | 94 | 10.0% |
| $25,000 to $34,999 | 44 | 4.7% |
| $35,000 to $49,999 | 174 | 18.5% |
| $50,000 to $74,999 | 248 | 26.3% |
| $75,000 to $99,999 | 114 | 12.1% |
| $100,000 to $149,999 | 74 | 7.8% |
| $150,000 to $199,999 | 99 | 10.5% |
| $200,000+ | 42 | 4.5% |
Household Income by Householder Age in Bristol
The median household income in Bristol is $65,536, with the highest median household income of $80,114 found in the 15 to 24 years age bracket for the primary householder. A total of 75 households (8.0%) fall into this category. Meanwhile, the 65+ years age bracket for the primary householder has the lowest median household income of $47,841, with 309 households (32.8%) in this group.
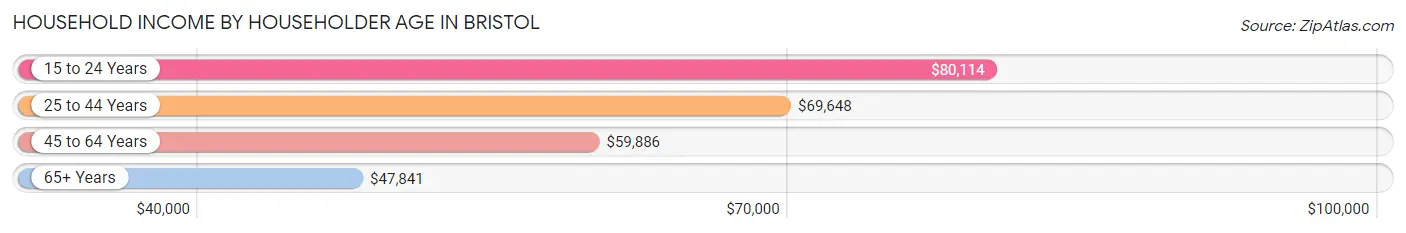
| Income Bracket | # Households | Median Income |
| 15 to 24 Years | 75 (8.0%) | $80,114 |
| 25 to 44 Years | 186 (19.7%) | $69,648 |
| 45 to 64 Years | 373 (39.6%) | $59,886 |
| 65+ Years | 309 (32.8%) | $47,841 |
| Total | 943 (100.0%) | $65,536 |
Poverty in Bristol
Income Below Poverty by Sex and Age in Bristol
With 8.0% poverty level for males and 16.4% for females among the residents of Bristol, 15 year old males and 55 to 64 year old females are the most vulnerable to poverty, with 26 males (72.2%) and 92 females (44.2%) in their respective age groups living below the poverty level.
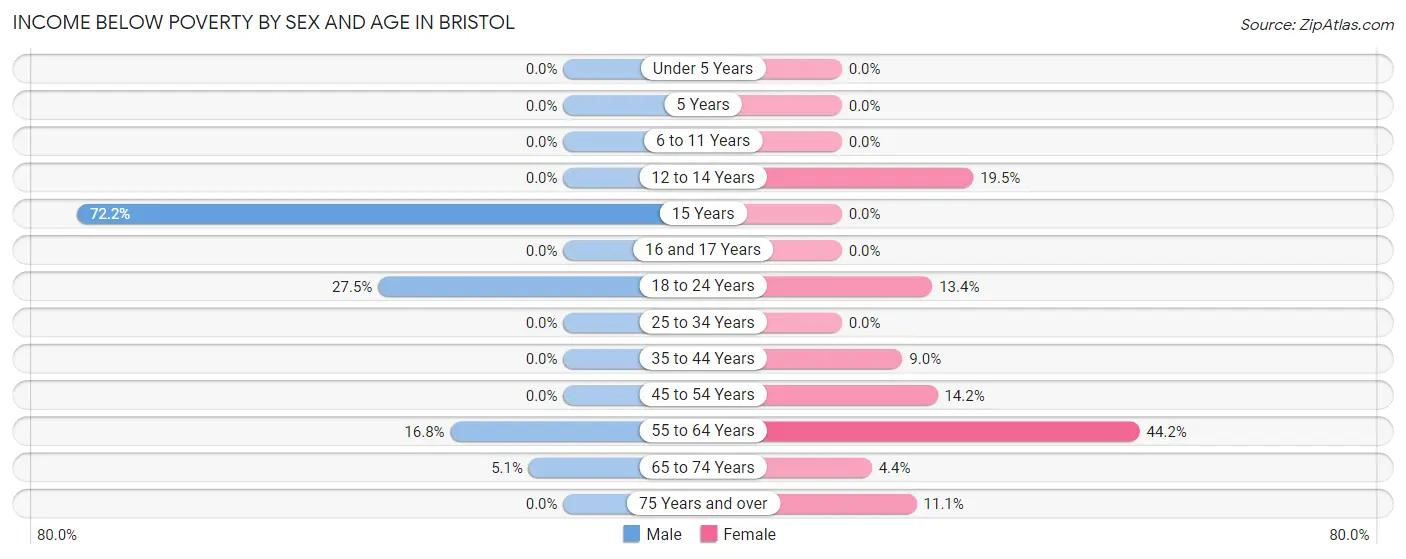
| Age Bracket | Male | Female |
| Under 5 Years | 0 (0.0%) | 0 (0.0%) |
| 5 Years | 0 (0.0%) | 0 (0.0%) |
| 6 to 11 Years | 0 (0.0%) | 0 (0.0%) |
| 12 to 14 Years | 0 (0.0%) | 8 (19.5%) |
| 15 Years | 26 (72.2%) | 0 (0.0%) |
| 16 and 17 Years | 0 (0.0%) | 0 (0.0%) |
| 18 to 24 Years | 11 (27.5%) | 9 (13.4%) |
| 25 to 34 Years | 0 (0.0%) | 0 (0.0%) |
| 35 to 44 Years | 0 (0.0%) | 9 (9.0%) |
| 45 to 54 Years | 0 (0.0%) | 27 (14.2%) |
| 55 to 64 Years | 27 (16.8%) | 92 (44.2%) |
| 65 to 74 Years | 10 (5.1%) | 4 (4.4%) |
| 75 Years and over | 0 (0.0%) | 15 (11.1%) |
| Total | 74 (8.0%) | 164 (16.4%) |
Income Above Poverty by Sex and Age in Bristol
According to the poverty statistics in Bristol, males aged under 5 years and females aged under 5 years are the age groups that are most secure financially, with 100.0% of males and 100.0% of females in these age groups living above the poverty line.
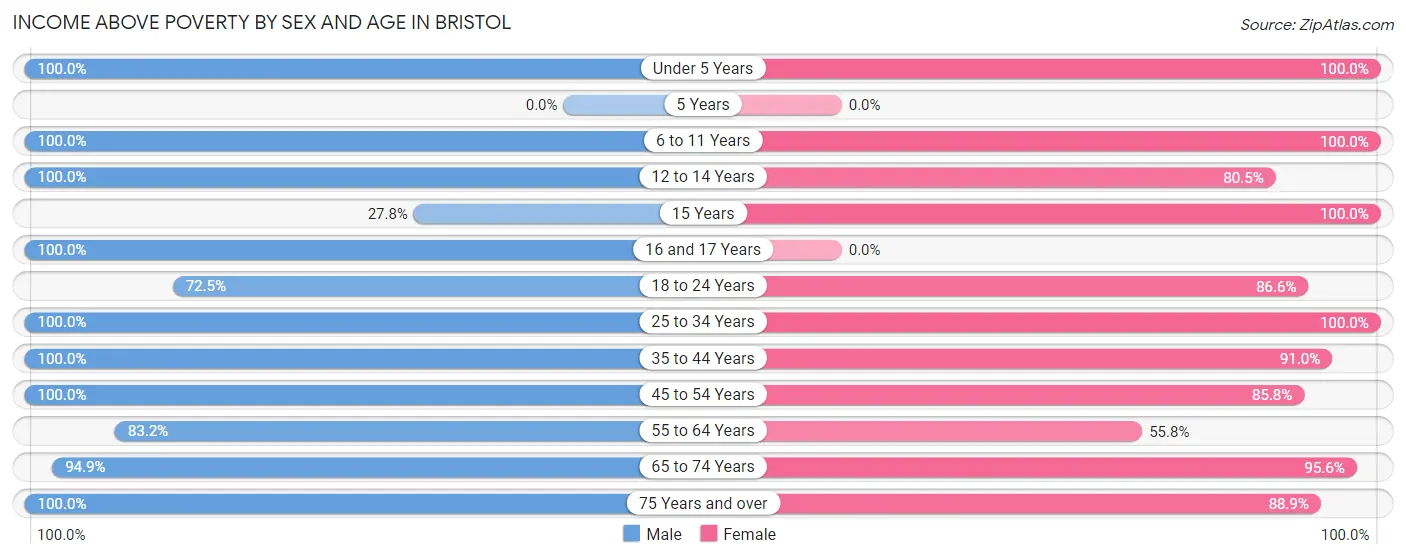
| Age Bracket | Male | Female |
| Under 5 Years | 7 (100.0%) | 48 (100.0%) |
| 5 Years | 0 (0.0%) | 0 (0.0%) |
| 6 to 11 Years | 77 (100.0%) | 36 (100.0%) |
| 12 to 14 Years | 45 (100.0%) | 33 (80.5%) |
| 15 Years | 10 (27.8%) | 24 (100.0%) |
| 16 and 17 Years | 26 (100.0%) | 0 (0.0%) |
| 18 to 24 Years | 29 (72.5%) | 58 (86.6%) |
| 25 to 34 Years | 12 (100.0%) | 62 (100.0%) |
| 35 to 44 Years | 127 (100.0%) | 91 (91.0%) |
| 45 to 54 Years | 149 (100.0%) | 163 (85.8%) |
| 55 to 64 Years | 134 (83.2%) | 116 (55.8%) |
| 65 to 74 Years | 185 (94.9%) | 86 (95.6%) |
| 75 Years and over | 45 (100.0%) | 120 (88.9%) |
| Total | 846 (92.0%) | 837 (83.6%) |
Income Below Poverty Among Married-Couple Families in Bristol
The poverty statistics for married-couple families in Bristol show that 9.2% or 31 of the total 337 families live below the poverty line. Families with 1 or 2 children have the highest poverty rate of 38.0%, comprising of 27 families. On the other hand, families with 3 or 4 children have the lowest poverty rate of 0.0%, which includes 0 families.
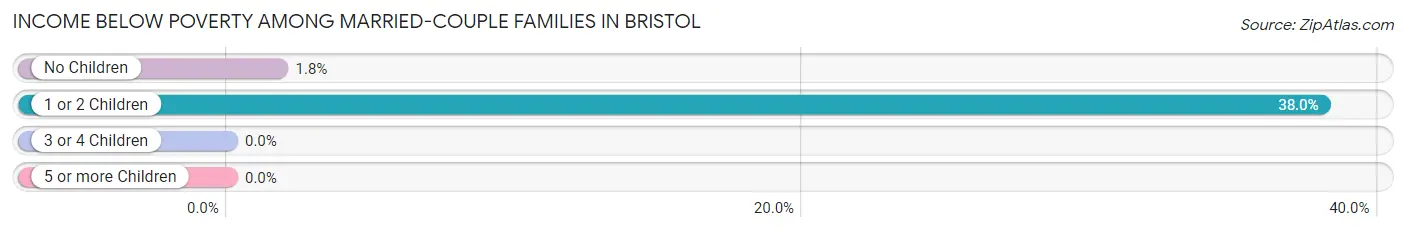
| Children | Above Poverty | Below Poverty |
| No Children | 223 (98.2%) | 4 (1.8%) |
| 1 or 2 Children | 44 (62.0%) | 27 (38.0%) |
| 3 or 4 Children | 39 (100.0%) | 0 (0.0%) |
| 5 or more Children | 0 (0.0%) | 0 (0.0%) |
| Total | 306 (90.8%) | 31 (9.2%) |
Income Below Poverty Among Single-Parent Households in Bristol
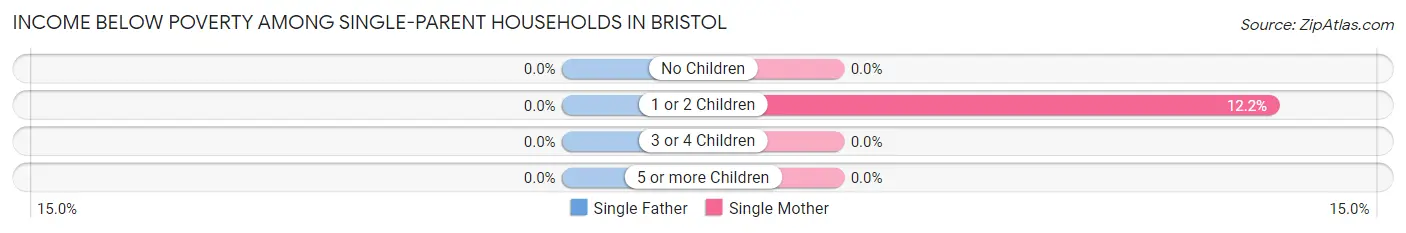
| Children | Single Father | Single Mother |
| No Children | 0 (0.0%) | 0 (0.0%) |
| 1 or 2 Children | 0 (0.0%) | 9 (12.2%) |
| 3 or 4 Children | 0 (0.0%) | 0 (0.0%) |
| 5 or more Children | 0 (0.0%) | 0 (0.0%) |
| Total | 0 (0.0%) | 9 (8.0%) |
Income Below Poverty Among Married-Couple vs Single-Parent Households in Bristol
The poverty data for Bristol shows that 31 of the married-couple family households (9.2%) and 9 of the single-parent households (7.3%) are living below the poverty level. Within the married-couple family households, those with 1 or 2 children have the highest poverty rate, with 27 households (38.0%) falling below the poverty line. Among the single-parent households, those with 1 or 2 children have the highest poverty rate, with 9 household (10.7%) living below poverty.
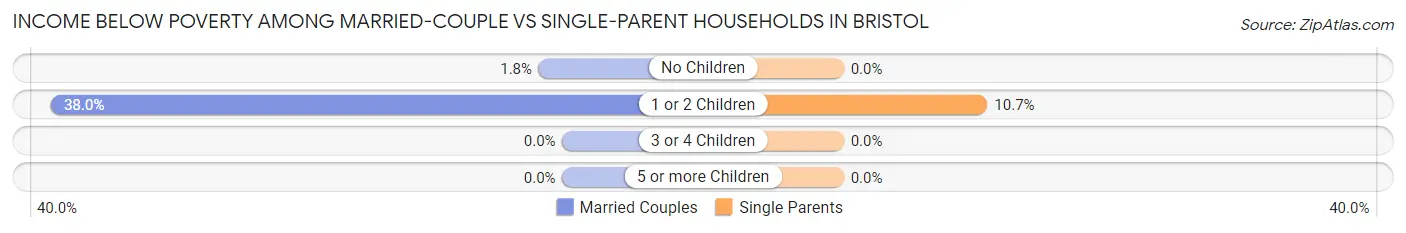
| Children | Married-Couple Families | Single-Parent Households |
| No Children | 4 (1.8%) | 0 (0.0%) |
| 1 or 2 Children | 27 (38.0%) | 9 (10.7%) |
| 3 or 4 Children | 0 (0.0%) | 0 (0.0%) |
| 5 or more Children | 0 (0.0%) | 0 (0.0%) |
| Total | 31 (9.2%) | 9 (7.3%) |
Race in Bristol
The most populous races in Bristol are White / Caucasian (1,852 | 94.7%), Hispanic or Latino (57 | 2.9%), and Black / African American (55 | 2.8%).
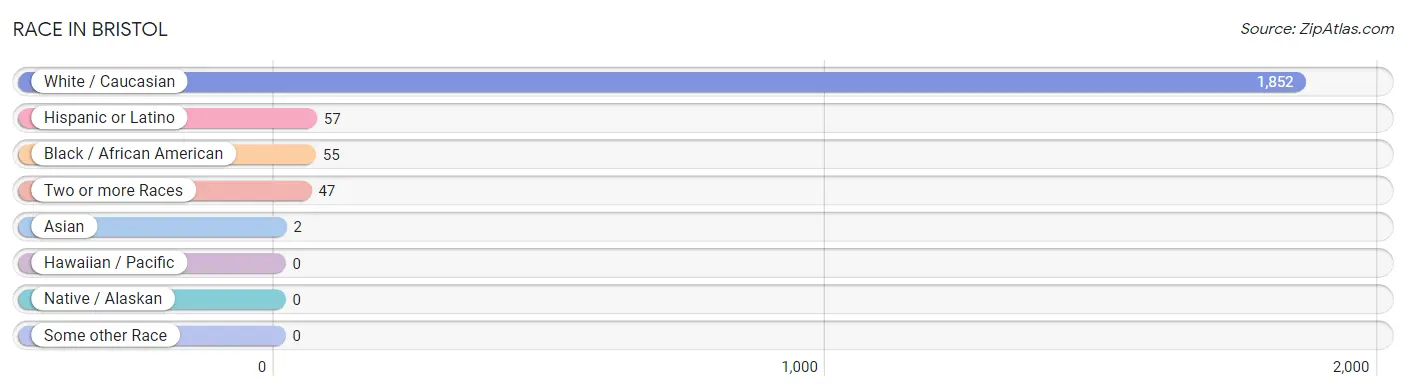
| Race | # Population | % Population |
| Asian | 2 | 0.1% |
| Black / African American | 55 | 2.8% |
| Hawaiian / Pacific | 0 | 0.0% |
| Hispanic or Latino | 57 | 2.9% |
| Native / Alaskan | 0 | 0.0% |
| White / Caucasian | 1,852 | 94.7% |
| Two or more Races | 47 | 2.4% |
| Some other Race | 0 | 0.0% |
| Total | 1,956 | 100.0% |
Ancestry in Bristol
The most populous ancestries reported in Bristol are English (485 | 24.8%), American (345 | 17.6%), Irish (340 | 17.4%), Danish (163 | 8.3%), and French (141 | 7.2%), together accounting for 75.4% of all Bristol residents.
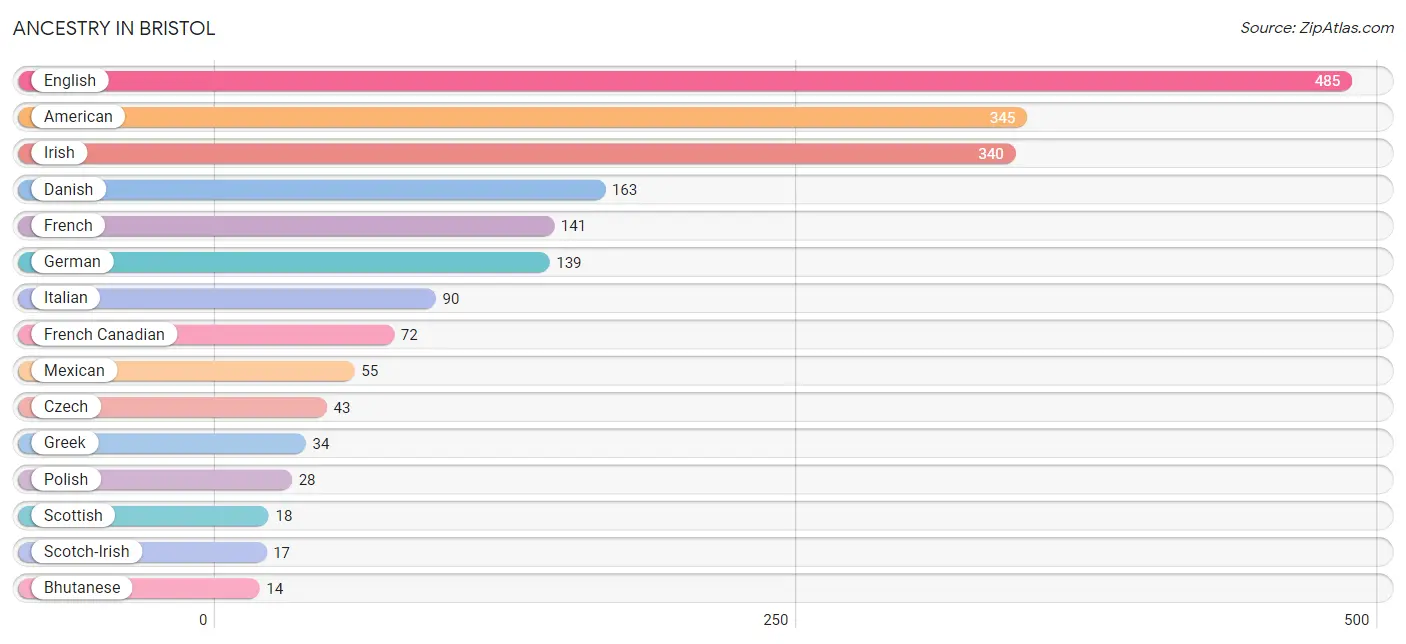
| Ancestry | # Population | % Population |
| American | 345 | 17.6% |
| Austrian | 6 | 0.3% |
| Bhutanese | 14 | 0.7% |
| British | 6 | 0.3% |
| Czech | 43 | 2.2% |
| Danish | 163 | 8.3% |
| English | 485 | 24.8% |
| European | 6 | 0.3% |
| Finnish | 14 | 0.7% |
| French | 141 | 7.2% |
| French Canadian | 72 | 3.7% |
| German | 139 | 7.1% |
| Greek | 34 | 1.7% |
| Iranian | 3 | 0.2% |
| Irish | 340 | 17.4% |
| Italian | 90 | 4.6% |
| Mexican | 55 | 2.8% |
| Polish | 28 | 1.4% |
| Russian | 6 | 0.3% |
| Scotch-Irish | 17 | 0.9% |
| Scottish | 18 | 0.9% |
| Slavic | 13 | 0.7% |
| Swedish | 7 | 0.4% |
| Ukrainian | 8 | 0.4% |
| Welsh | 13 | 0.7% | View All 25 Rows |
Immigrants in Bristol
The most numerous immigrant groups reported in Bristol came from Central America (55 | 2.8%), Latin America (55 | 2.8%), Mexico (55 | 2.8%), Canada (11 | 0.6%), and Asia (3 | 0.2%), together accounting for 9.1% of all Bristol residents.
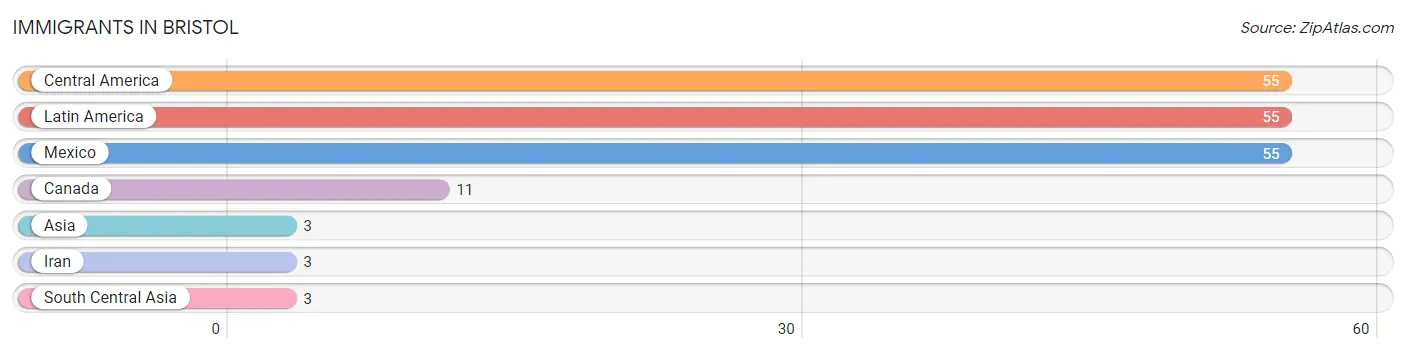
| Immigration Origin | # Population | % Population |
| Asia | 3 | 0.2% |
| Canada | 11 | 0.6% |
| Central America | 55 | 2.8% |
| Iran | 3 | 0.2% |
| Latin America | 55 | 2.8% |
| Mexico | 55 | 2.8% |
| South Central Asia | 3 | 0.2% | View All 7 Rows |
Sex and Age in Bristol
Sex and Age in Bristol
The most populous age groups in Bristol are 55 to 59 Years (102 | 11.0%) for men and 55 to 59 Years (140 | 13.6%) for women.
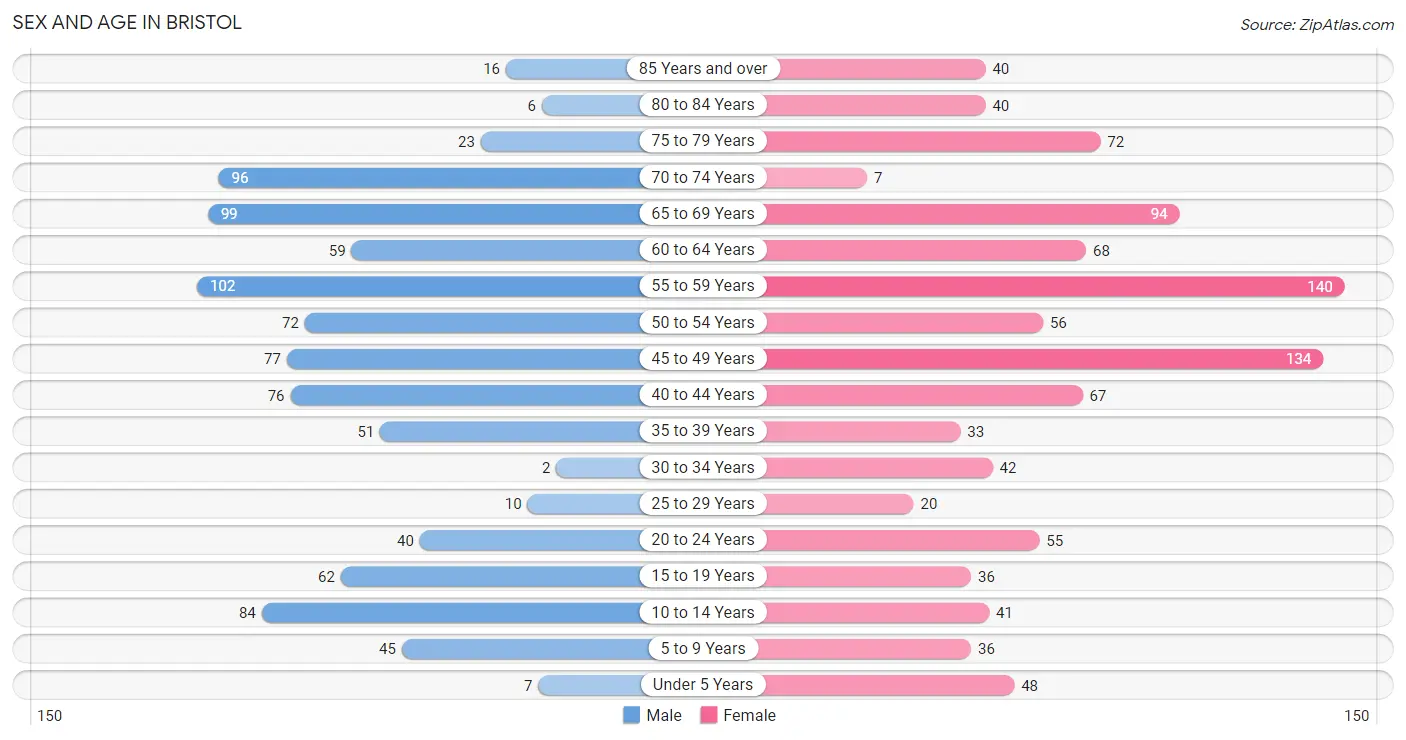
| Age Bracket | Male | Female |
| Under 5 Years | 7 (0.8%) | 48 (4.7%) |
| 5 to 9 Years | 45 (4.9%) | 36 (3.5%) |
| 10 to 14 Years | 84 (9.1%) | 41 (4.0%) |
| 15 to 19 Years | 62 (6.7%) | 36 (3.5%) |
| 20 to 24 Years | 40 (4.3%) | 55 (5.3%) |
| 25 to 29 Years | 10 (1.1%) | 20 (1.9%) |
| 30 to 34 Years | 2 (0.2%) | 42 (4.1%) |
| 35 to 39 Years | 51 (5.5%) | 33 (3.2%) |
| 40 to 44 Years | 76 (8.2%) | 67 (6.5%) |
| 45 to 49 Years | 77 (8.3%) | 134 (13.0%) |
| 50 to 54 Years | 72 (7.8%) | 56 (5.4%) |
| 55 to 59 Years | 102 (11.0%) | 140 (13.6%) |
| 60 to 64 Years | 59 (6.4%) | 68 (6.6%) |
| 65 to 69 Years | 99 (10.7%) | 94 (9.1%) |
| 70 to 74 Years | 96 (10.4%) | 7 (0.7%) |
| 75 to 79 Years | 23 (2.5%) | 72 (7.0%) |
| 80 to 84 Years | 6 (0.6%) | 40 (3.9%) |
| 85 Years and over | 16 (1.7%) | 40 (3.9%) |
| Total | 927 (100.0%) | 1,029 (100.0%) |
Families and Households in Bristol
Median Family Size in Bristol
The median family size in Bristol is 2.60 persons per family, with single male/father families (10 | 2.2%) accounting for the largest median family size of 3.2 persons per family. On the other hand, single female/mother families (113 | 24.6%) represent the smallest median family size with 2.05 persons per family.
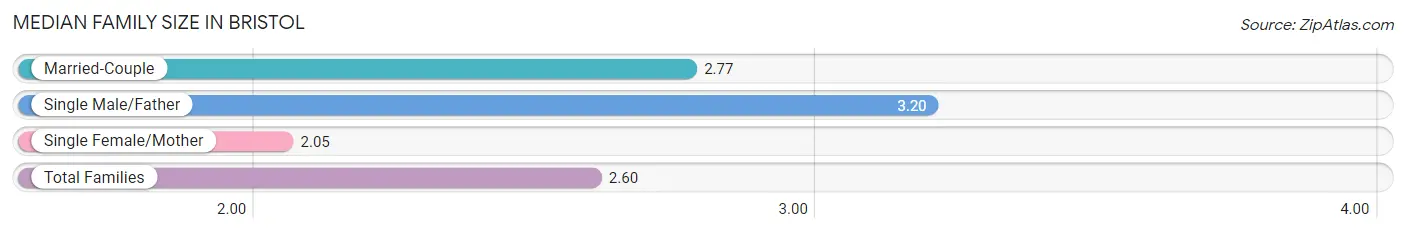
| Family Type | # Families | Family Size |
| Married-Couple | 337 (73.3%) | 2.77 |
| Single Male/Father | 10 (2.2%) | 3.20 |
| Single Female/Mother | 113 (24.6%) | 2.05 |
| Total Families | 460 (100.0%) | 2.60 |
Median Household Size in Bristol
The median household size in Bristol is 2.04 persons per household, with single male/father households (10 | 1.1%) accounting for the largest median household size of 3.2 persons per household. non-family households (483 | 51.2%) represent the smallest median household size with 1.51 persons per household.
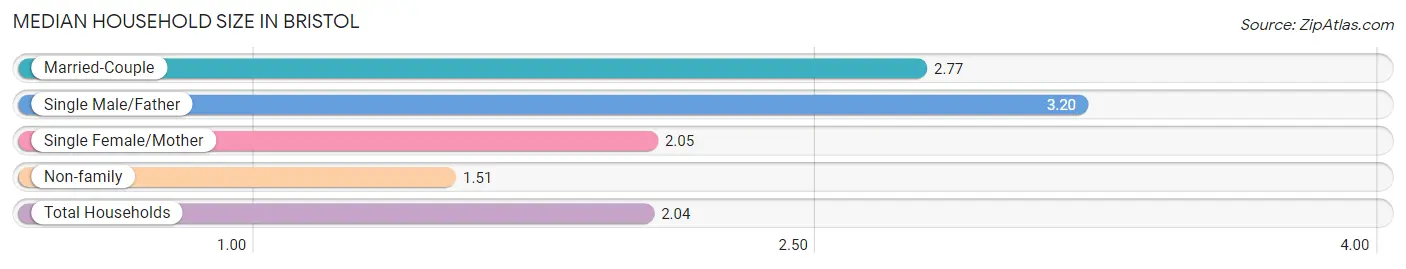
| Household Type | # Households | Household Size |
| Married-Couple | 337 (35.7%) | 2.77 |
| Single Male/Father | 10 (1.1%) | 3.20 |
| Single Female/Mother | 113 (12.0%) | 2.05 |
| Non-family | 483 (51.2%) | 1.51 |
| Total Households | 943 (100.0%) | 2.04 |
Household Size by Marriage Status in Bristol
Out of a total of 943 households in Bristol, 460 (48.8%) are family households, while 483 (51.2%) are nonfamily households. The most numerous type of family households are 2-person households, comprising 334, and the most common type of nonfamily households are 1-person households, comprising 326.
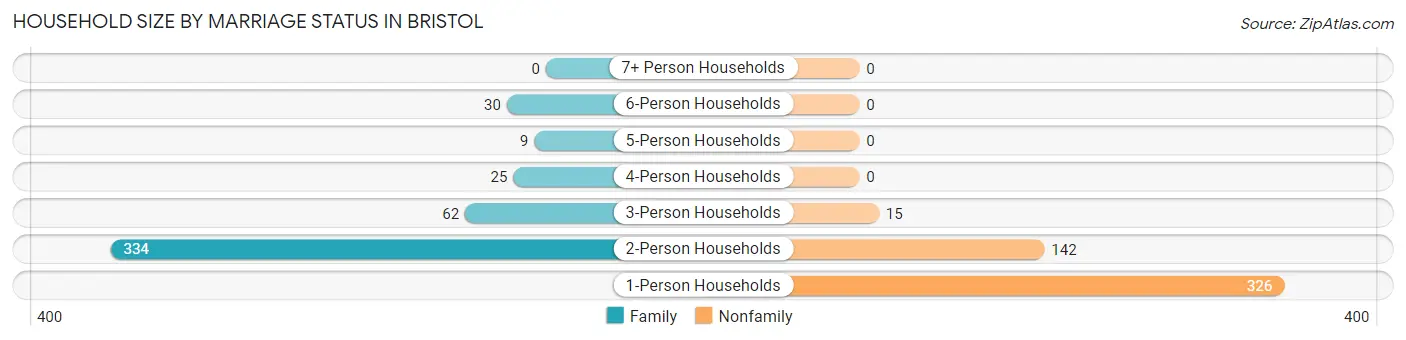
| Household Size | Family Households | Nonfamily Households |
| 1-Person Households | - | 326 (34.6%) |
| 2-Person Households | 334 (35.4%) | 142 (15.1%) |
| 3-Person Households | 62 (6.6%) | 15 (1.6%) |
| 4-Person Households | 25 (2.6%) | 0 (0.0%) |
| 5-Person Households | 9 (0.9%) | 0 (0.0%) |
| 6-Person Households | 30 (3.2%) | 0 (0.0%) |
| 7+ Person Households | 0 (0.0%) | 0 (0.0%) |
| Total | 460 (48.8%) | 483 (51.2%) |
Female Fertility in Bristol
Fertility by Age in Bristol
| Age Bracket | Women with Births | Births / 1,000 Women |
| 15 to 19 years | 0 (0.0%) | 0.0 |
| 20 to 34 years | 0 (0.0%) | 0.0 |
| 35 to 50 years | 0 (0.0%) | 0.0 |
| Total | 0 (0.0%) | 0.0 |
Fertility by Age by Marriage Status in Bristol
| Age Bracket | Married | Unmarried |
| 15 to 19 years | 0 (0.0%) | 0 (0.0%) |
| 20 to 34 years | 0 (0.0%) | 0 (0.0%) |
| 35 to 50 years | 0 (0.0%) | 0 (0.0%) |
| Total | 0 (0.0%) | 0 (0.0%) |
Fertility by Education in Bristol
| Educational Attainment | Women with Births | Births / 1,000 Women |
| Less than High School | 0 (0.0%) | 0.0 |
| High School Diploma | 0 (0.0%) | 0.0 |
| College or Associate's Degree | 0 (0.0%) | 0.0 |
| Bachelor's Degree | 0 (0.0%) | 0.0 |
| Graduate Degree | 0 (0.0%) | 0.0 |
| Total | 0 (0.0%) | 0.0 |
Fertility by Education by Marriage Status in Bristol
| Educational Attainment | Married | Unmarried |
| Less than High School | 0 (0.0%) | 0 (0.0%) |
| High School Diploma | 0 (0.0%) | 0 (0.0%) |
| College or Associate's Degree | 0 (0.0%) | 0 (0.0%) |
| Bachelor's Degree | 0 (0.0%) | 0 (0.0%) |
| Graduate Degree | 0 (0.0%) | 0 (0.0%) |
| Total | 0 (0.0%) | 0 (0.0%) |
Employment Characteristics in Bristol
Employment by Class of Employer in Bristol
Among the 957 employed individuals in Bristol, private company employees (517 | 54.0%), not-for-profit organizations (116 | 12.1%), and self-employed (not incorporated) (104 | 10.9%) make up the most common classes of employment.
| Employer Class | # Employees | % Employees |
| Private Company Employees | 517 | 54.0% |
| Self-Employed (Incorporated) | 36 | 3.8% |
| Self-Employed (Not Incorporated) | 104 | 10.9% |
| Not-for-profit Organizations | 116 | 12.1% |
| Local Government Employees | 83 | 8.7% |
| State Government Employees | 32 | 3.3% |
| Federal Government Employees | 69 | 7.2% |
| Unpaid Family Workers | 0 | 0.0% |
| Total | 957 | 100.0% |
Employment Status by Age in Bristol
According to the labor force statistics for Bristol, out of the total population over 16 years of age (1,635), 67.5% or 1,104 individuals are in the labor force, with 8.0% or 88 of them unemployed. The age group with the highest labor force participation rate is 16 to 19 years, with 100.0% or 38 individuals in the labor force. Within the labor force, the 75 years and over age range has the highest percentage of unemployed individuals, with 35.4% or 23 of them being unemployed.
| Age Bracket | In Labor Force | Unemployed |
| 16 to 19 Years | 38 (100.0%) | 0 (0.0%) |
| 20 to 24 Years | 95 (100.0%) | 20 (21.1%) |
| 25 to 29 Years | 30 (100.0%) | 0 (0.0%) |
| 30 to 34 Years | 44 (100.0%) | 0 (0.0%) |
| 35 to 44 Years | 197 (86.8%) | 0 (0.0%) |
| 45 to 54 Years | 308 (90.9%) | 18 (5.8%) |
| 55 to 59 Years | 78 (32.2%) | 27 (34.6%) |
| 60 to 64 Years | 88 (69.3%) | 0 (0.0%) |
| 65 to 74 Years | 160 (54.1%) | 0 (0.0%) |
| 75 Years and over | 65 (33.0%) | 23 (35.4%) |
| Total | 1,104 (67.5%) | 88 (8.0%) |
Employment Status by Educational Attainment in Bristol
According to labor force statistics for Bristol, 73.8% of individuals (745) out of the total population between 25 and 64 years of age (1,009) are in the labor force, with 6.0% or 45 of them being unemployed. The group with the highest labor force participation rate are those with the educational attainment of less than high school, with 100.0% or 45 individuals in the labor force. Within the labor force, individuals with less than high school education have the highest percentage of unemployment, with 100.0% or 45 of them being unemployed.
| Educational Attainment | In Labor Force | Unemployed |
| Less than High School | 45 (100.0%) | 45 (100.0%) |
| High School Diploma | 214 (55.9%) | 0 (0.0%) |
| College / Associate Degree | 191 (80.3%) | 0 (0.0%) |
| Bachelor's Degree or higher | 295 (86.0%) | 0 (0.0%) |
| Total | 745 (73.8%) | 61 (6.0%) |
Employment Occupations by Sex in Bristol
Management, Business, Science and Arts Occupations
The most common Management, Business, Science and Arts occupations in Bristol are Community & Social Service (84 | 8.3%), Education Instruction & Library (75 | 7.4%), Health Diagnosing & Treating (74 | 7.3%), Health Technologists (74 | 7.3%), and Management (66 | 6.5%).
Management, Business, Science and Arts Occupations by Sex
Within the Management, Business, Science and Arts occupations in Bristol, the most male-oriented occupations are Business & Financial (100.0%), Arts, Media & Entertainment (100.0%), and Architecture & Engineering (76.1%), while the most female-oriented occupations are Life, Physical & Social Science (100.0%), Health Diagnosing & Treating (87.8%), and Health Technologists (87.8%).
| Occupation | Male | Female |
| Management | 42 (63.6%) | 24 (36.4%) |
| Business & Financial | 47 (100.0%) | 0 (0.0%) |
| Computers, Engineering & Science | 35 (63.6%) | 20 (36.4%) |
| Computers & Mathematics | 0 (0.0%) | 0 (0.0%) |
| Architecture & Engineering | 35 (76.1%) | 11 (23.9%) |
| Life, Physical & Social Science | 0 (0.0%) | 9 (100.0%) |
| Community & Social Service | 21 (25.0%) | 63 (75.0%) |
| Education, Arts & Media | 0 (0.0%) | 0 (0.0%) |
| Legal Services & Support | 0 (0.0%) | 0 (0.0%) |
| Education Instruction & Library | 12 (16.0%) | 63 (84.0%) |
| Arts, Media & Entertainment | 9 (100.0%) | 0 (0.0%) |
| Health Diagnosing & Treating | 9 (12.2%) | 65 (87.8%) |
| Health Technologists | 9 (12.2%) | 65 (87.8%) |
| Total (Category) | 154 (47.2%) | 172 (52.8%) |
| Total (Overall) | 525 (51.7%) | 490 (48.3%) |
Services Occupations
The most common Services occupations in Bristol are Healthcare Support (37 | 3.6%), Food Preparation & Serving (26 | 2.6%), Security & Protection (8 | 0.8%), and Firefighting & Prevention (8 | 0.8%).
Services Occupations by Sex
Within the Services occupations in Bristol, the most male-oriented occupations are Food Preparation & Serving (100.0%), and Healthcare Support (13.5%), while the most female-oriented occupations are Security & Protection (100.0%), Firefighting & Prevention (100.0%), and Healthcare Support (86.5%).
| Occupation | Male | Female |
| Healthcare Support | 5 (13.5%) | 32 (86.5%) |
| Security & Protection | 0 (0.0%) | 8 (100.0%) |
| Firefighting & Prevention | 0 (0.0%) | 8 (100.0%) |
| Law Enforcement | 0 (0.0%) | 0 (0.0%) |
| Food Preparation & Serving | 26 (100.0%) | 0 (0.0%) |
| Cleaning & Maintenance | 0 (0.0%) | 0 (0.0%) |
| Personal Care & Service | 0 (0.0%) | 0 (0.0%) |
| Total (Category) | 31 (43.7%) | 40 (56.3%) |
| Total (Overall) | 525 (51.7%) | 490 (48.3%) |
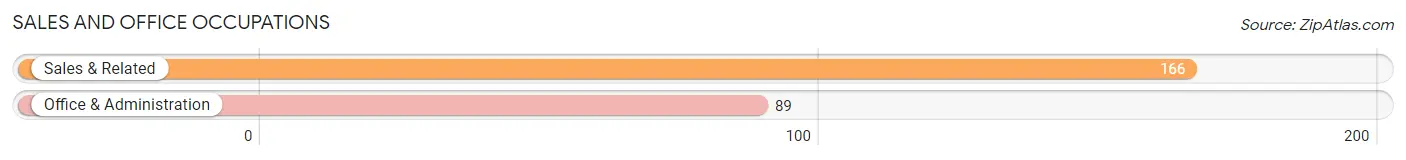
Sales and Office Occupations
The most common Sales and Office occupations in Bristol are Sales & Related (166 | 16.4%), and Office & Administration (89 | 8.8%).
Sales and Office Occupations by Sex
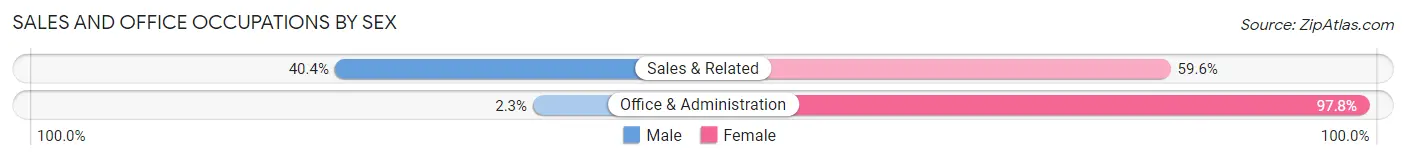
| Occupation | Male | Female |
| Sales & Related | 67 (40.4%) | 99 (59.6%) |
| Office & Administration | 2 (2.2%) | 87 (97.8%) |
| Total (Category) | 69 (27.1%) | 186 (72.9%) |
| Total (Overall) | 525 (51.7%) | 490 (48.3%) |
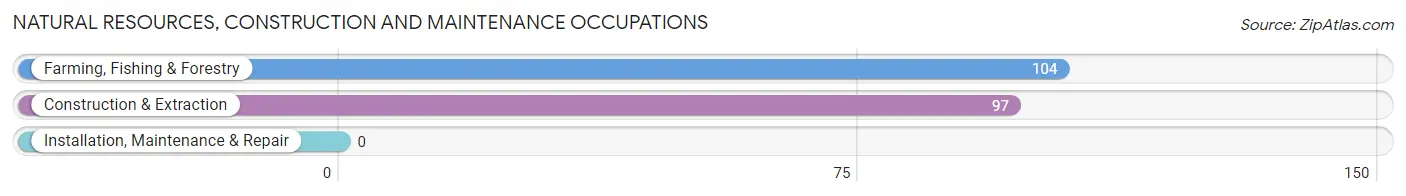
Natural Resources, Construction and Maintenance Occupations
The most common Natural Resources, Construction and Maintenance occupations in Bristol are Farming, Fishing & Forestry (104 | 10.2%), and Construction & Extraction (97 | 9.6%).
Natural Resources, Construction and Maintenance Occupations by Sex
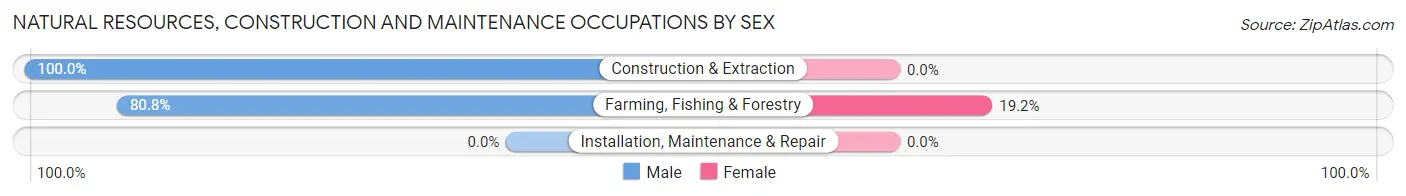
| Occupation | Male | Female |
| Farming, Fishing & Forestry | 84 (80.8%) | 20 (19.2%) |
| Construction & Extraction | 97 (100.0%) | 0 (0.0%) |
| Installation, Maintenance & Repair | 0 (0.0%) | 0 (0.0%) |
| Total (Category) | 181 (90.0%) | 20 (10.0%) |
| Total (Overall) | 525 (51.7%) | 490 (48.3%) |
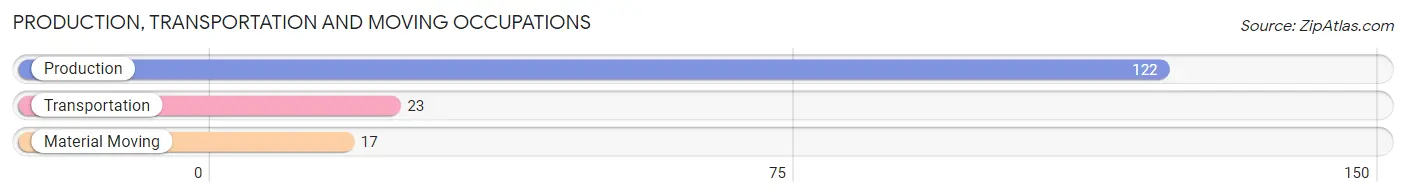
Production, Transportation and Moving Occupations
The most common Production, Transportation and Moving occupations in Bristol are Production (122 | 12.0%), Transportation (23 | 2.3%), and Material Moving (17 | 1.7%).
Production, Transportation and Moving Occupations by Sex
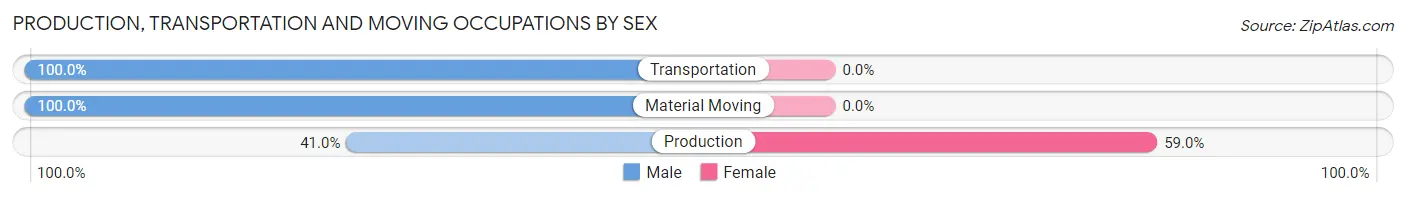
| Occupation | Male | Female |
| Production | 50 (41.0%) | 72 (59.0%) |
| Transportation | 23 (100.0%) | 0 (0.0%) |
| Material Moving | 17 (100.0%) | 0 (0.0%) |
| Total (Category) | 90 (55.6%) | 72 (44.4%) |
| Total (Overall) | 525 (51.7%) | 490 (48.3%) |
Employment Industries by Sex in Bristol
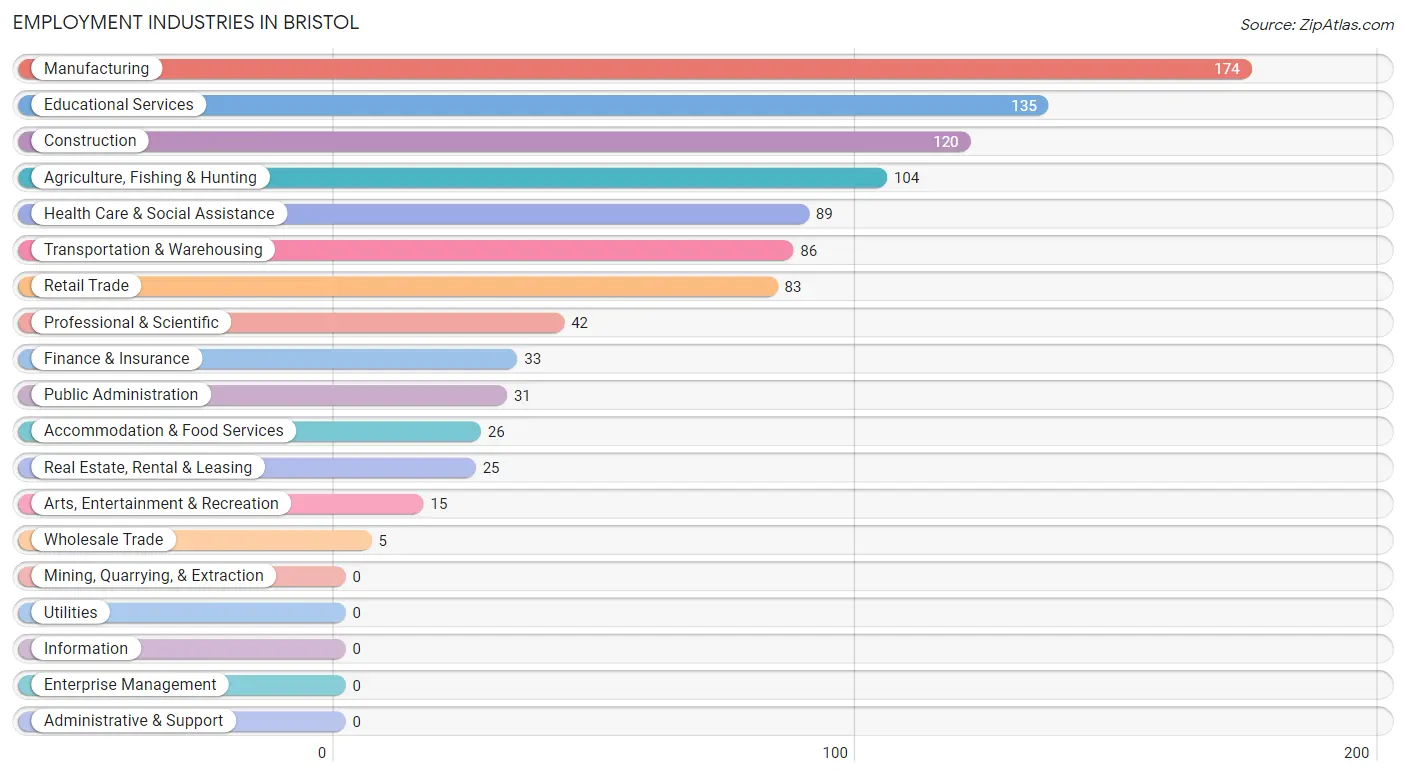
Employment Industries in Bristol
The major employment industries in Bristol include Manufacturing (174 | 17.1%), Educational Services (135 | 13.3%), Construction (120 | 11.8%), Agriculture, Fishing & Hunting (104 | 10.2%), and Health Care & Social Assistance (89 | 8.8%).
Employment Industries by Sex in Bristol
The Bristol industries that see more men than women are Wholesale Trade (100.0%), Accommodation & Food Services (100.0%), and Construction (90.8%), whereas the industries that tend to have a higher number of women are Finance & Insurance (100.0%), Real Estate, Rental & Leasing (100.0%), and Educational Services (91.1%).
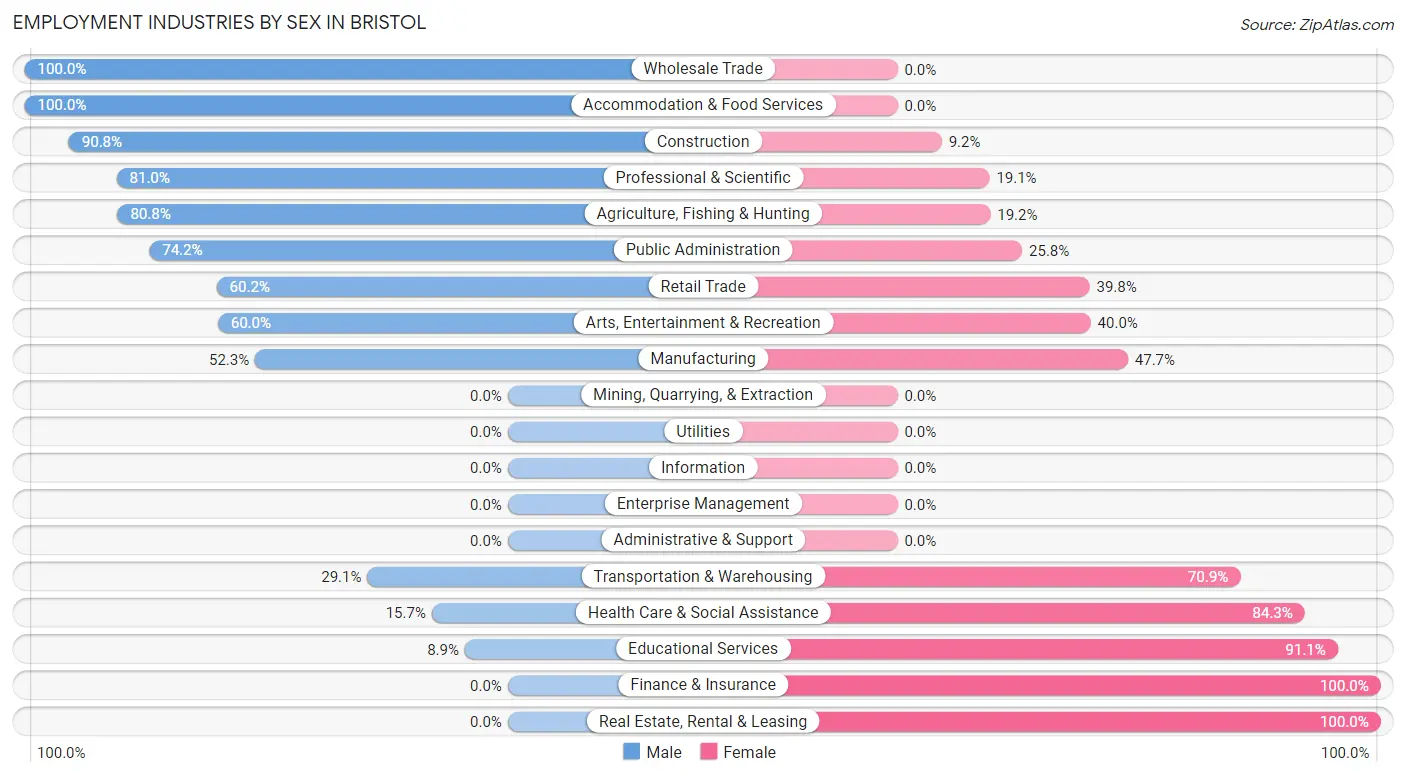
| Industry | Male | Female |
| Agriculture, Fishing & Hunting | 84 (80.8%) | 20 (19.2%) |
| Mining, Quarrying, & Extraction | 0 (0.0%) | 0 (0.0%) |
| Construction | 109 (90.8%) | 11 (9.2%) |
| Manufacturing | 91 (52.3%) | 83 (47.7%) |
| Wholesale Trade | 5 (100.0%) | 0 (0.0%) |
| Retail Trade | 50 (60.2%) | 33 (39.8%) |
| Transportation & Warehousing | 25 (29.1%) | 61 (70.9%) |
| Utilities | 0 (0.0%) | 0 (0.0%) |
| Information | 0 (0.0%) | 0 (0.0%) |
| Finance & Insurance | 0 (0.0%) | 33 (100.0%) |
| Real Estate, Rental & Leasing | 0 (0.0%) | 25 (100.0%) |
| Professional & Scientific | 34 (80.9%) | 8 (19.1%) |
| Enterprise Management | 0 (0.0%) | 0 (0.0%) |
| Administrative & Support | 0 (0.0%) | 0 (0.0%) |
| Educational Services | 12 (8.9%) | 123 (91.1%) |
| Health Care & Social Assistance | 14 (15.7%) | 75 (84.3%) |
| Arts, Entertainment & Recreation | 9 (60.0%) | 6 (40.0%) |
| Accommodation & Food Services | 26 (100.0%) | 0 (0.0%) |
| Public Administration | 23 (74.2%) | 8 (25.8%) |
| Total | 525 (51.7%) | 490 (48.3%) |
Education in Bristol
School Enrollment in Bristol
The most common levels of schooling among the 325 students in Bristol are high school (102 | 31.4%), middle school (93 | 28.6%), and elementary school (73 | 22.5%).
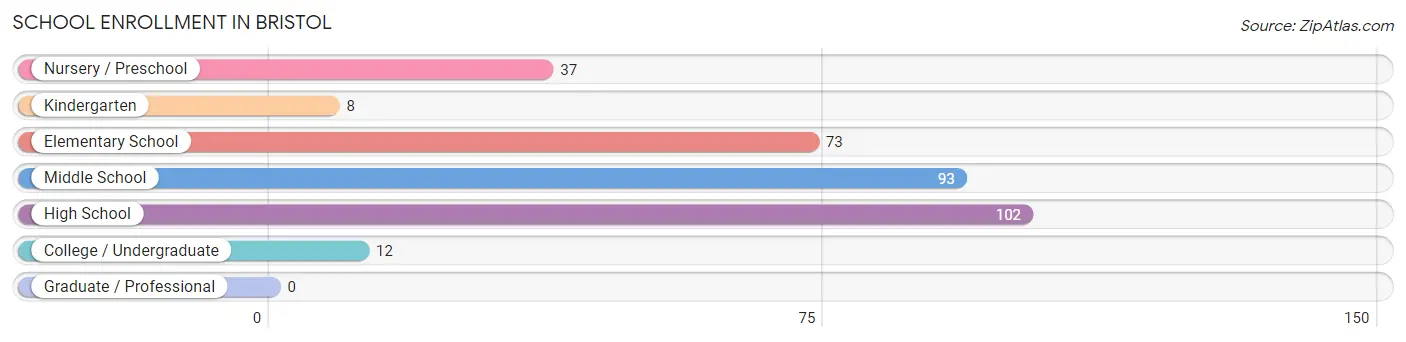
| School Level | # Students | % Students |
| Nursery / Preschool | 37 | 11.4% |
| Kindergarten | 8 | 2.5% |
| Elementary School | 73 | 22.5% |
| Middle School | 93 | 28.6% |
| High School | 102 | 31.4% |
| College / Undergraduate | 12 | 3.7% |
| Graduate / Professional | 0 | 0.0% |
| Total | 325 | 100.0% |
School Enrollment by Age by Funding Source in Bristol
Out of a total of 325 students who are enrolled in schools in Bristol, 20 (6.2%) attend a private institution, while the remaining 305 (93.8%) are enrolled in public schools. The age group of 5 to 9 year old has the highest likelihood of being enrolled in private schools, with 13 (16.1% in the age bracket) enrolled. Conversely, the age group of 3 to 4 year olds has the lowest likelihood of being enrolled in a private school, with 37 (100.0% in the age bracket) attending a public institution.
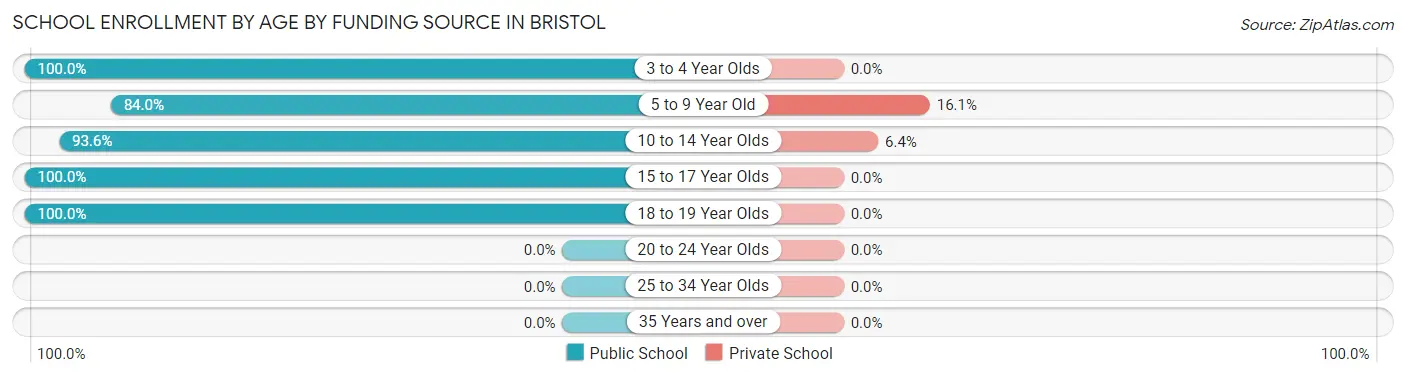
| Age Bracket | Public School | Private School |
| 3 to 4 Year Olds | 37 (100.0%) | 0 (0.0%) |
| 5 to 9 Year Old | 68 (84.0%) | 13 (16.1%) |
| 10 to 14 Year Olds | 102 (93.6%) | 7 (6.4%) |
| 15 to 17 Year Olds | 86 (100.0%) | 0 (0.0%) |
| 18 to 19 Year Olds | 12 (100.0%) | 0 (0.0%) |
| 20 to 24 Year Olds | 0 (0.0%) | 0 (0.0%) |
| 25 to 34 Year Olds | 0 (0.0%) | 0 (0.0%) |
| 35 Years and over | 0 (0.0%) | 0 (0.0%) |
| Total | 305 (93.8%) | 20 (6.2%) |
Educational Attainment by Field of Study in Bristol
Education (144 | 26.4%), literature & languages (83 | 15.2%), engineering (68 | 12.5%), business (44 | 8.1%), and bio, nature & agricultural (38 | 7.0%) are the most common fields of study among 545 individuals in Bristol who have obtained a bachelor's degree or higher.
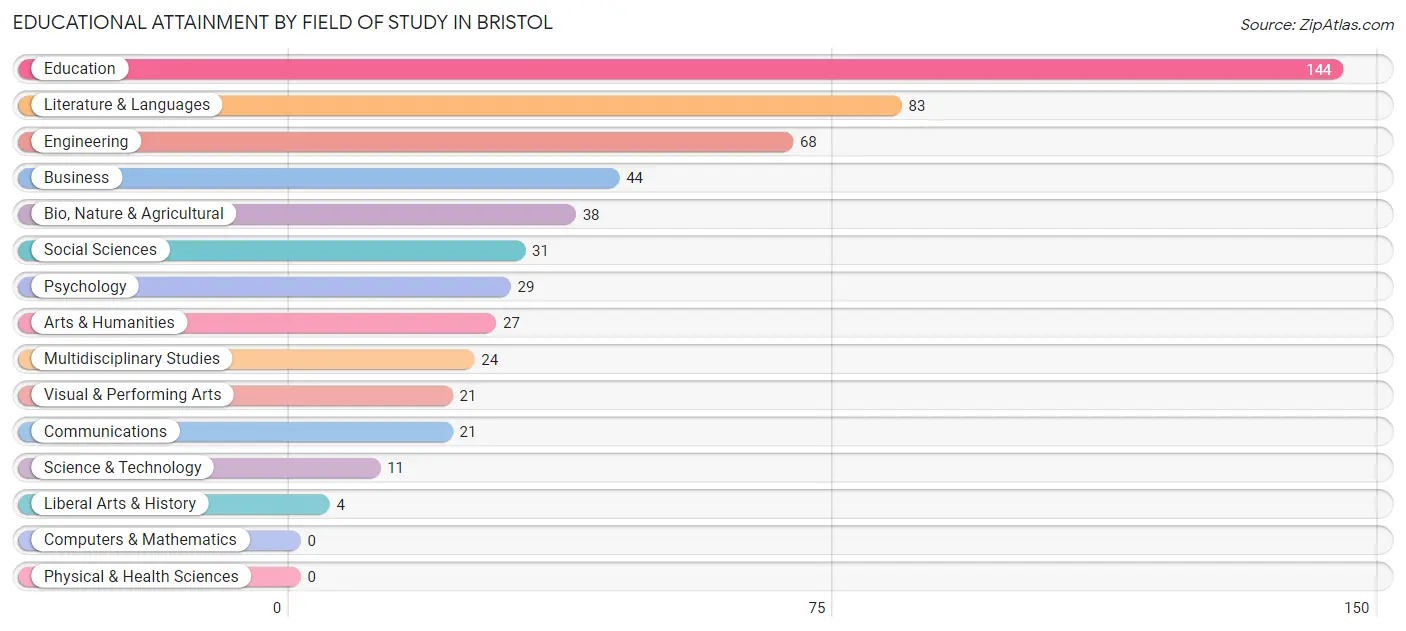
| Field of Study | # Graduates | % Graduates |
| Computers & Mathematics | 0 | 0.0% |
| Bio, Nature & Agricultural | 38 | 7.0% |
| Physical & Health Sciences | 0 | 0.0% |
| Psychology | 29 | 5.3% |
| Social Sciences | 31 | 5.7% |
| Engineering | 68 | 12.5% |
| Multidisciplinary Studies | 24 | 4.4% |
| Science & Technology | 11 | 2.0% |
| Business | 44 | 8.1% |
| Education | 144 | 26.4% |
| Literature & Languages | 83 | 15.2% |
| Liberal Arts & History | 4 | 0.7% |
| Visual & Performing Arts | 21 | 3.8% |
| Communications | 21 | 3.8% |
| Arts & Humanities | 27 | 5.0% |
| Total | 545 | 100.0% |
Transportation & Commute in Bristol
Vehicle Availability by Sex in Bristol
The most prevalent vehicle ownership categories in Bristol are males with 1 vehicle (209, accounting for 40.3%) and females with 1 vehicle (131, making up 47.7%).
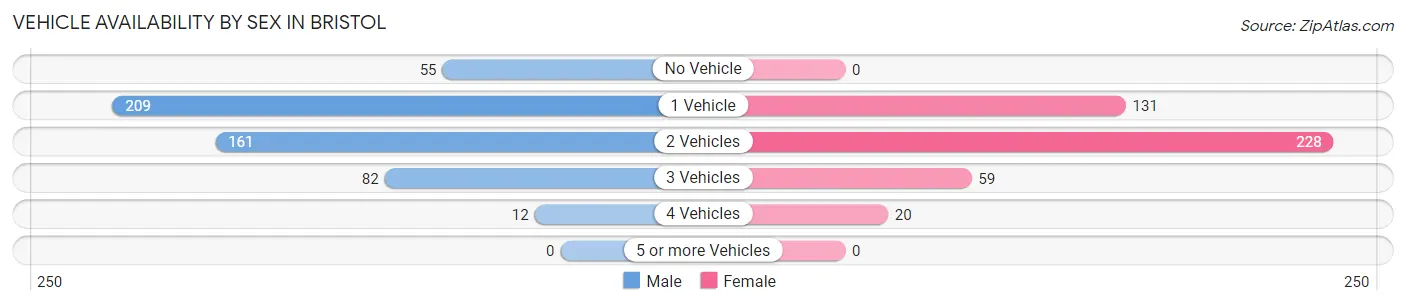
| Vehicles Available | Male | Female |
| No Vehicle | 55 (10.6%) | 0 (0.0%) |
| 1 Vehicle | 209 (40.3%) | 131 (29.9%) |
| 2 Vehicles | 161 (31.0%) | 228 (52.0%) |
| 3 Vehicles | 82 (15.8%) | 59 (13.5%) |
| 4 Vehicles | 12 (2.3%) | 20 (4.6%) |
| 5 or more Vehicles | 0 (0.0%) | 0 (0.0%) |
| Total | 519 (100.0%) | 438 (100.0%) |
Commute Time in Bristol
The most frequently occuring commute durations in Bristol are 15 to 19 minutes (198 commuters, 25.4%), 20 to 24 minutes (168 commuters, 21.5%), and 5 to 9 minutes (107 commuters, 13.7%).
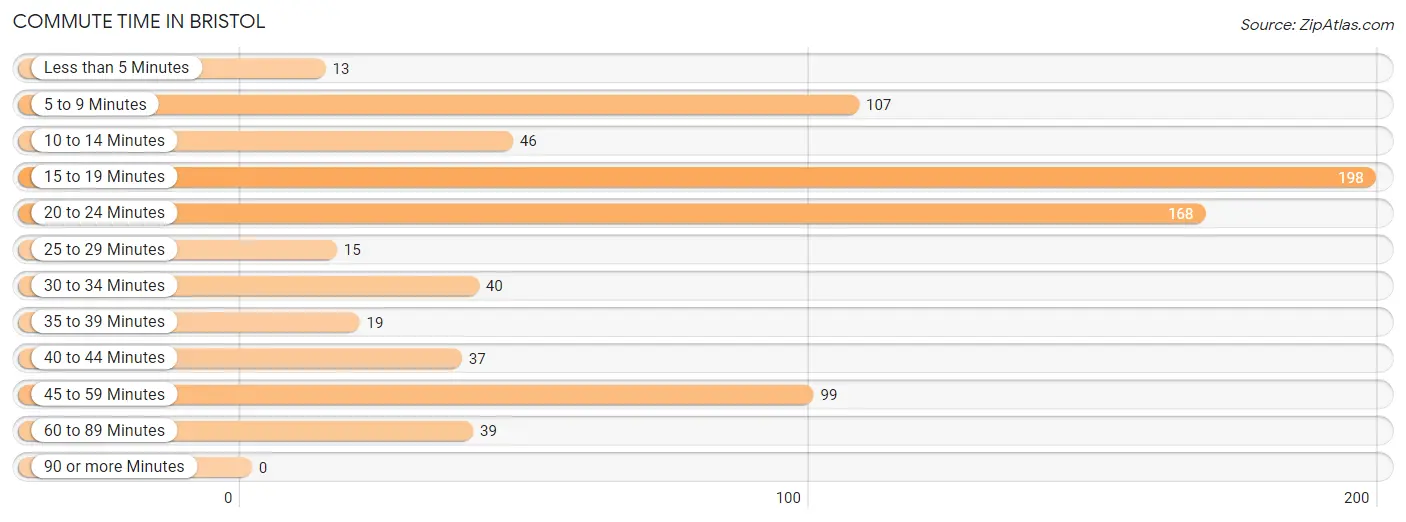
| Commute Time | # Commuters | % Commuters |
| Less than 5 Minutes | 13 | 1.7% |
| 5 to 9 Minutes | 107 | 13.7% |
| 10 to 14 Minutes | 46 | 5.9% |
| 15 to 19 Minutes | 198 | 25.4% |
| 20 to 24 Minutes | 168 | 21.5% |
| 25 to 29 Minutes | 15 | 1.9% |
| 30 to 34 Minutes | 40 | 5.1% |
| 35 to 39 Minutes | 19 | 2.4% |
| 40 to 44 Minutes | 37 | 4.7% |
| 45 to 59 Minutes | 99 | 12.7% |
| 60 to 89 Minutes | 39 | 5.0% |
| 90 or more Minutes | 0 | 0.0% |
Commute Time by Sex in Bristol
The most common commute times in Bristol are 15 to 19 minutes (85 commuters, 18.8%) for males and 15 to 19 minutes (113 commuters, 34.4%) for females.
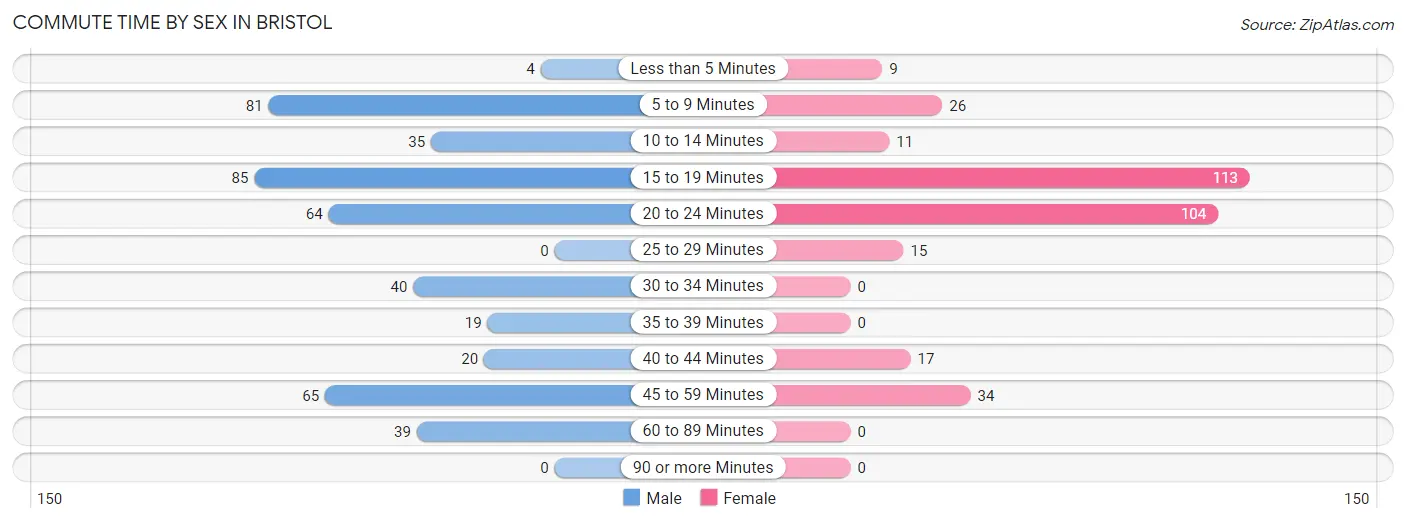
| Commute Time | Male | Female |
| Less than 5 Minutes | 4 (0.9%) | 9 (2.7%) |
| 5 to 9 Minutes | 81 (17.9%) | 26 (7.9%) |
| 10 to 14 Minutes | 35 (7.7%) | 11 (3.3%) |
| 15 to 19 Minutes | 85 (18.8%) | 113 (34.4%) |
| 20 to 24 Minutes | 64 (14.2%) | 104 (31.6%) |
| 25 to 29 Minutes | 0 (0.0%) | 15 (4.6%) |
| 30 to 34 Minutes | 40 (8.8%) | 0 (0.0%) |
| 35 to 39 Minutes | 19 (4.2%) | 0 (0.0%) |
| 40 to 44 Minutes | 20 (4.4%) | 17 (5.2%) |
| 45 to 59 Minutes | 65 (14.4%) | 34 (10.3%) |
| 60 to 89 Minutes | 39 (8.6%) | 0 (0.0%) |
| 90 or more Minutes | 0 (0.0%) | 0 (0.0%) |
Time of Departure to Work by Sex in Bristol
The most frequent times of departure to work in Bristol are 7:30 AM to 7:59 AM (82, 18.1%) for males and 7:30 AM to 7:59 AM (74, 22.5%) for females.
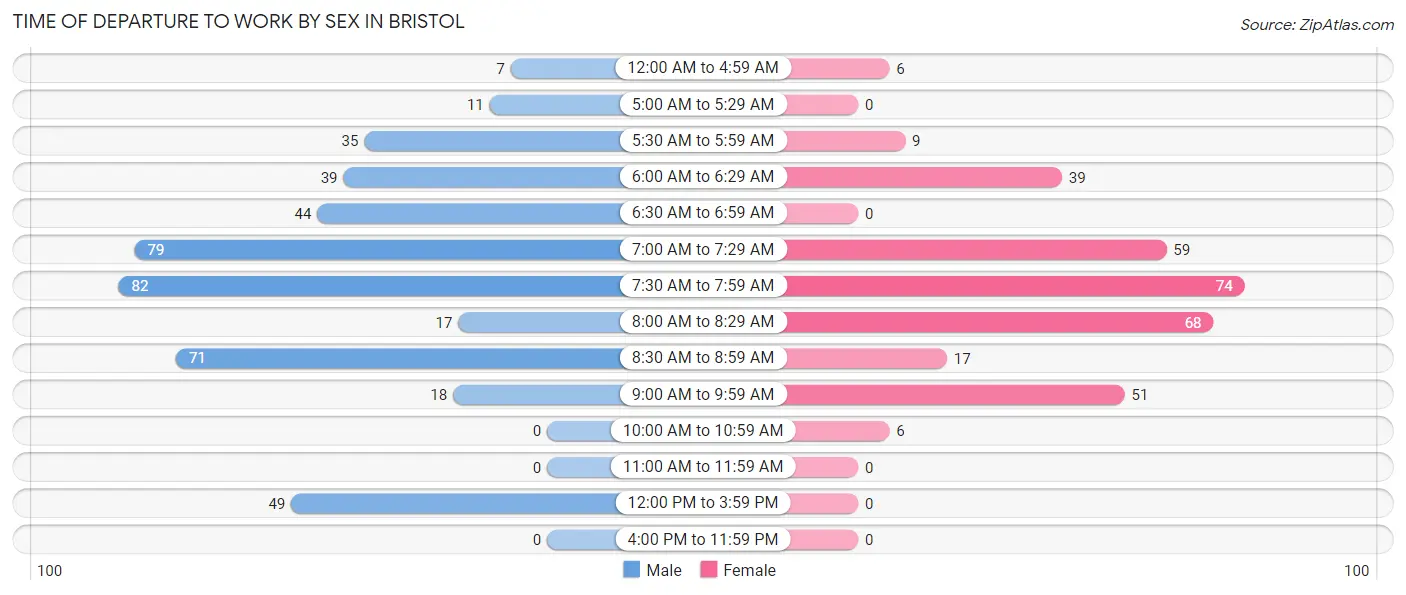
| Time of Departure | Male | Female |
| 12:00 AM to 4:59 AM | 7 (1.5%) | 6 (1.8%) |
| 5:00 AM to 5:29 AM | 11 (2.4%) | 0 (0.0%) |
| 5:30 AM to 5:59 AM | 35 (7.7%) | 9 (2.7%) |
| 6:00 AM to 6:29 AM | 39 (8.6%) | 39 (11.8%) |
| 6:30 AM to 6:59 AM | 44 (9.7%) | 0 (0.0%) |
| 7:00 AM to 7:29 AM | 79 (17.5%) | 59 (17.9%) |
| 7:30 AM to 7:59 AM | 82 (18.1%) | 74 (22.5%) |
| 8:00 AM to 8:29 AM | 17 (3.8%) | 68 (20.7%) |
| 8:30 AM to 8:59 AM | 71 (15.7%) | 17 (5.2%) |
| 9:00 AM to 9:59 AM | 18 (4.0%) | 51 (15.5%) |
| 10:00 AM to 10:59 AM | 0 (0.0%) | 6 (1.8%) |
| 11:00 AM to 11:59 AM | 0 (0.0%) | 0 (0.0%) |
| 12:00 PM to 3:59 PM | 49 (10.8%) | 0 (0.0%) |
| 4:00 PM to 11:59 PM | 0 (0.0%) | 0 (0.0%) |
| Total | 452 (100.0%) | 329 (100.0%) |
Housing Occupancy in Bristol
Occupancy by Ownership in Bristol
Of the total 943 dwellings in Bristol, owner-occupied units account for 660 (70.0%), while renter-occupied units make up 283 (30.0%).
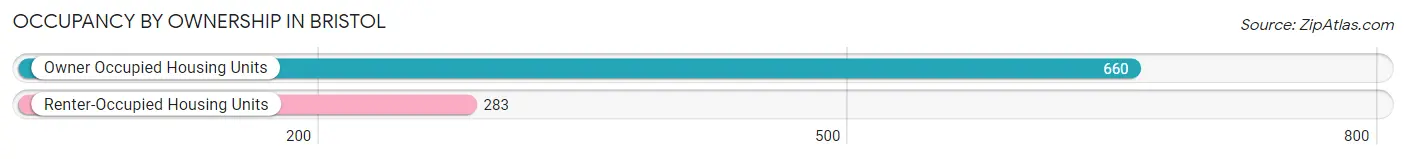
| Occupancy | # Housing Units | % Housing Units |
| Owner Occupied Housing Units | 660 | 70.0% |
| Renter-Occupied Housing Units | 283 | 30.0% |
| Total Occupied Housing Units | 943 | 100.0% |
Occupancy by Household Size in Bristol
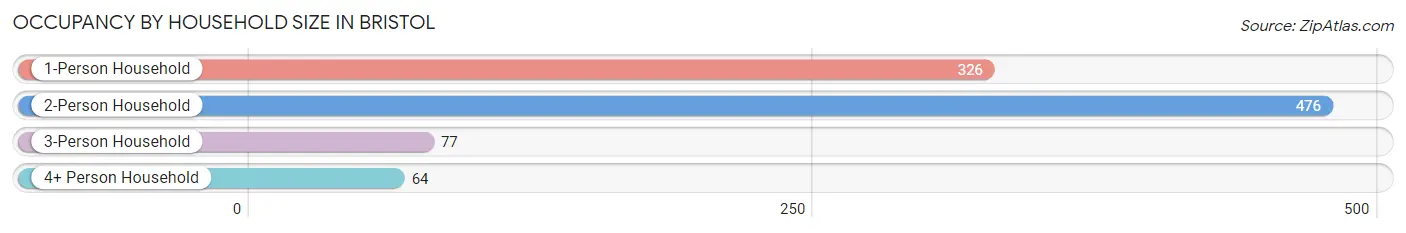
| Household Size | # Housing Units | % Housing Units |
| 1-Person Household | 326 | 34.6% |
| 2-Person Household | 476 | 50.5% |
| 3-Person Household | 77 | 8.2% |
| 4+ Person Household | 64 | 6.8% |
| Total Housing Units | 943 | 100.0% |
Occupancy by Ownership by Household Size in Bristol
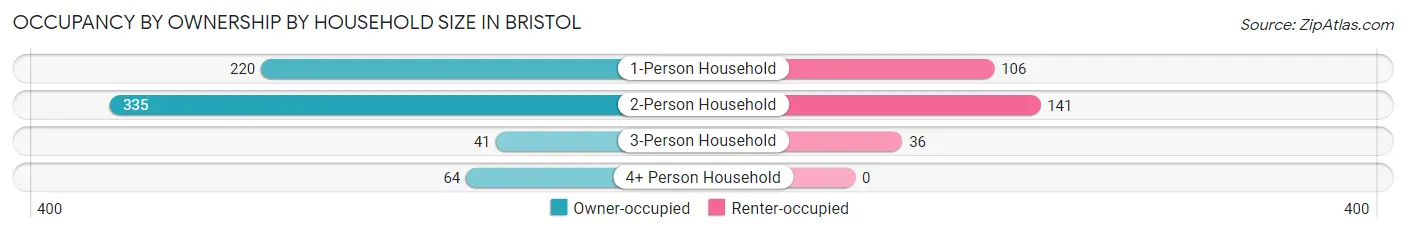
| Household Size | Owner-occupied | Renter-occupied |
| 1-Person Household | 220 (67.5%) | 106 (32.5%) |
| 2-Person Household | 335 (70.4%) | 141 (29.6%) |
| 3-Person Household | 41 (53.2%) | 36 (46.8%) |
| 4+ Person Household | 64 (100.0%) | 0 (0.0%) |
| Total Housing Units | 660 (70.0%) | 283 (30.0%) |
Occupancy by Educational Attainment in Bristol
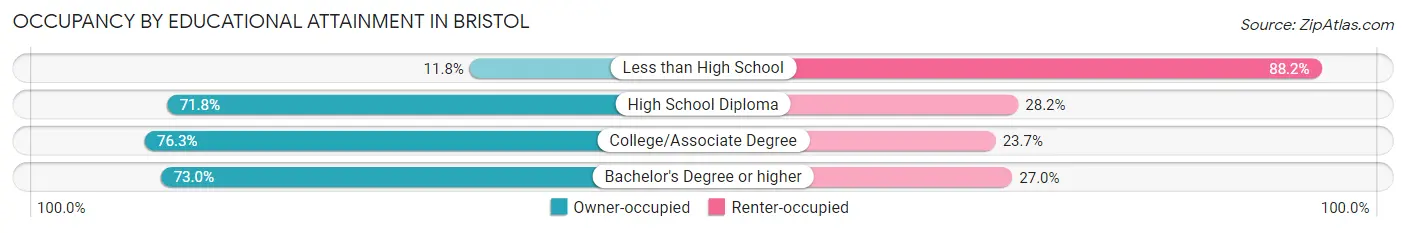
| Household Size | Owner-occupied | Renter-occupied |
| Less than High School | 6 (11.8%) | 45 (88.2%) |
| High School Diploma | 214 (71.8%) | 84 (28.2%) |
| College/Associate Degree | 148 (76.3%) | 46 (23.7%) |
| Bachelor's Degree or higher | 292 (73.0%) | 108 (27.0%) |
Occupancy by Age of Householder in Bristol
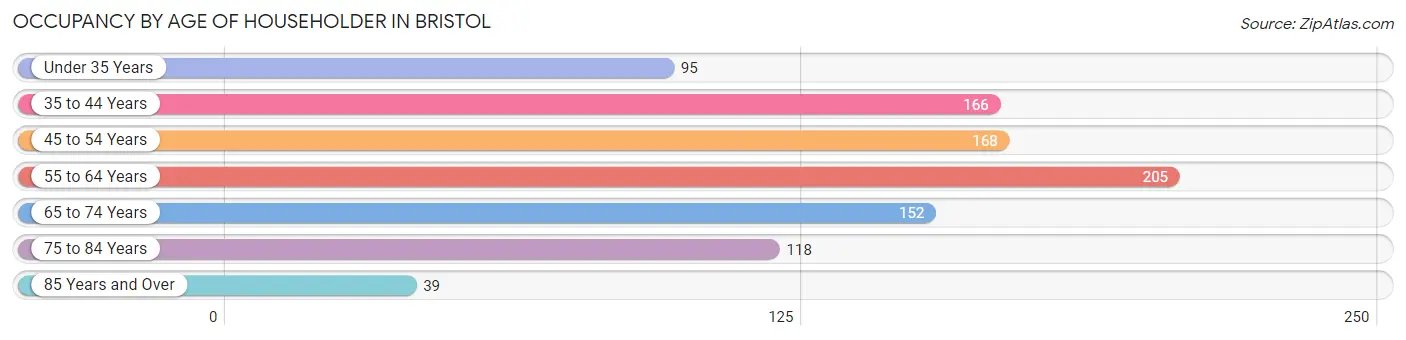
| Age Bracket | # Households | % Households |
| Under 35 Years | 95 | 10.1% |
| 35 to 44 Years | 166 | 17.6% |
| 45 to 54 Years | 168 | 17.8% |
| 55 to 64 Years | 205 | 21.7% |
| 65 to 74 Years | 152 | 16.1% |
| 75 to 84 Years | 118 | 12.5% |
| 85 Years and Over | 39 | 4.1% |
| Total | 943 | 100.0% |
Housing Finances in Bristol
Median Income by Occupancy in Bristol
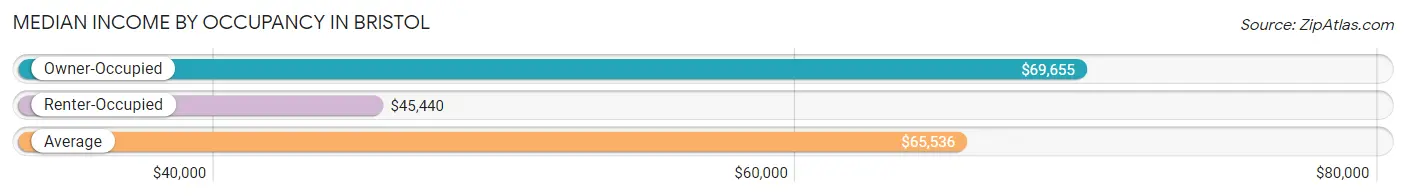
| Occupancy Type | # Households | Median Income |
| Owner-Occupied | 660 (70.0%) | $69,655 |
| Renter-Occupied | 283 (30.0%) | $45,440 |
| Average | 943 (100.0%) | $65,536 |
Occupancy by Householder Income Bracket in Bristol
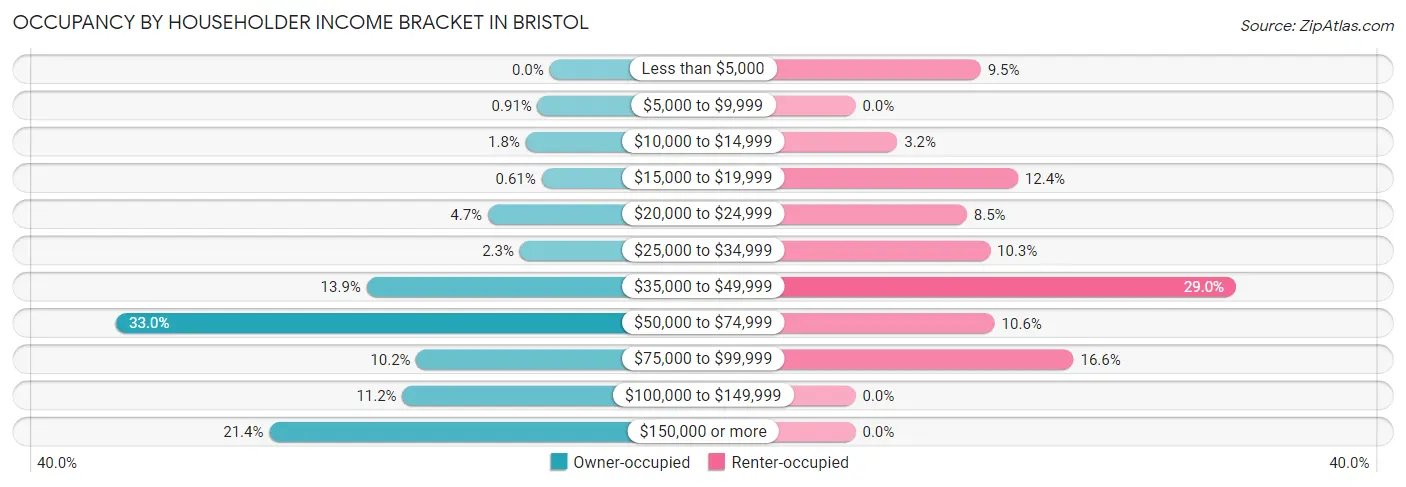
| Income Bracket | Owner-occupied | Renter-occupied |
| Less than $5,000 | 0 (0.0%) | 27 (9.5%) |
| $5,000 to $9,999 | 6 (0.9%) | 0 (0.0%) |
| $10,000 to $14,999 | 12 (1.8%) | 9 (3.2%) |
| $15,000 to $19,999 | 4 (0.6%) | 35 (12.4%) |
| $20,000 to $24,999 | 31 (4.7%) | 24 (8.5%) |
| $25,000 to $34,999 | 15 (2.3%) | 29 (10.2%) |
| $35,000 to $49,999 | 92 (13.9%) | 82 (29.0%) |
| $50,000 to $74,999 | 218 (33.0%) | 30 (10.6%) |
| $75,000 to $99,999 | 67 (10.2%) | 47 (16.6%) |
| $100,000 to $149,999 | 74 (11.2%) | 0 (0.0%) |
| $150,000 or more | 141 (21.4%) | 0 (0.0%) |
| Total | 660 (100.0%) | 283 (100.0%) |
Monthly Housing Cost Tiers in Bristol
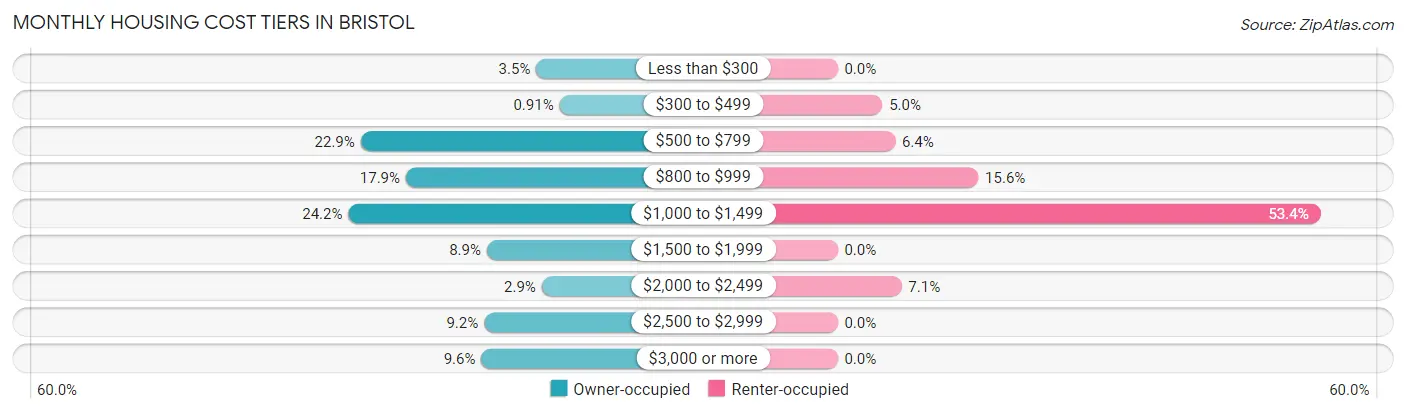
| Monthly Cost | Owner-occupied | Renter-occupied |
| Less than $300 | 23 (3.5%) | 0 (0.0%) |
| $300 to $499 | 6 (0.9%) | 14 (5.0%) |
| $500 to $799 | 151 (22.9%) | 18 (6.4%) |
| $800 to $999 | 118 (17.9%) | 44 (15.5%) |
| $1,000 to $1,499 | 160 (24.2%) | 151 (53.4%) |
| $1,500 to $1,999 | 59 (8.9%) | 0 (0.0%) |
| $2,000 to $2,499 | 19 (2.9%) | 20 (7.1%) |
| $2,500 to $2,999 | 61 (9.2%) | 0 (0.0%) |
| $3,000 or more | 63 (9.6%) | 0 (0.0%) |
| Total | 660 (100.0%) | 283 (100.0%) |
Physical Housing Characteristics in Bristol
Housing Structures in Bristol
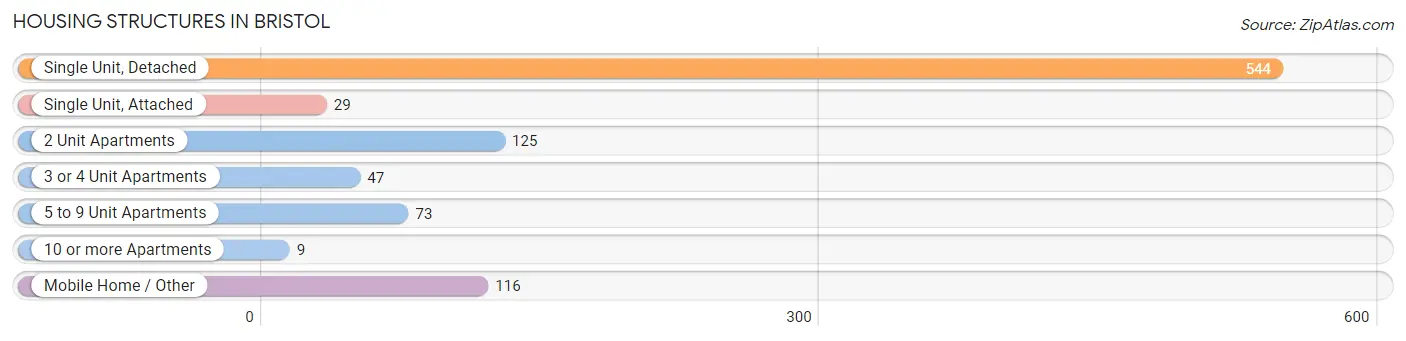
| Structure Type | # Housing Units | % Housing Units |
| Single Unit, Detached | 544 | 57.7% |
| Single Unit, Attached | 29 | 3.1% |
| 2 Unit Apartments | 125 | 13.3% |
| 3 or 4 Unit Apartments | 47 | 5.0% |
| 5 to 9 Unit Apartments | 73 | 7.7% |
| 10 or more Apartments | 9 | 0.9% |
| Mobile Home / Other | 116 | 12.3% |
| Total | 943 | 100.0% |
Housing Structures by Occupancy in Bristol
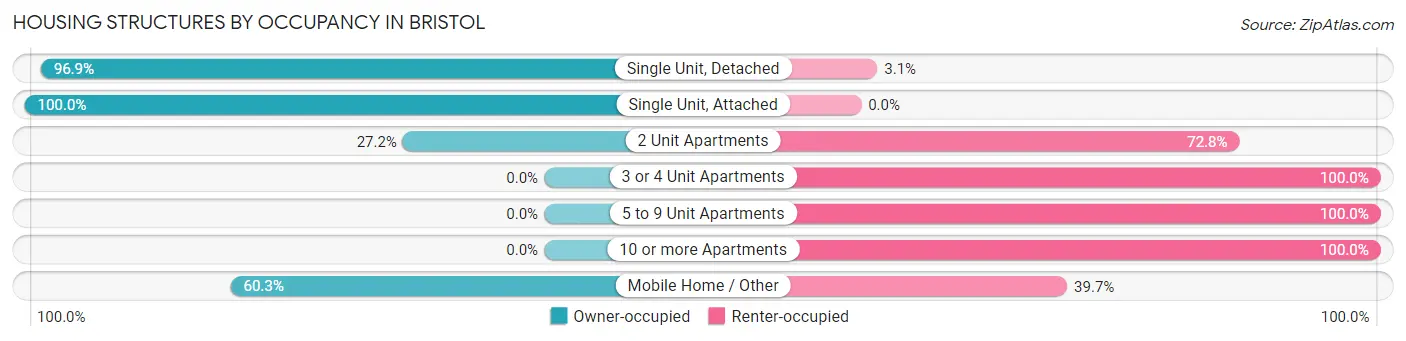
| Structure Type | Owner-occupied | Renter-occupied |
| Single Unit, Detached | 527 (96.9%) | 17 (3.1%) |
| Single Unit, Attached | 29 (100.0%) | 0 (0.0%) |
| 2 Unit Apartments | 34 (27.2%) | 91 (72.8%) |
| 3 or 4 Unit Apartments | 0 (0.0%) | 47 (100.0%) |
| 5 to 9 Unit Apartments | 0 (0.0%) | 73 (100.0%) |
| 10 or more Apartments | 0 (0.0%) | 9 (100.0%) |
| Mobile Home / Other | 70 (60.3%) | 46 (39.7%) |
| Total | 660 (70.0%) | 283 (30.0%) |
Housing Structures by Number of Rooms in Bristol
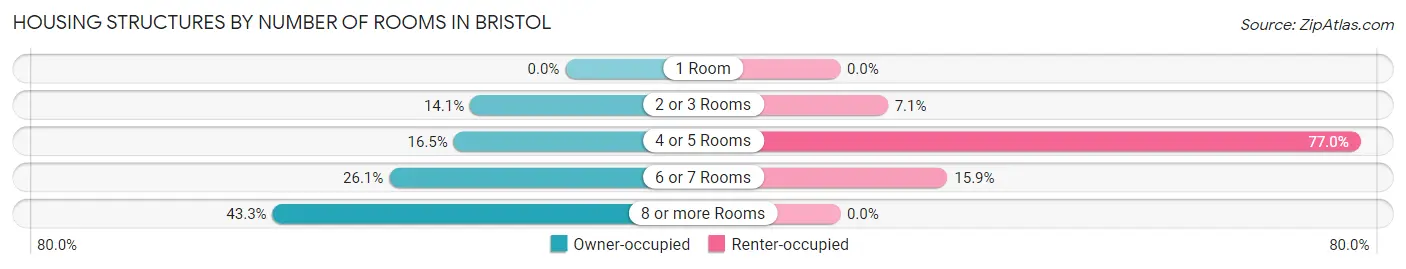
| Number of Rooms | Owner-occupied | Renter-occupied |
| 1 Room | 0 (0.0%) | 0 (0.0%) |
| 2 or 3 Rooms | 93 (14.1%) | 20 (7.1%) |
| 4 or 5 Rooms | 109 (16.5%) | 218 (77.0%) |
| 6 or 7 Rooms | 172 (26.1%) | 45 (15.9%) |
| 8 or more Rooms | 286 (43.3%) | 0 (0.0%) |
| Total | 660 (100.0%) | 283 (100.0%) |
Housing Structure by Heating Type in Bristol
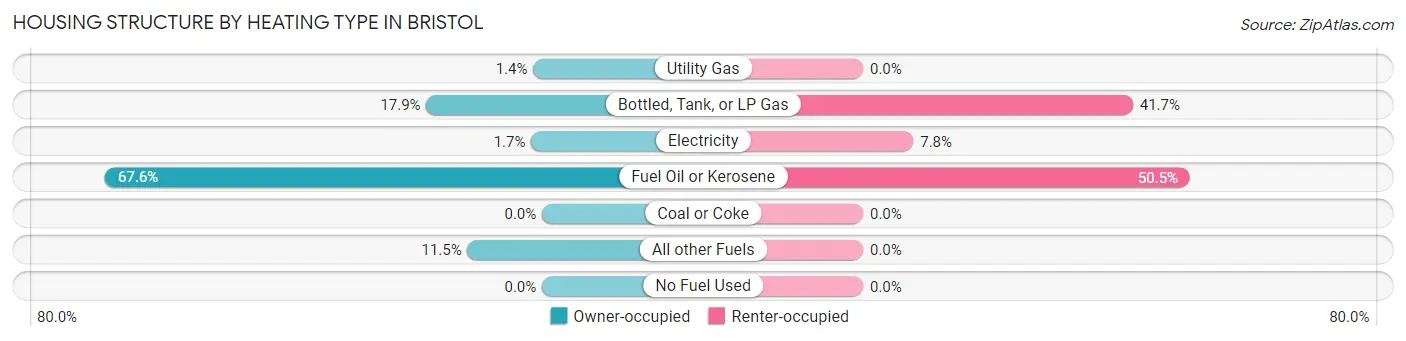
| Heating Type | Owner-occupied | Renter-occupied |
| Utility Gas | 9 (1.4%) | 0 (0.0%) |
| Bottled, Tank, or LP Gas | 118 (17.9%) | 118 (41.7%) |
| Electricity | 11 (1.7%) | 22 (7.8%) |
| Fuel Oil or Kerosene | 446 (67.6%) | 143 (50.5%) |
| Coal or Coke | 0 (0.0%) | 0 (0.0%) |
| All other Fuels | 76 (11.5%) | 0 (0.0%) |
| No Fuel Used | 0 (0.0%) | 0 (0.0%) |
| Total | 660 (100.0%) | 283 (100.0%) |
Household Vehicle Usage in Bristol
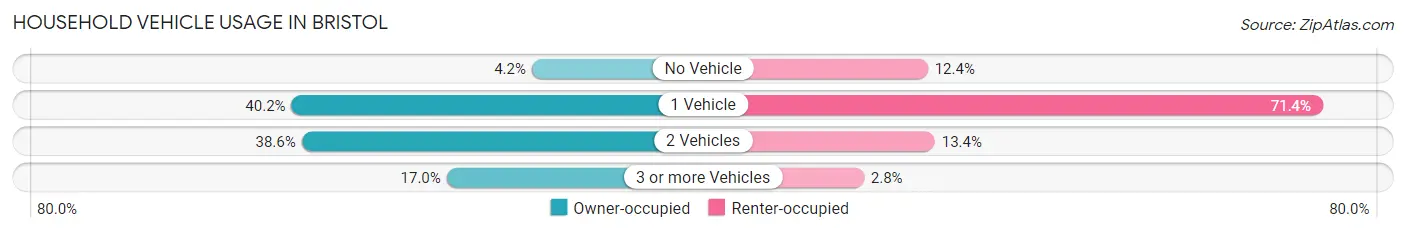
| Vehicles per Household | Owner-occupied | Renter-occupied |
| No Vehicle | 28 (4.2%) | 35 (12.4%) |
| 1 Vehicle | 265 (40.2%) | 202 (71.4%) |
| 2 Vehicles | 255 (38.6%) | 38 (13.4%) |
| 3 or more Vehicles | 112 (17.0%) | 8 (2.8%) |
| Total | 660 (100.0%) | 283 (100.0%) |
Real Estate & Mortgages in Bristol
Real Estate and Mortgage Overview in Bristol
| Characteristic | Without Mortgage | With Mortgage |
| Housing Units | 342 | 318 |
| Median Property Value | $234,500 | $305,500 |
| Median Household Income | $58,676 | $141 |
| Monthly Housing Costs | $802 | $55 |
| Real Estate Taxes | $5,602 | $0 |
Property Value by Mortgage Status in Bristol
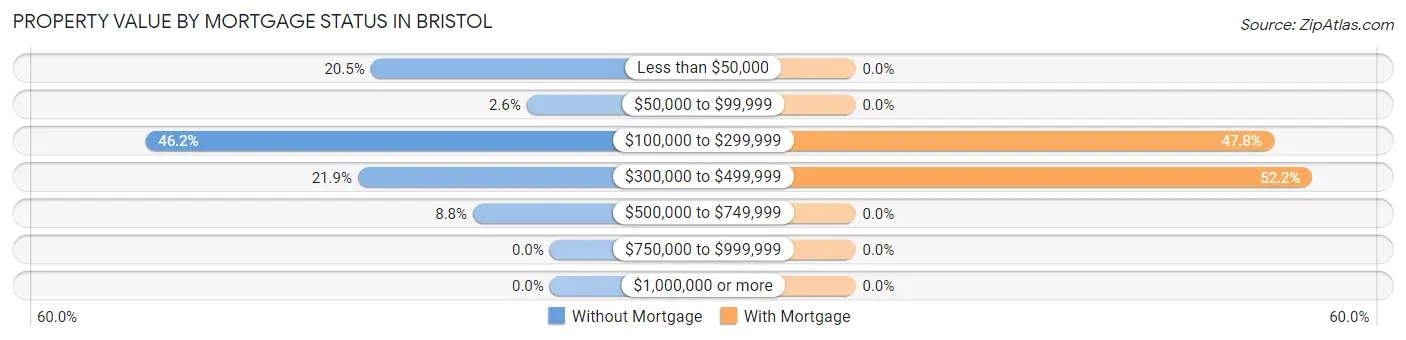
| Property Value | Without Mortgage | With Mortgage |
| Less than $50,000 | 70 (20.5%) | 0 (0.0%) |
| $50,000 to $99,999 | 9 (2.6%) | 0 (0.0%) |
| $100,000 to $299,999 | 158 (46.2%) | 152 (47.8%) |
| $300,000 to $499,999 | 75 (21.9%) | 166 (52.2%) |
| $500,000 to $749,999 | 30 (8.8%) | 0 (0.0%) |
| $750,000 to $999,999 | 0 (0.0%) | 0 (0.0%) |
| $1,000,000 or more | 0 (0.0%) | 0 (0.0%) |
| Total | 342 (100.0%) | 318 (100.0%) |
Household Income by Mortgage Status in Bristol
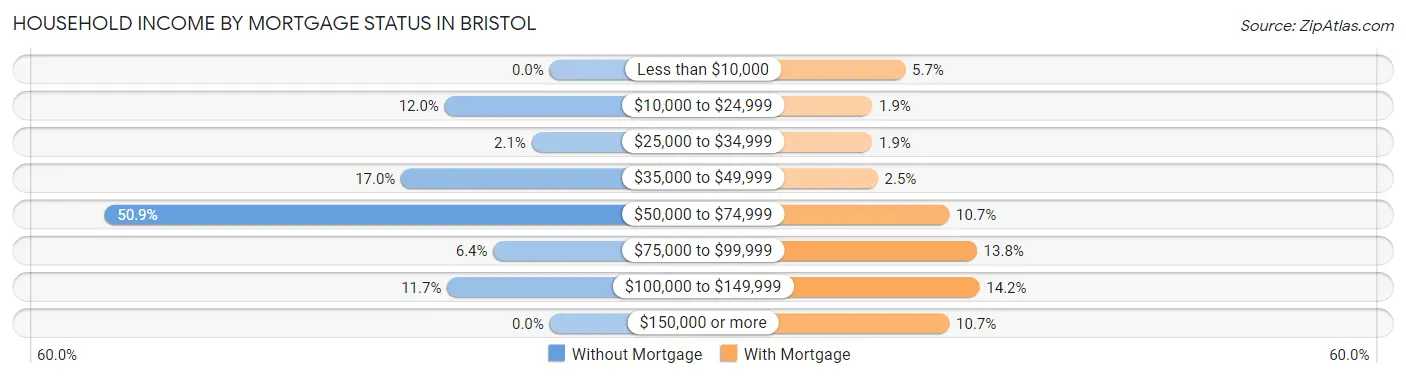
| Household Income | Without Mortgage | With Mortgage |
| Less than $10,000 | 0 (0.0%) | 18 (5.7%) |
| $10,000 to $24,999 | 41 (12.0%) | 6 (1.9%) |
| $25,000 to $34,999 | 7 (2.1%) | 6 (1.9%) |
| $35,000 to $49,999 | 58 (17.0%) | 8 (2.5%) |
| $50,000 to $74,999 | 174 (50.9%) | 34 (10.7%) |
| $75,000 to $99,999 | 22 (6.4%) | 44 (13.8%) |
| $100,000 to $149,999 | 40 (11.7%) | 45 (14.1%) |
| $150,000 or more | 0 (0.0%) | 34 (10.7%) |
| Total | 342 (100.0%) | 318 (100.0%) |
Property Value to Household Income Ratio in Bristol
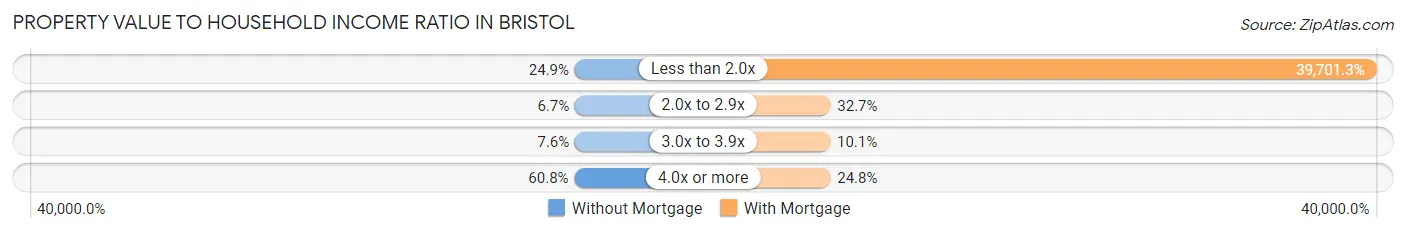
| Value-to-Income Ratio | Without Mortgage | With Mortgage |
| Less than 2.0x | 85 (24.8%) | 126,250 (39,701.3%) |
| 2.0x to 2.9x | 23 (6.7%) | 104 (32.7%) |
| 3.0x to 3.9x | 26 (7.6%) | 32 (10.1%) |
| 4.0x or more | 208 (60.8%) | 79 (24.8%) |
| Total | 342 (100.0%) | 318 (100.0%) |
Real Estate Taxes by Mortgage Status in Bristol
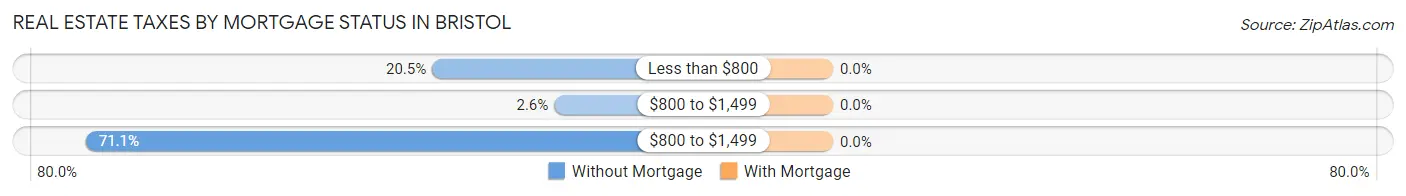
| Property Taxes | Without Mortgage | With Mortgage |
| Less than $800 | 70 (20.5%) | 0 (0.0%) |
| $800 to $1,499 | 9 (2.6%) | 0 (0.0%) |
| $800 to $1,499 | 243 (71.1%) | 0 (0.0%) |
| Total | 342 (100.0%) | 318 (100.0%) |
Health & Disability in Bristol
Health Insurance Coverage by Age in Bristol
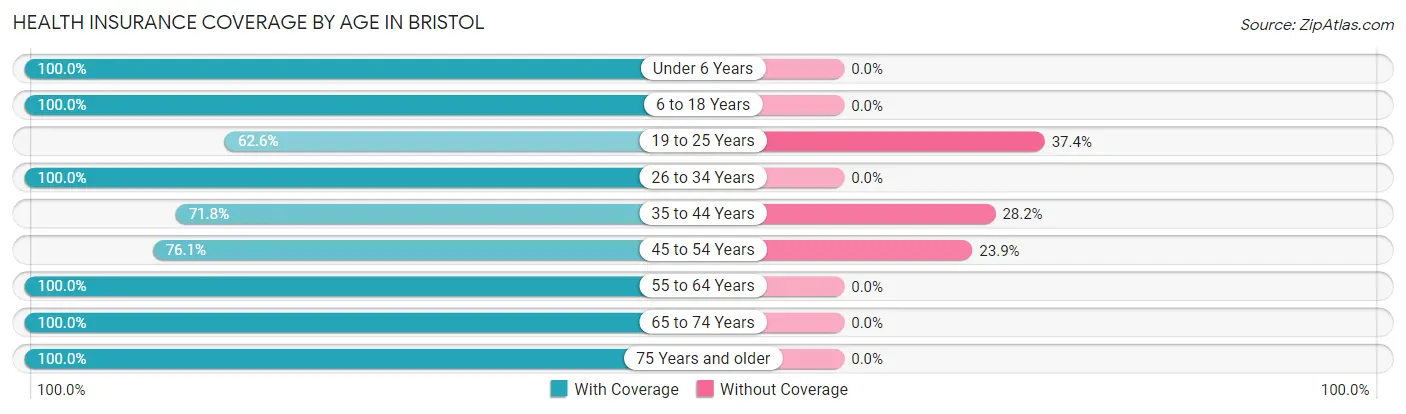
| Age Bracket | With Coverage | Without Coverage |
| Under 6 Years | 55 (100.0%) | 0 (0.0%) |
| 6 to 18 Years | 292 (100.0%) | 0 (0.0%) |
| 19 to 25 Years | 67 (62.6%) | 40 (37.4%) |
| 26 to 34 Years | 74 (100.0%) | 0 (0.0%) |
| 35 to 44 Years | 163 (71.8%) | 64 (28.2%) |
| 45 to 54 Years | 258 (76.1%) | 81 (23.9%) |
| 55 to 64 Years | 369 (100.0%) | 0 (0.0%) |
| 65 to 74 Years | 285 (100.0%) | 0 (0.0%) |
| 75 Years and older | 180 (100.0%) | 0 (0.0%) |
| Total | 1,743 (90.4%) | 185 (9.6%) |
Health Insurance Coverage by Citizenship Status in Bristol
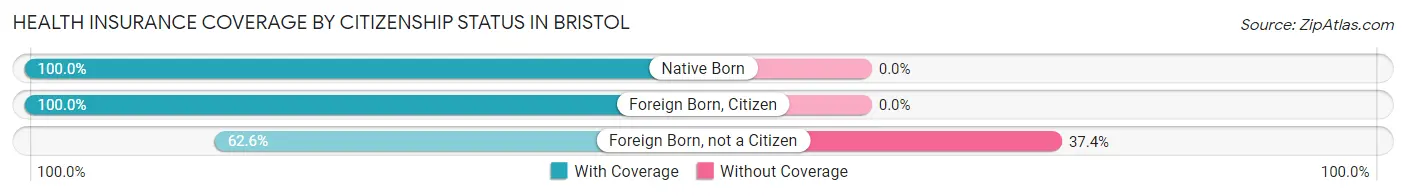
| Citizenship Status | With Coverage | Without Coverage |
| Native Born | 55 (100.0%) | 0 (0.0%) |
| Foreign Born, Citizen | 292 (100.0%) | 0 (0.0%) |
| Foreign Born, not a Citizen | 67 (62.6%) | 40 (37.4%) |
Health Insurance Coverage by Household Income in Bristol
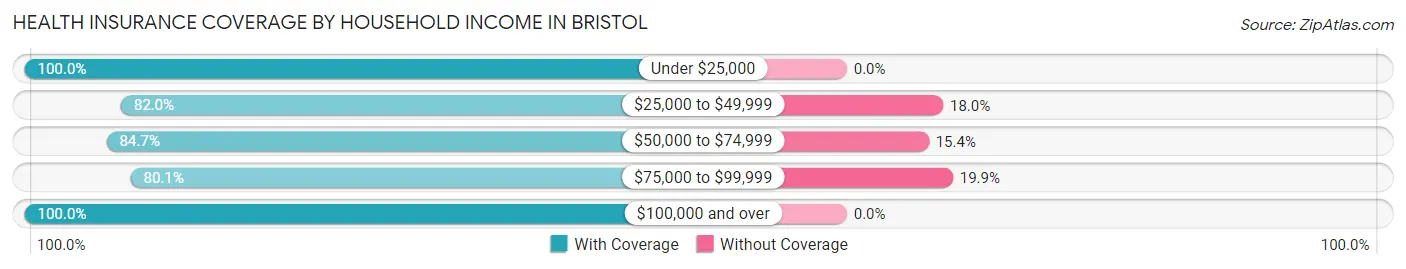
| Household Income | With Coverage | Without Coverage |
| Under $25,000 | 213 (100.0%) | 0 (0.0%) |
| $25,000 to $49,999 | 300 (82.0%) | 66 (18.0%) |
| $50,000 to $74,999 | 353 (84.7%) | 64 (15.3%) |
| $75,000 to $99,999 | 222 (80.1%) | 55 (19.9%) |
| $100,000 and over | 655 (100.0%) | 0 (0.0%) |
Public vs Private Health Insurance Coverage by Age in Bristol
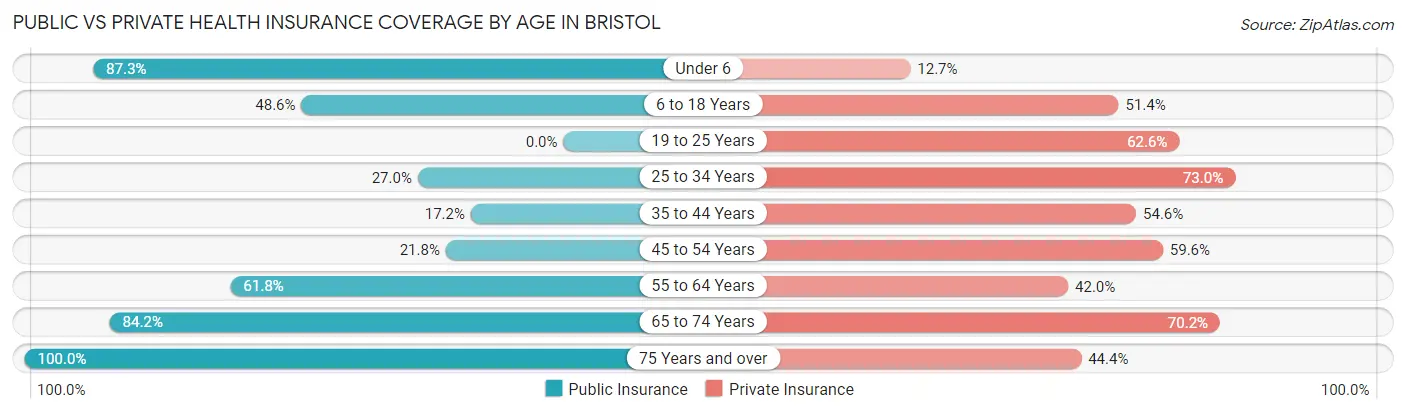
| Age Bracket | Public Insurance | Private Insurance |
| Under 6 | 48 (87.3%) | 7 (12.7%) |
| 6 to 18 Years | 142 (48.6%) | 150 (51.4%) |
| 19 to 25 Years | 0 (0.0%) | 67 (62.6%) |
| 25 to 34 Years | 20 (27.0%) | 54 (73.0%) |
| 35 to 44 Years | 39 (17.2%) | 124 (54.6%) |
| 45 to 54 Years | 74 (21.8%) | 202 (59.6%) |
| 55 to 64 Years | 228 (61.8%) | 155 (42.0%) |
| 65 to 74 Years | 240 (84.2%) | 200 (70.2%) |
| 75 Years and over | 180 (100.0%) | 80 (44.4%) |
| Total | 971 (50.4%) | 1,039 (53.9%) |
Disability Status by Sex by Age in Bristol
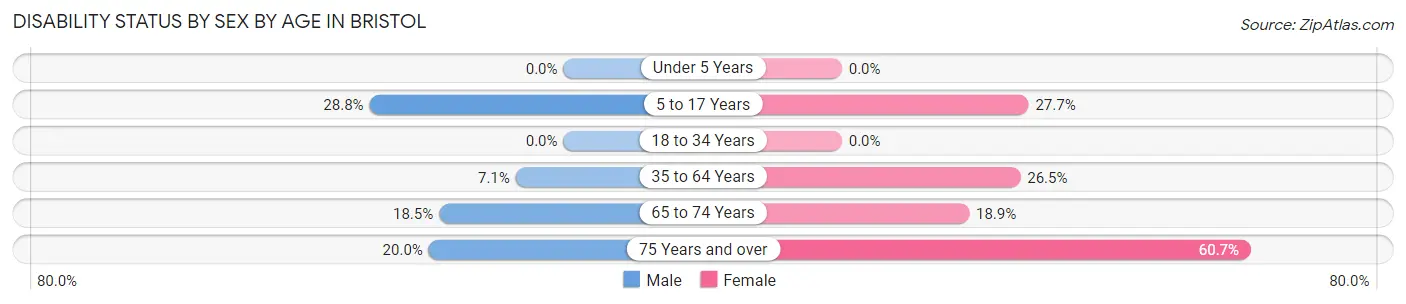
| Age Bracket | Male | Female |
| Under 5 Years | 0 (0.0%) | 0 (0.0%) |
| 5 to 17 Years | 55 (28.8%) | 28 (27.7%) |
| 18 to 34 Years | 0 (0.0%) | 0 (0.0%) |
| 35 to 64 Years | 31 (7.1%) | 132 (26.5%) |
| 65 to 74 Years | 36 (18.5%) | 17 (18.9%) |
| 75 Years and over | 9 (20.0%) | 82 (60.7%) |
Disability Class by Sex by Age in Bristol
Disability Class: Hearing Difficulty
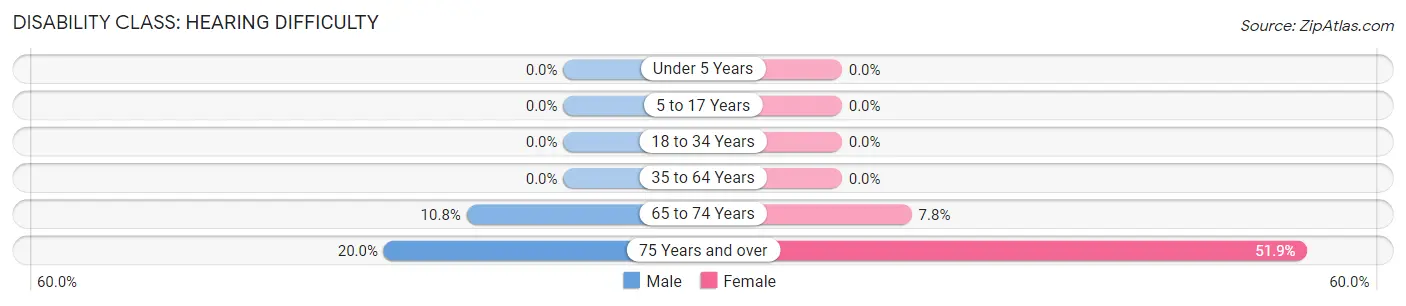
| Age Bracket | Male | Female |
| Under 5 Years | 0 (0.0%) | 0 (0.0%) |
| 5 to 17 Years | 0 (0.0%) | 0 (0.0%) |
| 18 to 34 Years | 0 (0.0%) | 0 (0.0%) |
| 35 to 64 Years | 0 (0.0%) | 0 (0.0%) |
| 65 to 74 Years | 21 (10.8%) | 7 (7.8%) |
| 75 Years and over | 9 (20.0%) | 70 (51.8%) |
Disability Class: Vision Difficulty
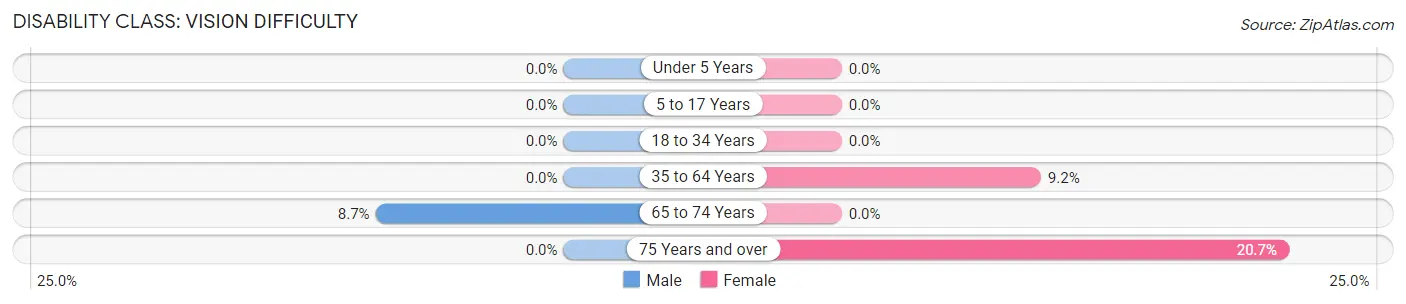
| Age Bracket | Male | Female |
| Under 5 Years | 0 (0.0%) | 0 (0.0%) |
| 5 to 17 Years | 0 (0.0%) | 0 (0.0%) |
| 18 to 34 Years | 0 (0.0%) | 0 (0.0%) |
| 35 to 64 Years | 0 (0.0%) | 46 (9.2%) |
| 65 to 74 Years | 17 (8.7%) | 0 (0.0%) |
| 75 Years and over | 0 (0.0%) | 28 (20.7%) |
Disability Class: Cognitive Difficulty
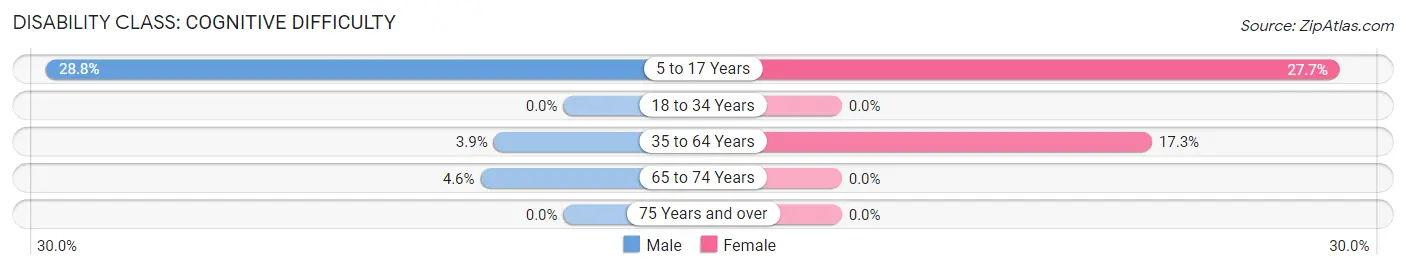
| Age Bracket | Male | Female |
| 5 to 17 Years | 55 (28.8%) | 28 (27.7%) |
| 18 to 34 Years | 0 (0.0%) | 0 (0.0%) |
| 35 to 64 Years | 17 (3.9%) | 86 (17.3%) |
| 65 to 74 Years | 9 (4.6%) | 0 (0.0%) |
| 75 Years and over | 0 (0.0%) | 0 (0.0%) |
Disability Class: Ambulatory Difficulty
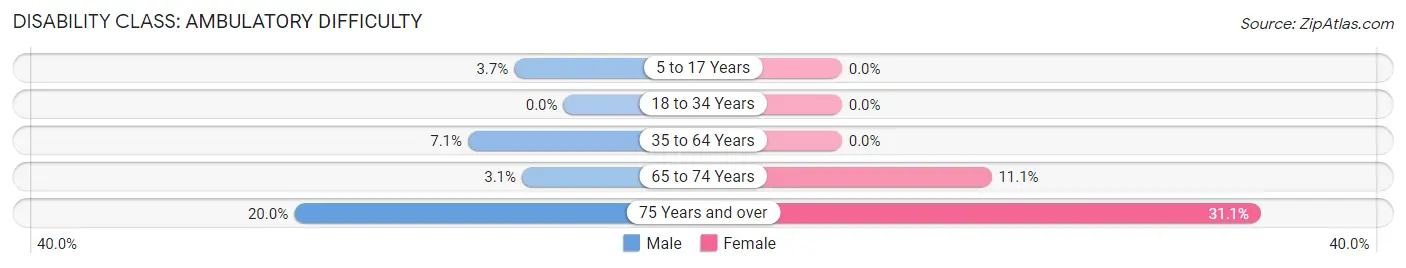
| Age Bracket | Male | Female |
| 5 to 17 Years | 7 (3.7%) | 0 (0.0%) |
| 18 to 34 Years | 0 (0.0%) | 0 (0.0%) |
| 35 to 64 Years | 31 (7.1%) | 0 (0.0%) |
| 65 to 74 Years | 6 (3.1%) | 10 (11.1%) |
| 75 Years and over | 9 (20.0%) | 42 (31.1%) |
Disability Class: Self-Care Difficulty
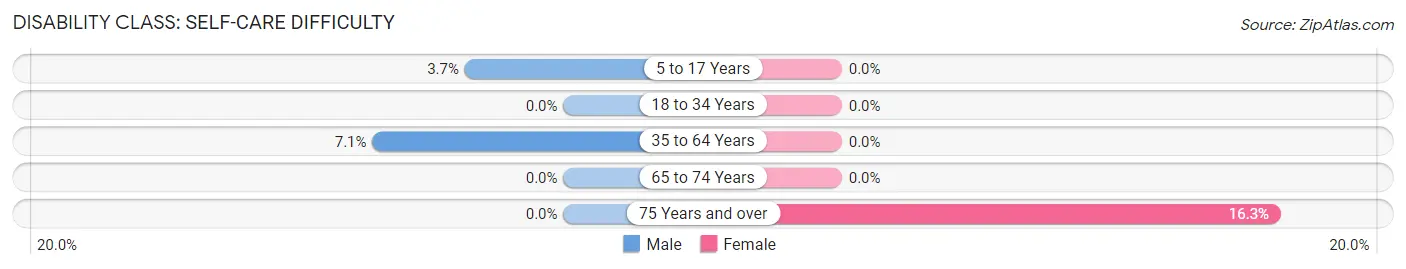
| Age Bracket | Male | Female |
| 5 to 17 Years | 7 (3.7%) | 0 (0.0%) |
| 18 to 34 Years | 0 (0.0%) | 0 (0.0%) |
| 35 to 64 Years | 31 (7.1%) | 0 (0.0%) |
| 65 to 74 Years | 0 (0.0%) | 0 (0.0%) |
| 75 Years and over | 0 (0.0%) | 22 (16.3%) |
Technology Access in Bristol
Computing Device Access in Bristol
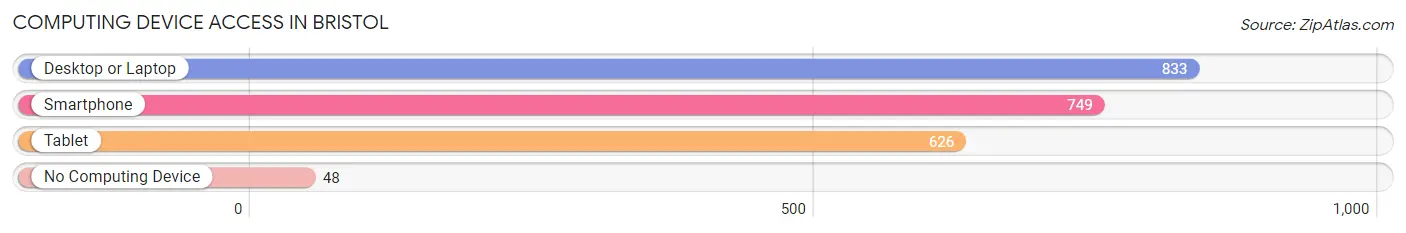
| Device Type | # Households | % Households |
| Desktop or Laptop | 833 | 88.3% |
| Smartphone | 749 | 79.4% |
| Tablet | 626 | 66.4% |
| No Computing Device | 48 | 5.1% |
| Total | 943 | 100.0% |
Internet Access in Bristol
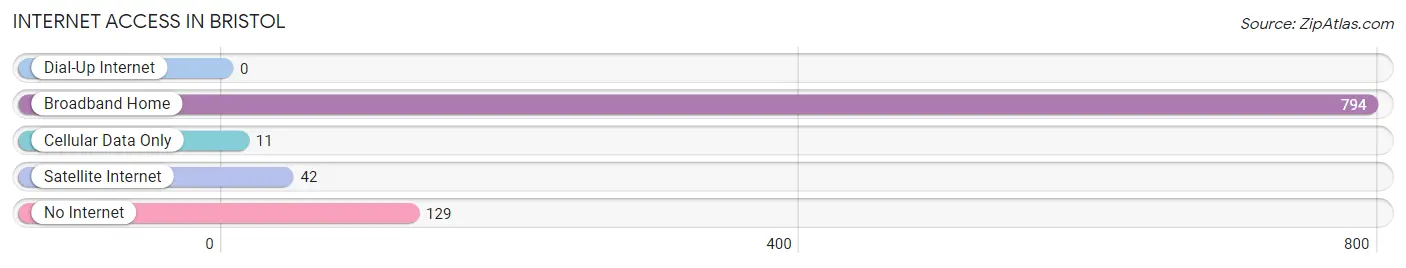
| Internet Type | # Households | % Households |
| Dial-Up Internet | 0 | 0.0% |
| Broadband Home | 794 | 84.2% |
| Cellular Data Only | 11 | 1.2% |
| Satellite Internet | 42 | 4.4% |
| No Internet | 129 | 13.7% |
| Total | 943 | 100.0% |
Bristol Summary
Bristol, Vermont is a small town located in Addison County, in the western part of the state. It is situated on the eastern shore of Lake Champlain, and is bordered by the towns of Starksboro, Monkton, Lincoln, and New Haven. The town has a population of 3,894, according to the 2010 census.
History
Bristol was first settled in 1762 by a group of settlers from Massachusetts. The town was named after Bristol, Rhode Island, and was incorporated in 1763. The town was originally a farming community, and the first gristmill was built in 1790. The town was also home to a number of small industries, including a sawmill, a tannery, and a woolen mill.
In the 19th century, the town became a popular summer resort destination, and several grand hotels were built. The town was also home to a number of summer camps, including Camp Dudley, which was founded in 1885.
Geography
Bristol is located in the Champlain Valley, and is bordered by the towns of Starksboro, Monkton, Lincoln, and New Haven. The town is situated on the eastern shore of Lake Champlain, and is home to several small lakes, including Lake Dunmore and Silver Lake. The town is located in the Green Mountains, and is home to several peaks, including Mount Abraham and Mount Hunger.
Economy
Bristol is a small, rural town, and the economy is largely based on agriculture and tourism. The town is home to several small farms, and is also home to a number of small businesses, including restaurants, shops, and galleries. The town is also home to several small manufacturing companies, including a furniture maker and a woodworking shop.
Demographics
According to the 2010 census, Bristol has a population of 3,894. The median household income is $50,945, and the median age is 43. The town is predominantly white, with 92.3% of the population identifying as white. The town is also home to a small Hispanic population, with 4.2% of the population identifying as Hispanic or Latino.
Conclusion
Bristol, Vermont is a small town located in Addison County, in the western part of the state. It is situated on the eastern shore of Lake Champlain, and is bordered by the towns of Starksboro, Monkton, Lincoln, and New Haven. The town has a population of 3,894, according to the 2010 census. The town is predominantly white, with 92.3% of the population identifying as white. The town is also home to a small Hispanic population, with 4.2% of the population identifying as Hispanic or Latino. The economy is largely based on agriculture and tourism, and the town is home to several small businesses, including restaurants, shops, and galleries. Bristol is a small, rural town, and is a popular summer destination for tourists.
Common Questions
What is Per Capita Income in Bristol?
Per Capita income in Bristol is $38,675.
What is the Median Family Income in Bristol?
Median Family Income in Bristol is $83,793.
What is the Median Household income in Bristol?
Median Household Income in Bristol is $65,536.
What is Income or Wage Gap in Bristol?
Income or Wage Gap in Bristol is 5.3%.
Women in Bristol earn 94.7 cents for every dollar earned by a man.
What is Inequality or Gini Index in Bristol?
Inequality or Gini Index in Bristol is 0.38.
What is the Total Population of Bristol?
Total Population of Bristol is 1,956.
What is the Total Male Population of Bristol?
Total Male Population of Bristol is 927.
What is the Total Female Population of Bristol?
Total Female Population of Bristol is 1,029.
What is the Ratio of Males per 100 Females in Bristol?
There are 90.09 Males per 100 Females in Bristol.
What is the Ratio of Females per 100 Males in Bristol?
There are 111.00 Females per 100 Males in Bristol.
What is the Median Population Age in Bristol?
Median Population Age in Bristol is 50.7 Years.
What is the Average Family Size in Bristol
Average Family Size in Bristol is 2.6 People.
What is the Average Household Size in Bristol
Average Household Size in Bristol is 2.0 People.
How Large is the Labor Force in Bristol?
There are 1,104 People in the Labor Forcein in Bristol.
What is the Percentage of People in the Labor Force in Bristol?
67.5% of People are in the Labor Force in Bristol.
What is the Unemployment Rate in Bristol?
Unemployment Rate in Bristol is 8.0%.