Woodstock, VT Map & Demographics
Woodstock Map
Woodstock Overview
$68,636
PER CAPITA INCOME
$173,958
AVG FAMILY INCOME
$85,536
AVG HOUSEHOLD INCOME
7.9%
WAGE / INCOME GAP [ % ]
92.1¢/ $1
WAGE / INCOME GAP [ $ ]
0.51
INEQUALITY / GINI INDEX
1,033
TOTAL POPULATION
450
MALE POPULATION
583
FEMALE POPULATION
77.19
MALES / 100 FEMALES
129.56
FEMALES / 100 MALES
58.1
MEDIAN AGE
2.9
AVG FAMILY SIZE
1.9
AVG HOUSEHOLD SIZE
504
LABOR FORCE [ PEOPLE ]
57.8%
PERCENT IN LABOR FORCE
Woodstock Zip Codes
Woodstock Area Codes
Income in Woodstock
Income Overview in Woodstock
Per Capita Income in Woodstock is $68,636, while median incomes of families and households are $173,958 and $85,536 respectively.
| Characteristic | Number | Measure |
| Per Capita Income | 1,033 | $68,636 |
| Median Family Income | 213 | $173,958 |
| Mean Family Income | 213 | $227,147 |
| Median Household Income | 509 | $85,536 |
| Mean Household Income | 509 | $139,811 |
| Income Deficit | 213 | $0 |
| Wage / Income Gap (%) | 1,033 | 7.88% |
| Wage / Income Gap ($) | 1,033 | 92.12¢ per $1 |
| Gini / Inequality Index | 1,033 | 0.51 |
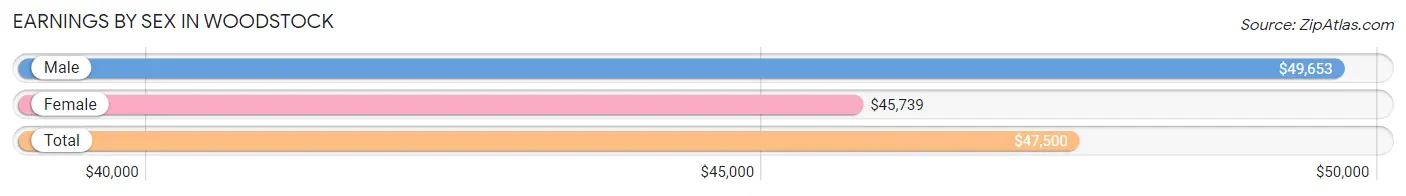
Earnings by Sex in Woodstock
Average Earnings in Woodstock are $47,500, $49,653 for men and $45,739 for women, a difference of 7.9%.
| Sex | Number | Average Earnings |
| Male | 251 (45.8%) | $49,653 |
| Female | 297 (54.2%) | $45,739 |
| Total | 548 (100.0%) | $47,500 |
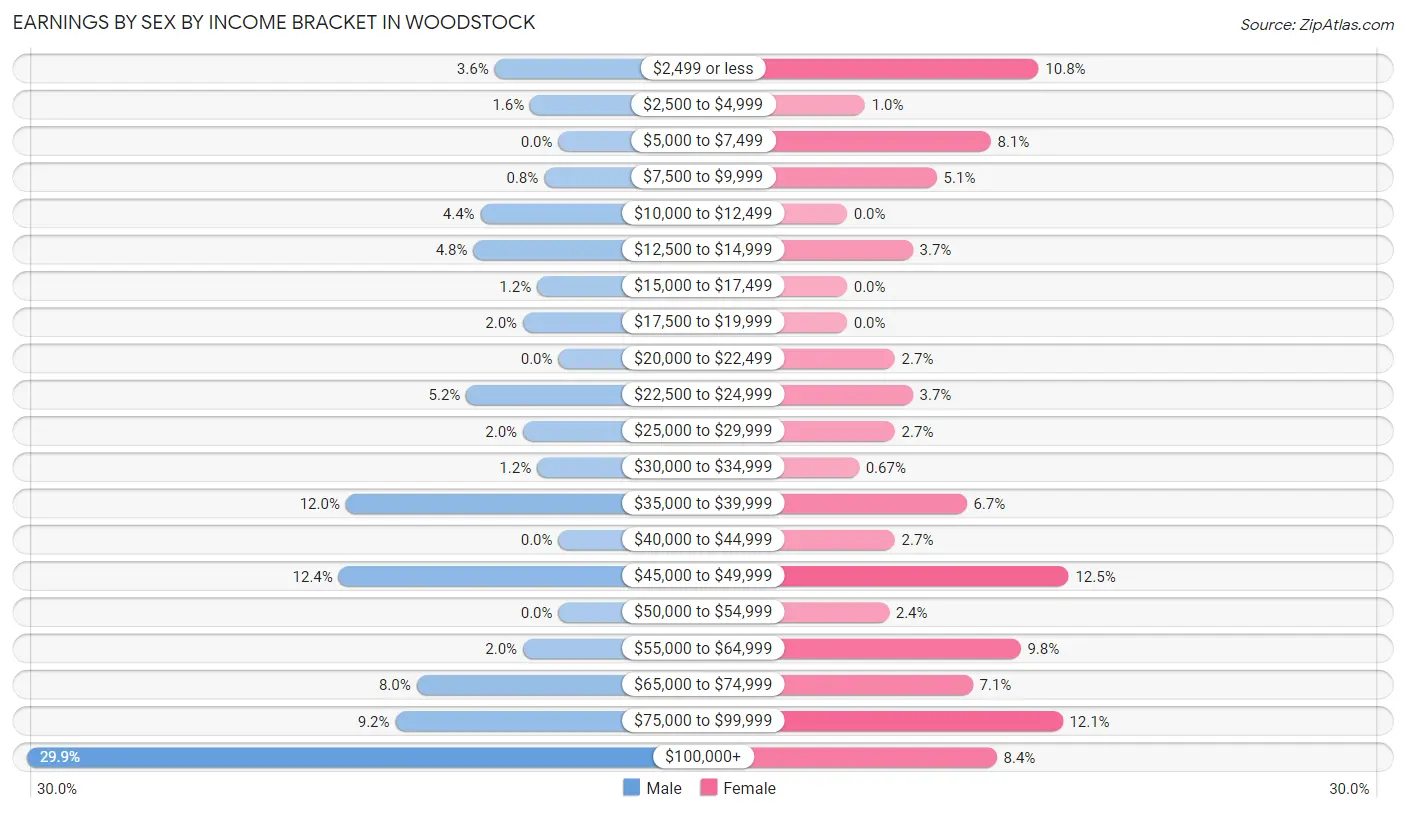
Earnings by Sex by Income Bracket in Woodstock
The most common earnings brackets in Woodstock are $100,000+ for men (75 | 29.9%) and $45,000 to $49,999 for women (37 | 12.5%).
| Income | Male | Female |
| $2,499 or less | 9 (3.6%) | 32 (10.8%) |
| $2,500 to $4,999 | 4 (1.6%) | 3 (1.0%) |
| $5,000 to $7,499 | 0 (0.0%) | 24 (8.1%) |
| $7,500 to $9,999 | 2 (0.8%) | 15 (5.1%) |
| $10,000 to $12,499 | 11 (4.4%) | 0 (0.0%) |
| $12,500 to $14,999 | 12 (4.8%) | 11 (3.7%) |
| $15,000 to $17,499 | 3 (1.2%) | 0 (0.0%) |
| $17,500 to $19,999 | 5 (2.0%) | 0 (0.0%) |
| $20,000 to $22,499 | 0 (0.0%) | 8 (2.7%) |
| $22,500 to $24,999 | 13 (5.2%) | 11 (3.7%) |
| $25,000 to $29,999 | 5 (2.0%) | 8 (2.7%) |
| $30,000 to $34,999 | 3 (1.2%) | 2 (0.7%) |
| $35,000 to $39,999 | 30 (11.9%) | 20 (6.7%) |
| $40,000 to $44,999 | 0 (0.0%) | 8 (2.7%) |
| $45,000 to $49,999 | 31 (12.3%) | 37 (12.5%) |
| $50,000 to $54,999 | 0 (0.0%) | 7 (2.4%) |
| $55,000 to $64,999 | 5 (2.0%) | 29 (9.8%) |
| $65,000 to $74,999 | 20 (8.0%) | 21 (7.1%) |
| $75,000 to $99,999 | 23 (9.2%) | 36 (12.1%) |
| $100,000+ | 75 (29.9%) | 25 (8.4%) |
| Total | 251 (100.0%) | 297 (100.0%) |
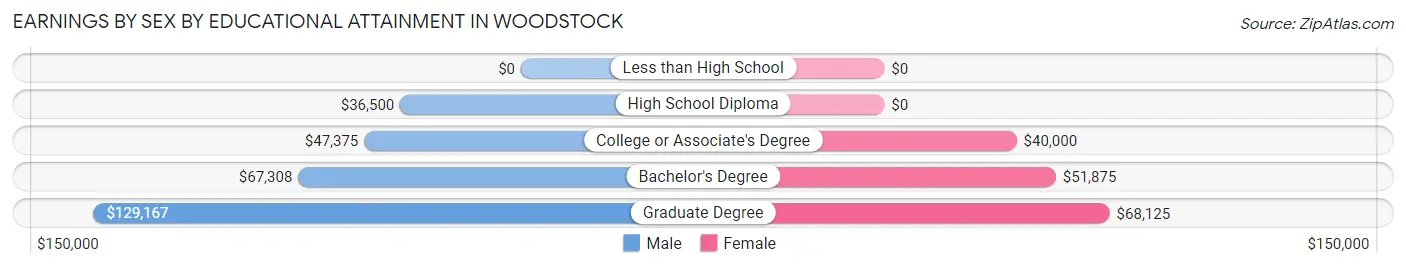
Earnings by Sex by Educational Attainment in Woodstock
Average earnings in Woodstock are $59,750 for men and $47,500 for women, a difference of 20.5%. Men with an educational attainment of graduate degree enjoy the highest average annual earnings of $129,167, while those with high school diploma education earn the least with $36,500. Women with an educational attainment of graduate degree earn the most with the average annual earnings of $68,125, while those with college or associate's degree education have the smallest earnings of $40,000.
| Educational Attainment | Male Income | Female Income |
| Less than High School | - | - |
| High School Diploma | $36,500 | $0 |
| College or Associate's Degree | $47,375 | $40,000 |
| Bachelor's Degree | $67,308 | $51,875 |
| Graduate Degree | $129,167 | $68,125 |
| Total | $59,750 | $47,500 |
Family Income in Woodstock
Family Income Brackets in Woodstock
According to the Woodstock family income data, there are 96 families falling into the $200,000+ income range, which is the most common income bracket and makes up 45.1% of all families.
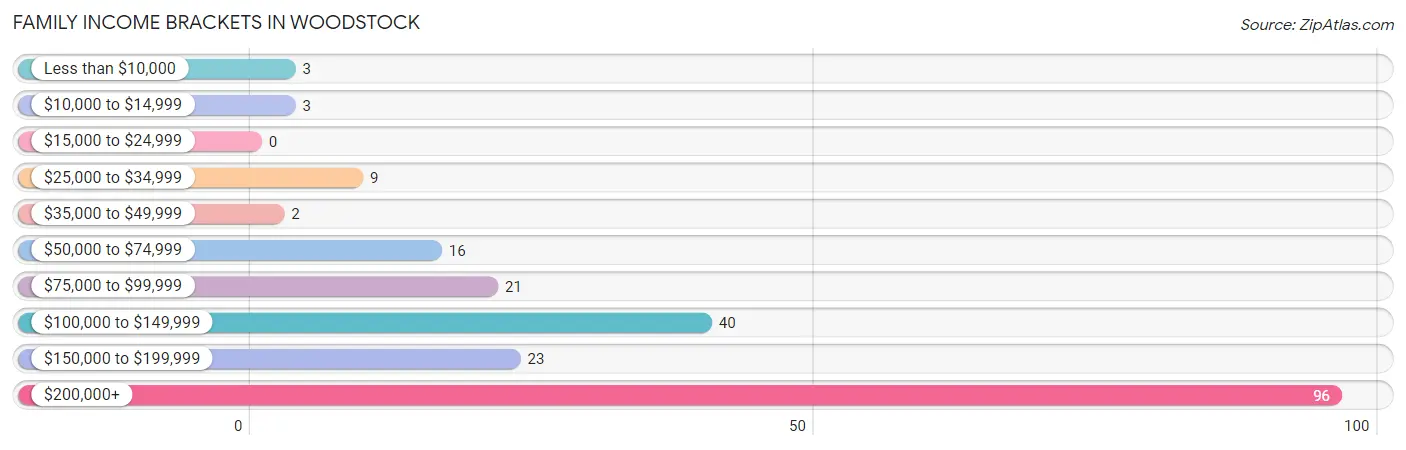
| Income Bracket | # Families | % Families |
| Less than $10,000 | 3 | 1.4% |
| $10,000 to $14,999 | 3 | 1.4% |
| $15,000 to $24,999 | 0 | 0.0% |
| $25,000 to $34,999 | 9 | 4.2% |
| $35,000 to $49,999 | 2 | 0.9% |
| $50,000 to $74,999 | 16 | 7.5% |
| $75,000 to $99,999 | 21 | 9.9% |
| $100,000 to $149,999 | 40 | 18.8% |
| $150,000 to $199,999 | 23 | 10.8% |
| $200,000+ | 96 | 45.1% |
Family Income by Famaliy Size in Woodstock
2-person families (132 | 62.0%) account for the highest median family income in Woodstock with $178,125 per family, while 2-person families (132 | 62.0%) have the highest median income of $89,062 per family member.
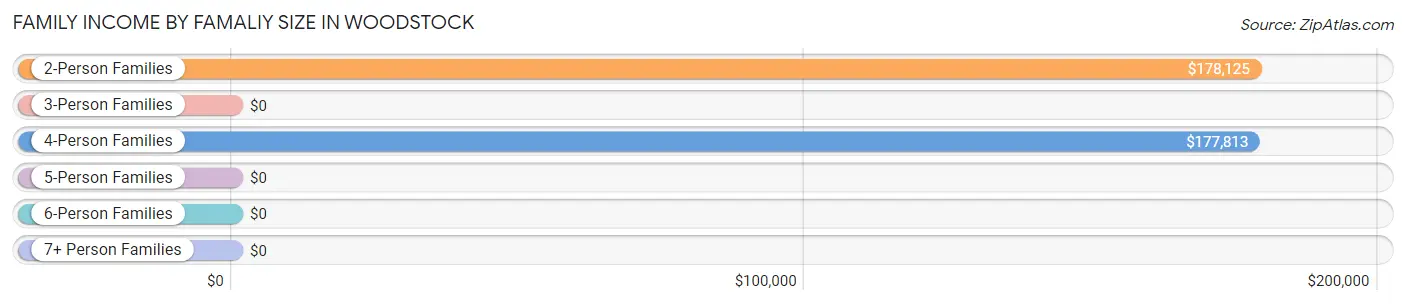
| Income Bracket | # Families | Median Income |
| 2-Person Families | 132 (62.0%) | $178,125 |
| 3-Person Families | 15 (7.0%) | $0 |
| 4-Person Families | 47 (22.1%) | $177,813 |
| 5-Person Families | 19 (8.9%) | $0 |
| 6-Person Families | 0 (0.0%) | $0 |
| 7+ Person Families | 0 (0.0%) | $0 |
| Total | 213 (100.0%) | $173,958 |
Family Income by Number of Earners in Woodstock
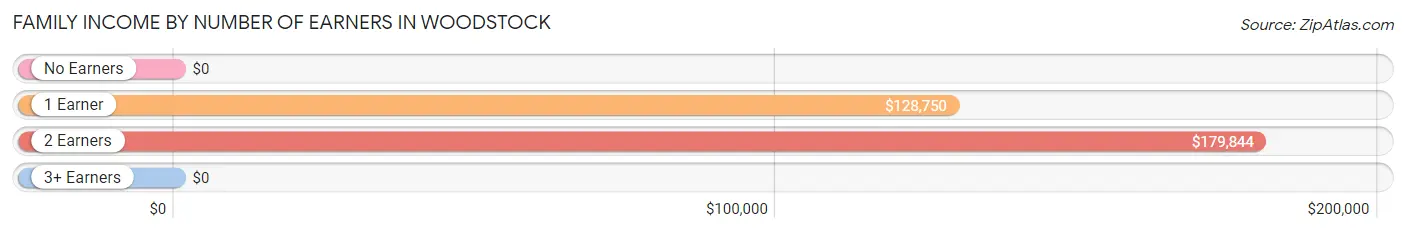
| Number of Earners | # Families | Median Income |
| No Earners | 21 (9.9%) | $0 |
| 1 Earner | 76 (35.7%) | $128,750 |
| 2 Earners | 111 (52.1%) | $179,844 |
| 3+ Earners | 5 (2.4%) | $0 |
| Total | 213 (100.0%) | $173,958 |
Household Income in Woodstock
Household Income Brackets in Woodstock
With 122 households falling in the category, the $200,000+ income range is the most frequent in Woodstock, accounting for 24.0% of all households. In contrast, only 19 households (3.7%) fall into the $10,000 to $14,999 income bracket, making it the least populous group.
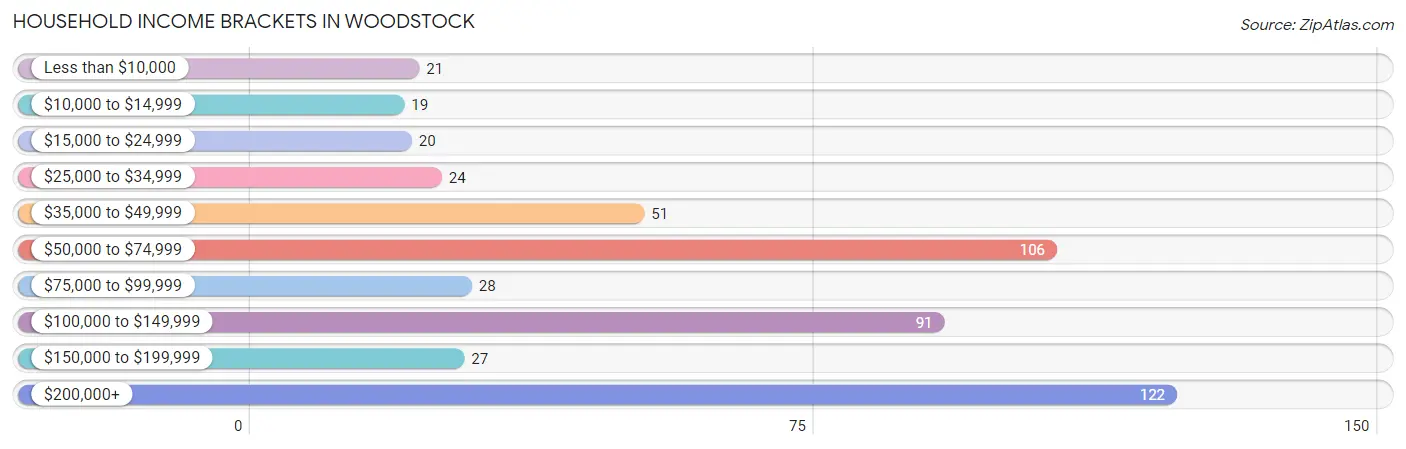
| Income Bracket | # Households | % Households |
| Less than $10,000 | 21 | 4.1% |
| $10,000 to $14,999 | 19 | 3.7% |
| $15,000 to $24,999 | 20 | 3.9% |
| $25,000 to $34,999 | 24 | 4.7% |
| $35,000 to $49,999 | 51 | 10.0% |
| $50,000 to $74,999 | 106 | 20.8% |
| $75,000 to $99,999 | 28 | 5.5% |
| $100,000 to $149,999 | 91 | 17.9% |
| $150,000 to $199,999 | 27 | 5.3% |
| $200,000+ | 122 | 24.0% |
Household Income by Householder Age in Woodstock
The median household income in Woodstock is $85,536, with the highest median household income of $117,679 found in the 25 to 44 years age bracket for the primary householder. A total of 87 households (17.1%) fall into this category. Meanwhile, the 65+ years age bracket for the primary householder has the lowest median household income of $70,208, with 260 households (51.1%) in this group.
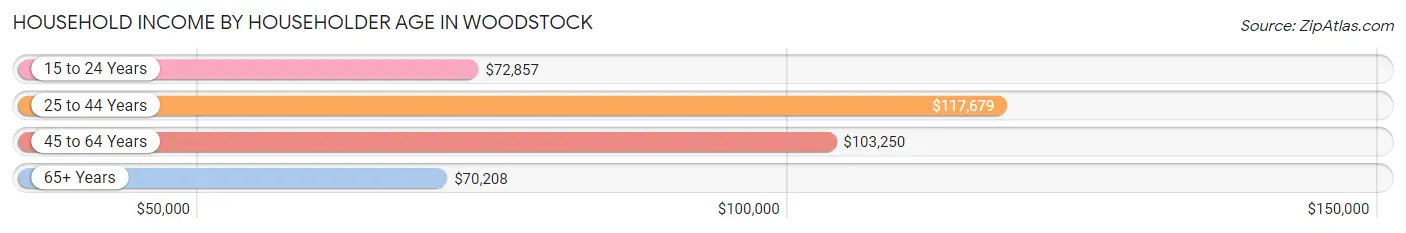
| Income Bracket | # Households | Median Income |
| 15 to 24 Years | 24 (4.7%) | $72,857 |
| 25 to 44 Years | 87 (17.1%) | $117,679 |
| 45 to 64 Years | 138 (27.1%) | $103,250 |
| 65+ Years | 260 (51.1%) | $70,208 |
| Total | 509 (100.0%) | $85,536 |
Poverty in Woodstock
Income Below Poverty by Sex and Age in Woodstock
With 1.6% poverty level for males and 7.8% for females among the residents of Woodstock, 55 to 64 year old males and 18 to 24 year old females are the most vulnerable to poverty, with 5 males (7.3%) and 6 females (27.3%) in their respective age groups living below the poverty level.
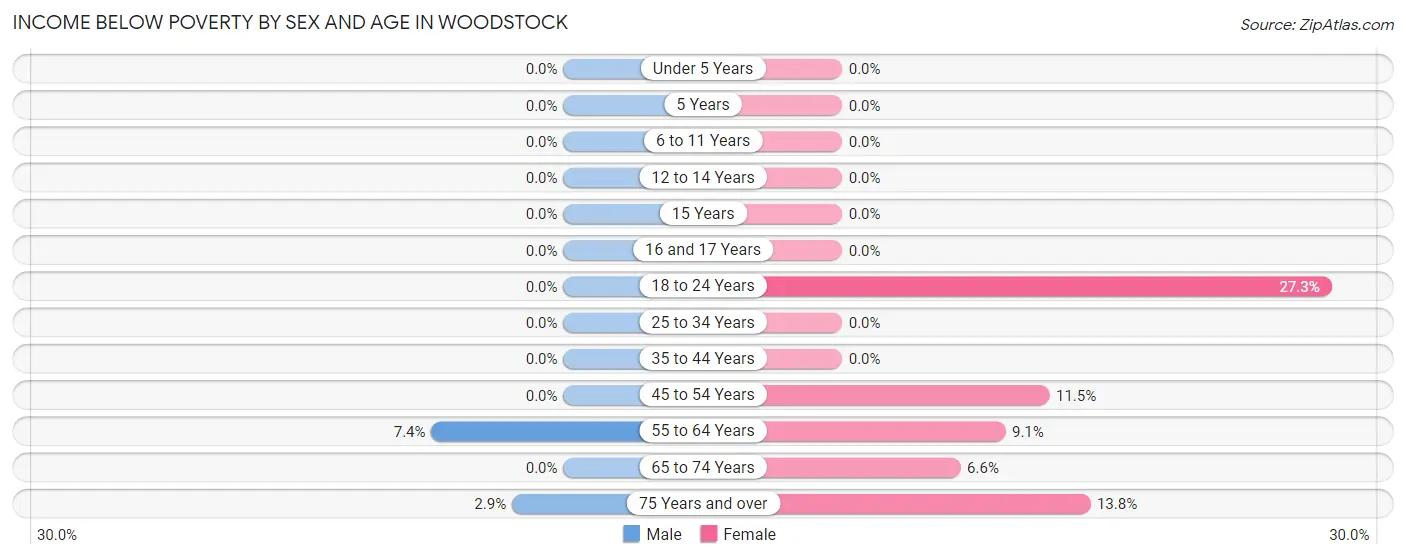
| Age Bracket | Male | Female |
| Under 5 Years | 0 (0.0%) | 0 (0.0%) |
| 5 Years | 0 (0.0%) | 0 (0.0%) |
| 6 to 11 Years | 0 (0.0%) | 0 (0.0%) |
| 12 to 14 Years | 0 (0.0%) | 0 (0.0%) |
| 15 Years | 0 (0.0%) | 0 (0.0%) |
| 16 and 17 Years | 0 (0.0%) | 0 (0.0%) |
| 18 to 24 Years | 0 (0.0%) | 6 (27.3%) |
| 25 to 34 Years | 0 (0.0%) | 0 (0.0%) |
| 35 to 44 Years | 0 (0.0%) | 0 (0.0%) |
| 45 to 54 Years | 0 (0.0%) | 6 (11.5%) |
| 55 to 64 Years | 5 (7.3%) | 7 (9.1%) |
| 65 to 74 Years | 0 (0.0%) | 6 (6.6%) |
| 75 Years and over | 2 (2.9%) | 17 (13.8%) |
| Total | 7 (1.6%) | 42 (7.8%) |
Income Above Poverty by Sex and Age in Woodstock
According to the poverty statistics in Woodstock, males aged under 5 years and females aged under 5 years are the age groups that are most secure financially, with 100.0% of males and 100.0% of females in these age groups living above the poverty line.
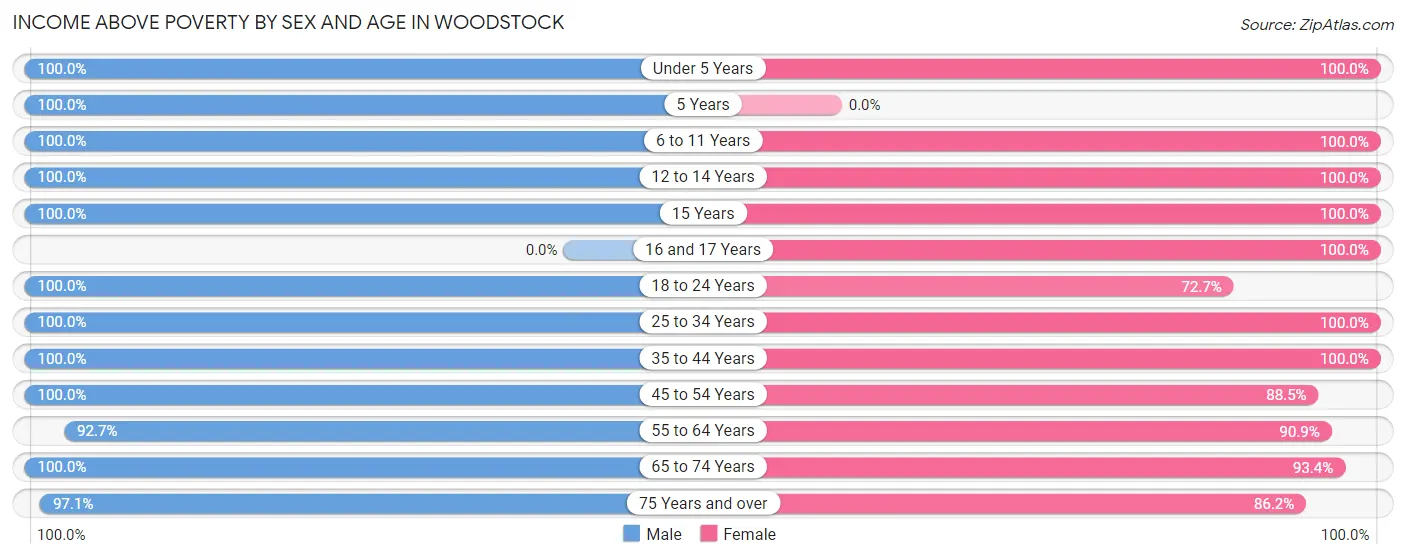
| Age Bracket | Male | Female |
| Under 5 Years | 16 (100.0%) | 26 (100.0%) |
| 5 Years | 10 (100.0%) | 0 (0.0%) |
| 6 to 11 Years | 39 (100.0%) | 6 (100.0%) |
| 12 to 14 Years | 31 (100.0%) | 13 (100.0%) |
| 15 Years | 16 (100.0%) | 4 (100.0%) |
| 16 and 17 Years | 0 (0.0%) | 31 (100.0%) |
| 18 to 24 Years | 14 (100.0%) | 16 (72.7%) |
| 25 to 34 Years | 2 (100.0%) | 55 (100.0%) |
| 35 to 44 Years | 61 (100.0%) | 41 (100.0%) |
| 45 to 54 Years | 44 (100.0%) | 46 (88.5%) |
| 55 to 64 Years | 63 (92.6%) | 70 (90.9%) |
| 65 to 74 Years | 79 (100.0%) | 85 (93.4%) |
| 75 Years and over | 68 (97.1%) | 106 (86.2%) |
| Total | 443 (98.4%) | 499 (92.2%) |
Income Below Poverty Among Married-Couple Families in Woodstock
The poverty statistics for married-couple families in Woodstock show that 3.2% or 6 of the total 188 families live below the poverty line. Families with no children have the highest poverty rate of 5.0%, comprising of 6 families. On the other hand, families with 1 or 2 children have the lowest poverty rate of 0.0%, which includes 0 families.
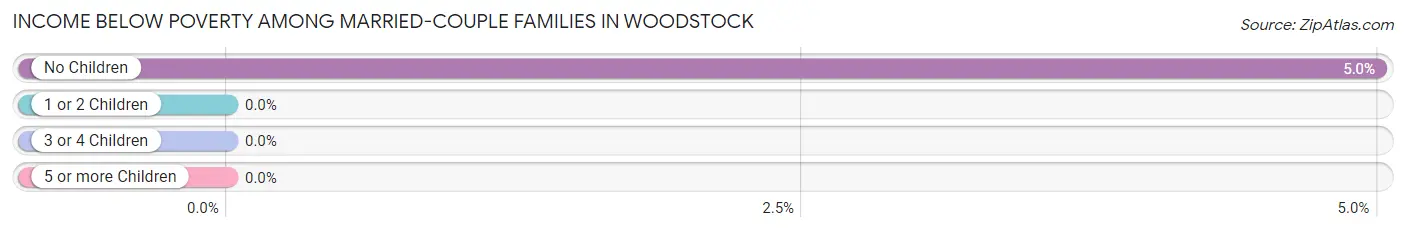
| Children | Above Poverty | Below Poverty |
| No Children | 114 (95.0%) | 6 (5.0%) |
| 1 or 2 Children | 58 (100.0%) | 0 (0.0%) |
| 3 or 4 Children | 10 (100.0%) | 0 (0.0%) |
| 5 or more Children | 0 (0.0%) | 0 (0.0%) |
| Total | 182 (96.8%) | 6 (3.2%) |
Income Below Poverty Among Single-Parent Households in Woodstock
| Children | Single Father | Single Mother |
| No Children | 0 (0.0%) | 0 (0.0%) |
| 1 or 2 Children | 0 (0.0%) | 0 (0.0%) |
| 3 or 4 Children | 0 (0.0%) | 0 (0.0%) |
| 5 or more Children | 0 (0.0%) | 0 (0.0%) |
| Total | 0 (0.0%) | 0 (0.0%) |
Income Below Poverty Among Married-Couple vs Single-Parent Households in Woodstock

| Children | Married-Couple Families | Single-Parent Households |
| No Children | 6 (5.0%) | 0 (0.0%) |
| 1 or 2 Children | 0 (0.0%) | 0 (0.0%) |
| 3 or 4 Children | 0 (0.0%) | 0 (0.0%) |
| 5 or more Children | 0 (0.0%) | 0 (0.0%) |
| Total | 6 (3.2%) | 0 (0.0%) |
Race in Woodstock
The most populous races in Woodstock are White / Caucasian (1,013 | 98.1%), Two or more Races (13 | 1.3%), and Black / African American (7 | 0.7%).
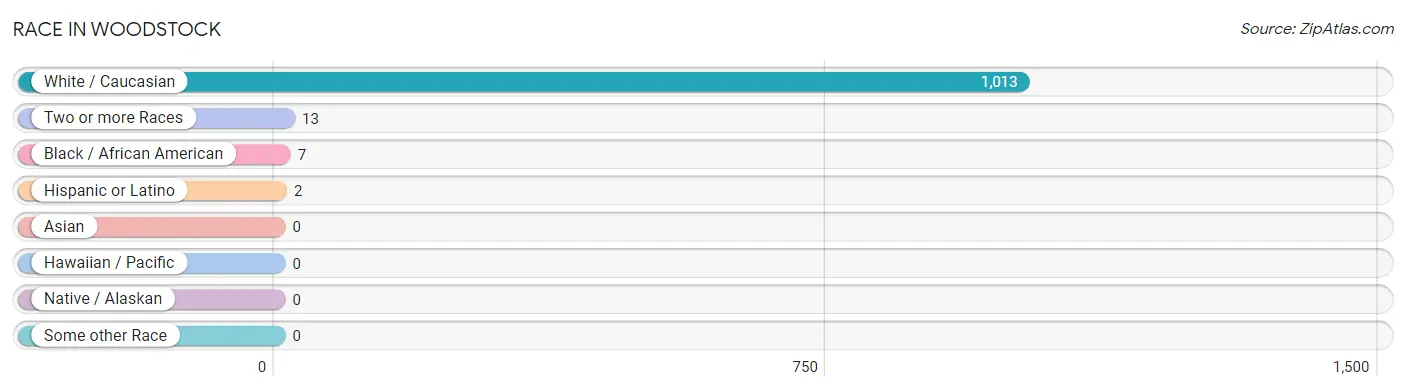
| Race | # Population | % Population |
| Asian | 0 | 0.0% |
| Black / African American | 7 | 0.7% |
| Hawaiian / Pacific | 0 | 0.0% |
| Hispanic or Latino | 2 | 0.2% |
| Native / Alaskan | 0 | 0.0% |
| White / Caucasian | 1,013 | 98.1% |
| Two or more Races | 13 | 1.3% |
| Some other Race | 0 | 0.0% |
| Total | 1,033 | 100.0% |
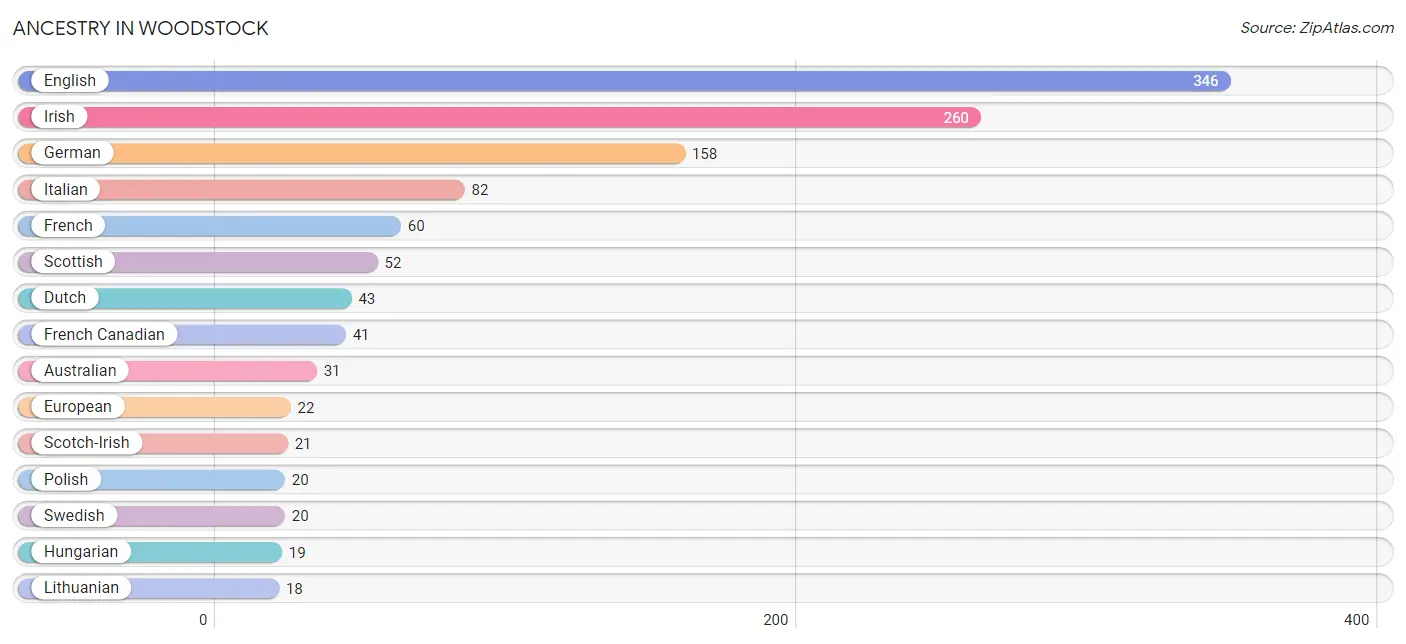
Ancestry in Woodstock
The most populous ancestries reported in Woodstock are English (346 | 33.5%), Irish (260 | 25.2%), German (158 | 15.3%), Italian (82 | 7.9%), and French (60 | 5.8%), together accounting for 87.7% of all Woodstock residents.
| Ancestry | # Population | % Population |
| American | 17 | 1.7% |
| Australian | 31 | 3.0% |
| Austrian | 15 | 1.5% |
| British | 16 | 1.5% |
| Bulgarian | 3 | 0.3% |
| Canadian | 5 | 0.5% |
| Czech | 4 | 0.4% |
| Danish | 3 | 0.3% |
| Dutch | 43 | 4.2% |
| Eastern European | 4 | 0.4% |
| English | 346 | 33.5% |
| European | 22 | 2.1% |
| Finnish | 9 | 0.9% |
| French | 60 | 5.8% |
| French Canadian | 41 | 4.0% |
| German | 158 | 15.3% |
| Greek | 14 | 1.4% |
| Hungarian | 19 | 1.8% |
| Irish | 260 | 25.2% |
| Italian | 82 | 7.9% |
| Korean | 13 | 1.3% |
| Lithuanian | 18 | 1.7% |
| Northern European | 6 | 0.6% |
| Norwegian | 4 | 0.4% |
| Polish | 20 | 1.9% |
| Romanian | 5 | 0.5% |
| Russian | 8 | 0.8% |
| Scotch-Irish | 21 | 2.0% |
| Scottish | 52 | 5.0% |
| Spaniard | 2 | 0.2% |
| Subsaharan African | 2 | 0.2% |
| Swedish | 20 | 1.9% |
| Swiss | 12 | 1.2% |
| Ukrainian | 8 | 0.8% |
| Welsh | 13 | 1.3% | View All 35 Rows |
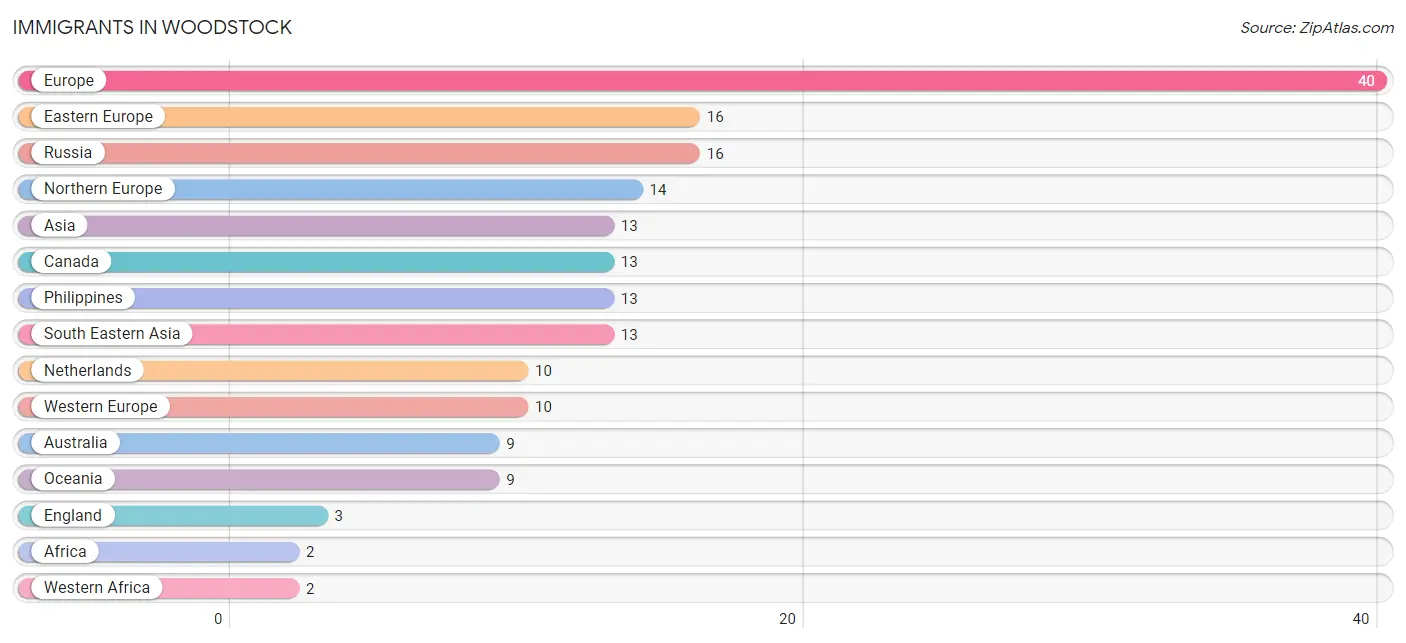
Immigrants in Woodstock
The most numerous immigrant groups reported in Woodstock came from Europe (40 | 3.9%), Eastern Europe (16 | 1.5%), Russia (16 | 1.5%), Northern Europe (14 | 1.4%), and Asia (13 | 1.3%), together accounting for 9.6% of all Woodstock residents.
| Immigration Origin | # Population | % Population |
| Africa | 2 | 0.2% |
| Asia | 13 | 1.3% |
| Australia | 9 | 0.9% |
| Canada | 13 | 1.3% |
| Eastern Europe | 16 | 1.5% |
| England | 3 | 0.3% |
| Europe | 40 | 3.9% |
| Netherlands | 10 | 1.0% |
| Northern Europe | 14 | 1.4% |
| Oceania | 9 | 0.9% |
| Philippines | 13 | 1.3% |
| Russia | 16 | 1.5% |
| South Eastern Asia | 13 | 1.3% |
| Western Africa | 2 | 0.2% |
| Western Europe | 10 | 1.0% | View All 15 Rows |
Sex and Age in Woodstock
Sex and Age in Woodstock
The most populous age groups in Woodstock are 65 to 69 Years (54 | 12.0%) for men and 70 to 74 Years (68 | 11.7%) for women.
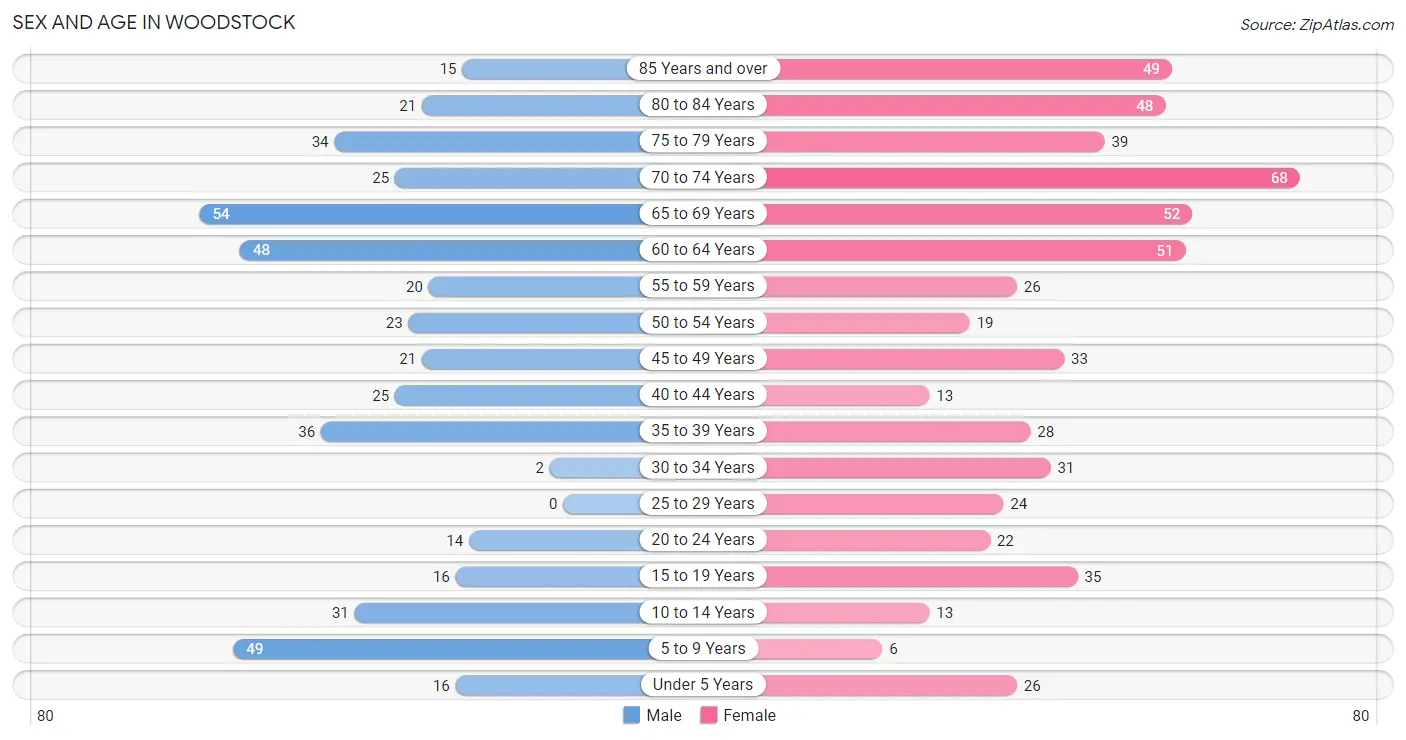
| Age Bracket | Male | Female |
| Under 5 Years | 16 (3.6%) | 26 (4.5%) |
| 5 to 9 Years | 49 (10.9%) | 6 (1.0%) |
| 10 to 14 Years | 31 (6.9%) | 13 (2.2%) |
| 15 to 19 Years | 16 (3.6%) | 35 (6.0%) |
| 20 to 24 Years | 14 (3.1%) | 22 (3.8%) |
| 25 to 29 Years | 0 (0.0%) | 24 (4.1%) |
| 30 to 34 Years | 2 (0.4%) | 31 (5.3%) |
| 35 to 39 Years | 36 (8.0%) | 28 (4.8%) |
| 40 to 44 Years | 25 (5.6%) | 13 (2.2%) |
| 45 to 49 Years | 21 (4.7%) | 33 (5.7%) |
| 50 to 54 Years | 23 (5.1%) | 19 (3.3%) |
| 55 to 59 Years | 20 (4.4%) | 26 (4.5%) |
| 60 to 64 Years | 48 (10.7%) | 51 (8.7%) |
| 65 to 69 Years | 54 (12.0%) | 52 (8.9%) |
| 70 to 74 Years | 25 (5.6%) | 68 (11.7%) |
| 75 to 79 Years | 34 (7.6%) | 39 (6.7%) |
| 80 to 84 Years | 21 (4.7%) | 48 (8.2%) |
| 85 Years and over | 15 (3.3%) | 49 (8.4%) |
| Total | 450 (100.0%) | 583 (100.0%) |
Families and Households in Woodstock
Median Family Size in Woodstock
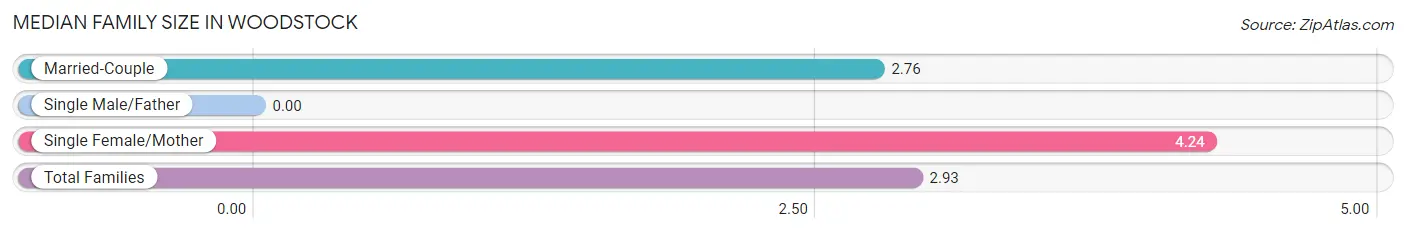
| Family Type | # Families | Family Size |
| Married-Couple | 188 (88.3%) | 2.76 |
| Single Male/Father | 0 (0.0%) | - |
| Single Female/Mother | 25 (11.7%) | 4.24 |
| Total Families | 213 (100.0%) | 2.93 |
Median Household Size in Woodstock
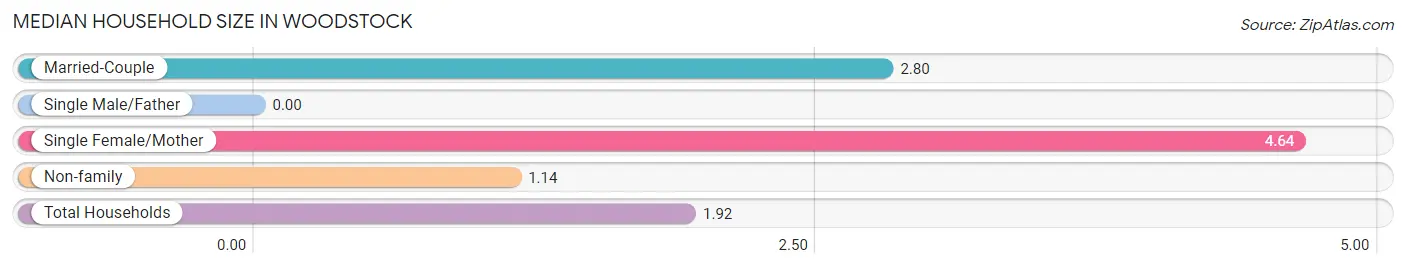
| Household Type | # Households | Household Size |
| Married-Couple | 188 (36.9%) | 2.80 |
| Single Male/Father | 0 (0.0%) | - |
| Single Female/Mother | 25 (4.9%) | 4.64 |
| Non-family | 296 (58.2%) | 1.14 |
| Total Households | 509 (100.0%) | 1.92 |
Household Size by Marriage Status in Woodstock
Out of a total of 509 households in Woodstock, 213 (41.8%) are family households, while 296 (58.2%) are nonfamily households. The most numerous type of family households are 2-person households, comprising 132, and the most common type of nonfamily households are 1-person households, comprising 264.
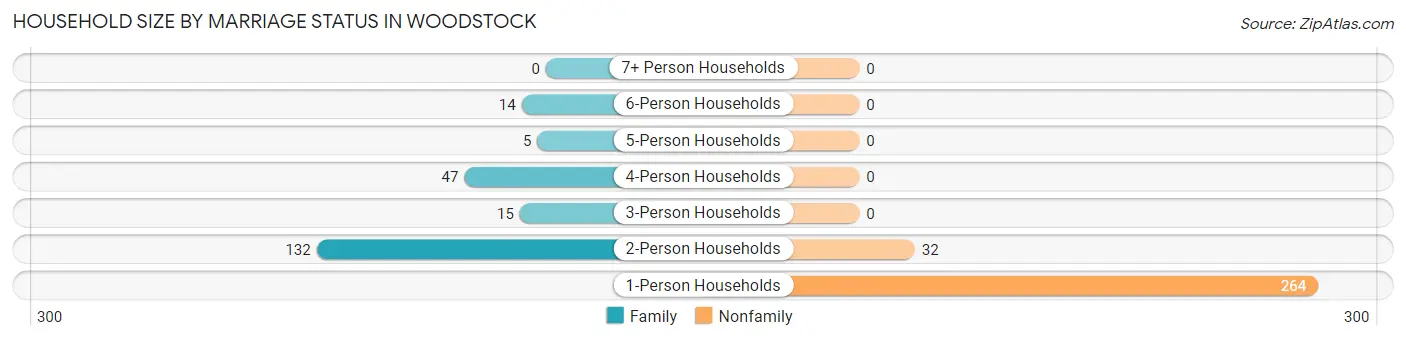
| Household Size | Family Households | Nonfamily Households |
| 1-Person Households | - | 264 (51.9%) |
| 2-Person Households | 132 (25.9%) | 32 (6.3%) |
| 3-Person Households | 15 (2.9%) | 0 (0.0%) |
| 4-Person Households | 47 (9.2%) | 0 (0.0%) |
| 5-Person Households | 5 (1.0%) | 0 (0.0%) |
| 6-Person Households | 14 (2.8%) | 0 (0.0%) |
| 7+ Person Households | 0 (0.0%) | 0 (0.0%) |
| Total | 213 (41.8%) | 296 (58.2%) |
Female Fertility in Woodstock
Fertility by Age in Woodstock
Average fertility rate in Woodstock is 21.0 births per 1,000 women. Women in the age bracket of 20 to 34 years have the highest fertility rate with 52.0 births per 1,000 women. Women in the age bracket of 20 to 34 years acount for 100.0% of all women with births.
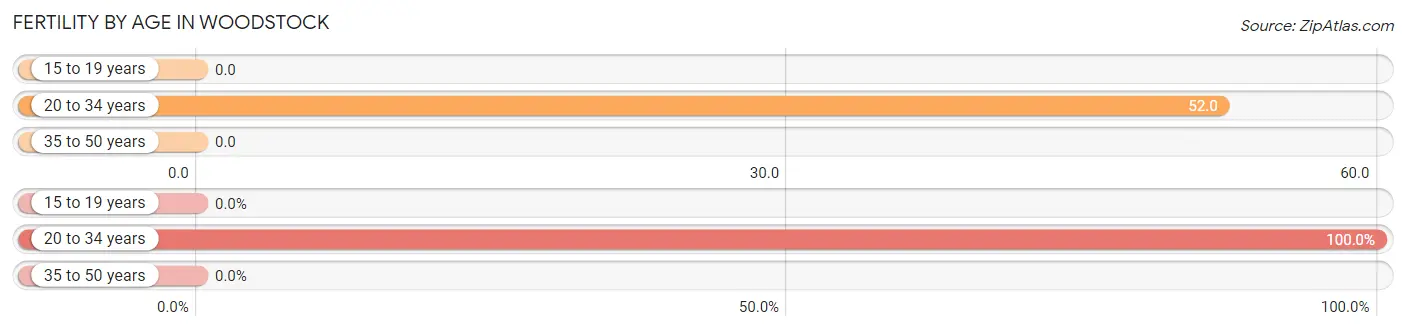
| Age Bracket | Women with Births | Births / 1,000 Women |
| 15 to 19 years | 0 (0.0%) | 0.0 |
| 20 to 34 years | 4 (100.0%) | 52.0 |
| 35 to 50 years | 0 (0.0%) | 0.0 |
| Total | 4 (100.0%) | 21.0 |
Fertility by Age by Marriage Status in Woodstock
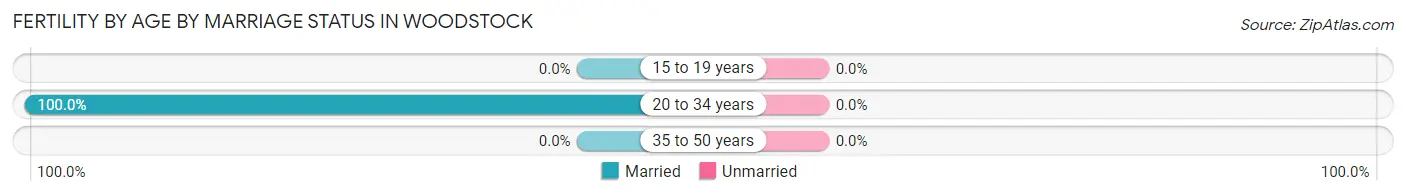
| Age Bracket | Married | Unmarried |
| 15 to 19 years | 0 (0.0%) | 0 (0.0%) |
| 20 to 34 years | 4 (100.0%) | 0 (0.0%) |
| 35 to 50 years | 0 (0.0%) | 0 (0.0%) |
| Total | 4 (100.0%) | 0 (0.0%) |
Fertility by Education in Woodstock
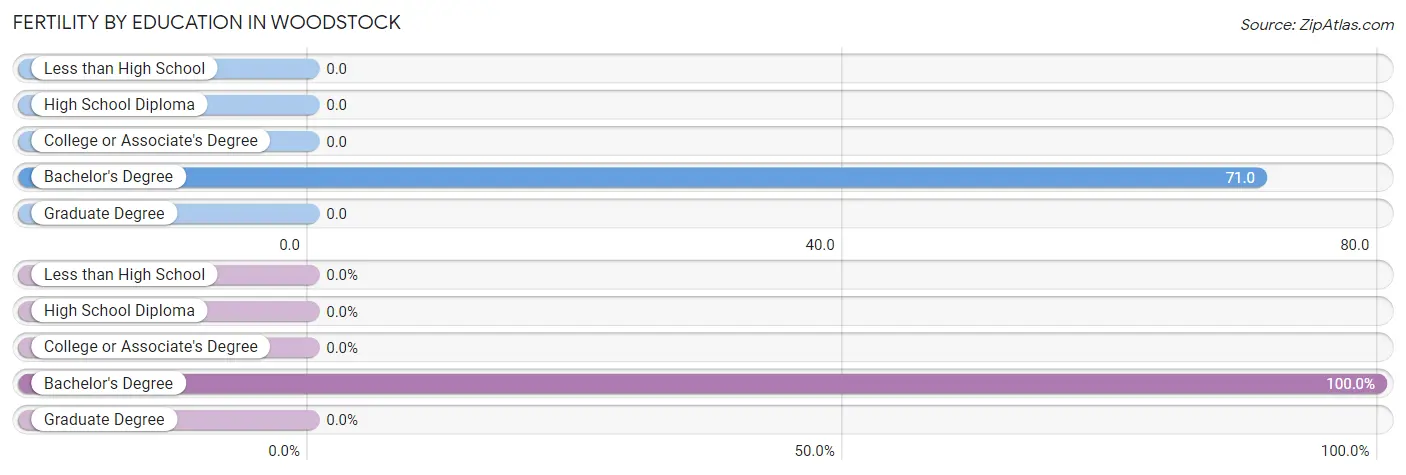
| Educational Attainment | Women with Births | Births / 1,000 Women |
| Less than High School | 0 (0.0%) | 0.0 |
| High School Diploma | 0 (0.0%) | 0.0 |
| College or Associate's Degree | 0 (0.0%) | 0.0 |
| Bachelor's Degree | 4 (100.0%) | 71.0 |
| Graduate Degree | 0 (0.0%) | 0.0 |
| Total | 4 (100.0%) | 21.0 |
Fertility by Education by Marriage Status in Woodstock
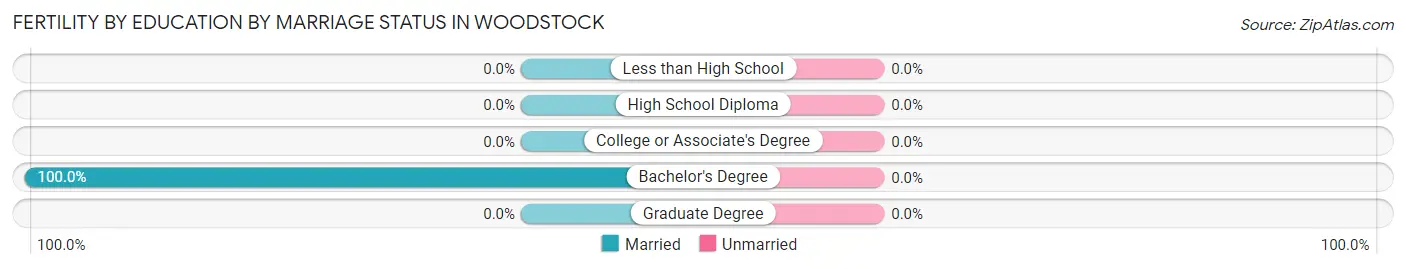
| Educational Attainment | Married | Unmarried |
| Less than High School | 0 (0.0%) | 0 (0.0%) |
| High School Diploma | 0 (0.0%) | 0 (0.0%) |
| College or Associate's Degree | 0 (0.0%) | 0 (0.0%) |
| Bachelor's Degree | 4 (100.0%) | 0 (0.0%) |
| Graduate Degree | 0 (0.0%) | 0 (0.0%) |
| Total | 4 (100.0%) | 0 (0.0%) |
Employment Characteristics in Woodstock
Employment by Class of Employer in Woodstock
Among the 500 employed individuals in Woodstock, private company employees (251 | 50.2%), not-for-profit organizations (75 | 15.0%), and self-employed (incorporated) (63 | 12.6%) make up the most common classes of employment.
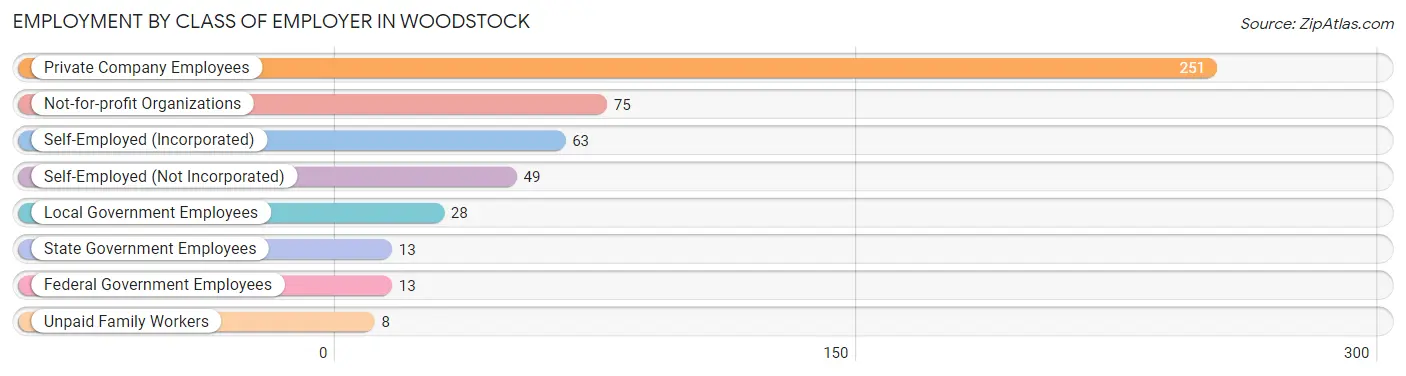
| Employer Class | # Employees | % Employees |
| Private Company Employees | 251 | 50.2% |
| Self-Employed (Incorporated) | 63 | 12.6% |
| Self-Employed (Not Incorporated) | 49 | 9.8% |
| Not-for-profit Organizations | 75 | 15.0% |
| Local Government Employees | 28 | 5.6% |
| State Government Employees | 13 | 2.6% |
| Federal Government Employees | 13 | 2.6% |
| Unpaid Family Workers | 8 | 1.6% |
| Total | 500 | 100.0% |
Employment Status by Age in Woodstock
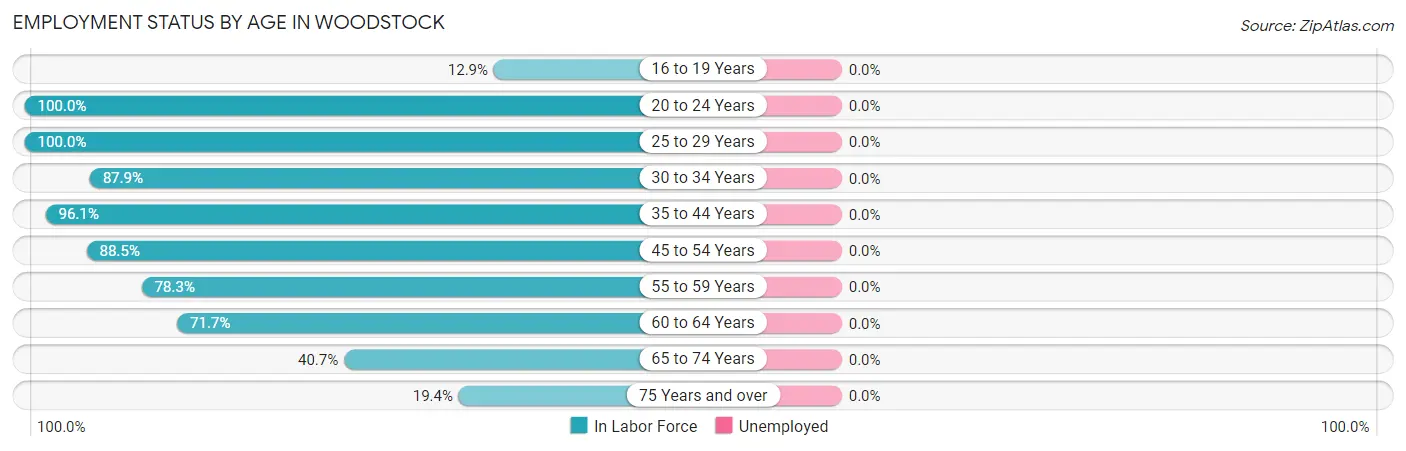
| Age Bracket | In Labor Force | Unemployed |
| 16 to 19 Years | 4 (12.9%) | 0 (0.0%) |
| 20 to 24 Years | 36 (100.0%) | 0 (0.0%) |
| 25 to 29 Years | 24 (100.0%) | 0 (0.0%) |
| 30 to 34 Years | 29 (87.9%) | 0 (0.0%) |
| 35 to 44 Years | 98 (96.1%) | 0 (0.0%) |
| 45 to 54 Years | 85 (88.5%) | 0 (0.0%) |
| 55 to 59 Years | 36 (78.3%) | 0 (0.0%) |
| 60 to 64 Years | 71 (71.7%) | 0 (0.0%) |
| 65 to 74 Years | 81 (40.7%) | 0 (0.0%) |
| 75 Years and over | 40 (19.4%) | 0 (0.0%) |
| Total | 504 (57.8%) | 0 (0.0%) |
Employment Status by Educational Attainment in Woodstock
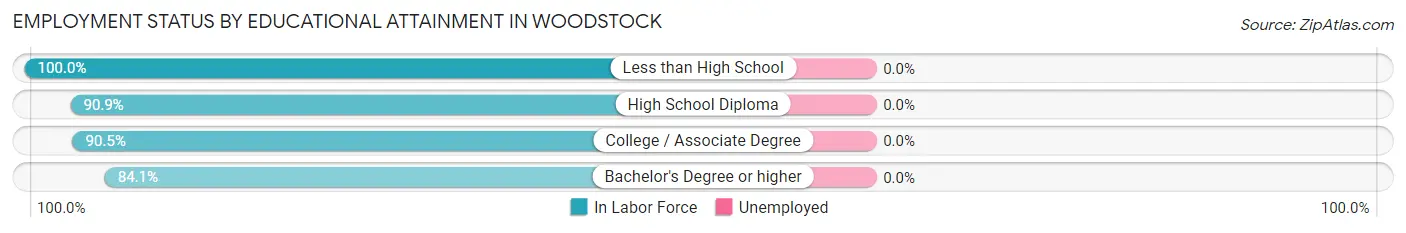
| Educational Attainment | In Labor Force | Unemployed |
| Less than High School | 2 (100.0%) | 0 (0.0%) |
| High School Diploma | 30 (90.9%) | 0 (0.0%) |
| College / Associate Degree | 57 (90.5%) | 0 (0.0%) |
| Bachelor's Degree or higher | 254 (84.1%) | 0 (0.0%) |
| Total | 343 (85.8%) | 0 (0.0%) |
Employment Occupations by Sex in Woodstock
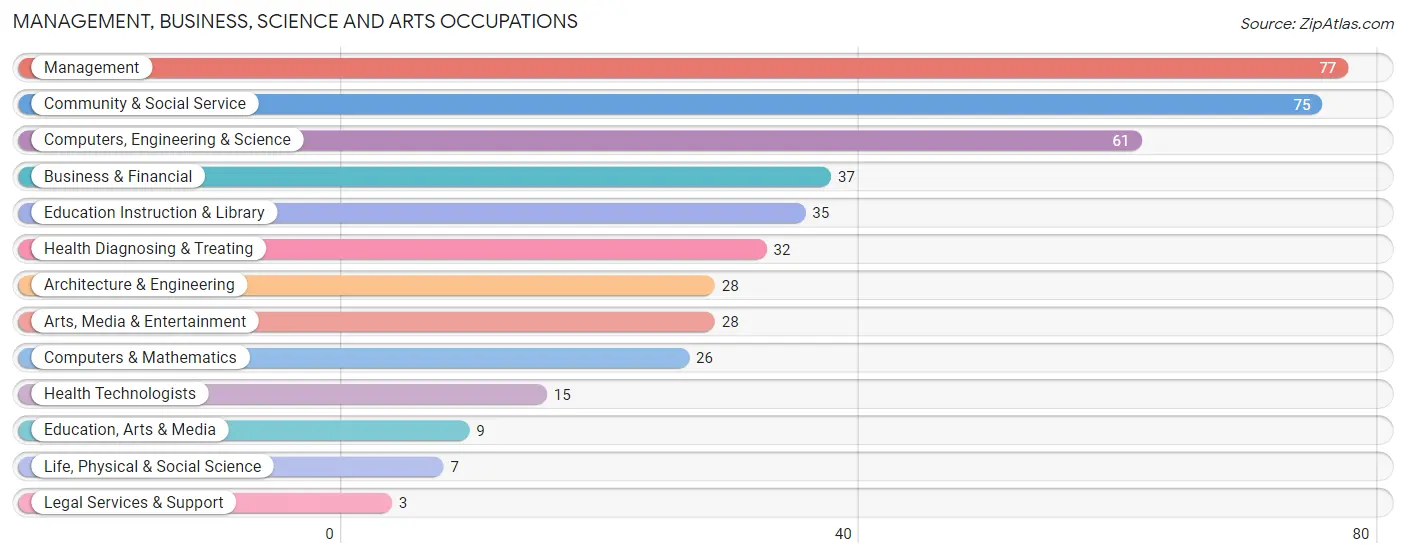
Management, Business, Science and Arts Occupations
The most common Management, Business, Science and Arts occupations in Woodstock are Management (77 | 15.3%), Community & Social Service (75 | 14.9%), Computers, Engineering & Science (61 | 12.1%), Business & Financial (37 | 7.3%), and Education Instruction & Library (35 | 6.9%).
Management, Business, Science and Arts Occupations by Sex
Within the Management, Business, Science and Arts occupations in Woodstock, the most male-oriented occupations are Computers & Mathematics (100.0%), Education, Arts & Media (100.0%), and Health Technologists (86.7%), while the most female-oriented occupations are Life, Physical & Social Science (100.0%), Legal Services & Support (100.0%), and Arts, Media & Entertainment (71.4%).
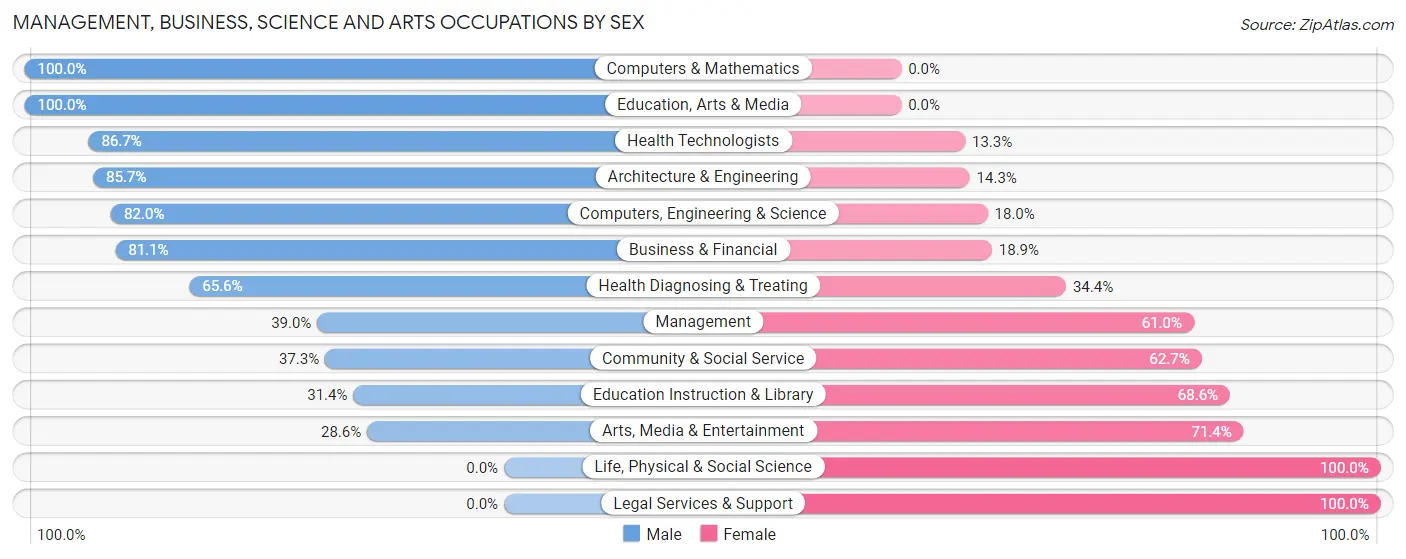
| Occupation | Male | Female |
| Management | 30 (39.0%) | 47 (61.0%) |
| Business & Financial | 30 (81.1%) | 7 (18.9%) |
| Computers, Engineering & Science | 50 (82.0%) | 11 (18.0%) |
| Computers & Mathematics | 26 (100.0%) | 0 (0.0%) |
| Architecture & Engineering | 24 (85.7%) | 4 (14.3%) |
| Life, Physical & Social Science | 0 (0.0%) | 7 (100.0%) |
| Community & Social Service | 28 (37.3%) | 47 (62.7%) |
| Education, Arts & Media | 9 (100.0%) | 0 (0.0%) |
| Legal Services & Support | 0 (0.0%) | 3 (100.0%) |
| Education Instruction & Library | 11 (31.4%) | 24 (68.6%) |
| Arts, Media & Entertainment | 8 (28.6%) | 20 (71.4%) |
| Health Diagnosing & Treating | 21 (65.6%) | 11 (34.4%) |
| Health Technologists | 13 (86.7%) | 2 (13.3%) |
| Total (Category) | 159 (56.4%) | 123 (43.6%) |
| Total (Overall) | 241 (47.8%) | 263 (52.2%) |
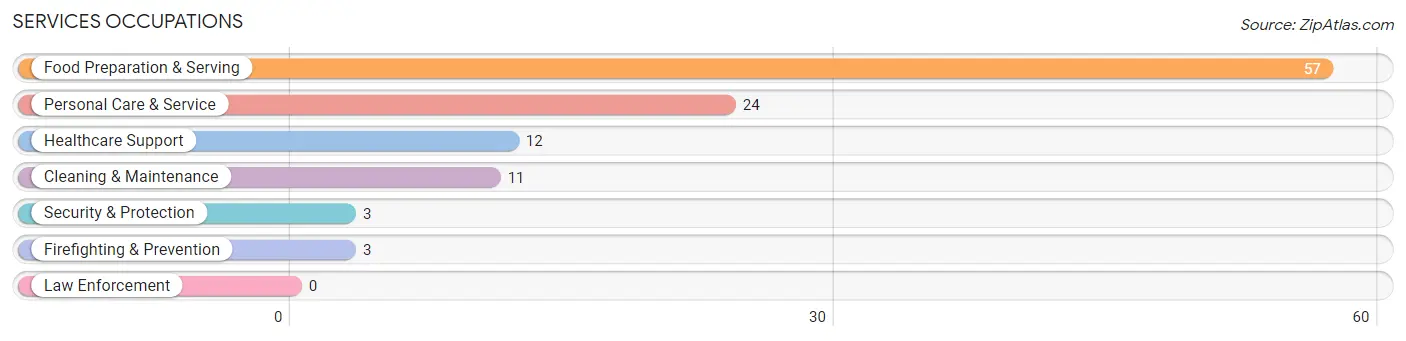
Services Occupations
The most common Services occupations in Woodstock are Food Preparation & Serving (57 | 11.3%), Personal Care & Service (24 | 4.8%), Healthcare Support (12 | 2.4%), Cleaning & Maintenance (11 | 2.2%), and Security & Protection (3 | 0.6%).
Services Occupations by Sex
Within the Services occupations in Woodstock, the most male-oriented occupations are Security & Protection (100.0%), Firefighting & Prevention (100.0%), and Food Preparation & Serving (40.4%), while the most female-oriented occupations are Healthcare Support (100.0%), Personal Care & Service (83.3%), and Cleaning & Maintenance (72.7%).
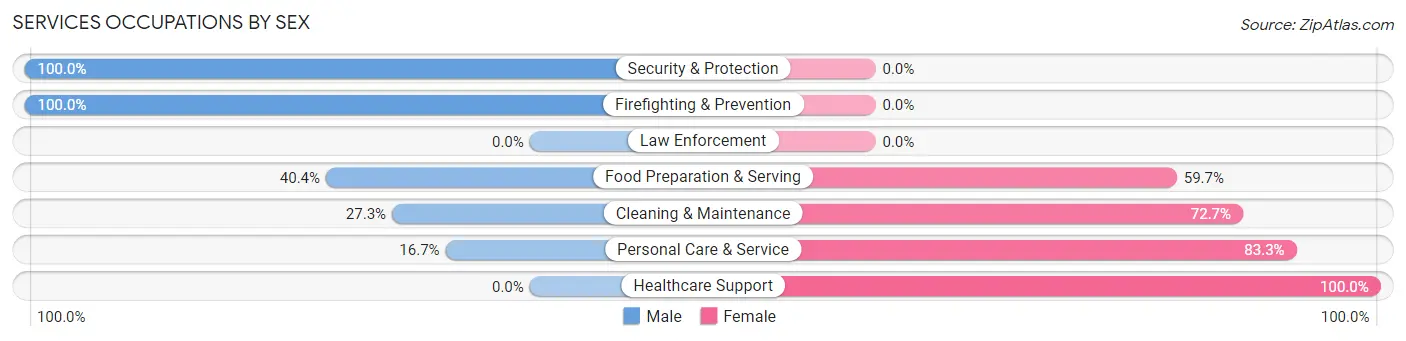
| Occupation | Male | Female |
| Healthcare Support | 0 (0.0%) | 12 (100.0%) |
| Security & Protection | 3 (100.0%) | 0 (0.0%) |
| Firefighting & Prevention | 3 (100.0%) | 0 (0.0%) |
| Law Enforcement | 0 (0.0%) | 0 (0.0%) |
| Food Preparation & Serving | 23 (40.4%) | 34 (59.7%) |
| Cleaning & Maintenance | 3 (27.3%) | 8 (72.7%) |
| Personal Care & Service | 4 (16.7%) | 20 (83.3%) |
| Total (Category) | 33 (30.8%) | 74 (69.2%) |
| Total (Overall) | 241 (47.8%) | 263 (52.2%) |
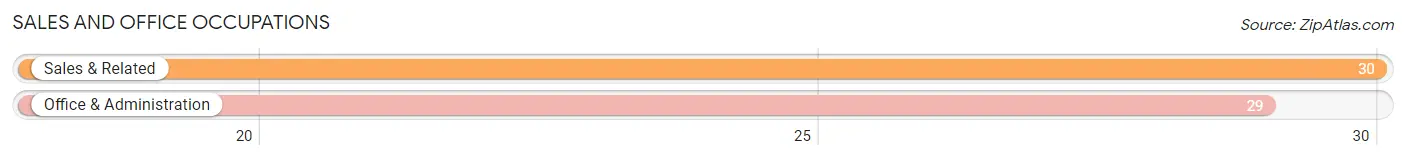
Sales and Office Occupations
The most common Sales and Office occupations in Woodstock are Sales & Related (30 | 5.9%), and Office & Administration (29 | 5.8%).
Sales and Office Occupations by Sex
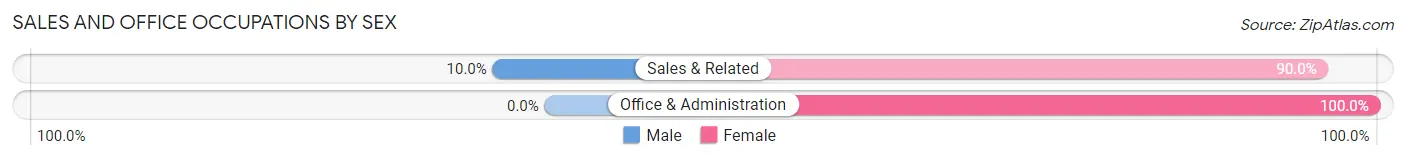
| Occupation | Male | Female |
| Sales & Related | 3 (10.0%) | 27 (90.0%) |
| Office & Administration | 0 (0.0%) | 29 (100.0%) |
| Total (Category) | 3 (5.1%) | 56 (94.9%) |
| Total (Overall) | 241 (47.8%) | 263 (52.2%) |
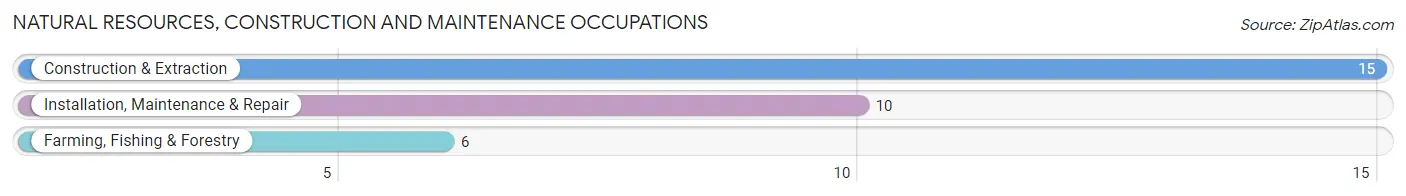
Natural Resources, Construction and Maintenance Occupations
The most common Natural Resources, Construction and Maintenance occupations in Woodstock are Construction & Extraction (15 | 3.0%), Installation, Maintenance & Repair (10 | 2.0%), and Farming, Fishing & Forestry (6 | 1.2%).
Natural Resources, Construction and Maintenance Occupations by Sex
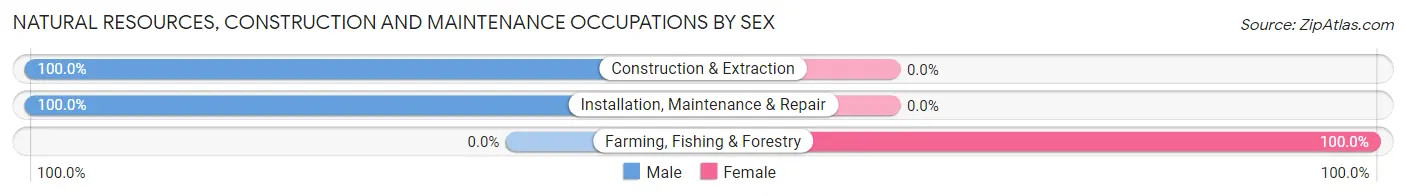
| Occupation | Male | Female |
| Farming, Fishing & Forestry | 0 (0.0%) | 6 (100.0%) |
| Construction & Extraction | 15 (100.0%) | 0 (0.0%) |
| Installation, Maintenance & Repair | 10 (100.0%) | 0 (0.0%) |
| Total (Category) | 25 (80.6%) | 6 (19.4%) |
| Total (Overall) | 241 (47.8%) | 263 (52.2%) |
Production, Transportation and Moving Occupations
The most common Production, Transportation and Moving occupations in Woodstock are Production (19 | 3.8%), and Material Moving (6 | 1.2%).
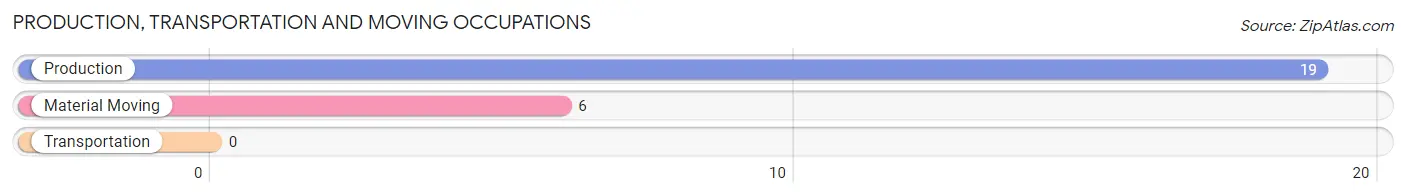
Production, Transportation and Moving Occupations by Sex
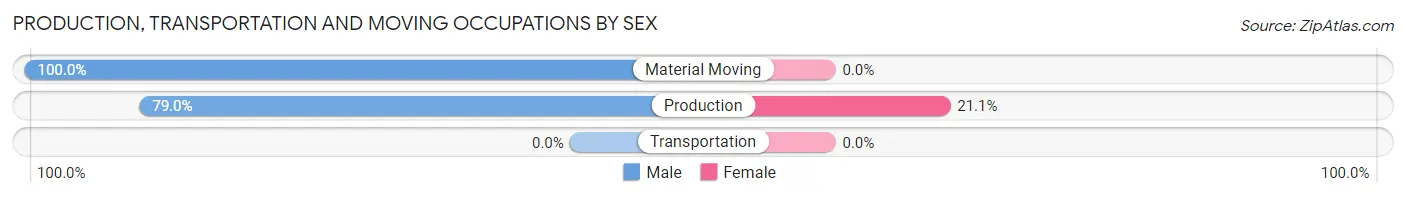
| Occupation | Male | Female |
| Production | 15 (78.9%) | 4 (21.0%) |
| Transportation | 0 (0.0%) | 0 (0.0%) |
| Material Moving | 6 (100.0%) | 0 (0.0%) |
| Total (Category) | 21 (84.0%) | 4 (16.0%) |
| Total (Overall) | 241 (47.8%) | 263 (52.2%) |
Employment Industries by Sex in Woodstock
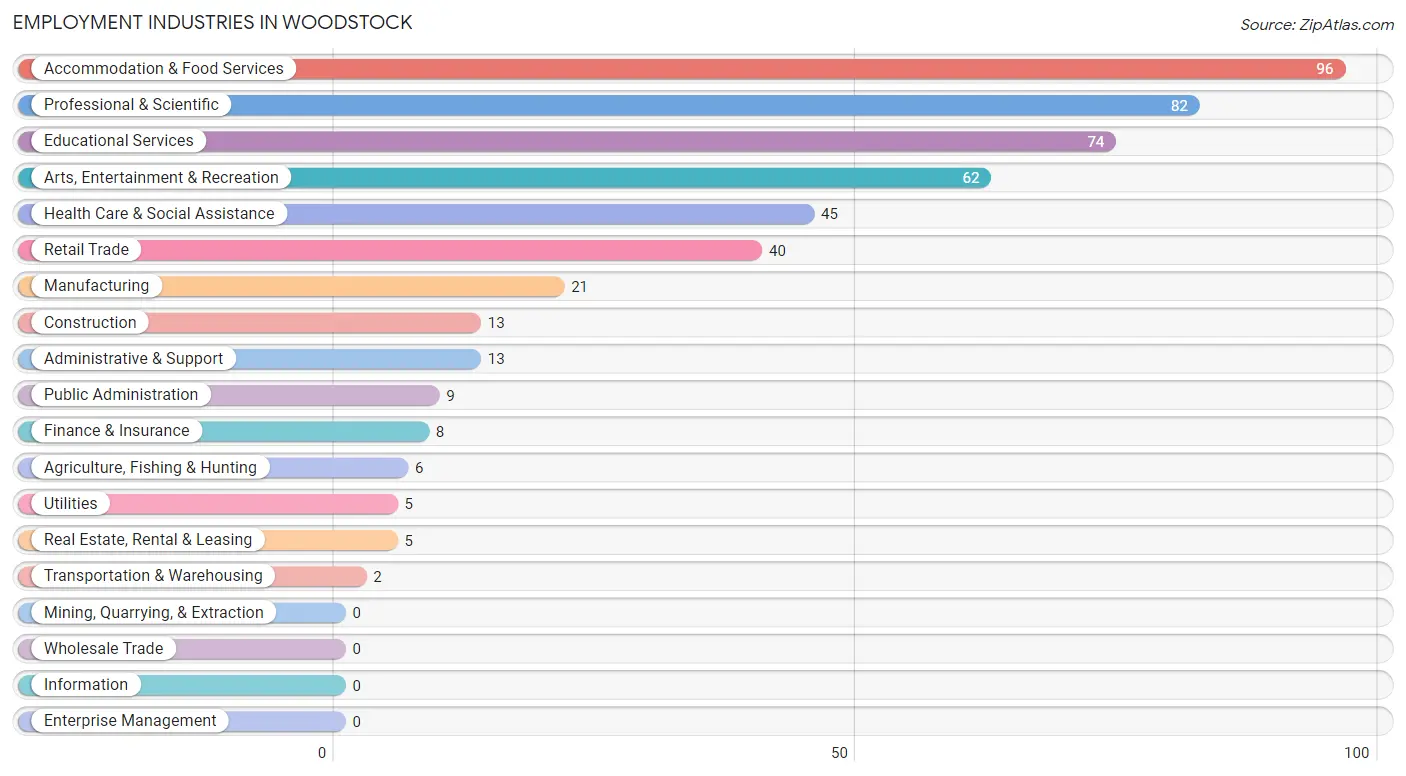
Employment Industries in Woodstock
The major employment industries in Woodstock include Accommodation & Food Services (96 | 19.1%), Professional & Scientific (82 | 16.3%), Educational Services (74 | 14.7%), Arts, Entertainment & Recreation (62 | 12.3%), and Health Care & Social Assistance (45 | 8.9%).
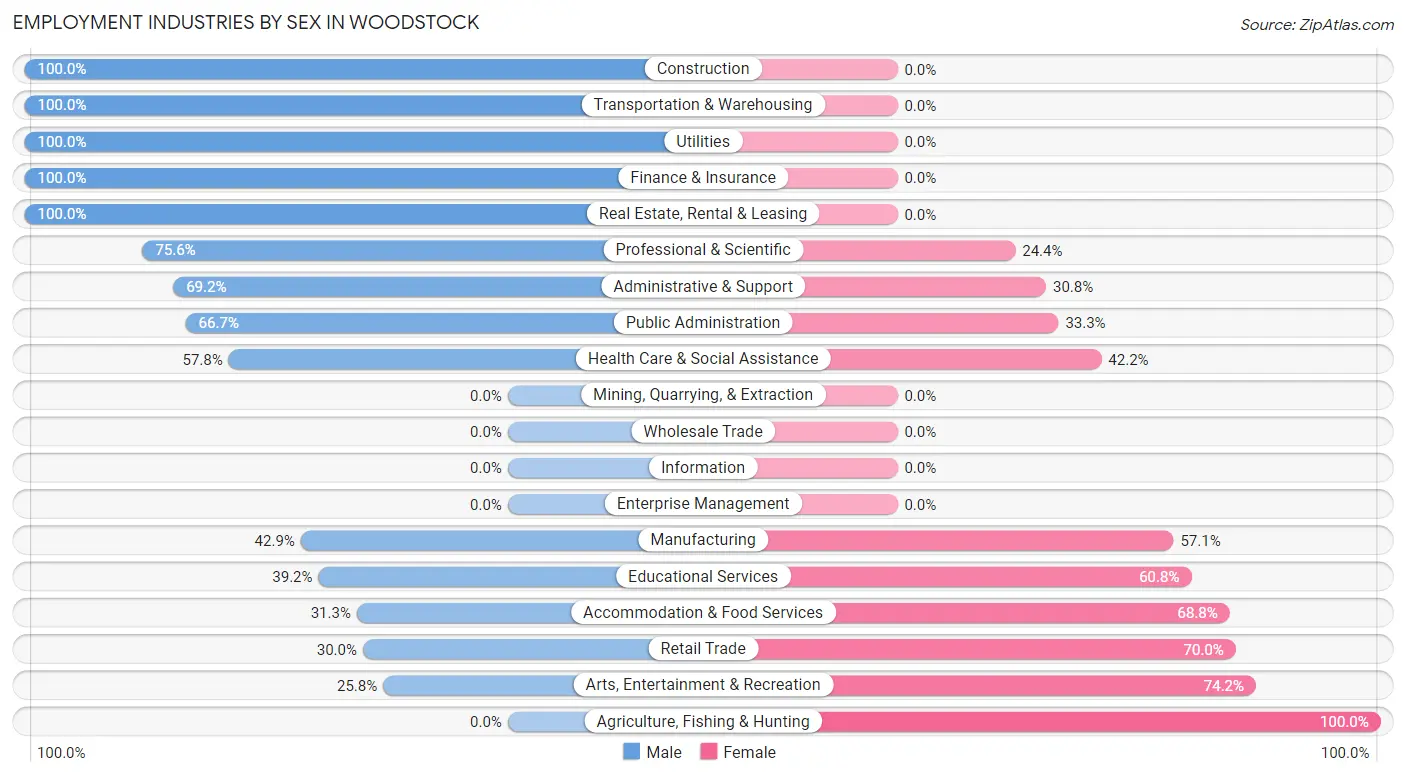
Employment Industries by Sex in Woodstock
The Woodstock industries that see more men than women are Construction (100.0%), Transportation & Warehousing (100.0%), and Utilities (100.0%), whereas the industries that tend to have a higher number of women are Agriculture, Fishing & Hunting (100.0%), Arts, Entertainment & Recreation (74.2%), and Retail Trade (70.0%).
| Industry | Male | Female |
| Agriculture, Fishing & Hunting | 0 (0.0%) | 6 (100.0%) |
| Mining, Quarrying, & Extraction | 0 (0.0%) | 0 (0.0%) |
| Construction | 13 (100.0%) | 0 (0.0%) |
| Manufacturing | 9 (42.9%) | 12 (57.1%) |
| Wholesale Trade | 0 (0.0%) | 0 (0.0%) |
| Retail Trade | 12 (30.0%) | 28 (70.0%) |
| Transportation & Warehousing | 2 (100.0%) | 0 (0.0%) |
| Utilities | 5 (100.0%) | 0 (0.0%) |
| Information | 0 (0.0%) | 0 (0.0%) |
| Finance & Insurance | 8 (100.0%) | 0 (0.0%) |
| Real Estate, Rental & Leasing | 5 (100.0%) | 0 (0.0%) |
| Professional & Scientific | 62 (75.6%) | 20 (24.4%) |
| Enterprise Management | 0 (0.0%) | 0 (0.0%) |
| Administrative & Support | 9 (69.2%) | 4 (30.8%) |
| Educational Services | 29 (39.2%) | 45 (60.8%) |
| Health Care & Social Assistance | 26 (57.8%) | 19 (42.2%) |
| Arts, Entertainment & Recreation | 16 (25.8%) | 46 (74.2%) |
| Accommodation & Food Services | 30 (31.2%) | 66 (68.8%) |
| Public Administration | 6 (66.7%) | 3 (33.3%) |
| Total | 241 (47.8%) | 263 (52.2%) |
Education in Woodstock
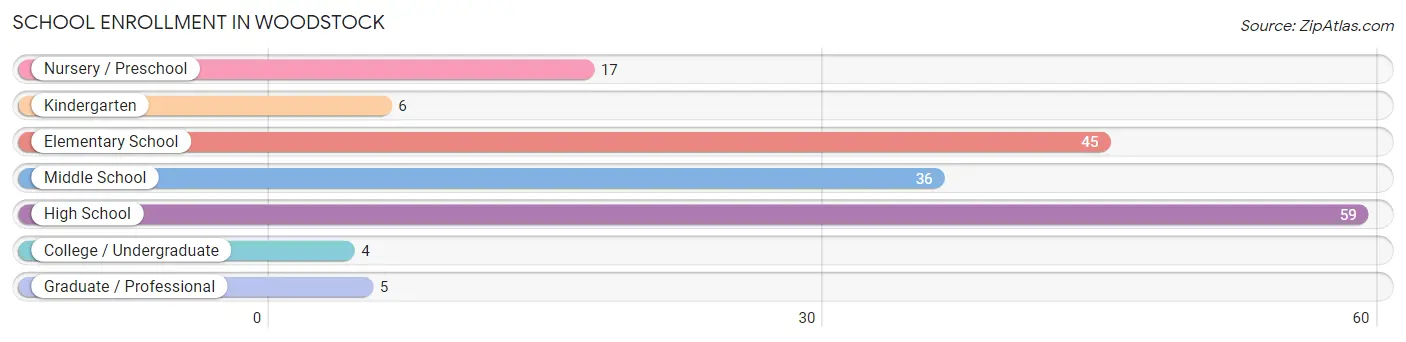
School Enrollment in Woodstock
The most common levels of schooling among the 172 students in Woodstock are high school (59 | 34.3%), elementary school (45 | 26.2%), and middle school (36 | 20.9%).
| School Level | # Students | % Students |
| Nursery / Preschool | 17 | 9.9% |
| Kindergarten | 6 | 3.5% |
| Elementary School | 45 | 26.2% |
| Middle School | 36 | 20.9% |
| High School | 59 | 34.3% |
| College / Undergraduate | 4 | 2.3% |
| Graduate / Professional | 5 | 2.9% |
| Total | 172 | 100.0% |
School Enrollment by Age by Funding Source in Woodstock
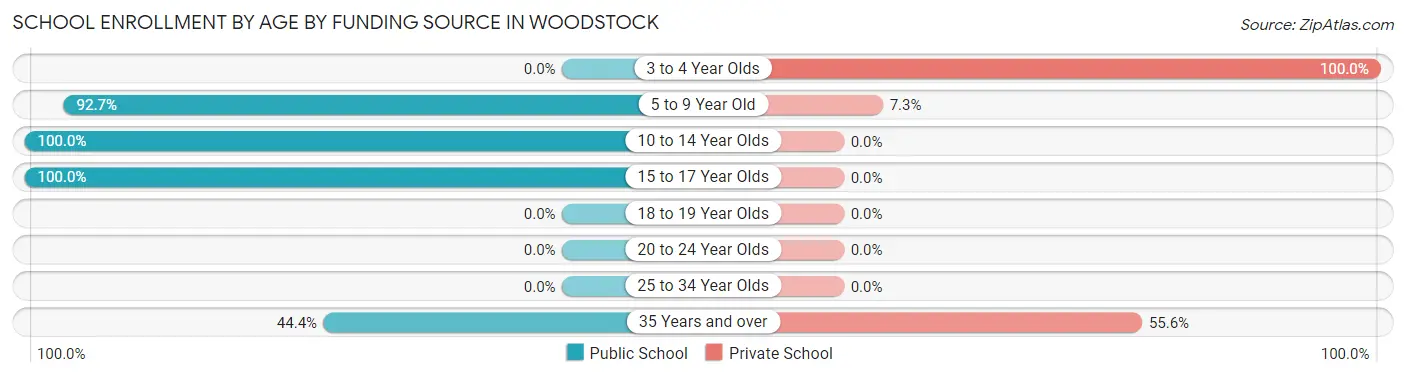
Out of a total of 172 students who are enrolled in schools in Woodstock, 22 (12.8%) attend a private institution, while the remaining 150 (87.2%) are enrolled in public schools. The age group of 3 to 4 year olds has the highest likelihood of being enrolled in private schools, with 13 (100.0% in the age bracket) enrolled. Conversely, the age group of 10 to 14 year olds has the lowest likelihood of being enrolled in a private school, with 44 (100.0% in the age bracket) attending a public institution.
| Age Bracket | Public School | Private School |
| 3 to 4 Year Olds | 0 (0.0%) | 13 (100.0%) |
| 5 to 9 Year Old | 51 (92.7%) | 4 (7.3%) |
| 10 to 14 Year Olds | 44 (100.0%) | 0 (0.0%) |
| 15 to 17 Year Olds | 51 (100.0%) | 0 (0.0%) |
| 18 to 19 Year Olds | 0 (0.0%) | 0 (0.0%) |
| 20 to 24 Year Olds | 0 (0.0%) | 0 (0.0%) |
| 25 to 34 Year Olds | 0 (0.0%) | 0 (0.0%) |
| 35 Years and over | 4 (44.4%) | 5 (55.6%) |
| Total | 150 (87.2%) | 22 (12.8%) |
Educational Attainment by Field of Study in Woodstock
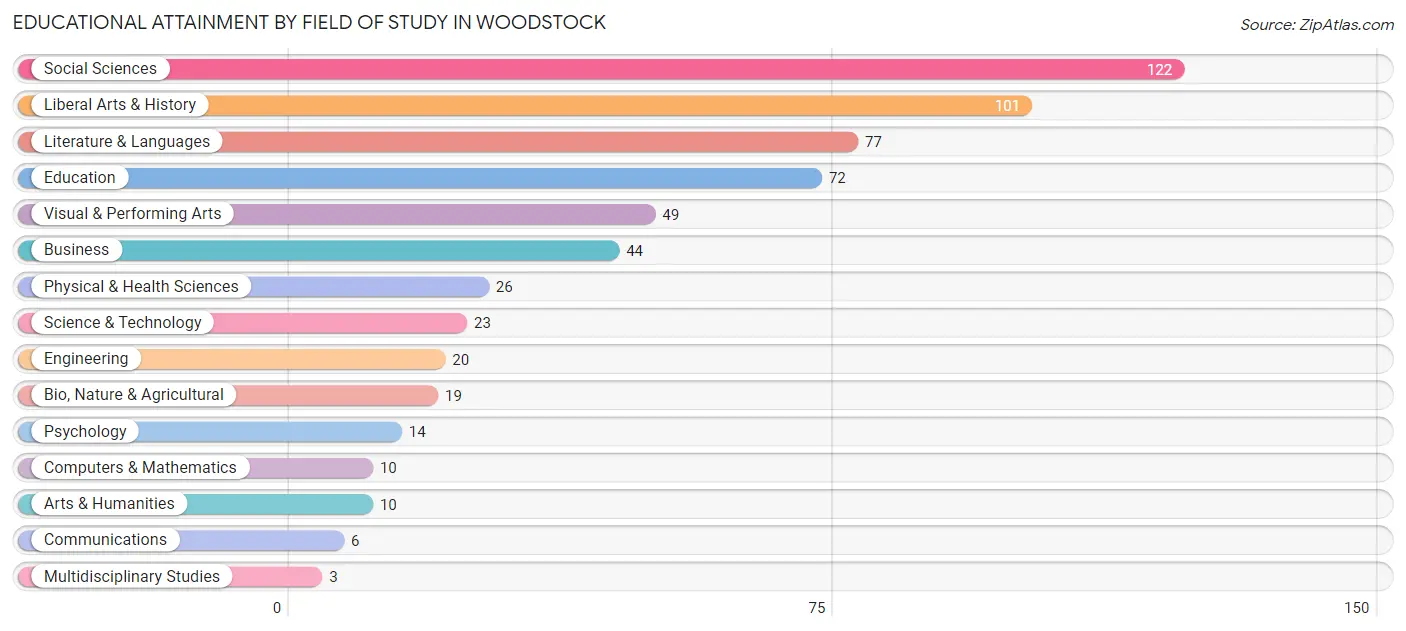
Social sciences (122 | 20.5%), liberal arts & history (101 | 17.0%), literature & languages (77 | 12.9%), education (72 | 12.1%), and visual & performing arts (49 | 8.2%) are the most common fields of study among 596 individuals in Woodstock who have obtained a bachelor's degree or higher.
| Field of Study | # Graduates | % Graduates |
| Computers & Mathematics | 10 | 1.7% |
| Bio, Nature & Agricultural | 19 | 3.2% |
| Physical & Health Sciences | 26 | 4.4% |
| Psychology | 14 | 2.4% |
| Social Sciences | 122 | 20.5% |
| Engineering | 20 | 3.4% |
| Multidisciplinary Studies | 3 | 0.5% |
| Science & Technology | 23 | 3.9% |
| Business | 44 | 7.4% |
| Education | 72 | 12.1% |
| Literature & Languages | 77 | 12.9% |
| Liberal Arts & History | 101 | 17.0% |
| Visual & Performing Arts | 49 | 8.2% |
| Communications | 6 | 1.0% |
| Arts & Humanities | 10 | 1.7% |
| Total | 596 | 100.0% |
Transportation & Commute in Woodstock
Vehicle Availability by Sex in Woodstock
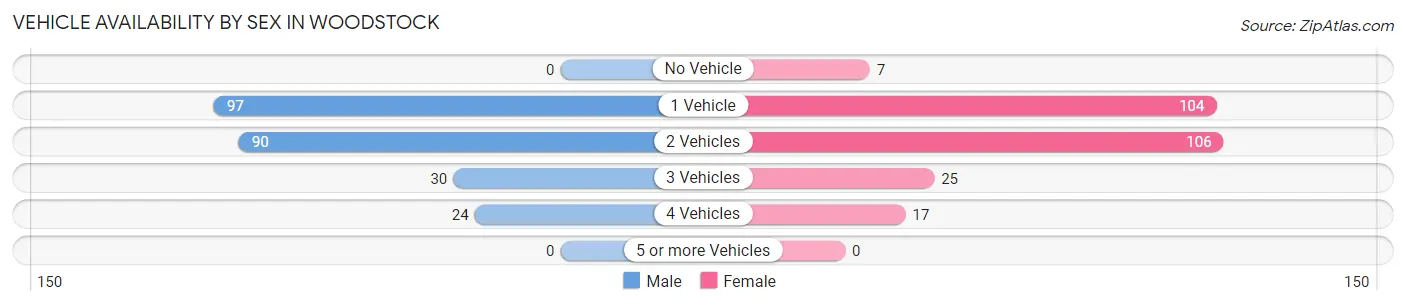
The most prevalent vehicle ownership categories in Woodstock are males with 1 vehicle (97, accounting for 40.3%) and females with 1 vehicle (104, making up 37.4%).
| Vehicles Available | Male | Female |
| No Vehicle | 0 (0.0%) | 7 (2.7%) |
| 1 Vehicle | 97 (40.3%) | 104 (40.2%) |
| 2 Vehicles | 90 (37.3%) | 106 (40.9%) |
| 3 Vehicles | 30 (12.4%) | 25 (9.7%) |
| 4 Vehicles | 24 (10.0%) | 17 (6.6%) |
| 5 or more Vehicles | 0 (0.0%) | 0 (0.0%) |
| Total | 241 (100.0%) | 259 (100.0%) |
Commute Time in Woodstock
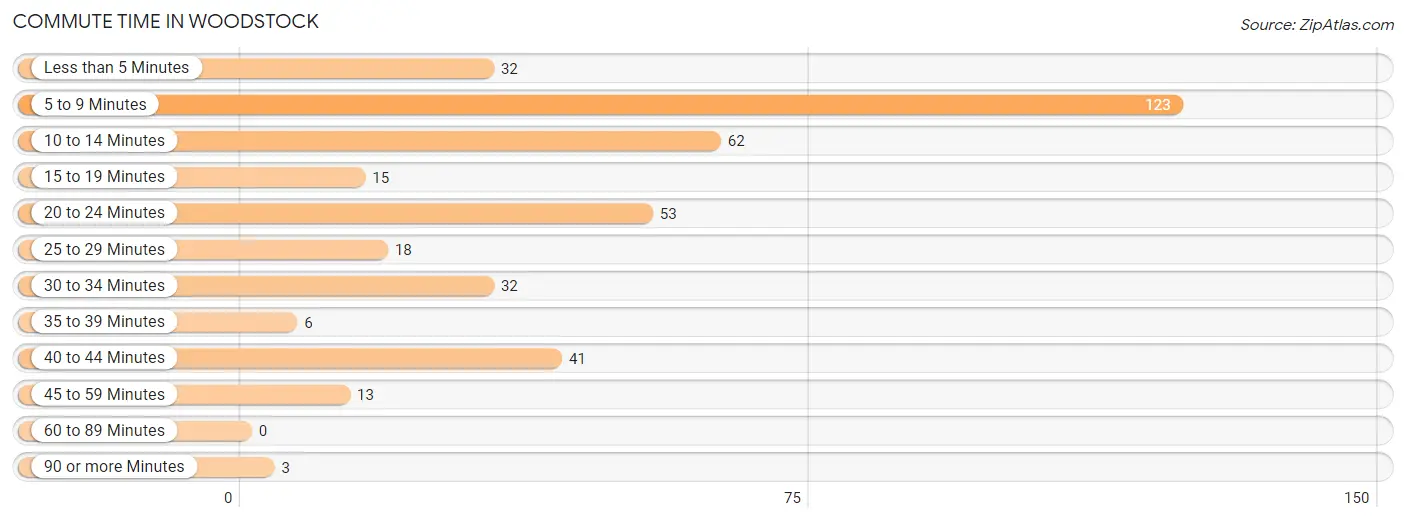
The most frequently occuring commute durations in Woodstock are 5 to 9 minutes (123 commuters, 30.9%), 10 to 14 minutes (62 commuters, 15.6%), and 20 to 24 minutes (53 commuters, 13.3%).
| Commute Time | # Commuters | % Commuters |
| Less than 5 Minutes | 32 | 8.0% |
| 5 to 9 Minutes | 123 | 30.9% |
| 10 to 14 Minutes | 62 | 15.6% |
| 15 to 19 Minutes | 15 | 3.8% |
| 20 to 24 Minutes | 53 | 13.3% |
| 25 to 29 Minutes | 18 | 4.5% |
| 30 to 34 Minutes | 32 | 8.0% |
| 35 to 39 Minutes | 6 | 1.5% |
| 40 to 44 Minutes | 41 | 10.3% |
| 45 to 59 Minutes | 13 | 3.3% |
| 60 to 89 Minutes | 0 | 0.0% |
| 90 or more Minutes | 3 | 0.7% |
Commute Time by Sex in Woodstock
The most common commute times in Woodstock are 5 to 9 minutes (52 commuters, 28.6%) for males and 5 to 9 minutes (71 commuters, 32.9%) for females.
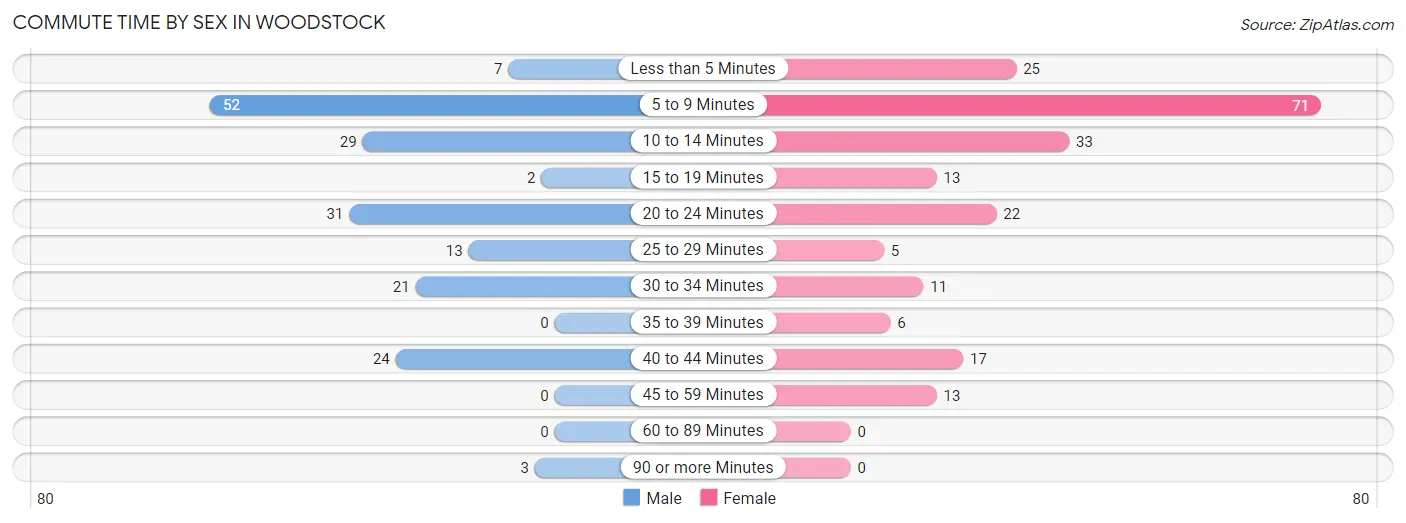
| Commute Time | Male | Female |
| Less than 5 Minutes | 7 (3.8%) | 25 (11.6%) |
| 5 to 9 Minutes | 52 (28.6%) | 71 (32.9%) |
| 10 to 14 Minutes | 29 (15.9%) | 33 (15.3%) |
| 15 to 19 Minutes | 2 (1.1%) | 13 (6.0%) |
| 20 to 24 Minutes | 31 (17.0%) | 22 (10.2%) |
| 25 to 29 Minutes | 13 (7.1%) | 5 (2.3%) |
| 30 to 34 Minutes | 21 (11.5%) | 11 (5.1%) |
| 35 to 39 Minutes | 0 (0.0%) | 6 (2.8%) |
| 40 to 44 Minutes | 24 (13.2%) | 17 (7.9%) |
| 45 to 59 Minutes | 0 (0.0%) | 13 (6.0%) |
| 60 to 89 Minutes | 0 (0.0%) | 0 (0.0%) |
| 90 or more Minutes | 3 (1.7%) | 0 (0.0%) |
Time of Departure to Work by Sex in Woodstock
The most frequent times of departure to work in Woodstock are 7:00 AM to 7:29 AM (28, 15.4%) for males and 12:00 PM to 3:59 PM (46, 21.3%) for females.
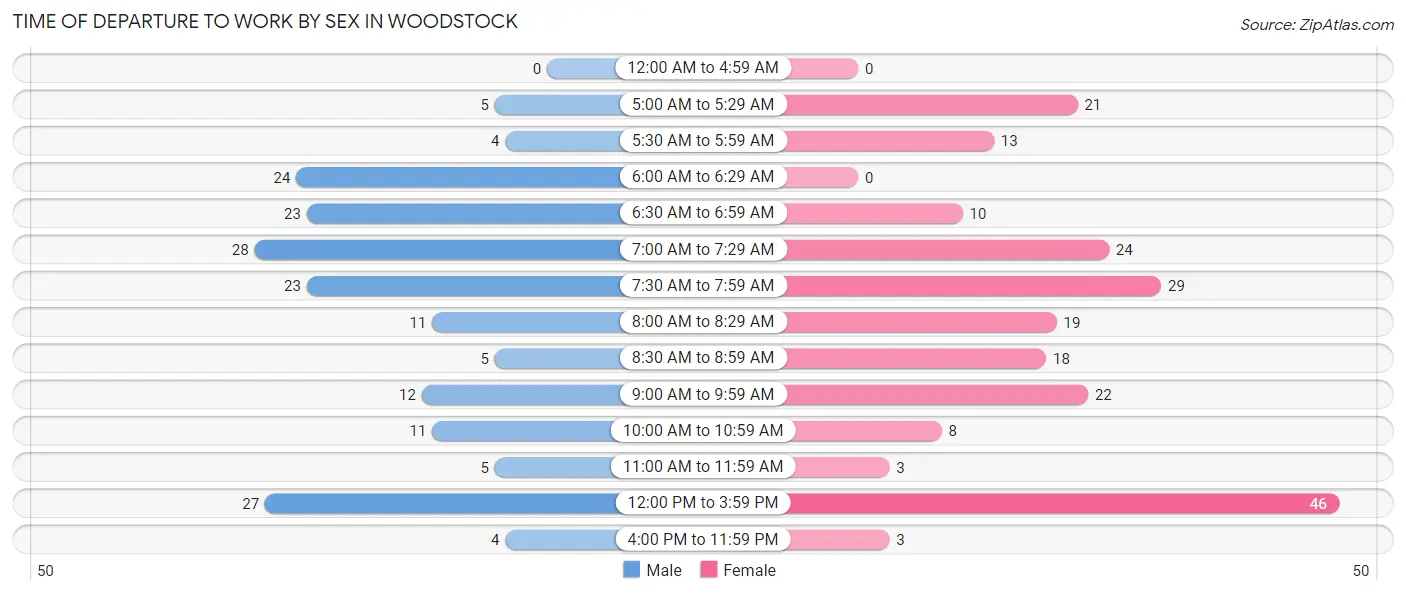
| Time of Departure | Male | Female |
| 12:00 AM to 4:59 AM | 0 (0.0%) | 0 (0.0%) |
| 5:00 AM to 5:29 AM | 5 (2.8%) | 21 (9.7%) |
| 5:30 AM to 5:59 AM | 4 (2.2%) | 13 (6.0%) |
| 6:00 AM to 6:29 AM | 24 (13.2%) | 0 (0.0%) |
| 6:30 AM to 6:59 AM | 23 (12.6%) | 10 (4.6%) |
| 7:00 AM to 7:29 AM | 28 (15.4%) | 24 (11.1%) |
| 7:30 AM to 7:59 AM | 23 (12.6%) | 29 (13.4%) |
| 8:00 AM to 8:29 AM | 11 (6.0%) | 19 (8.8%) |
| 8:30 AM to 8:59 AM | 5 (2.8%) | 18 (8.3%) |
| 9:00 AM to 9:59 AM | 12 (6.6%) | 22 (10.2%) |
| 10:00 AM to 10:59 AM | 11 (6.0%) | 8 (3.7%) |
| 11:00 AM to 11:59 AM | 5 (2.8%) | 3 (1.4%) |
| 12:00 PM to 3:59 PM | 27 (14.8%) | 46 (21.3%) |
| 4:00 PM to 11:59 PM | 4 (2.2%) | 3 (1.4%) |
| Total | 182 (100.0%) | 216 (100.0%) |
Housing Occupancy in Woodstock
Occupancy by Ownership in Woodstock
Of the total 509 dwellings in Woodstock, owner-occupied units account for 279 (54.8%), while renter-occupied units make up 230 (45.2%).
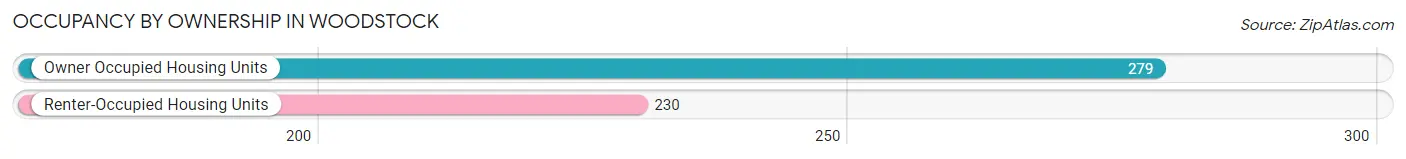
| Occupancy | # Housing Units | % Housing Units |
| Owner Occupied Housing Units | 279 | 54.8% |
| Renter-Occupied Housing Units | 230 | 45.2% |
| Total Occupied Housing Units | 509 | 100.0% |
Occupancy by Household Size in Woodstock
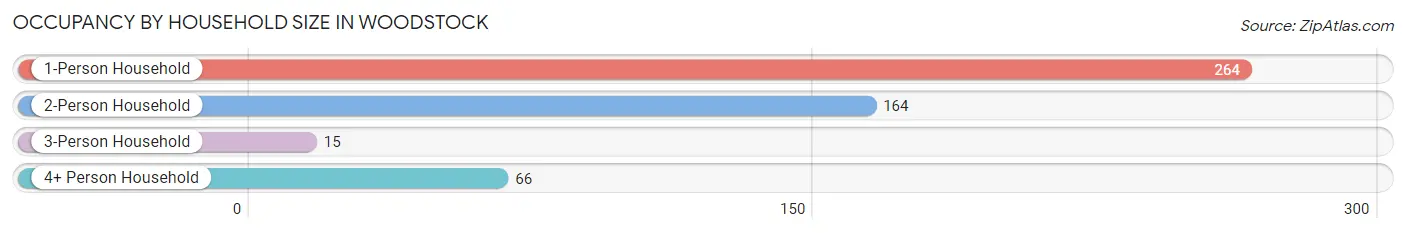
| Household Size | # Housing Units | % Housing Units |
| 1-Person Household | 264 | 51.9% |
| 2-Person Household | 164 | 32.2% |
| 3-Person Household | 15 | 2.9% |
| 4+ Person Household | 66 | 13.0% |
| Total Housing Units | 509 | 100.0% |
Occupancy by Ownership by Household Size in Woodstock
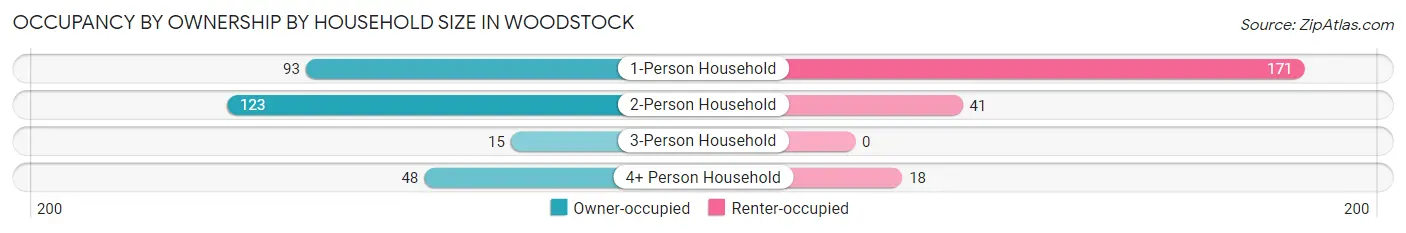
| Household Size | Owner-occupied | Renter-occupied |
| 1-Person Household | 93 (35.2%) | 171 (64.8%) |
| 2-Person Household | 123 (75.0%) | 41 (25.0%) |
| 3-Person Household | 15 (100.0%) | 0 (0.0%) |
| 4+ Person Household | 48 (72.7%) | 18 (27.3%) |
| Total Housing Units | 279 (54.8%) | 230 (45.2%) |
Occupancy by Educational Attainment in Woodstock
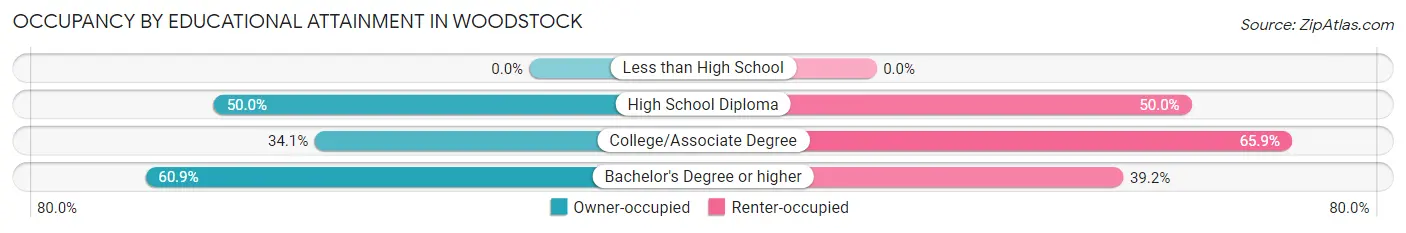
| Household Size | Owner-occupied | Renter-occupied |
| Less than High School | 0 (0.0%) | 0 (0.0%) |
| High School Diploma | 33 (50.0%) | 33 (50.0%) |
| College/Associate Degree | 30 (34.1%) | 58 (65.9%) |
| Bachelor's Degree or higher | 216 (60.9%) | 139 (39.2%) |
Occupancy by Age of Householder in Woodstock
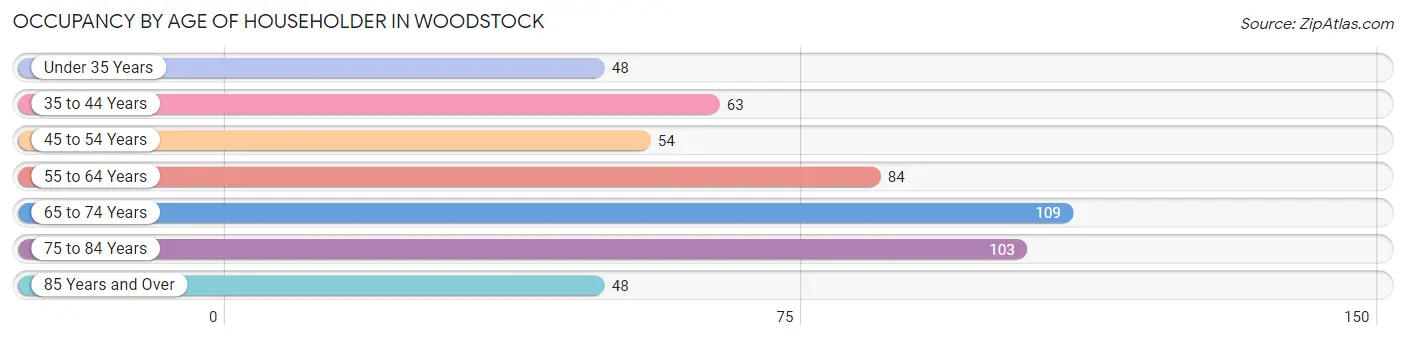
| Age Bracket | # Households | % Households |
| Under 35 Years | 48 | 9.4% |
| 35 to 44 Years | 63 | 12.4% |
| 45 to 54 Years | 54 | 10.6% |
| 55 to 64 Years | 84 | 16.5% |
| 65 to 74 Years | 109 | 21.4% |
| 75 to 84 Years | 103 | 20.2% |
| 85 Years and Over | 48 | 9.4% |
| Total | 509 | 100.0% |
Housing Finances in Woodstock
Median Income by Occupancy in Woodstock
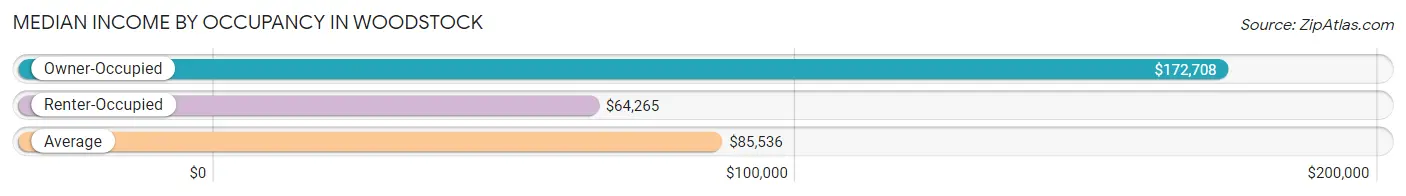
| Occupancy Type | # Households | Median Income |
| Owner-Occupied | 279 (54.8%) | $172,708 |
| Renter-Occupied | 230 (45.2%) | $64,265 |
| Average | 509 (100.0%) | $85,536 |
Occupancy by Householder Income Bracket in Woodstock
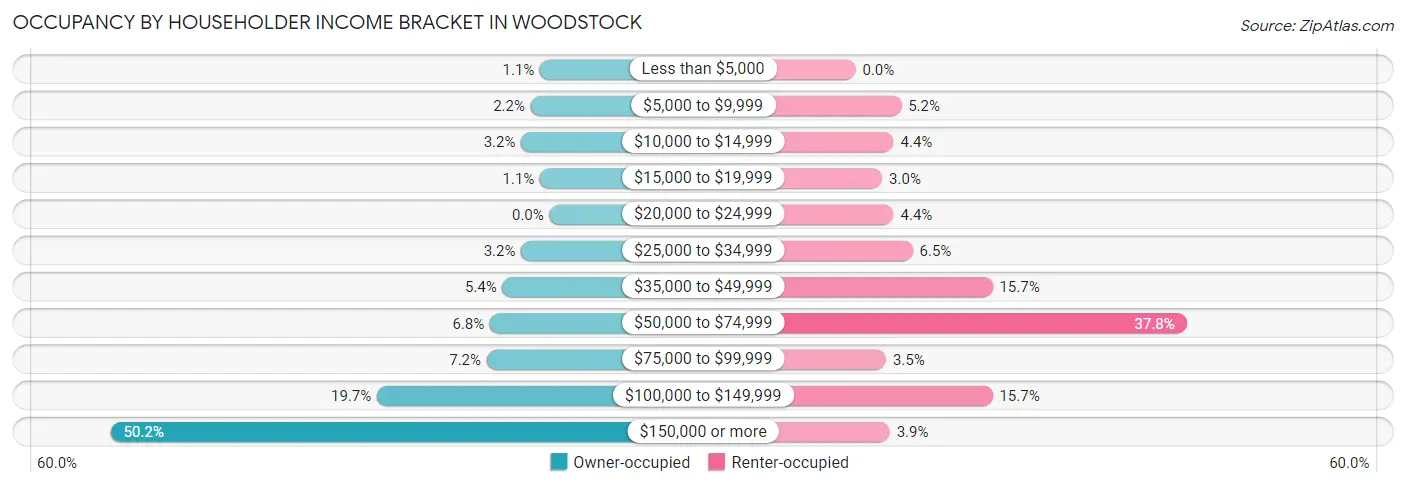
| Income Bracket | Owner-occupied | Renter-occupied |
| Less than $5,000 | 3 (1.1%) | 0 (0.0%) |
| $5,000 to $9,999 | 6 (2.1%) | 12 (5.2%) |
| $10,000 to $14,999 | 9 (3.2%) | 10 (4.3%) |
| $15,000 to $19,999 | 3 (1.1%) | 7 (3.0%) |
| $20,000 to $24,999 | 0 (0.0%) | 10 (4.3%) |
| $25,000 to $34,999 | 9 (3.2%) | 15 (6.5%) |
| $35,000 to $49,999 | 15 (5.4%) | 36 (15.7%) |
| $50,000 to $74,999 | 19 (6.8%) | 87 (37.8%) |
| $75,000 to $99,999 | 20 (7.2%) | 8 (3.5%) |
| $100,000 to $149,999 | 55 (19.7%) | 36 (15.7%) |
| $150,000 or more | 140 (50.2%) | 9 (3.9%) |
| Total | 279 (100.0%) | 230 (100.0%) |
Monthly Housing Cost Tiers in Woodstock
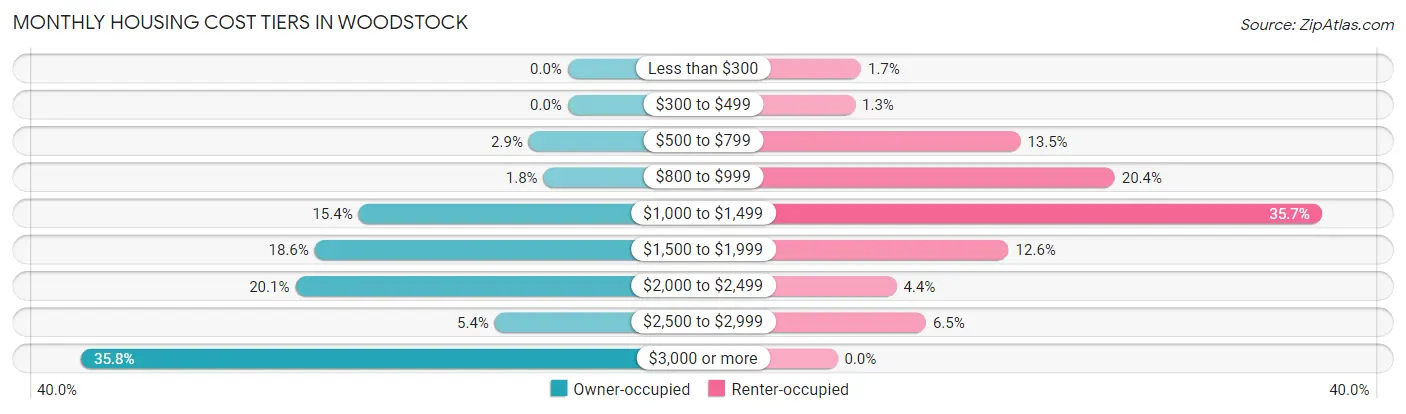
| Monthly Cost | Owner-occupied | Renter-occupied |
| Less than $300 | 0 (0.0%) | 4 (1.7%) |
| $300 to $499 | 0 (0.0%) | 3 (1.3%) |
| $500 to $799 | 8 (2.9%) | 31 (13.5%) |
| $800 to $999 | 5 (1.8%) | 47 (20.4%) |
| $1,000 to $1,499 | 43 (15.4%) | 82 (35.6%) |
| $1,500 to $1,999 | 52 (18.6%) | 29 (12.6%) |
| $2,000 to $2,499 | 56 (20.1%) | 10 (4.3%) |
| $2,500 to $2,999 | 15 (5.4%) | 15 (6.5%) |
| $3,000 or more | 100 (35.8%) | 0 (0.0%) |
| Total | 279 (100.0%) | 230 (100.0%) |
Physical Housing Characteristics in Woodstock
Housing Structures in Woodstock
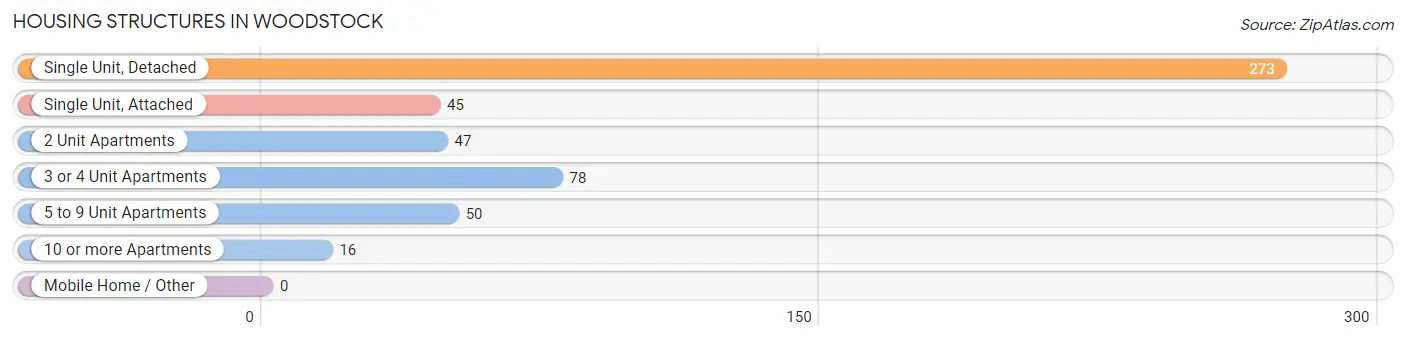
| Structure Type | # Housing Units | % Housing Units |
| Single Unit, Detached | 273 | 53.6% |
| Single Unit, Attached | 45 | 8.8% |
| 2 Unit Apartments | 47 | 9.2% |
| 3 or 4 Unit Apartments | 78 | 15.3% |
| 5 to 9 Unit Apartments | 50 | 9.8% |
| 10 or more Apartments | 16 | 3.1% |
| Mobile Home / Other | 0 | 0.0% |
| Total | 509 | 100.0% |
Housing Structures by Occupancy in Woodstock
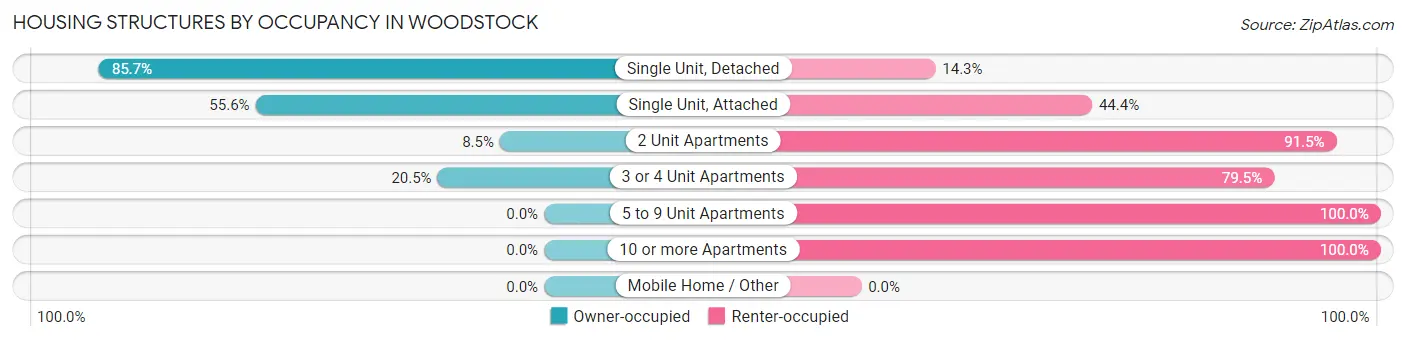
| Structure Type | Owner-occupied | Renter-occupied |
| Single Unit, Detached | 234 (85.7%) | 39 (14.3%) |
| Single Unit, Attached | 25 (55.6%) | 20 (44.4%) |
| 2 Unit Apartments | 4 (8.5%) | 43 (91.5%) |
| 3 or 4 Unit Apartments | 16 (20.5%) | 62 (79.5%) |
| 5 to 9 Unit Apartments | 0 (0.0%) | 50 (100.0%) |
| 10 or more Apartments | 0 (0.0%) | 16 (100.0%) |
| Mobile Home / Other | 0 (0.0%) | 0 (0.0%) |
| Total | 279 (54.8%) | 230 (45.2%) |
Housing Structures by Number of Rooms in Woodstock
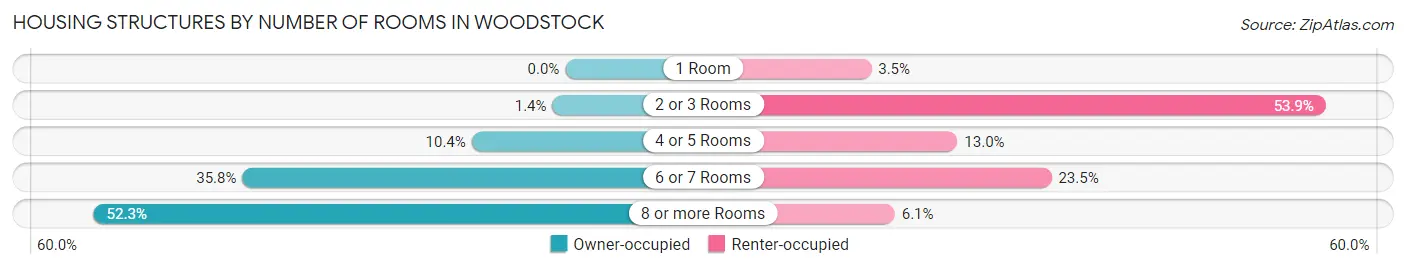
| Number of Rooms | Owner-occupied | Renter-occupied |
| 1 Room | 0 (0.0%) | 8 (3.5%) |
| 2 or 3 Rooms | 4 (1.4%) | 124 (53.9%) |
| 4 or 5 Rooms | 29 (10.4%) | 30 (13.0%) |
| 6 or 7 Rooms | 100 (35.8%) | 54 (23.5%) |
| 8 or more Rooms | 146 (52.3%) | 14 (6.1%) |
| Total | 279 (100.0%) | 230 (100.0%) |
Housing Structure by Heating Type in Woodstock
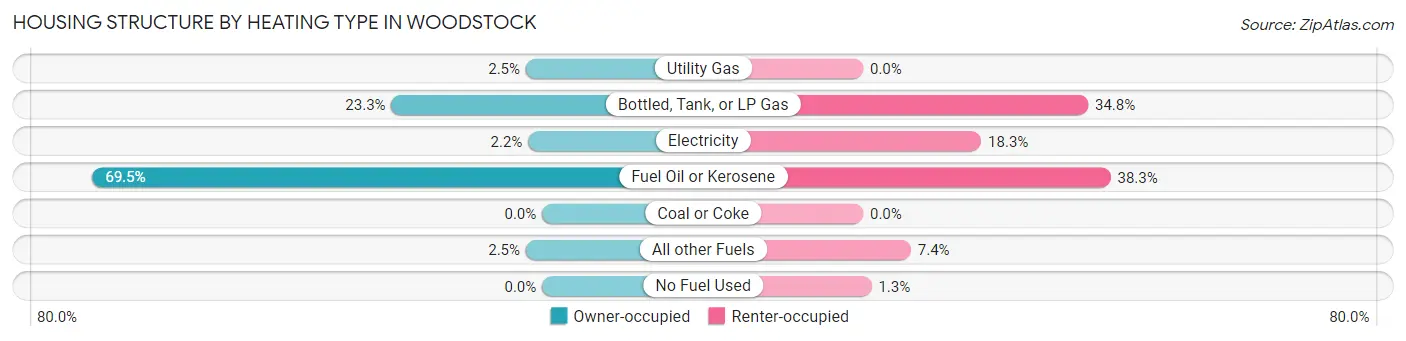
| Heating Type | Owner-occupied | Renter-occupied |
| Utility Gas | 7 (2.5%) | 0 (0.0%) |
| Bottled, Tank, or LP Gas | 65 (23.3%) | 80 (34.8%) |
| Electricity | 6 (2.1%) | 42 (18.3%) |
| Fuel Oil or Kerosene | 194 (69.5%) | 88 (38.3%) |
| Coal or Coke | 0 (0.0%) | 0 (0.0%) |
| All other Fuels | 7 (2.5%) | 17 (7.4%) |
| No Fuel Used | 0 (0.0%) | 3 (1.3%) |
| Total | 279 (100.0%) | 230 (100.0%) |
Household Vehicle Usage in Woodstock
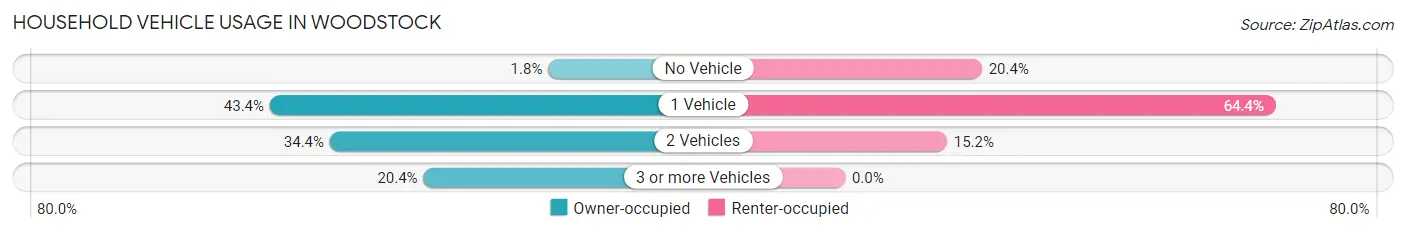
| Vehicles per Household | Owner-occupied | Renter-occupied |
| No Vehicle | 5 (1.8%) | 47 (20.4%) |
| 1 Vehicle | 121 (43.4%) | 148 (64.3%) |
| 2 Vehicles | 96 (34.4%) | 35 (15.2%) |
| 3 or more Vehicles | 57 (20.4%) | 0 (0.0%) |
| Total | 279 (100.0%) | 230 (100.0%) |
Real Estate & Mortgages in Woodstock
Real Estate and Mortgage Overview in Woodstock
| Characteristic | Without Mortgage | With Mortgage |
| Housing Units | 113 | 166 |
| Median Property Value | $600,600 | $614,600 |
| Median Household Income | $182,188 | $76 |
| Monthly Housing Costs | $1,501 | $96 |
| Real Estate Taxes | $10,001 | $0 |
Property Value by Mortgage Status in Woodstock
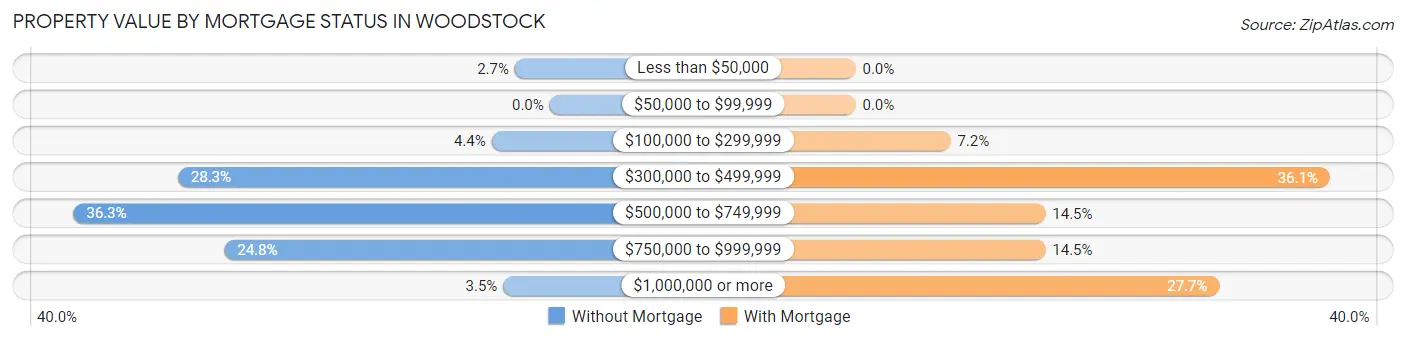
| Property Value | Without Mortgage | With Mortgage |
| Less than $50,000 | 3 (2.6%) | 0 (0.0%) |
| $50,000 to $99,999 | 0 (0.0%) | 0 (0.0%) |
| $100,000 to $299,999 | 5 (4.4%) | 12 (7.2%) |
| $300,000 to $499,999 | 32 (28.3%) | 60 (36.1%) |
| $500,000 to $749,999 | 41 (36.3%) | 24 (14.5%) |
| $750,000 to $999,999 | 28 (24.8%) | 24 (14.5%) |
| $1,000,000 or more | 4 (3.5%) | 46 (27.7%) |
| Total | 113 (100.0%) | 166 (100.0%) |
Household Income by Mortgage Status in Woodstock
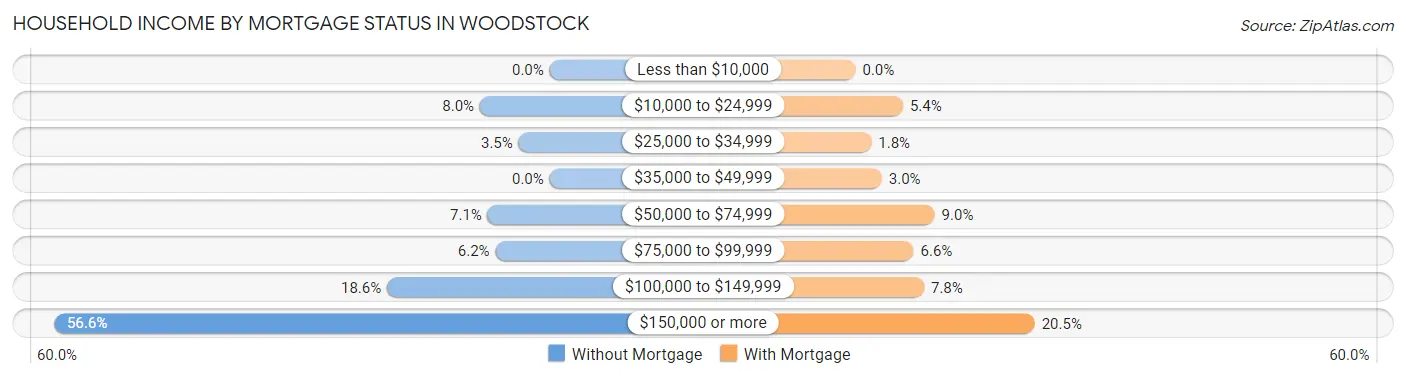
| Household Income | Without Mortgage | With Mortgage |
| Less than $10,000 | 0 (0.0%) | 0 (0.0%) |
| $10,000 to $24,999 | 9 (8.0%) | 9 (5.4%) |
| $25,000 to $34,999 | 4 (3.5%) | 3 (1.8%) |
| $35,000 to $49,999 | 0 (0.0%) | 5 (3.0%) |
| $50,000 to $74,999 | 8 (7.1%) | 15 (9.0%) |
| $75,000 to $99,999 | 7 (6.2%) | 11 (6.6%) |
| $100,000 to $149,999 | 21 (18.6%) | 13 (7.8%) |
| $150,000 or more | 64 (56.6%) | 34 (20.5%) |
| Total | 113 (100.0%) | 166 (100.0%) |
Property Value to Household Income Ratio in Woodstock
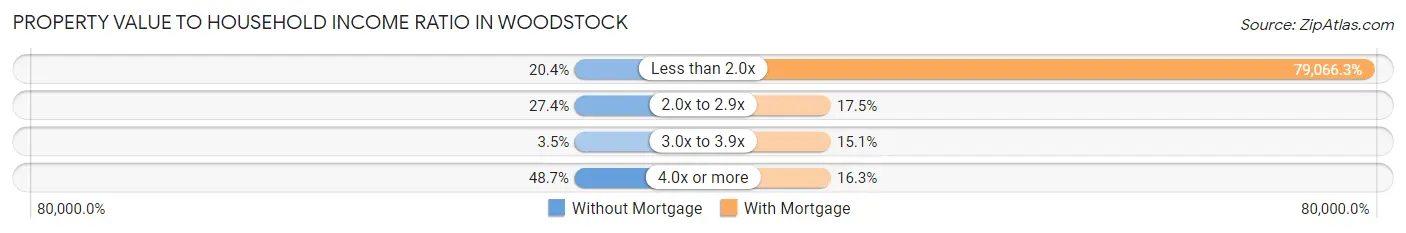
| Value-to-Income Ratio | Without Mortgage | With Mortgage |
| Less than 2.0x | 23 (20.3%) | 131,250 (79,066.3%) |
| 2.0x to 2.9x | 31 (27.4%) | 29 (17.5%) |
| 3.0x to 3.9x | 4 (3.5%) | 25 (15.1%) |
| 4.0x or more | 55 (48.7%) | 27 (16.3%) |
| Total | 113 (100.0%) | 166 (100.0%) |
Real Estate Taxes by Mortgage Status in Woodstock
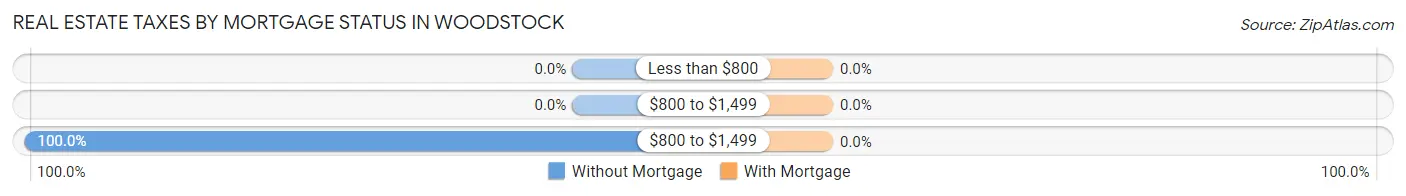
| Property Taxes | Without Mortgage | With Mortgage |
| Less than $800 | 0 (0.0%) | 0 (0.0%) |
| $800 to $1,499 | 0 (0.0%) | 0 (0.0%) |
| $800 to $1,499 | 113 (100.0%) | 0 (0.0%) |
| Total | 113 (100.0%) | 166 (100.0%) |
Health & Disability in Woodstock
Health Insurance Coverage by Age in Woodstock
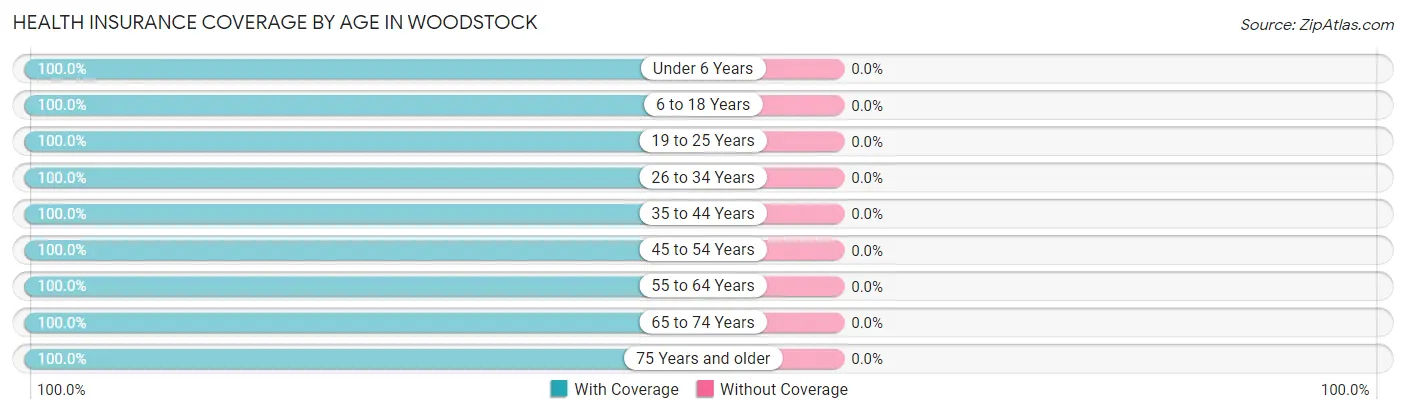
| Age Bracket | With Coverage | Without Coverage |
| Under 6 Years | 52 (100.0%) | 0 (0.0%) |
| 6 to 18 Years | 140 (100.0%) | 0 (0.0%) |
| 19 to 25 Years | 43 (100.0%) | 0 (0.0%) |
| 26 to 34 Years | 50 (100.0%) | 0 (0.0%) |
| 35 to 44 Years | 102 (100.0%) | 0 (0.0%) |
| 45 to 54 Years | 96 (100.0%) | 0 (0.0%) |
| 55 to 64 Years | 145 (100.0%) | 0 (0.0%) |
| 65 to 74 Years | 170 (100.0%) | 0 (0.0%) |
| 75 Years and older | 193 (100.0%) | 0 (0.0%) |
| Total | 991 (100.0%) | 0 (0.0%) |
Health Insurance Coverage by Citizenship Status in Woodstock
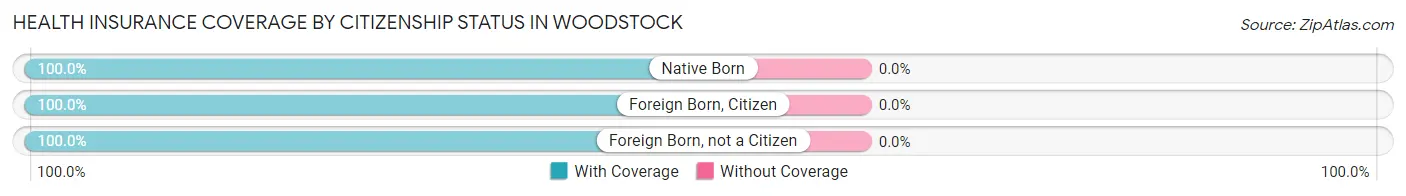
| Citizenship Status | With Coverage | Without Coverage |
| Native Born | 52 (100.0%) | 0 (0.0%) |
| Foreign Born, Citizen | 140 (100.0%) | 0 (0.0%) |
| Foreign Born, not a Citizen | 43 (100.0%) | 0 (0.0%) |
Health Insurance Coverage by Household Income in Woodstock
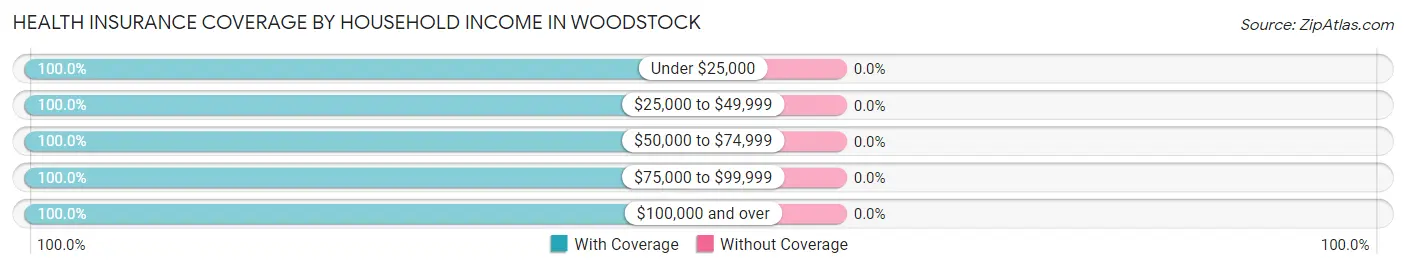
| Household Income | With Coverage | Without Coverage |
| Under $25,000 | 64 (100.0%) | 0 (0.0%) |
| $25,000 to $49,999 | 97 (100.0%) | 0 (0.0%) |
| $50,000 to $74,999 | 133 (100.0%) | 0 (0.0%) |
| $75,000 to $99,999 | 74 (100.0%) | 0 (0.0%) |
| $100,000 and over | 611 (100.0%) | 0 (0.0%) |
Public vs Private Health Insurance Coverage by Age in Woodstock
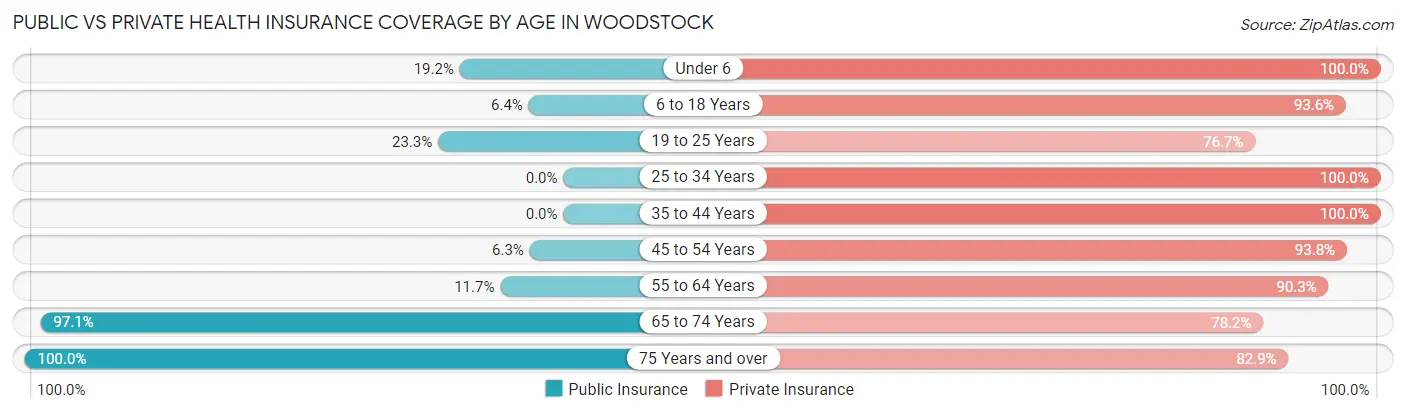
| Age Bracket | Public Insurance | Private Insurance |
| Under 6 | 10 (19.2%) | 52 (100.0%) |
| 6 to 18 Years | 9 (6.4%) | 131 (93.6%) |
| 19 to 25 Years | 10 (23.3%) | 33 (76.7%) |
| 25 to 34 Years | 0 (0.0%) | 50 (100.0%) |
| 35 to 44 Years | 0 (0.0%) | 102 (100.0%) |
| 45 to 54 Years | 6 (6.2%) | 90 (93.8%) |
| 55 to 64 Years | 17 (11.7%) | 131 (90.3%) |
| 65 to 74 Years | 165 (97.1%) | 133 (78.2%) |
| 75 Years and over | 193 (100.0%) | 160 (82.9%) |
| Total | 410 (41.4%) | 882 (89.0%) |
Disability Status by Sex by Age in Woodstock
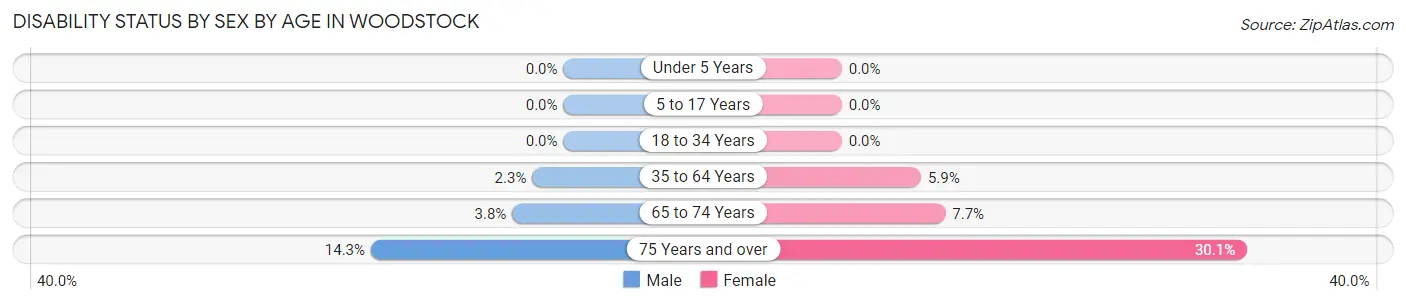
| Age Bracket | Male | Female |
| Under 5 Years | 0 (0.0%) | 0 (0.0%) |
| 5 to 17 Years | 0 (0.0%) | 0 (0.0%) |
| 18 to 34 Years | 0 (0.0%) | 0 (0.0%) |
| 35 to 64 Years | 4 (2.3%) | 10 (5.9%) |
| 65 to 74 Years | 3 (3.8%) | 7 (7.7%) |
| 75 Years and over | 10 (14.3%) | 37 (30.1%) |
Disability Class by Sex by Age in Woodstock
Disability Class: Hearing Difficulty
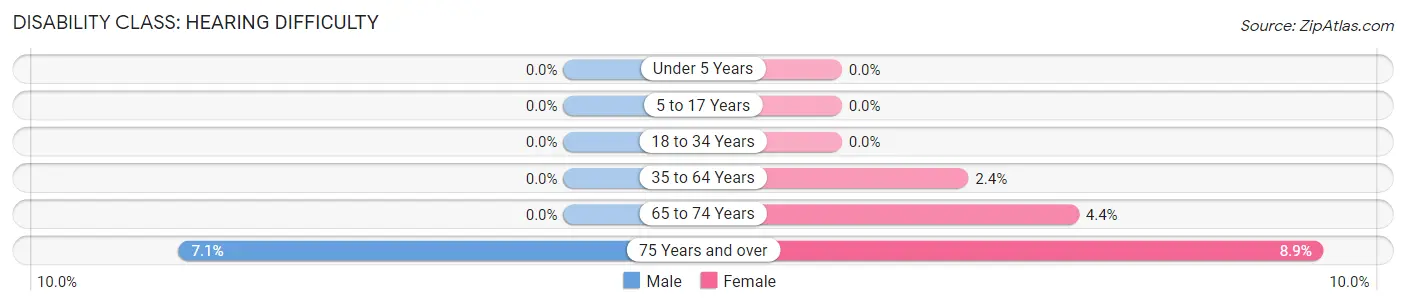
| Age Bracket | Male | Female |
| Under 5 Years | 0 (0.0%) | 0 (0.0%) |
| 5 to 17 Years | 0 (0.0%) | 0 (0.0%) |
| 18 to 34 Years | 0 (0.0%) | 0 (0.0%) |
| 35 to 64 Years | 0 (0.0%) | 4 (2.4%) |
| 65 to 74 Years | 0 (0.0%) | 4 (4.4%) |
| 75 Years and over | 5 (7.1%) | 11 (8.9%) |
Disability Class: Vision Difficulty
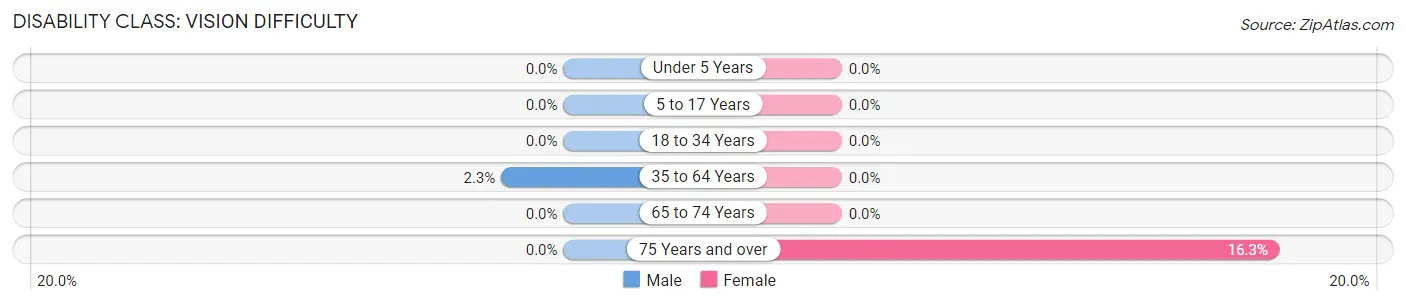
| Age Bracket | Male | Female |
| Under 5 Years | 0 (0.0%) | 0 (0.0%) |
| 5 to 17 Years | 0 (0.0%) | 0 (0.0%) |
| 18 to 34 Years | 0 (0.0%) | 0 (0.0%) |
| 35 to 64 Years | 4 (2.3%) | 0 (0.0%) |
| 65 to 74 Years | 0 (0.0%) | 0 (0.0%) |
| 75 Years and over | 0 (0.0%) | 20 (16.3%) |
Disability Class: Cognitive Difficulty
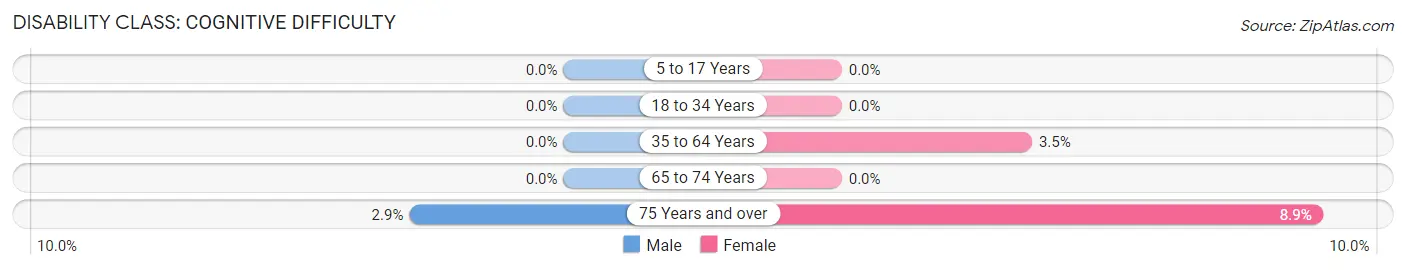
| Age Bracket | Male | Female |
| 5 to 17 Years | 0 (0.0%) | 0 (0.0%) |
| 18 to 34 Years | 0 (0.0%) | 0 (0.0%) |
| 35 to 64 Years | 0 (0.0%) | 6 (3.5%) |
| 65 to 74 Years | 0 (0.0%) | 0 (0.0%) |
| 75 Years and over | 2 (2.9%) | 11 (8.9%) |
Disability Class: Ambulatory Difficulty
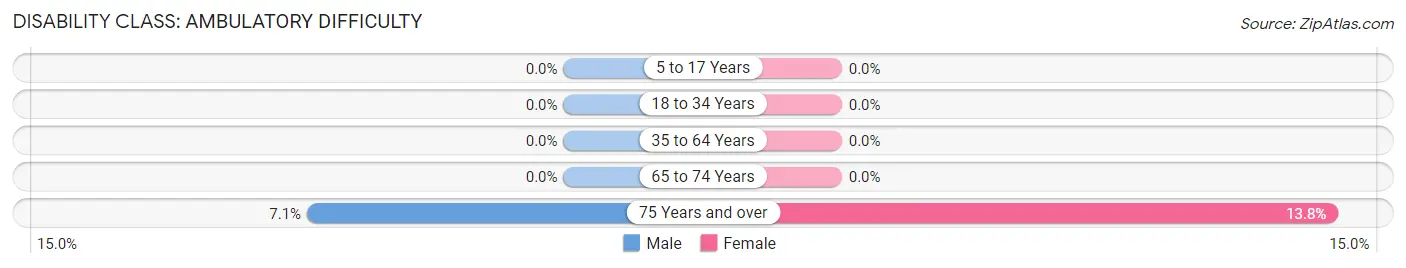
| Age Bracket | Male | Female |
| 5 to 17 Years | 0 (0.0%) | 0 (0.0%) |
| 18 to 34 Years | 0 (0.0%) | 0 (0.0%) |
| 35 to 64 Years | 0 (0.0%) | 0 (0.0%) |
| 65 to 74 Years | 0 (0.0%) | 0 (0.0%) |
| 75 Years and over | 5 (7.1%) | 17 (13.8%) |
Disability Class: Self-Care Difficulty
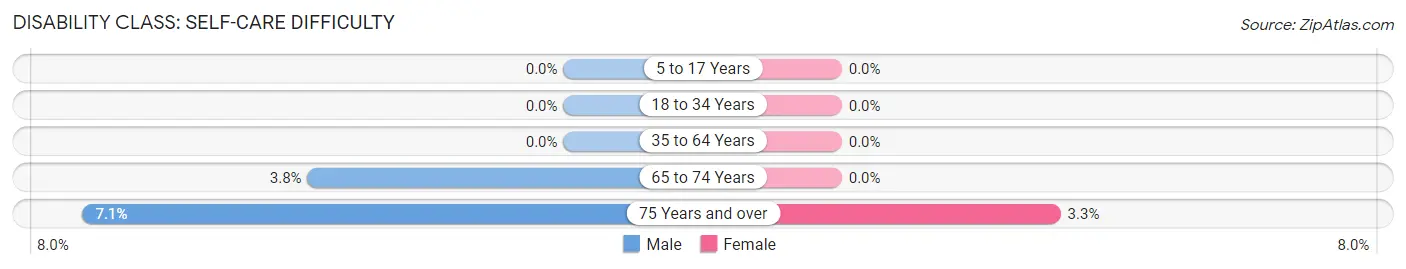
| Age Bracket | Male | Female |
| 5 to 17 Years | 0 (0.0%) | 0 (0.0%) |
| 18 to 34 Years | 0 (0.0%) | 0 (0.0%) |
| 35 to 64 Years | 0 (0.0%) | 0 (0.0%) |
| 65 to 74 Years | 3 (3.8%) | 0 (0.0%) |
| 75 Years and over | 5 (7.1%) | 4 (3.3%) |
Technology Access in Woodstock
Computing Device Access in Woodstock
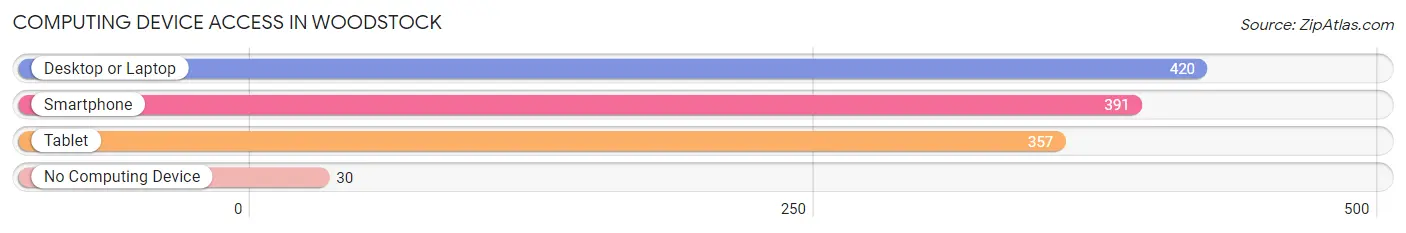
| Device Type | # Households | % Households |
| Desktop or Laptop | 420 | 82.5% |
| Smartphone | 391 | 76.8% |
| Tablet | 357 | 70.1% |
| No Computing Device | 30 | 5.9% |
| Total | 509 | 100.0% |
Internet Access in Woodstock
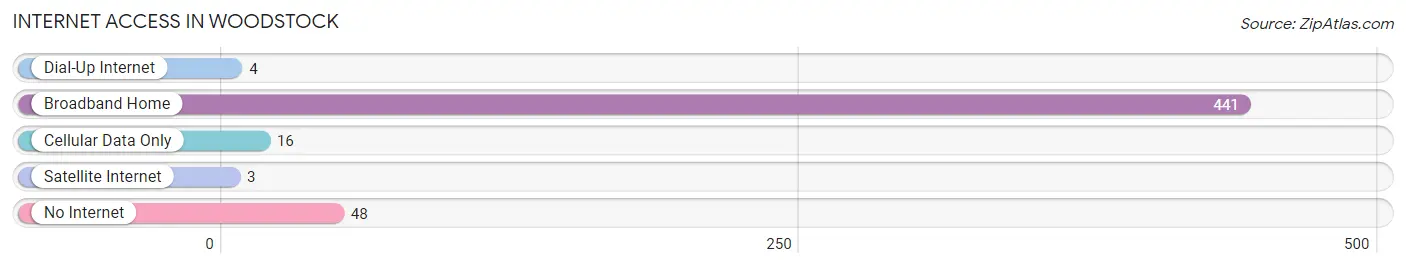
| Internet Type | # Households | % Households |
| Dial-Up Internet | 4 | 0.8% |
| Broadband Home | 441 | 86.6% |
| Cellular Data Only | 16 | 3.1% |
| Satellite Internet | 3 | 0.6% |
| No Internet | 48 | 9.4% |
| Total | 509 | 100.0% |
Woodstock Summary
Stockbridge, Vermont is a small town located in Windsor County, in the state of Vermont. It is situated in the Green Mountains, and is bordered by the towns of Barnard, Bridgewater, Pomfret, and Woodstock. The town was first settled in 1780, and was incorporated in 1781. The town was named after Stockbridge, Massachusetts, which was the hometown of the first settlers.
Geography
Stockbridge is located in the Green Mountains of Vermont, and is bordered by the towns of Barnard, Bridgewater, Pomfret, and Woodstock. The town is situated on the Ottauquechee River, and is surrounded by rolling hills and forests. The town has a total area of 24.2 square miles, of which 24.1 square miles is land and 0.1 square miles is water. The highest point in the town is the summit of Mount Tom, which has an elevation of 2,890 feet.
Climate
Stockbridge has a humid continental climate, with cold, snowy winters and warm, humid summers. The average annual temperature is 41.3°F, and the average annual precipitation is 40.3 inches.
Demographics
As of the 2010 census, there were 1,717 people, 745 households, and 486 families residing in the town. The population density was 71.2 people per square mile. The racial makeup of the town was 97.2% White, 0.5% African American, 0.2% Native American, 0.4% Asian, 0.1% Pacific Islander, 0.2% from other races, and 1.4% from two or more races. Hispanic or Latino of any race were 1.2% of the population.
Economy
Stockbridge is a rural town, and the economy is largely based on agriculture and tourism. The town is home to several small businesses, including a general store, a restaurant, and a bed and breakfast. The town is also home to several farms, which produce a variety of products, including dairy, beef, and maple syrup.
The town is also home to the Woodstock Country Club, which is a private golf course and country club. The club is located on the banks of the Ottauquechee River, and offers a variety of amenities, including a golf course, tennis courts, and a swimming pool.
The town is also home to the Billings Farm and Museum, which is a working dairy farm and museum. The museum offers educational programs and exhibits about the history of farming in Vermont.
Conclusion
Stockbridge, Vermont is a small town located in the Green Mountains of Vermont. The town was first settled in 1780, and was incorporated in 1781. The town has a total area of 24.2 square miles, and has a humid continental climate. As of the 2010 census, there were 1,717 people, 745 households, and 486 families residing in the town. The economy of the town is largely based on agriculture and tourism, and the town is home to several small businesses, farms, and the Woodstock Country Club and Billings Farm and Museum.
Common Questions
What is Per Capita Income in Woodstock?
Per Capita income in Woodstock is $68,636.
What is the Median Family Income in Woodstock?
Median Family Income in Woodstock is $173,958.
What is the Median Household income in Woodstock?
Median Household Income in Woodstock is $85,536.
What is Income or Wage Gap in Woodstock?
Income or Wage Gap in Woodstock is 7.9%.
Women in Woodstock earn 92.1 cents for every dollar earned by a man.
What is Inequality or Gini Index in Woodstock?
Inequality or Gini Index in Woodstock is 0.51.
What is the Total Population of Woodstock?
Total Population of Woodstock is 1,033.
What is the Total Male Population of Woodstock?
Total Male Population of Woodstock is 450.
What is the Total Female Population of Woodstock?
Total Female Population of Woodstock is 583.
What is the Ratio of Males per 100 Females in Woodstock?
There are 77.19 Males per 100 Females in Woodstock.
What is the Ratio of Females per 100 Males in Woodstock?
There are 129.56 Females per 100 Males in Woodstock.
What is the Median Population Age in Woodstock?
Median Population Age in Woodstock is 58.1 Years.
What is the Average Family Size in Woodstock
Average Family Size in Woodstock is 2.9 People.
What is the Average Household Size in Woodstock
Average Household Size in Woodstock is 1.9 People.
How Large is the Labor Force in Woodstock?
There are 504 People in the Labor Forcein in Woodstock.
What is the Percentage of People in the Labor Force in Woodstock?
57.8% of People are in the Labor Force in Woodstock.