Cities with the Highest Percentage of Population Employed in Public Administration in Vermont
RELATED REPORTS & OPTIONS
Public Administration
Vermont
Compare Cities
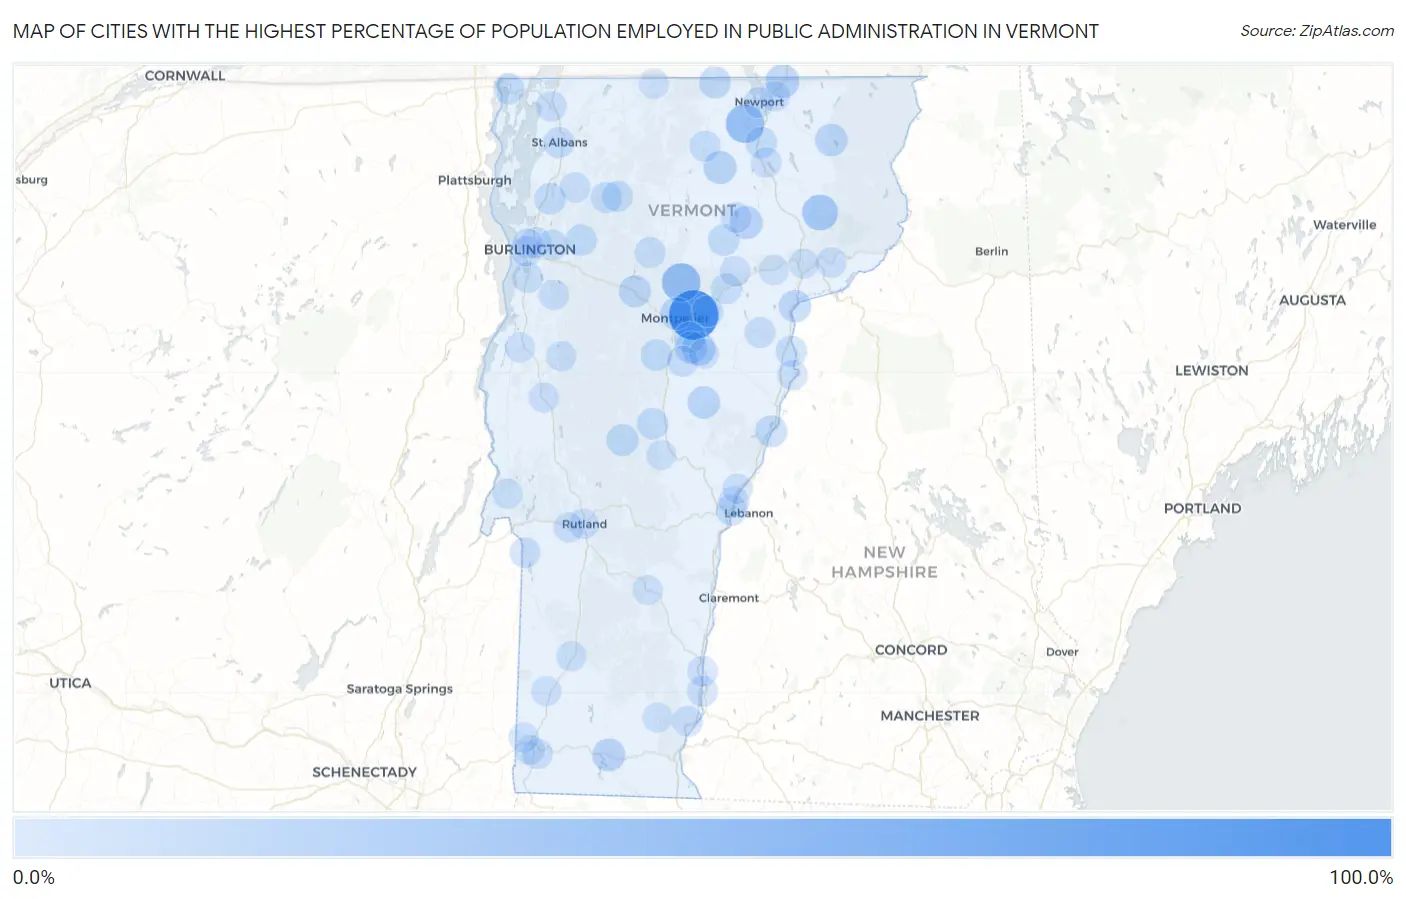
Map of Cities with the Highest Percentage of Population Employed in Public Administration in Vermont
0.0%
100.0%
Cities with the Highest Percentage of Population Employed in Public Administration in Vermont
| City | % Employed | vs State | vs National | |
| 1. | East Montpelier | 100.0% | 4.9%(+95.1)#1 | 4.7%(+95.3)#10 |
| 2. | Worcester | 43.2% | 4.9%(+38.4)#2 | 4.7%(+38.6)#218 |
| 3. | Wardsboro | 42.6% | 4.9%(+37.7)#3 | 4.7%(+37.9)#228 |
| 4. | Coventry | 41.7% | 4.9%(+36.8)#4 | 4.7%(+37.0)#244 |
| 5. | Townshend | 32.3% | 4.9%(+27.4)#5 | 4.7%(+27.6)#411 |
| 6. | East Burke | 28.9% | 4.9%(+24.0)#6 | 4.7%(+24.2)#521 |
| 7. | Stratton Mountain | 20.0% | 4.9%(+15.1)#7 | 4.7%(+15.3)#1,197 |
| 8. | Derby Line | 19.2% | 4.9%(+14.4)#8 | 4.7%(+14.6)#1,304 |
| 9. | Websterville | 18.3% | 4.9%(+13.4)#9 | 4.7%(+13.6)#1,428 |
| 10. | South Hero | 16.5% | 4.9%(+11.6)#10 | 4.7%(+11.8)#1,766 |
| 11. | Albany | 16.3% | 4.9%(+11.4)#11 | 4.7%(+11.6)#1,793 |
| 12. | Wilmington | 15.9% | 4.9%(+11.1)#12 | 4.7%(+11.3)#1,874 |
| 13. | Greensboro Bend | 15.8% | 4.9%(+10.9)#13 | 4.7%(+11.1)#1,901 |
| 14. | Island Pond | 14.2% | 4.9%(+9.36)#14 | 4.7%(+9.56)#2,393 |
| 15. | South Barre | 13.5% | 4.9%(+8.60)#15 | 4.7%(+8.80)#2,665 |
| 16. | Chelsea | 13.4% | 4.9%(+8.49)#16 | 4.7%(+8.68)#2,720 |
| 17. | Montpelier | 12.9% | 4.9%(+8.06)#17 | 4.7%(+8.25)#2,872 |
| 18. | Barnet | 12.9% | 4.9%(+8.02)#18 | 4.7%(+8.22)#2,882 |
| 19. | Waterbury Center | 12.1% | 4.9%(+7.22)#19 | 4.7%(+7.42)#3,225 |
| 20. | Waterbury | 11.7% | 4.9%(+6.85)#20 | 4.7%(+7.05)#3,399 |
| 21. | Gilman | 11.6% | 4.9%(+6.74)#21 | 4.7%(+6.94)#3,455 |
| 22. | Rochester | 10.7% | 4.9%(+5.80)#22 | 4.7%(+5.99)#4,012 |
| 23. | Fairlee | 10.3% | 4.9%(+5.46)#23 | 4.7%(+5.66)#4,238 |
| 24. | North Hyde Park | 10.1% | 4.9%(+5.24)#24 | 4.7%(+5.44)#4,401 |
| 25. | Bolton Valley | 9.8% | 4.9%(+4.89)#25 | 4.7%(+5.09)#4,662 |
| 26. | North Troy | 9.7% | 4.9%(+4.82)#26 | 4.7%(+5.02)#4,715 |
| 27. | Hardwick | 9.6% | 4.9%(+4.67)#27 | 4.7%(+4.87)#4,820 |
| 28. | Northfield | 9.5% | 4.9%(+4.66)#28 | 4.7%(+4.86)#4,830 |
| 29. | Randolph | 9.2% | 4.9%(+4.34)#29 | 4.7%(+4.54)#5,098 |
| 30. | Hartford | 8.9% | 4.9%(+4.01)#30 | 4.7%(+4.21)#5,390 |
| 31. | Milton | 8.8% | 4.9%(+3.93)#31 | 4.7%(+4.13)#5,476 |
| 32. | Whitingham | 8.7% | 4.9%(+3.81)#32 | 4.7%(+4.01)#5,610 |
| 33. | Killington | 8.6% | 4.9%(+3.72)#33 | 4.7%(+3.92)#5,694 |
| 34. | Jericho | 8.4% | 4.9%(+3.56)#34 | 4.7%(+3.76)#5,868 |
| 35. | Orleans | 8.4% | 4.9%(+3.50)#35 | 4.7%(+3.70)#5,934 |
| 36. | Huntington | 8.4% | 4.9%(+3.48)#36 | 4.7%(+3.68)#5,957 |
| 37. | Plainfield | 8.3% | 4.9%(+3.45)#37 | 4.7%(+3.65)#5,991 |
| 38. | Barre | 8.1% | 4.9%(+3.21)#38 | 4.7%(+3.41)#6,251 |
| 39. | Alburgh | 7.8% | 4.9%(+2.92)#39 | 4.7%(+3.11)#6,590 |
| 40. | Sutton | 7.5% | 4.9%(+2.64)#40 | 4.7%(+2.84)#6,961 |
| 41. | Cambridge | 7.4% | 4.9%(+2.52)#41 | 4.7%(+2.72)#7,103 |
| 42. | White River Junction | 7.4% | 4.9%(+2.48)#42 | 4.7%(+2.68)#7,152 |
| 43. | Jeffersonville | 7.0% | 4.9%(+2.09)#43 | 4.7%(+2.29)#7,695 |
| 44. | Wells River | 6.8% | 4.9%(+1.90)#44 | 4.7%(+2.09)#8,019 |
| 45. | St Albans | 6.6% | 4.9%(+1.74)#45 | 4.7%(+1.94)#8,265 |
| 46. | North Pownal | 6.5% | 4.9%(+1.59)#46 | 4.7%(+1.79)#8,496 |
| 47. | Lowell | 6.5% | 4.9%(+1.57)#47 | 4.7%(+1.77)#8,544 |
| 48. | Williamstown | 6.3% | 4.9%(+1.39)#48 | 4.7%(+1.59)#8,868 |
| 49. | Westminster | 5.9% | 4.9%(+1.06)#49 | 4.7%(+1.26)#9,460 |
| 50. | Marshfield | 5.9% | 4.9%(+1.06)#50 | 4.7%(+1.26)#9,466 |
| 51. | Stowe | 5.8% | 4.9%(+0.937)#51 | 4.7%(+1.13)#9,723 |
| 52. | Lincoln | 5.7% | 4.9%(+0.808)#52 | 4.7%(+1.01)#10,000 |
| 53. | South Lincoln | 5.6% | 4.9%(+0.724)#53 | 4.7%(+0.922)#10,206 |
| 54. | Groton | 5.6% | 4.9%(+0.695)#54 | 4.7%(+0.893)#10,280 |
| 55. | Essex Junction | 5.6% | 4.9%(+0.673)#55 | 4.7%(+0.870)#10,323 |
| 56. | Newport | 5.4% | 4.9%(+0.495)#56 | 4.7%(+0.692)#10,752 |
| 57. | Huntington Center | 5.4% | 4.9%(+0.493)#57 | 4.7%(+0.691)#10,762 |
| 58. | Shelburne | 5.2% | 4.9%(+0.310)#58 | 4.7%(+0.508)#11,215 |
| 59. | Poultney | 5.2% | 4.9%(+0.267)#59 | 4.7%(+0.465)#11,309 |
| 60. | Swanton | 5.1% | 4.9%(+0.174)#60 | 4.7%(+0.372)#11,538 |
| 61. | Winooski | 4.9% | 4.9%(-0.001)#61 | 4.7%(+0.197)#11,960 |
| 62. | Greensboro | 4.8% | 4.9%(-0.121)#62 | 4.7%(+0.077)#12,279 |
| 63. | Putney | 4.7% | 4.9%(-0.159)#63 | 4.7%(+0.039)#12,362 |
| 64. | Barton | 4.6% | 4.9%(-0.280)#64 | 4.7%(-0.083)#12,714 |
| 65. | South Burlington | 4.6% | 4.9%(-0.293)#65 | 4.7%(-0.095)#12,751 |
| 66. | Newbury | 4.3% | 4.9%(-0.559)#66 | 4.7%(-0.361)#13,477 |
| 67. | Westford | 4.3% | 4.9%(-0.582)#67 | 4.7%(-0.384)#13,536 |
| 68. | Rutland | 4.3% | 4.9%(-0.620)#68 | 4.7%(-0.422)#13,656 |
| 69. | Burlington | 4.2% | 4.9%(-0.637)#69 | 4.7%(-0.440)#13,712 |
| 70. | Hinesburg | 4.2% | 4.9%(-0.641)#70 | 4.7%(-0.443)#13,718 |
| 71. | Bennington | 4.2% | 4.9%(-0.677)#71 | 4.7%(-0.479)#13,821 |
| 72. | Pawlet | 4.2% | 4.9%(-0.681)#72 | 4.7%(-0.484)#13,833 |
| 73. | Wilder | 4.1% | 4.9%(-0.750)#73 | 4.7%(-0.552)#14,069 |
| 74. | Derby Center | 4.0% | 4.9%(-0.903)#74 | 4.7%(-0.705)#14,565 |
| 75. | West Rutland | 4.0% | 4.9%(-0.931)#75 | 4.7%(-0.733)#14,652 |
| 76. | Bellows Falls | 4.0% | 4.9%(-0.931)#76 | 4.7%(-0.733)#14,655 |
| 77. | Fairfax | 3.9% | 4.9%(-0.971)#77 | 4.7%(-0.773)#14,767 |
| 78. | New Haven | 3.8% | 4.9%(-1.07)#78 | 4.7%(-0.868)#15,092 |
| 79. | Stamford | 3.8% | 4.9%(-1.07)#79 | 4.7%(-0.872)#15,101 |
| 80. | Cabot | 3.7% | 4.9%(-1.21)#80 | 4.7%(-1.02)#15,579 |
| 81. | Concord | 3.6% | 4.9%(-1.28)#81 | 4.7%(-1.08)#15,780 |
| 82. | Benson | 3.4% | 4.9%(-1.47)#82 | 4.7%(-1.28)#16,442 |
| 83. | Manchester Center | 3.3% | 4.9%(-1.61)#83 | 4.7%(-1.42)#16,918 |
| 84. | Peacham | 3.2% | 4.9%(-1.71)#84 | 4.7%(-1.51)#17,257 |
| 85. | Middlebury | 3.1% | 4.9%(-1.81)#85 | 4.7%(-1.61)#17,569 |
| 86. | Bristol | 3.1% | 4.9%(-1.83)#86 | 4.7%(-1.63)#17,639 |
| 87. | Vergennes | 2.9% | 4.9%(-1.95)#87 | 4.7%(-1.75)#18,015 |
| 88. | East Barre | 2.8% | 4.9%(-2.10)#88 | 4.7%(-1.90)#18,546 |
| 89. | Bethel | 2.8% | 4.9%(-2.13)#89 | 4.7%(-1.93)#18,650 |
| 90. | Danville | 2.7% | 4.9%(-2.15)#90 | 4.7%(-1.95)#18,712 |
| 91. | Richford | 2.7% | 4.9%(-2.22)#91 | 4.7%(-2.02)#18,975 |
| 92. | Newfane | 2.6% | 4.9%(-2.25)#92 | 4.7%(-2.05)#19,080 |
| 93. | Underhill Flats | 2.5% | 4.9%(-2.40)#93 | 4.7%(-2.20)#19,570 |
| 94. | Castleton Four Corners | 2.5% | 4.9%(-2.43)#94 | 4.7%(-2.23)#19,667 |
| 95. | Old Bennington | 2.4% | 4.9%(-2.47)#95 | 4.7%(-2.28)#19,810 |
| 96. | Norwich | 2.4% | 4.9%(-2.52)#96 | 4.7%(-2.32)#19,971 |
| 97. | Ludlow | 2.3% | 4.9%(-2.53)#97 | 4.7%(-2.34)#20,018 |
| 98. | St Johnsbury | 2.2% | 4.9%(-2.64)#98 | 4.7%(-2.45)#20,386 |
| 99. | Arlington | 2.2% | 4.9%(-2.65)#99 | 4.7%(-2.45)#20,387 |
| 100. | North Bennington | 2.2% | 4.9%(-2.65)#100 | 4.7%(-2.46)#20,405 |
1
2Common Questions
What are the Top 10 Cities with the Highest Percentage of Population Employed in Public Administration in Vermont?
Top 10 Cities with the Highest Percentage of Population Employed in Public Administration in Vermont are:
#1
100.0%
#2
43.2%
#3
41.7%
#4
28.9%
#5
19.2%
#6
18.3%
#7
16.3%
#8
15.9%
#9
15.8%
#10
14.2%
What city has the Highest Percentage of Population Employed in Public Administration in Vermont?
East Montpelier has the Highest Percentage of Population Employed in Public Administration in Vermont with 100.0%.
What is the Percentage of Population Employed in Public Administration in the State of Vermont?
Percentage of Population Employed in Public Administration in Vermont is 4.9%.
What is the Percentage of Population Employed in Public Administration in the United States?
Percentage of Population Employed in Public Administration in the United States is 4.7%.