Putney, VT Map & Demographics
Putney Map
Putney Overview
$59,361
PER CAPITA INCOME
$55,833
AVG HOUSEHOLD INCOME
0.56
INEQUALITY / GINI INDEX
360
TOTAL POPULATION
165
MALE POPULATION
195
FEMALE POPULATION
84.62
MALES / 100 FEMALES
118.18
FEMALES / 100 MALES
54.2
MEDIAN AGE
2.7
AVG FAMILY SIZE
1.8
AVG HOUSEHOLD SIZE
130
LABOR FORCE [ PEOPLE ]
43.8%
PERCENT IN LABOR FORCE
2.3%
UNEMPLOYMENT RATE
Putney Zip Codes
Putney Area Codes
Income in Putney
Income Overview in Putney
| Characteristic | Number | Measure |
| Per Capita Income | 360 | $59,361 |
| Median Family Income | 62 | $0 |
| Mean Family Income | 62 | $165,226 |
| Median Household Income | 196 | $55,833 |
| Mean Household Income | 196 | $107,840 |
| Income Deficit | 62 | $0 |
| Wage / Income Gap (%) | 360 | 0.00% |
| Wage / Income Gap ($) | 360 | 100.00¢ per $1 |
| Gini / Inequality Index | 360 | 0.56 |
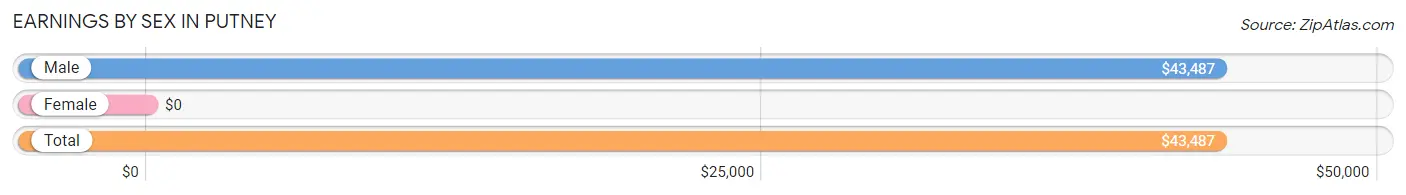
Earnings by Sex in Putney
| Sex | Number | Average Earnings |
| Male | 69 (48.9%) | $43,487 |
| Female | 72 (51.1%) | $0 |
| Total | 141 (100.0%) | $43,487 |
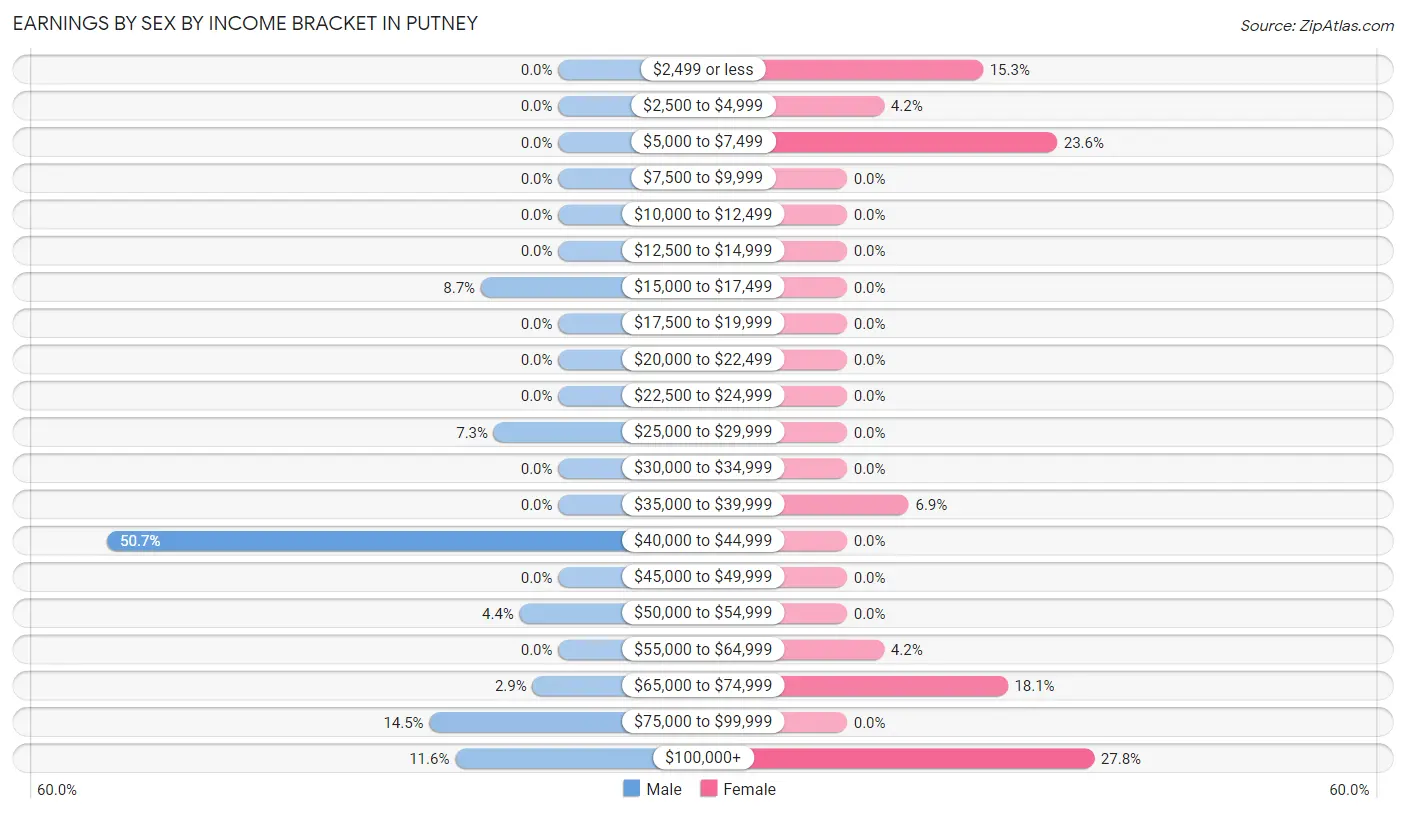
Earnings by Sex by Income Bracket in Putney
The most common earnings brackets in Putney are $40,000 to $44,999 for men (35 | 50.7%) and $100,000+ for women (20 | 27.8%).
| Income | Male | Female |
| $2,499 or less | 0 (0.0%) | 11 (15.3%) |
| $2,500 to $4,999 | 0 (0.0%) | 3 (4.2%) |
| $5,000 to $7,499 | 0 (0.0%) | 17 (23.6%) |
| $7,500 to $9,999 | 0 (0.0%) | 0 (0.0%) |
| $10,000 to $12,499 | 0 (0.0%) | 0 (0.0%) |
| $12,500 to $14,999 | 0 (0.0%) | 0 (0.0%) |
| $15,000 to $17,499 | 6 (8.7%) | 0 (0.0%) |
| $17,500 to $19,999 | 0 (0.0%) | 0 (0.0%) |
| $20,000 to $22,499 | 0 (0.0%) | 0 (0.0%) |
| $22,500 to $24,999 | 0 (0.0%) | 0 (0.0%) |
| $25,000 to $29,999 | 5 (7.2%) | 0 (0.0%) |
| $30,000 to $34,999 | 0 (0.0%) | 0 (0.0%) |
| $35,000 to $39,999 | 0 (0.0%) | 5 (6.9%) |
| $40,000 to $44,999 | 35 (50.7%) | 0 (0.0%) |
| $45,000 to $49,999 | 0 (0.0%) | 0 (0.0%) |
| $50,000 to $54,999 | 3 (4.3%) | 0 (0.0%) |
| $55,000 to $64,999 | 0 (0.0%) | 3 (4.2%) |
| $65,000 to $74,999 | 2 (2.9%) | 13 (18.1%) |
| $75,000 to $99,999 | 10 (14.5%) | 0 (0.0%) |
| $100,000+ | 8 (11.6%) | 20 (27.8%) |
| Total | 69 (100.0%) | 72 (100.0%) |
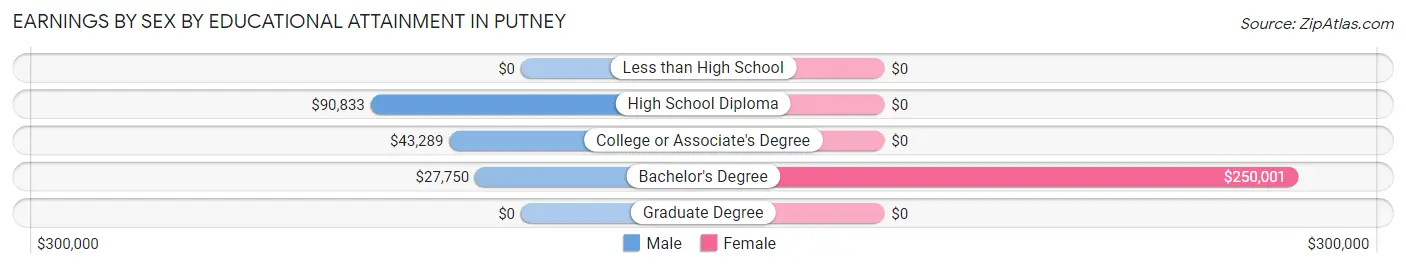
Earnings by Sex by Educational Attainment in Putney
| Educational Attainment | Male Income | Female Income |
| Less than High School | - | - |
| High School Diploma | $90,833 | $0 |
| College or Associate's Degree | $43,289 | $0 |
| Bachelor's Degree | $27,750 | $250,001 |
| Graduate Degree | - | - |
| Total | $43,487 | $0 |
Family Income in Putney
Family Income Brackets in Putney
According to the Putney family income data, there are 20 families falling into the $200,000+ income range, which is the most common income bracket and makes up 32.3% of all families.
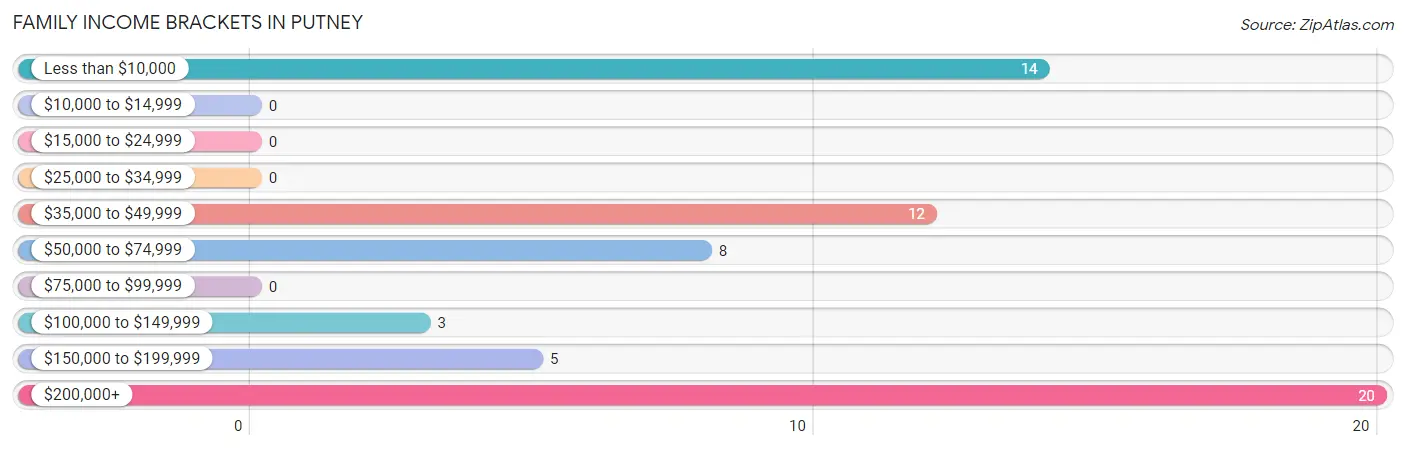
| Income Bracket | # Families | % Families |
| Less than $10,000 | 14 | 22.6% |
| $10,000 to $14,999 | 0 | 0.0% |
| $15,000 to $24,999 | 0 | 0.0% |
| $25,000 to $34,999 | 0 | 0.0% |
| $35,000 to $49,999 | 12 | 19.4% |
| $50,000 to $74,999 | 8 | 12.9% |
| $75,000 to $99,999 | 0 | 0.0% |
| $100,000 to $149,999 | 3 | 4.8% |
| $150,000 to $199,999 | 5 | 8.1% |
| $200,000+ | 20 | 32.3% |
Family Income by Famaliy Size in Putney
3-person families (33 | 53.2%) account for the highest median family income in Putney with $250,001 per family, while 3-person families (33 | 53.2%) have the highest median income of $83,334 per family member.
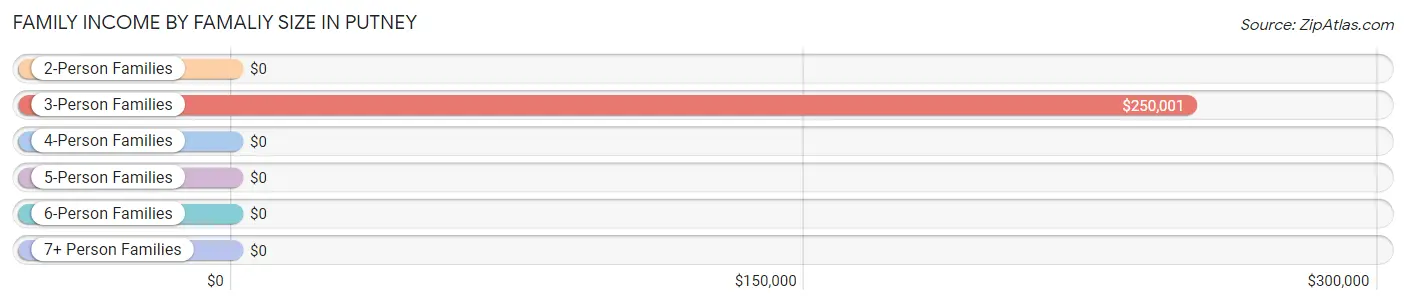
| Income Bracket | # Families | Median Income |
| 2-Person Families | 29 (46.8%) | $0 |
| 3-Person Families | 33 (53.2%) | $250,001 |
| 4-Person Families | 0 (0.0%) | $0 |
| 5-Person Families | 0 (0.0%) | $0 |
| 6-Person Families | 0 (0.0%) | $0 |
| 7+ Person Families | 0 (0.0%) | $0 |
| Total | 62 (100.0%) | $0 |
Family Income by Number of Earners in Putney
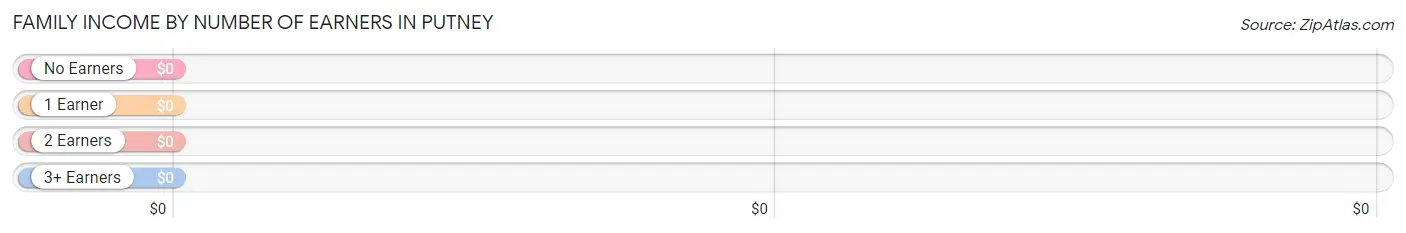
| Number of Earners | # Families | Median Income |
| No Earners | 11 (17.7%) | $0 |
| 1 Earner | 46 (74.2%) | $0 |
| 2 Earners | 5 (8.1%) | $0 |
| 3+ Earners | 0 (0.0%) | $0 |
| Total | 62 (100.0%) | $0 |
Household Income in Putney
Household Income Brackets in Putney
With 38 households falling in the category, the $35,000 to $49,999 income range is the most frequent in Putney, accounting for 19.4% of all households. In contrast, only 2 households (1.0%) fall into the $25,000 to $34,999 income bracket, making it the least populous group.
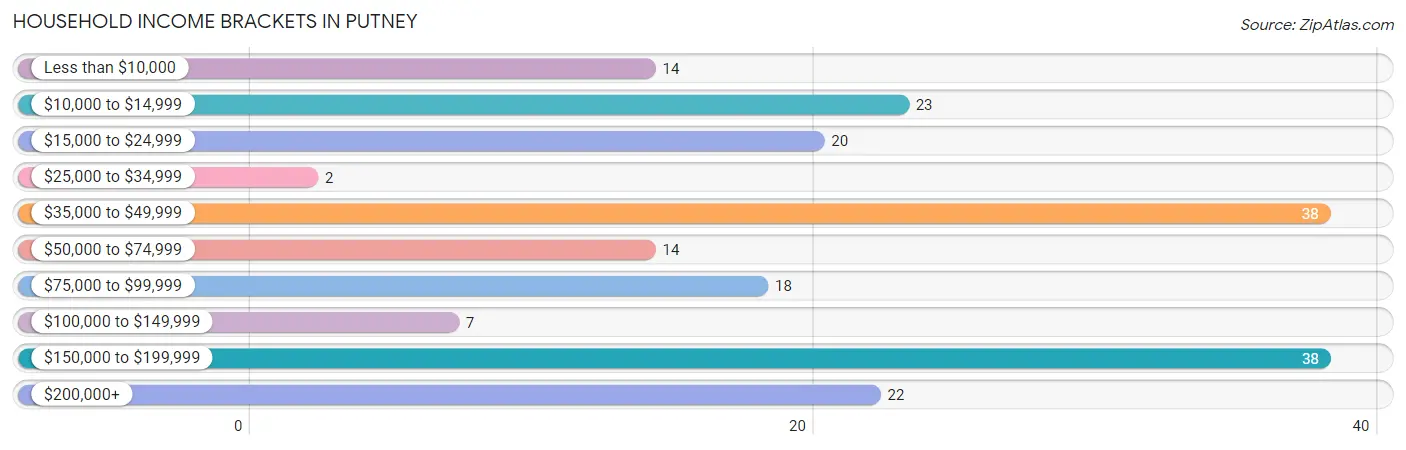
| Income Bracket | # Households | % Households |
| Less than $10,000 | 14 | 7.1% |
| $10,000 to $14,999 | 23 | 11.7% |
| $15,000 to $24,999 | 20 | 10.2% |
| $25,000 to $34,999 | 2 | 1.0% |
| $35,000 to $49,999 | 38 | 19.4% |
| $50,000 to $74,999 | 14 | 7.1% |
| $75,000 to $99,999 | 18 | 9.2% |
| $100,000 to $149,999 | 7 | 3.6% |
| $150,000 to $199,999 | 38 | 19.4% |
| $200,000+ | 22 | 11.2% |
Household Income by Householder Age in Putney
The median household income in Putney is $55,833, with the highest median household income of $87,788 found in the 45 to 64 years age bracket for the primary householder. A total of 45 households (23.0%) fall into this category.
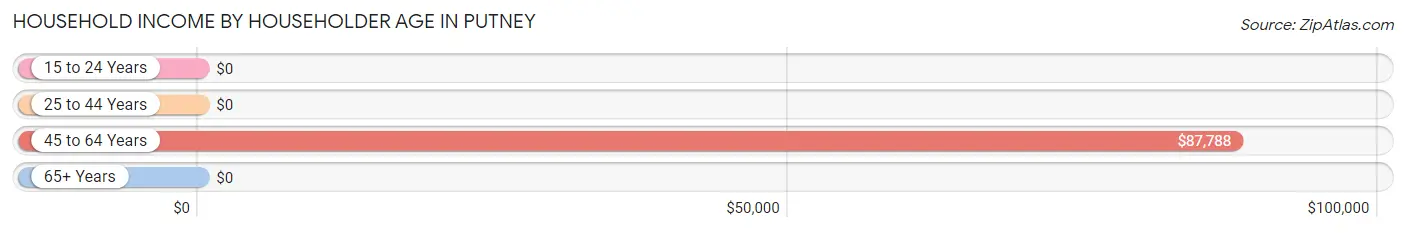
| Income Bracket | # Households | Median Income |
| 15 to 24 Years | 0 (0.0%) | $0 |
| 25 to 44 Years | 51 (26.0%) | $0 |
| 45 to 64 Years | 45 (23.0%) | $87,788 |
| 65+ Years | 100 (51.0%) | $0 |
| Total | 196 (100.0%) | $55,833 |
Poverty in Putney
Income Below Poverty by Sex and Age in Putney
With 10.3% poverty level for males and 26.5% for females among the residents of Putney, 16 and 17 year old males and 65 to 74 year old females are the most vulnerable to poverty, with 8 males (100.0%) and 16 females (40.0%) in their respective age groups living below the poverty level.
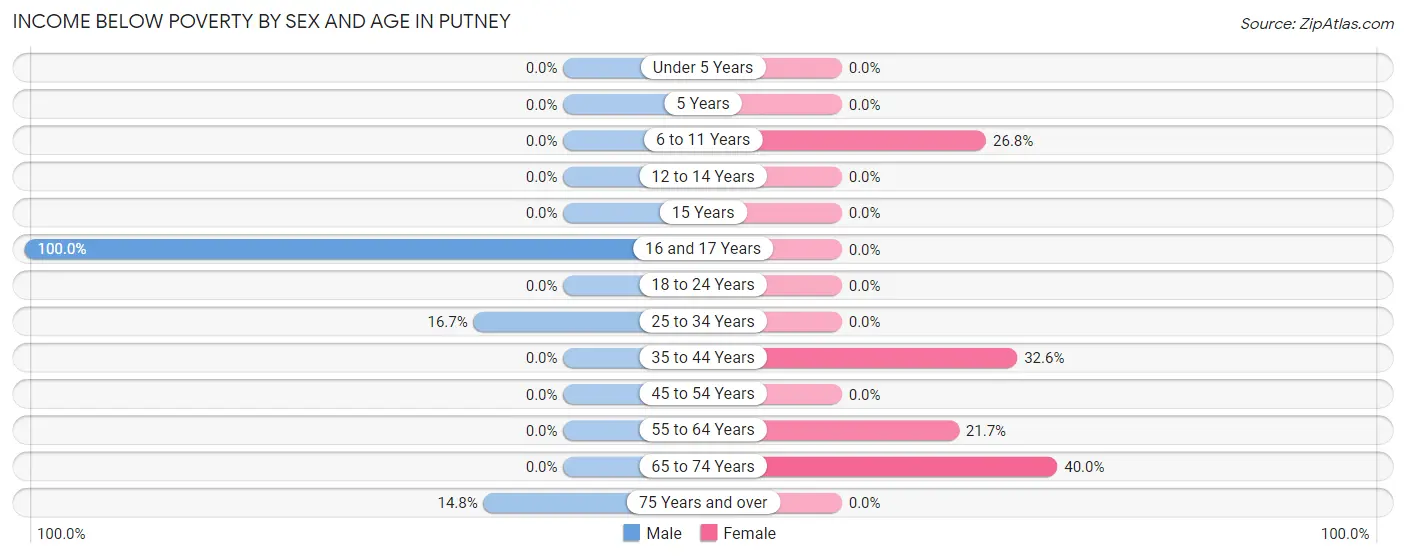
| Age Bracket | Male | Female |
| Under 5 Years | 0 (0.0%) | 0 (0.0%) |
| 5 Years | 0 (0.0%) | 0 (0.0%) |
| 6 to 11 Years | 0 (0.0%) | 15 (26.8%) |
| 12 to 14 Years | 0 (0.0%) | 0 (0.0%) |
| 15 Years | 0 (0.0%) | 0 (0.0%) |
| 16 and 17 Years | 8 (100.0%) | 0 (0.0%) |
| 18 to 24 Years | 0 (0.0%) | 0 (0.0%) |
| 25 to 34 Years | 1 (16.7%) | 0 (0.0%) |
| 35 to 44 Years | 0 (0.0%) | 14 (32.6%) |
| 45 to 54 Years | 0 (0.0%) | 0 (0.0%) |
| 55 to 64 Years | 0 (0.0%) | 5 (21.7%) |
| 65 to 74 Years | 0 (0.0%) | 16 (40.0%) |
| 75 Years and over | 8 (14.8%) | 0 (0.0%) |
| Total | 17 (10.3%) | 50 (26.5%) |
Income Above Poverty by Sex and Age in Putney
According to the poverty statistics in Putney, males aged 35 to 44 years and females aged 12 to 14 years are the age groups that are most secure financially, with 100.0% of males and 100.0% of females in these age groups living above the poverty line.
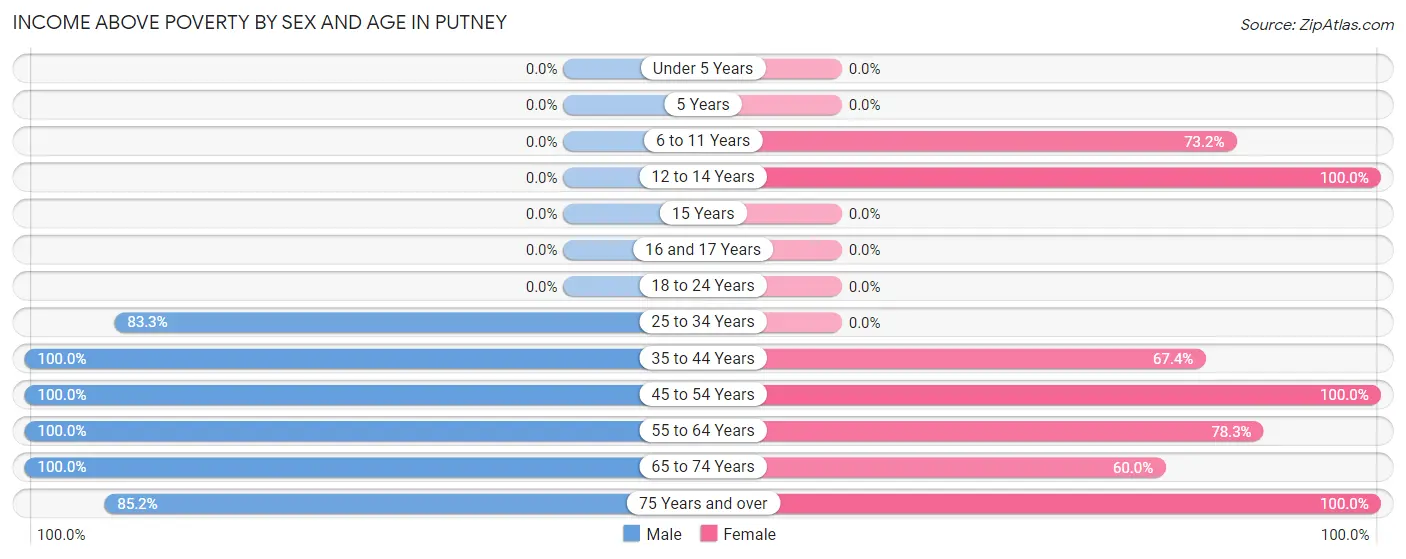
| Age Bracket | Male | Female |
| Under 5 Years | 0 (0.0%) | 0 (0.0%) |
| 5 Years | 0 (0.0%) | 0 (0.0%) |
| 6 to 11 Years | 0 (0.0%) | 41 (73.2%) |
| 12 to 14 Years | 0 (0.0%) | 1 (100.0%) |
| 15 Years | 0 (0.0%) | 0 (0.0%) |
| 16 and 17 Years | 0 (0.0%) | 0 (0.0%) |
| 18 to 24 Years | 0 (0.0%) | 0 (0.0%) |
| 25 to 34 Years | 5 (83.3%) | 0 (0.0%) |
| 35 to 44 Years | 31 (100.0%) | 29 (67.4%) |
| 45 to 54 Years | 21 (100.0%) | 21 (100.0%) |
| 55 to 64 Years | 21 (100.0%) | 18 (78.3%) |
| 65 to 74 Years | 24 (100.0%) | 24 (60.0%) |
| 75 Years and over | 46 (85.2%) | 5 (100.0%) |
| Total | 148 (89.7%) | 139 (73.5%) |
Income Below Poverty Among Married-Couple Families in Putney
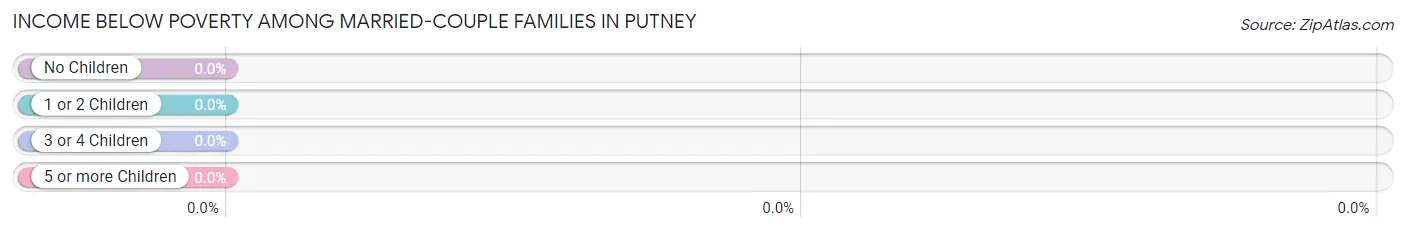
| Children | Above Poverty | Below Poverty |
| No Children | 25 (100.0%) | 0 (0.0%) |
| 1 or 2 Children | 3 (100.0%) | 0 (0.0%) |
| 3 or 4 Children | 0 (0.0%) | 0 (0.0%) |
| 5 or more Children | 0 (0.0%) | 0 (0.0%) |
| Total | 28 (100.0%) | 0 (0.0%) |
Income Below Poverty Among Single-Parent Households in Putney
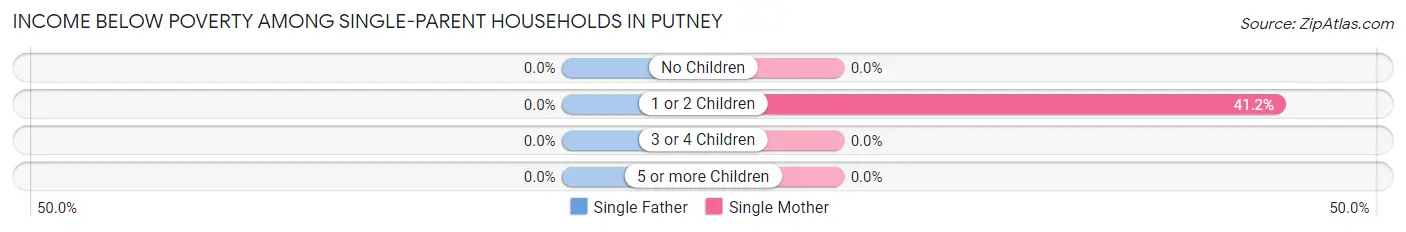
| Children | Single Father | Single Mother |
| No Children | 0 (0.0%) | 0 (0.0%) |
| 1 or 2 Children | 0 (0.0%) | 14 (41.2%) |
| 3 or 4 Children | 0 (0.0%) | 0 (0.0%) |
| 5 or more Children | 0 (0.0%) | 0 (0.0%) |
| Total | 0 (0.0%) | 14 (41.2%) |
Income Below Poverty Among Married-Couple vs Single-Parent Households in Putney
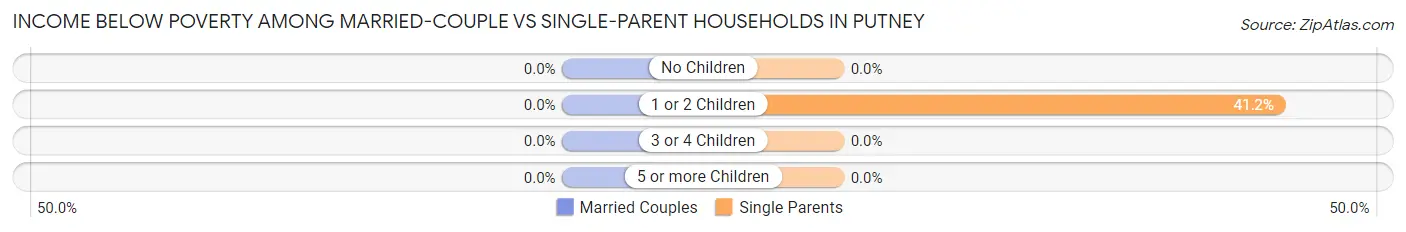
| Children | Married-Couple Families | Single-Parent Households |
| No Children | 0 (0.0%) | 0 (0.0%) |
| 1 or 2 Children | 0 (0.0%) | 14 (41.2%) |
| 3 or 4 Children | 0 (0.0%) | 0 (0.0%) |
| 5 or more Children | 0 (0.0%) | 0 (0.0%) |
| Total | 0 (0.0%) | 14 (41.2%) |
Race in Putney
The most populous races in Putney are White / Caucasian (346 | 96.1%), Two or more Races (13 | 3.6%), and Native / Alaskan (1 | 0.3%).
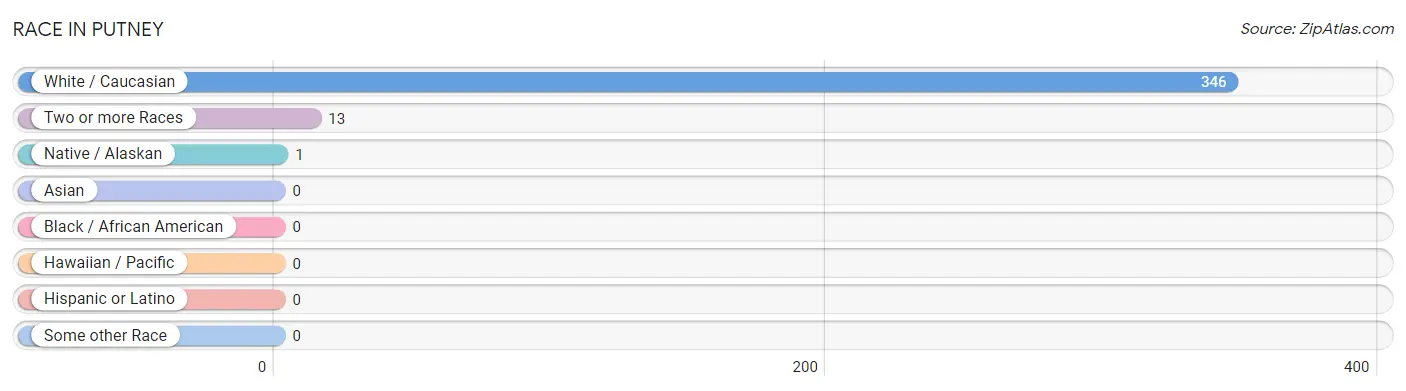
| Race | # Population | % Population |
| Asian | 0 | 0.0% |
| Black / African American | 0 | 0.0% |
| Hawaiian / Pacific | 0 | 0.0% |
| Hispanic or Latino | 0 | 0.0% |
| Native / Alaskan | 1 | 0.3% |
| White / Caucasian | 346 | 96.1% |
| Two or more Races | 13 | 3.6% |
| Some other Race | 0 | 0.0% |
| Total | 360 | 100.0% |
Ancestry in Putney
The most populous ancestries reported in Putney are English (131 | 36.4%), Irish (106 | 29.4%), Scottish (35 | 9.7%), Belgian (28 | 7.8%), and German (27 | 7.5%), together accounting for 90.8% of all Putney residents.
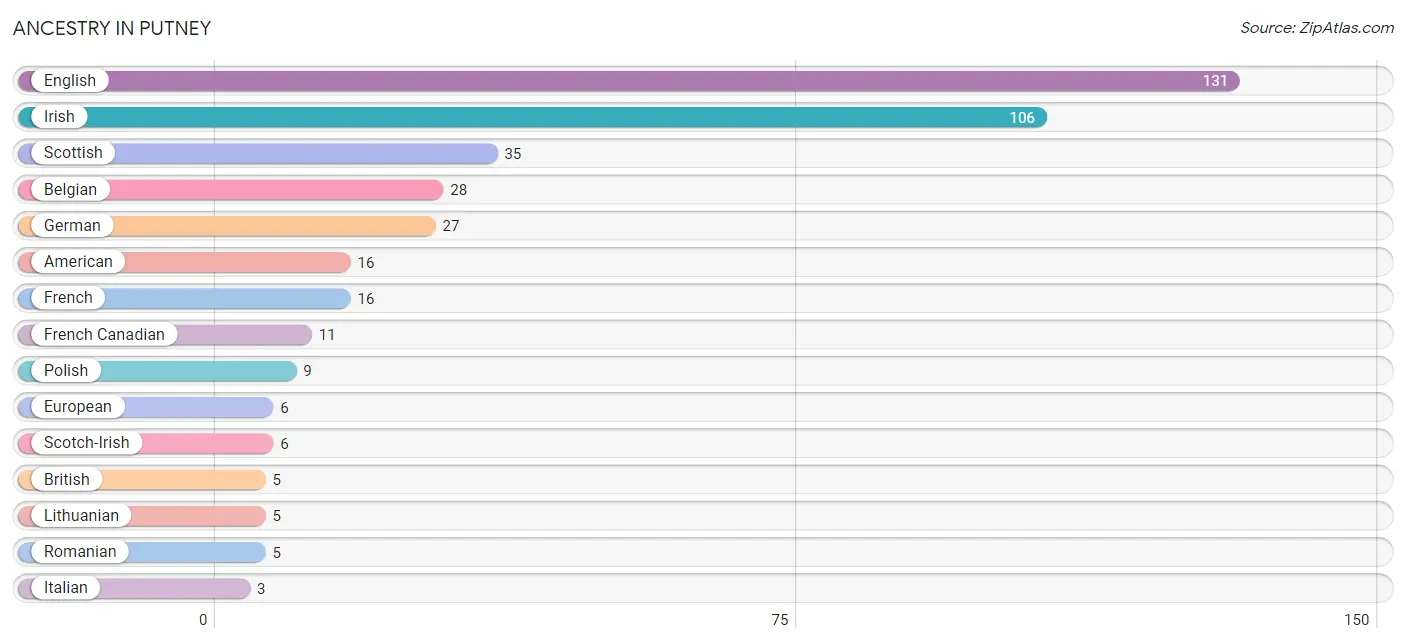
| Ancestry | # Population | % Population |
| American | 16 | 4.4% |
| Belgian | 28 | 7.8% |
| British | 5 | 1.4% |
| Danish | 2 | 0.6% |
| English | 131 | 36.4% |
| European | 6 | 1.7% |
| French | 16 | 4.4% |
| French Canadian | 11 | 3.1% |
| German | 27 | 7.5% |
| Irish | 106 | 29.4% |
| Iroquois | 1 | 0.3% |
| Italian | 3 | 0.8% |
| Lithuanian | 5 | 1.4% |
| Polish | 9 | 2.5% |
| Romanian | 5 | 1.4% |
| Scotch-Irish | 6 | 1.7% |
| Scottish | 35 | 9.7% |
| Sioux | 1 | 0.3% |
| Swiss | 3 | 0.8% | View All 19 Rows |
Immigrants in Putney
The most numerous immigrant groups reported in Putney came from Belgium (28 | 7.8%), Europe (28 | 7.8%), and Western Europe (28 | 7.8%), together accounting for 23.3% of all Putney residents.
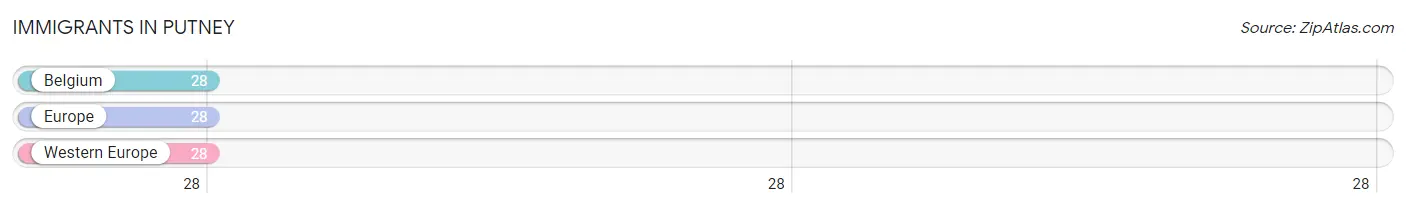
| Immigration Origin | # Population | % Population |
| Belgium | 28 | 7.8% |
| Europe | 28 | 7.8% |
| Western Europe | 28 | 7.8% | View All 3 Rows |
Sex and Age in Putney
Sex and Age in Putney
The most populous age groups in Putney are 85 Years and over (30 | 18.2%) for men and 5 to 9 Years (41 | 21.0%) for women.
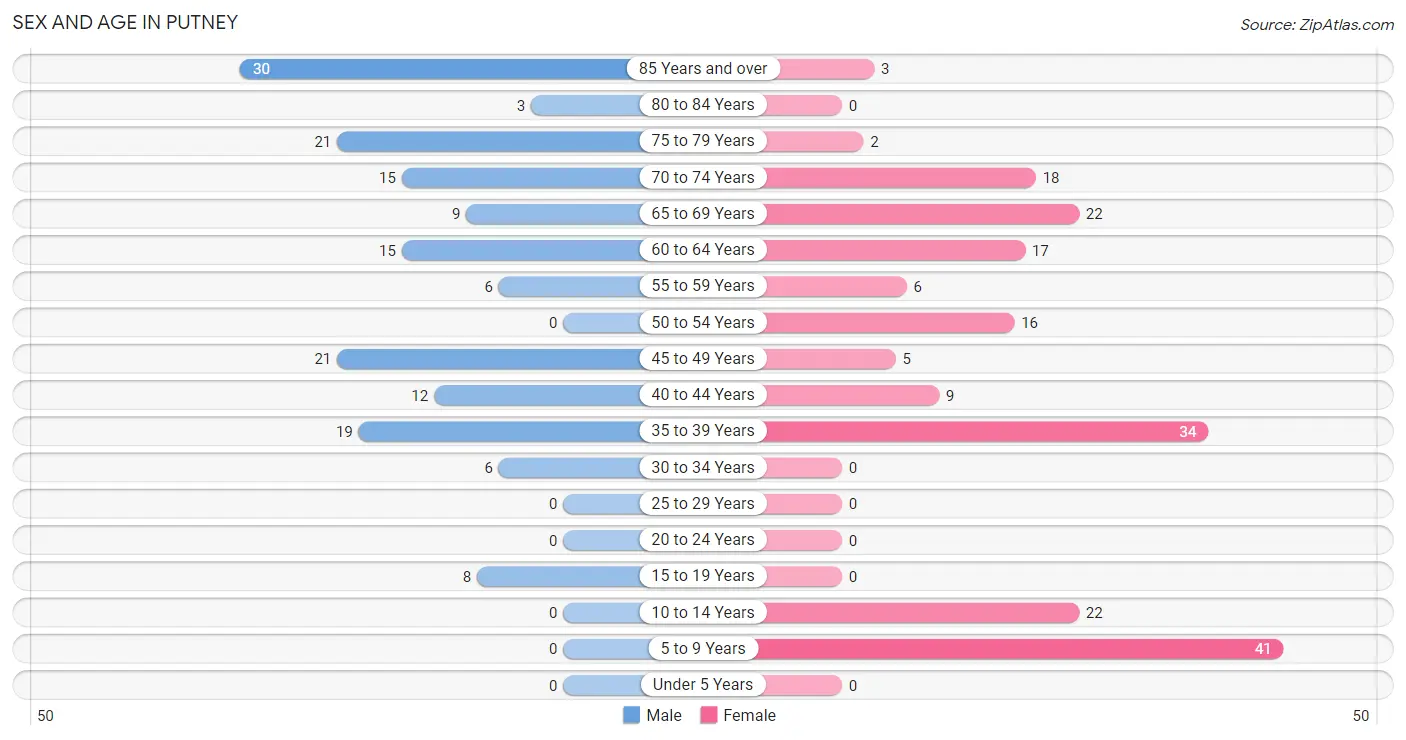
| Age Bracket | Male | Female |
| Under 5 Years | 0 (0.0%) | 0 (0.0%) |
| 5 to 9 Years | 0 (0.0%) | 41 (21.0%) |
| 10 to 14 Years | 0 (0.0%) | 22 (11.3%) |
| 15 to 19 Years | 8 (4.9%) | 0 (0.0%) |
| 20 to 24 Years | 0 (0.0%) | 0 (0.0%) |
| 25 to 29 Years | 0 (0.0%) | 0 (0.0%) |
| 30 to 34 Years | 6 (3.6%) | 0 (0.0%) |
| 35 to 39 Years | 19 (11.5%) | 34 (17.4%) |
| 40 to 44 Years | 12 (7.3%) | 9 (4.6%) |
| 45 to 49 Years | 21 (12.7%) | 5 (2.6%) |
| 50 to 54 Years | 0 (0.0%) | 16 (8.2%) |
| 55 to 59 Years | 6 (3.6%) | 6 (3.1%) |
| 60 to 64 Years | 15 (9.1%) | 17 (8.7%) |
| 65 to 69 Years | 9 (5.4%) | 22 (11.3%) |
| 70 to 74 Years | 15 (9.1%) | 18 (9.2%) |
| 75 to 79 Years | 21 (12.7%) | 2 (1.0%) |
| 80 to 84 Years | 3 (1.8%) | 0 (0.0%) |
| 85 Years and over | 30 (18.2%) | 3 (1.5%) |
| Total | 165 (100.0%) | 195 (100.0%) |
Families and Households in Putney
Median Family Size in Putney
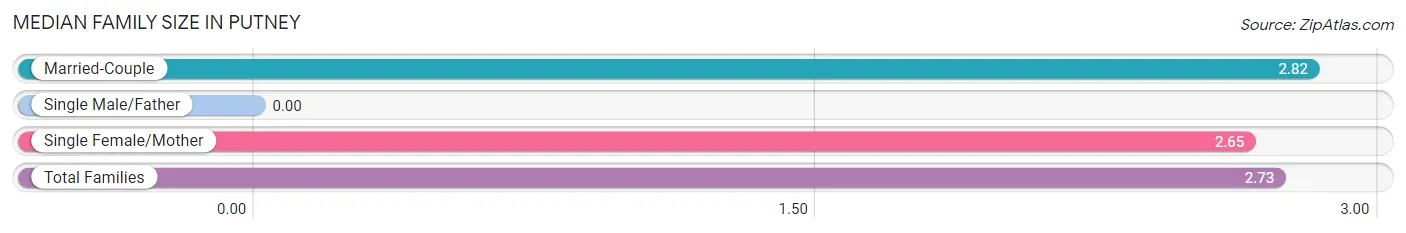
| Family Type | # Families | Family Size |
| Married-Couple | 28 (45.2%) | 2.82 |
| Single Male/Father | 0 (0.0%) | - |
| Single Female/Mother | 34 (54.8%) | 2.65 |
| Total Families | 62 (100.0%) | 2.73 |
Median Household Size in Putney
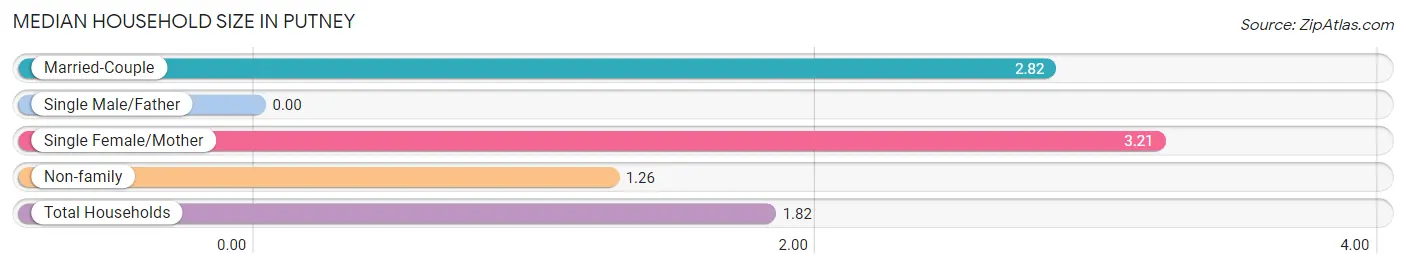
| Household Type | # Households | Household Size |
| Married-Couple | 28 (14.3%) | 2.82 |
| Single Male/Father | 0 (0.0%) | - |
| Single Female/Mother | 34 (17.3%) | 3.21 |
| Non-family | 134 (68.4%) | 1.26 |
| Total Households | 196 (100.0%) | 1.82 |
Household Size by Marriage Status in Putney
Out of a total of 196 households in Putney, 62 (31.6%) are family households, while 134 (68.4%) are nonfamily households. The most numerous type of family households are 2-person households, comprising 29, and the most common type of nonfamily households are 1-person households, comprising 121.
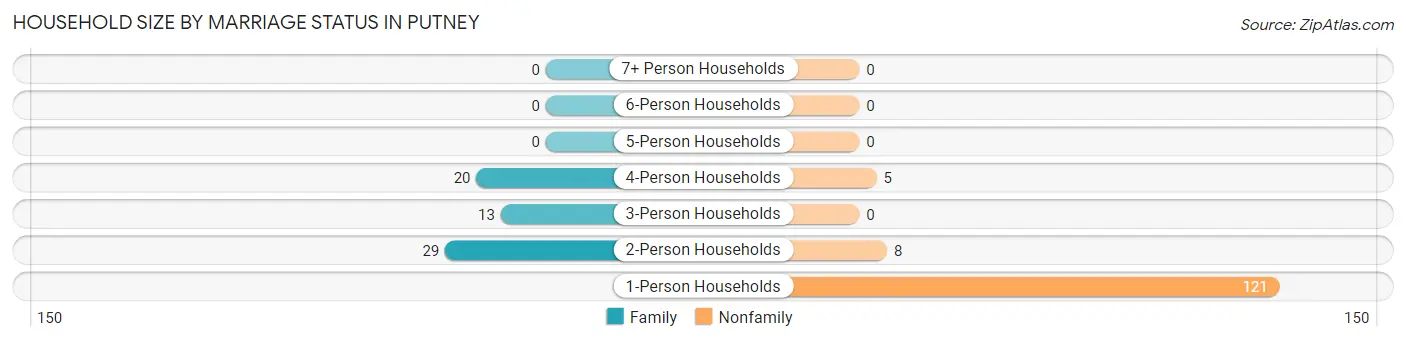
| Household Size | Family Households | Nonfamily Households |
| 1-Person Households | - | 121 (61.7%) |
| 2-Person Households | 29 (14.8%) | 8 (4.1%) |
| 3-Person Households | 13 (6.6%) | 0 (0.0%) |
| 4-Person Households | 20 (10.2%) | 5 (2.5%) |
| 5-Person Households | 0 (0.0%) | 0 (0.0%) |
| 6-Person Households | 0 (0.0%) | 0 (0.0%) |
| 7+ Person Households | 0 (0.0%) | 0 (0.0%) |
| Total | 62 (31.6%) | 134 (68.4%) |
Female Fertility in Putney
Fertility by Age in Putney
| Age Bracket | Women with Births | Births / 1,000 Women |
| 15 to 19 years | 0 (0.0%) | 0.0 |
| 20 to 34 years | 0 (0.0%) | 0.0 |
| 35 to 50 years | 0 (0.0%) | 0.0 |
| Total | 0 (0.0%) | 0.0 |
Fertility by Age by Marriage Status in Putney
| Age Bracket | Married | Unmarried |
| 15 to 19 years | 0 (0.0%) | 0 (0.0%) |
| 20 to 34 years | 0 (0.0%) | 0 (0.0%) |
| 35 to 50 years | 0 (0.0%) | 0 (0.0%) |
| Total | 0 (0.0%) | 0 (0.0%) |
Fertility by Education in Putney
| Educational Attainment | Women with Births | Births / 1,000 Women |
| Less than High School | 0 (0.0%) | 0.0 |
| High School Diploma | 0 (0.0%) | 0.0 |
| College or Associate's Degree | 0 (0.0%) | 0.0 |
| Bachelor's Degree | 0 (0.0%) | 0.0 |
| Graduate Degree | 0 (0.0%) | 0.0 |
| Total | 0 (0.0%) | 0.0 |
Fertility by Education by Marriage Status in Putney
| Educational Attainment | Married | Unmarried |
| Less than High School | 0 (0.0%) | 0 (0.0%) |
| High School Diploma | 0 (0.0%) | 0 (0.0%) |
| College or Associate's Degree | 0 (0.0%) | 0 (0.0%) |
| Bachelor's Degree | 0 (0.0%) | 0 (0.0%) |
| Graduate Degree | 0 (0.0%) | 0 (0.0%) |
| Total | 0 (0.0%) | 0 (0.0%) |
Employment Characteristics in Putney
Employment by Class of Employer in Putney
Among the 115 employed individuals in Putney, private company employees (68 | 59.1%), not-for-profit organizations (22 | 19.1%), and self-employed (not incorporated) (16 | 13.9%) make up the most common classes of employment.
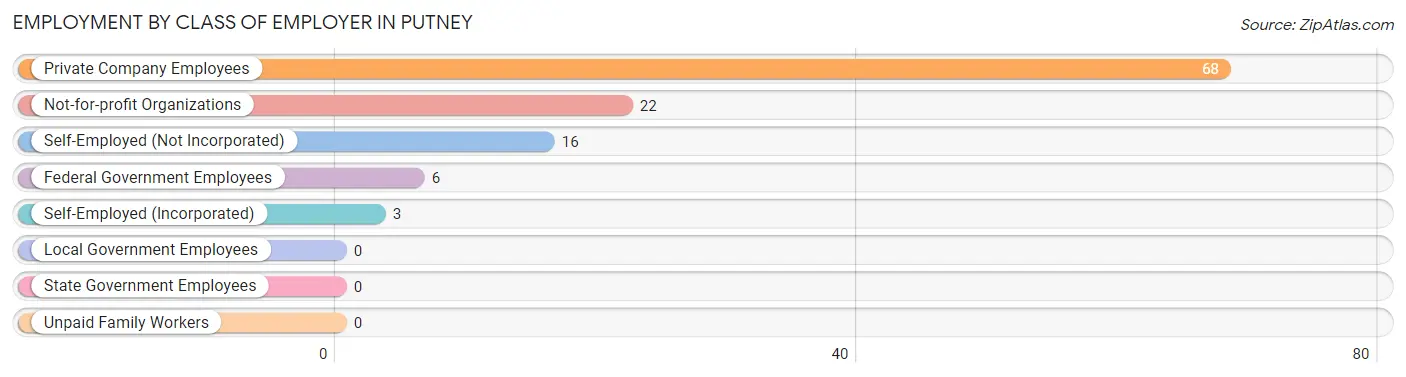
| Employer Class | # Employees | % Employees |
| Private Company Employees | 68 | 59.1% |
| Self-Employed (Incorporated) | 3 | 2.6% |
| Self-Employed (Not Incorporated) | 16 | 13.9% |
| Not-for-profit Organizations | 22 | 19.1% |
| Local Government Employees | 0 | 0.0% |
| State Government Employees | 0 | 0.0% |
| Federal Government Employees | 6 | 5.2% |
| Unpaid Family Workers | 0 | 0.0% |
| Total | 115 | 100.0% |
Employment Status by Age in Putney
According to the labor force statistics for Putney, out of the total population over 16 years of age (297), 43.8% or 130 individuals are in the labor force, with 2.3% or 3 of them unemployed. The age group with the highest labor force participation rate is 55 to 59 years, with 100.0% or 12 individuals in the labor force. Within the labor force, the 55 to 59 years age range has the highest percentage of unemployed individuals, with 25.0% or 3 of them being unemployed.
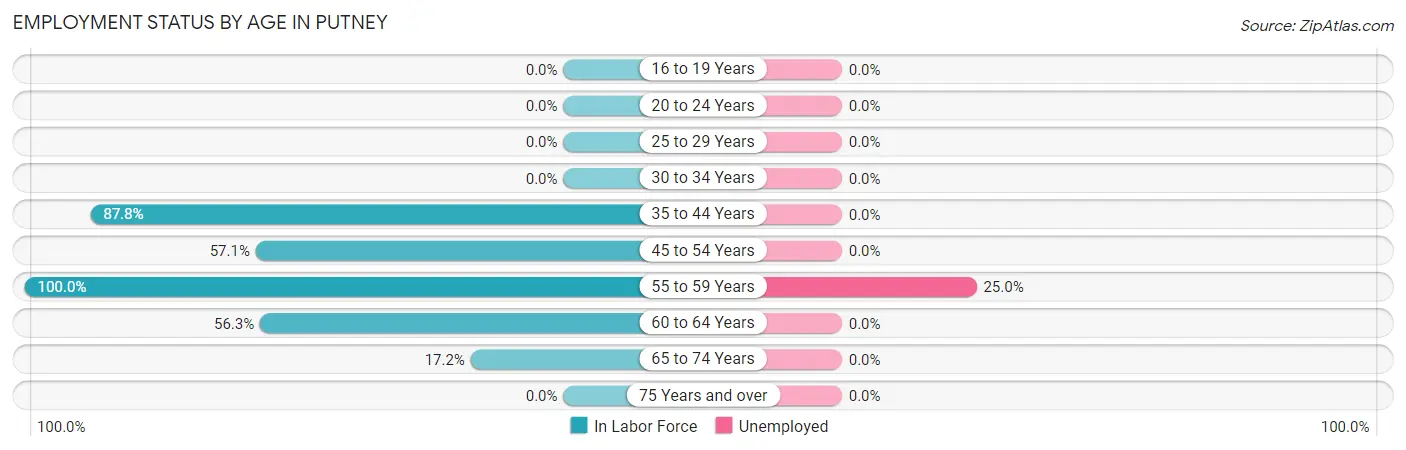
| Age Bracket | In Labor Force | Unemployed |
| 16 to 19 Years | 0 (0.0%) | 0 (0.0%) |
| 20 to 24 Years | 0 (0.0%) | 0 (0.0%) |
| 25 to 29 Years | 0 (0.0%) | 0 (0.0%) |
| 30 to 34 Years | 0 (0.0%) | 0 (0.0%) |
| 35 to 44 Years | 65 (87.8%) | 0 (0.0%) |
| 45 to 54 Years | 24 (57.1%) | 0 (0.0%) |
| 55 to 59 Years | 12 (100.0%) | 3 (25.0%) |
| 60 to 64 Years | 18 (56.3%) | 0 (0.0%) |
| 65 to 74 Years | 11 (17.2%) | 0 (0.0%) |
| 75 Years and over | 0 (0.0%) | 0 (0.0%) |
| Total | 130 (43.8%) | 3 (2.3%) |
Employment Status by Educational Attainment in Putney
According to labor force statistics for Putney, 71.7% of individuals (119) out of the total population between 25 and 64 years of age (166) are in the labor force, with 2.5% or 3 of them being unemployed. The group with the highest labor force participation rate are those with the educational attainment of college / associate degree, with 96.0% or 48 individuals in the labor force. Within the labor force, individuals with high school diploma education have the highest percentage of unemployment, with 12.0% or 3 of them being unemployed.
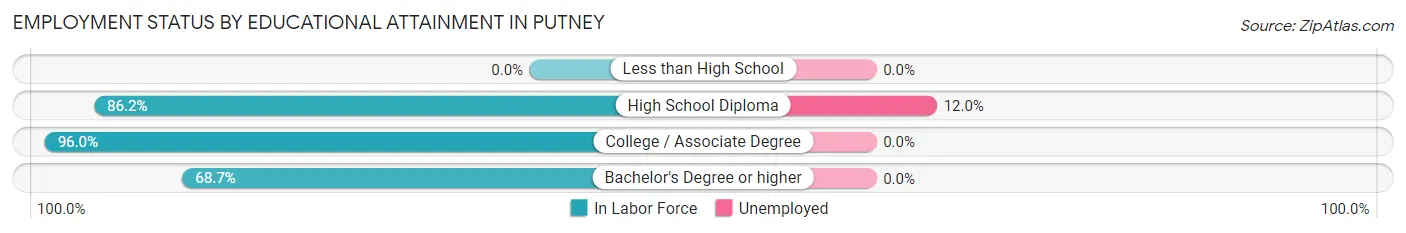
| Educational Attainment | In Labor Force | Unemployed |
| Less than High School | 0 (0.0%) | 0 (0.0%) |
| High School Diploma | 25 (86.2%) | 3 (12.0%) |
| College / Associate Degree | 48 (96.0%) | 0 (0.0%) |
| Bachelor's Degree or higher | 46 (68.7%) | 0 (0.0%) |
| Total | 119 (71.7%) | 4 (2.5%) |
Employment Occupations by Sex in Putney
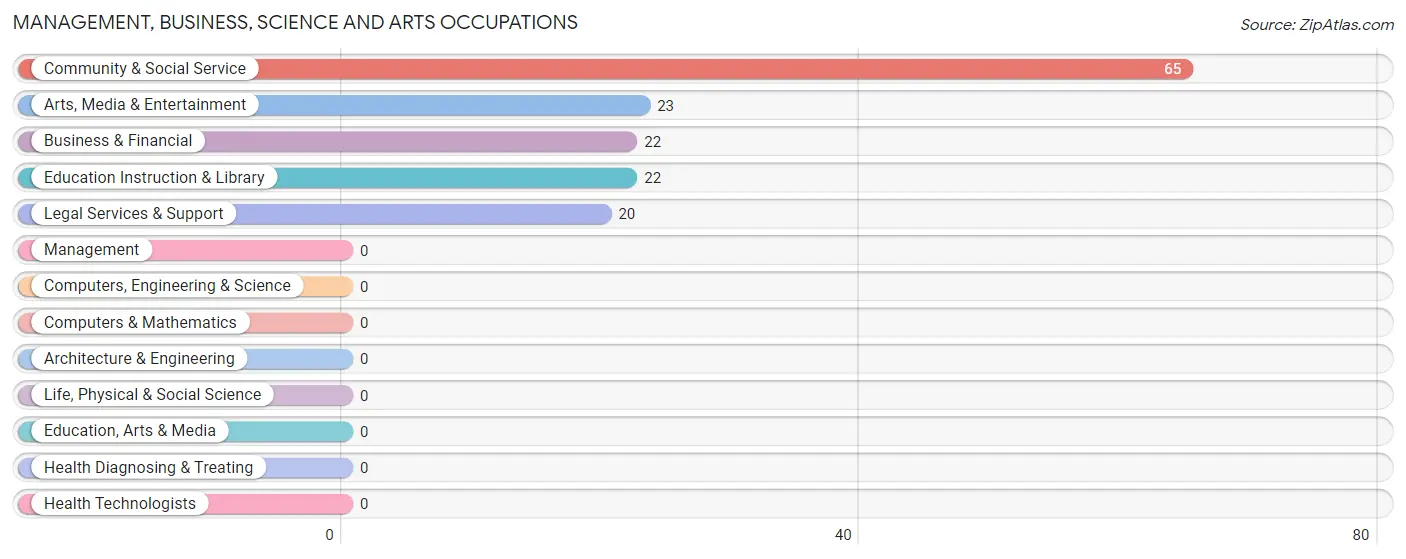
Management, Business, Science and Arts Occupations
The most common Management, Business, Science and Arts occupations in Putney are Community & Social Service (65 | 51.2%), Arts, Media & Entertainment (23 | 18.1%), Business & Financial (22 | 17.3%), Education Instruction & Library (22 | 17.3%), and Legal Services & Support (20 | 15.8%).
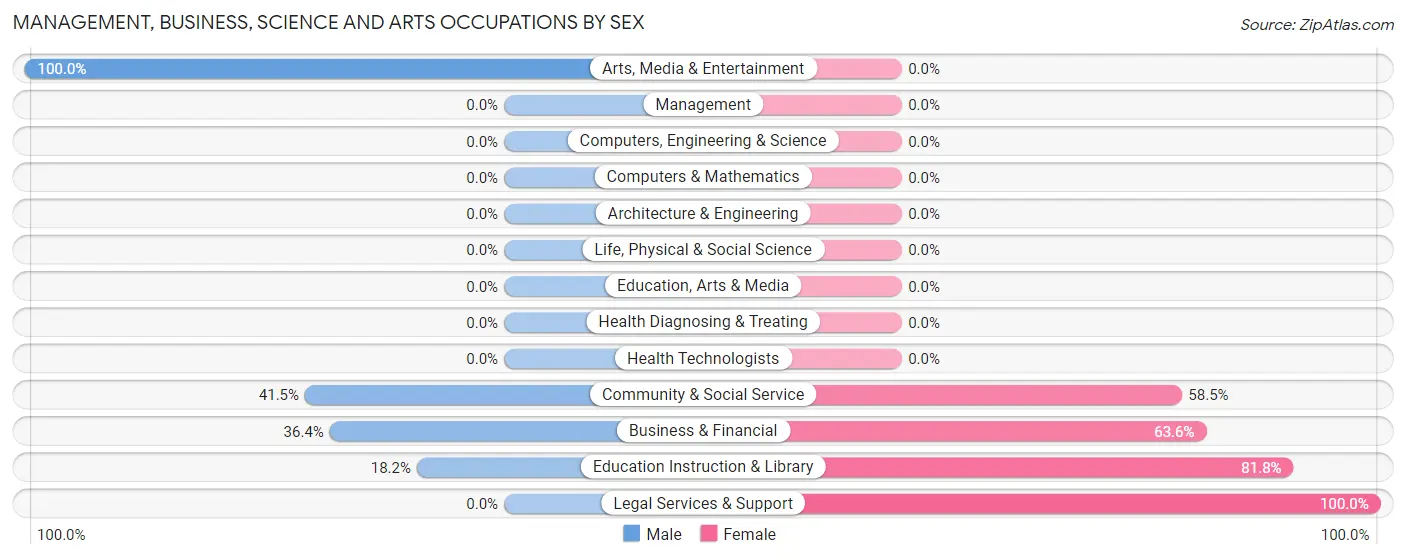
Management, Business, Science and Arts Occupations by Sex
Within the Management, Business, Science and Arts occupations in Putney, the most male-oriented occupations are Arts, Media & Entertainment (100.0%), Community & Social Service (41.5%), and Business & Financial (36.4%), while the most female-oriented occupations are Legal Services & Support (100.0%), Education Instruction & Library (81.8%), and Business & Financial (63.6%).
| Occupation | Male | Female |
| Management | 0 (0.0%) | 0 (0.0%) |
| Business & Financial | 8 (36.4%) | 14 (63.6%) |
| Computers, Engineering & Science | 0 (0.0%) | 0 (0.0%) |
| Computers & Mathematics | 0 (0.0%) | 0 (0.0%) |
| Architecture & Engineering | 0 (0.0%) | 0 (0.0%) |
| Life, Physical & Social Science | 0 (0.0%) | 0 (0.0%) |
| Community & Social Service | 27 (41.5%) | 38 (58.5%) |
| Education, Arts & Media | 0 (0.0%) | 0 (0.0%) |
| Legal Services & Support | 0 (0.0%) | 20 (100.0%) |
| Education Instruction & Library | 4 (18.2%) | 18 (81.8%) |
| Arts, Media & Entertainment | 23 (100.0%) | 0 (0.0%) |
| Health Diagnosing & Treating | 0 (0.0%) | 0 (0.0%) |
| Health Technologists | 0 (0.0%) | 0 (0.0%) |
| Total (Category) | 35 (40.2%) | 52 (59.8%) |
| Total (Overall) | 66 (52.0%) | 61 (48.0%) |
Services Occupations
Services Occupations by Sex
| Occupation | Male | Female |
| Healthcare Support | 0 (0.0%) | 0 (0.0%) |
| Security & Protection | 0 (0.0%) | 0 (0.0%) |
| Firefighting & Prevention | 0 (0.0%) | 0 (0.0%) |
| Law Enforcement | 0 (0.0%) | 0 (0.0%) |
| Food Preparation & Serving | 0 (0.0%) | 0 (0.0%) |
| Cleaning & Maintenance | 0 (0.0%) | 0 (0.0%) |
| Personal Care & Service | 0 (0.0%) | 0 (0.0%) |
| Total (Category) | 0 (0.0%) | 0 (0.0%) |
| Total (Overall) | 66 (52.0%) | 61 (48.0%) |
Sales and Office Occupations
The most common Sales and Office occupations in Putney are Office & Administration (25 | 19.7%), and Sales & Related (2 | 1.6%).
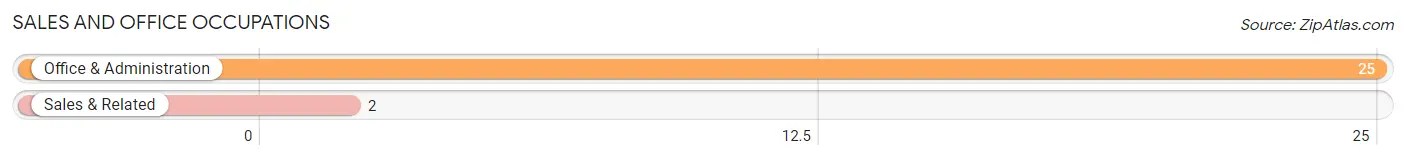
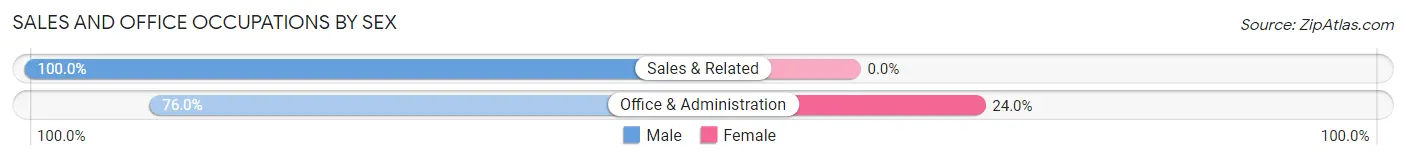
Sales and Office Occupations by Sex
| Occupation | Male | Female |
| Sales & Related | 2 (100.0%) | 0 (0.0%) |
| Office & Administration | 19 (76.0%) | 6 (24.0%) |
| Total (Category) | 21 (77.8%) | 6 (22.2%) |
| Total (Overall) | 66 (52.0%) | 61 (48.0%) |
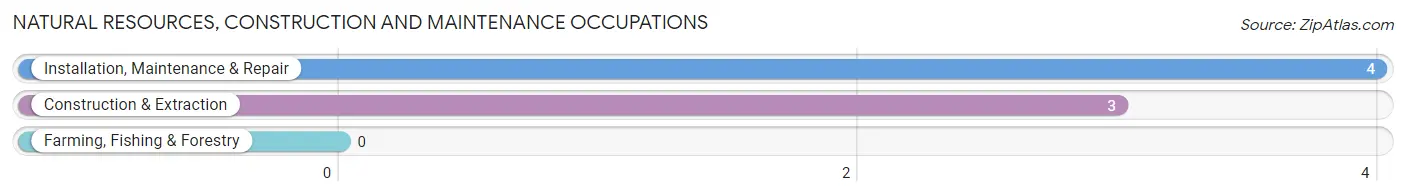
Natural Resources, Construction and Maintenance Occupations
The most common Natural Resources, Construction and Maintenance occupations in Putney are Installation, Maintenance & Repair (4 | 3.2%), and Construction & Extraction (3 | 2.4%).
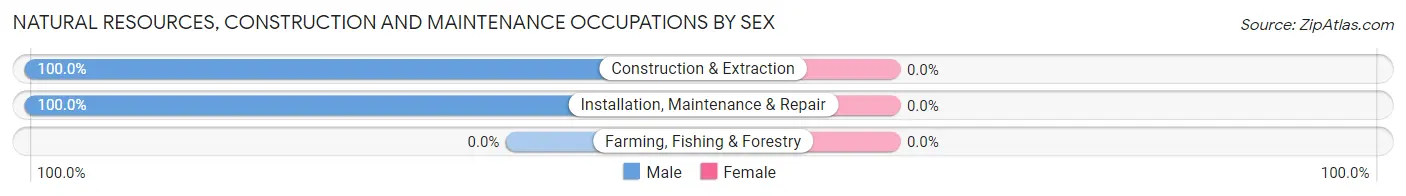
Natural Resources, Construction and Maintenance Occupations by Sex
| Occupation | Male | Female |
| Farming, Fishing & Forestry | 0 (0.0%) | 0 (0.0%) |
| Construction & Extraction | 3 (100.0%) | 0 (0.0%) |
| Installation, Maintenance & Repair | 4 (100.0%) | 0 (0.0%) |
| Total (Category) | 7 (100.0%) | 0 (0.0%) |
| Total (Overall) | 66 (52.0%) | 61 (48.0%) |
Production, Transportation and Moving Occupations
The most common Production, Transportation and Moving occupations in Putney are , and Production (6 | 4.7%).
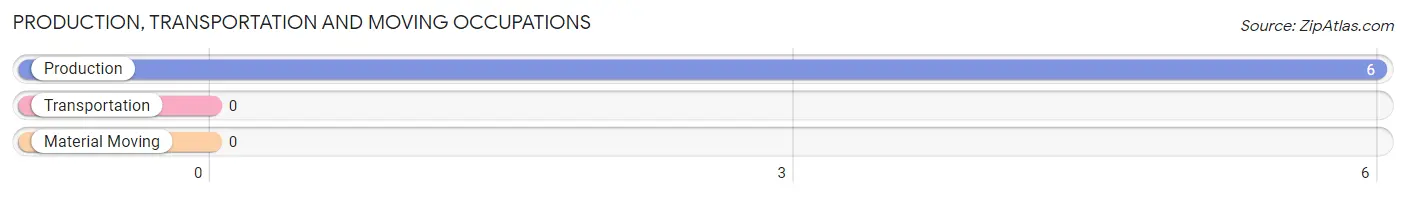
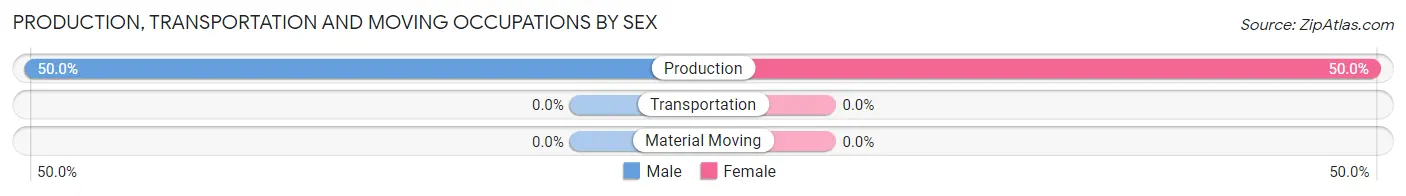
Production, Transportation and Moving Occupations by Sex
| Occupation | Male | Female |
| Production | 3 (50.0%) | 3 (50.0%) |
| Transportation | 0 (0.0%) | 0 (0.0%) |
| Material Moving | 0 (0.0%) | 0 (0.0%) |
| Total (Category) | 3 (50.0%) | 3 (50.0%) |
| Total (Overall) | 66 (52.0%) | 61 (48.0%) |
Employment Industries by Sex in Putney
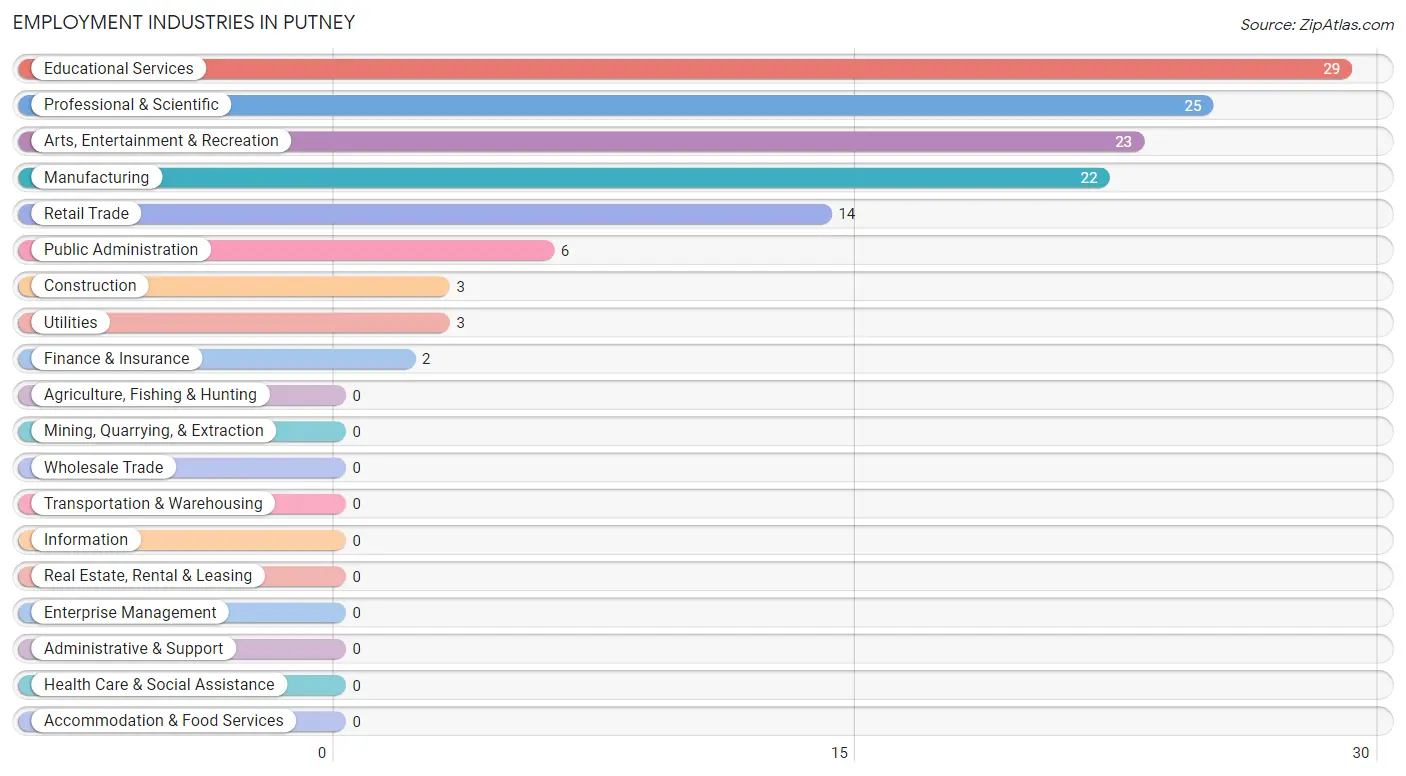
Employment Industries in Putney
The major employment industries in Putney include Educational Services (29 | 22.8%), Professional & Scientific (25 | 19.7%), Arts, Entertainment & Recreation (23 | 18.1%), Manufacturing (22 | 17.3%), and Retail Trade (14 | 11.0%).
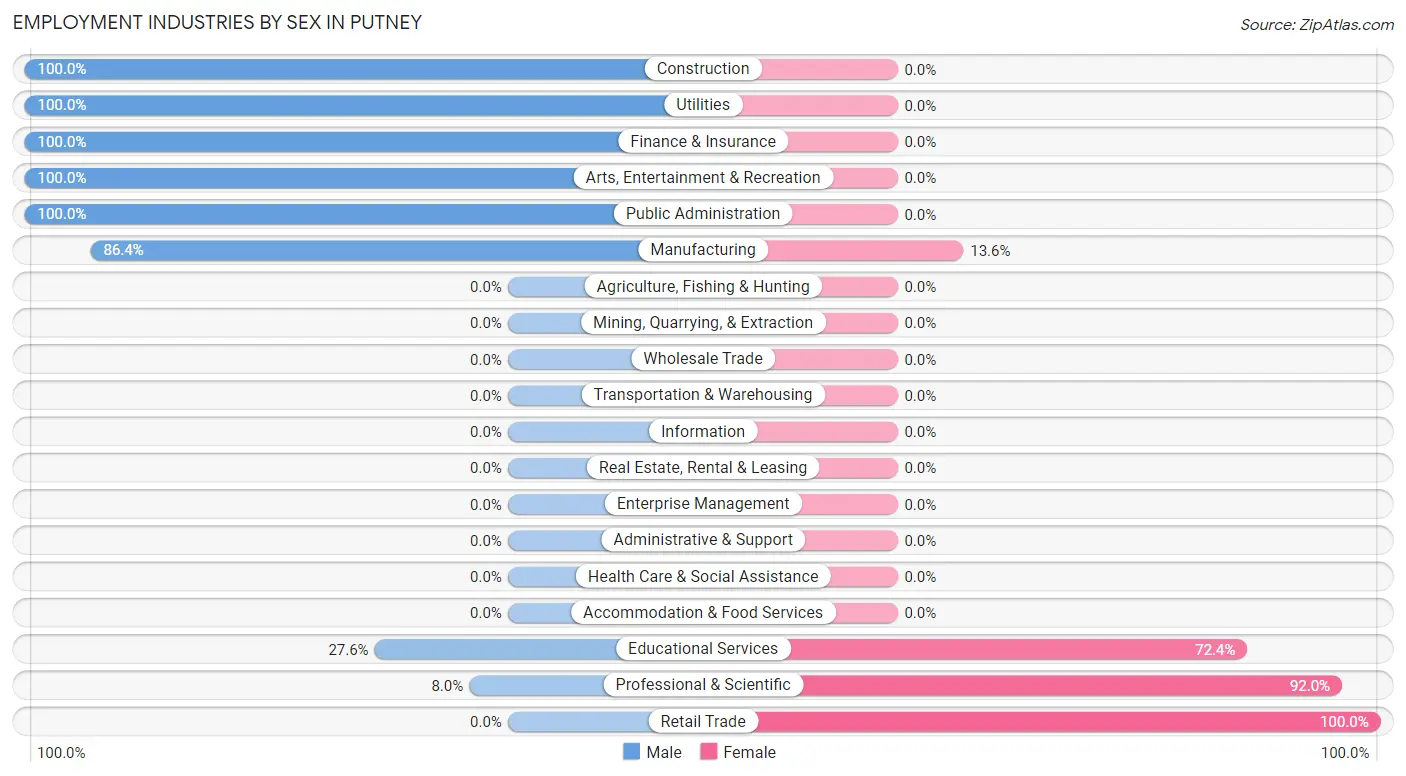
Employment Industries by Sex in Putney
The Putney industries that see more men than women are Construction (100.0%), Utilities (100.0%), and Finance & Insurance (100.0%), whereas the industries that tend to have a higher number of women are Retail Trade (100.0%), Professional & Scientific (92.0%), and Educational Services (72.4%).
| Industry | Male | Female |
| Agriculture, Fishing & Hunting | 0 (0.0%) | 0 (0.0%) |
| Mining, Quarrying, & Extraction | 0 (0.0%) | 0 (0.0%) |
| Construction | 3 (100.0%) | 0 (0.0%) |
| Manufacturing | 19 (86.4%) | 3 (13.6%) |
| Wholesale Trade | 0 (0.0%) | 0 (0.0%) |
| Retail Trade | 0 (0.0%) | 14 (100.0%) |
| Transportation & Warehousing | 0 (0.0%) | 0 (0.0%) |
| Utilities | 3 (100.0%) | 0 (0.0%) |
| Information | 0 (0.0%) | 0 (0.0%) |
| Finance & Insurance | 2 (100.0%) | 0 (0.0%) |
| Real Estate, Rental & Leasing | 0 (0.0%) | 0 (0.0%) |
| Professional & Scientific | 2 (8.0%) | 23 (92.0%) |
| Enterprise Management | 0 (0.0%) | 0 (0.0%) |
| Administrative & Support | 0 (0.0%) | 0 (0.0%) |
| Educational Services | 8 (27.6%) | 21 (72.4%) |
| Health Care & Social Assistance | 0 (0.0%) | 0 (0.0%) |
| Arts, Entertainment & Recreation | 23 (100.0%) | 0 (0.0%) |
| Accommodation & Food Services | 0 (0.0%) | 0 (0.0%) |
| Public Administration | 6 (100.0%) | 0 (0.0%) |
| Total | 66 (52.0%) | 61 (48.0%) |
Education in Putney
School Enrollment in Putney
The most common levels of schooling among the 100 students in Putney are elementary school (41 | 41.0%), middle school (22 | 22.0%), and college / undergraduate (19 | 19.0%).
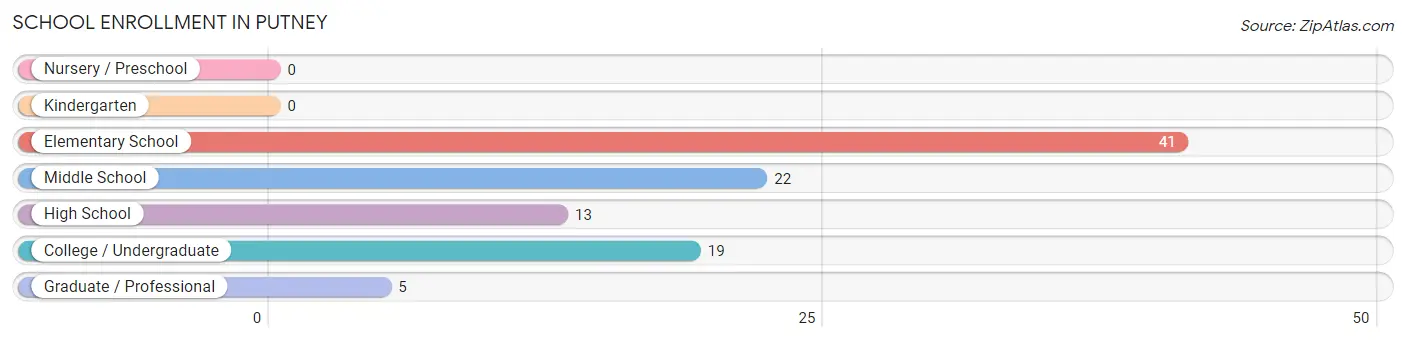
| School Level | # Students | % Students |
| Nursery / Preschool | 0 | 0.0% |
| Kindergarten | 0 | 0.0% |
| Elementary School | 41 | 41.0% |
| Middle School | 22 | 22.0% |
| High School | 13 | 13.0% |
| College / Undergraduate | 19 | 19.0% |
| Graduate / Professional | 5 | 5.0% |
| Total | 100 | 100.0% |
School Enrollment by Age by Funding Source in Putney
Out of a total of 100 students who are enrolled in schools in Putney, 6 (6.0%) attend a private institution, while the remaining 94 (94.0%) are enrolled in public schools. The age group of 35 years and over has the highest likelihood of being enrolled in private schools, with 5 (20.8% in the age bracket) enrolled. Conversely, the age group of 5 to 9 year old has the lowest likelihood of being enrolled in a private school, with 41 (100.0% in the age bracket) attending a public institution.
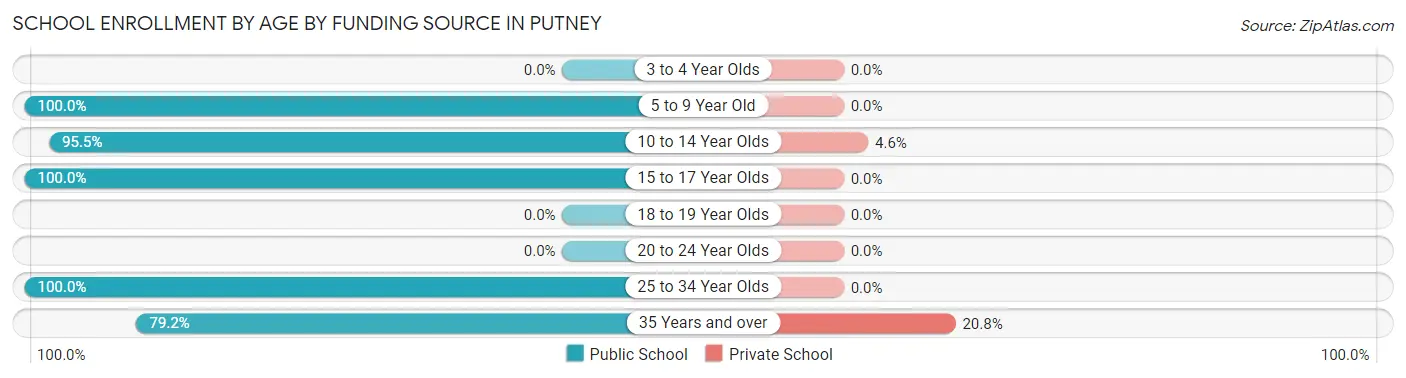
| Age Bracket | Public School | Private School |
| 3 to 4 Year Olds | 0 (0.0%) | 0 (0.0%) |
| 5 to 9 Year Old | 41 (100.0%) | 0 (0.0%) |
| 10 to 14 Year Olds | 21 (95.5%) | 1 (4.5%) |
| 15 to 17 Year Olds | 8 (100.0%) | 0 (0.0%) |
| 18 to 19 Year Olds | 0 (0.0%) | 0 (0.0%) |
| 20 to 24 Year Olds | 0 (0.0%) | 0 (0.0%) |
| 25 to 34 Year Olds | 5 (100.0%) | 0 (0.0%) |
| 35 Years and over | 19 (79.2%) | 5 (20.8%) |
| Total | 94 (94.0%) | 6 (6.0%) |
Educational Attainment by Field of Study in Putney
Liberal arts & history (45 | 31.5%), education (44 | 30.8%), literature & languages (12 | 8.4%), psychology (11 | 7.7%), and social sciences (10 | 7.0%) are the most common fields of study among 143 individuals in Putney who have obtained a bachelor's degree or higher.
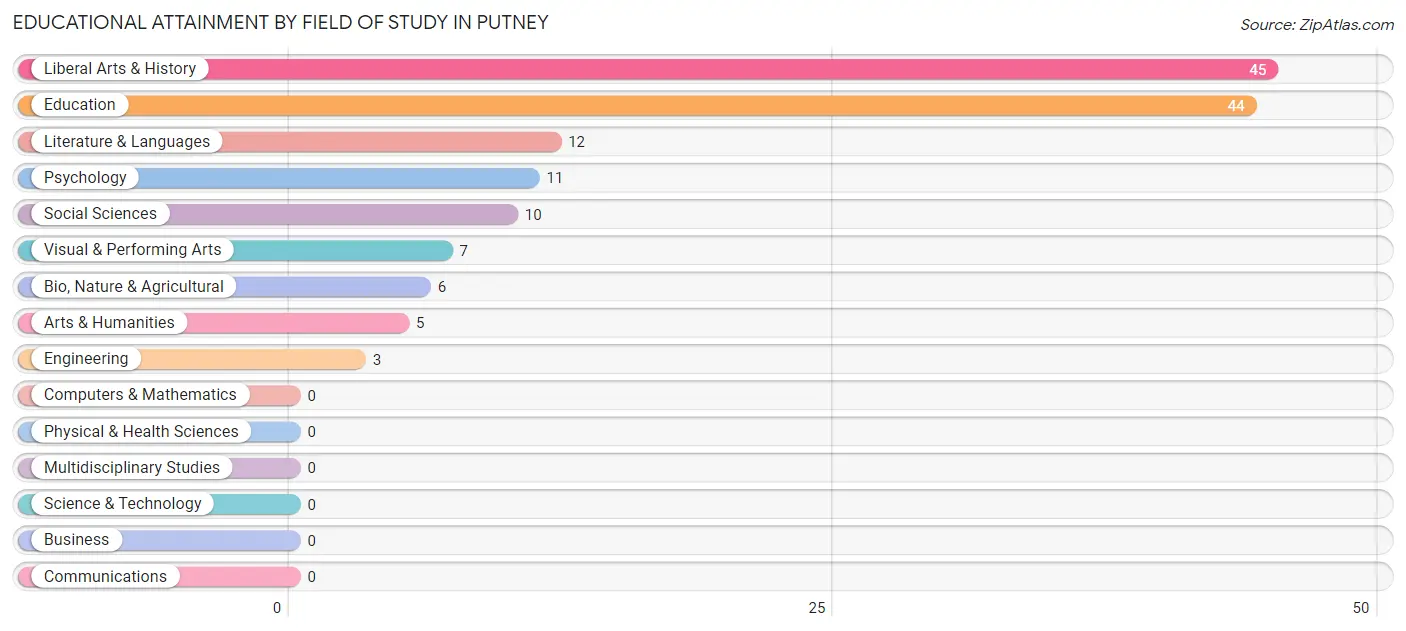
| Field of Study | # Graduates | % Graduates |
| Computers & Mathematics | 0 | 0.0% |
| Bio, Nature & Agricultural | 6 | 4.2% |
| Physical & Health Sciences | 0 | 0.0% |
| Psychology | 11 | 7.7% |
| Social Sciences | 10 | 7.0% |
| Engineering | 3 | 2.1% |
| Multidisciplinary Studies | 0 | 0.0% |
| Science & Technology | 0 | 0.0% |
| Business | 0 | 0.0% |
| Education | 44 | 30.8% |
| Literature & Languages | 12 | 8.4% |
| Liberal Arts & History | 45 | 31.5% |
| Visual & Performing Arts | 7 | 4.9% |
| Communications | 0 | 0.0% |
| Arts & Humanities | 5 | 3.5% |
| Total | 143 | 100.0% |
Transportation & Commute in Putney
Vehicle Availability by Sex in Putney
The most prevalent vehicle ownership categories in Putney are males with 2 vehicles (42, accounting for 77.8%) and females with 2 vehicles (31, making up 68.9%).
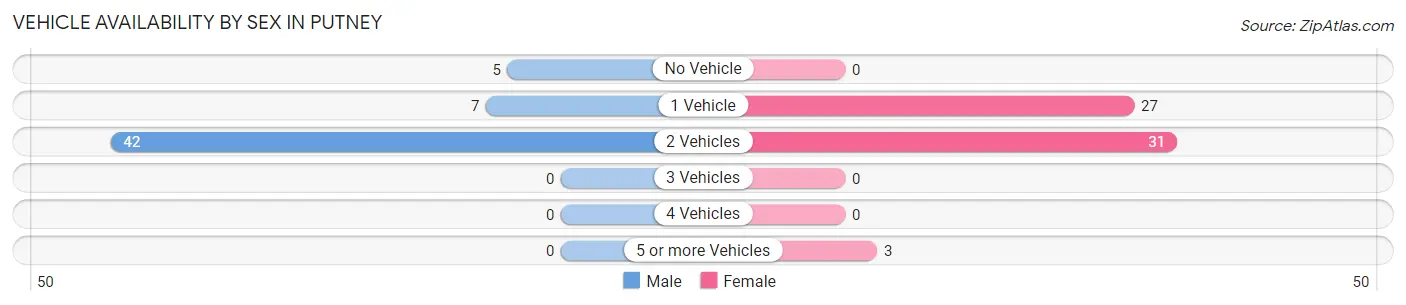
| Vehicles Available | Male | Female |
| No Vehicle | 5 (9.3%) | 0 (0.0%) |
| 1 Vehicle | 7 (13.0%) | 27 (44.3%) |
| 2 Vehicles | 42 (77.8%) | 31 (50.8%) |
| 3 Vehicles | 0 (0.0%) | 0 (0.0%) |
| 4 Vehicles | 0 (0.0%) | 0 (0.0%) |
| 5 or more Vehicles | 0 (0.0%) | 3 (4.9%) |
| Total | 54 (100.0%) | 61 (100.0%) |
Commute Time in Putney
The most frequently occuring commute durations in Putney are less than 5 minutes (49 commuters, 45.4%), 15 to 19 minutes (28 commuters, 25.9%), and 5 to 9 minutes (14 commuters, 13.0%).
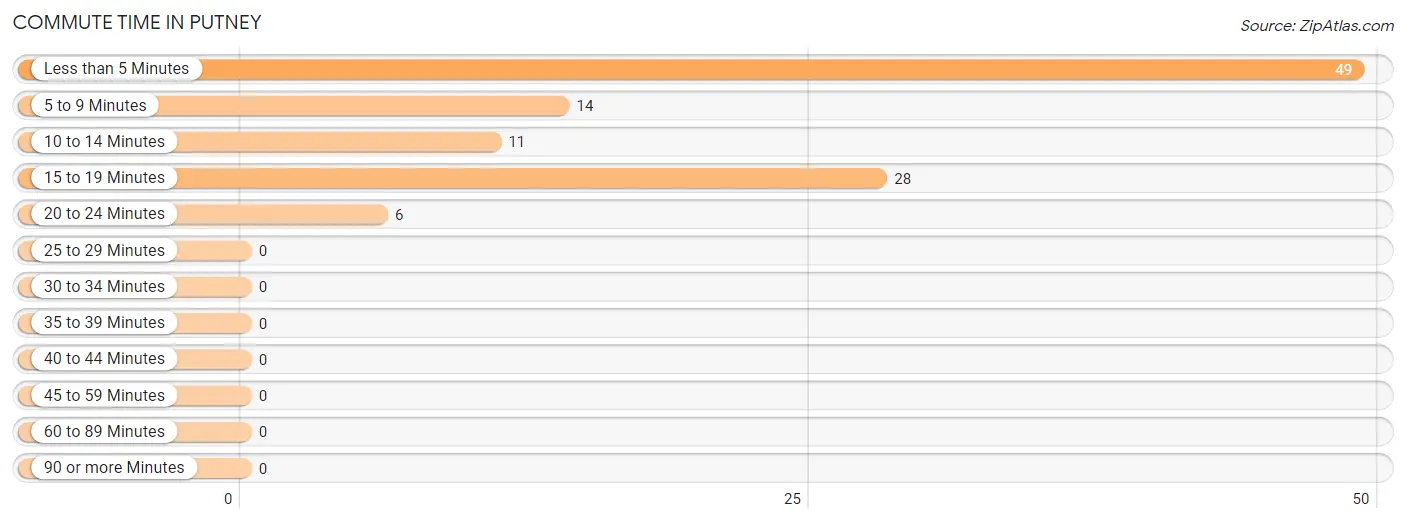
| Commute Time | # Commuters | % Commuters |
| Less than 5 Minutes | 49 | 45.4% |
| 5 to 9 Minutes | 14 | 13.0% |
| 10 to 14 Minutes | 11 | 10.2% |
| 15 to 19 Minutes | 28 | 25.9% |
| 20 to 24 Minutes | 6 | 5.6% |
| 25 to 29 Minutes | 0 | 0.0% |
| 30 to 34 Minutes | 0 | 0.0% |
| 35 to 39 Minutes | 0 | 0.0% |
| 40 to 44 Minutes | 0 | 0.0% |
| 45 to 59 Minutes | 0 | 0.0% |
| 60 to 89 Minutes | 0 | 0.0% |
| 90 or more Minutes | 0 | 0.0% |
Commute Time by Sex in Putney
The most common commute times in Putney are less than 5 minutes (22 commuters, 46.8%) for males and less than 5 minutes (27 commuters, 44.3%) for females.
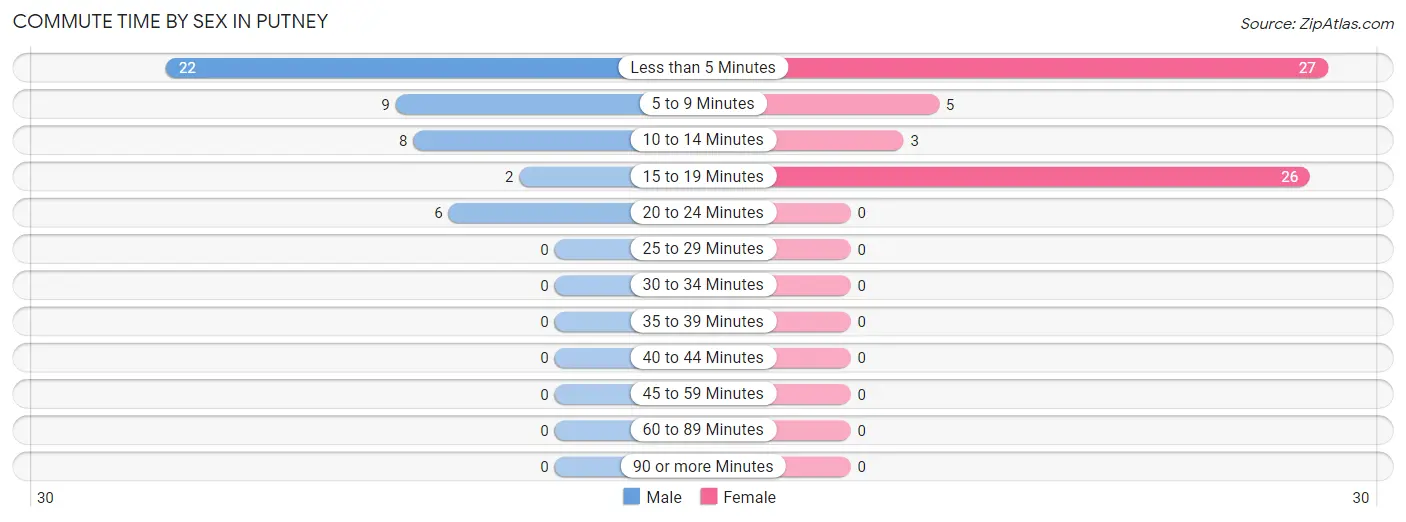
| Commute Time | Male | Female |
| Less than 5 Minutes | 22 (46.8%) | 27 (44.3%) |
| 5 to 9 Minutes | 9 (19.2%) | 5 (8.2%) |
| 10 to 14 Minutes | 8 (17.0%) | 3 (4.9%) |
| 15 to 19 Minutes | 2 (4.3%) | 26 (42.6%) |
| 20 to 24 Minutes | 6 (12.8%) | 0 (0.0%) |
| 25 to 29 Minutes | 0 (0.0%) | 0 (0.0%) |
| 30 to 34 Minutes | 0 (0.0%) | 0 (0.0%) |
| 35 to 39 Minutes | 0 (0.0%) | 0 (0.0%) |
| 40 to 44 Minutes | 0 (0.0%) | 0 (0.0%) |
| 45 to 59 Minutes | 0 (0.0%) | 0 (0.0%) |
| 60 to 89 Minutes | 0 (0.0%) | 0 (0.0%) |
| 90 or more Minutes | 0 (0.0%) | 0 (0.0%) |
Time of Departure to Work by Sex in Putney
The most frequent times of departure to work in Putney are 6:30 AM to 6:59 AM (31, 66.0%) for males and 8:00 AM to 8:29 AM (33, 54.1%) for females.
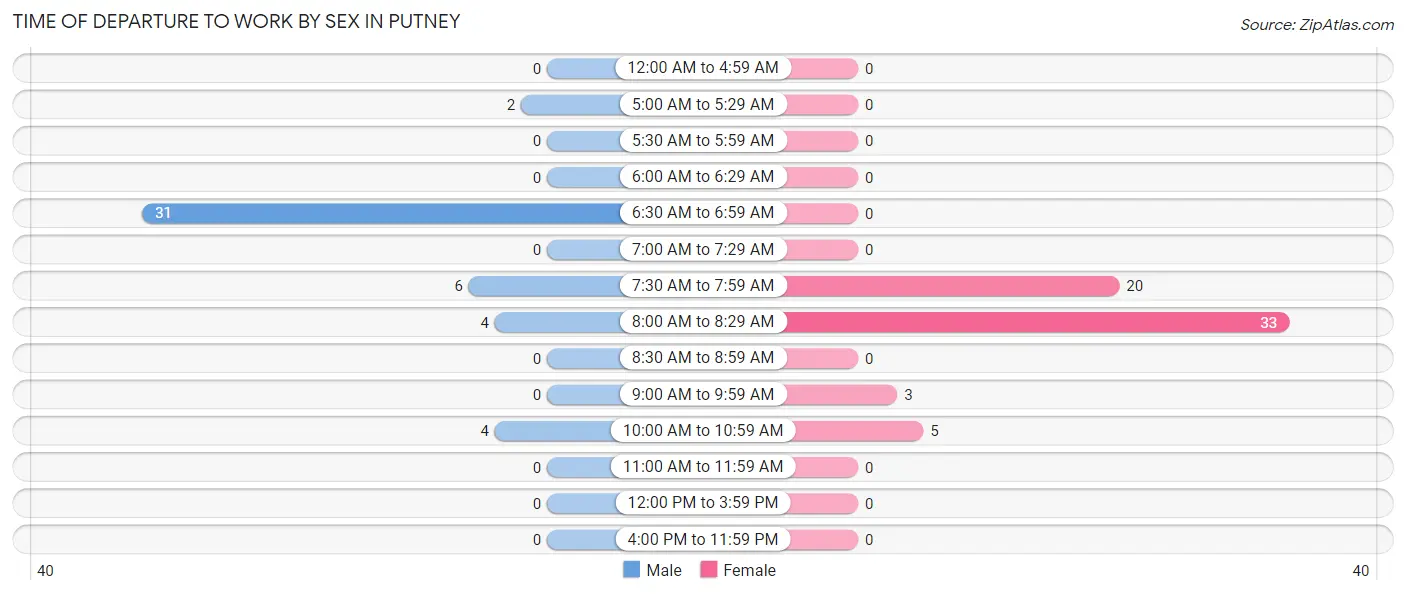
| Time of Departure | Male | Female |
| 12:00 AM to 4:59 AM | 0 (0.0%) | 0 (0.0%) |
| 5:00 AM to 5:29 AM | 2 (4.3%) | 0 (0.0%) |
| 5:30 AM to 5:59 AM | 0 (0.0%) | 0 (0.0%) |
| 6:00 AM to 6:29 AM | 0 (0.0%) | 0 (0.0%) |
| 6:30 AM to 6:59 AM | 31 (66.0%) | 0 (0.0%) |
| 7:00 AM to 7:29 AM | 0 (0.0%) | 0 (0.0%) |
| 7:30 AM to 7:59 AM | 6 (12.8%) | 20 (32.8%) |
| 8:00 AM to 8:29 AM | 4 (8.5%) | 33 (54.1%) |
| 8:30 AM to 8:59 AM | 0 (0.0%) | 0 (0.0%) |
| 9:00 AM to 9:59 AM | 0 (0.0%) | 3 (4.9%) |
| 10:00 AM to 10:59 AM | 4 (8.5%) | 5 (8.2%) |
| 11:00 AM to 11:59 AM | 0 (0.0%) | 0 (0.0%) |
| 12:00 PM to 3:59 PM | 0 (0.0%) | 0 (0.0%) |
| 4:00 PM to 11:59 PM | 0 (0.0%) | 0 (0.0%) |
| Total | 47 (100.0%) | 61 (100.0%) |
Housing Occupancy in Putney
Occupancy by Ownership in Putney
Of the total 196 dwellings in Putney, owner-occupied units account for 106 (54.1%), while renter-occupied units make up 90 (45.9%).
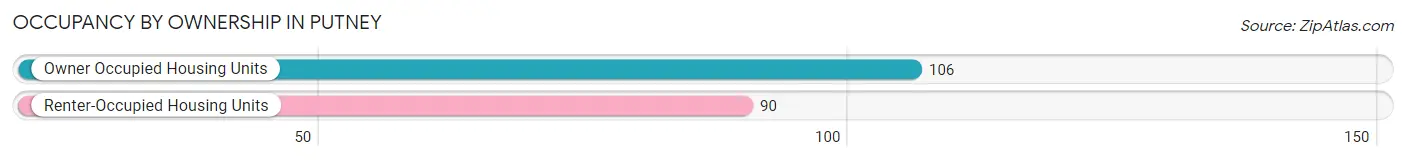
| Occupancy | # Housing Units | % Housing Units |
| Owner Occupied Housing Units | 106 | 54.1% |
| Renter-Occupied Housing Units | 90 | 45.9% |
| Total Occupied Housing Units | 196 | 100.0% |
Occupancy by Household Size in Putney
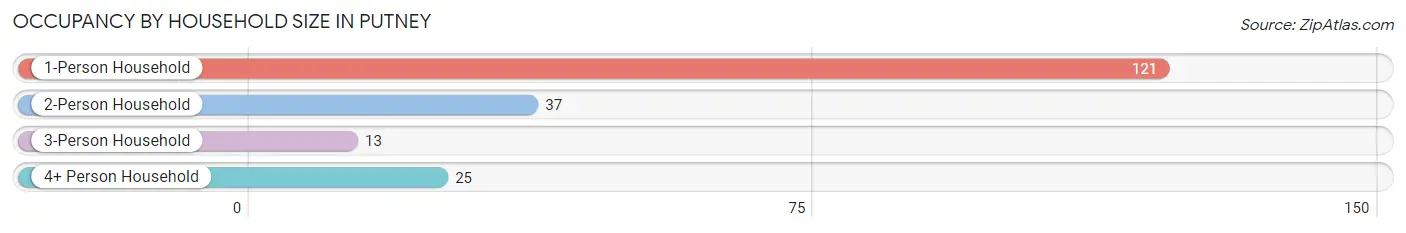
| Household Size | # Housing Units | % Housing Units |
| 1-Person Household | 121 | 61.7% |
| 2-Person Household | 37 | 18.9% |
| 3-Person Household | 13 | 6.6% |
| 4+ Person Household | 25 | 12.8% |
| Total Housing Units | 196 | 100.0% |
Occupancy by Ownership by Household Size in Putney
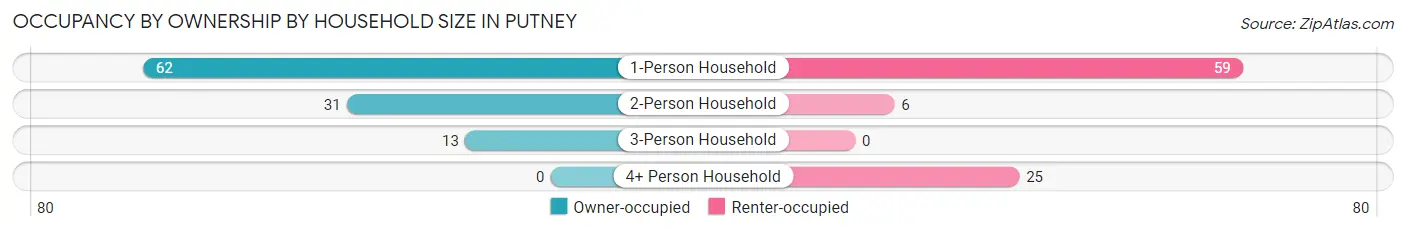
| Household Size | Owner-occupied | Renter-occupied |
| 1-Person Household | 62 (51.2%) | 59 (48.8%) |
| 2-Person Household | 31 (83.8%) | 6 (16.2%) |
| 3-Person Household | 13 (100.0%) | 0 (0.0%) |
| 4+ Person Household | 0 (0.0%) | 25 (100.0%) |
| Total Housing Units | 106 (54.1%) | 90 (45.9%) |
Occupancy by Educational Attainment in Putney
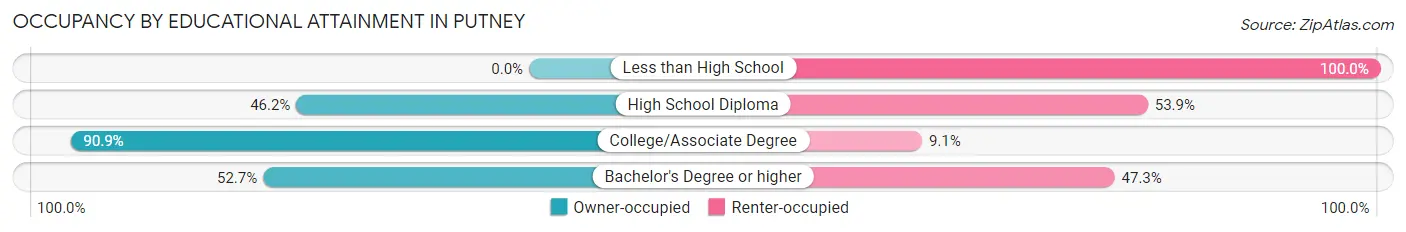
| Household Size | Owner-occupied | Renter-occupied |
| Less than High School | 0 (0.0%) | 14 (100.0%) |
| High School Diploma | 18 (46.2%) | 21 (53.8%) |
| College/Associate Degree | 30 (90.9%) | 3 (9.1%) |
| Bachelor's Degree or higher | 58 (52.7%) | 52 (47.3%) |
Occupancy by Age of Householder in Putney
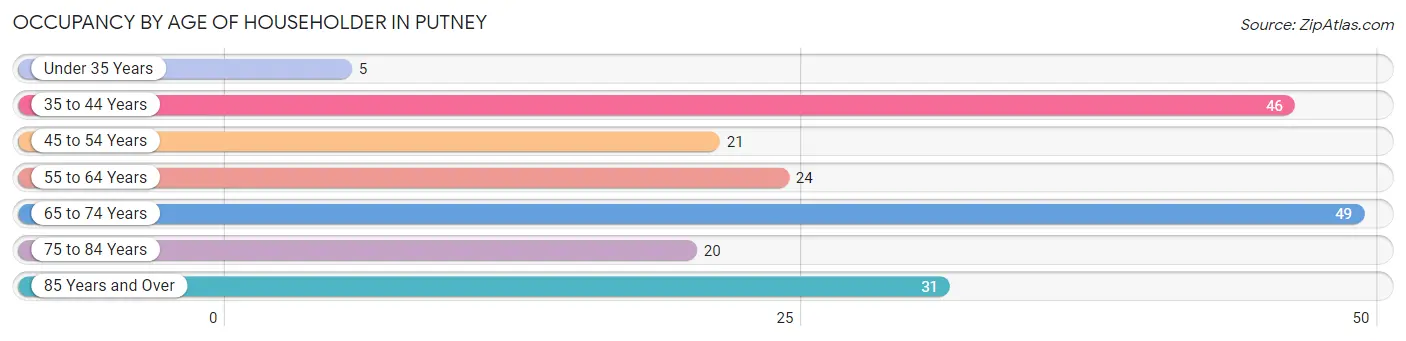
| Age Bracket | # Households | % Households |
| Under 35 Years | 5 | 2.5% |
| 35 to 44 Years | 46 | 23.5% |
| 45 to 54 Years | 21 | 10.7% |
| 55 to 64 Years | 24 | 12.2% |
| 65 to 74 Years | 49 | 25.0% |
| 75 to 84 Years | 20 | 10.2% |
| 85 Years and Over | 31 | 15.8% |
| Total | 196 | 100.0% |
Housing Finances in Putney
Median Income by Occupancy in Putney
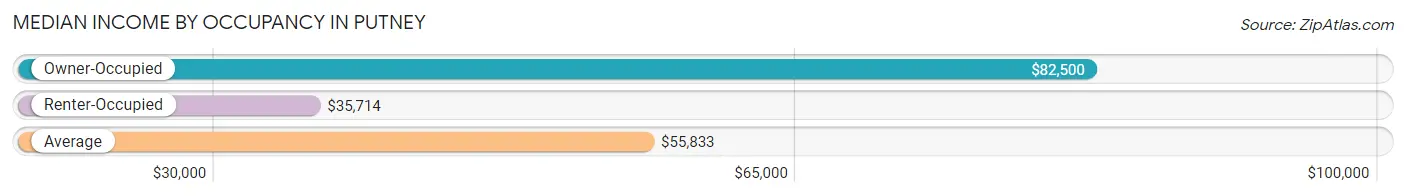
| Occupancy Type | # Households | Median Income |
| Owner-Occupied | 106 (54.1%) | $82,500 |
| Renter-Occupied | 90 (45.9%) | $35,714 |
| Average | 196 (100.0%) | $55,833 |
Occupancy by Householder Income Bracket in Putney
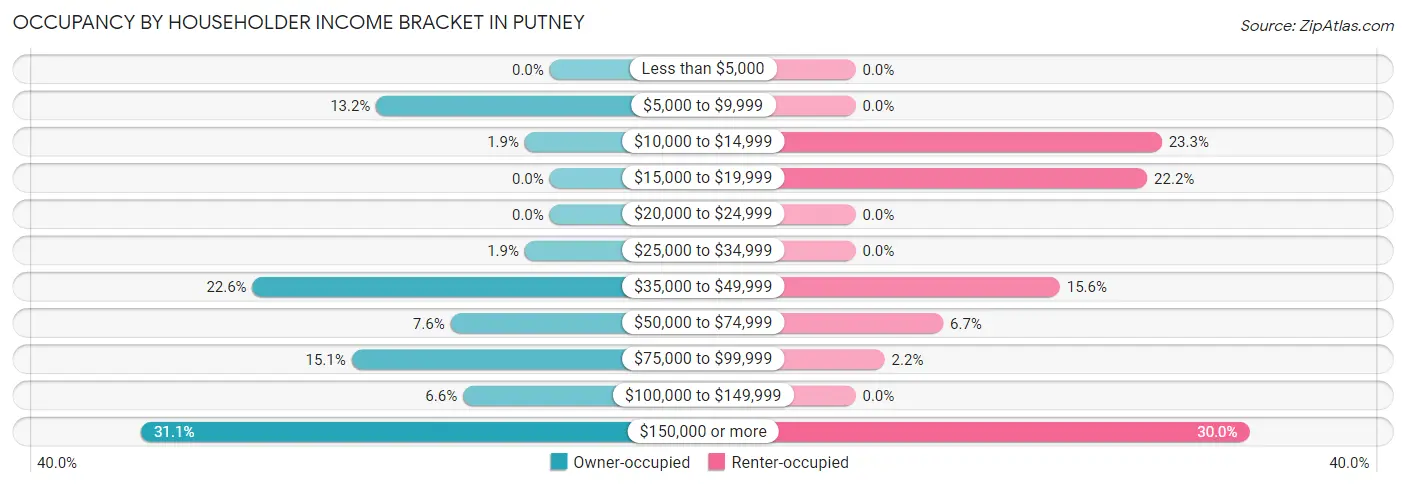
| Income Bracket | Owner-occupied | Renter-occupied |
| Less than $5,000 | 0 (0.0%) | 0 (0.0%) |
| $5,000 to $9,999 | 14 (13.2%) | 0 (0.0%) |
| $10,000 to $14,999 | 2 (1.9%) | 21 (23.3%) |
| $15,000 to $19,999 | 0 (0.0%) | 20 (22.2%) |
| $20,000 to $24,999 | 0 (0.0%) | 0 (0.0%) |
| $25,000 to $34,999 | 2 (1.9%) | 0 (0.0%) |
| $35,000 to $49,999 | 24 (22.6%) | 14 (15.6%) |
| $50,000 to $74,999 | 8 (7.5%) | 6 (6.7%) |
| $75,000 to $99,999 | 16 (15.1%) | 2 (2.2%) |
| $100,000 to $149,999 | 7 (6.6%) | 0 (0.0%) |
| $150,000 or more | 33 (31.1%) | 27 (30.0%) |
| Total | 106 (100.0%) | 90 (100.0%) |
Monthly Housing Cost Tiers in Putney
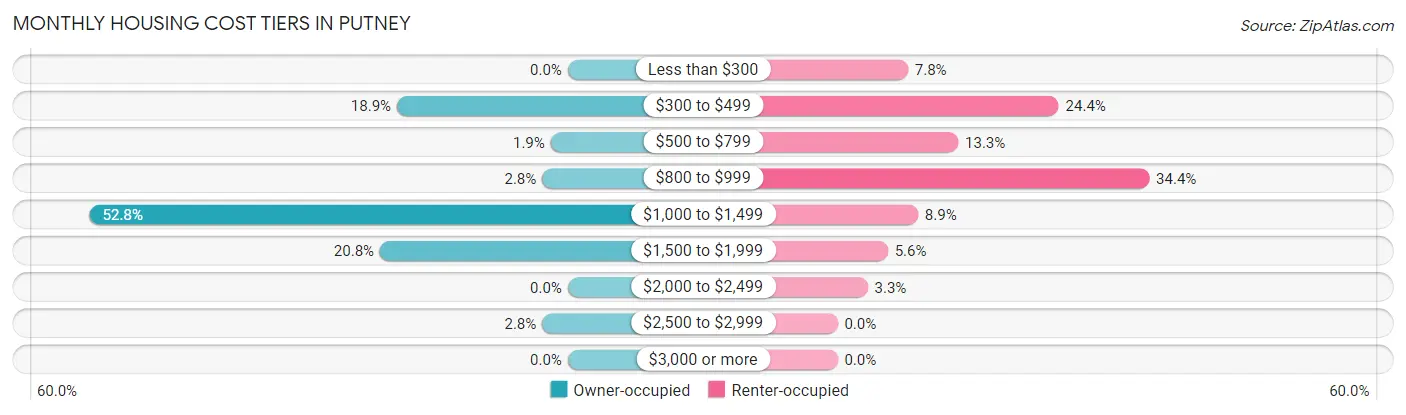
| Monthly Cost | Owner-occupied | Renter-occupied |
| Less than $300 | 0 (0.0%) | 7 (7.8%) |
| $300 to $499 | 20 (18.9%) | 22 (24.4%) |
| $500 to $799 | 2 (1.9%) | 12 (13.3%) |
| $800 to $999 | 3 (2.8%) | 31 (34.4%) |
| $1,000 to $1,499 | 56 (52.8%) | 8 (8.9%) |
| $1,500 to $1,999 | 22 (20.7%) | 5 (5.6%) |
| $2,000 to $2,499 | 0 (0.0%) | 3 (3.3%) |
| $2,500 to $2,999 | 3 (2.8%) | 0 (0.0%) |
| $3,000 or more | 0 (0.0%) | 0 (0.0%) |
| Total | 106 (100.0%) | 90 (100.0%) |
Physical Housing Characteristics in Putney
Housing Structures in Putney
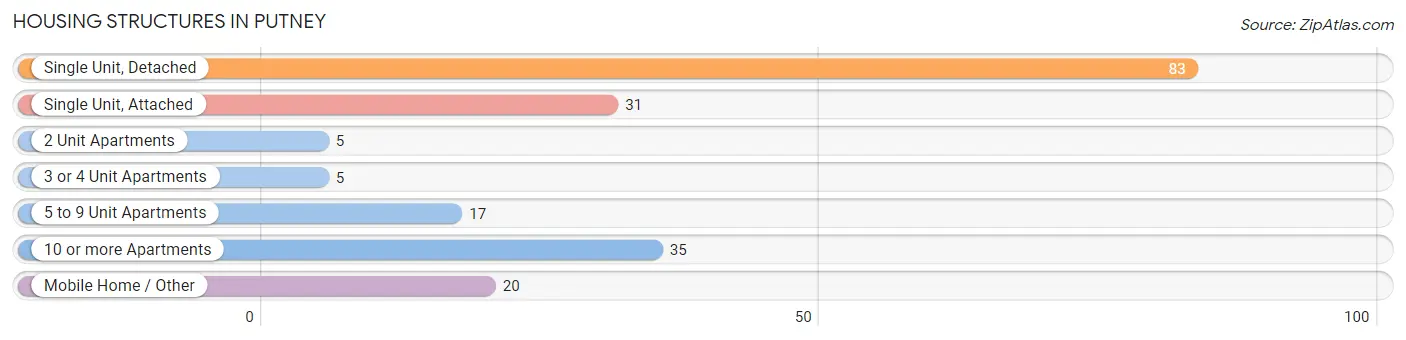
| Structure Type | # Housing Units | % Housing Units |
| Single Unit, Detached | 83 | 42.3% |
| Single Unit, Attached | 31 | 15.8% |
| 2 Unit Apartments | 5 | 2.5% |
| 3 or 4 Unit Apartments | 5 | 2.5% |
| 5 to 9 Unit Apartments | 17 | 8.7% |
| 10 or more Apartments | 35 | 17.9% |
| Mobile Home / Other | 20 | 10.2% |
| Total | 196 | 100.0% |
Housing Structures by Occupancy in Putney
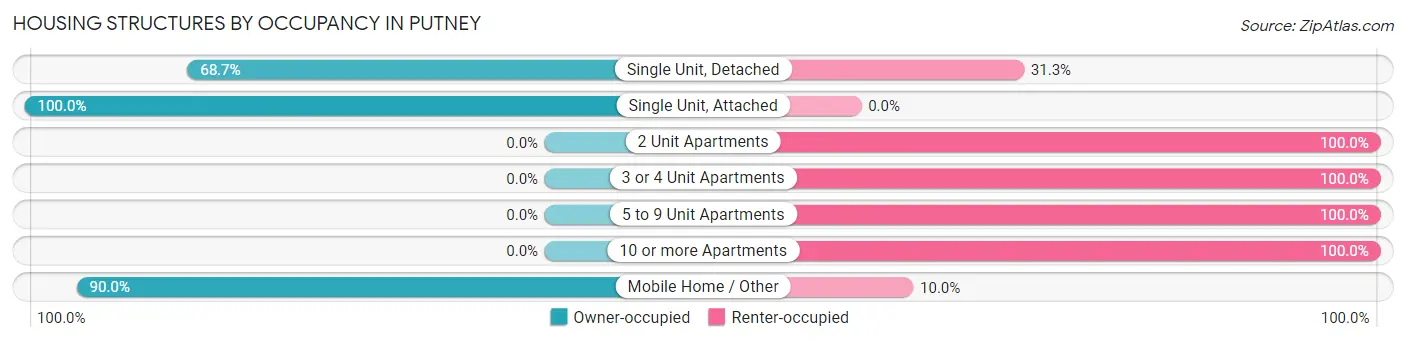
| Structure Type | Owner-occupied | Renter-occupied |
| Single Unit, Detached | 57 (68.7%) | 26 (31.3%) |
| Single Unit, Attached | 31 (100.0%) | 0 (0.0%) |
| 2 Unit Apartments | 0 (0.0%) | 5 (100.0%) |
| 3 or 4 Unit Apartments | 0 (0.0%) | 5 (100.0%) |
| 5 to 9 Unit Apartments | 0 (0.0%) | 17 (100.0%) |
| 10 or more Apartments | 0 (0.0%) | 35 (100.0%) |
| Mobile Home / Other | 18 (90.0%) | 2 (10.0%) |
| Total | 106 (54.1%) | 90 (45.9%) |
Housing Structures by Number of Rooms in Putney
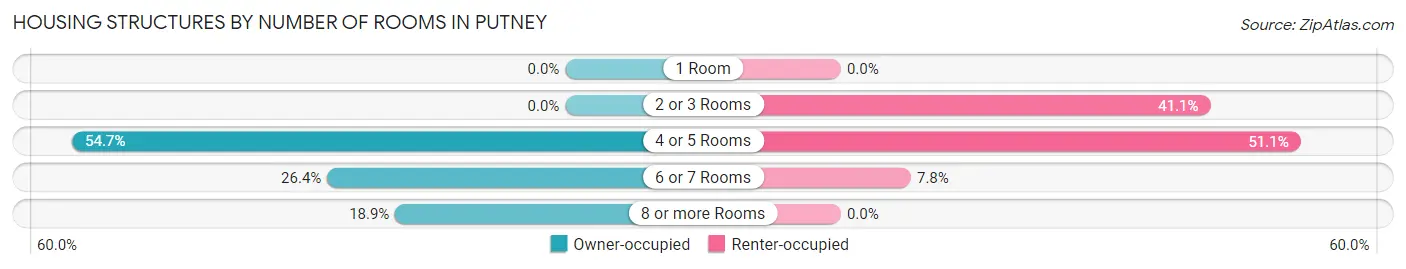
| Number of Rooms | Owner-occupied | Renter-occupied |
| 1 Room | 0 (0.0%) | 0 (0.0%) |
| 2 or 3 Rooms | 0 (0.0%) | 37 (41.1%) |
| 4 or 5 Rooms | 58 (54.7%) | 46 (51.1%) |
| 6 or 7 Rooms | 28 (26.4%) | 7 (7.8%) |
| 8 or more Rooms | 20 (18.9%) | 0 (0.0%) |
| Total | 106 (100.0%) | 90 (100.0%) |
Housing Structure by Heating Type in Putney
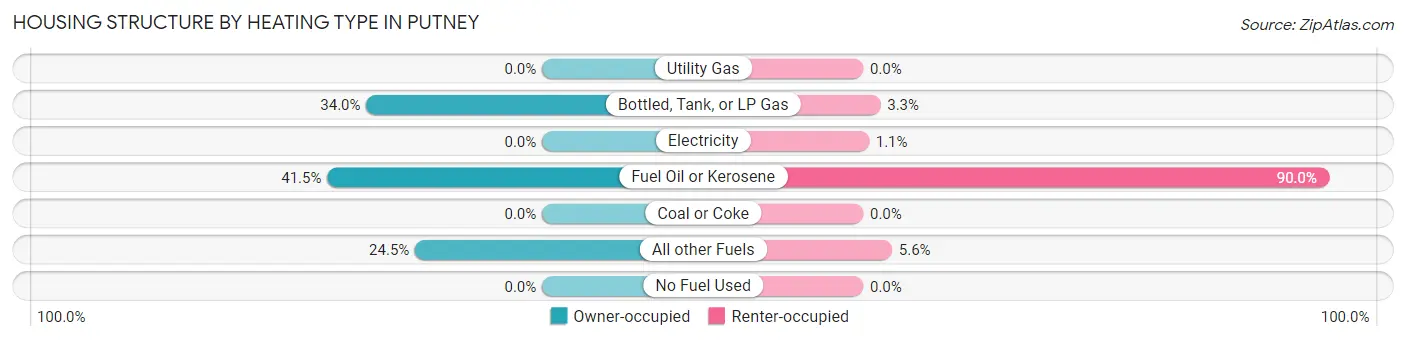
| Heating Type | Owner-occupied | Renter-occupied |
| Utility Gas | 0 (0.0%) | 0 (0.0%) |
| Bottled, Tank, or LP Gas | 36 (34.0%) | 3 (3.3%) |
| Electricity | 0 (0.0%) | 1 (1.1%) |
| Fuel Oil or Kerosene | 44 (41.5%) | 81 (90.0%) |
| Coal or Coke | 0 (0.0%) | 0 (0.0%) |
| All other Fuels | 26 (24.5%) | 5 (5.6%) |
| No Fuel Used | 0 (0.0%) | 0 (0.0%) |
| Total | 106 (100.0%) | 90 (100.0%) |
Household Vehicle Usage in Putney
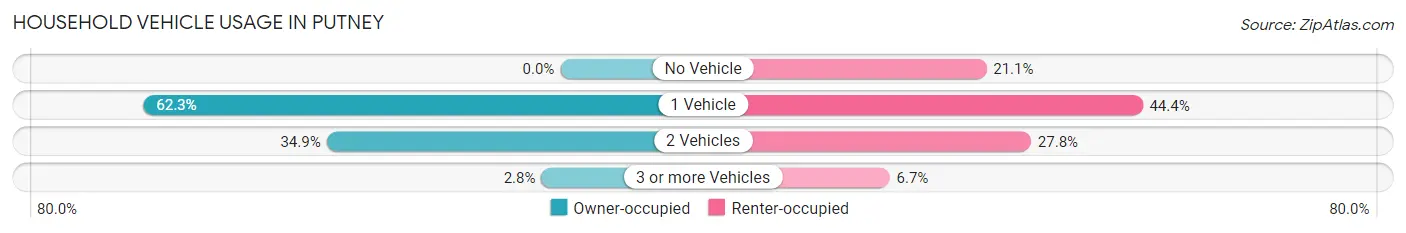
| Vehicles per Household | Owner-occupied | Renter-occupied |
| No Vehicle | 0 (0.0%) | 19 (21.1%) |
| 1 Vehicle | 66 (62.3%) | 40 (44.4%) |
| 2 Vehicles | 37 (34.9%) | 25 (27.8%) |
| 3 or more Vehicles | 3 (2.8%) | 6 (6.7%) |
| Total | 106 (100.0%) | 90 (100.0%) |
Real Estate & Mortgages in Putney
Real Estate and Mortgage Overview in Putney
| Characteristic | Without Mortgage | With Mortgage |
| Housing Units | 73 | 33 |
| Median Property Value | $236,600 | $241,300 |
| Median Household Income | - | - |
| Monthly Housing Costs | $1,037 | $0 |
| Real Estate Taxes | $4,482 | $0 |
Property Value by Mortgage Status in Putney
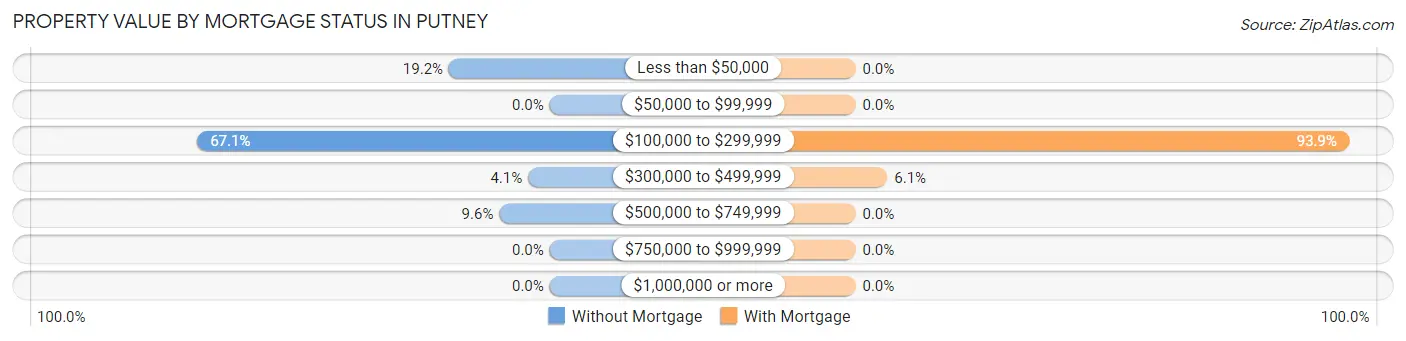
| Property Value | Without Mortgage | With Mortgage |
| Less than $50,000 | 14 (19.2%) | 0 (0.0%) |
| $50,000 to $99,999 | 0 (0.0%) | 0 (0.0%) |
| $100,000 to $299,999 | 49 (67.1%) | 31 (93.9%) |
| $300,000 to $499,999 | 3 (4.1%) | 2 (6.1%) |
| $500,000 to $749,999 | 7 (9.6%) | 0 (0.0%) |
| $750,000 to $999,999 | 0 (0.0%) | 0 (0.0%) |
| $1,000,000 or more | 0 (0.0%) | 0 (0.0%) |
| Total | 73 (100.0%) | 33 (100.0%) |
Household Income by Mortgage Status in Putney
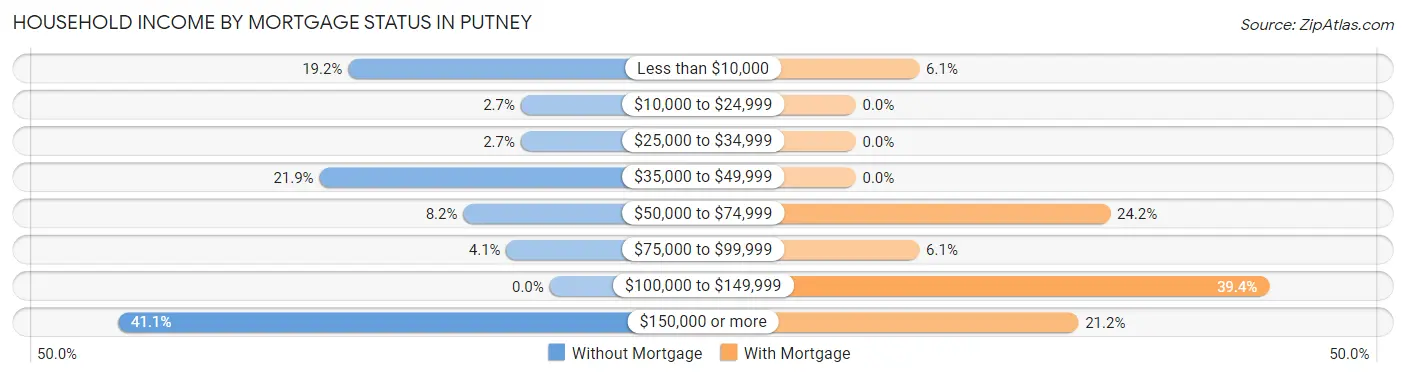
| Household Income | Without Mortgage | With Mortgage |
| Less than $10,000 | 14 (19.2%) | 2 (6.1%) |
| $10,000 to $24,999 | 2 (2.7%) | 0 (0.0%) |
| $25,000 to $34,999 | 2 (2.7%) | 0 (0.0%) |
| $35,000 to $49,999 | 16 (21.9%) | 0 (0.0%) |
| $50,000 to $74,999 | 6 (8.2%) | 8 (24.2%) |
| $75,000 to $99,999 | 3 (4.1%) | 2 (6.1%) |
| $100,000 to $149,999 | 0 (0.0%) | 13 (39.4%) |
| $150,000 or more | 30 (41.1%) | 7 (21.2%) |
| Total | 73 (100.0%) | 33 (100.0%) |
Property Value to Household Income Ratio in Putney
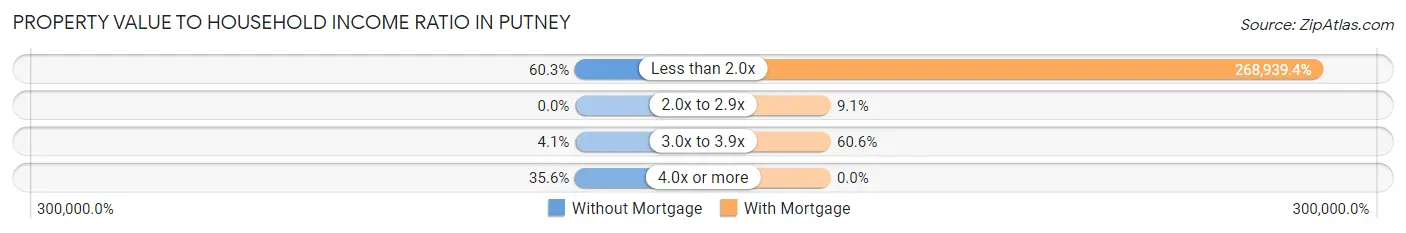
| Value-to-Income Ratio | Without Mortgage | With Mortgage |
| Less than 2.0x | 44 (60.3%) | 88,750 (268,939.4%) |
| 2.0x to 2.9x | 0 (0.0%) | 3 (9.1%) |
| 3.0x to 3.9x | 3 (4.1%) | 20 (60.6%) |
| 4.0x or more | 26 (35.6%) | 0 (0.0%) |
| Total | 73 (100.0%) | 33 (100.0%) |
Real Estate Taxes by Mortgage Status in Putney
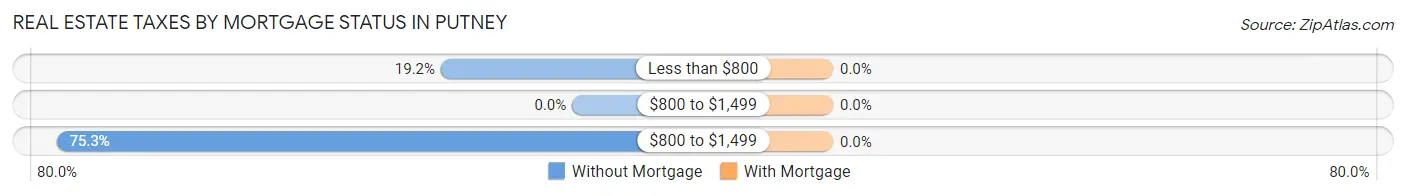
| Property Taxes | Without Mortgage | With Mortgage |
| Less than $800 | 14 (19.2%) | 0 (0.0%) |
| $800 to $1,499 | 0 (0.0%) | 0 (0.0%) |
| $800 to $1,499 | 55 (75.3%) | 0 (0.0%) |
| Total | 73 (100.0%) | 33 (100.0%) |
Health & Disability in Putney
Health Insurance Coverage by Age in Putney

| Age Bracket | With Coverage | Without Coverage |
| Under 6 Years | 0 (0.0%) | 0 (0.0%) |
| 6 to 18 Years | 71 (100.0%) | 0 (0.0%) |
| 19 to 25 Years | 0 (0.0%) | 0 (0.0%) |
| 26 to 34 Years | 6 (100.0%) | 0 (0.0%) |
| 35 to 44 Years | 74 (100.0%) | 0 (0.0%) |
| 45 to 54 Years | 42 (100.0%) | 0 (0.0%) |
| 55 to 64 Years | 44 (100.0%) | 0 (0.0%) |
| 65 to 74 Years | 64 (100.0%) | 0 (0.0%) |
| 75 Years and older | 59 (100.0%) | 0 (0.0%) |
| Total | 360 (100.0%) | 0 (0.0%) |
Health Insurance Coverage by Citizenship Status in Putney
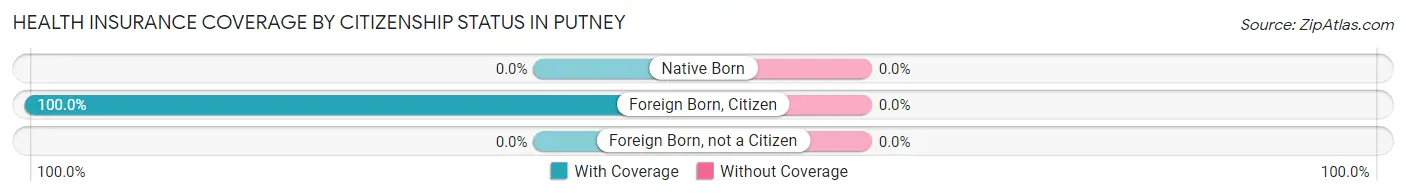
| Citizenship Status | With Coverage | Without Coverage |
| Native Born | 0 (0.0%) | 0 (0.0%) |
| Foreign Born, Citizen | 71 (100.0%) | 0 (0.0%) |
| Foreign Born, not a Citizen | 0 (0.0%) | 0 (0.0%) |
Health Insurance Coverage by Household Income in Putney
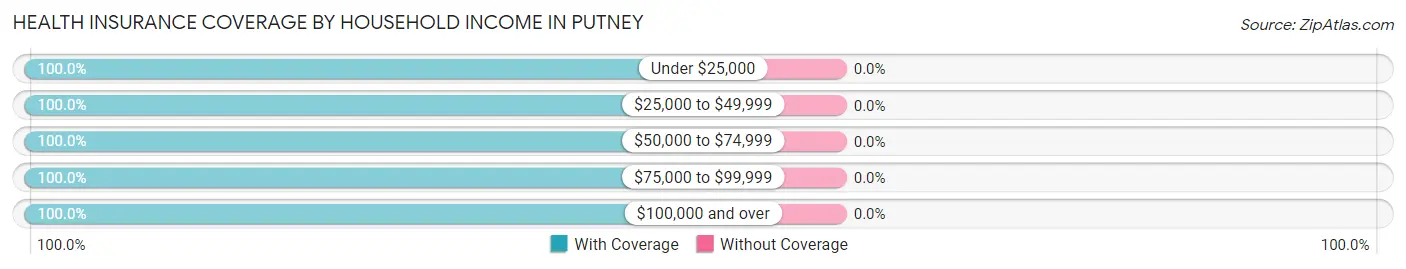
| Household Income | With Coverage | Without Coverage |
| Under $25,000 | 72 (100.0%) | 0 (0.0%) |
| $25,000 to $49,999 | 71 (100.0%) | 0 (0.0%) |
| $50,000 to $74,999 | 37 (100.0%) | 0 (0.0%) |
| $75,000 to $99,999 | 21 (100.0%) | 0 (0.0%) |
| $100,000 and over | 156 (100.0%) | 0 (0.0%) |
Public vs Private Health Insurance Coverage by Age in Putney
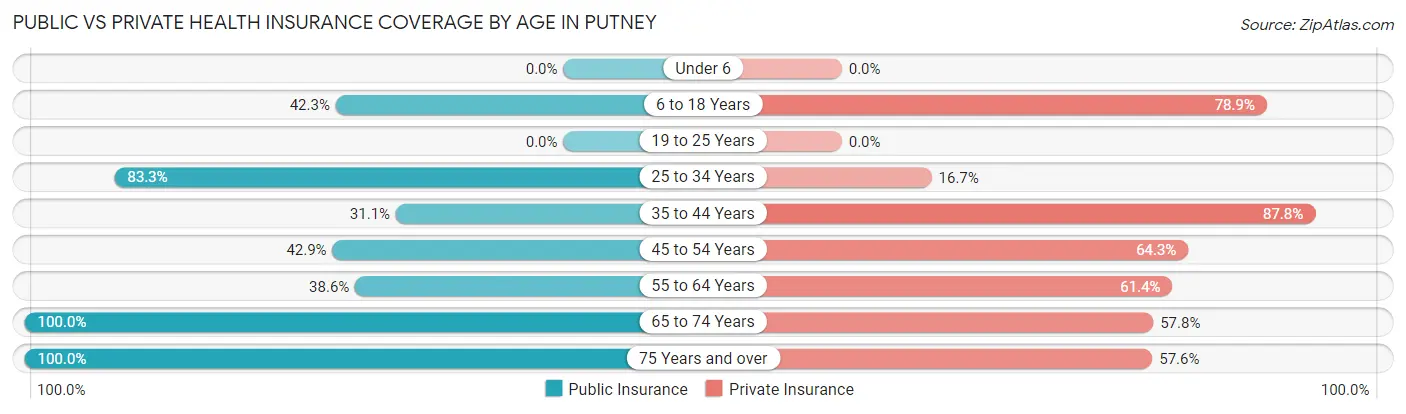
| Age Bracket | Public Insurance | Private Insurance |
| Under 6 | 0 (0.0%) | 0 (0.0%) |
| 6 to 18 Years | 30 (42.2%) | 56 (78.9%) |
| 19 to 25 Years | 0 (0.0%) | 0 (0.0%) |
| 25 to 34 Years | 5 (83.3%) | 1 (16.7%) |
| 35 to 44 Years | 23 (31.1%) | 65 (87.8%) |
| 45 to 54 Years | 18 (42.9%) | 27 (64.3%) |
| 55 to 64 Years | 17 (38.6%) | 27 (61.4%) |
| 65 to 74 Years | 64 (100.0%) | 37 (57.8%) |
| 75 Years and over | 59 (100.0%) | 34 (57.6%) |
| Total | 216 (60.0%) | 247 (68.6%) |
Disability Status by Sex by Age in Putney
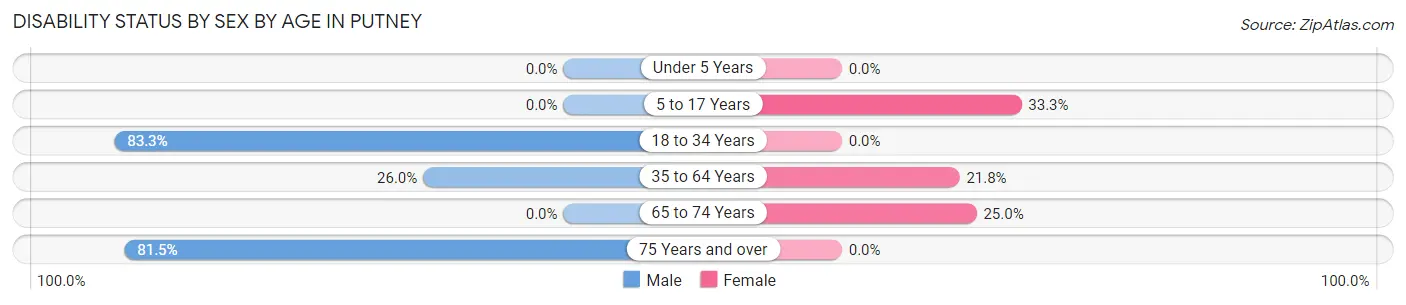
| Age Bracket | Male | Female |
| Under 5 Years | 0 (0.0%) | 0 (0.0%) |
| 5 to 17 Years | 0 (0.0%) | 21 (33.3%) |
| 18 to 34 Years | 5 (83.3%) | 0 (0.0%) |
| 35 to 64 Years | 19 (26.0%) | 19 (21.8%) |
| 65 to 74 Years | 0 (0.0%) | 10 (25.0%) |
| 75 Years and over | 44 (81.5%) | 0 (0.0%) |
Disability Class by Sex by Age in Putney
Disability Class: Hearing Difficulty
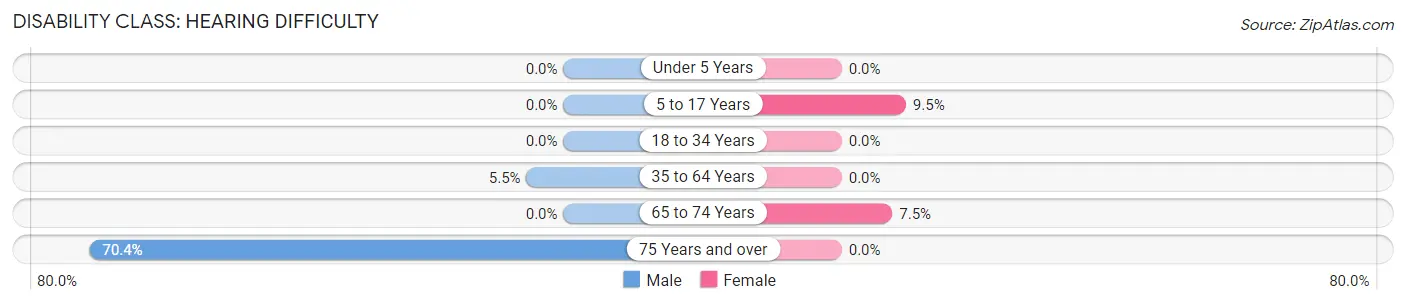
| Age Bracket | Male | Female |
| Under 5 Years | 0 (0.0%) | 0 (0.0%) |
| 5 to 17 Years | 0 (0.0%) | 6 (9.5%) |
| 18 to 34 Years | 0 (0.0%) | 0 (0.0%) |
| 35 to 64 Years | 4 (5.5%) | 0 (0.0%) |
| 65 to 74 Years | 0 (0.0%) | 3 (7.5%) |
| 75 Years and over | 38 (70.4%) | 0 (0.0%) |
Disability Class: Vision Difficulty
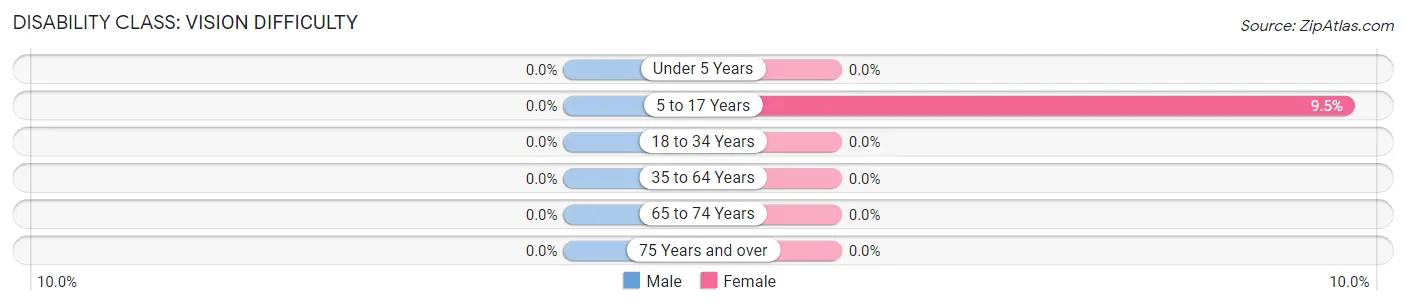
| Age Bracket | Male | Female |
| Under 5 Years | 0 (0.0%) | 0 (0.0%) |
| 5 to 17 Years | 0 (0.0%) | 6 (9.5%) |
| 18 to 34 Years | 0 (0.0%) | 0 (0.0%) |
| 35 to 64 Years | 0 (0.0%) | 0 (0.0%) |
| 65 to 74 Years | 0 (0.0%) | 0 (0.0%) |
| 75 Years and over | 0 (0.0%) | 0 (0.0%) |
Disability Class: Cognitive Difficulty
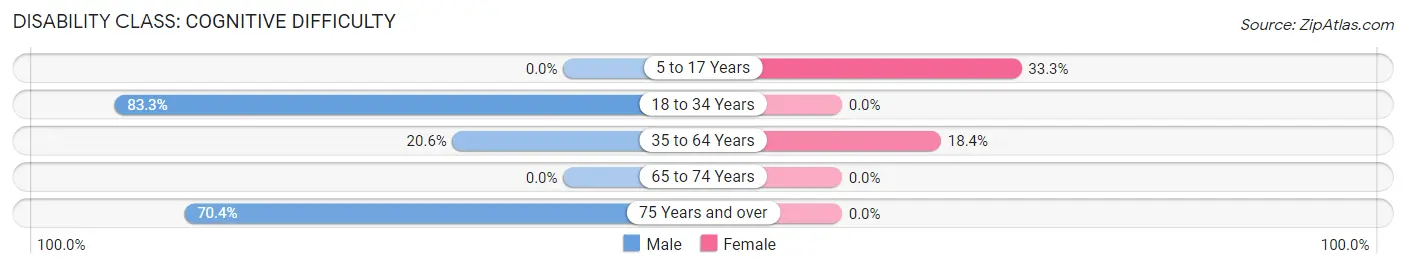
| Age Bracket | Male | Female |
| 5 to 17 Years | 0 (0.0%) | 21 (33.3%) |
| 18 to 34 Years | 5 (83.3%) | 0 (0.0%) |
| 35 to 64 Years | 15 (20.5%) | 16 (18.4%) |
| 65 to 74 Years | 0 (0.0%) | 0 (0.0%) |
| 75 Years and over | 38 (70.4%) | 0 (0.0%) |
Disability Class: Ambulatory Difficulty
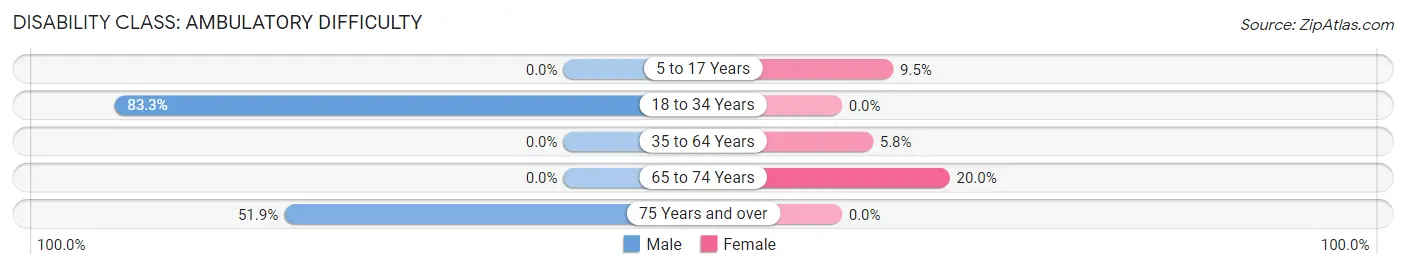
| Age Bracket | Male | Female |
| 5 to 17 Years | 0 (0.0%) | 6 (9.5%) |
| 18 to 34 Years | 5 (83.3%) | 0 (0.0%) |
| 35 to 64 Years | 0 (0.0%) | 5 (5.8%) |
| 65 to 74 Years | 0 (0.0%) | 8 (20.0%) |
| 75 Years and over | 28 (51.8%) | 0 (0.0%) |
Disability Class: Self-Care Difficulty
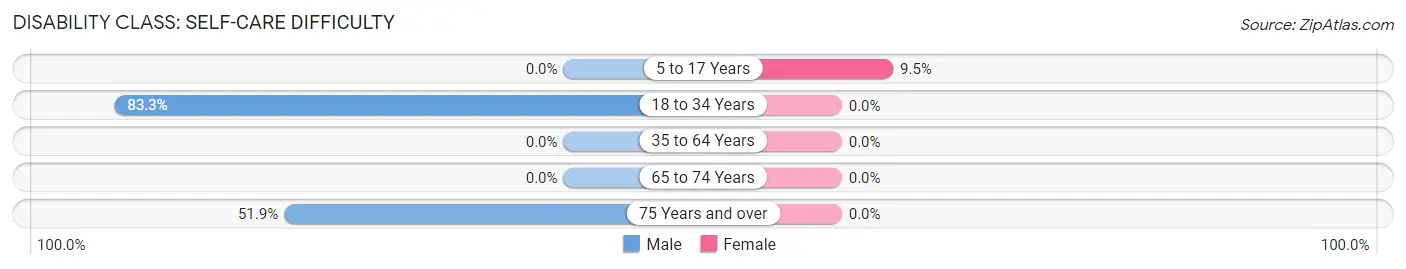
| Age Bracket | Male | Female |
| 5 to 17 Years | 0 (0.0%) | 6 (9.5%) |
| 18 to 34 Years | 5 (83.3%) | 0 (0.0%) |
| 35 to 64 Years | 0 (0.0%) | 0 (0.0%) |
| 65 to 74 Years | 0 (0.0%) | 0 (0.0%) |
| 75 Years and over | 28 (51.8%) | 0 (0.0%) |
Technology Access in Putney
Computing Device Access in Putney
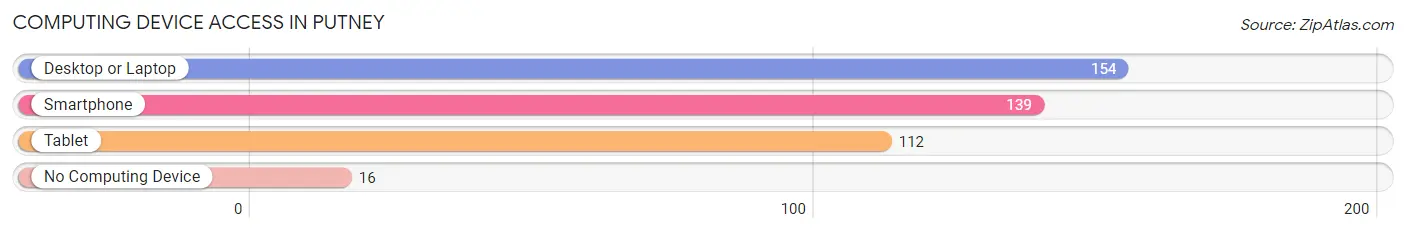
| Device Type | # Households | % Households |
| Desktop or Laptop | 154 | 78.6% |
| Smartphone | 139 | 70.9% |
| Tablet | 112 | 57.1% |
| No Computing Device | 16 | 8.2% |
| Total | 196 | 100.0% |
Internet Access in Putney
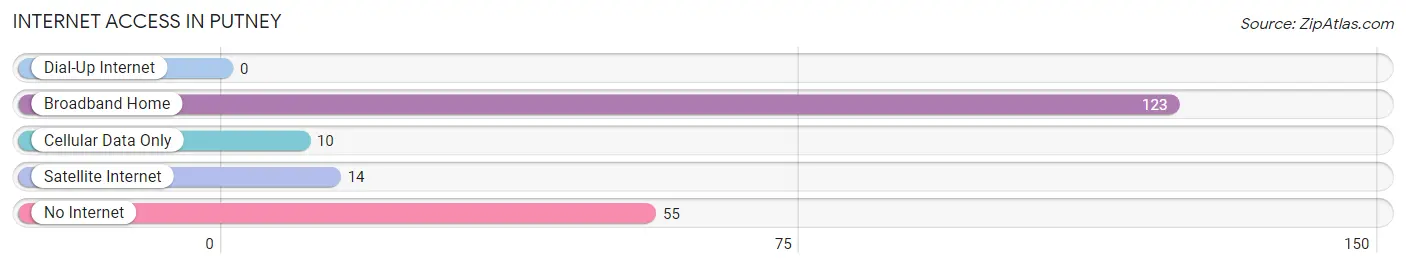
| Internet Type | # Households | % Households |
| Dial-Up Internet | 0 | 0.0% |
| Broadband Home | 123 | 62.8% |
| Cellular Data Only | 10 | 5.1% |
| Satellite Internet | 14 | 7.1% |
| No Internet | 55 | 28.1% |
| Total | 196 | 100.0% |
Putney Summary
Introduction
Putney is a small town located in the southwestern corner of Vermont, United States. It is situated in the Connecticut River Valley, and is bordered by the towns of Dummerston, Westminster, and Brattleboro. Putney is a rural community with a population of 2,717 as of the 2010 census. The town is known for its vibrant arts and culture, and its commitment to sustainable living.
History
Putney was first settled in 1753 by a group of settlers from Massachusetts. The town was named after Putney, England, and was incorporated in 1753. The town was originally an agricultural community, with the main crops being corn, wheat, and hay. In the 19th century, Putney became a center for the woolen industry, with several mills located in the town. The town also had a thriving lumber industry, with several sawmills located in the area.
In the 20th century, Putney became a center for the arts and culture. The Putney School, a progressive boarding school, was founded in 1935, and the Vermont Studio Center, an artist residency program, was founded in 1984. The town is also home to the New England Youth Theatre, which produces plays and musicals for children and young adults.
Geography
Putney is located in the Connecticut River Valley, and is bordered by the towns of Dummerston, Westminster, and Brattleboro. The town is situated on the western bank of the Connecticut River, and is surrounded by rolling hills and forests. The town has a total area of 24.2 square miles, of which 24.1 square miles is land and 0.1 square miles is water.
Economy
Putney’s economy is largely based on tourism and the arts. The town is home to several art galleries, museums, and theaters, as well as the Putney School and the Vermont Studio Center. The town also has several small businesses, including restaurants, cafes, and retail stores.
Demographics
As of the 2010 census, Putney had a population of 2,717. The racial makeup of the town was 94.3% White, 1.2% African American, 0.7% Native American, 0.7% Asian, 0.1% Pacific Islander, 0.7% from other races, and 2.1% from two or more races. The median household income was $50,977, and the median family income was $63,750.
Conclusion
Putney is a small town located in the southwestern corner of Vermont. It is a rural community with a population of 2,717 as of the 2010 census. The town is known for its vibrant arts and culture, and its commitment to sustainable living. Putney’s economy is largely based on tourism and the arts, and the town has a diverse population with a median household income of $50,977.
Common Questions
What is Per Capita Income in Putney?
Per Capita income in Putney is $59,361.
What is the Median Household income in Putney?
Median Household Income in Putney is $55,833.
What is Inequality or Gini Index in Putney?
Inequality or Gini Index in Putney is 0.56.
What is the Total Population of Putney?
Total Population of Putney is 360.
What is the Total Male Population of Putney?
Total Male Population of Putney is 165.
What is the Total Female Population of Putney?
Total Female Population of Putney is 195.
What is the Ratio of Males per 100 Females in Putney?
There are 84.62 Males per 100 Females in Putney.
What is the Ratio of Females per 100 Males in Putney?
There are 118.18 Females per 100 Males in Putney.
What is the Median Population Age in Putney?
Median Population Age in Putney is 54.2 Years.
What is the Average Family Size in Putney
Average Family Size in Putney is 2.7 People.
What is the Average Household Size in Putney
Average Household Size in Putney is 1.8 People.
How Large is the Labor Force in Putney?
There are 130 People in the Labor Forcein in Putney.
What is the Percentage of People in the Labor Force in Putney?
43.8% of People are in the Labor Force in Putney.
What is the Unemployment Rate in Putney?
Unemployment Rate in Putney is 2.3%.