Zip Codes with the Highest Percentage of Households with Income Above $200,000 in Barton, VT
RELATED REPORTS & OPTIONS
Household Income | $200k+
Barton
Compare Zip Codes
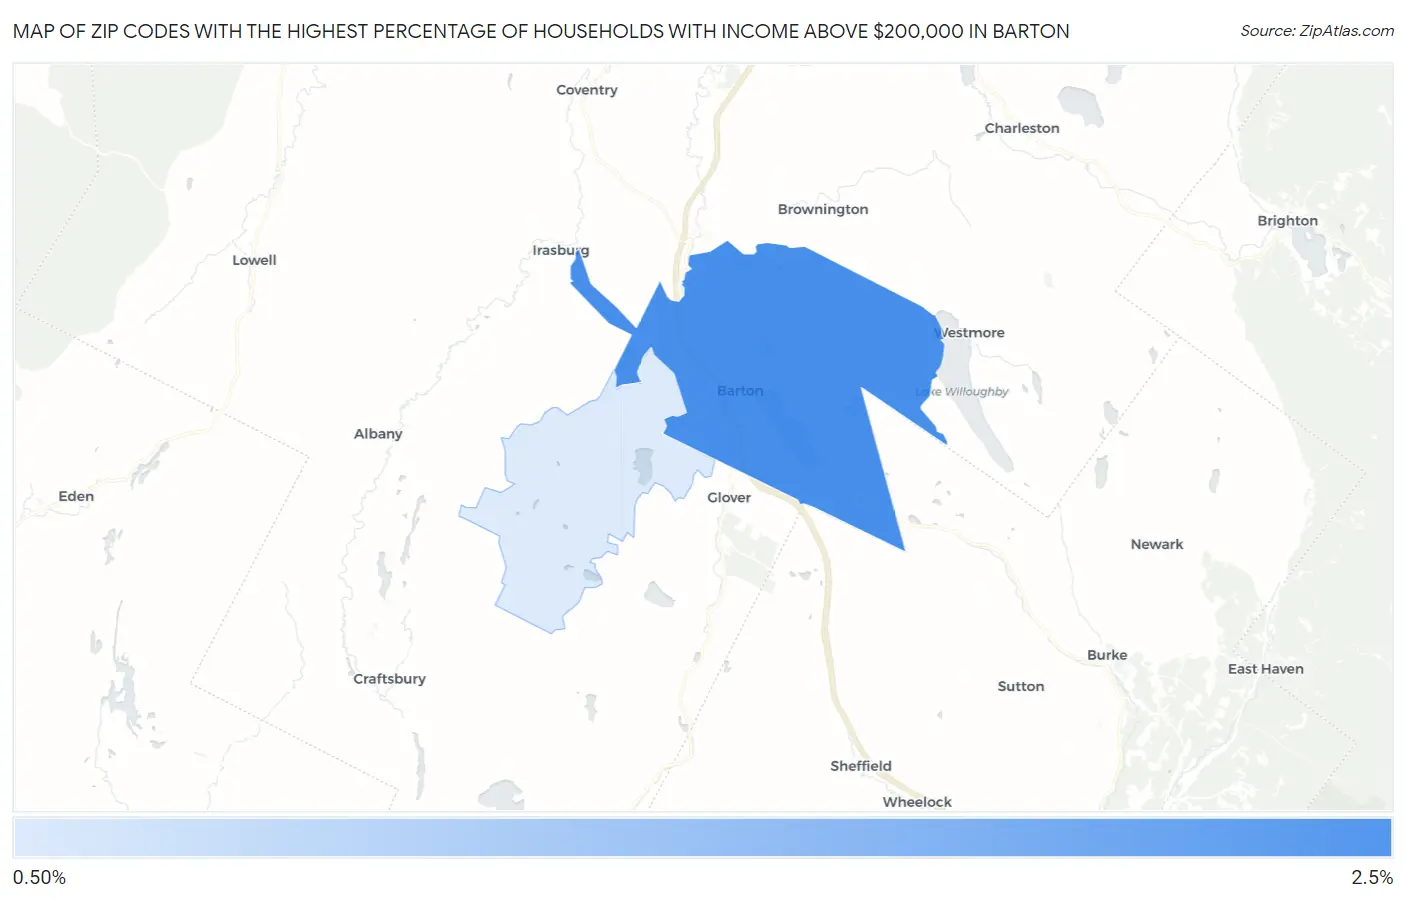
Map of Zip Codes with the Highest Percentage of Households with Income Above $200,000 in Barton
1.5%
2.1%
Zip Codes with the Highest Percentage of Households with Income Above $200,000 in Barton, VT
| Zip Code | Households with Income > $200k | vs State | vs National | |
| 1. | 05822 | 2.1% | 8.9%(-6.80)#207 | 11.4%(-9.30)#23,591 |
| 2. | 05875 | 1.5% | 8.9%(-7.40)#215 | 11.4%(-9.90)#25,262 |
1
Common Questions
What are the Top Zip Codes with the Highest Percentage of Households with Income Above $200,000 in Barton, VT?
Top Zip Codes with the Highest Percentage of Households with Income Above $200,000 in Barton, VT are:
What zip code has the Highest Percentage of Households with Income Above $200,000 in Barton, VT?
05822 has the Highest Percentage of Households with Income Above $200,000 in Barton, VT with 2.1%.
What is the Percentage of Households with Income Above $200,000 in Vermont?
Percentage of Households with Income Above $200,000 in Vermont is 8.9%.
What is the Percentage of Households with Income Above $200,000 in the United States?
Percentage of Households with Income Above $200,000 in the United States is 11.4%.