Dorset, VT Map & Demographics
Dorset Map
Dorset Overview
$57,759
PER CAPITA INCOME
$150,726
AVG FAMILY INCOME
$141,304
AVG HOUSEHOLD INCOME
0.27
INEQUALITY / GINI INDEX
374
TOTAL POPULATION
206
MALE POPULATION
168
FEMALE POPULATION
122.62
MALES / 100 FEMALES
81.55
FEMALES / 100 MALES
52.8
MEDIAN AGE
2.8
AVG FAMILY SIZE
2.2
AVG HOUSEHOLD SIZE
139
LABOR FORCE [ PEOPLE ]
44.1%
PERCENT IN LABOR FORCE
Dorset Zip Codes
Dorset Area Codes
Income in Dorset
Income Overview in Dorset
Per Capita Income in Dorset is $57,759, while median incomes of families and households are $150,726 and $141,304 respectively.
| Characteristic | Number | Measure |
| Per Capita Income | 374 | $57,759 |
| Median Family Income | 114 | $150,726 |
| Mean Family Income | 114 | $157,151 |
| Median Household Income | 170 | $141,304 |
| Mean Household Income | 170 | $124,209 |
| Income Deficit | 114 | $0 |
| Wage / Income Gap (%) | 374 | 0.00% |
| Wage / Income Gap ($) | 374 | 100.00¢ per $1 |
| Gini / Inequality Index | 374 | 0.27 |
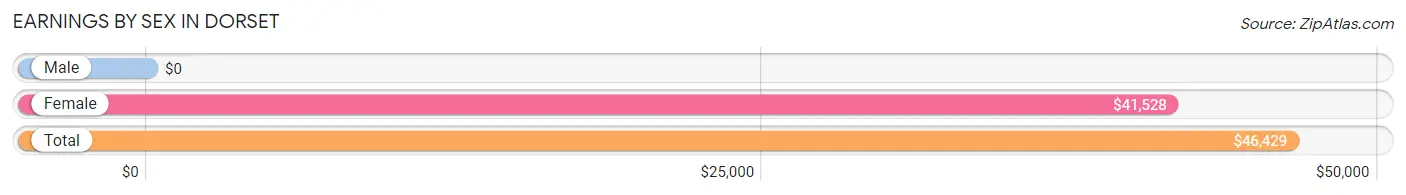
Earnings by Sex in Dorset
| Sex | Number | Average Earnings |
| Male | 113 (76.3%) | $0 |
| Female | 35 (23.6%) | $41,528 |
| Total | 148 (100.0%) | $46,429 |
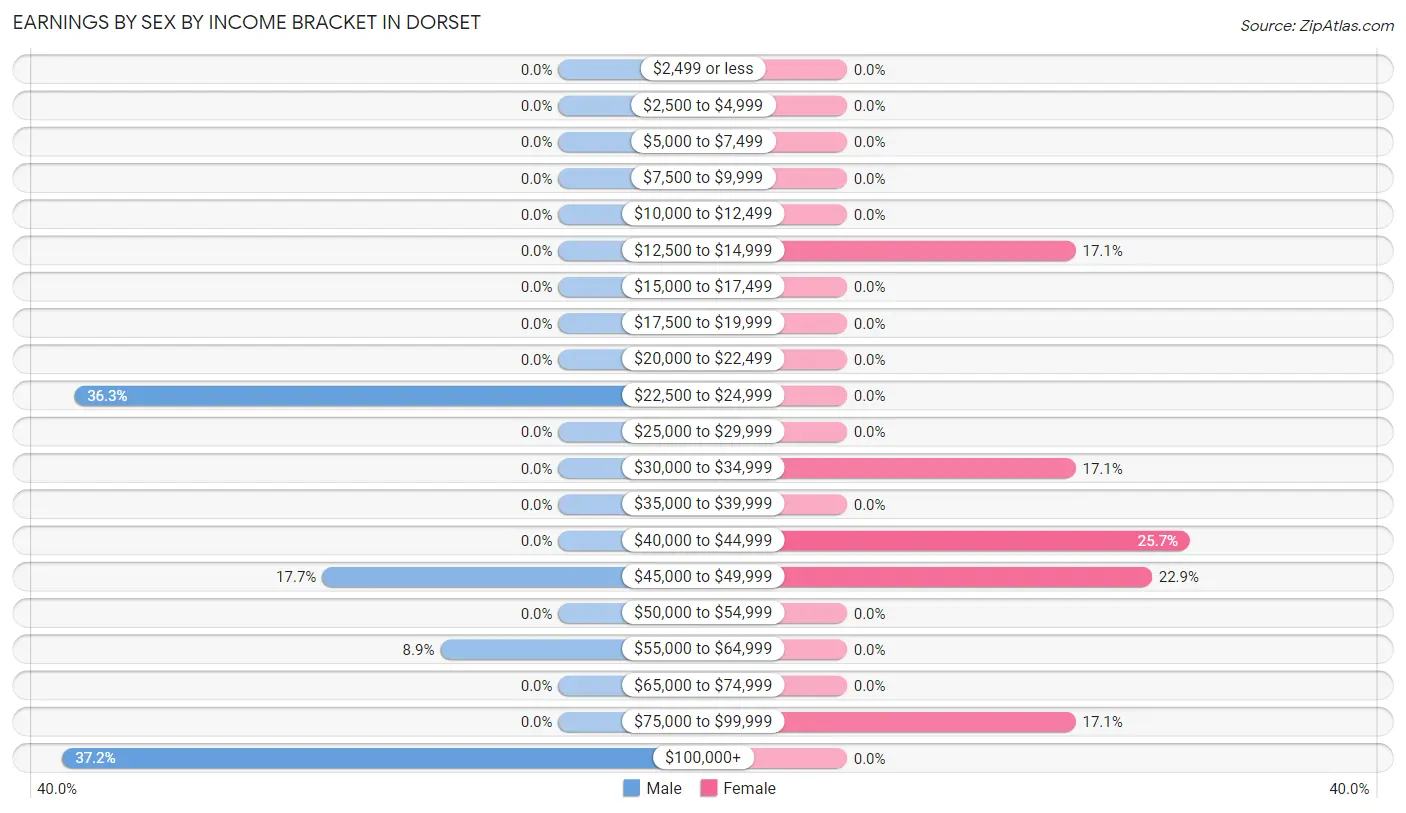
Earnings by Sex by Income Bracket in Dorset
The most common earnings brackets in Dorset are $100,000+ for men (42 | 37.2%) and $40,000 to $44,999 for women (9 | 25.7%).
| Income | Male | Female |
| $2,499 or less | 0 (0.0%) | 0 (0.0%) |
| $2,500 to $4,999 | 0 (0.0%) | 0 (0.0%) |
| $5,000 to $7,499 | 0 (0.0%) | 0 (0.0%) |
| $7,500 to $9,999 | 0 (0.0%) | 0 (0.0%) |
| $10,000 to $12,499 | 0 (0.0%) | 0 (0.0%) |
| $12,500 to $14,999 | 0 (0.0%) | 6 (17.1%) |
| $15,000 to $17,499 | 0 (0.0%) | 0 (0.0%) |
| $17,500 to $19,999 | 0 (0.0%) | 0 (0.0%) |
| $20,000 to $22,499 | 0 (0.0%) | 0 (0.0%) |
| $22,500 to $24,999 | 41 (36.3%) | 0 (0.0%) |
| $25,000 to $29,999 | 0 (0.0%) | 0 (0.0%) |
| $30,000 to $34,999 | 0 (0.0%) | 6 (17.1%) |
| $35,000 to $39,999 | 0 (0.0%) | 0 (0.0%) |
| $40,000 to $44,999 | 0 (0.0%) | 9 (25.7%) |
| $45,000 to $49,999 | 20 (17.7%) | 8 (22.9%) |
| $50,000 to $54,999 | 0 (0.0%) | 0 (0.0%) |
| $55,000 to $64,999 | 10 (8.8%) | 0 (0.0%) |
| $65,000 to $74,999 | 0 (0.0%) | 0 (0.0%) |
| $75,000 to $99,999 | 0 (0.0%) | 6 (17.1%) |
| $100,000+ | 42 (37.2%) | 0 (0.0%) |
| Total | 113 (100.0%) | 35 (100.0%) |
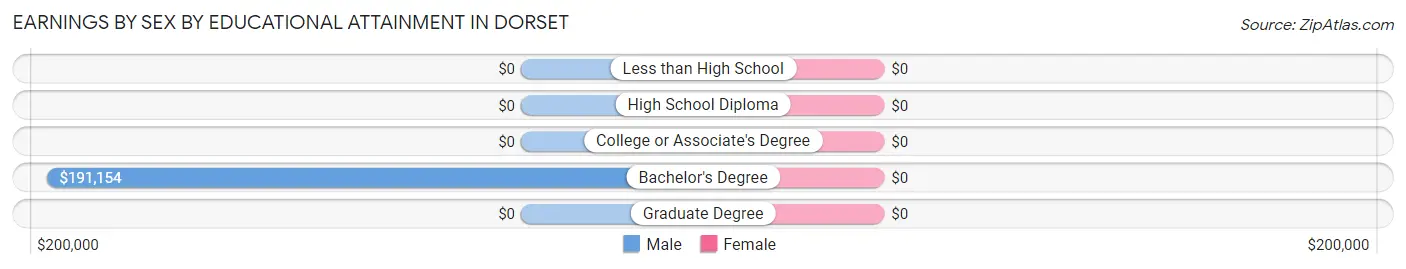
Earnings by Sex by Educational Attainment in Dorset
| Educational Attainment | Male Income | Female Income |
| Less than High School | - | - |
| High School Diploma | - | - |
| College or Associate's Degree | - | - |
| Bachelor's Degree | $191,154 | $0 |
| Graduate Degree | - | - |
| Total | $190,433 | $42,361 |
Family Income in Dorset
Family Income Brackets in Dorset
According to the Dorset family income data, there are 58 families falling into the $150,000 to $199,999 income range, which is the most common income bracket and makes up 50.9% of all families.
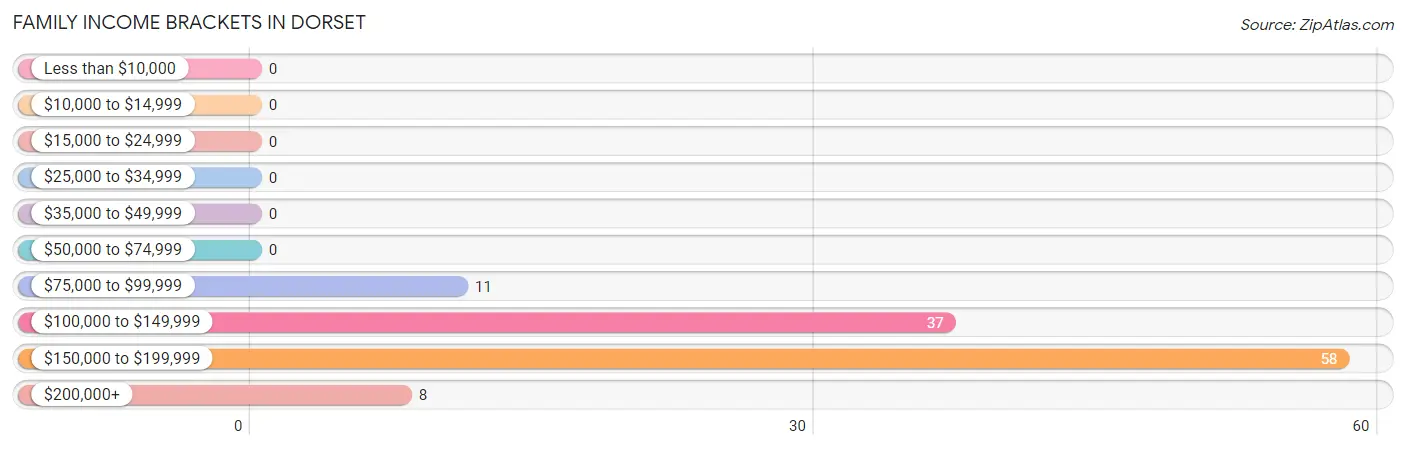
| Income Bracket | # Families | % Families |
| Less than $10,000 | 0 | 0.0% |
| $10,000 to $14,999 | 0 | 0.0% |
| $15,000 to $24,999 | 0 | 0.0% |
| $25,000 to $34,999 | 0 | 0.0% |
| $35,000 to $49,999 | 0 | 0.0% |
| $50,000 to $74,999 | 0 | 0.0% |
| $75,000 to $99,999 | 11 | 9.6% |
| $100,000 to $149,999 | 37 | 32.5% |
| $150,000 to $199,999 | 58 | 50.9% |
| $200,000+ | 8 | 7.0% |
Family Income by Famaliy Size in Dorset
2-person families (73 | 64.0%) account for the highest median family income in Dorset with $150,202 per family, while 2-person families (73 | 64.0%) have the highest median income of $75,101 per family member.
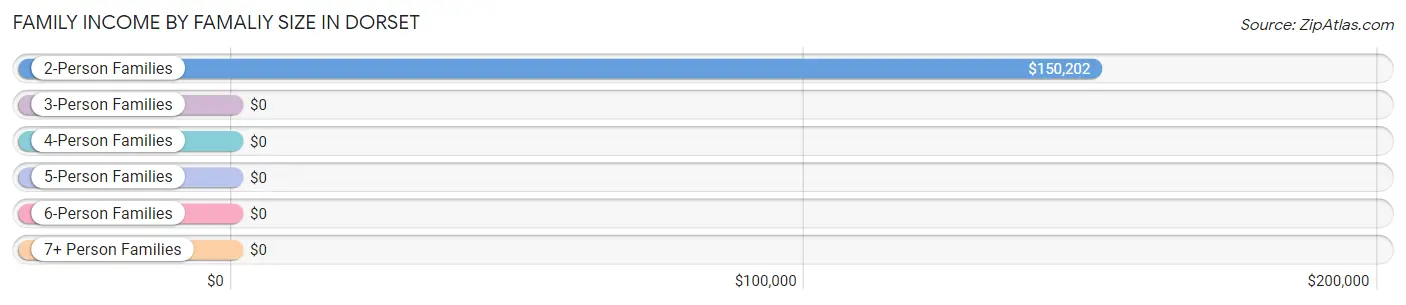
| Income Bracket | # Families | Median Income |
| 2-Person Families | 73 (64.0%) | $150,202 |
| 3-Person Families | 14 (12.3%) | $0 |
| 4-Person Families | 27 (23.7%) | $0 |
| 5-Person Families | 0 (0.0%) | $0 |
| 6-Person Families | 0 (0.0%) | $0 |
| 7+ Person Families | 0 (0.0%) | $0 |
| Total | 114 (100.0%) | $150,726 |
Family Income by Number of Earners in Dorset
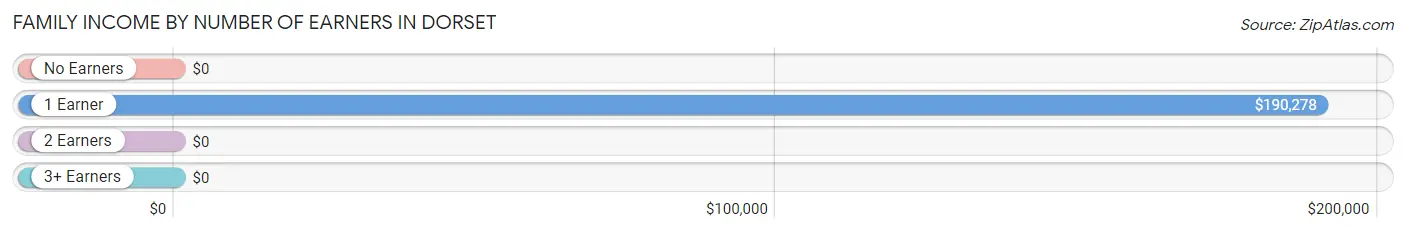
| Number of Earners | # Families | Median Income |
| No Earners | 28 (24.6%) | $0 |
| 1 Earner | 64 (56.1%) | $190,278 |
| 2 Earners | 14 (12.3%) | $0 |
| 3+ Earners | 8 (7.0%) | $0 |
| Total | 114 (100.0%) | $150,726 |
Household Income in Dorset
Household Income Brackets in Dorset
With 58 households falling in the category, the $150,000 to $199,999 income range is the most frequent in Dorset, accounting for 34.1% of all households.
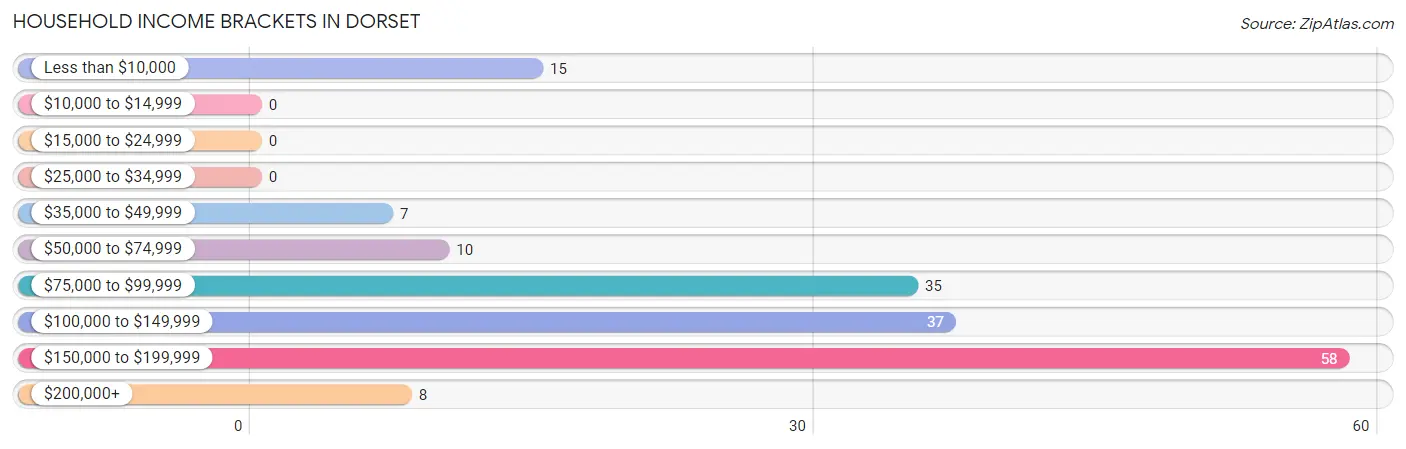
| Income Bracket | # Households | % Households |
| Less than $10,000 | 15 | 8.8% |
| $10,000 to $14,999 | 0 | 0.0% |
| $15,000 to $24,999 | 0 | 0.0% |
| $25,000 to $34,999 | 0 | 0.0% |
| $35,000 to $49,999 | 7 | 4.1% |
| $50,000 to $74,999 | 10 | 5.9% |
| $75,000 to $99,999 | 35 | 20.6% |
| $100,000 to $149,999 | 37 | 21.8% |
| $150,000 to $199,999 | 58 | 34.1% |
| $200,000+ | 8 | 4.7% |
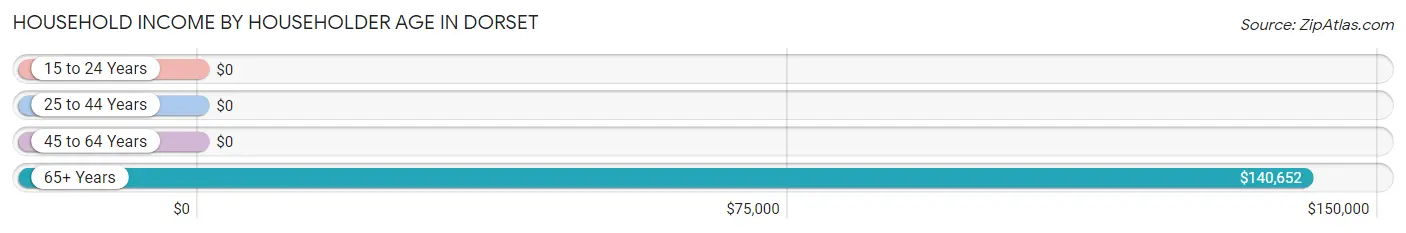
Household Income by Householder Age in Dorset
The median household income in Dorset is $141,304, with the highest median household income of $140,652 found in the 65+ years age bracket for the primary householder. A total of 96 households (56.5%) fall into this category.
| Income Bracket | # Households | Median Income |
| 15 to 24 Years | 0 (0.0%) | $0 |
| 25 to 44 Years | 37 (21.8%) | $0 |
| 45 to 64 Years | 37 (21.8%) | $0 |
| 65+ Years | 96 (56.5%) | $140,652 |
| Total | 170 (100.0%) | $141,304 |
Poverty in Dorset
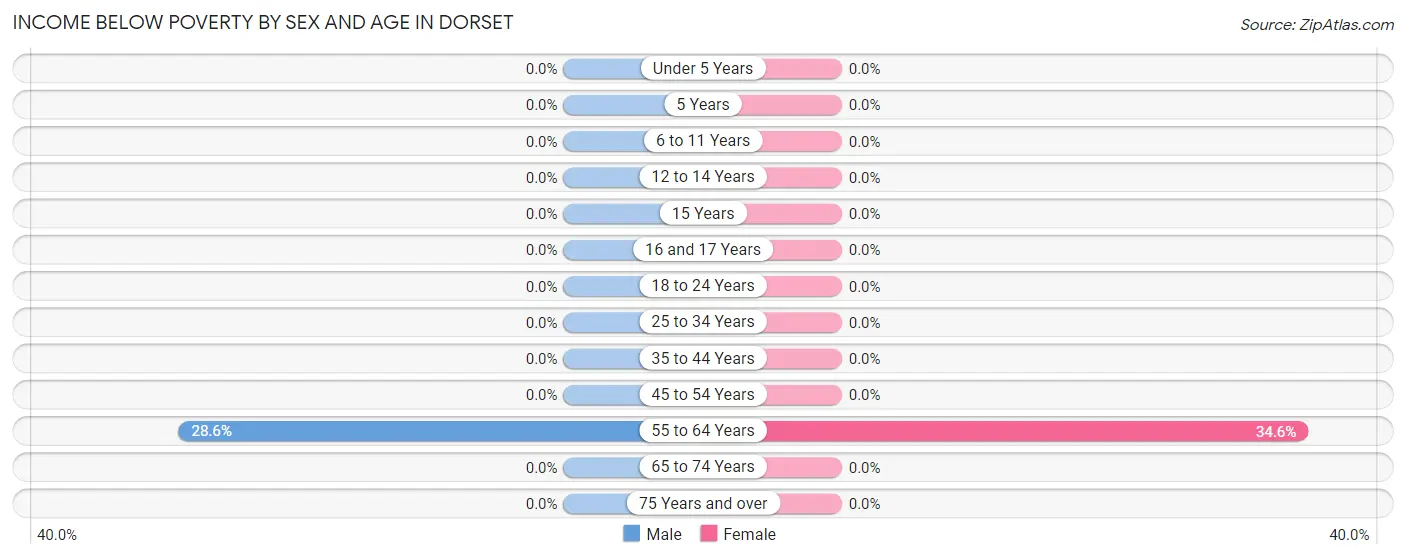
Income Below Poverty by Sex and Age in Dorset
With 2.9% poverty level for males and 5.4% for females among the residents of Dorset, 55 to 64 year old males and 55 to 64 year old females are the most vulnerable to poverty, with 6 males (28.6%) and 9 females (34.6%) in their respective age groups living below the poverty level.
| Age Bracket | Male | Female |
| Under 5 Years | 0 (0.0%) | 0 (0.0%) |
| 5 Years | 0 (0.0%) | 0 (0.0%) |
| 6 to 11 Years | 0 (0.0%) | 0 (0.0%) |
| 12 to 14 Years | 0 (0.0%) | 0 (0.0%) |
| 15 Years | 0 (0.0%) | 0 (0.0%) |
| 16 and 17 Years | 0 (0.0%) | 0 (0.0%) |
| 18 to 24 Years | 0 (0.0%) | 0 (0.0%) |
| 25 to 34 Years | 0 (0.0%) | 0 (0.0%) |
| 35 to 44 Years | 0 (0.0%) | 0 (0.0%) |
| 45 to 54 Years | 0 (0.0%) | 0 (0.0%) |
| 55 to 64 Years | 6 (28.6%) | 9 (34.6%) |
| 65 to 74 Years | 0 (0.0%) | 0 (0.0%) |
| 75 Years and over | 0 (0.0%) | 0 (0.0%) |
| Total | 6 (2.9%) | 9 (5.4%) |
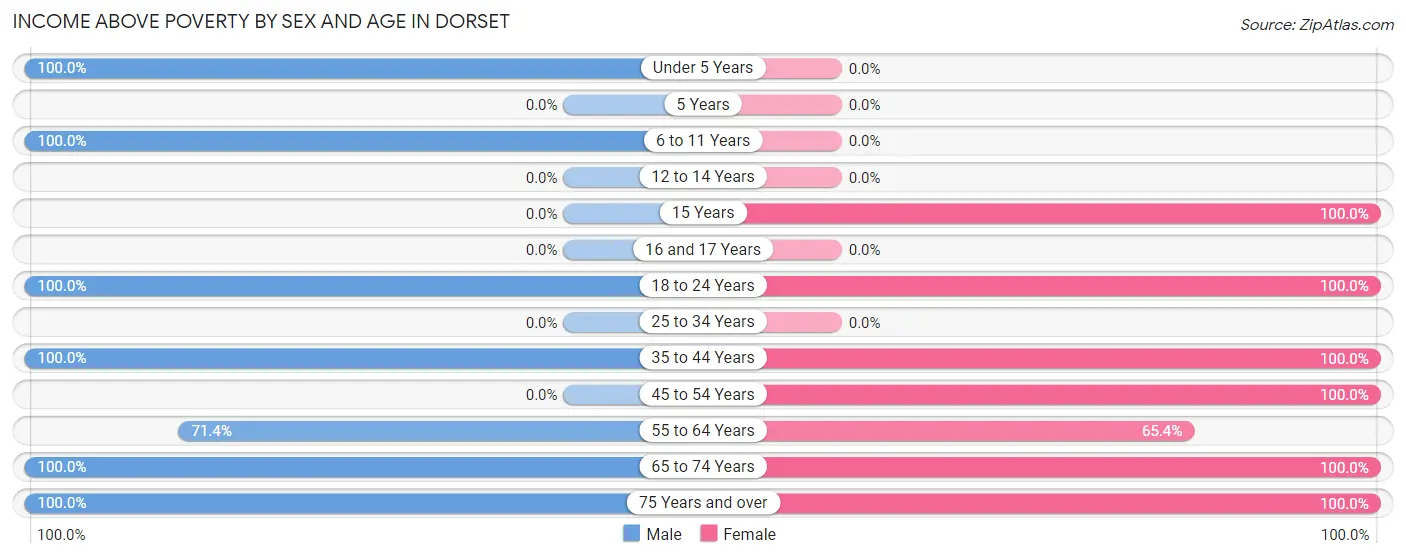
Income Above Poverty by Sex and Age in Dorset
According to the poverty statistics in Dorset, males aged under 5 years and females aged 15 years are the age groups that are most secure financially, with 100.0% of males and 100.0% of females in these age groups living above the poverty line.
| Age Bracket | Male | Female |
| Under 5 Years | 28 (100.0%) | 0 (0.0%) |
| 5 Years | 0 (0.0%) | 0 (0.0%) |
| 6 to 11 Years | 24 (100.0%) | 0 (0.0%) |
| 12 to 14 Years | 0 (0.0%) | 0 (0.0%) |
| 15 Years | 0 (0.0%) | 7 (100.0%) |
| 16 and 17 Years | 0 (0.0%) | 0 (0.0%) |
| 18 to 24 Years | 54 (100.0%) | 6 (100.0%) |
| 25 to 34 Years | 0 (0.0%) | 0 (0.0%) |
| 35 to 44 Years | 36 (100.0%) | 27 (100.0%) |
| 45 to 54 Years | 0 (0.0%) | 6 (100.0%) |
| 55 to 64 Years | 15 (71.4%) | 17 (65.4%) |
| 65 to 74 Years | 14 (100.0%) | 65 (100.0%) |
| 75 Years and over | 29 (100.0%) | 31 (100.0%) |
| Total | 200 (97.1%) | 159 (94.6%) |
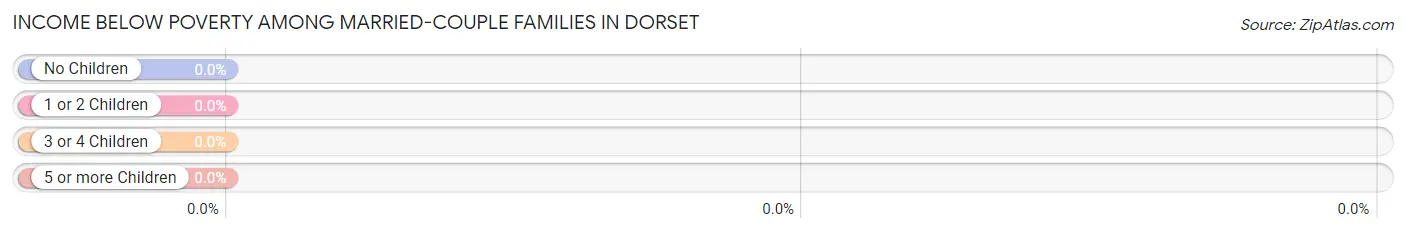
Income Below Poverty Among Married-Couple Families in Dorset
| Children | Above Poverty | Below Poverty |
| No Children | 58 (100.0%) | 0 (0.0%) |
| 1 or 2 Children | 27 (100.0%) | 0 (0.0%) |
| 3 or 4 Children | 0 (0.0%) | 0 (0.0%) |
| 5 or more Children | 0 (0.0%) | 0 (0.0%) |
| Total | 85 (100.0%) | 0 (0.0%) |
Income Below Poverty Among Single-Parent Households in Dorset
| Children | Single Father | Single Mother |
| No Children | 0 (0.0%) | 0 (0.0%) |
| 1 or 2 Children | 0 (0.0%) | 0 (0.0%) |
| 3 or 4 Children | 0 (0.0%) | 0 (0.0%) |
| 5 or more Children | 0 (0.0%) | 0 (0.0%) |
| Total | 0 (0.0%) | 0 (0.0%) |
Income Below Poverty Among Married-Couple vs Single-Parent Households in Dorset
| Children | Married-Couple Families | Single-Parent Households |
| No Children | 0 (0.0%) | 0 (0.0%) |
| 1 or 2 Children | 0 (0.0%) | 0 (0.0%) |
| 3 or 4 Children | 0 (0.0%) | 0 (0.0%) |
| 5 or more Children | 0 (0.0%) | 0 (0.0%) |
| Total | 0 (0.0%) | 0 (0.0%) |
Race in Dorset
The most populous races in Dorset are , and White / Caucasian (374 | 100.0%).
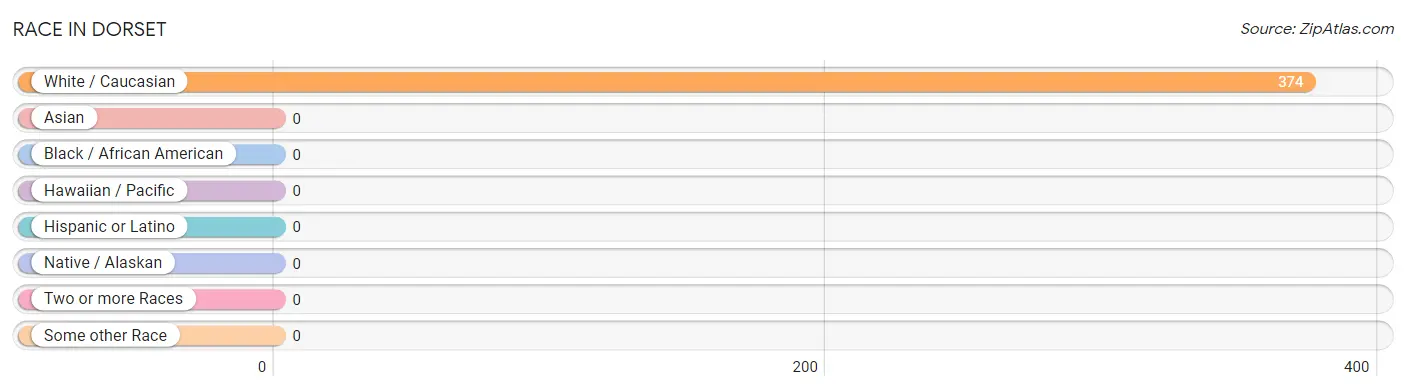
| Race | # Population | % Population |
| Asian | 0 | 0.0% |
| Black / African American | 0 | 0.0% |
| Hawaiian / Pacific | 0 | 0.0% |
| Hispanic or Latino | 0 | 0.0% |
| Native / Alaskan | 0 | 0.0% |
| White / Caucasian | 374 | 100.0% |
| Two or more Races | 0 | 0.0% |
| Some other Race | 0 | 0.0% |
| Total | 374 | 100.0% |
Ancestry in Dorset
The most populous ancestries reported in Dorset are Irish (132 | 35.3%), Italian (52 | 13.9%), English (45 | 12.0%), American (39 | 10.4%), and British (16 | 4.3%), together accounting for 75.9% of all Dorset residents.
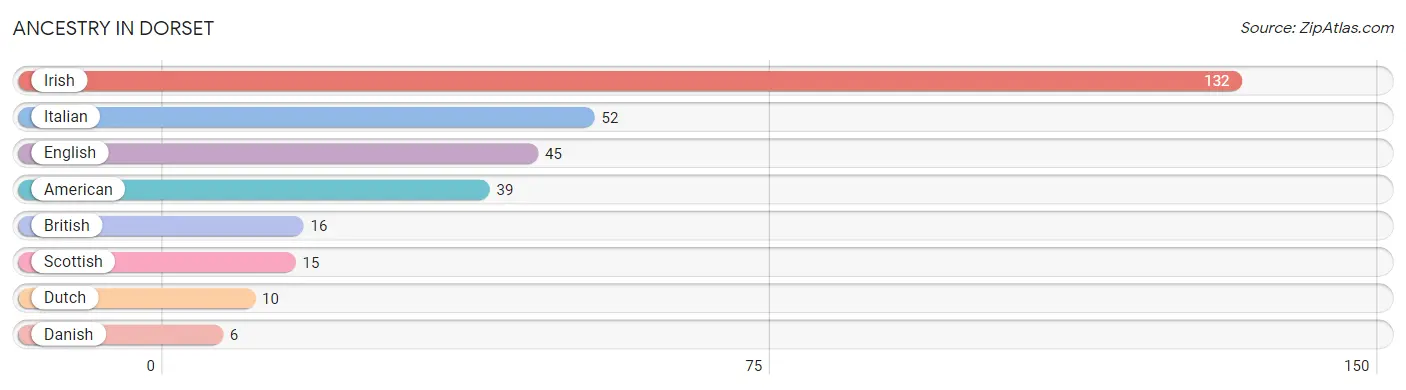
| Ancestry | # Population | % Population |
| American | 39 | 10.4% |
| British | 16 | 4.3% |
| Danish | 6 | 1.6% |
| Dutch | 10 | 2.7% |
| English | 45 | 12.0% |
| Irish | 132 | 35.3% |
| Italian | 52 | 13.9% |
| Scottish | 15 | 4.0% | View All 8 Rows |
Immigrants in Dorset

| Immigration Origin | # Population | % Population | View All 0 Rows |
Sex and Age in Dorset
Sex and Age in Dorset
The most populous age groups in Dorset are 20 to 24 Years (54 | 26.2%) for men and 70 to 74 Years (51 | 30.4%) for women.
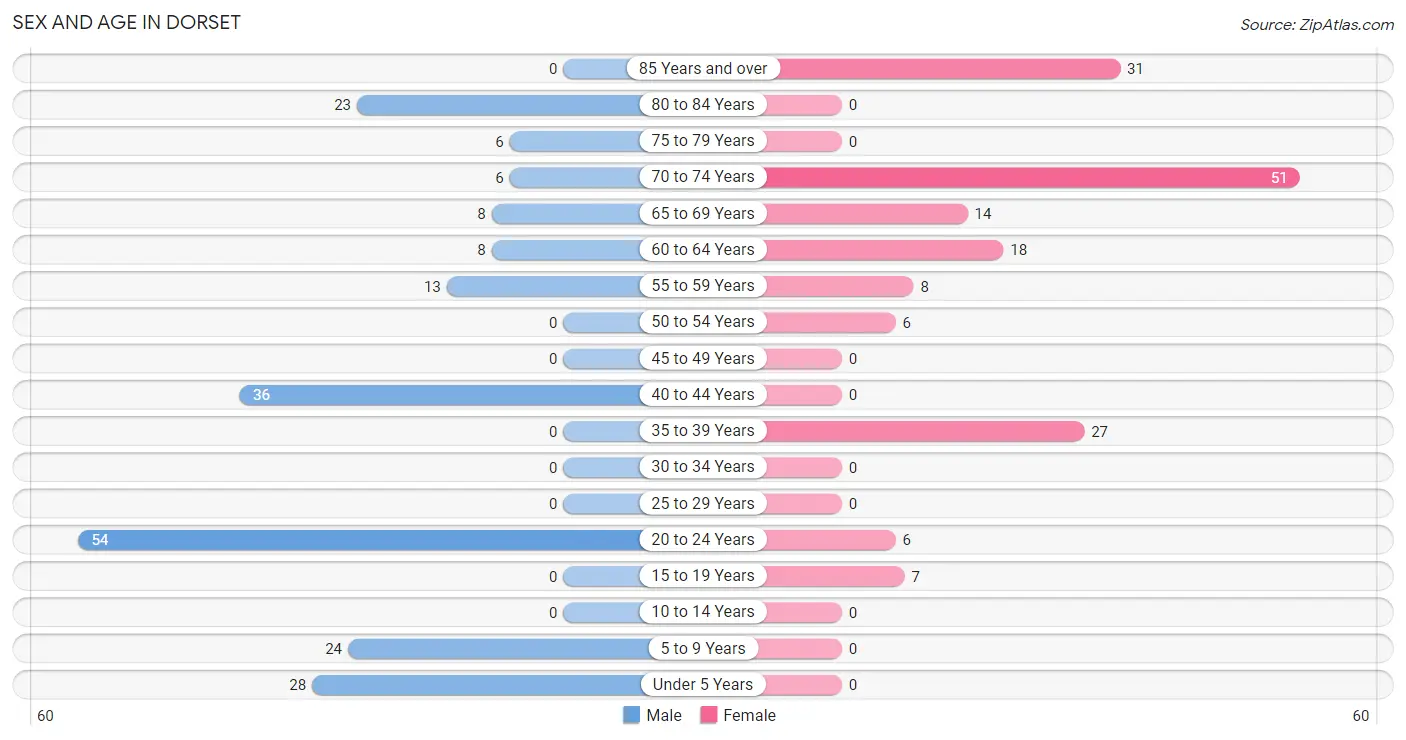
| Age Bracket | Male | Female |
| Under 5 Years | 28 (13.6%) | 0 (0.0%) |
| 5 to 9 Years | 24 (11.7%) | 0 (0.0%) |
| 10 to 14 Years | 0 (0.0%) | 0 (0.0%) |
| 15 to 19 Years | 0 (0.0%) | 7 (4.2%) |
| 20 to 24 Years | 54 (26.2%) | 6 (3.6%) |
| 25 to 29 Years | 0 (0.0%) | 0 (0.0%) |
| 30 to 34 Years | 0 (0.0%) | 0 (0.0%) |
| 35 to 39 Years | 0 (0.0%) | 27 (16.1%) |
| 40 to 44 Years | 36 (17.5%) | 0 (0.0%) |
| 45 to 49 Years | 0 (0.0%) | 0 (0.0%) |
| 50 to 54 Years | 0 (0.0%) | 6 (3.6%) |
| 55 to 59 Years | 13 (6.3%) | 8 (4.8%) |
| 60 to 64 Years | 8 (3.9%) | 18 (10.7%) |
| 65 to 69 Years | 8 (3.9%) | 14 (8.3%) |
| 70 to 74 Years | 6 (2.9%) | 51 (30.4%) |
| 75 to 79 Years | 6 (2.9%) | 0 (0.0%) |
| 80 to 84 Years | 23 (11.2%) | 0 (0.0%) |
| 85 Years and over | 0 (0.0%) | 31 (18.4%) |
| Total | 206 (100.0%) | 168 (100.0%) |
Families and Households in Dorset
Median Family Size in Dorset
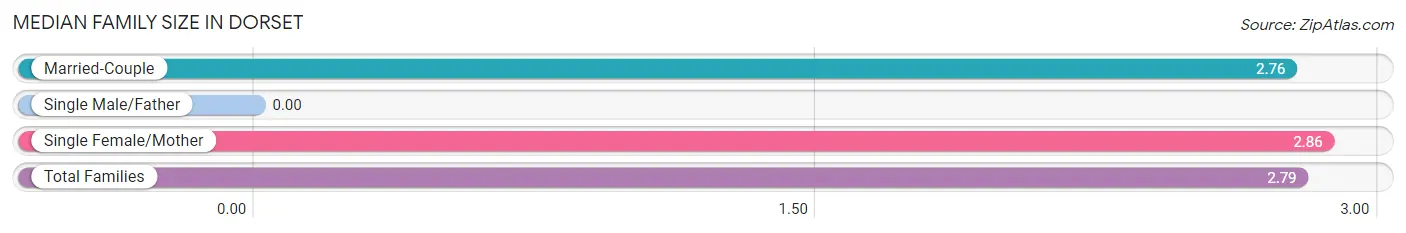
| Family Type | # Families | Family Size |
| Married-Couple | 85 (74.6%) | 2.76 |
| Single Male/Father | 0 (0.0%) | - |
| Single Female/Mother | 29 (25.4%) | 2.86 |
| Total Families | 114 (100.0%) | 2.79 |
Median Household Size in Dorset
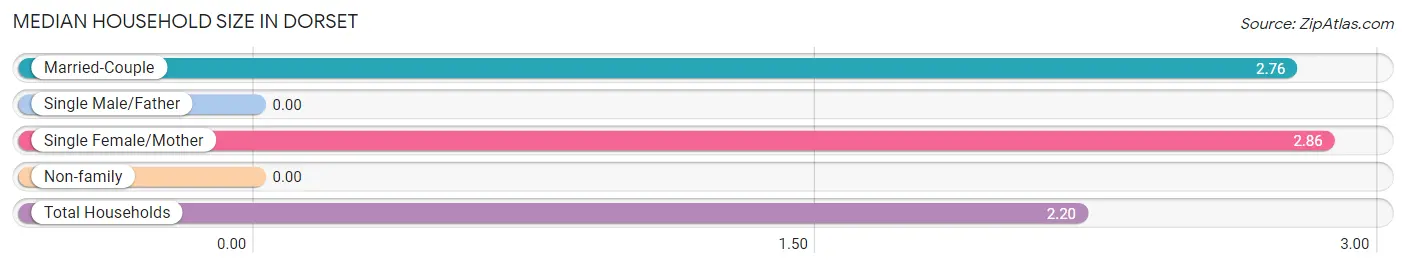
| Household Type | # Households | Household Size |
| Married-Couple | 85 (50.0%) | 2.76 |
| Single Male/Father | 0 (0.0%) | - |
| Single Female/Mother | 29 (17.1%) | 2.86 |
| Non-family | 56 (32.9%) | - |
| Total Households | 170 (100.0%) | 2.20 |
Household Size by Marriage Status in Dorset
Out of a total of 170 households in Dorset, 114 (67.1%) are family households, while 56 (32.9%) are nonfamily households. The most numerous type of family households are 2-person households, comprising 73, and the most common type of nonfamily households are 1-person households, comprising 56.
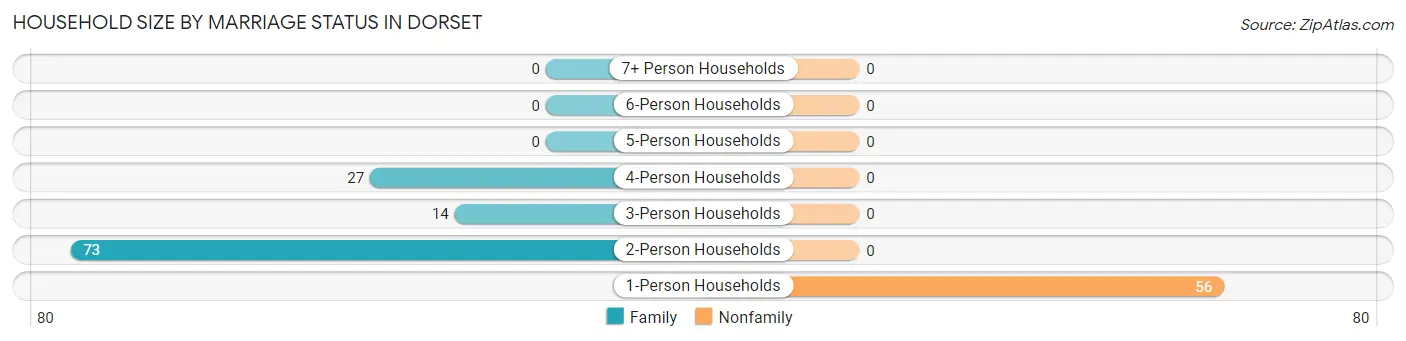
| Household Size | Family Households | Nonfamily Households |
| 1-Person Households | - | 56 (32.9%) |
| 2-Person Households | 73 (42.9%) | 0 (0.0%) |
| 3-Person Households | 14 (8.2%) | 0 (0.0%) |
| 4-Person Households | 27 (15.9%) | 0 (0.0%) |
| 5-Person Households | 0 (0.0%) | 0 (0.0%) |
| 6-Person Households | 0 (0.0%) | 0 (0.0%) |
| 7+ Person Households | 0 (0.0%) | 0 (0.0%) |
| Total | 114 (67.1%) | 56 (32.9%) |
Female Fertility in Dorset
Fertility by Age in Dorset
| Age Bracket | Women with Births | Births / 1,000 Women |
| 15 to 19 years | 0 (0.0%) | 0.0 |
| 20 to 34 years | 0 (0.0%) | 0.0 |
| 35 to 50 years | 0 (0.0%) | 0.0 |
| Total | 0 (0.0%) | 0.0 |
Fertility by Age by Marriage Status in Dorset
| Age Bracket | Married | Unmarried |
| 15 to 19 years | 0 (0.0%) | 0 (0.0%) |
| 20 to 34 years | 0 (0.0%) | 0 (0.0%) |
| 35 to 50 years | 0 (0.0%) | 0 (0.0%) |
| Total | 0 (0.0%) | 0 (0.0%) |
Fertility by Education in Dorset
| Educational Attainment | Women with Births | Births / 1,000 Women |
| Less than High School | 0 (0.0%) | 0.0 |
| High School Diploma | 0 (0.0%) | 0.0 |
| College or Associate's Degree | 0 (0.0%) | 0.0 |
| Bachelor's Degree | 0 (0.0%) | 0.0 |
| Graduate Degree | 0 (0.0%) | 0.0 |
| Total | 0 (0.0%) | 0.0 |
Fertility by Education by Marriage Status in Dorset
| Educational Attainment | Married | Unmarried |
| Less than High School | 0 (0.0%) | 0 (0.0%) |
| High School Diploma | 0 (0.0%) | 0 (0.0%) |
| College or Associate's Degree | 0 (0.0%) | 0 (0.0%) |
| Bachelor's Degree | 0 (0.0%) | 0 (0.0%) |
| Graduate Degree | 0 (0.0%) | 0 (0.0%) |
| Total | 0 (0.0%) | 0 (0.0%) |
Employment Characteristics in Dorset
Employment by Class of Employer in Dorset
Among the 131 employed individuals in Dorset, private company employees (98 | 74.8%), self-employed (incorporated) (14 | 10.7%), and not-for-profit organizations (12 | 9.2%) make up the most common classes of employment.
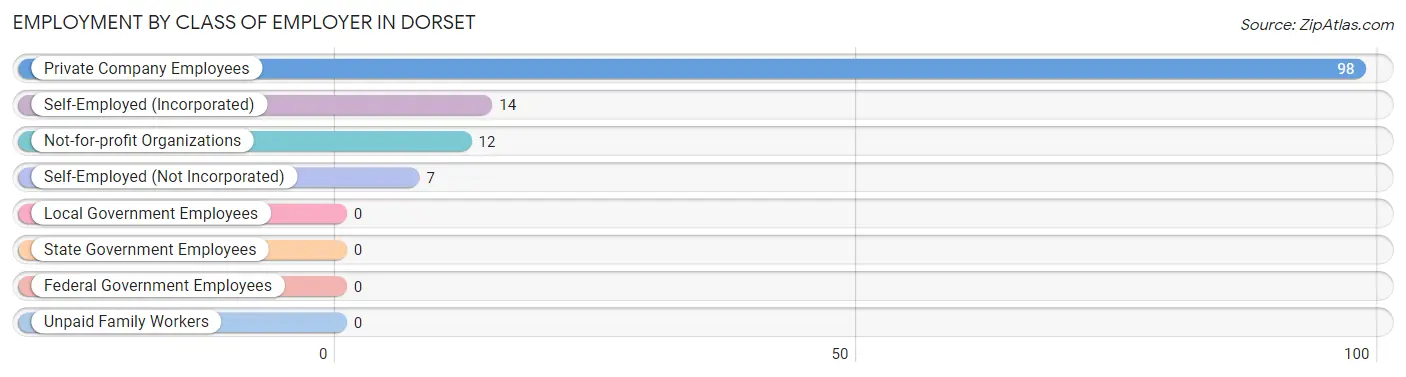
| Employer Class | # Employees | % Employees |
| Private Company Employees | 98 | 74.8% |
| Self-Employed (Incorporated) | 14 | 10.7% |
| Self-Employed (Not Incorporated) | 7 | 5.3% |
| Not-for-profit Organizations | 12 | 9.2% |
| Local Government Employees | 0 | 0.0% |
| State Government Employees | 0 | 0.0% |
| Federal Government Employees | 0 | 0.0% |
| Unpaid Family Workers | 0 | 0.0% |
| Total | 131 | 100.0% |
Employment Status by Age in Dorset
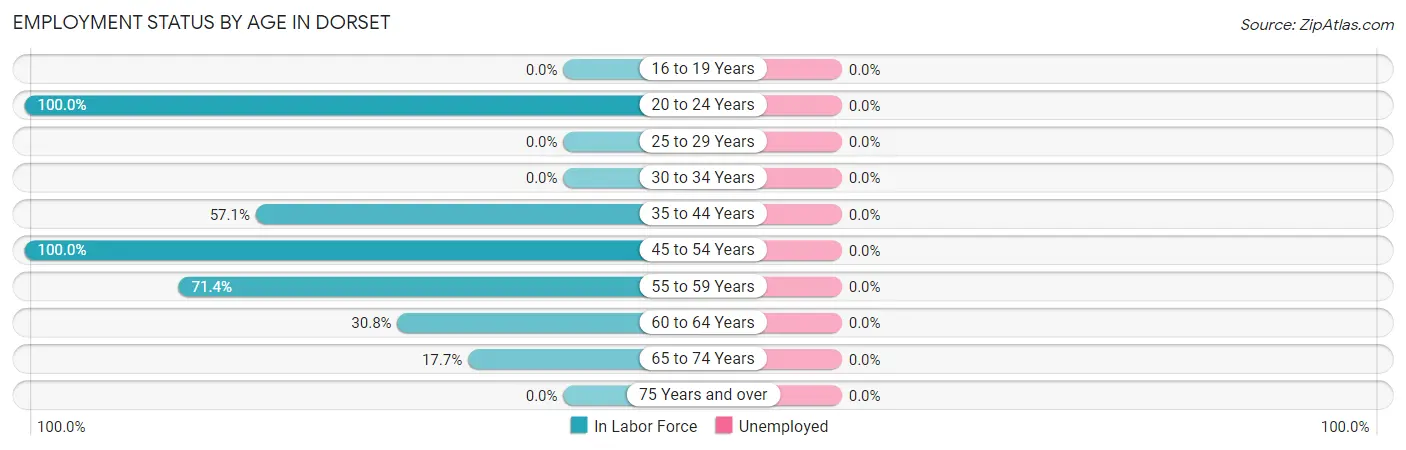
| Age Bracket | In Labor Force | Unemployed |
| 16 to 19 Years | 0 (0.0%) | 0 (0.0%) |
| 20 to 24 Years | 60 (100.0%) | 0 (0.0%) |
| 25 to 29 Years | 0 (0.0%) | 0 (0.0%) |
| 30 to 34 Years | 0 (0.0%) | 0 (0.0%) |
| 35 to 44 Years | 36 (57.1%) | 0 (0.0%) |
| 45 to 54 Years | 6 (100.0%) | 0 (0.0%) |
| 55 to 59 Years | 15 (71.4%) | 0 (0.0%) |
| 60 to 64 Years | 8 (30.8%) | 0 (0.0%) |
| 65 to 74 Years | 14 (17.7%) | 0 (0.0%) |
| 75 Years and over | 0 (0.0%) | 0 (0.0%) |
| Total | 139 (44.1%) | 0 (0.0%) |
Employment Status by Educational Attainment in Dorset
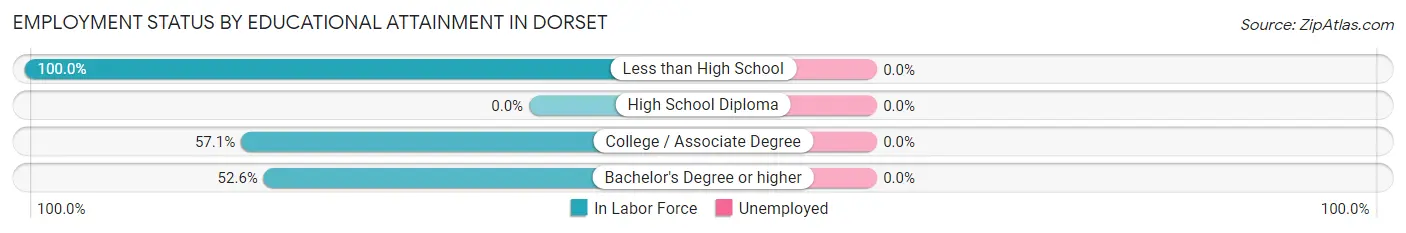
| Educational Attainment | In Labor Force | Unemployed |
| Less than High School | 7 (100.0%) | 0 (0.0%) |
| High School Diploma | 0 (0.0%) | 0 (0.0%) |
| College / Associate Degree | 8 (57.1%) | 0 (0.0%) |
| Bachelor's Degree or higher | 50 (52.6%) | 0 (0.0%) |
| Total | 65 (56.0%) | 0 (0.0%) |
Employment Occupations by Sex in Dorset
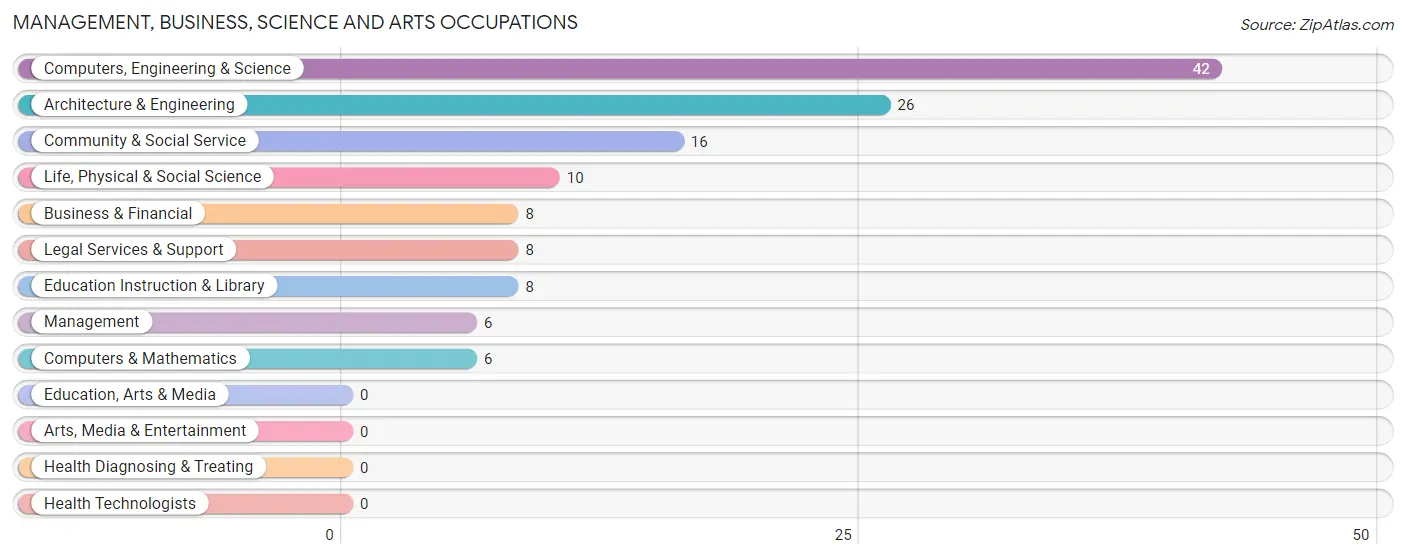
Management, Business, Science and Arts Occupations
The most common Management, Business, Science and Arts occupations in Dorset are Computers, Engineering & Science (42 | 30.2%), Architecture & Engineering (26 | 18.7%), Community & Social Service (16 | 11.5%), Life, Physical & Social Science (10 | 7.2%), and Business & Financial (8 | 5.8%).
Management, Business, Science and Arts Occupations by Sex
Within the Management, Business, Science and Arts occupations in Dorset, the most male-oriented occupations are Business & Financial (100.0%), Architecture & Engineering (100.0%), and Life, Physical & Social Science (100.0%), while the most female-oriented occupations are Management (100.0%), Computers & Mathematics (100.0%), and Legal Services & Support (100.0%).
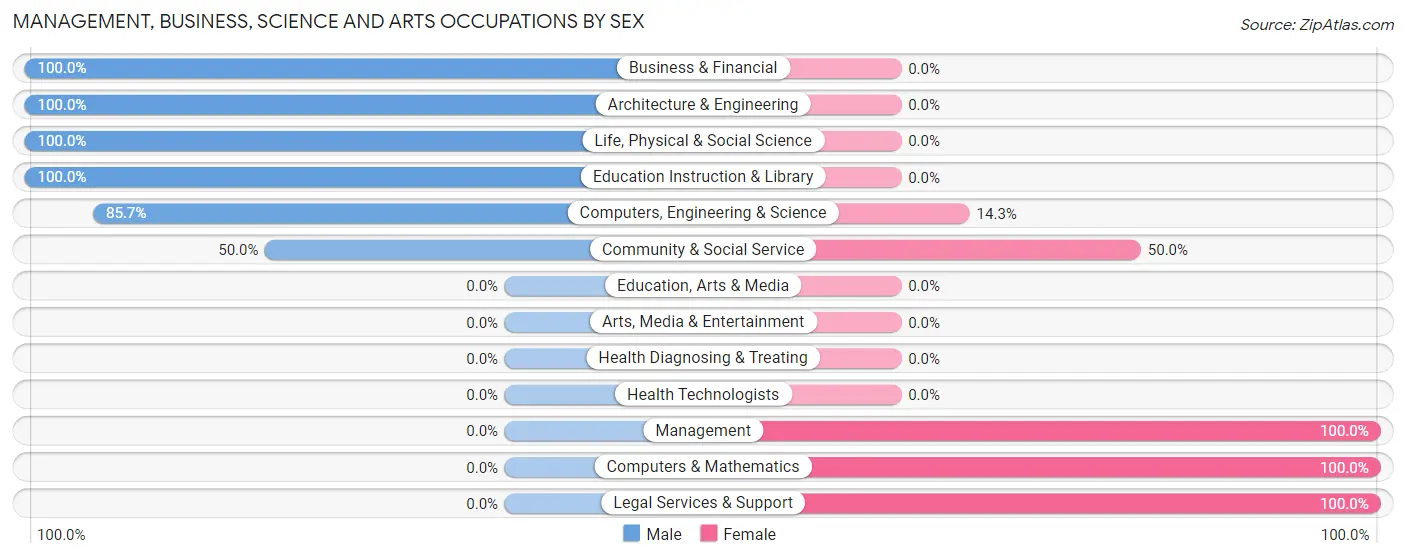
| Occupation | Male | Female |
| Management | 0 (0.0%) | 6 (100.0%) |
| Business & Financial | 8 (100.0%) | 0 (0.0%) |
| Computers, Engineering & Science | 36 (85.7%) | 6 (14.3%) |
| Computers & Mathematics | 0 (0.0%) | 6 (100.0%) |
| Architecture & Engineering | 26 (100.0%) | 0 (0.0%) |
| Life, Physical & Social Science | 10 (100.0%) | 0 (0.0%) |
| Community & Social Service | 8 (50.0%) | 8 (50.0%) |
| Education, Arts & Media | 0 (0.0%) | 0 (0.0%) |
| Legal Services & Support | 0 (0.0%) | 8 (100.0%) |
| Education Instruction & Library | 8 (100.0%) | 0 (0.0%) |
| Arts, Media & Entertainment | 0 (0.0%) | 0 (0.0%) |
| Health Diagnosing & Treating | 0 (0.0%) | 0 (0.0%) |
| Health Technologists | 0 (0.0%) | 0 (0.0%) |
| Total (Category) | 52 (72.2%) | 20 (27.8%) |
| Total (Overall) | 113 (81.3%) | 26 (18.7%) |
Services Occupations
Services Occupations by Sex
| Occupation | Male | Female |
| Healthcare Support | 0 (0.0%) | 0 (0.0%) |
| Security & Protection | 0 (0.0%) | 0 (0.0%) |
| Firefighting & Prevention | 0 (0.0%) | 0 (0.0%) |
| Law Enforcement | 0 (0.0%) | 0 (0.0%) |
| Food Preparation & Serving | 0 (0.0%) | 0 (0.0%) |
| Cleaning & Maintenance | 0 (0.0%) | 0 (0.0%) |
| Personal Care & Service | 0 (0.0%) | 0 (0.0%) |
| Total (Category) | 0 (0.0%) | 0 (0.0%) |
| Total (Overall) | 113 (81.3%) | 26 (18.7%) |
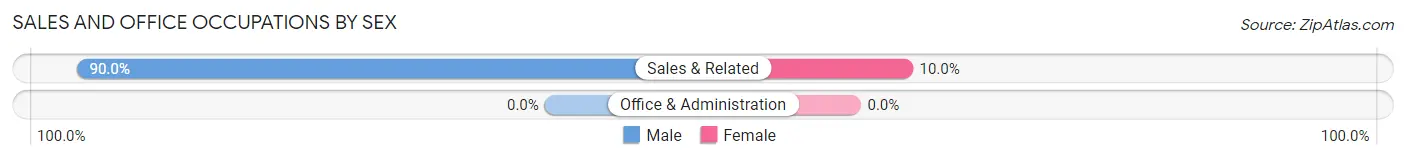
Sales and Office Occupations
The most common Sales and Office occupations in Dorset are , and Sales & Related (60 | 43.2%).
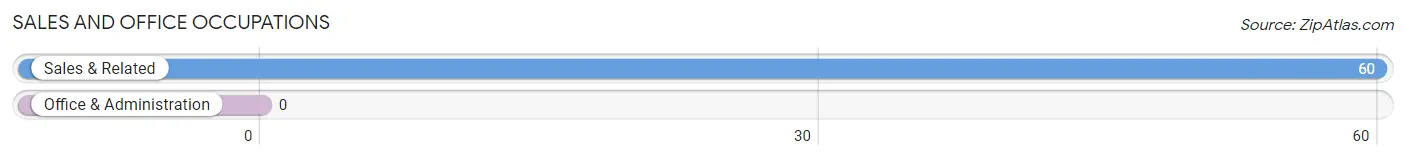
Sales and Office Occupations by Sex
| Occupation | Male | Female |
| Sales & Related | 54 (90.0%) | 6 (10.0%) |
| Office & Administration | 0 (0.0%) | 0 (0.0%) |
| Total (Category) | 54 (90.0%) | 6 (10.0%) |
| Total (Overall) | 113 (81.3%) | 26 (18.7%) |
Natural Resources, Construction and Maintenance Occupations
The most common Natural Resources, Construction and Maintenance occupations in Dorset are , and Construction & Extraction (7 | 5.0%).
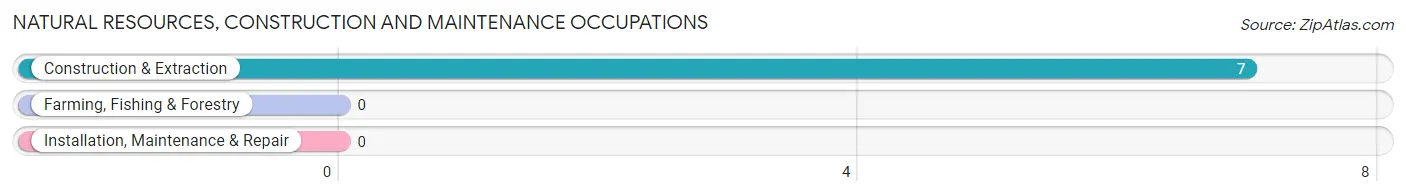
Natural Resources, Construction and Maintenance Occupations by Sex
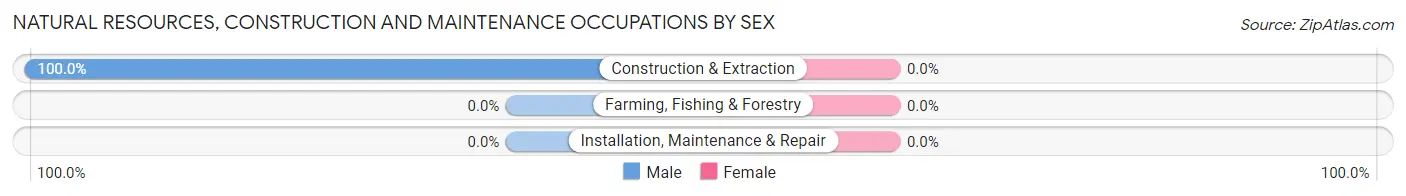
| Occupation | Male | Female |
| Farming, Fishing & Forestry | 0 (0.0%) | 0 (0.0%) |
| Construction & Extraction | 7 (100.0%) | 0 (0.0%) |
| Installation, Maintenance & Repair | 0 (0.0%) | 0 (0.0%) |
| Total (Category) | 7 (100.0%) | 0 (0.0%) |
| Total (Overall) | 113 (81.3%) | 26 (18.7%) |
Production, Transportation and Moving Occupations
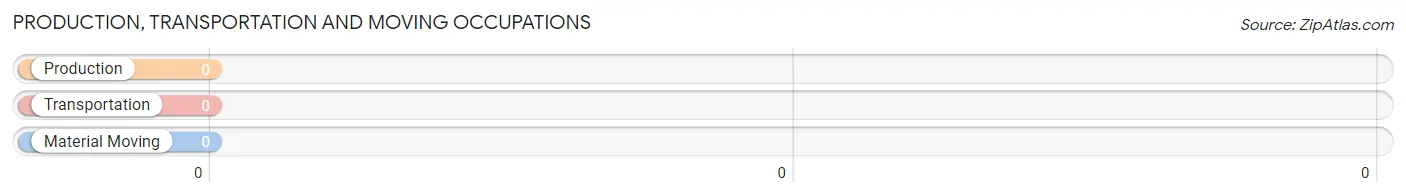
Production, Transportation and Moving Occupations by Sex
| Occupation | Male | Female |
| Production | 0 (0.0%) | 0 (0.0%) |
| Transportation | 0 (0.0%) | 0 (0.0%) |
| Material Moving | 0 (0.0%) | 0 (0.0%) |
| Total (Category) | 0 (0.0%) | 0 (0.0%) |
| Total (Overall) | 113 (81.3%) | 26 (18.7%) |
Employment Industries by Sex in Dorset
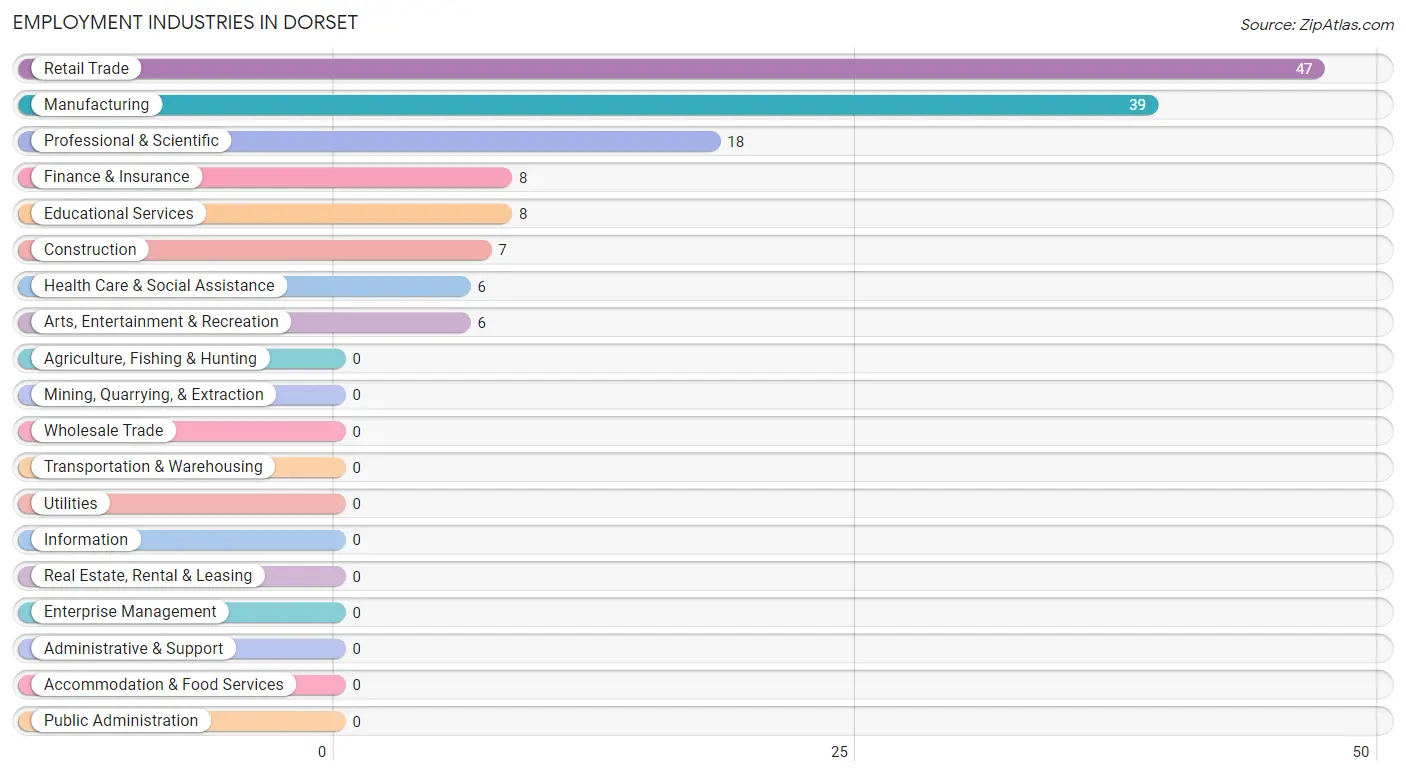
Employment Industries in Dorset
The major employment industries in Dorset include Retail Trade (47 | 33.8%), Manufacturing (39 | 28.1%), Professional & Scientific (18 | 13.0%), Finance & Insurance (8 | 5.8%), and Educational Services (8 | 5.8%).
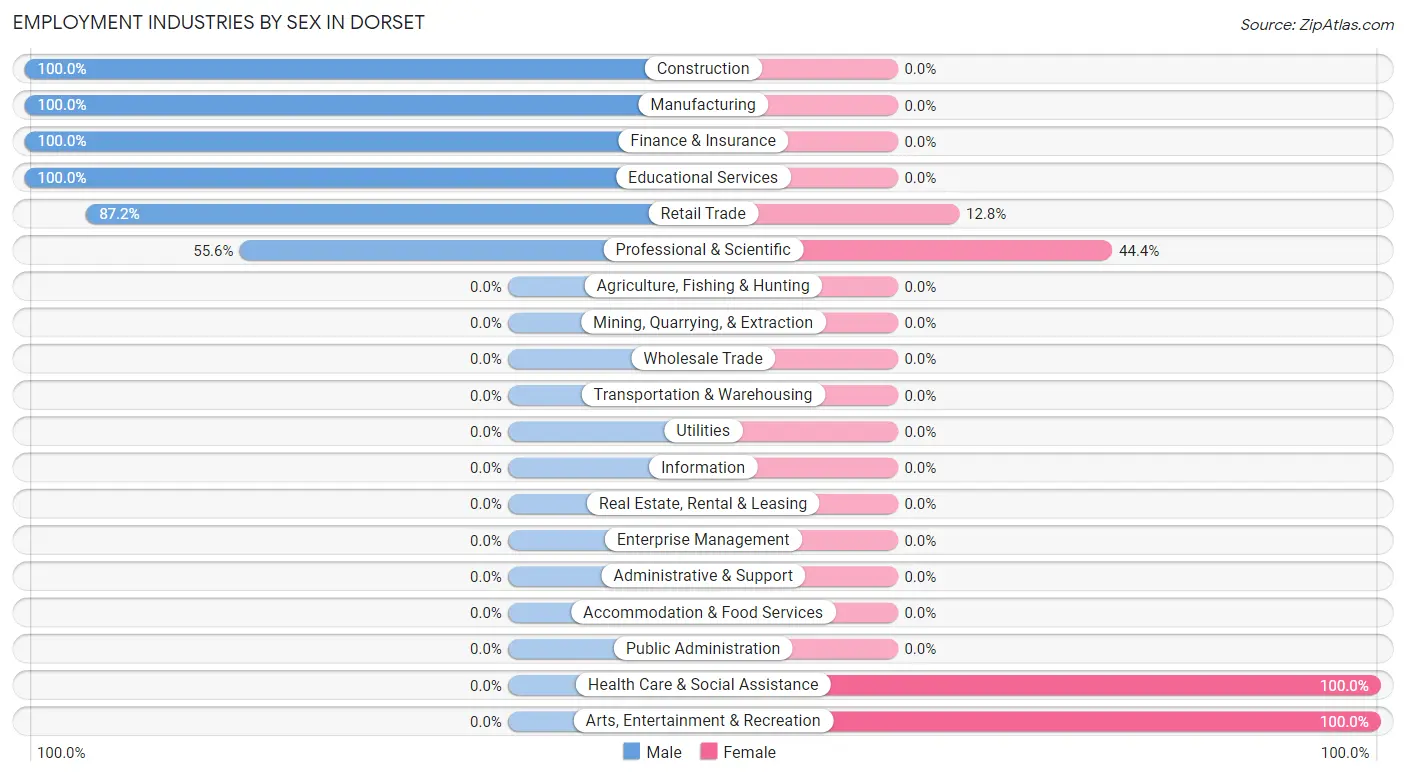
Employment Industries by Sex in Dorset
The Dorset industries that see more men than women are Construction (100.0%), Manufacturing (100.0%), and Finance & Insurance (100.0%), whereas the industries that tend to have a higher number of women are Health Care & Social Assistance (100.0%), Arts, Entertainment & Recreation (100.0%), and Professional & Scientific (44.4%).
| Industry | Male | Female |
| Agriculture, Fishing & Hunting | 0 (0.0%) | 0 (0.0%) |
| Mining, Quarrying, & Extraction | 0 (0.0%) | 0 (0.0%) |
| Construction | 7 (100.0%) | 0 (0.0%) |
| Manufacturing | 39 (100.0%) | 0 (0.0%) |
| Wholesale Trade | 0 (0.0%) | 0 (0.0%) |
| Retail Trade | 41 (87.2%) | 6 (12.8%) |
| Transportation & Warehousing | 0 (0.0%) | 0 (0.0%) |
| Utilities | 0 (0.0%) | 0 (0.0%) |
| Information | 0 (0.0%) | 0 (0.0%) |
| Finance & Insurance | 8 (100.0%) | 0 (0.0%) |
| Real Estate, Rental & Leasing | 0 (0.0%) | 0 (0.0%) |
| Professional & Scientific | 10 (55.6%) | 8 (44.4%) |
| Enterprise Management | 0 (0.0%) | 0 (0.0%) |
| Administrative & Support | 0 (0.0%) | 0 (0.0%) |
| Educational Services | 8 (100.0%) | 0 (0.0%) |
| Health Care & Social Assistance | 0 (0.0%) | 6 (100.0%) |
| Arts, Entertainment & Recreation | 0 (0.0%) | 6 (100.0%) |
| Accommodation & Food Services | 0 (0.0%) | 0 (0.0%) |
| Public Administration | 0 (0.0%) | 0 (0.0%) |
| Total | 113 (81.3%) | 26 (18.7%) |
Education in Dorset
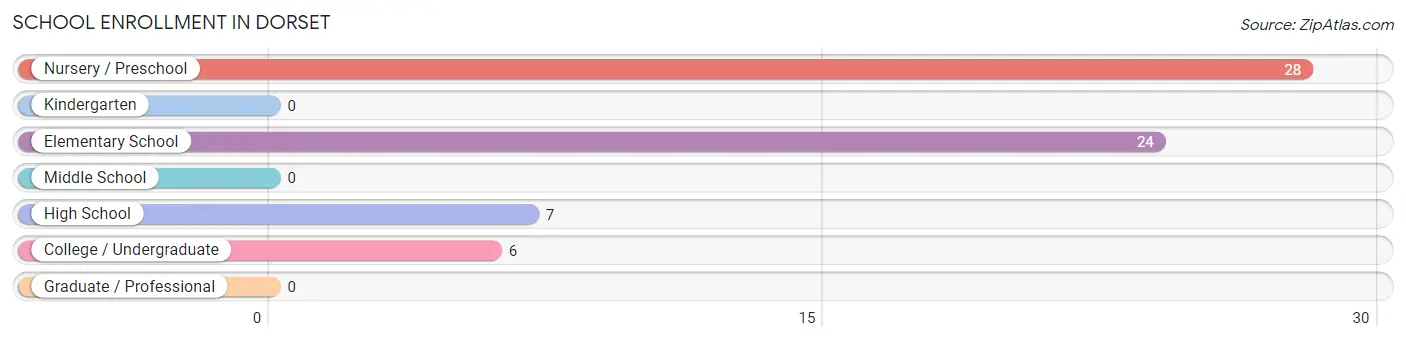
School Enrollment in Dorset
The most common levels of schooling among the 65 students in Dorset are nursery / preschool (28 | 43.1%), elementary school (24 | 36.9%), and high school (7 | 10.8%).
| School Level | # Students | % Students |
| Nursery / Preschool | 28 | 43.1% |
| Kindergarten | 0 | 0.0% |
| Elementary School | 24 | 36.9% |
| Middle School | 0 | 0.0% |
| High School | 7 | 10.8% |
| College / Undergraduate | 6 | 9.2% |
| Graduate / Professional | 0 | 0.0% |
| Total | 65 | 100.0% |
School Enrollment by Age by Funding Source in Dorset
Out of a total of 65 students who are enrolled in schools in Dorset, 30 (46.2%) attend a private institution, while the remaining 35 (53.8%) are enrolled in public schools. The age group of 5 to 9 year old has the highest likelihood of being enrolled in private schools, with 24 (100.0% in the age bracket) enrolled. Conversely, the age group of 3 to 4 year olds has the lowest likelihood of being enrolled in a private school, with 28 (100.0% in the age bracket) attending a public institution.
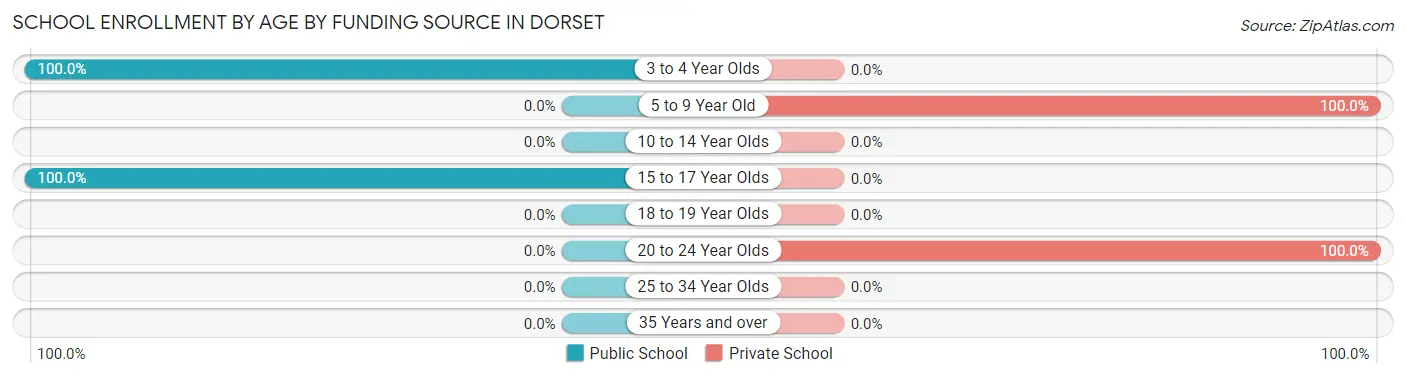
| Age Bracket | Public School | Private School |
| 3 to 4 Year Olds | 28 (100.0%) | 0 (0.0%) |
| 5 to 9 Year Old | 0 (0.0%) | 24 (100.0%) |
| 10 to 14 Year Olds | 0 (0.0%) | 0 (0.0%) |
| 15 to 17 Year Olds | 7 (100.0%) | 0 (0.0%) |
| 18 to 19 Year Olds | 0 (0.0%) | 0 (0.0%) |
| 20 to 24 Year Olds | 0 (0.0%) | 6 (100.0%) |
| 25 to 34 Year Olds | 0 (0.0%) | 0 (0.0%) |
| 35 Years and over | 0 (0.0%) | 0 (0.0%) |
| Total | 35 (53.8%) | 30 (46.2%) |
Educational Attainment by Field of Study in Dorset
Literature & languages (96 | 33.5%), visual & performing arts (58 | 20.2%), business (35 | 12.2%), education (30 | 10.4%), and computers & mathematics (26 | 9.1%) are the most common fields of study among 287 individuals in Dorset who have obtained a bachelor's degree or higher.
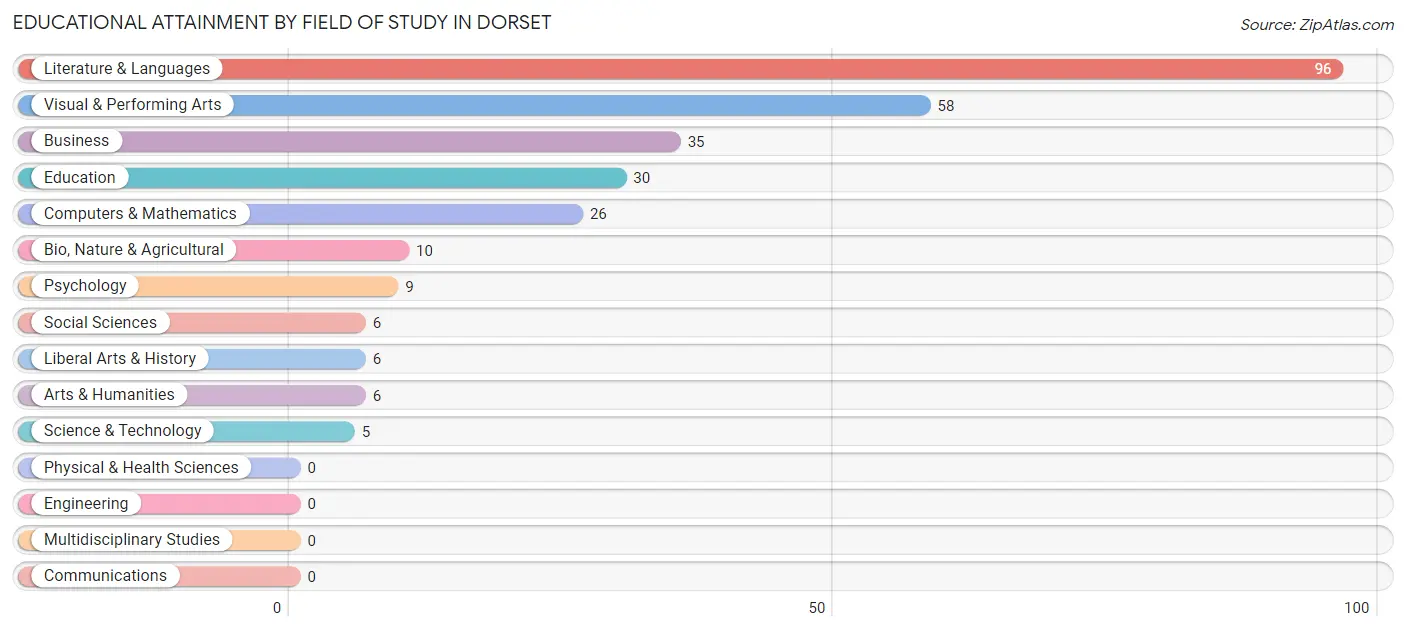
| Field of Study | # Graduates | % Graduates |
| Computers & Mathematics | 26 | 9.1% |
| Bio, Nature & Agricultural | 10 | 3.5% |
| Physical & Health Sciences | 0 | 0.0% |
| Psychology | 9 | 3.1% |
| Social Sciences | 6 | 2.1% |
| Engineering | 0 | 0.0% |
| Multidisciplinary Studies | 0 | 0.0% |
| Science & Technology | 5 | 1.7% |
| Business | 35 | 12.2% |
| Education | 30 | 10.4% |
| Literature & Languages | 96 | 33.5% |
| Liberal Arts & History | 6 | 2.1% |
| Visual & Performing Arts | 58 | 20.2% |
| Communications | 0 | 0.0% |
| Arts & Humanities | 6 | 2.1% |
| Total | 287 | 100.0% |
Transportation & Commute in Dorset
Vehicle Availability by Sex in Dorset
The most prevalent vehicle ownership categories in Dorset are males with 2 vehicles (54, accounting for 51.4%) and females with 2 vehicles (20, making up 207.7%).
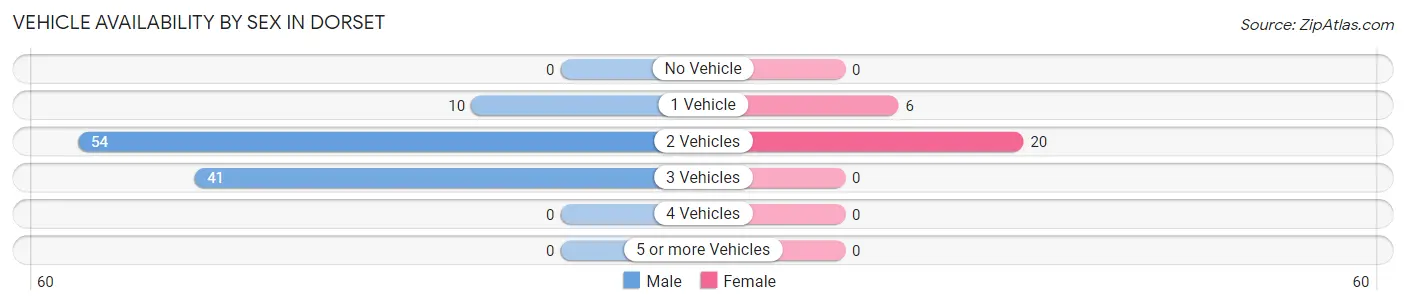
| Vehicles Available | Male | Female |
| No Vehicle | 0 (0.0%) | 0 (0.0%) |
| 1 Vehicle | 10 (9.5%) | 6 (23.1%) |
| 2 Vehicles | 54 (51.4%) | 20 (76.9%) |
| 3 Vehicles | 41 (39.1%) | 0 (0.0%) |
| 4 Vehicles | 0 (0.0%) | 0 (0.0%) |
| 5 or more Vehicles | 0 (0.0%) | 0 (0.0%) |
| Total | 105 (100.0%) | 26 (100.0%) |
Commute Time in Dorset
The most frequently occuring commute durations in Dorset are less than 5 minutes (51 commuters, 41.5%), 20 to 24 minutes (26 commuters, 21.1%), and 60 to 89 minutes (21 commuters, 17.1%).
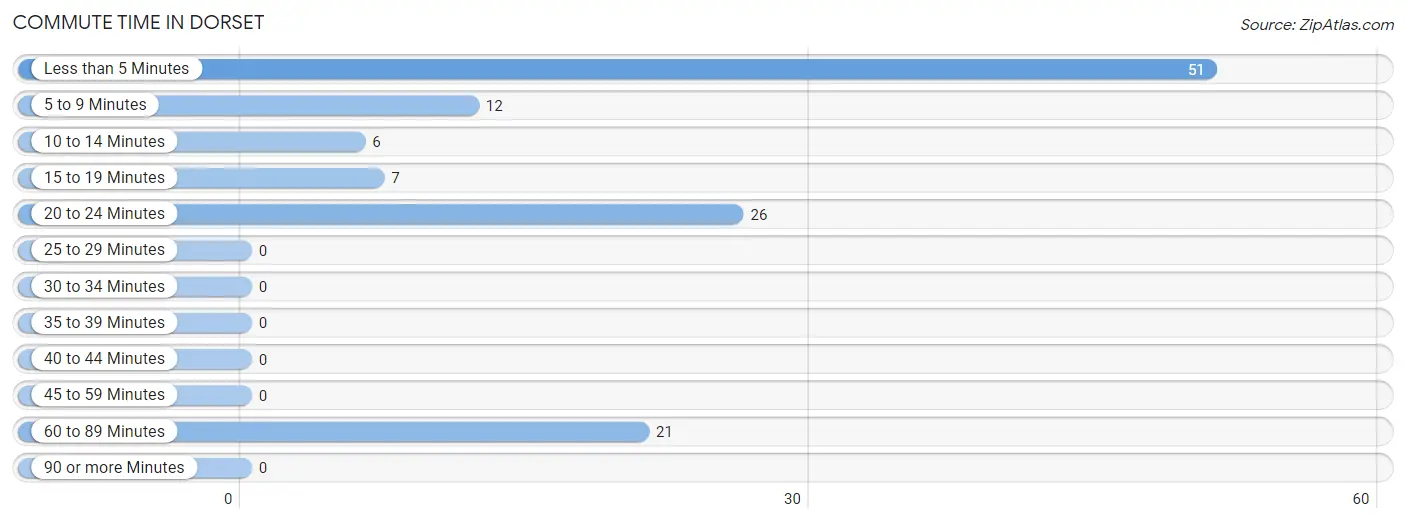
| Commute Time | # Commuters | % Commuters |
| Less than 5 Minutes | 51 | 41.5% |
| 5 to 9 Minutes | 12 | 9.8% |
| 10 to 14 Minutes | 6 | 4.9% |
| 15 to 19 Minutes | 7 | 5.7% |
| 20 to 24 Minutes | 26 | 21.1% |
| 25 to 29 Minutes | 0 | 0.0% |
| 30 to 34 Minutes | 0 | 0.0% |
| 35 to 39 Minutes | 0 | 0.0% |
| 40 to 44 Minutes | 0 | 0.0% |
| 45 to 59 Minutes | 0 | 0.0% |
| 60 to 89 Minutes | 21 | 17.1% |
| 90 or more Minutes | 0 | 0.0% |
Commute Time by Sex in Dorset
The most common commute times in Dorset are less than 5 minutes (51 commuters, 52.6%) for males and 5 to 9 minutes (12 commuters, 46.2%) for females.
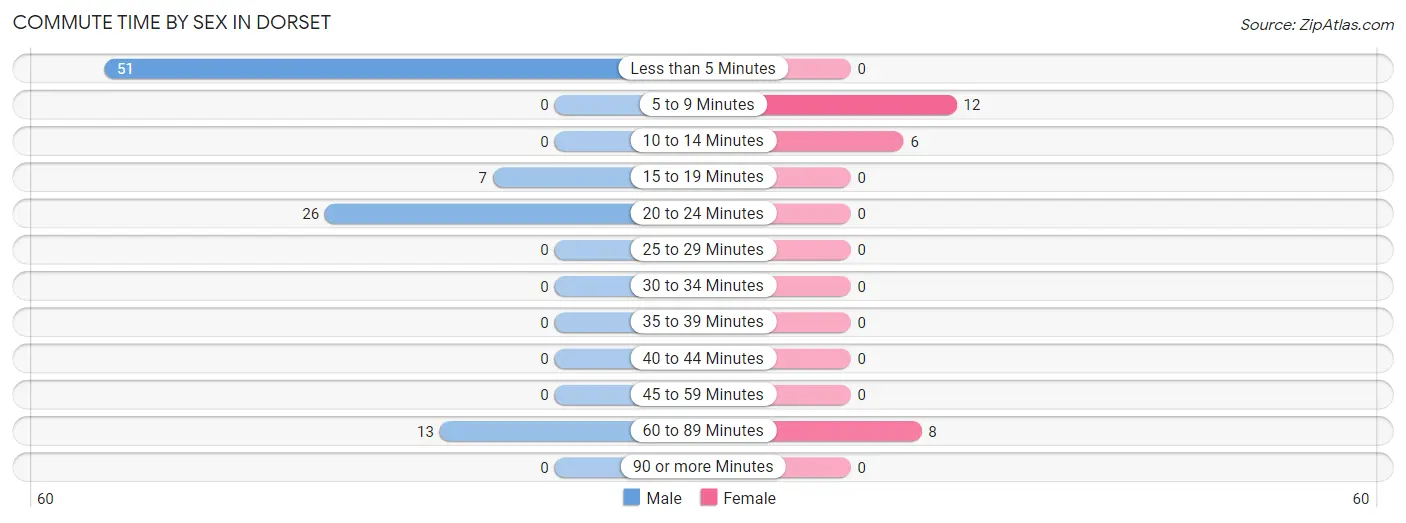
| Commute Time | Male | Female |
| Less than 5 Minutes | 51 (52.6%) | 0 (0.0%) |
| 5 to 9 Minutes | 0 (0.0%) | 12 (46.2%) |
| 10 to 14 Minutes | 0 (0.0%) | 6 (23.1%) |
| 15 to 19 Minutes | 7 (7.2%) | 0 (0.0%) |
| 20 to 24 Minutes | 26 (26.8%) | 0 (0.0%) |
| 25 to 29 Minutes | 0 (0.0%) | 0 (0.0%) |
| 30 to 34 Minutes | 0 (0.0%) | 0 (0.0%) |
| 35 to 39 Minutes | 0 (0.0%) | 0 (0.0%) |
| 40 to 44 Minutes | 0 (0.0%) | 0 (0.0%) |
| 45 to 59 Minutes | 0 (0.0%) | 0 (0.0%) |
| 60 to 89 Minutes | 13 (13.4%) | 8 (30.8%) |
| 90 or more Minutes | 0 (0.0%) | 0 (0.0%) |
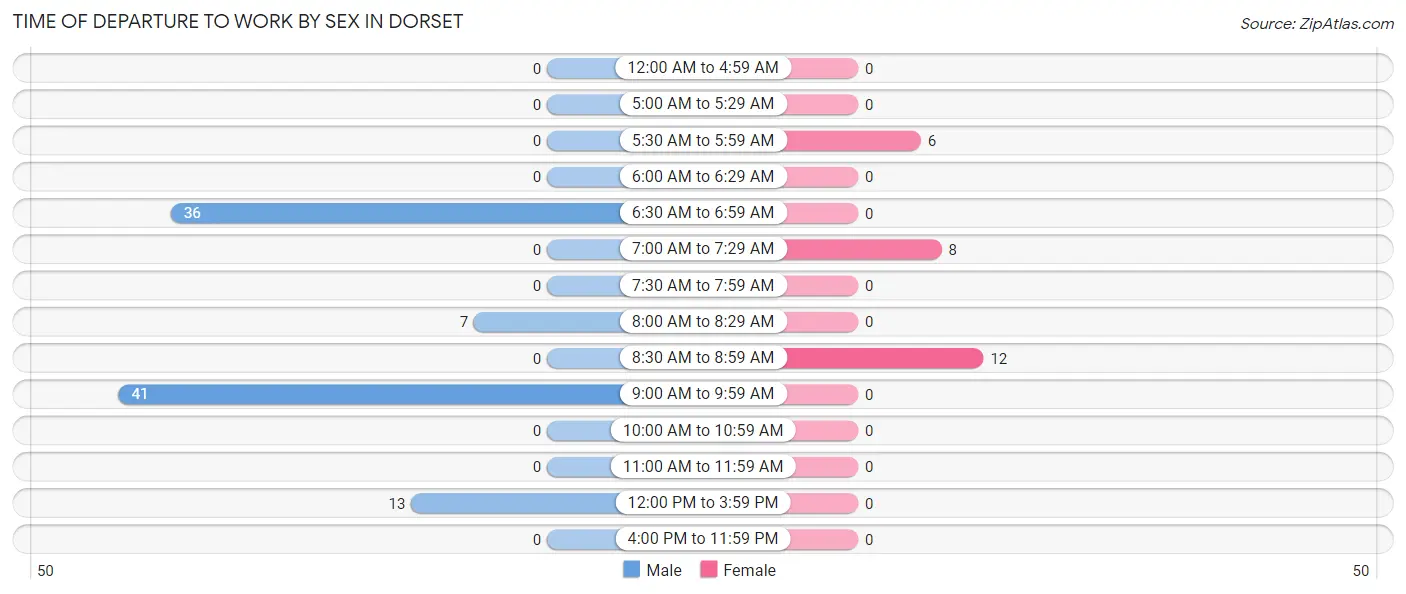
Time of Departure to Work by Sex in Dorset
The most frequent times of departure to work in Dorset are 9:00 AM to 9:59 AM (41, 42.3%) for males and 8:30 AM to 8:59 AM (12, 46.2%) for females.
| Time of Departure | Male | Female |
| 12:00 AM to 4:59 AM | 0 (0.0%) | 0 (0.0%) |
| 5:00 AM to 5:29 AM | 0 (0.0%) | 0 (0.0%) |
| 5:30 AM to 5:59 AM | 0 (0.0%) | 6 (23.1%) |
| 6:00 AM to 6:29 AM | 0 (0.0%) | 0 (0.0%) |
| 6:30 AM to 6:59 AM | 36 (37.1%) | 0 (0.0%) |
| 7:00 AM to 7:29 AM | 0 (0.0%) | 8 (30.8%) |
| 7:30 AM to 7:59 AM | 0 (0.0%) | 0 (0.0%) |
| 8:00 AM to 8:29 AM | 7 (7.2%) | 0 (0.0%) |
| 8:30 AM to 8:59 AM | 0 (0.0%) | 12 (46.2%) |
| 9:00 AM to 9:59 AM | 41 (42.3%) | 0 (0.0%) |
| 10:00 AM to 10:59 AM | 0 (0.0%) | 0 (0.0%) |
| 11:00 AM to 11:59 AM | 0 (0.0%) | 0 (0.0%) |
| 12:00 PM to 3:59 PM | 13 (13.4%) | 0 (0.0%) |
| 4:00 PM to 11:59 PM | 0 (0.0%) | 0 (0.0%) |
| Total | 97 (100.0%) | 26 (100.0%) |
Housing Occupancy in Dorset
Occupancy by Ownership in Dorset
Of the total 170 dwellings in Dorset, owner-occupied units account for 170 (100.0%), while renter-occupied units make up 0 (0.0%).
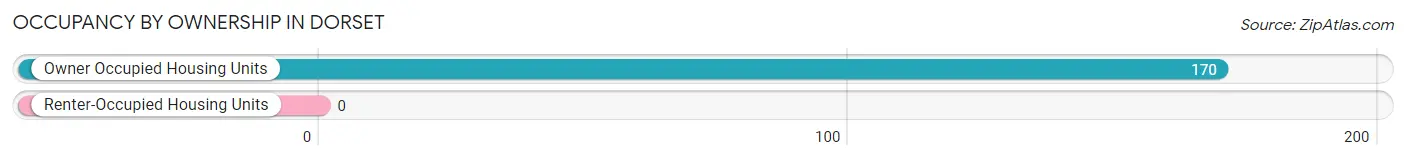
| Occupancy | # Housing Units | % Housing Units |
| Owner Occupied Housing Units | 170 | 100.0% |
| Renter-Occupied Housing Units | 0 | 0.0% |
| Total Occupied Housing Units | 170 | 100.0% |
Occupancy by Household Size in Dorset
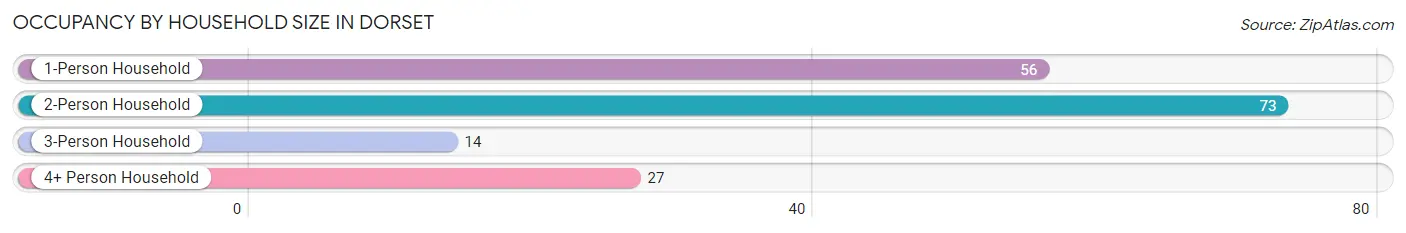
| Household Size | # Housing Units | % Housing Units |
| 1-Person Household | 56 | 32.9% |
| 2-Person Household | 73 | 42.9% |
| 3-Person Household | 14 | 8.2% |
| 4+ Person Household | 27 | 15.9% |
| Total Housing Units | 170 | 100.0% |
Occupancy by Ownership by Household Size in Dorset
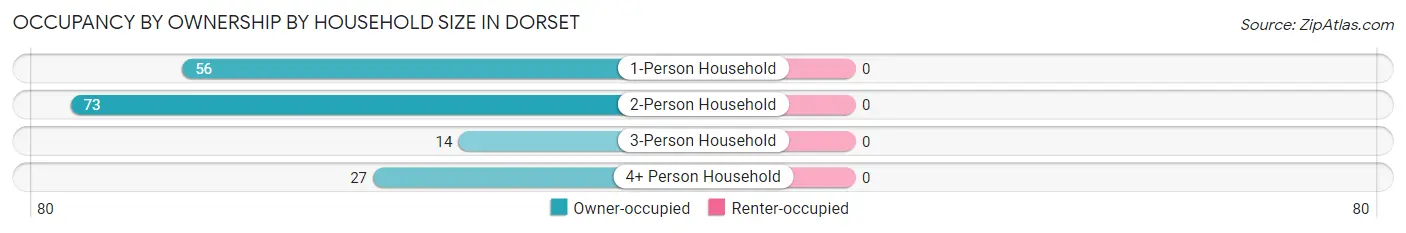
| Household Size | Owner-occupied | Renter-occupied |
| 1-Person Household | 56 (100.0%) | 0 (0.0%) |
| 2-Person Household | 73 (100.0%) | 0 (0.0%) |
| 3-Person Household | 14 (100.0%) | 0 (0.0%) |
| 4+ Person Household | 27 (100.0%) | 0 (0.0%) |
| Total Housing Units | 170 (100.0%) | 0 (0.0%) |
Occupancy by Educational Attainment in Dorset
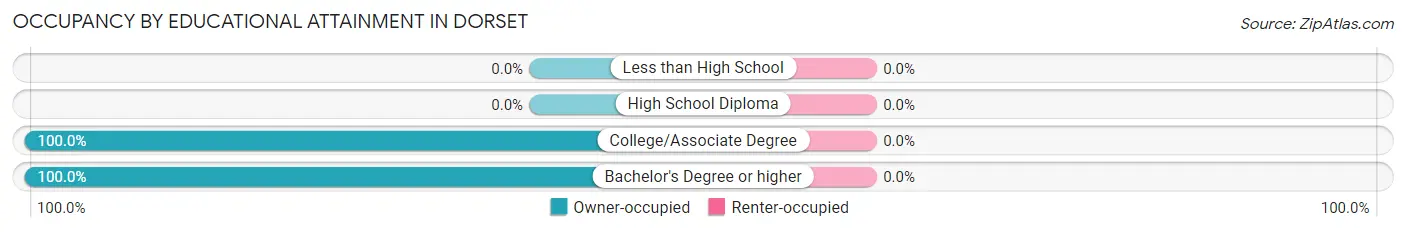
| Household Size | Owner-occupied | Renter-occupied |
| Less than High School | 0 (0.0%) | 0 (0.0%) |
| High School Diploma | 0 (0.0%) | 0 (0.0%) |
| College/Associate Degree | 14 (100.0%) | 0 (0.0%) |
| Bachelor's Degree or higher | 156 (100.0%) | 0 (0.0%) |
Occupancy by Age of Householder in Dorset
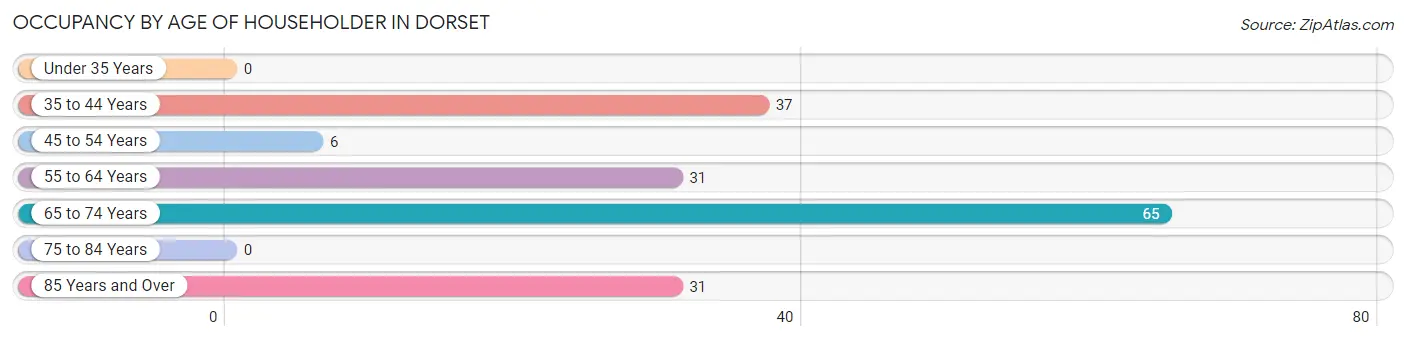
| Age Bracket | # Households | % Households |
| Under 35 Years | 0 | 0.0% |
| 35 to 44 Years | 37 | 21.8% |
| 45 to 54 Years | 6 | 3.5% |
| 55 to 64 Years | 31 | 18.2% |
| 65 to 74 Years | 65 | 38.2% |
| 75 to 84 Years | 0 | 0.0% |
| 85 Years and Over | 31 | 18.2% |
| Total | 170 | 100.0% |
Housing Finances in Dorset
Median Income by Occupancy in Dorset
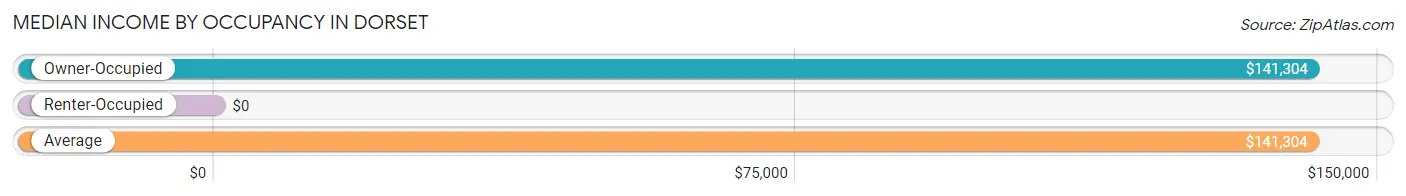
| Occupancy Type | # Households | Median Income |
| Owner-Occupied | 170 (100.0%) | $141,304 |
| Renter-Occupied | 0 (0.0%) | $0 |
| Average | 170 (100.0%) | $141,304 |
Occupancy by Householder Income Bracket in Dorset
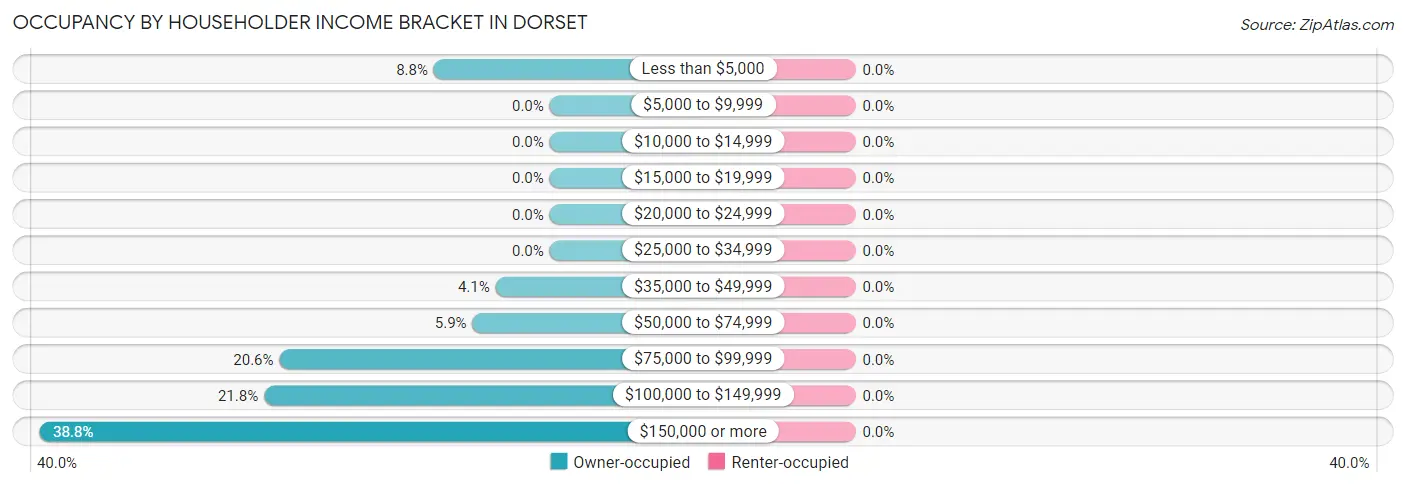
| Income Bracket | Owner-occupied | Renter-occupied |
| Less than $5,000 | 15 (8.8%) | 0 (0.0%) |
| $5,000 to $9,999 | 0 (0.0%) | 0 (0.0%) |
| $10,000 to $14,999 | 0 (0.0%) | 0 (0.0%) |
| $15,000 to $19,999 | 0 (0.0%) | 0 (0.0%) |
| $20,000 to $24,999 | 0 (0.0%) | 0 (0.0%) |
| $25,000 to $34,999 | 0 (0.0%) | 0 (0.0%) |
| $35,000 to $49,999 | 7 (4.1%) | 0 (0.0%) |
| $50,000 to $74,999 | 10 (5.9%) | 0 (0.0%) |
| $75,000 to $99,999 | 35 (20.6%) | 0 (0.0%) |
| $100,000 to $149,999 | 37 (21.8%) | 0 (0.0%) |
| $150,000 or more | 66 (38.8%) | 0 (0.0%) |
| Total | 170 (100.0%) | 0 (0.0%) |
Monthly Housing Cost Tiers in Dorset
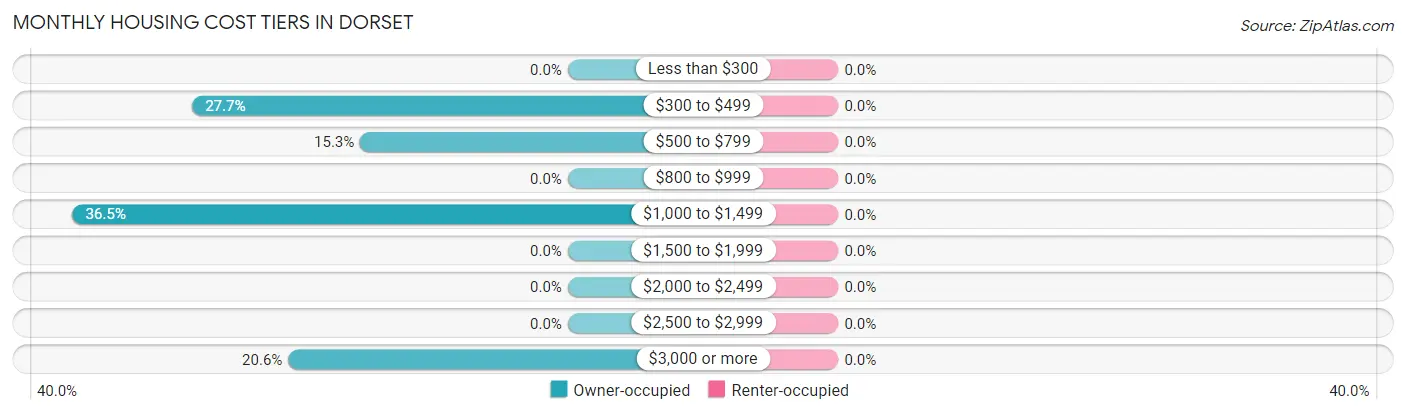
| Monthly Cost | Owner-occupied | Renter-occupied |
| Less than $300 | 0 (0.0%) | 0 (0.0%) |
| $300 to $499 | 47 (27.7%) | 0 (0.0%) |
| $500 to $799 | 26 (15.3%) | 0 (0.0%) |
| $800 to $999 | 0 (0.0%) | 0 (0.0%) |
| $1,000 to $1,499 | 62 (36.5%) | 0 (0.0%) |
| $1,500 to $1,999 | 0 (0.0%) | 0 (0.0%) |
| $2,000 to $2,499 | 0 (0.0%) | 0 (0.0%) |
| $2,500 to $2,999 | 0 (0.0%) | 0 (0.0%) |
| $3,000 or more | 35 (20.6%) | 0 (0.0%) |
| Total | 170 (100.0%) | 0 (0.0%) |
Physical Housing Characteristics in Dorset
Housing Structures in Dorset
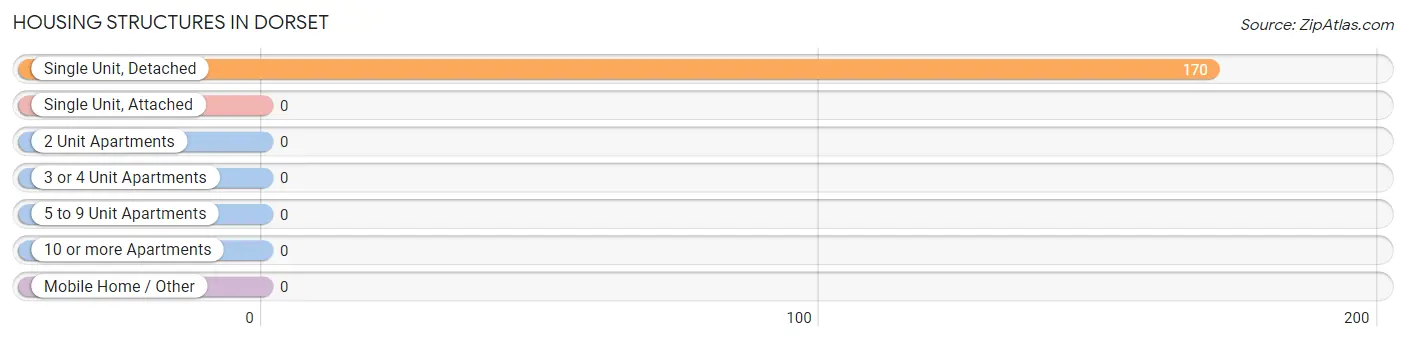
| Structure Type | # Housing Units | % Housing Units |
| Single Unit, Detached | 170 | 100.0% |
| Single Unit, Attached | 0 | 0.0% |
| 2 Unit Apartments | 0 | 0.0% |
| 3 or 4 Unit Apartments | 0 | 0.0% |
| 5 to 9 Unit Apartments | 0 | 0.0% |
| 10 or more Apartments | 0 | 0.0% |
| Mobile Home / Other | 0 | 0.0% |
| Total | 170 | 100.0% |
Housing Structures by Occupancy in Dorset
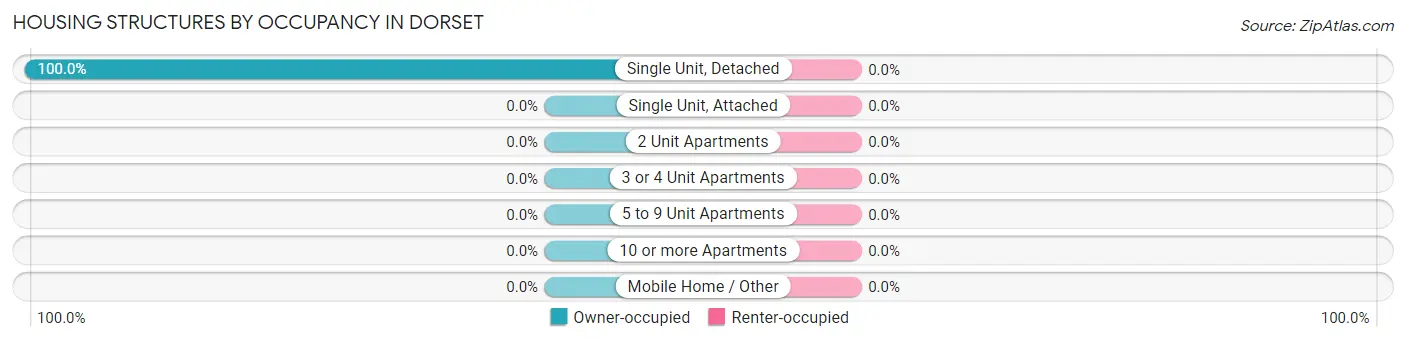
| Structure Type | Owner-occupied | Renter-occupied |
| Single Unit, Detached | 170 (100.0%) | 0 (0.0%) |
| Single Unit, Attached | 0 (0.0%) | 0 (0.0%) |
| 2 Unit Apartments | 0 (0.0%) | 0 (0.0%) |
| 3 or 4 Unit Apartments | 0 (0.0%) | 0 (0.0%) |
| 5 to 9 Unit Apartments | 0 (0.0%) | 0 (0.0%) |
| 10 or more Apartments | 0 (0.0%) | 0 (0.0%) |
| Mobile Home / Other | 0 (0.0%) | 0 (0.0%) |
| Total | 170 (100.0%) | 0 (0.0%) |
Housing Structures by Number of Rooms in Dorset
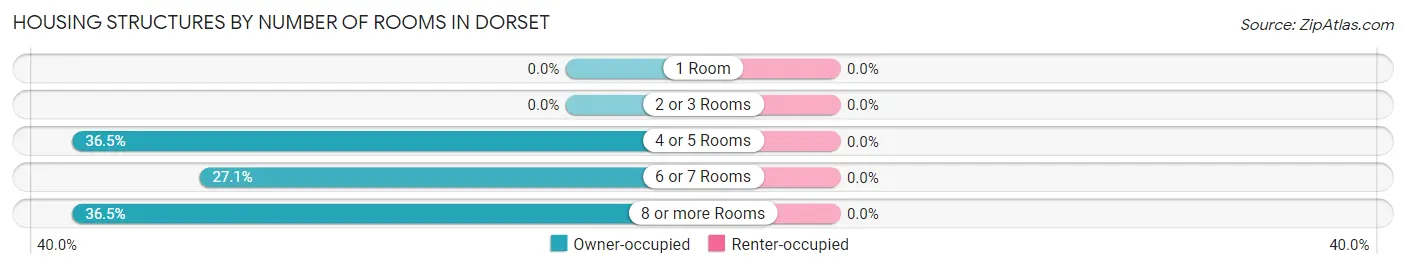
| Number of Rooms | Owner-occupied | Renter-occupied |
| 1 Room | 0 (0.0%) | 0 (0.0%) |
| 2 or 3 Rooms | 0 (0.0%) | 0 (0.0%) |
| 4 or 5 Rooms | 62 (36.5%) | 0 (0.0%) |
| 6 or 7 Rooms | 46 (27.1%) | 0 (0.0%) |
| 8 or more Rooms | 62 (36.5%) | 0 (0.0%) |
| Total | 170 (100.0%) | 0 (0.0%) |
Housing Structure by Heating Type in Dorset
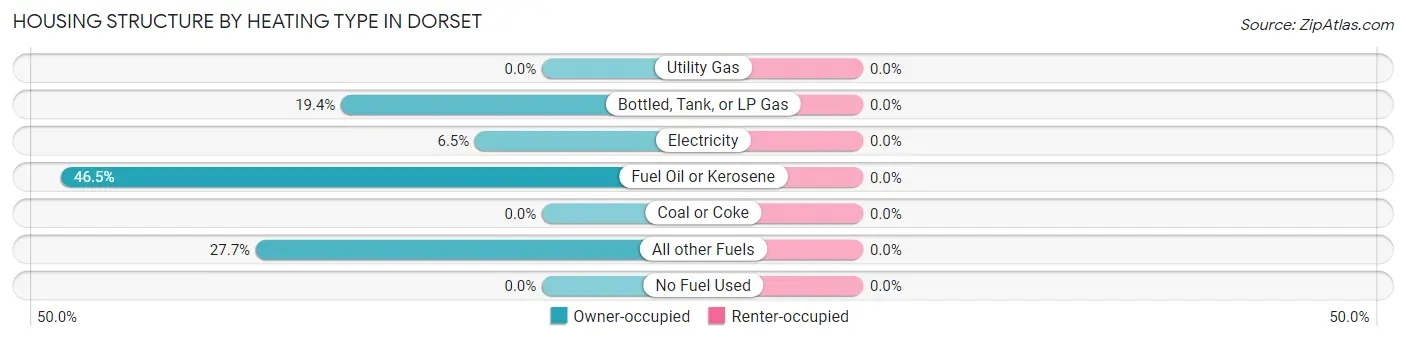
| Heating Type | Owner-occupied | Renter-occupied |
| Utility Gas | 0 (0.0%) | 0 (0.0%) |
| Bottled, Tank, or LP Gas | 33 (19.4%) | 0 (0.0%) |
| Electricity | 11 (6.5%) | 0 (0.0%) |
| Fuel Oil or Kerosene | 79 (46.5%) | 0 (0.0%) |
| Coal or Coke | 0 (0.0%) | 0 (0.0%) |
| All other Fuels | 47 (27.7%) | 0 (0.0%) |
| No Fuel Used | 0 (0.0%) | 0 (0.0%) |
| Total | 170 (100.0%) | 0 (0.0%) |
Household Vehicle Usage in Dorset
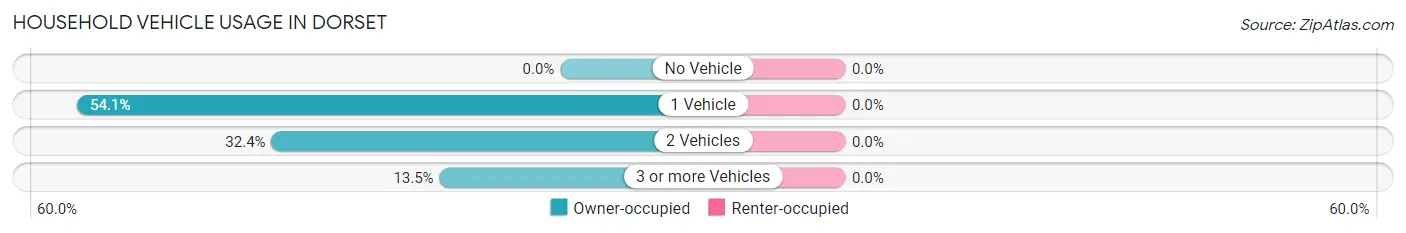
| Vehicles per Household | Owner-occupied | Renter-occupied |
| No Vehicle | 0 (0.0%) | 0 (0.0%) |
| 1 Vehicle | 92 (54.1%) | 0 (0.0%) |
| 2 Vehicles | 55 (32.4%) | 0 (0.0%) |
| 3 or more Vehicles | 23 (13.5%) | 0 (0.0%) |
| Total | 170 (100.0%) | 0 (0.0%) |
Real Estate & Mortgages in Dorset
Real Estate and Mortgage Overview in Dorset
| Characteristic | Without Mortgage | With Mortgage |
| Housing Units | 94 | 76 |
| Median Property Value | $237,000 | $464,500 |
| Median Household Income | $98,958 | $58 |
| Monthly Housing Costs | $600 | $35 |
| Real Estate Taxes | - | - |
Property Value by Mortgage Status in Dorset
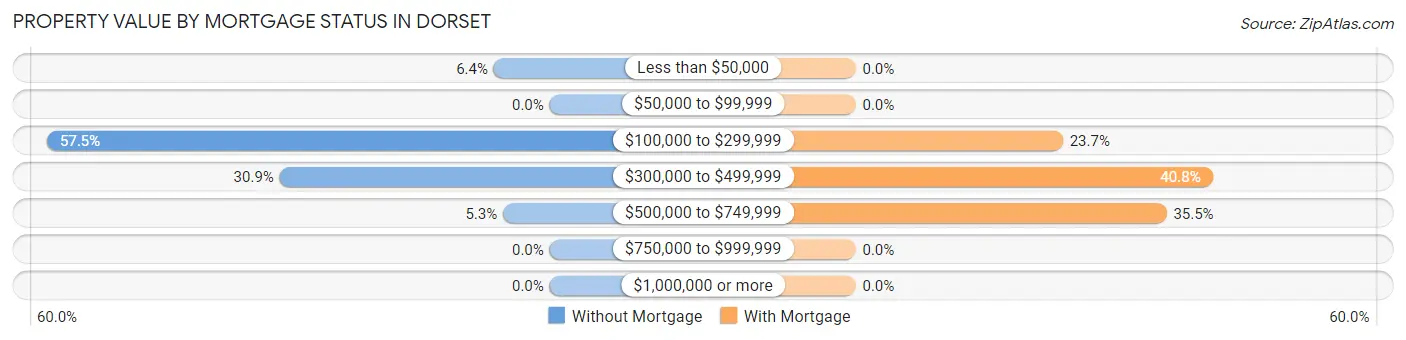
| Property Value | Without Mortgage | With Mortgage |
| Less than $50,000 | 6 (6.4%) | 0 (0.0%) |
| $50,000 to $99,999 | 0 (0.0%) | 0 (0.0%) |
| $100,000 to $299,999 | 54 (57.5%) | 18 (23.7%) |
| $300,000 to $499,999 | 29 (30.8%) | 31 (40.8%) |
| $500,000 to $749,999 | 5 (5.3%) | 27 (35.5%) |
| $750,000 to $999,999 | 0 (0.0%) | 0 (0.0%) |
| $1,000,000 or more | 0 (0.0%) | 0 (0.0%) |
| Total | 94 (100.0%) | 76 (100.0%) |
Household Income by Mortgage Status in Dorset
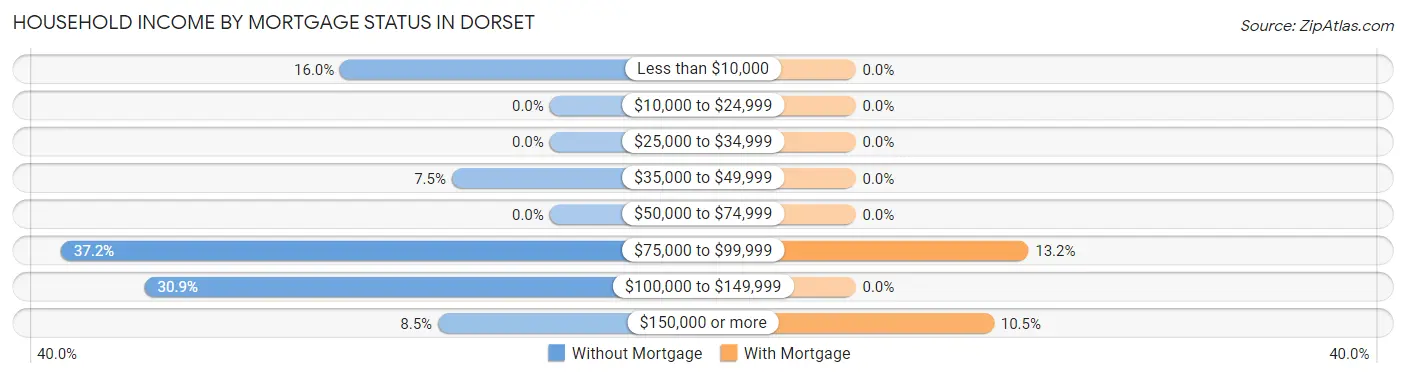
| Household Income | Without Mortgage | With Mortgage |
| Less than $10,000 | 15 (16.0%) | 0 (0.0%) |
| $10,000 to $24,999 | 0 (0.0%) | 0 (0.0%) |
| $25,000 to $34,999 | 0 (0.0%) | 0 (0.0%) |
| $35,000 to $49,999 | 7 (7.4%) | 0 (0.0%) |
| $50,000 to $74,999 | 0 (0.0%) | 0 (0.0%) |
| $75,000 to $99,999 | 35 (37.2%) | 10 (13.2%) |
| $100,000 to $149,999 | 29 (30.8%) | 0 (0.0%) |
| $150,000 or more | 8 (8.5%) | 8 (10.5%) |
| Total | 94 (100.0%) | 76 (100.0%) |
Property Value to Household Income Ratio in Dorset
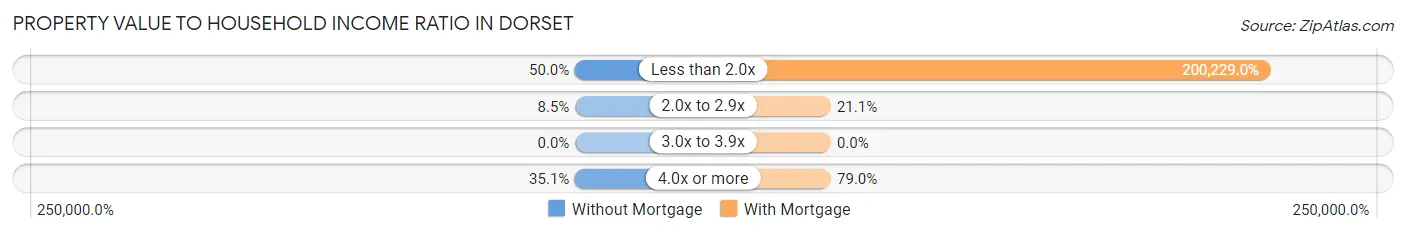
| Value-to-Income Ratio | Without Mortgage | With Mortgage |
| Less than 2.0x | 47 (50.0%) | 152,174 (200,229.0%) |
| 2.0x to 2.9x | 8 (8.5%) | 16 (21.0%) |
| 3.0x to 3.9x | 0 (0.0%) | 0 (0.0%) |
| 4.0x or more | 33 (35.1%) | 60 (78.9%) |
| Total | 94 (100.0%) | 76 (100.0%) |
Real Estate Taxes by Mortgage Status in Dorset
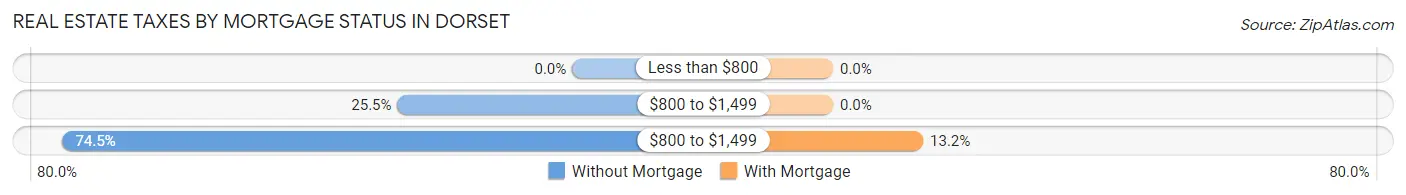
| Property Taxes | Without Mortgage | With Mortgage |
| Less than $800 | 0 (0.0%) | 0 (0.0%) |
| $800 to $1,499 | 24 (25.5%) | 0 (0.0%) |
| $800 to $1,499 | 70 (74.5%) | 10 (13.2%) |
| Total | 94 (100.0%) | 76 (100.0%) |
Health & Disability in Dorset
Health Insurance Coverage by Age in Dorset
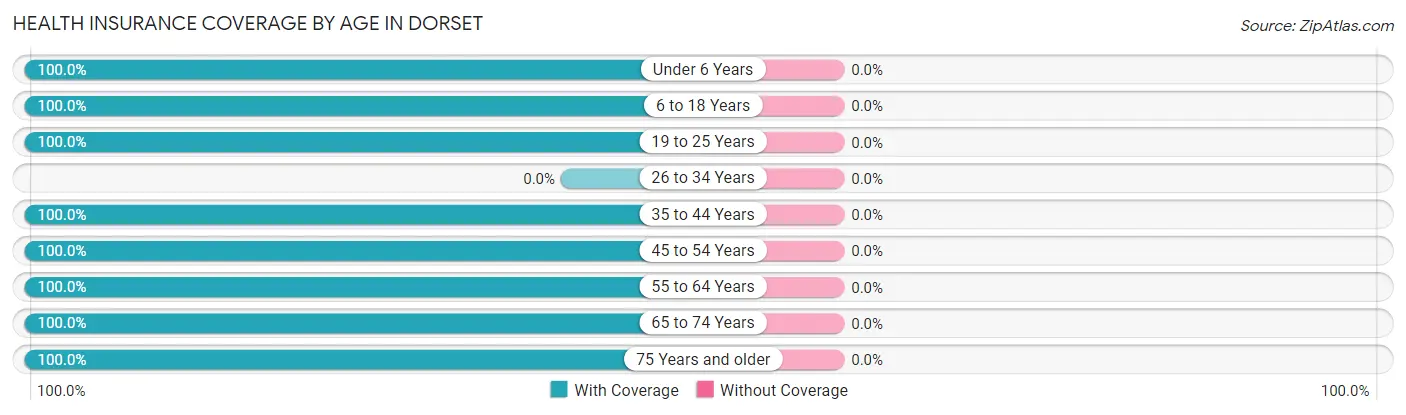
| Age Bracket | With Coverage | Without Coverage |
| Under 6 Years | 28 (100.0%) | 0 (0.0%) |
| 6 to 18 Years | 31 (100.0%) | 0 (0.0%) |
| 19 to 25 Years | 60 (100.0%) | 0 (0.0%) |
| 26 to 34 Years | 0 (0.0%) | 0 (0.0%) |
| 35 to 44 Years | 63 (100.0%) | 0 (0.0%) |
| 45 to 54 Years | 6 (100.0%) | 0 (0.0%) |
| 55 to 64 Years | 47 (100.0%) | 0 (0.0%) |
| 65 to 74 Years | 79 (100.0%) | 0 (0.0%) |
| 75 Years and older | 60 (100.0%) | 0 (0.0%) |
| Total | 374 (100.0%) | 0 (0.0%) |
Health Insurance Coverage by Citizenship Status in Dorset
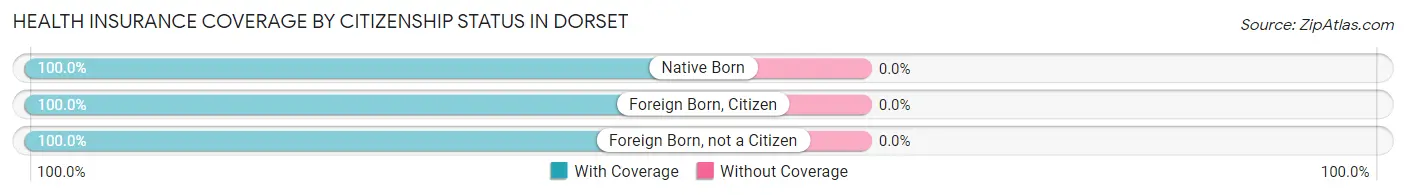
| Citizenship Status | With Coverage | Without Coverage |
| Native Born | 28 (100.0%) | 0 (0.0%) |
| Foreign Born, Citizen | 31 (100.0%) | 0 (0.0%) |
| Foreign Born, not a Citizen | 60 (100.0%) | 0 (0.0%) |
Health Insurance Coverage by Household Income in Dorset
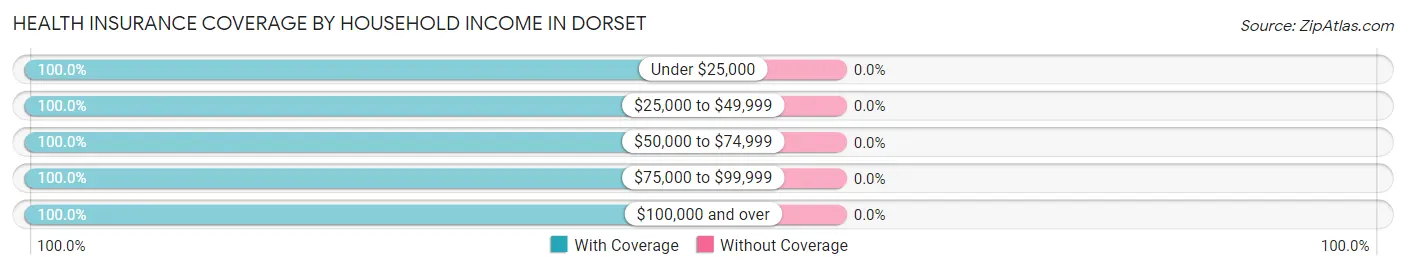
| Household Income | With Coverage | Without Coverage |
| Under $25,000 | 15 (100.0%) | 0 (0.0%) |
| $25,000 to $49,999 | 7 (100.0%) | 0 (0.0%) |
| $50,000 to $74,999 | 10 (100.0%) | 0 (0.0%) |
| $75,000 to $99,999 | 54 (100.0%) | 0 (0.0%) |
| $100,000 and over | 288 (100.0%) | 0 (0.0%) |
Public vs Private Health Insurance Coverage by Age in Dorset
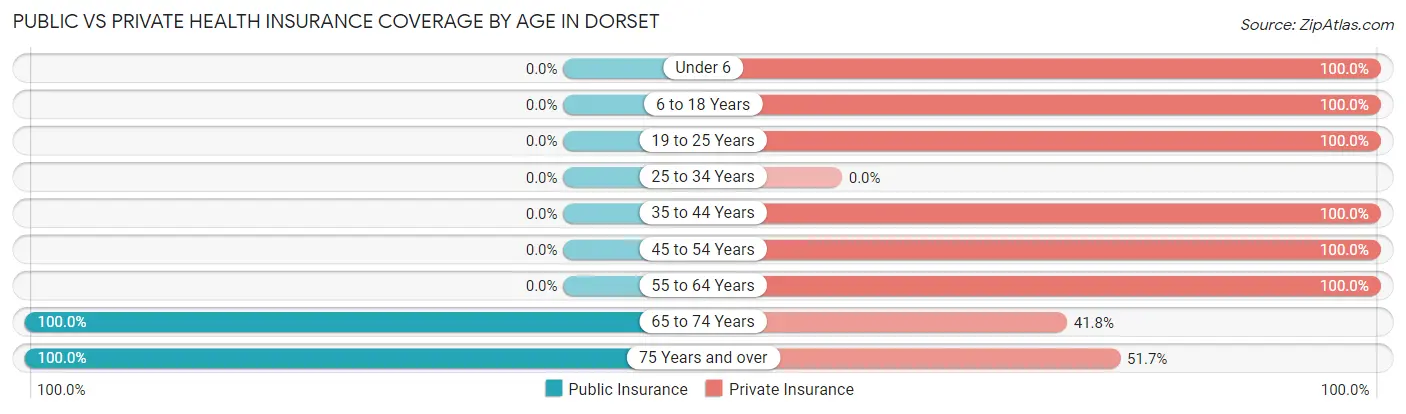
| Age Bracket | Public Insurance | Private Insurance |
| Under 6 | 0 (0.0%) | 28 (100.0%) |
| 6 to 18 Years | 0 (0.0%) | 31 (100.0%) |
| 19 to 25 Years | 0 (0.0%) | 60 (100.0%) |
| 25 to 34 Years | 0 (0.0%) | 0 (0.0%) |
| 35 to 44 Years | 0 (0.0%) | 63 (100.0%) |
| 45 to 54 Years | 0 (0.0%) | 6 (100.0%) |
| 55 to 64 Years | 0 (0.0%) | 47 (100.0%) |
| 65 to 74 Years | 79 (100.0%) | 33 (41.8%) |
| 75 Years and over | 60 (100.0%) | 31 (51.7%) |
| Total | 139 (37.2%) | 299 (79.9%) |
Disability Status by Sex by Age in Dorset
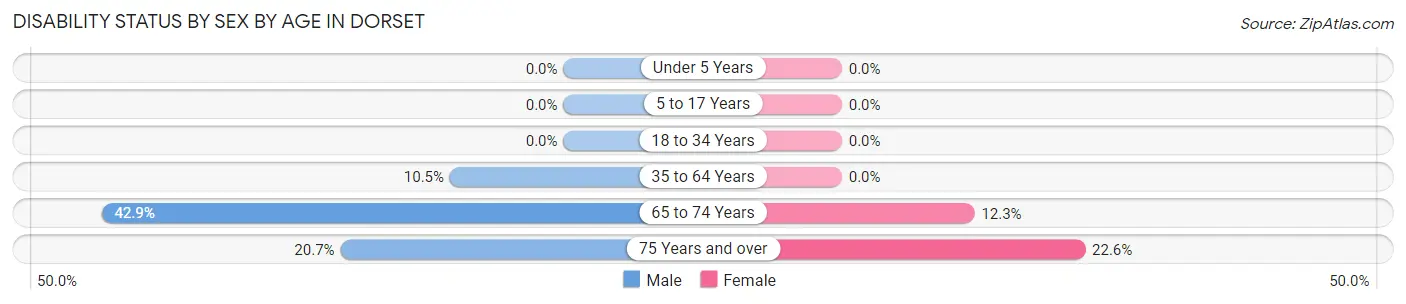
| Age Bracket | Male | Female |
| Under 5 Years | 0 (0.0%) | 0 (0.0%) |
| 5 to 17 Years | 0 (0.0%) | 0 (0.0%) |
| 18 to 34 Years | 0 (0.0%) | 0 (0.0%) |
| 35 to 64 Years | 6 (10.5%) | 0 (0.0%) |
| 65 to 74 Years | 6 (42.9%) | 8 (12.3%) |
| 75 Years and over | 6 (20.7%) | 7 (22.6%) |
Disability Class by Sex by Age in Dorset
Disability Class: Hearing Difficulty
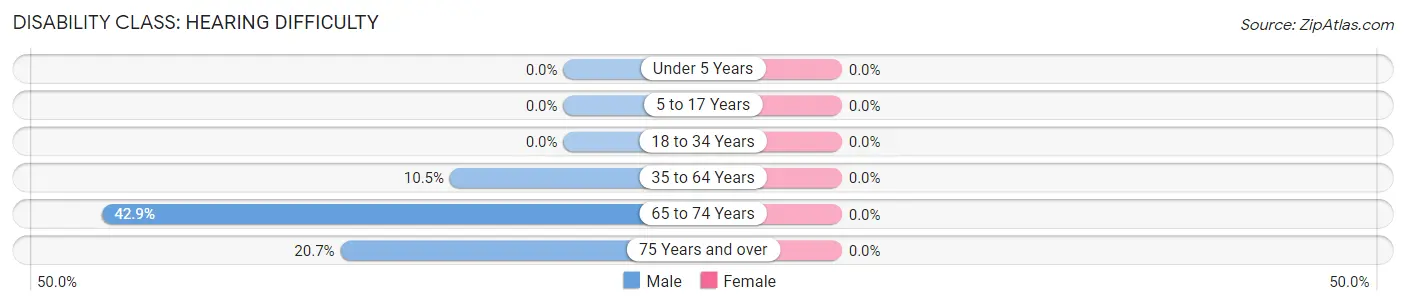
| Age Bracket | Male | Female |
| Under 5 Years | 0 (0.0%) | 0 (0.0%) |
| 5 to 17 Years | 0 (0.0%) | 0 (0.0%) |
| 18 to 34 Years | 0 (0.0%) | 0 (0.0%) |
| 35 to 64 Years | 6 (10.5%) | 0 (0.0%) |
| 65 to 74 Years | 6 (42.9%) | 0 (0.0%) |
| 75 Years and over | 6 (20.7%) | 0 (0.0%) |
Disability Class: Vision Difficulty
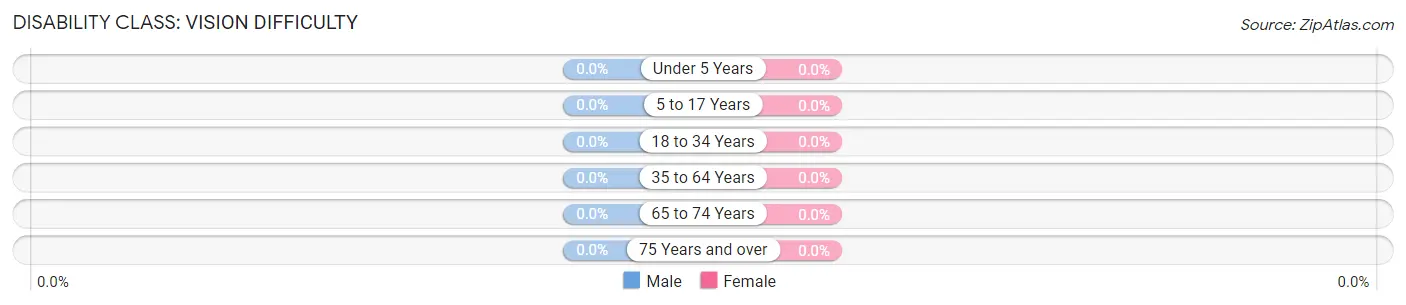
| Age Bracket | Male | Female |
| Under 5 Years | 0 (0.0%) | 0 (0.0%) |
| 5 to 17 Years | 0 (0.0%) | 0 (0.0%) |
| 18 to 34 Years | 0 (0.0%) | 0 (0.0%) |
| 35 to 64 Years | 0 (0.0%) | 0 (0.0%) |
| 65 to 74 Years | 0 (0.0%) | 0 (0.0%) |
| 75 Years and over | 0 (0.0%) | 0 (0.0%) |
Disability Class: Cognitive Difficulty
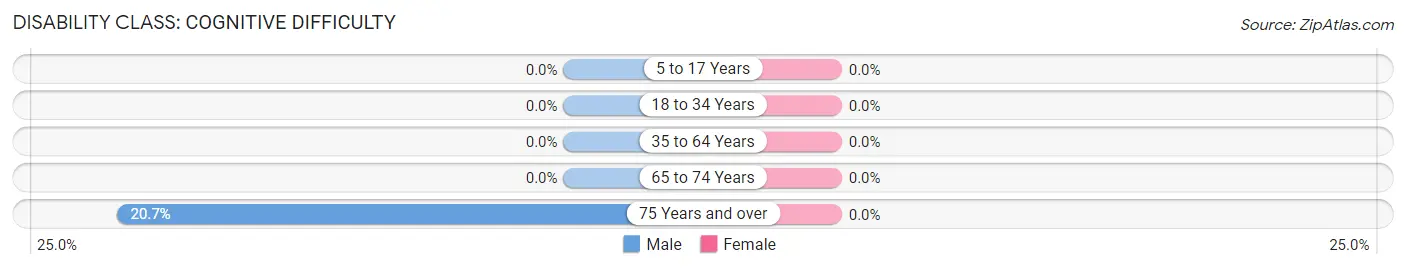
| Age Bracket | Male | Female |
| 5 to 17 Years | 0 (0.0%) | 0 (0.0%) |
| 18 to 34 Years | 0 (0.0%) | 0 (0.0%) |
| 35 to 64 Years | 0 (0.0%) | 0 (0.0%) |
| 65 to 74 Years | 0 (0.0%) | 0 (0.0%) |
| 75 Years and over | 6 (20.7%) | 0 (0.0%) |
Disability Class: Ambulatory Difficulty
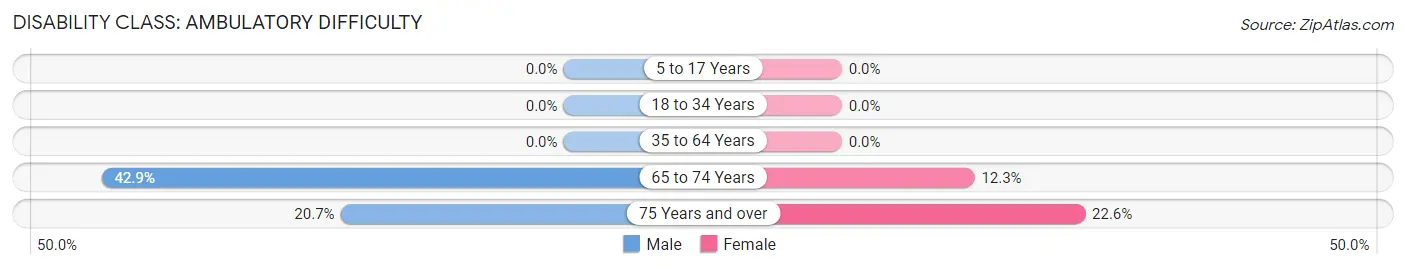
| Age Bracket | Male | Female |
| 5 to 17 Years | 0 (0.0%) | 0 (0.0%) |
| 18 to 34 Years | 0 (0.0%) | 0 (0.0%) |
| 35 to 64 Years | 0 (0.0%) | 0 (0.0%) |
| 65 to 74 Years | 6 (42.9%) | 8 (12.3%) |
| 75 Years and over | 6 (20.7%) | 7 (22.6%) |
Disability Class: Self-Care Difficulty
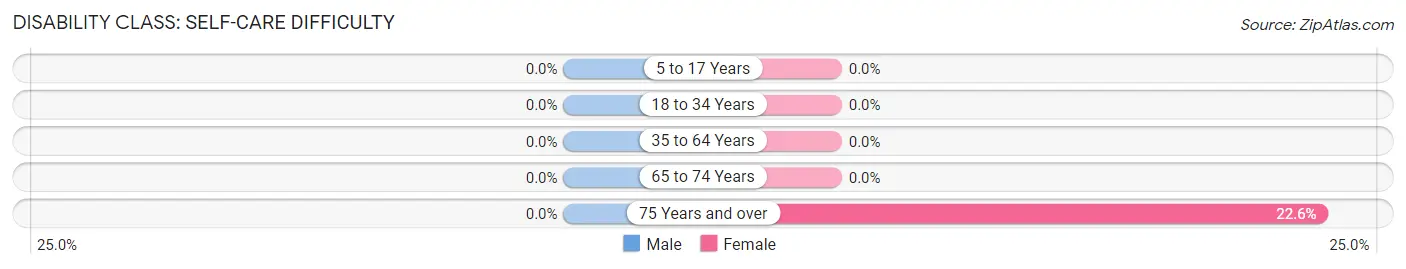
| Age Bracket | Male | Female |
| 5 to 17 Years | 0 (0.0%) | 0 (0.0%) |
| 18 to 34 Years | 0 (0.0%) | 0 (0.0%) |
| 35 to 64 Years | 0 (0.0%) | 0 (0.0%) |
| 65 to 74 Years | 0 (0.0%) | 0 (0.0%) |
| 75 Years and over | 0 (0.0%) | 7 (22.6%) |
Technology Access in Dorset
Computing Device Access in Dorset
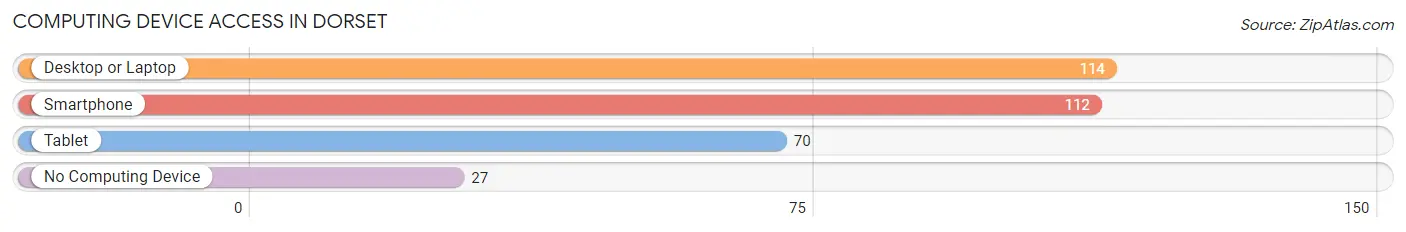
| Device Type | # Households | % Households |
| Desktop or Laptop | 114 | 67.1% |
| Smartphone | 112 | 65.9% |
| Tablet | 70 | 41.2% |
| No Computing Device | 27 | 15.9% |
| Total | 170 | 100.0% |
Internet Access in Dorset
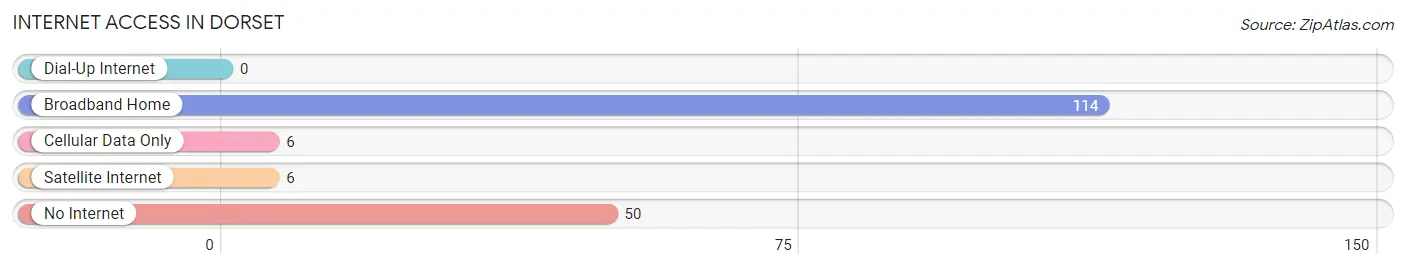
| Internet Type | # Households | % Households |
| Dial-Up Internet | 0 | 0.0% |
| Broadband Home | 114 | 67.1% |
| Cellular Data Only | 6 | 3.5% |
| Satellite Internet | 6 | 3.5% |
| No Internet | 50 | 29.4% |
| Total | 170 | 100.0% |
Dorset Summary
Dorset, Vermont is a small town located in the southwestern corner of the state, in Bennington County. It is situated in the Taconic Mountains, and is bordered by the towns of Manchester, Rupert, and Danby. The town has a population of approximately 2,000 people, and is known for its rural charm and picturesque landscape.
Geography
Dorset is located in the Taconic Mountains, which are part of the Appalachian Mountains. The town is situated at an elevation of 1,400 feet, and is surrounded by rolling hills and lush forests. The town is located on the western side of the mountain range, and is bordered by the towns of Manchester, Rupert, and Danby. The town is located approximately 25 miles from the state capital of Montpelier, and is accessible via Route 7.
The town is home to several small lakes, including Lake St. Catherine, Lake Bomoseen, and Lake Hortonia. The town is also home to several small streams, including the Dorset Brook and the Mettawee River. The town is home to several small parks, including the Dorset Town Park and the Dorset Recreation Area.
Economy
Dorset is a small, rural town, and its economy is largely based on agriculture and tourism. The town is home to several small farms, which produce a variety of crops, including corn, hay, and apples. The town is also home to several small businesses, including restaurants, shops, and galleries. The town is also home to several small manufacturing companies, which produce a variety of products, including furniture, clothing, and jewelry.
The town is also home to several small resorts, which attract tourists from all over the world. The town is home to several ski resorts, including the Dorset Mountain Resort and the Bromley Mountain Ski Resort. The town is also home to several golf courses, including the Dorset Country Club and the Dorset Golf Course.
Demographics
As of the 2010 census, the town had a population of 2,031 people. The racial makeup of the town was 97.3% White, 0.7% African American, 0.3% Native American, 0.3% Asian, 0.1% Pacific Islander, 0.2% from other races, and 1.2% from two or more races. Hispanic or Latino of any race were 1.2% of the population.
The median income for a household in the town was $50,938, and the median income for a family was $60,000. The per capita income for the town was $27,845. About 5.2% of families and 8.2% of the population were below the poverty line, including 10.2% of those under age 18 and 5.2% of those age 65 or over.
Conclusion
Dorset, Vermont is a small town located in the southwestern corner of the state, in Bennington County. It is situated in the Taconic Mountains, and is bordered by the towns of Manchester, Rupert, and Danby. The town has a population of approximately 2,000 people, and is known for its rural charm and picturesque landscape. The town's economy is largely based on agriculture and tourism, and it is home to several small businesses, farms, and resorts. The town has a diverse population, with a median income of $50,938 and a per capita income of $27,845.
Common Questions
What is Per Capita Income in Dorset?
Per Capita income in Dorset is $57,759.
What is the Median Family Income in Dorset?
Median Family Income in Dorset is $150,726.
What is the Median Household income in Dorset?
Median Household Income in Dorset is $141,304.
What is Inequality or Gini Index in Dorset?
Inequality or Gini Index in Dorset is 0.27.
What is the Total Population of Dorset?
Total Population of Dorset is 374.
What is the Total Male Population of Dorset?
Total Male Population of Dorset is 206.
What is the Total Female Population of Dorset?
Total Female Population of Dorset is 168.
What is the Ratio of Males per 100 Females in Dorset?
There are 122.62 Males per 100 Females in Dorset.
What is the Ratio of Females per 100 Males in Dorset?
There are 81.55 Females per 100 Males in Dorset.
What is the Median Population Age in Dorset?
Median Population Age in Dorset is 52.8 Years.
What is the Average Family Size in Dorset
Average Family Size in Dorset is 2.8 People.
What is the Average Household Size in Dorset
Average Household Size in Dorset is 2.2 People.
How Large is the Labor Force in Dorset?
There are 139 People in the Labor Forcein in Dorset.
What is the Percentage of People in the Labor Force in Dorset?
44.1% of People are in the Labor Force in Dorset.