Chelsea, VT Map & Demographics
Chelsea Map
Chelsea Overview
$35,192
PER CAPITA INCOME
$42,969
AVG HOUSEHOLD INCOME
16.7%
WAGE / INCOME GAP [ % ]
83.3¢/ $1
WAGE / INCOME GAP [ $ ]
0.50
INEQUALITY / GINI INDEX
486
TOTAL POPULATION
244
MALE POPULATION
242
FEMALE POPULATION
100.83
MALES / 100 FEMALES
99.18
FEMALES / 100 MALES
34.6
MEDIAN AGE
3.0
AVG FAMILY SIZE
2.2
AVG HOUSEHOLD SIZE
202
LABOR FORCE [ PEOPLE ]
56.4%
PERCENT IN LABOR FORCE
7.4%
UNEMPLOYMENT RATE
Chelsea Zip Codes
Chelsea Area Codes
Income in Chelsea
Income Overview in Chelsea
| Characteristic | Number | Measure |
| Per Capita Income | 486 | $35,192 |
| Median Family Income | 112 | $0 |
| Mean Family Income | 112 | $93,780 |
| Median Household Income | 212 | $42,969 |
| Mean Household Income | 212 | $78,930 |
| Income Deficit | 112 | $0 |
| Wage / Income Gap (%) | 486 | 16.71% |
| Wage / Income Gap ($) | 486 | 83.29¢ per $1 |
| Gini / Inequality Index | 486 | 0.50 |
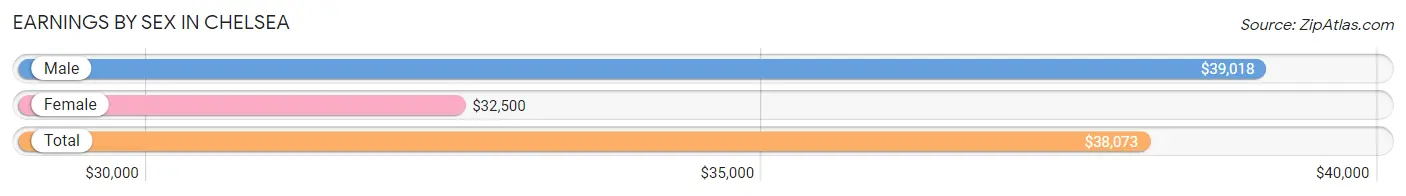
Earnings by Sex in Chelsea
Average Earnings in Chelsea are $38,073, $39,018 for men and $32,500 for women, a difference of 16.7%.
| Sex | Number | Average Earnings |
| Male | 95 (45.0%) | $39,018 |
| Female | 116 (55.0%) | $32,500 |
| Total | 211 (100.0%) | $38,073 |
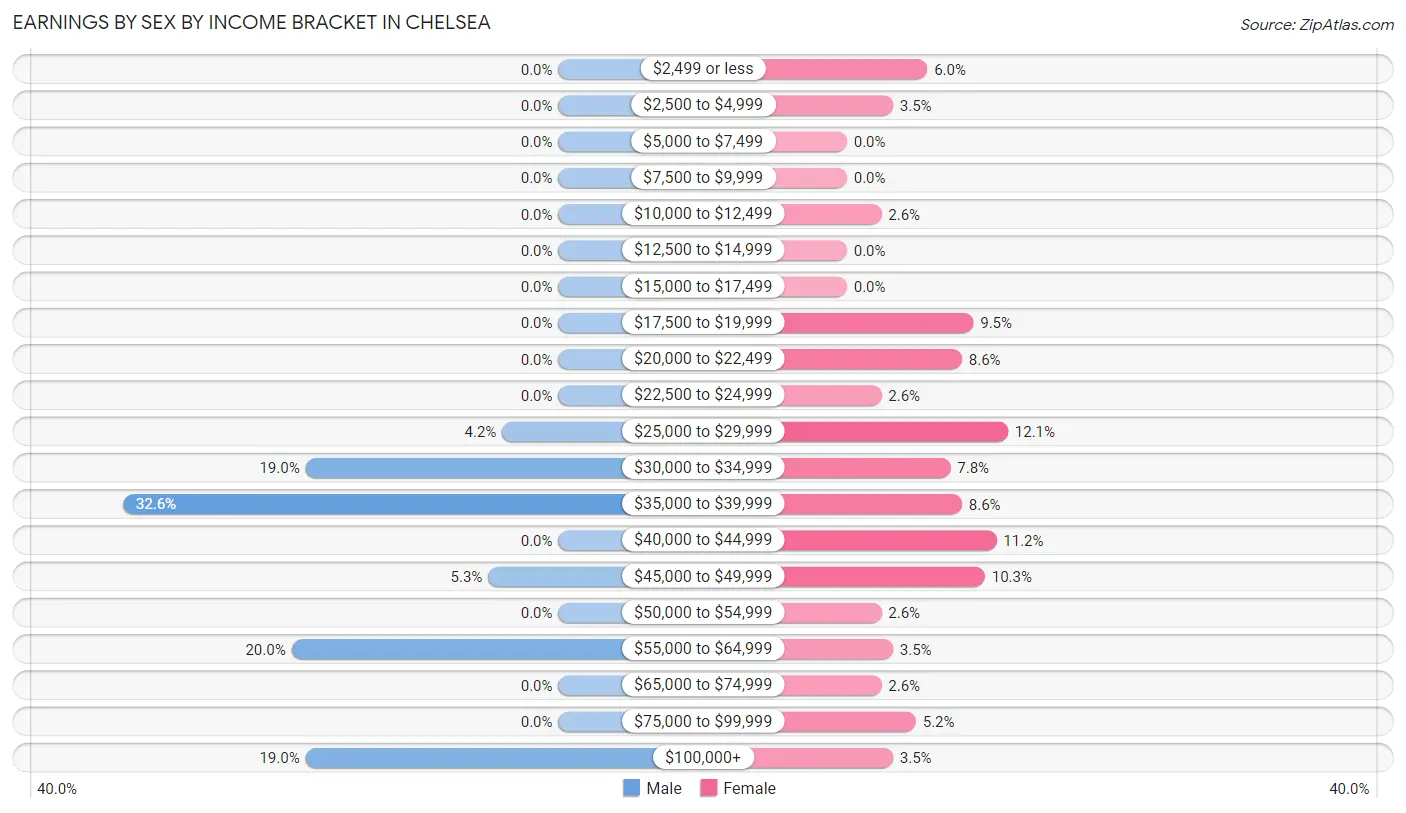
Earnings by Sex by Income Bracket in Chelsea
The most common earnings brackets in Chelsea are $35,000 to $39,999 for men (31 | 32.6%) and $25,000 to $29,999 for women (14 | 12.1%).
| Income | Male | Female |
| $2,499 or less | 0 (0.0%) | 7 (6.0%) |
| $2,500 to $4,999 | 0 (0.0%) | 4 (3.5%) |
| $5,000 to $7,499 | 0 (0.0%) | 0 (0.0%) |
| $7,500 to $9,999 | 0 (0.0%) | 0 (0.0%) |
| $10,000 to $12,499 | 0 (0.0%) | 3 (2.6%) |
| $12,500 to $14,999 | 0 (0.0%) | 0 (0.0%) |
| $15,000 to $17,499 | 0 (0.0%) | 0 (0.0%) |
| $17,500 to $19,999 | 0 (0.0%) | 11 (9.5%) |
| $20,000 to $22,499 | 0 (0.0%) | 10 (8.6%) |
| $22,500 to $24,999 | 0 (0.0%) | 3 (2.6%) |
| $25,000 to $29,999 | 4 (4.2%) | 14 (12.1%) |
| $30,000 to $34,999 | 18 (19.0%) | 9 (7.8%) |
| $35,000 to $39,999 | 31 (32.6%) | 10 (8.6%) |
| $40,000 to $44,999 | 0 (0.0%) | 13 (11.2%) |
| $45,000 to $49,999 | 5 (5.3%) | 12 (10.3%) |
| $50,000 to $54,999 | 0 (0.0%) | 3 (2.6%) |
| $55,000 to $64,999 | 19 (20.0%) | 4 (3.5%) |
| $65,000 to $74,999 | 0 (0.0%) | 3 (2.6%) |
| $75,000 to $99,999 | 0 (0.0%) | 6 (5.2%) |
| $100,000+ | 18 (19.0%) | 4 (3.5%) |
| Total | 95 (100.0%) | 116 (100.0%) |
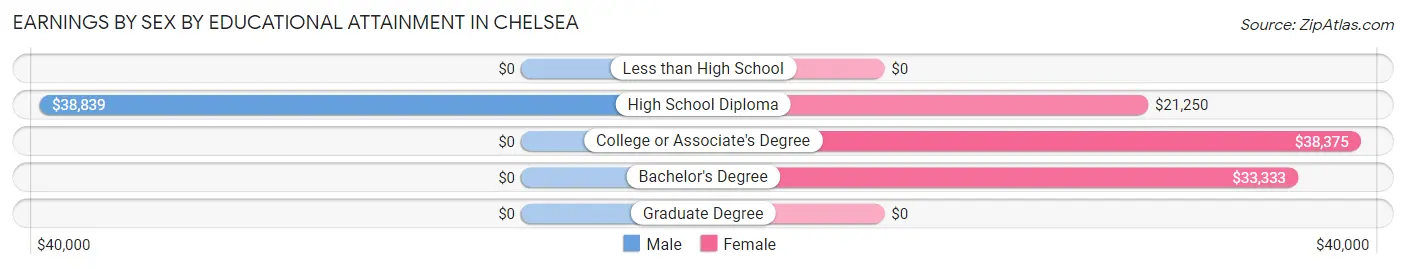
Earnings by Sex by Educational Attainment in Chelsea
Average earnings in Chelsea are $45,750 for men and $32,500 for women, a difference of 29.0%. Men with an educational attainment of high school diploma enjoy the highest average annual earnings of $38,839, while those with high school diploma education earn the least with $38,839. Women with an educational attainment of college or associate's degree earn the most with the average annual earnings of $38,375, while those with high school diploma education have the smallest earnings of $21,250.
| Educational Attainment | Male Income | Female Income |
| Less than High School | - | - |
| High School Diploma | $38,839 | $21,250 |
| College or Associate's Degree | - | - |
| Bachelor's Degree | - | - |
| Graduate Degree | - | - |
| Total | $45,750 | $32,500 |
Family Income in Chelsea
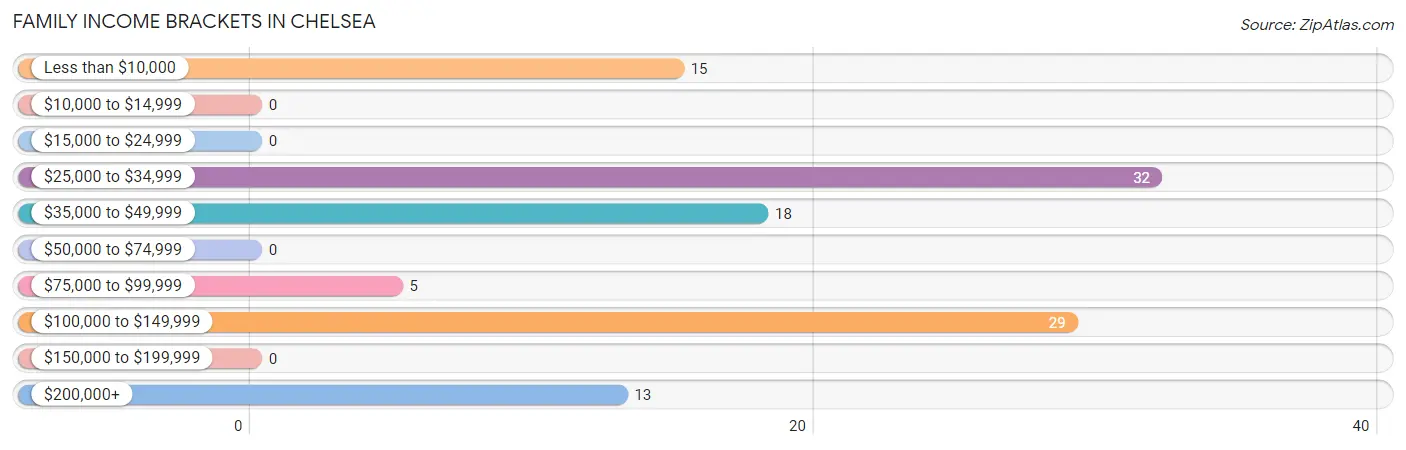
Family Income Brackets in Chelsea
According to the Chelsea family income data, there are 32 families falling into the $25,000 to $34,999 income range, which is the most common income bracket and makes up 28.6% of all families.
| Income Bracket | # Families | % Families |
| Less than $10,000 | 15 | 13.4% |
| $10,000 to $14,999 | 0 | 0.0% |
| $15,000 to $24,999 | 0 | 0.0% |
| $25,000 to $34,999 | 32 | 28.6% |
| $35,000 to $49,999 | 18 | 16.1% |
| $50,000 to $74,999 | 0 | 0.0% |
| $75,000 to $99,999 | 5 | 4.5% |
| $100,000 to $149,999 | 29 | 25.9% |
| $150,000 to $199,999 | 0 | 0.0% |
| $200,000+ | 13 | 11.6% |
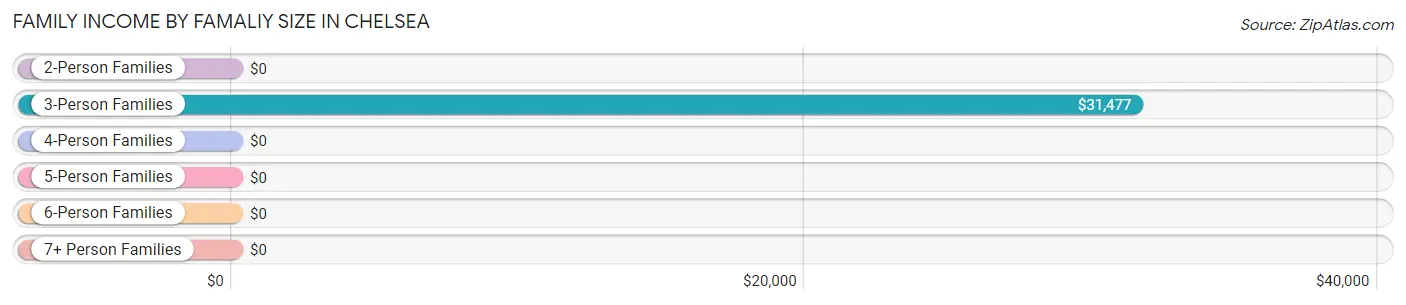
Family Income by Famaliy Size in Chelsea
3-person families (43 | 38.4%) account for the highest median family income in Chelsea with $31,477 per family, while 3-person families (43 | 38.4%) have the highest median income of $10,492 per family member.
| Income Bracket | # Families | Median Income |
| 2-Person Families | 27 (24.1%) | $0 |
| 3-Person Families | 43 (38.4%) | $31,477 |
| 4-Person Families | 30 (26.8%) | $0 |
| 5-Person Families | 12 (10.7%) | $0 |
| 6-Person Families | 0 (0.0%) | $0 |
| 7+ Person Families | 0 (0.0%) | $0 |
| Total | 112 (100.0%) | $0 |
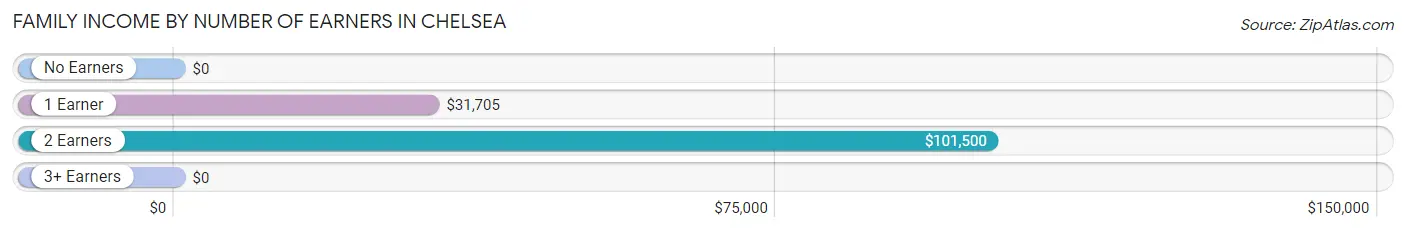
Family Income by Number of Earners in Chelsea
| Number of Earners | # Families | Median Income |
| No Earners | 37 (33.0%) | $0 |
| 1 Earner | 37 (33.0%) | $31,705 |
| 2 Earners | 34 (30.4%) | $101,500 |
| 3+ Earners | 4 (3.6%) | $0 |
| Total | 112 (100.0%) | $0 |
Household Income in Chelsea
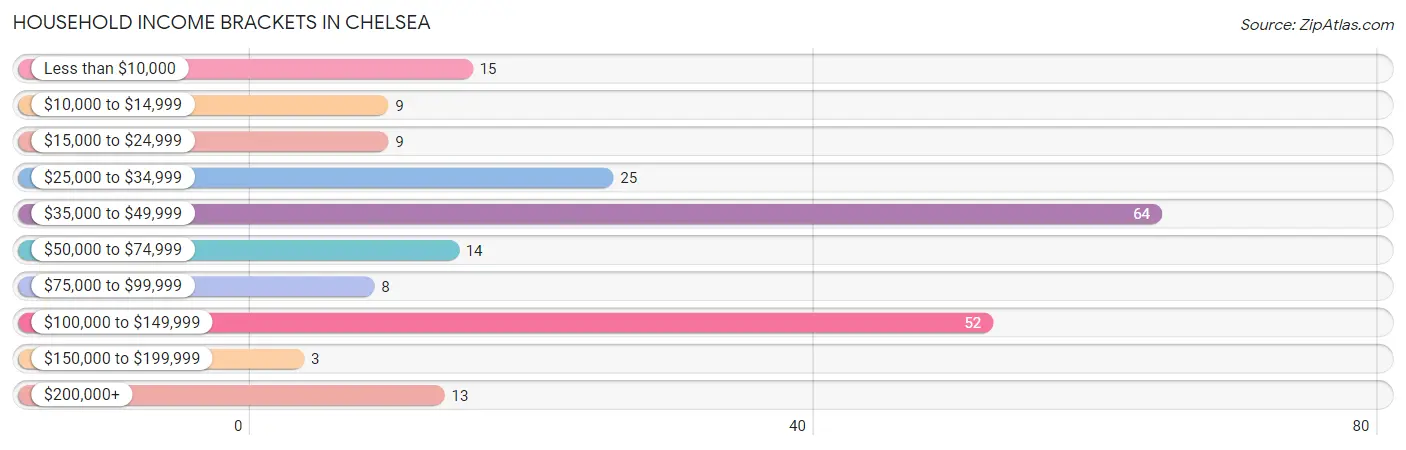
Household Income Brackets in Chelsea
With 64 households falling in the category, the $35,000 to $49,999 income range is the most frequent in Chelsea, accounting for 30.2% of all households. In contrast, only 3 households (1.4%) fall into the $150,000 to $199,999 income bracket, making it the least populous group.
| Income Bracket | # Households | % Households |
| Less than $10,000 | 15 | 7.1% |
| $10,000 to $14,999 | 9 | 4.2% |
| $15,000 to $24,999 | 9 | 4.2% |
| $25,000 to $34,999 | 25 | 11.8% |
| $35,000 to $49,999 | 64 | 30.2% |
| $50,000 to $74,999 | 14 | 6.6% |
| $75,000 to $99,999 | 8 | 3.8% |
| $100,000 to $149,999 | 52 | 24.5% |
| $150,000 to $199,999 | 3 | 1.4% |
| $200,000+ | 13 | 6.1% |
Household Income by Householder Age in Chelsea
| Income Bracket | # Households | Median Income |
| 15 to 24 Years | 14 (6.6%) | $0 |
| 25 to 44 Years | 87 (41.0%) | $0 |
| 45 to 64 Years | 49 (23.1%) | $0 |
| 65+ Years | 62 (29.2%) | $0 |
| Total | 212 (100.0%) | $42,969 |
Poverty in Chelsea
Income Below Poverty by Sex and Age in Chelsea
With 13.4% poverty level for males and 23.7% for females among the residents of Chelsea, 5 year old males and 6 to 11 year old females are the most vulnerable to poverty, with 3 males (100.0%) and 32 females (86.5%) in their respective age groups living below the poverty level.
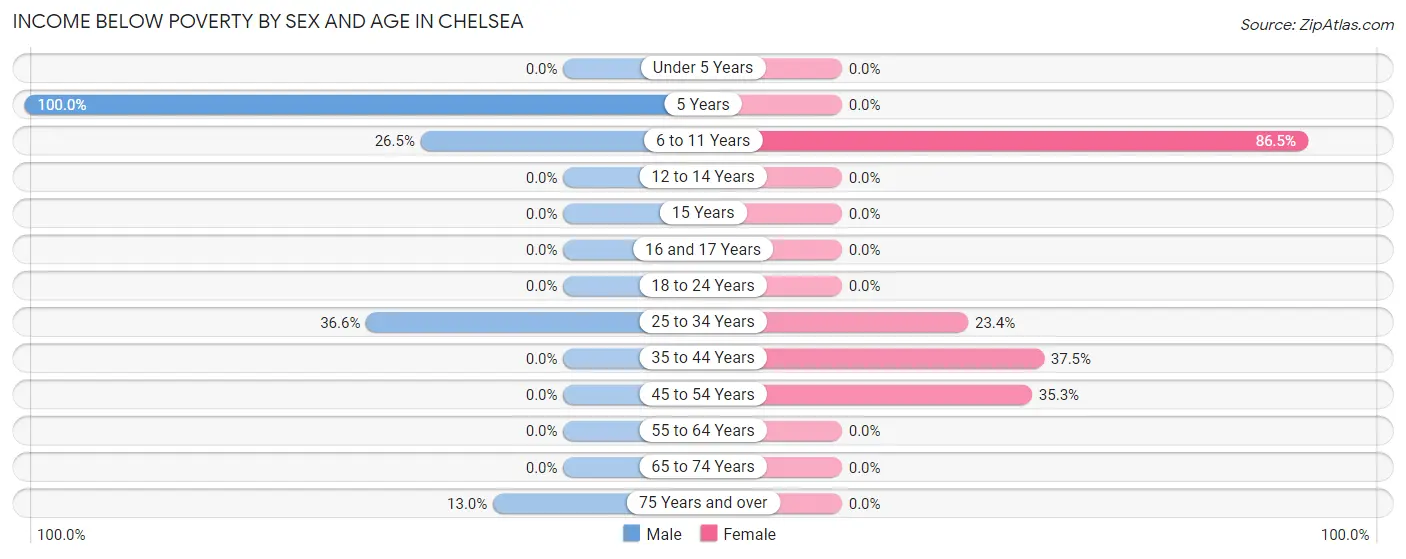
| Age Bracket | Male | Female |
| Under 5 Years | 0 (0.0%) | 0 (0.0%) |
| 5 Years | 3 (100.0%) | 0 (0.0%) |
| 6 to 11 Years | 9 (26.5%) | 32 (86.5%) |
| 12 to 14 Years | 0 (0.0%) | 0 (0.0%) |
| 15 Years | 0 (0.0%) | 0 (0.0%) |
| 16 and 17 Years | 0 (0.0%) | 0 (0.0%) |
| 18 to 24 Years | 0 (0.0%) | 0 (0.0%) |
| 25 to 34 Years | 15 (36.6%) | 15 (23.4%) |
| 35 to 44 Years | 0 (0.0%) | 3 (37.5%) |
| 45 to 54 Years | 0 (0.0%) | 6 (35.3%) |
| 55 to 64 Years | 0 (0.0%) | 0 (0.0%) |
| 65 to 74 Years | 0 (0.0%) | 0 (0.0%) |
| 75 Years and over | 3 (13.0%) | 0 (0.0%) |
| Total | 30 (13.4%) | 56 (23.7%) |
Income Above Poverty by Sex and Age in Chelsea
According to the poverty statistics in Chelsea, males aged under 5 years and females aged under 5 years are the age groups that are most secure financially, with 100.0% of males and 100.0% of females in these age groups living above the poverty line.
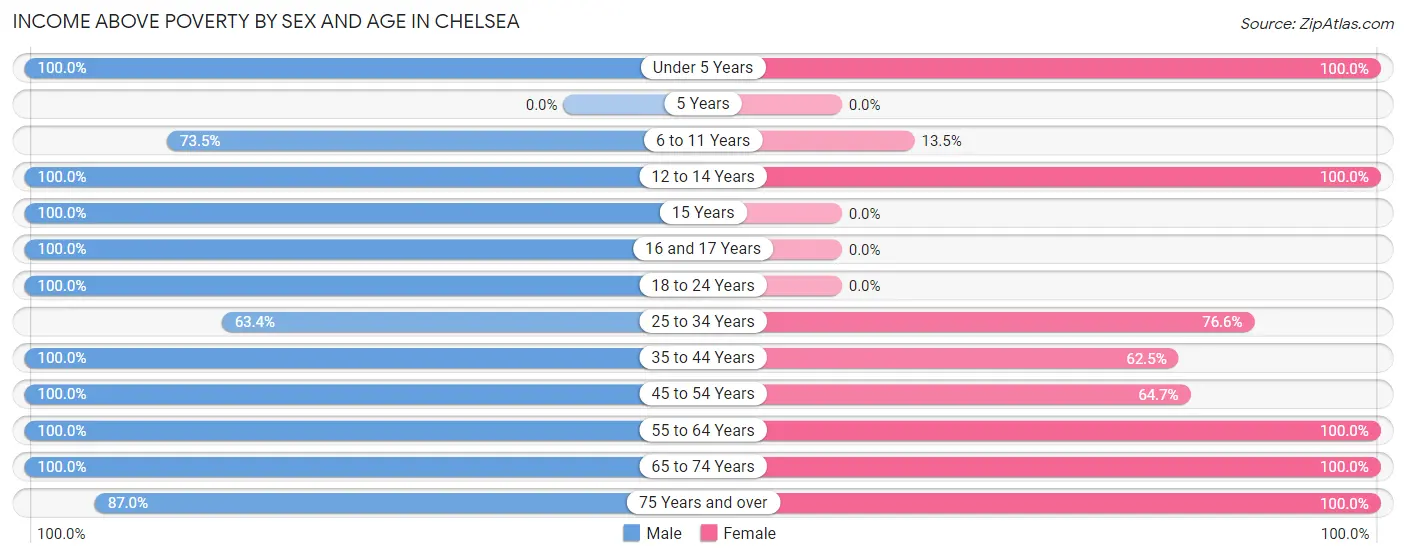
| Age Bracket | Male | Female |
| Under 5 Years | 5 (100.0%) | 17 (100.0%) |
| 5 Years | 0 (0.0%) | 0 (0.0%) |
| 6 to 11 Years | 25 (73.5%) | 5 (13.5%) |
| 12 to 14 Years | 9 (100.0%) | 10 (100.0%) |
| 15 Years | 10 (100.0%) | 0 (0.0%) |
| 16 and 17 Years | 9 (100.0%) | 0 (0.0%) |
| 18 to 24 Years | 14 (100.0%) | 0 (0.0%) |
| 25 to 34 Years | 26 (63.4%) | 49 (76.6%) |
| 35 to 44 Years | 36 (100.0%) | 5 (62.5%) |
| 45 to 54 Years | 17 (100.0%) | 11 (64.7%) |
| 55 to 64 Years | 10 (100.0%) | 30 (100.0%) |
| 65 to 74 Years | 13 (100.0%) | 28 (100.0%) |
| 75 Years and over | 20 (87.0%) | 25 (100.0%) |
| Total | 194 (86.6%) | 180 (76.3%) |
Income Below Poverty Among Married-Couple Families in Chelsea
The poverty statistics for married-couple families in Chelsea show that 15.1% or 11 of the total 73 families live below the poverty line. Families with 1 or 2 children have the highest poverty rate of 36.7%, comprising of 11 families. On the other hand, families with no children have the lowest poverty rate of 0.0%, which includes 0 families.
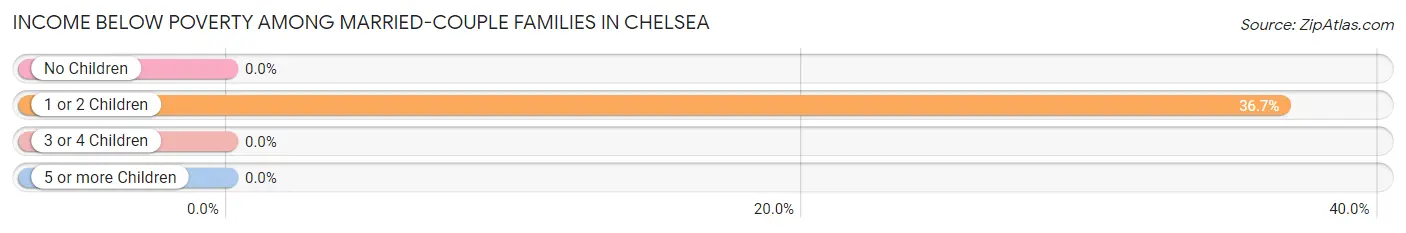
| Children | Above Poverty | Below Poverty |
| No Children | 31 (100.0%) | 0 (0.0%) |
| 1 or 2 Children | 19 (63.3%) | 11 (36.7%) |
| 3 or 4 Children | 12 (100.0%) | 0 (0.0%) |
| 5 or more Children | 0 (0.0%) | 0 (0.0%) |
| Total | 62 (84.9%) | 11 (15.1%) |
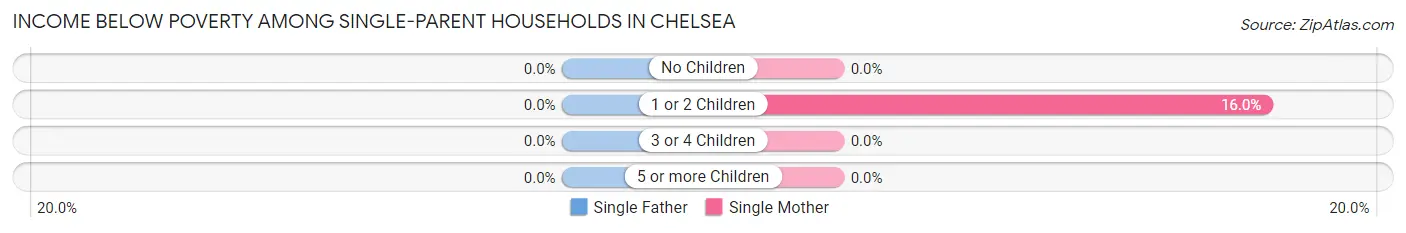
Income Below Poverty Among Single-Parent Households in Chelsea
| Children | Single Father | Single Mother |
| No Children | 0 (0.0%) | 0 (0.0%) |
| 1 or 2 Children | 0 (0.0%) | 4 (16.0%) |
| 3 or 4 Children | 0 (0.0%) | 0 (0.0%) |
| 5 or more Children | 0 (0.0%) | 0 (0.0%) |
| Total | 0 (0.0%) | 4 (14.3%) |
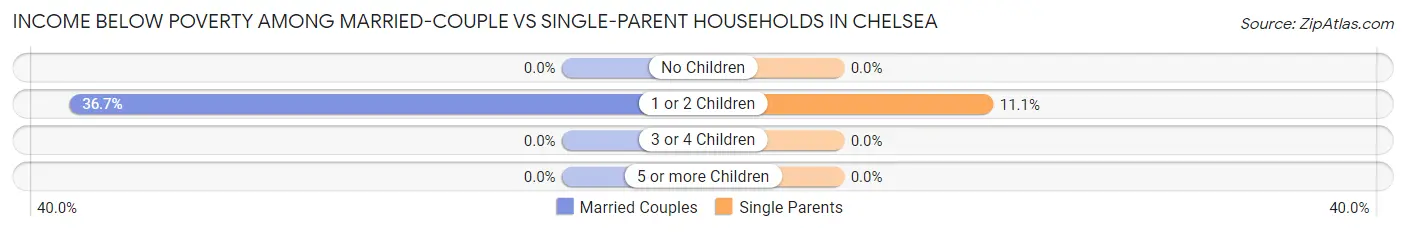
Income Below Poverty Among Married-Couple vs Single-Parent Households in Chelsea
The poverty data for Chelsea shows that 11 of the married-couple family households (15.1%) and 4 of the single-parent households (10.3%) are living below the poverty level. Within the married-couple family households, those with 1 or 2 children have the highest poverty rate, with 11 households (36.7%) falling below the poverty line. Among the single-parent households, those with 1 or 2 children have the highest poverty rate, with 4 household (11.1%) living below poverty.
| Children | Married-Couple Families | Single-Parent Households |
| No Children | 0 (0.0%) | 0 (0.0%) |
| 1 or 2 Children | 11 (36.7%) | 4 (11.1%) |
| 3 or 4 Children | 0 (0.0%) | 0 (0.0%) |
| 5 or more Children | 0 (0.0%) | 0 (0.0%) |
| Total | 11 (15.1%) | 4 (10.3%) |
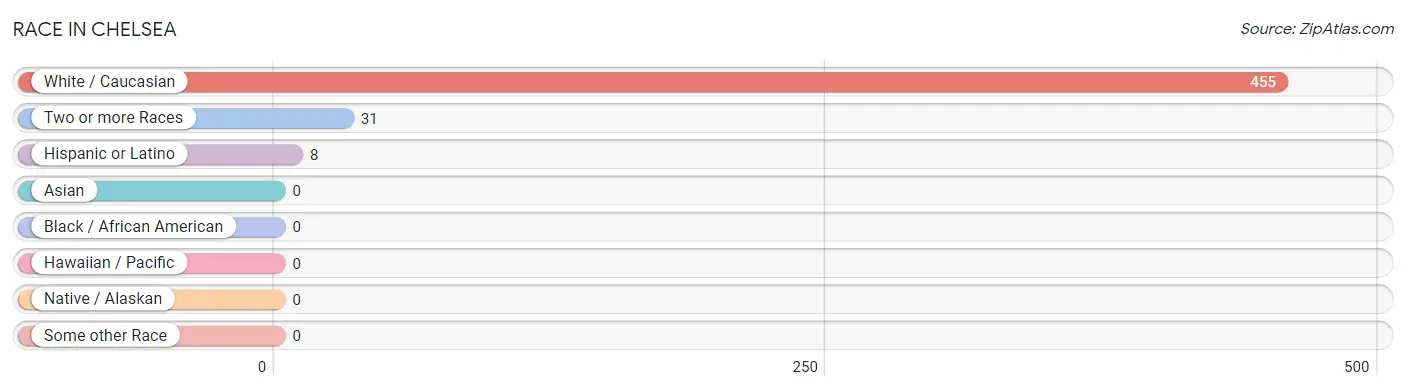
Race in Chelsea
The most populous races in Chelsea are White / Caucasian (455 | 93.6%), Two or more Races (31 | 6.4%), and Hispanic or Latino (8 | 1.7%).
| Race | # Population | % Population |
| Asian | 0 | 0.0% |
| Black / African American | 0 | 0.0% |
| Hawaiian / Pacific | 0 | 0.0% |
| Hispanic or Latino | 8 | 1.7% |
| Native / Alaskan | 0 | 0.0% |
| White / Caucasian | 455 | 93.6% |
| Two or more Races | 31 | 6.4% |
| Some other Race | 0 | 0.0% |
| Total | 486 | 100.0% |
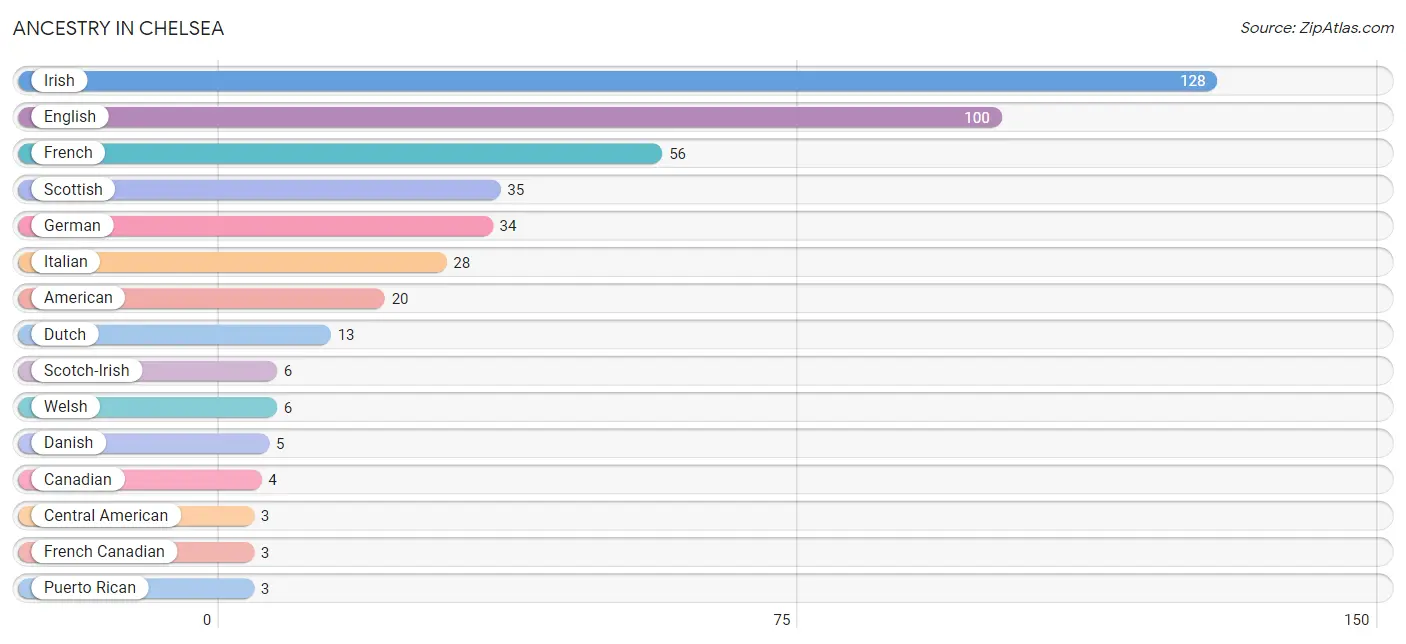
Ancestry in Chelsea
The most populous ancestries reported in Chelsea are Irish (128 | 26.3%), English (100 | 20.6%), French (56 | 11.5%), Scottish (35 | 7.2%), and German (34 | 7.0%), together accounting for 72.6% of all Chelsea residents.
| Ancestry | # Population | % Population |
| American | 20 | 4.1% |
| Canadian | 4 | 0.8% |
| Central American | 3 | 0.6% |
| Danish | 5 | 1.0% |
| Dutch | 13 | 2.7% |
| English | 100 | 20.6% |
| French | 56 | 11.5% |
| French Canadian | 3 | 0.6% |
| German | 34 | 7.0% |
| Irish | 128 | 26.3% |
| Italian | 28 | 5.8% |
| Polish | 2 | 0.4% |
| Puerto Rican | 3 | 0.6% |
| Salvadoran | 3 | 0.6% |
| Scotch-Irish | 6 | 1.2% |
| Scottish | 35 | 7.2% |
| Welsh | 6 | 1.2% | View All 17 Rows |
Immigrants in Chelsea

| Immigration Origin | # Population | % Population | View All 0 Rows |
Sex and Age in Chelsea
Sex and Age in Chelsea
The most populous age groups in Chelsea are 10 to 14 Years (31 | 12.7%) for men and 10 to 14 Years (39 | 16.1%) for women.
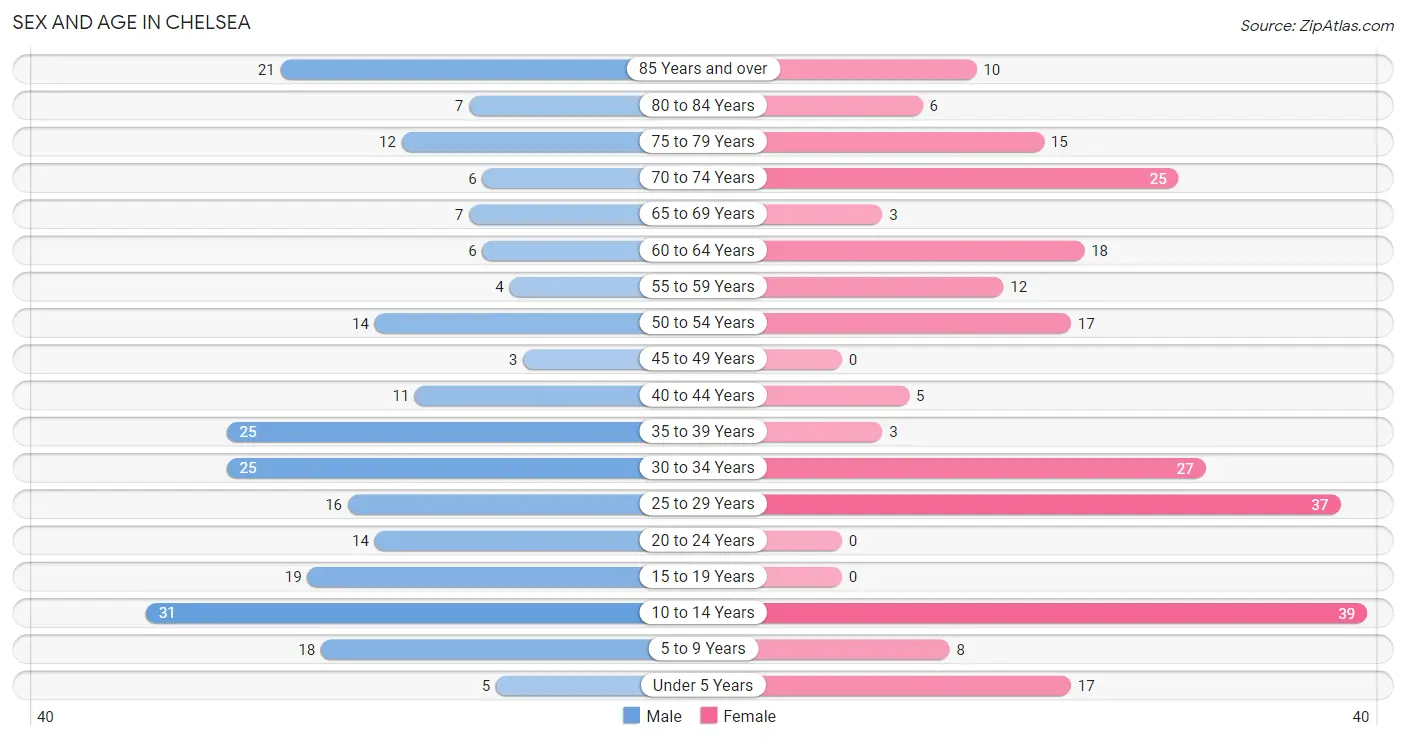
| Age Bracket | Male | Female |
| Under 5 Years | 5 (2.1%) | 17 (7.0%) |
| 5 to 9 Years | 18 (7.4%) | 8 (3.3%) |
| 10 to 14 Years | 31 (12.7%) | 39 (16.1%) |
| 15 to 19 Years | 19 (7.8%) | 0 (0.0%) |
| 20 to 24 Years | 14 (5.7%) | 0 (0.0%) |
| 25 to 29 Years | 16 (6.6%) | 37 (15.3%) |
| 30 to 34 Years | 25 (10.2%) | 27 (11.2%) |
| 35 to 39 Years | 25 (10.2%) | 3 (1.2%) |
| 40 to 44 Years | 11 (4.5%) | 5 (2.1%) |
| 45 to 49 Years | 3 (1.2%) | 0 (0.0%) |
| 50 to 54 Years | 14 (5.7%) | 17 (7.0%) |
| 55 to 59 Years | 4 (1.6%) | 12 (5.0%) |
| 60 to 64 Years | 6 (2.5%) | 18 (7.4%) |
| 65 to 69 Years | 7 (2.9%) | 3 (1.2%) |
| 70 to 74 Years | 6 (2.5%) | 25 (10.3%) |
| 75 to 79 Years | 12 (4.9%) | 15 (6.2%) |
| 80 to 84 Years | 7 (2.9%) | 6 (2.5%) |
| 85 Years and over | 21 (8.6%) | 10 (4.1%) |
| Total | 244 (100.0%) | 242 (100.0%) |
Families and Households in Chelsea
Median Family Size in Chelsea
The median family size in Chelsea is 2.98 persons per family, with married-couple families (73 | 65.2%) accounting for the largest median family size of 3.1 persons per family. On the other hand, single male/father families (11 | 9.8%) represent the smallest median family size with 2.73 persons per family.
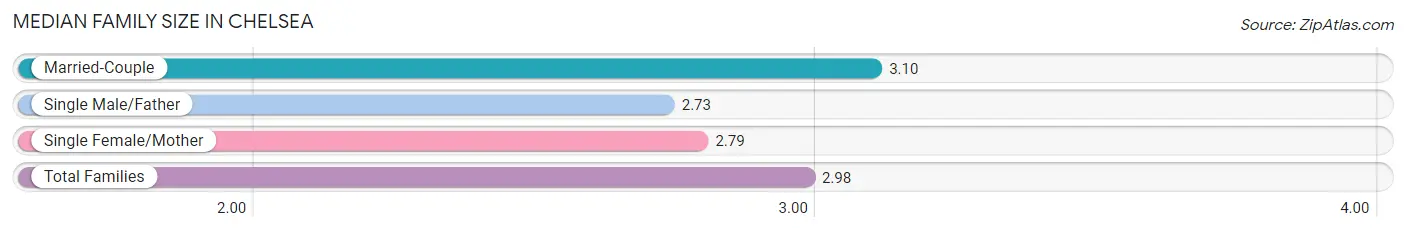
| Family Type | # Families | Family Size |
| Married-Couple | 73 (65.2%) | 3.10 |
| Single Male/Father | 11 (9.8%) | 2.73 |
| Single Female/Mother | 28 (25.0%) | 2.79 |
| Total Families | 112 (100.0%) | 2.98 |
Median Household Size in Chelsea
The median household size in Chelsea is 2.17 persons per household, with single female/mother households (28 | 13.2%) accounting for the largest median household size of 3.14 persons per household. non-family households (100 | 47.2%) represent the smallest median household size with 1.16 persons per household.
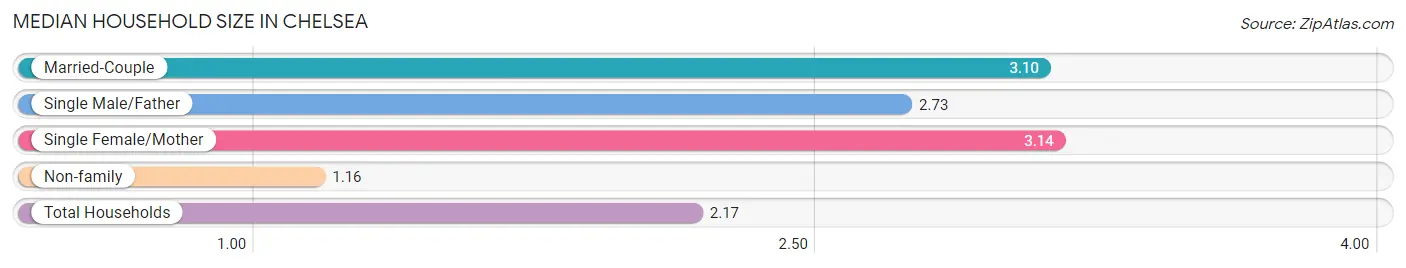
| Household Type | # Households | Household Size |
| Married-Couple | 73 (34.4%) | 3.10 |
| Single Male/Father | 11 (5.2%) | 2.73 |
| Single Female/Mother | 28 (13.2%) | 3.14 |
| Non-family | 100 (47.2%) | 1.16 |
| Total Households | 212 (100.0%) | 2.17 |
Household Size by Marriage Status in Chelsea
Out of a total of 212 households in Chelsea, 112 (52.8%) are family households, while 100 (47.2%) are nonfamily households. The most numerous type of family households are 4-person households, comprising 41, and the most common type of nonfamily households are 1-person households, comprising 85.
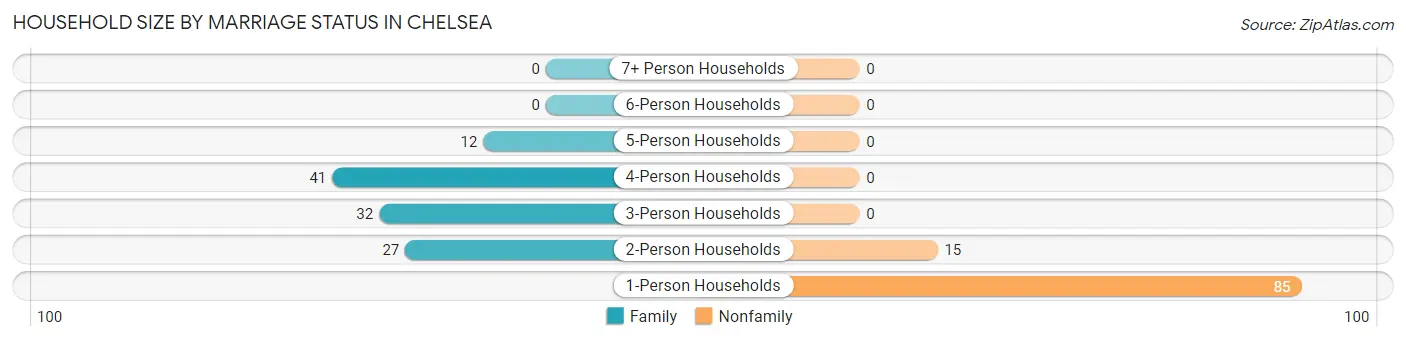
| Household Size | Family Households | Nonfamily Households |
| 1-Person Households | - | 85 (40.1%) |
| 2-Person Households | 27 (12.7%) | 15 (7.1%) |
| 3-Person Households | 32 (15.1%) | 0 (0.0%) |
| 4-Person Households | 41 (19.3%) | 0 (0.0%) |
| 5-Person Households | 12 (5.7%) | 0 (0.0%) |
| 6-Person Households | 0 (0.0%) | 0 (0.0%) |
| 7+ Person Households | 0 (0.0%) | 0 (0.0%) |
| Total | 112 (52.8%) | 100 (47.2%) |
Female Fertility in Chelsea
Fertility by Age in Chelsea
| Age Bracket | Women with Births | Births / 1,000 Women |
| 15 to 19 years | 0 (0.0%) | 0.0 |
| 20 to 34 years | 0 (0.0%) | 0.0 |
| 35 to 50 years | 0 (0.0%) | 0.0 |
| Total | 0 (0.0%) | 0.0 |
Fertility by Age by Marriage Status in Chelsea
| Age Bracket | Married | Unmarried |
| 15 to 19 years | 0 (0.0%) | 0 (0.0%) |
| 20 to 34 years | 0 (0.0%) | 0 (0.0%) |
| 35 to 50 years | 0 (0.0%) | 0 (0.0%) |
| Total | 0 (0.0%) | 0 (0.0%) |
Fertility by Education in Chelsea
| Educational Attainment | Women with Births | Births / 1,000 Women |
| Less than High School | 0 (0.0%) | 0.0 |
| High School Diploma | 0 (0.0%) | 0.0 |
| College or Associate's Degree | 0 (0.0%) | 0.0 |
| Bachelor's Degree | 0 (0.0%) | 0.0 |
| Graduate Degree | 0 (0.0%) | 0.0 |
| Total | 0 (0.0%) | 0.0 |
Fertility by Education by Marriage Status in Chelsea
| Educational Attainment | Married | Unmarried |
| Less than High School | 0 (0.0%) | 0 (0.0%) |
| High School Diploma | 0 (0.0%) | 0 (0.0%) |
| College or Associate's Degree | 0 (0.0%) | 0 (0.0%) |
| Bachelor's Degree | 0 (0.0%) | 0 (0.0%) |
| Graduate Degree | 0 (0.0%) | 0 (0.0%) |
| Total | 0 (0.0%) | 0 (0.0%) |
Employment Characteristics in Chelsea
Employment by Class of Employer in Chelsea
Among the 183 employed individuals in Chelsea, private company employees (80 | 43.7%), not-for-profit organizations (31 | 16.9%), and self-employed (not incorporated) (28 | 15.3%) make up the most common classes of employment.
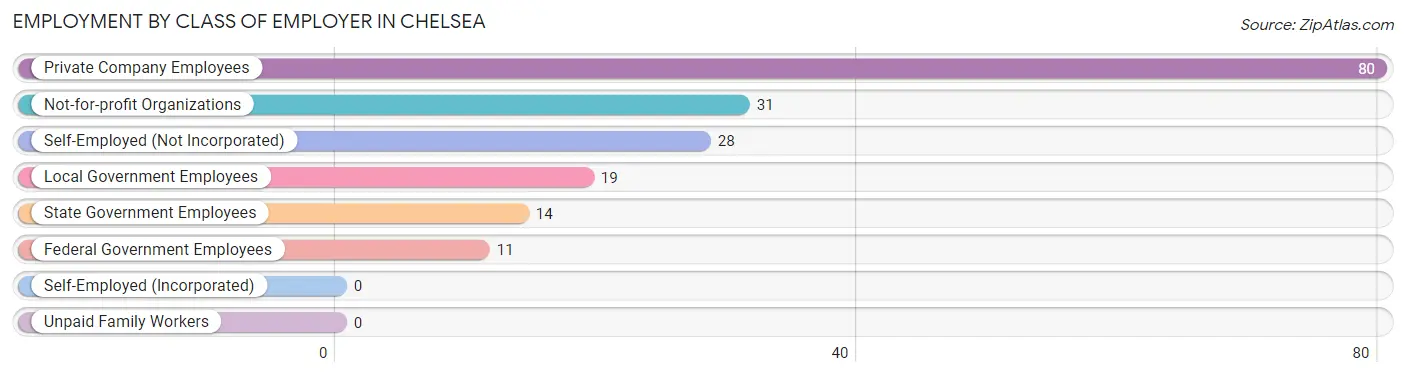
| Employer Class | # Employees | % Employees |
| Private Company Employees | 80 | 43.7% |
| Self-Employed (Incorporated) | 0 | 0.0% |
| Self-Employed (Not Incorporated) | 28 | 15.3% |
| Not-for-profit Organizations | 31 | 16.9% |
| Local Government Employees | 19 | 10.4% |
| State Government Employees | 14 | 7.6% |
| Federal Government Employees | 11 | 6.0% |
| Unpaid Family Workers | 0 | 0.0% |
| Total | 183 | 100.0% |
Employment Status by Age in Chelsea
According to the labor force statistics for Chelsea, out of the total population over 16 years of age (358), 56.4% or 202 individuals are in the labor force, with 7.4% or 15 of them unemployed. The age group with the highest labor force participation rate is 20 to 24 years, with 100.0% or 14 individuals in the labor force. Within the labor force, the 35 to 44 years age range has the highest percentage of unemployed individuals, with 33.3% or 11 of them being unemployed.
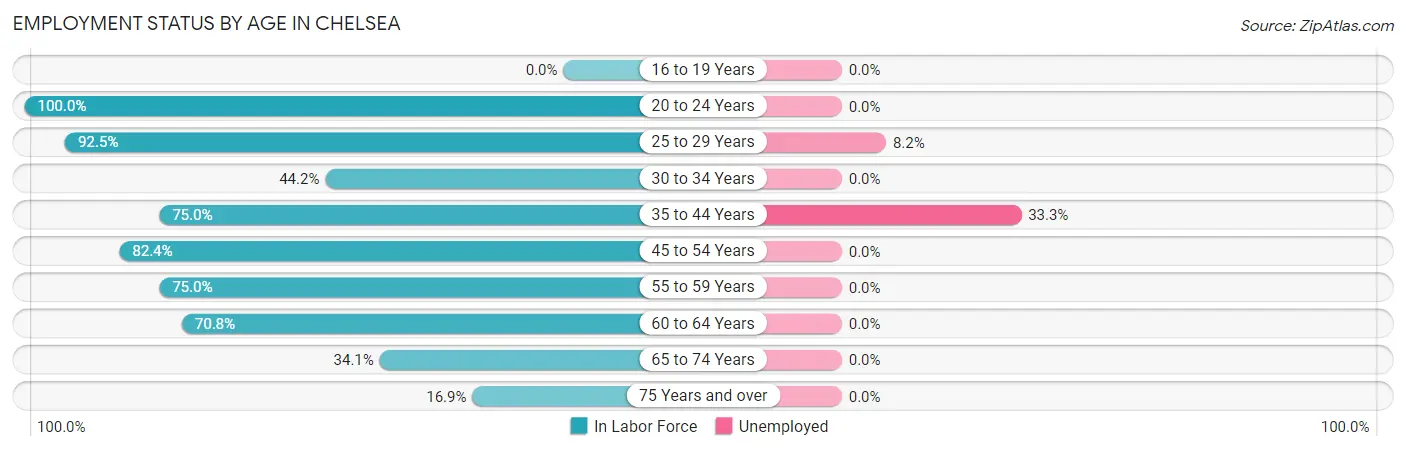
| Age Bracket | In Labor Force | Unemployed |
| 16 to 19 Years | 0 (0.0%) | 0 (0.0%) |
| 20 to 24 Years | 14 (100.0%) | 0 (0.0%) |
| 25 to 29 Years | 49 (92.5%) | 4 (8.2%) |
| 30 to 34 Years | 23 (44.2%) | 0 (0.0%) |
| 35 to 44 Years | 33 (75.0%) | 11 (33.3%) |
| 45 to 54 Years | 28 (82.4%) | 0 (0.0%) |
| 55 to 59 Years | 12 (75.0%) | 0 (0.0%) |
| 60 to 64 Years | 17 (70.8%) | 0 (0.0%) |
| 65 to 74 Years | 14 (34.1%) | 0 (0.0%) |
| 75 Years and over | 12 (16.9%) | 0 (0.0%) |
| Total | 202 (56.4%) | 15 (7.4%) |
Employment Status by Educational Attainment in Chelsea
According to labor force statistics for Chelsea, 72.6% of individuals (162) out of the total population between 25 and 64 years of age (223) are in the labor force, with 9.3% or 15 of them being unemployed. The group with the highest labor force participation rate are those with the educational attainment of bachelor's degree or higher, with 93.9% or 46 individuals in the labor force. Within the labor force, individuals with college / associate degree education have the highest percentage of unemployment, with 19.5% or 15 of them being unemployed.
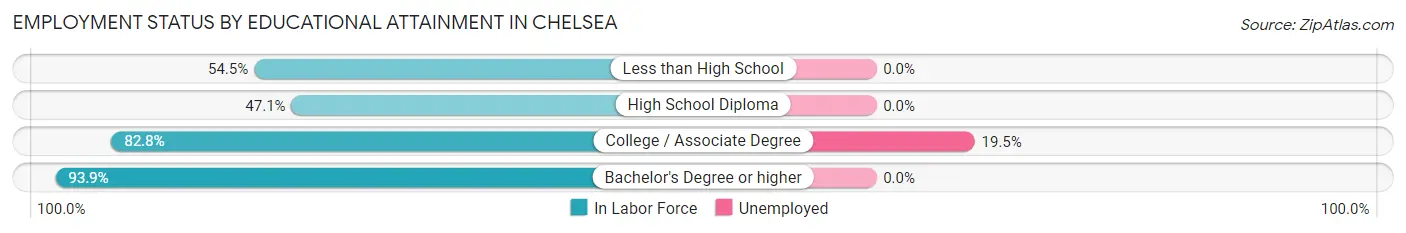
| Educational Attainment | In Labor Force | Unemployed |
| Less than High School | 6 (54.5%) | 0 (0.0%) |
| High School Diploma | 33 (47.1%) | 0 (0.0%) |
| College / Associate Degree | 77 (82.8%) | 18 (19.5%) |
| Bachelor's Degree or higher | 46 (93.9%) | 0 (0.0%) |
| Total | 162 (72.6%) | 21 (9.3%) |
Employment Occupations by Sex in Chelsea
Management, Business, Science and Arts Occupations
The most common Management, Business, Science and Arts occupations in Chelsea are Community & Social Service (28 | 15.0%), Management (18 | 9.6%), Education Instruction & Library (17 | 9.1%), Business & Financial (11 | 5.9%), and Computers, Engineering & Science (11 | 5.9%).
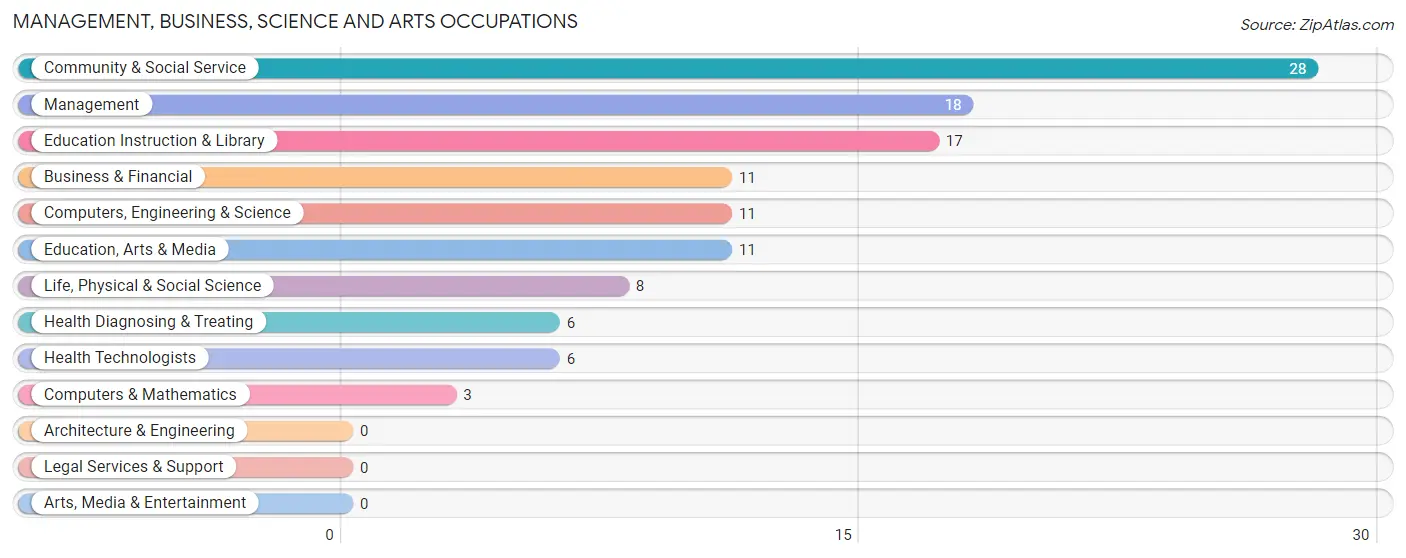
Management, Business, Science and Arts Occupations by Sex
Within the Management, Business, Science and Arts occupations in Chelsea, the most male-oriented occupations are Business & Financial (100.0%), Computers & Mathematics (100.0%), and Education, Arts & Media (100.0%), while the most female-oriented occupations are Education Instruction & Library (100.0%), Health Diagnosing & Treating (100.0%), and Health Technologists (100.0%).
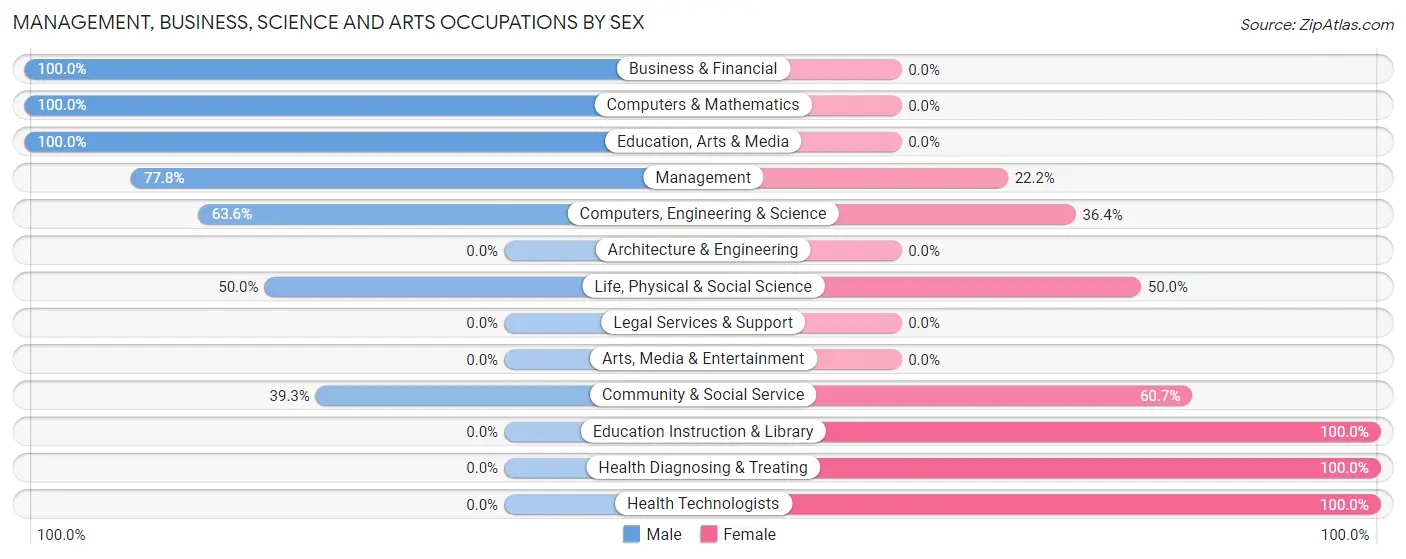
| Occupation | Male | Female |
| Management | 14 (77.8%) | 4 (22.2%) |
| Business & Financial | 11 (100.0%) | 0 (0.0%) |
| Computers, Engineering & Science | 7 (63.6%) | 4 (36.4%) |
| Computers & Mathematics | 3 (100.0%) | 0 (0.0%) |
| Architecture & Engineering | 0 (0.0%) | 0 (0.0%) |
| Life, Physical & Social Science | 4 (50.0%) | 4 (50.0%) |
| Community & Social Service | 11 (39.3%) | 17 (60.7%) |
| Education, Arts & Media | 11 (100.0%) | 0 (0.0%) |
| Legal Services & Support | 0 (0.0%) | 0 (0.0%) |
| Education Instruction & Library | 0 (0.0%) | 17 (100.0%) |
| Arts, Media & Entertainment | 0 (0.0%) | 0 (0.0%) |
| Health Diagnosing & Treating | 0 (0.0%) | 6 (100.0%) |
| Health Technologists | 0 (0.0%) | 6 (100.0%) |
| Total (Category) | 43 (58.1%) | 31 (41.9%) |
| Total (Overall) | 84 (44.9%) | 103 (55.1%) |
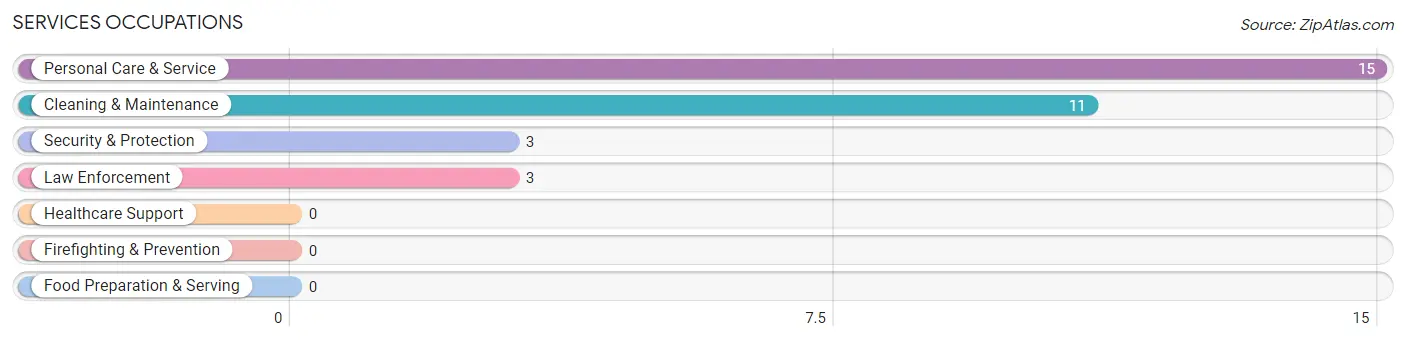
Services Occupations
The most common Services occupations in Chelsea are Personal Care & Service (15 | 8.0%), Cleaning & Maintenance (11 | 5.9%), Security & Protection (3 | 1.6%), and Law Enforcement (3 | 1.6%).
Services Occupations by Sex
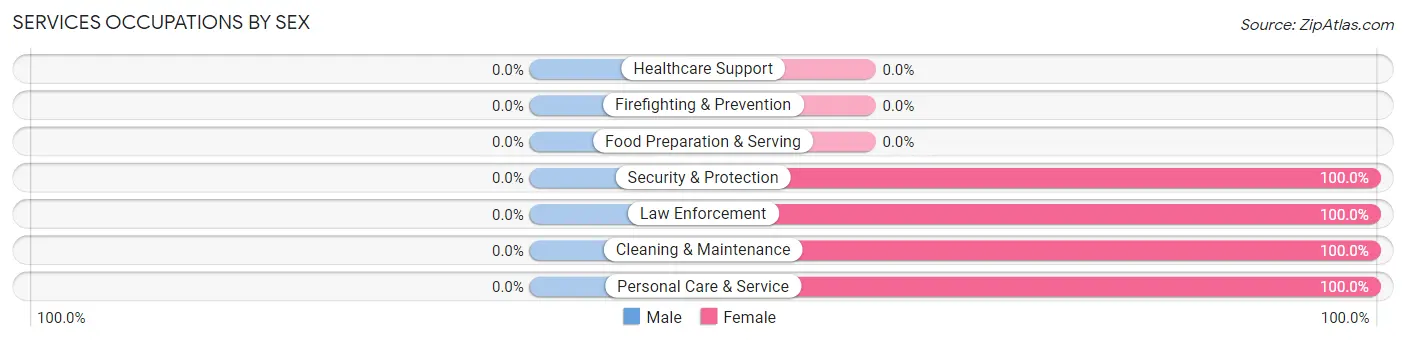
| Occupation | Male | Female |
| Healthcare Support | 0 (0.0%) | 0 (0.0%) |
| Security & Protection | 0 (0.0%) | 3 (100.0%) |
| Firefighting & Prevention | 0 (0.0%) | 0 (0.0%) |
| Law Enforcement | 0 (0.0%) | 3 (100.0%) |
| Food Preparation & Serving | 0 (0.0%) | 0 (0.0%) |
| Cleaning & Maintenance | 0 (0.0%) | 11 (100.0%) |
| Personal Care & Service | 0 (0.0%) | 15 (100.0%) |
| Total (Category) | 0 (0.0%) | 29 (100.0%) |
| Total (Overall) | 84 (44.9%) | 103 (55.1%) |
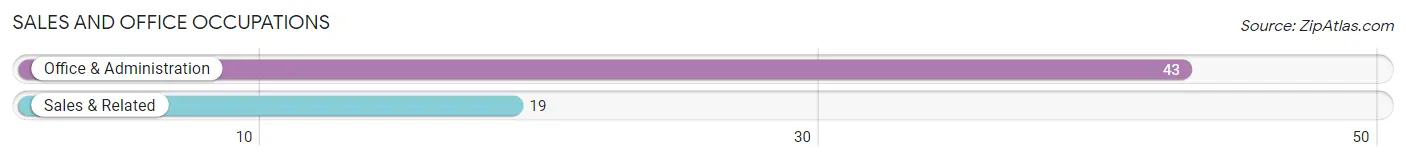
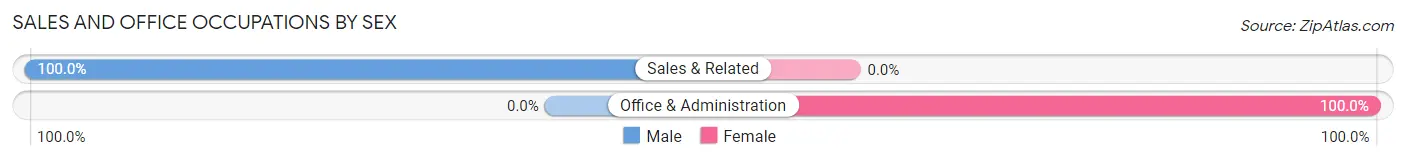
Sales and Office Occupations
The most common Sales and Office occupations in Chelsea are Office & Administration (43 | 23.0%), and Sales & Related (19 | 10.2%).
Sales and Office Occupations by Sex
| Occupation | Male | Female |
| Sales & Related | 19 (100.0%) | 0 (0.0%) |
| Office & Administration | 0 (0.0%) | 43 (100.0%) |
| Total (Category) | 19 (30.6%) | 43 (69.4%) |
| Total (Overall) | 84 (44.9%) | 103 (55.1%) |
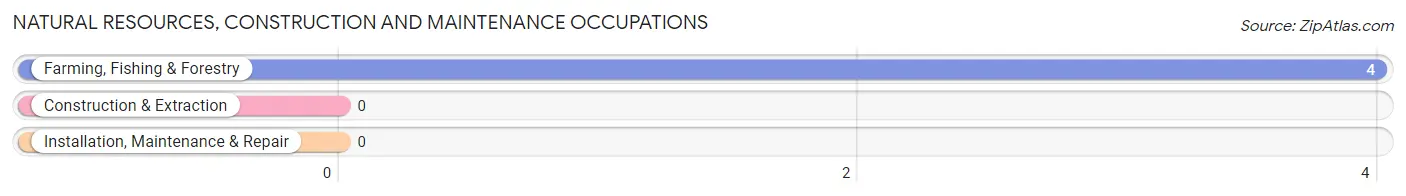
Natural Resources, Construction and Maintenance Occupations
The most common Natural Resources, Construction and Maintenance occupations in Chelsea are , and Farming, Fishing & Forestry (4 | 2.1%).
Natural Resources, Construction and Maintenance Occupations by Sex
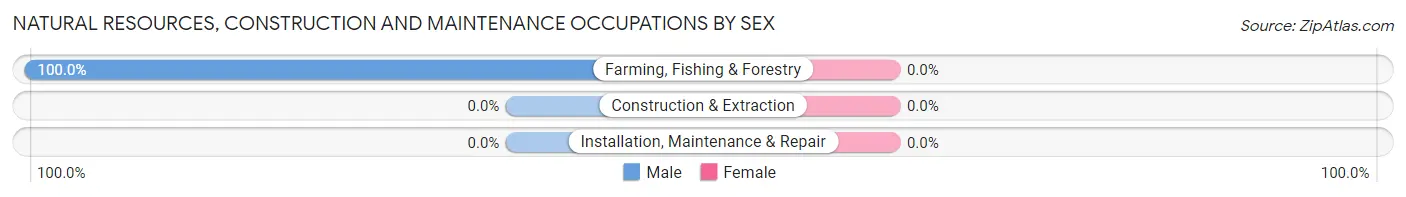
| Occupation | Male | Female |
| Farming, Fishing & Forestry | 4 (100.0%) | 0 (0.0%) |
| Construction & Extraction | 0 (0.0%) | 0 (0.0%) |
| Installation, Maintenance & Repair | 0 (0.0%) | 0 (0.0%) |
| Total (Category) | 4 (100.0%) | 0 (0.0%) |
| Total (Overall) | 84 (44.9%) | 103 (55.1%) |
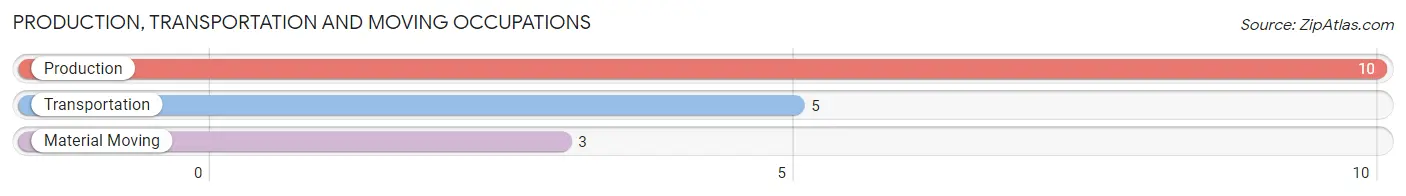
Production, Transportation and Moving Occupations
The most common Production, Transportation and Moving occupations in Chelsea are Production (10 | 5.3%), Transportation (5 | 2.7%), and Material Moving (3 | 1.6%).
Production, Transportation and Moving Occupations by Sex
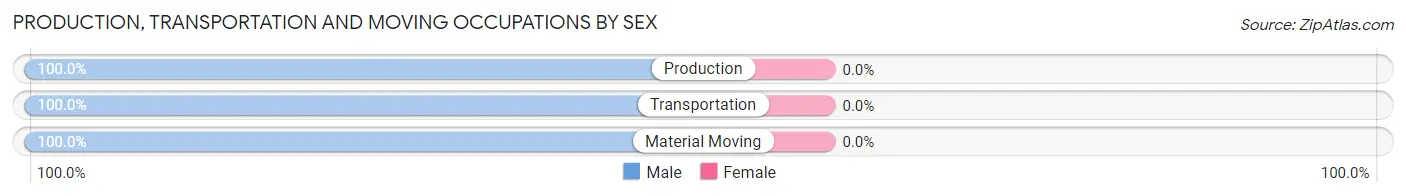
| Occupation | Male | Female |
| Production | 10 (100.0%) | 0 (0.0%) |
| Transportation | 5 (100.0%) | 0 (0.0%) |
| Material Moving | 3 (100.0%) | 0 (0.0%) |
| Total (Category) | 18 (100.0%) | 0 (0.0%) |
| Total (Overall) | 84 (44.9%) | 103 (55.1%) |
Employment Industries by Sex in Chelsea
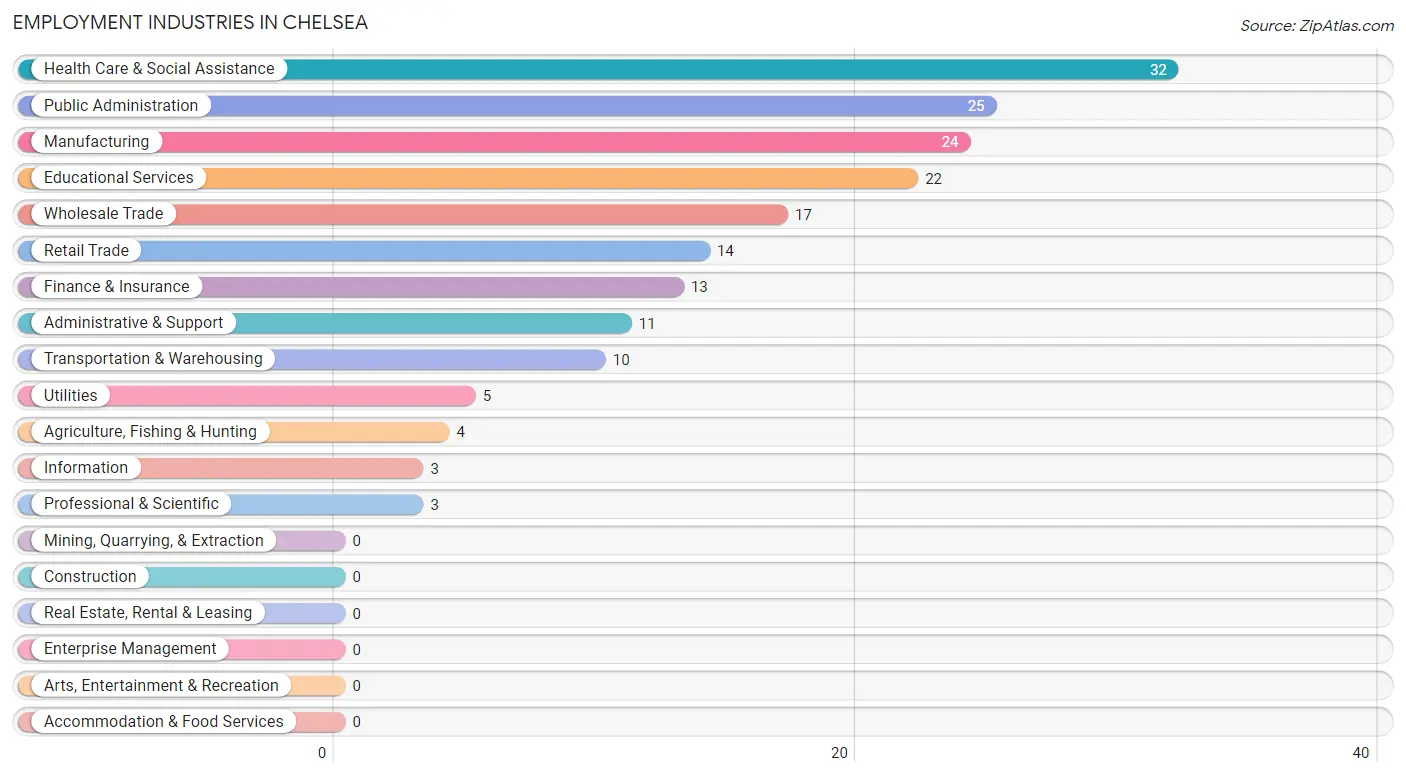
Employment Industries in Chelsea
The major employment industries in Chelsea include Health Care & Social Assistance (32 | 17.1%), Public Administration (25 | 13.4%), Manufacturing (24 | 12.8%), Educational Services (22 | 11.8%), and Wholesale Trade (17 | 9.1%).
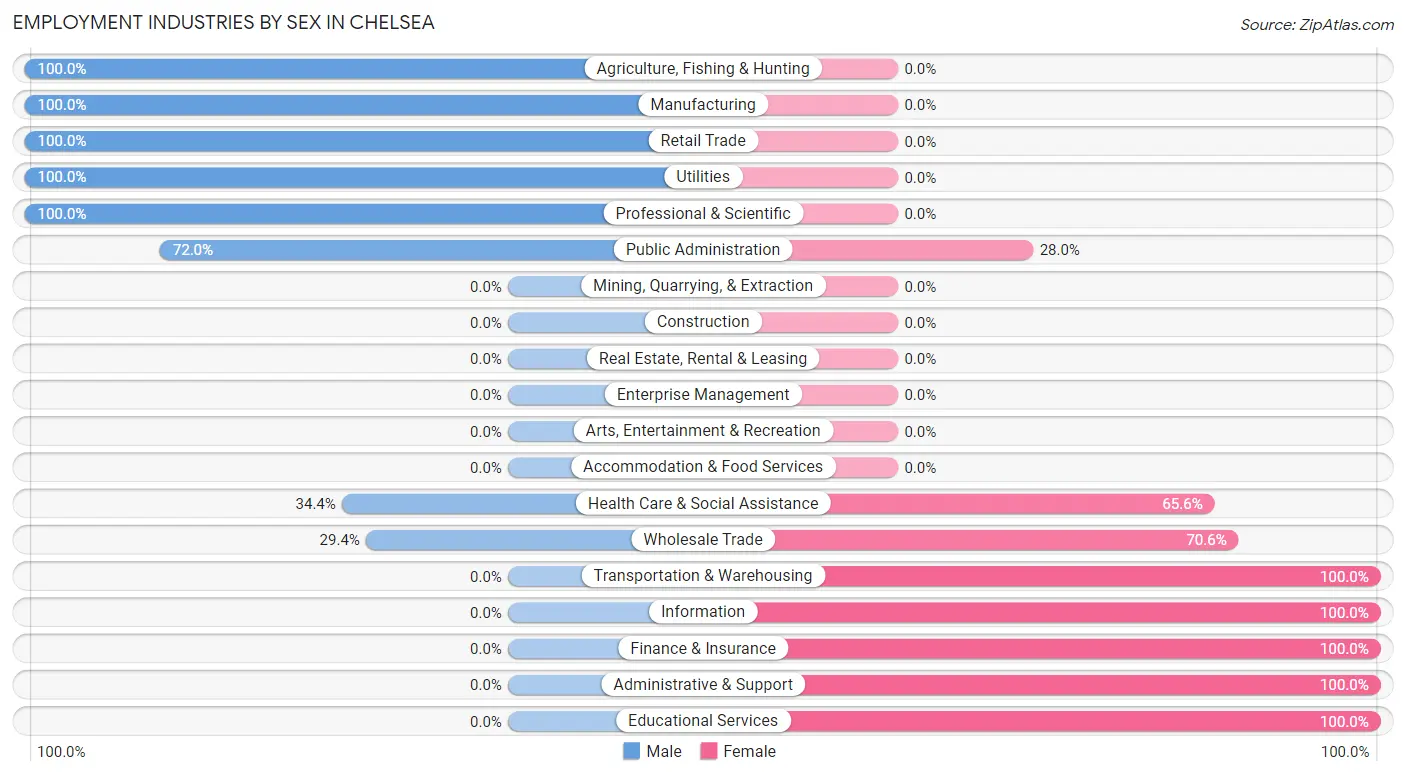
Employment Industries by Sex in Chelsea
The Chelsea industries that see more men than women are Agriculture, Fishing & Hunting (100.0%), Manufacturing (100.0%), and Retail Trade (100.0%), whereas the industries that tend to have a higher number of women are Transportation & Warehousing (100.0%), Information (100.0%), and Finance & Insurance (100.0%).
| Industry | Male | Female |
| Agriculture, Fishing & Hunting | 4 (100.0%) | 0 (0.0%) |
| Mining, Quarrying, & Extraction | 0 (0.0%) | 0 (0.0%) |
| Construction | 0 (0.0%) | 0 (0.0%) |
| Manufacturing | 24 (100.0%) | 0 (0.0%) |
| Wholesale Trade | 5 (29.4%) | 12 (70.6%) |
| Retail Trade | 14 (100.0%) | 0 (0.0%) |
| Transportation & Warehousing | 0 (0.0%) | 10 (100.0%) |
| Utilities | 5 (100.0%) | 0 (0.0%) |
| Information | 0 (0.0%) | 3 (100.0%) |
| Finance & Insurance | 0 (0.0%) | 13 (100.0%) |
| Real Estate, Rental & Leasing | 0 (0.0%) | 0 (0.0%) |
| Professional & Scientific | 3 (100.0%) | 0 (0.0%) |
| Enterprise Management | 0 (0.0%) | 0 (0.0%) |
| Administrative & Support | 0 (0.0%) | 11 (100.0%) |
| Educational Services | 0 (0.0%) | 22 (100.0%) |
| Health Care & Social Assistance | 11 (34.4%) | 21 (65.6%) |
| Arts, Entertainment & Recreation | 0 (0.0%) | 0 (0.0%) |
| Accommodation & Food Services | 0 (0.0%) | 0 (0.0%) |
| Public Administration | 18 (72.0%) | 7 (28.0%) |
| Total | 84 (44.9%) | 103 (55.1%) |
Education in Chelsea
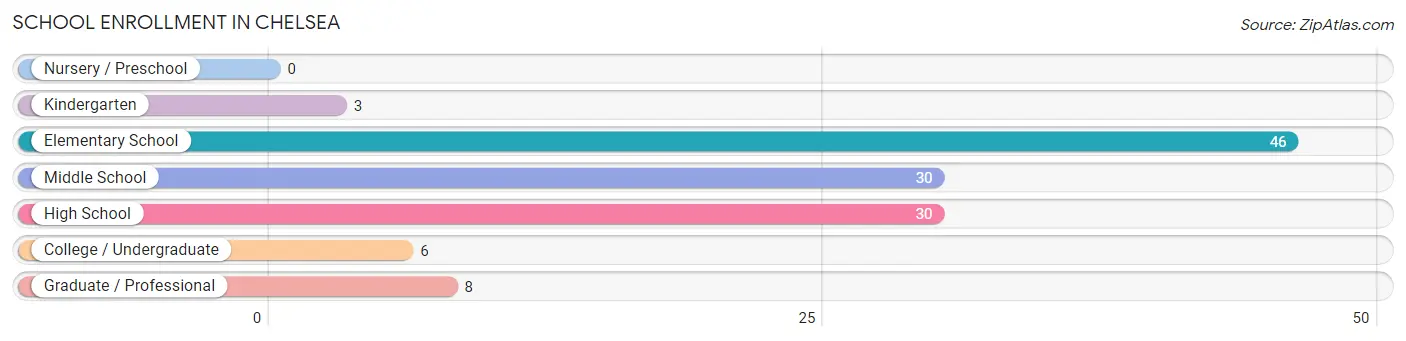
School Enrollment in Chelsea
The most common levels of schooling among the 123 students in Chelsea are elementary school (46 | 37.4%), middle school (30 | 24.4%), and high school (30 | 24.4%).
| School Level | # Students | % Students |
| Nursery / Preschool | 0 | 0.0% |
| Kindergarten | 3 | 2.4% |
| Elementary School | 46 | 37.4% |
| Middle School | 30 | 24.4% |
| High School | 30 | 24.4% |
| College / Undergraduate | 6 | 4.9% |
| Graduate / Professional | 8 | 6.5% |
| Total | 123 | 100.0% |
School Enrollment by Age by Funding Source in Chelsea
Out of a total of 123 students who are enrolled in schools in Chelsea, 11 (8.9%) attend a private institution, while the remaining 112 (91.1%) are enrolled in public schools. The age group of 25 to 34 year olds has the highest likelihood of being enrolled in private schools, with 4 (100.0% in the age bracket) enrolled. Conversely, the age group of 5 to 9 year old has the lowest likelihood of being enrolled in a private school, with 20 (100.0% in the age bracket) attending a public institution.
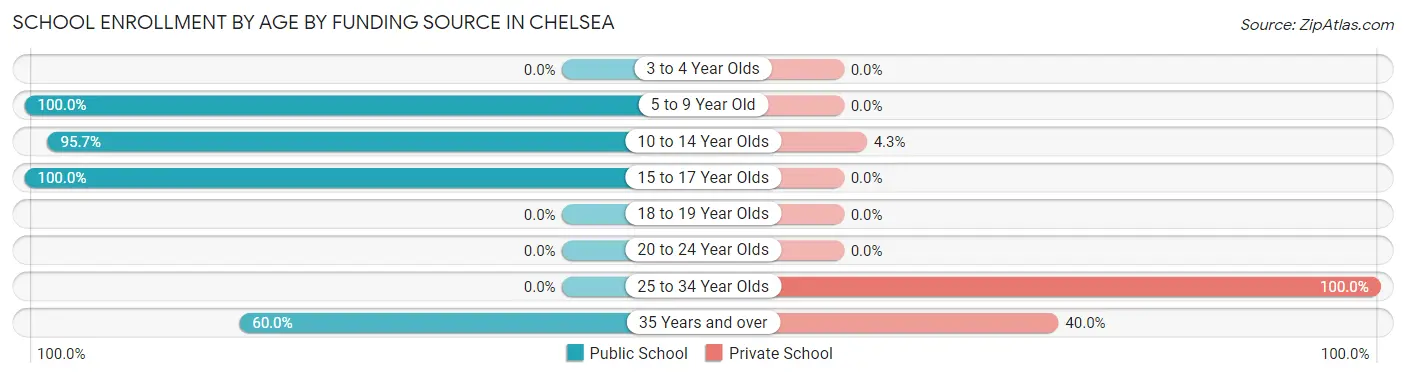
| Age Bracket | Public School | Private School |
| 3 to 4 Year Olds | 0 (0.0%) | 0 (0.0%) |
| 5 to 9 Year Old | 20 (100.0%) | 0 (0.0%) |
| 10 to 14 Year Olds | 67 (95.7%) | 3 (4.3%) |
| 15 to 17 Year Olds | 19 (100.0%) | 0 (0.0%) |
| 18 to 19 Year Olds | 0 (0.0%) | 0 (0.0%) |
| 20 to 24 Year Olds | 0 (0.0%) | 0 (0.0%) |
| 25 to 34 Year Olds | 0 (0.0%) | 4 (100.0%) |
| 35 Years and over | 6 (60.0%) | 4 (40.0%) |
| Total | 112 (91.1%) | 11 (8.9%) |
Educational Attainment by Field of Study in Chelsea
Business (14 | 16.1%), social sciences (13 | 14.9%), physical & health sciences (11 | 12.6%), psychology (9 | 10.3%), and engineering (9 | 10.3%) are the most common fields of study among 87 individuals in Chelsea who have obtained a bachelor's degree or higher.
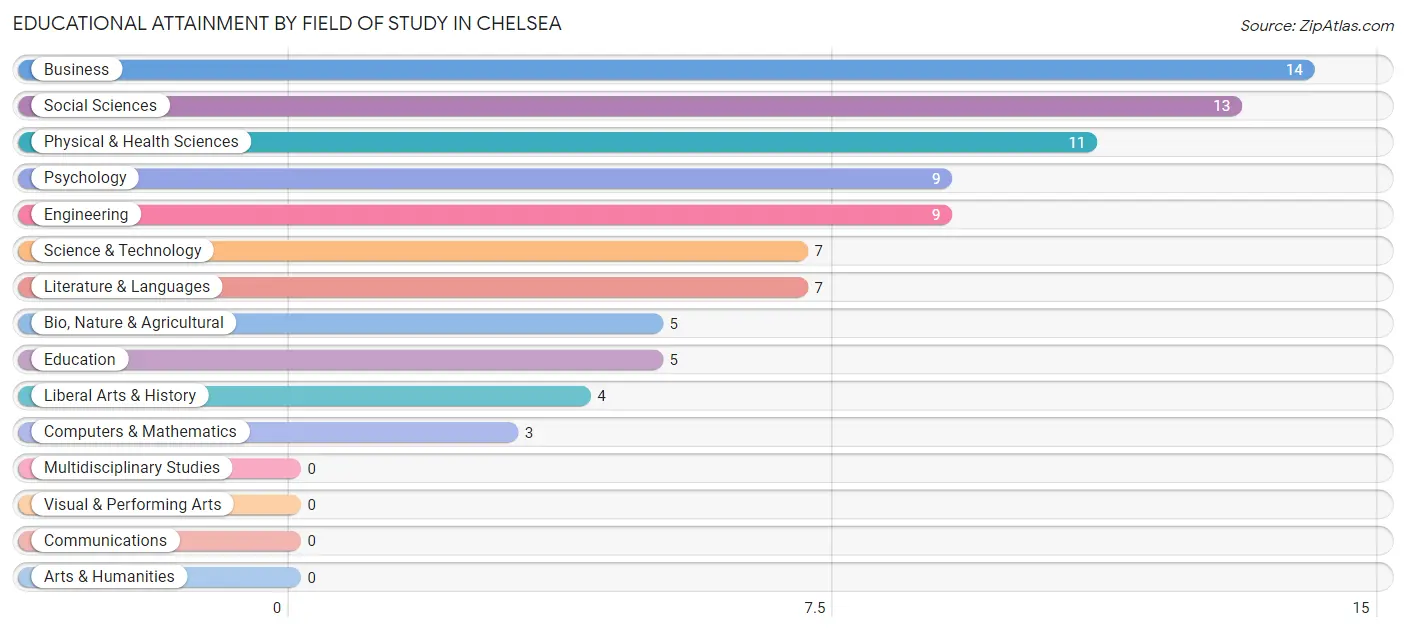
| Field of Study | # Graduates | % Graduates |
| Computers & Mathematics | 3 | 3.5% |
| Bio, Nature & Agricultural | 5 | 5.8% |
| Physical & Health Sciences | 11 | 12.6% |
| Psychology | 9 | 10.3% |
| Social Sciences | 13 | 14.9% |
| Engineering | 9 | 10.3% |
| Multidisciplinary Studies | 0 | 0.0% |
| Science & Technology | 7 | 8.1% |
| Business | 14 | 16.1% |
| Education | 5 | 5.8% |
| Literature & Languages | 7 | 8.1% |
| Liberal Arts & History | 4 | 4.6% |
| Visual & Performing Arts | 0 | 0.0% |
| Communications | 0 | 0.0% |
| Arts & Humanities | 0 | 0.0% |
| Total | 87 | 100.0% |
Transportation & Commute in Chelsea
Vehicle Availability by Sex in Chelsea
The most prevalent vehicle ownership categories in Chelsea are males with 2 vehicles (28, accounting for 33.3%) and females with 2 vehicles (35, making up 28.3%).
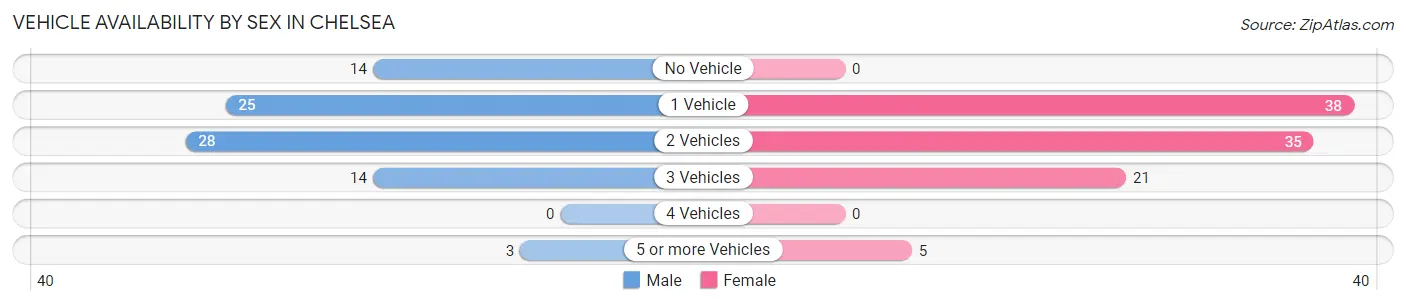
| Vehicles Available | Male | Female |
| No Vehicle | 14 (16.7%) | 0 (0.0%) |
| 1 Vehicle | 25 (29.8%) | 38 (38.4%) |
| 2 Vehicles | 28 (33.3%) | 35 (35.3%) |
| 3 Vehicles | 14 (16.7%) | 21 (21.2%) |
| 4 Vehicles | 0 (0.0%) | 0 (0.0%) |
| 5 or more Vehicles | 3 (3.6%) | 5 (5.1%) |
| Total | 84 (100.0%) | 99 (100.0%) |
Commute Time in Chelsea
The most frequently occuring commute durations in Chelsea are 30 to 34 minutes (47 commuters, 30.9%), 20 to 24 minutes (40 commuters, 26.3%), and less than 5 minutes (14 commuters, 9.2%).
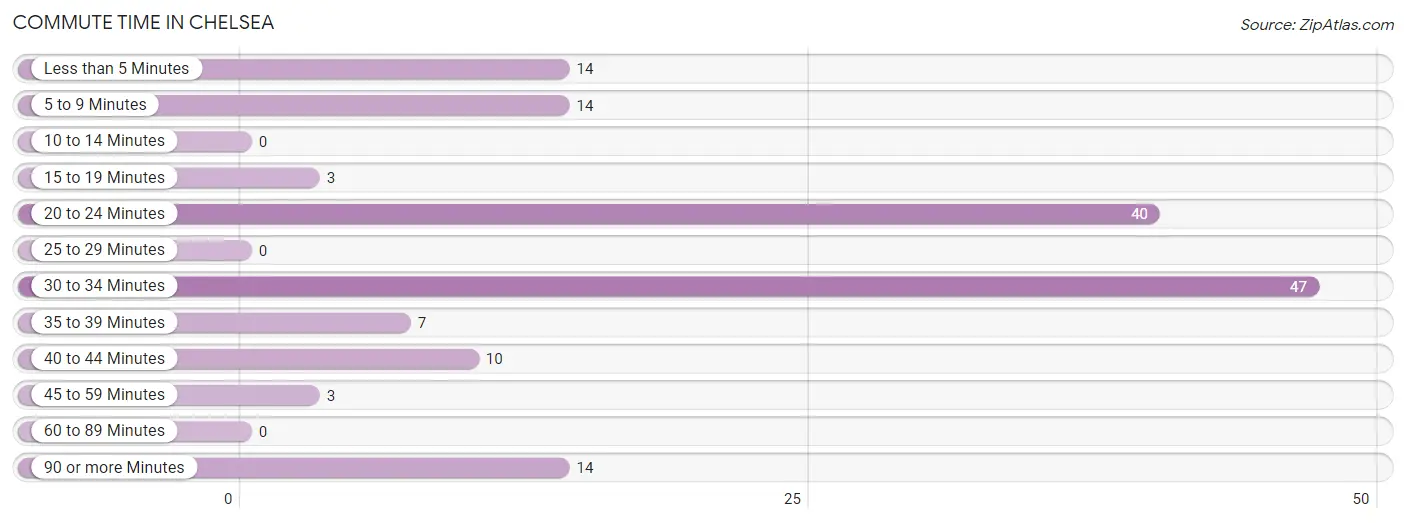
| Commute Time | # Commuters | % Commuters |
| Less than 5 Minutes | 14 | 9.2% |
| 5 to 9 Minutes | 14 | 9.2% |
| 10 to 14 Minutes | 0 | 0.0% |
| 15 to 19 Minutes | 3 | 2.0% |
| 20 to 24 Minutes | 40 | 26.3% |
| 25 to 29 Minutes | 0 | 0.0% |
| 30 to 34 Minutes | 47 | 30.9% |
| 35 to 39 Minutes | 7 | 4.6% |
| 40 to 44 Minutes | 10 | 6.6% |
| 45 to 59 Minutes | 3 | 2.0% |
| 60 to 89 Minutes | 0 | 0.0% |
| 90 or more Minutes | 14 | 9.2% |
Commute Time by Sex in Chelsea
The most common commute times in Chelsea are 30 to 34 minutes (22 commuters, 29.3%) for males and 20 to 24 minutes (40 commuters, 51.9%) for females.
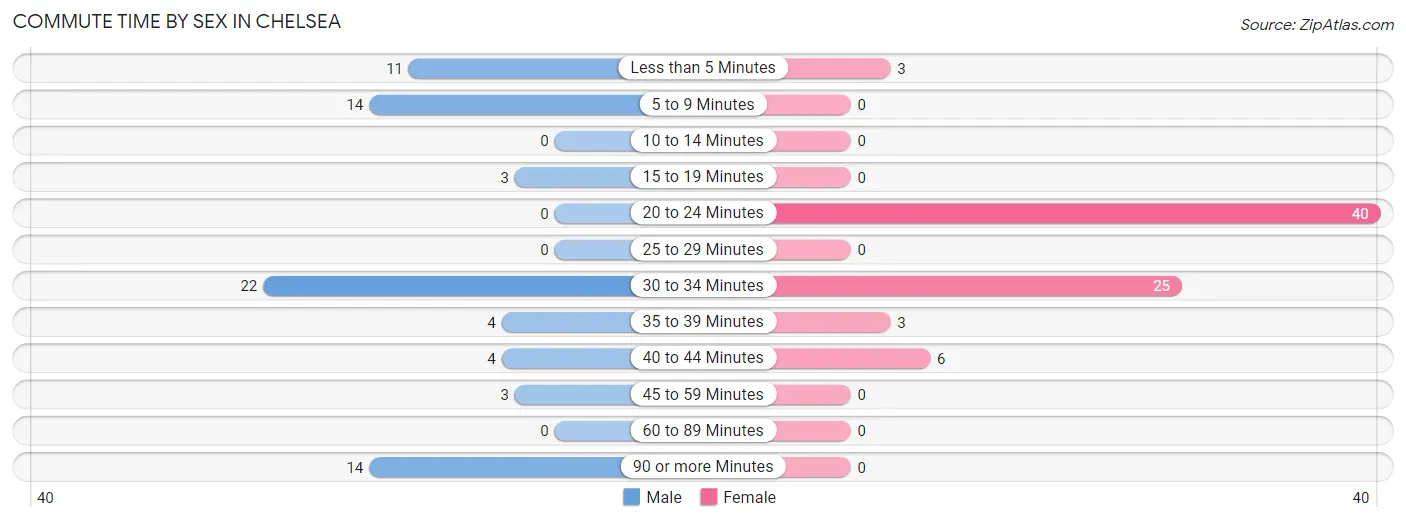
| Commute Time | Male | Female |
| Less than 5 Minutes | 11 (14.7%) | 3 (3.9%) |
| 5 to 9 Minutes | 14 (18.7%) | 0 (0.0%) |
| 10 to 14 Minutes | 0 (0.0%) | 0 (0.0%) |
| 15 to 19 Minutes | 3 (4.0%) | 0 (0.0%) |
| 20 to 24 Minutes | 0 (0.0%) | 40 (51.9%) |
| 25 to 29 Minutes | 0 (0.0%) | 0 (0.0%) |
| 30 to 34 Minutes | 22 (29.3%) | 25 (32.5%) |
| 35 to 39 Minutes | 4 (5.3%) | 3 (3.9%) |
| 40 to 44 Minutes | 4 (5.3%) | 6 (7.8%) |
| 45 to 59 Minutes | 3 (4.0%) | 0 (0.0%) |
| 60 to 89 Minutes | 0 (0.0%) | 0 (0.0%) |
| 90 or more Minutes | 14 (18.7%) | 0 (0.0%) |
Time of Departure to Work by Sex in Chelsea
The most frequent times of departure to work in Chelsea are 6:30 AM to 6:59 AM (19, 25.3%) for males and 7:00 AM to 7:29 AM (26, 33.8%) for females.
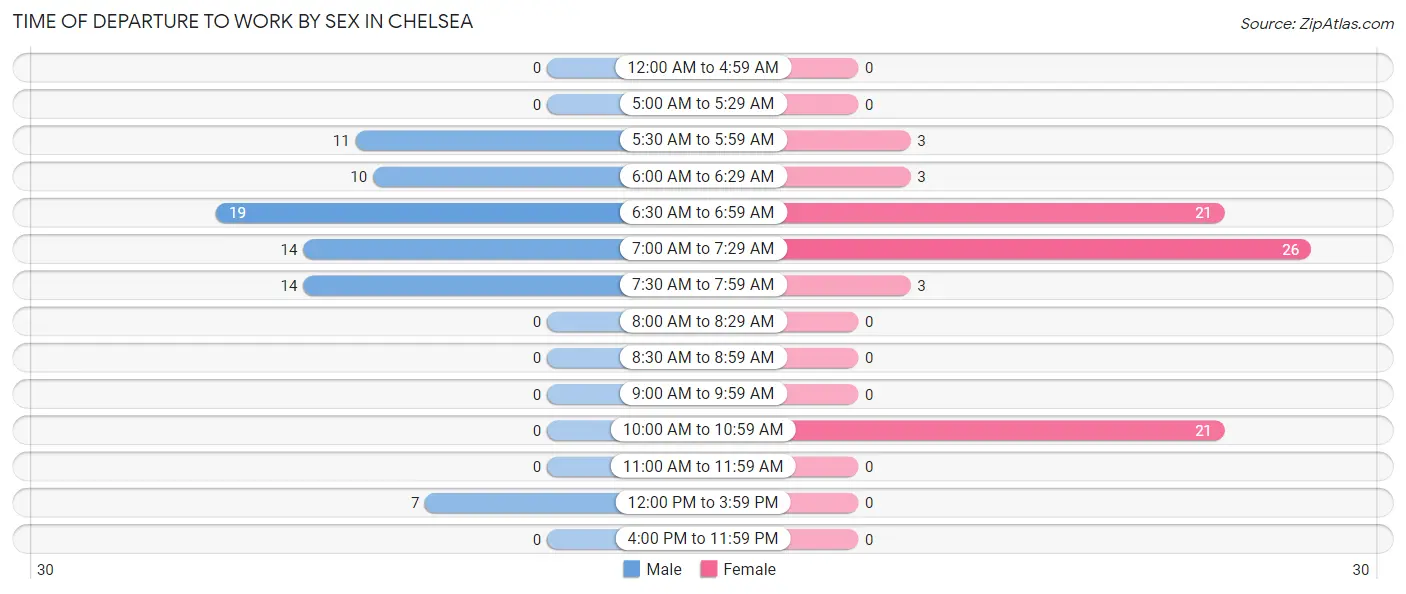
| Time of Departure | Male | Female |
| 12:00 AM to 4:59 AM | 0 (0.0%) | 0 (0.0%) |
| 5:00 AM to 5:29 AM | 0 (0.0%) | 0 (0.0%) |
| 5:30 AM to 5:59 AM | 11 (14.7%) | 3 (3.9%) |
| 6:00 AM to 6:29 AM | 10 (13.3%) | 3 (3.9%) |
| 6:30 AM to 6:59 AM | 19 (25.3%) | 21 (27.3%) |
| 7:00 AM to 7:29 AM | 14 (18.7%) | 26 (33.8%) |
| 7:30 AM to 7:59 AM | 14 (18.7%) | 3 (3.9%) |
| 8:00 AM to 8:29 AM | 0 (0.0%) | 0 (0.0%) |
| 8:30 AM to 8:59 AM | 0 (0.0%) | 0 (0.0%) |
| 9:00 AM to 9:59 AM | 0 (0.0%) | 0 (0.0%) |
| 10:00 AM to 10:59 AM | 0 (0.0%) | 21 (27.3%) |
| 11:00 AM to 11:59 AM | 0 (0.0%) | 0 (0.0%) |
| 12:00 PM to 3:59 PM | 7 (9.3%) | 0 (0.0%) |
| 4:00 PM to 11:59 PM | 0 (0.0%) | 0 (0.0%) |
| Total | 75 (100.0%) | 77 (100.0%) |
Housing Occupancy in Chelsea
Occupancy by Ownership in Chelsea
Of the total 212 dwellings in Chelsea, owner-occupied units account for 158 (74.5%), while renter-occupied units make up 54 (25.5%).
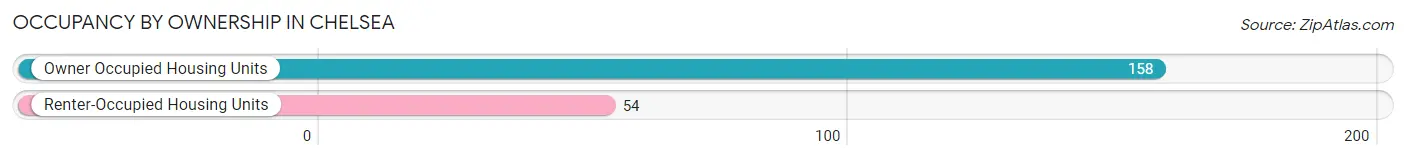
| Occupancy | # Housing Units | % Housing Units |
| Owner Occupied Housing Units | 158 | 74.5% |
| Renter-Occupied Housing Units | 54 | 25.5% |
| Total Occupied Housing Units | 212 | 100.0% |
Occupancy by Household Size in Chelsea
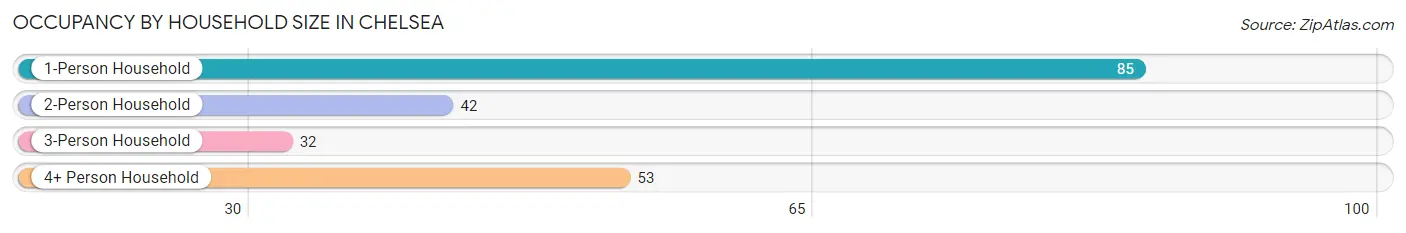
| Household Size | # Housing Units | % Housing Units |
| 1-Person Household | 85 | 40.1% |
| 2-Person Household | 42 | 19.8% |
| 3-Person Household | 32 | 15.1% |
| 4+ Person Household | 53 | 25.0% |
| Total Housing Units | 212 | 100.0% |
Occupancy by Ownership by Household Size in Chelsea
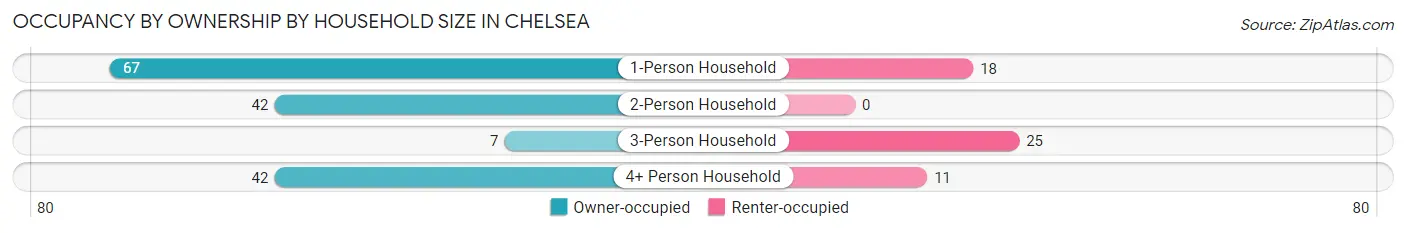
| Household Size | Owner-occupied | Renter-occupied |
| 1-Person Household | 67 (78.8%) | 18 (21.2%) |
| 2-Person Household | 42 (100.0%) | 0 (0.0%) |
| 3-Person Household | 7 (21.9%) | 25 (78.1%) |
| 4+ Person Household | 42 (79.2%) | 11 (20.7%) |
| Total Housing Units | 158 (74.5%) | 54 (25.5%) |
Occupancy by Educational Attainment in Chelsea
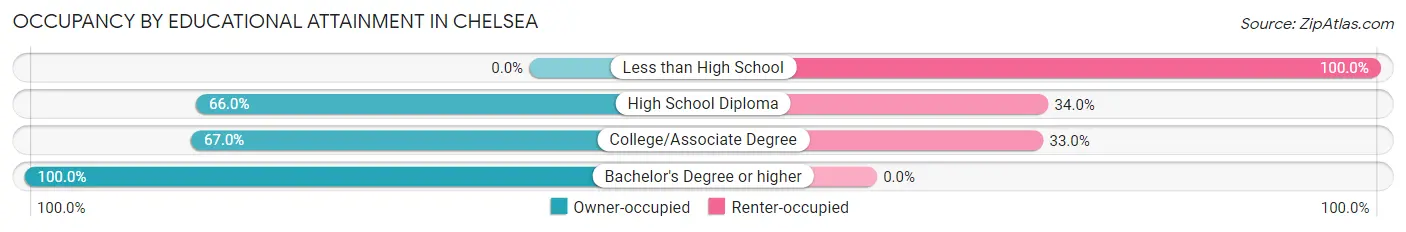
| Household Size | Owner-occupied | Renter-occupied |
| Less than High School | 0 (0.0%) | 5 (100.0%) |
| High School Diploma | 33 (66.0%) | 17 (34.0%) |
| College/Associate Degree | 65 (67.0%) | 32 (33.0%) |
| Bachelor's Degree or higher | 60 (100.0%) | 0 (0.0%) |
Occupancy by Age of Householder in Chelsea
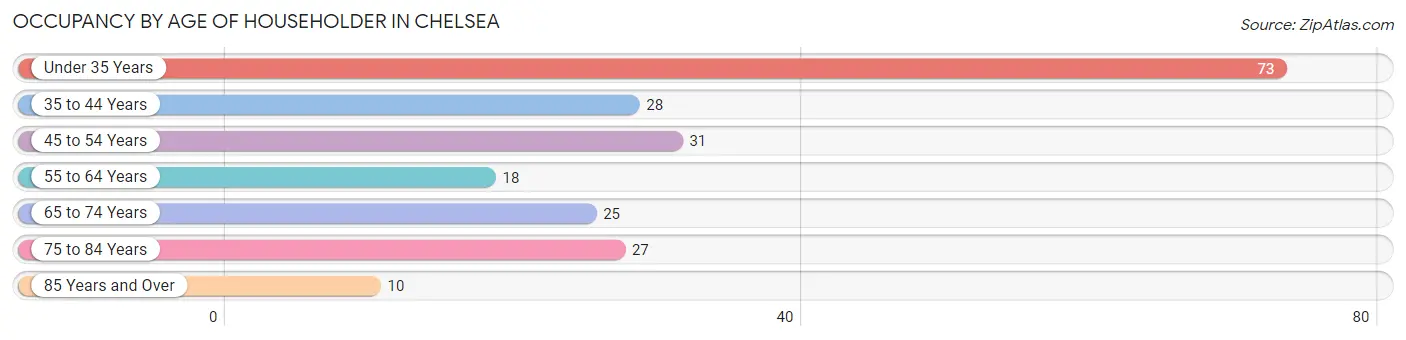
| Age Bracket | # Households | % Households |
| Under 35 Years | 73 | 34.4% |
| 35 to 44 Years | 28 | 13.2% |
| 45 to 54 Years | 31 | 14.6% |
| 55 to 64 Years | 18 | 8.5% |
| 65 to 74 Years | 25 | 11.8% |
| 75 to 84 Years | 27 | 12.7% |
| 85 Years and Over | 10 | 4.7% |
| Total | 212 | 100.0% |
Housing Finances in Chelsea
Median Income by Occupancy in Chelsea
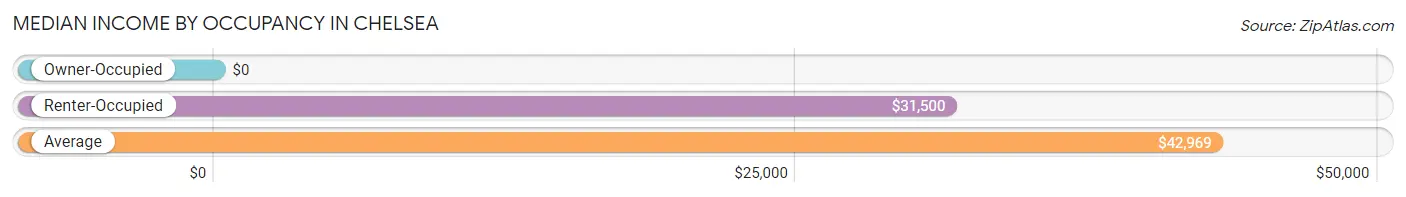
| Occupancy Type | # Households | Median Income |
| Owner-Occupied | 158 (74.5%) | $0 |
| Renter-Occupied | 54 (25.5%) | $31,500 |
| Average | 212 (100.0%) | $42,969 |
Occupancy by Householder Income Bracket in Chelsea
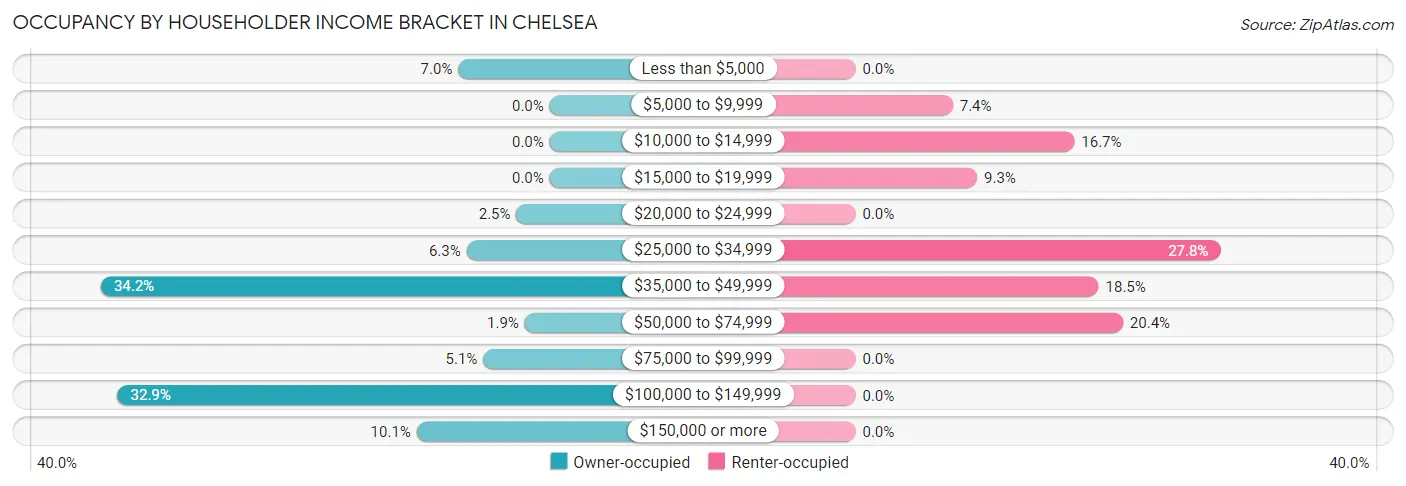
| Income Bracket | Owner-occupied | Renter-occupied |
| Less than $5,000 | 11 (7.0%) | 0 (0.0%) |
| $5,000 to $9,999 | 0 (0.0%) | 4 (7.4%) |
| $10,000 to $14,999 | 0 (0.0%) | 9 (16.7%) |
| $15,000 to $19,999 | 0 (0.0%) | 5 (9.3%) |
| $20,000 to $24,999 | 4 (2.5%) | 0 (0.0%) |
| $25,000 to $34,999 | 10 (6.3%) | 15 (27.8%) |
| $35,000 to $49,999 | 54 (34.2%) | 10 (18.5%) |
| $50,000 to $74,999 | 3 (1.9%) | 11 (20.4%) |
| $75,000 to $99,999 | 8 (5.1%) | 0 (0.0%) |
| $100,000 to $149,999 | 52 (32.9%) | 0 (0.0%) |
| $150,000 or more | 16 (10.1%) | 0 (0.0%) |
| Total | 158 (100.0%) | 54 (100.0%) |
Monthly Housing Cost Tiers in Chelsea
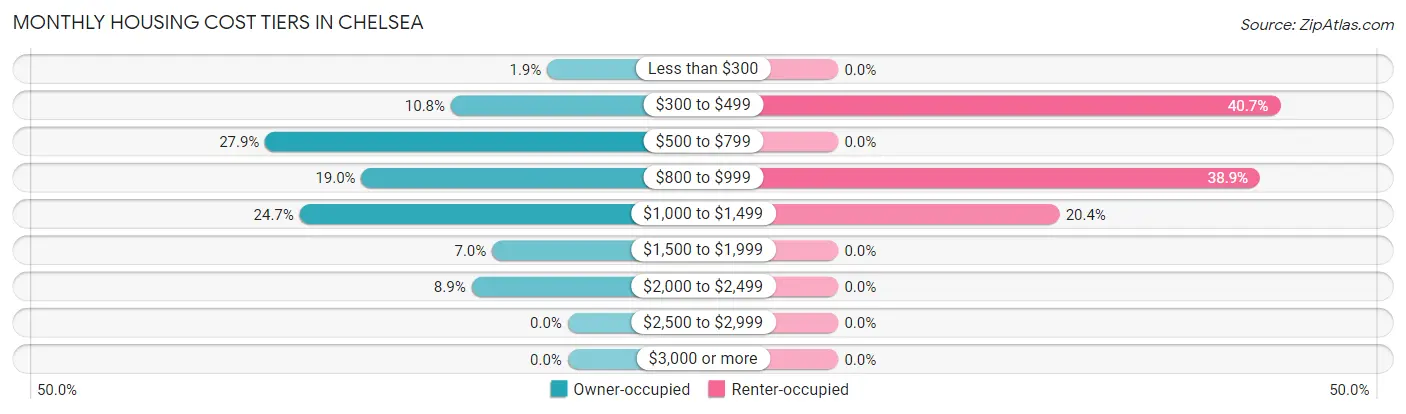
| Monthly Cost | Owner-occupied | Renter-occupied |
| Less than $300 | 3 (1.9%) | 0 (0.0%) |
| $300 to $499 | 17 (10.8%) | 22 (40.7%) |
| $500 to $799 | 44 (27.9%) | 0 (0.0%) |
| $800 to $999 | 30 (19.0%) | 21 (38.9%) |
| $1,000 to $1,499 | 39 (24.7%) | 11 (20.4%) |
| $1,500 to $1,999 | 11 (7.0%) | 0 (0.0%) |
| $2,000 to $2,499 | 14 (8.9%) | 0 (0.0%) |
| $2,500 to $2,999 | 0 (0.0%) | 0 (0.0%) |
| $3,000 or more | 0 (0.0%) | 0 (0.0%) |
| Total | 158 (100.0%) | 54 (100.0%) |
Physical Housing Characteristics in Chelsea
Housing Structures in Chelsea
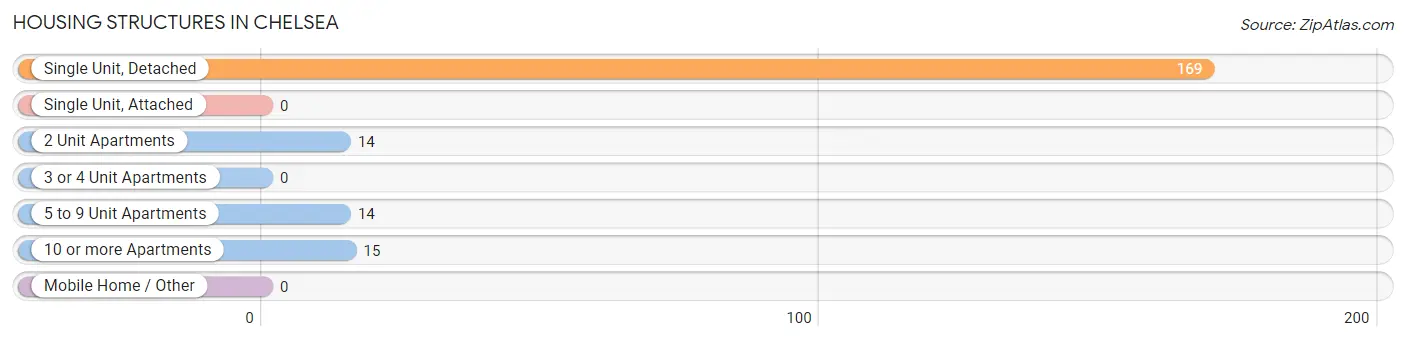
| Structure Type | # Housing Units | % Housing Units |
| Single Unit, Detached | 169 | 79.7% |
| Single Unit, Attached | 0 | 0.0% |
| 2 Unit Apartments | 14 | 6.6% |
| 3 or 4 Unit Apartments | 0 | 0.0% |
| 5 to 9 Unit Apartments | 14 | 6.6% |
| 10 or more Apartments | 15 | 7.1% |
| Mobile Home / Other | 0 | 0.0% |
| Total | 212 | 100.0% |
Housing Structures by Occupancy in Chelsea
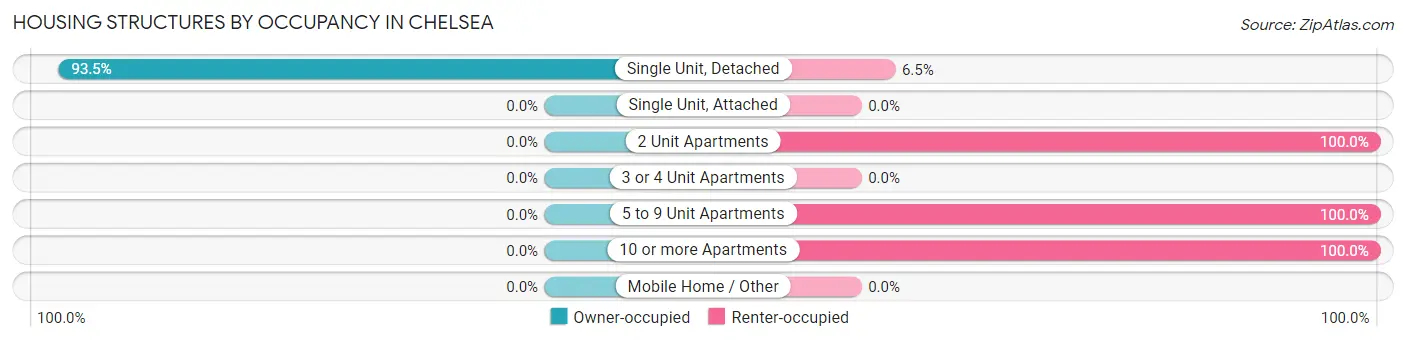
| Structure Type | Owner-occupied | Renter-occupied |
| Single Unit, Detached | 158 (93.5%) | 11 (6.5%) |
| Single Unit, Attached | 0 (0.0%) | 0 (0.0%) |
| 2 Unit Apartments | 0 (0.0%) | 14 (100.0%) |
| 3 or 4 Unit Apartments | 0 (0.0%) | 0 (0.0%) |
| 5 to 9 Unit Apartments | 0 (0.0%) | 14 (100.0%) |
| 10 or more Apartments | 0 (0.0%) | 15 (100.0%) |
| Mobile Home / Other | 0 (0.0%) | 0 (0.0%) |
| Total | 158 (74.5%) | 54 (25.5%) |
Housing Structures by Number of Rooms in Chelsea
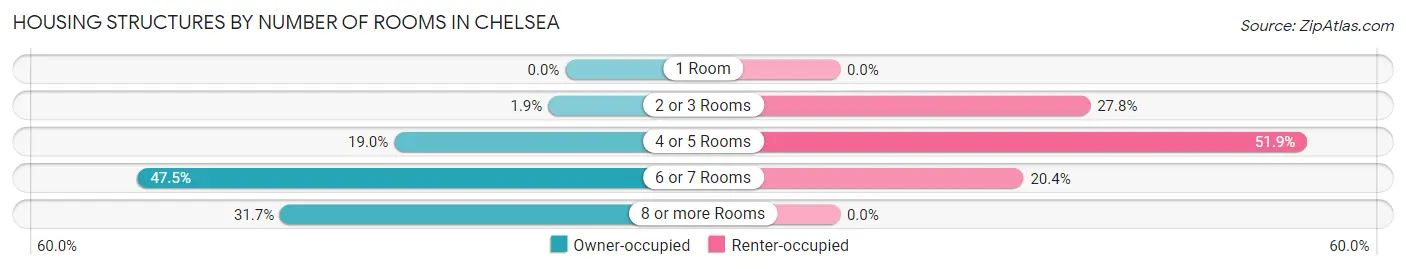
| Number of Rooms | Owner-occupied | Renter-occupied |
| 1 Room | 0 (0.0%) | 0 (0.0%) |
| 2 or 3 Rooms | 3 (1.9%) | 15 (27.8%) |
| 4 or 5 Rooms | 30 (19.0%) | 28 (51.8%) |
| 6 or 7 Rooms | 75 (47.5%) | 11 (20.4%) |
| 8 or more Rooms | 50 (31.7%) | 0 (0.0%) |
| Total | 158 (100.0%) | 54 (100.0%) |
Housing Structure by Heating Type in Chelsea
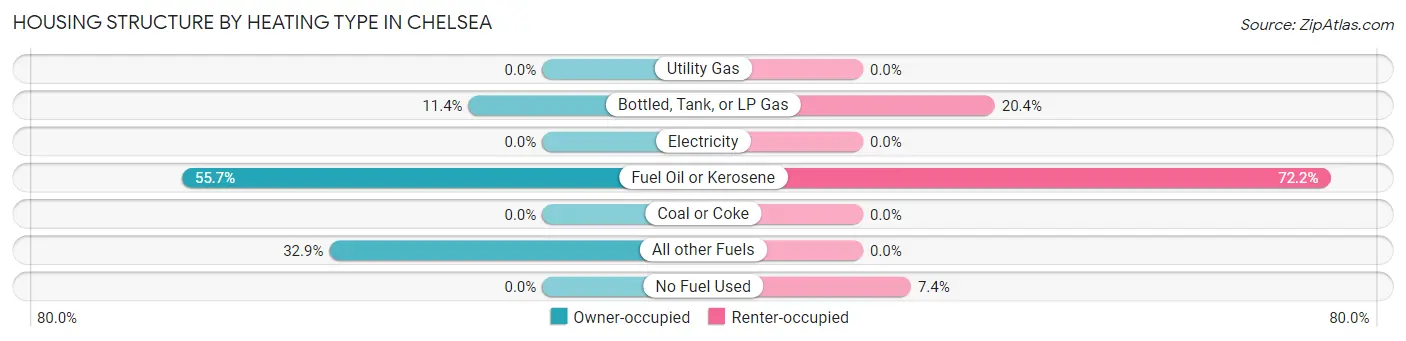
| Heating Type | Owner-occupied | Renter-occupied |
| Utility Gas | 0 (0.0%) | 0 (0.0%) |
| Bottled, Tank, or LP Gas | 18 (11.4%) | 11 (20.4%) |
| Electricity | 0 (0.0%) | 0 (0.0%) |
| Fuel Oil or Kerosene | 88 (55.7%) | 39 (72.2%) |
| Coal or Coke | 0 (0.0%) | 0 (0.0%) |
| All other Fuels | 52 (32.9%) | 0 (0.0%) |
| No Fuel Used | 0 (0.0%) | 4 (7.4%) |
| Total | 158 (100.0%) | 54 (100.0%) |
Household Vehicle Usage in Chelsea
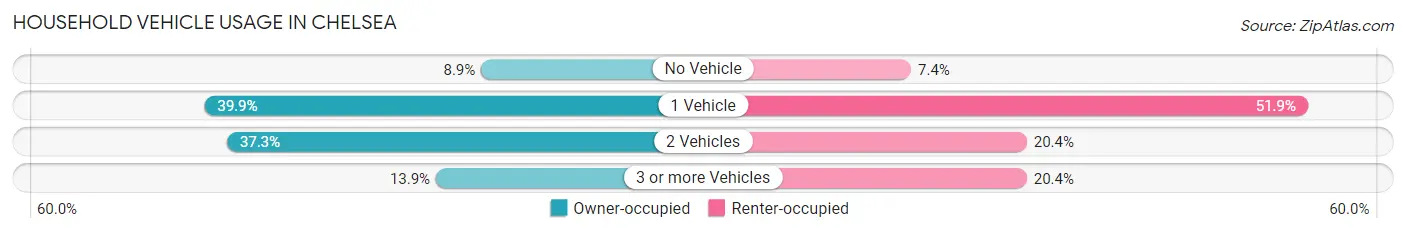
| Vehicles per Household | Owner-occupied | Renter-occupied |
| No Vehicle | 14 (8.9%) | 4 (7.4%) |
| 1 Vehicle | 63 (39.9%) | 28 (51.8%) |
| 2 Vehicles | 59 (37.3%) | 11 (20.4%) |
| 3 or more Vehicles | 22 (13.9%) | 11 (20.4%) |
| Total | 158 (100.0%) | 54 (100.0%) |
Real Estate & Mortgages in Chelsea
Real Estate and Mortgage Overview in Chelsea
| Characteristic | Without Mortgage | With Mortgage |
| Housing Units | 101 | 57 |
| Median Property Value | $179,200 | $123,000 |
| Median Household Income | $39,554 | $3 |
| Monthly Housing Costs | $670 | $0 |
| Real Estate Taxes | $2,391 | $0 |
Property Value by Mortgage Status in Chelsea
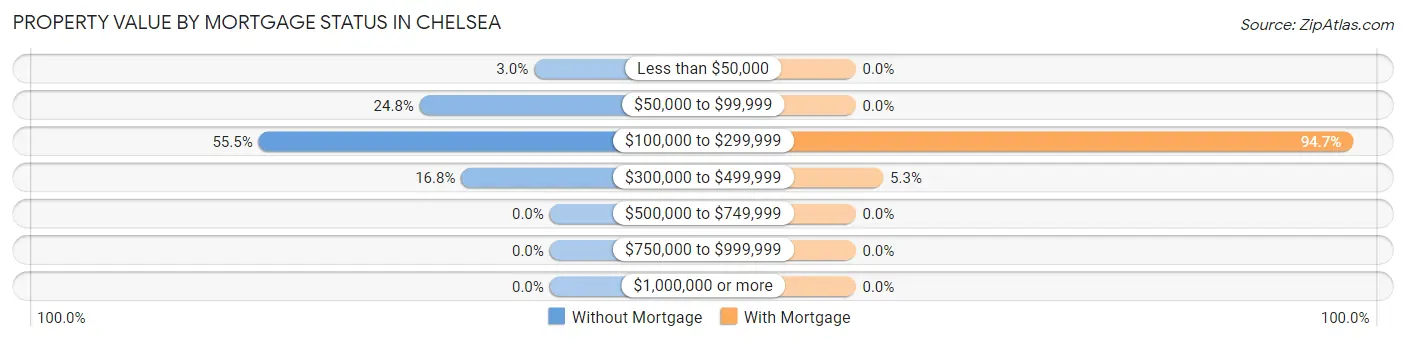
| Property Value | Without Mortgage | With Mortgage |
| Less than $50,000 | 3 (3.0%) | 0 (0.0%) |
| $50,000 to $99,999 | 25 (24.7%) | 0 (0.0%) |
| $100,000 to $299,999 | 56 (55.4%) | 54 (94.7%) |
| $300,000 to $499,999 | 17 (16.8%) | 3 (5.3%) |
| $500,000 to $749,999 | 0 (0.0%) | 0 (0.0%) |
| $750,000 to $999,999 | 0 (0.0%) | 0 (0.0%) |
| $1,000,000 or more | 0 (0.0%) | 0 (0.0%) |
| Total | 101 (100.0%) | 57 (100.0%) |
Household Income by Mortgage Status in Chelsea
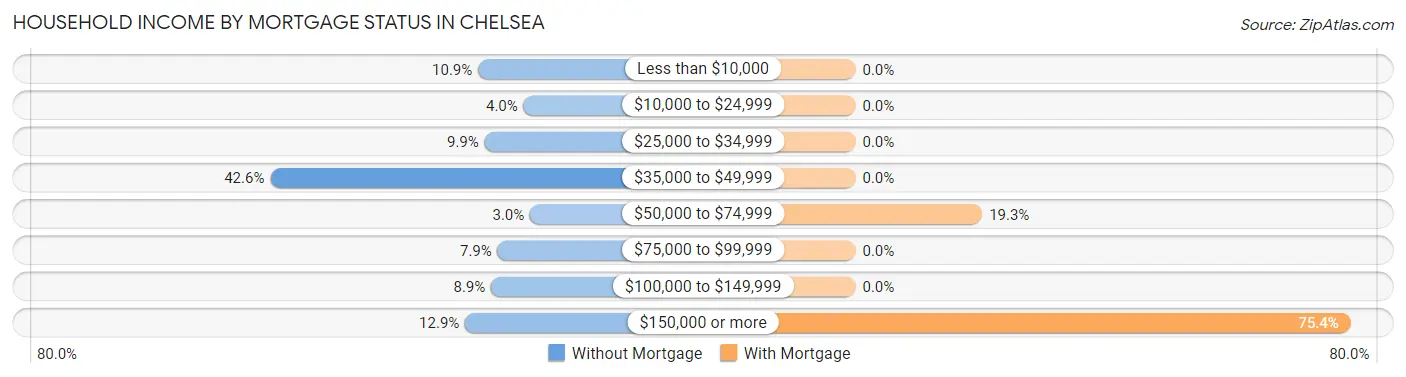
| Household Income | Without Mortgage | With Mortgage |
| Less than $10,000 | 11 (10.9%) | 0 (0.0%) |
| $10,000 to $24,999 | 4 (4.0%) | 0 (0.0%) |
| $25,000 to $34,999 | 10 (9.9%) | 0 (0.0%) |
| $35,000 to $49,999 | 43 (42.6%) | 0 (0.0%) |
| $50,000 to $74,999 | 3 (3.0%) | 11 (19.3%) |
| $75,000 to $99,999 | 8 (7.9%) | 0 (0.0%) |
| $100,000 to $149,999 | 9 (8.9%) | 0 (0.0%) |
| $150,000 or more | 13 (12.9%) | 43 (75.4%) |
| Total | 101 (100.0%) | 57 (100.0%) |
Property Value to Household Income Ratio in Chelsea
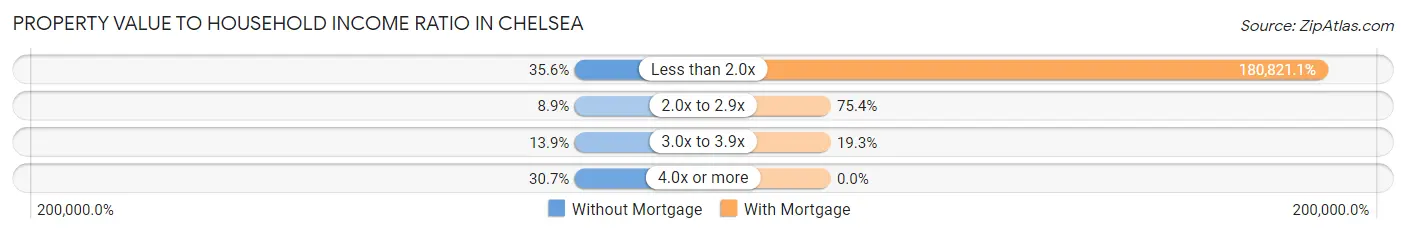
| Value-to-Income Ratio | Without Mortgage | With Mortgage |
| Less than 2.0x | 36 (35.6%) | 103,068 (180,821.0%) |
| 2.0x to 2.9x | 9 (8.9%) | 43 (75.4%) |
| 3.0x to 3.9x | 14 (13.9%) | 11 (19.3%) |
| 4.0x or more | 31 (30.7%) | 0 (0.0%) |
| Total | 101 (100.0%) | 57 (100.0%) |
Real Estate Taxes by Mortgage Status in Chelsea
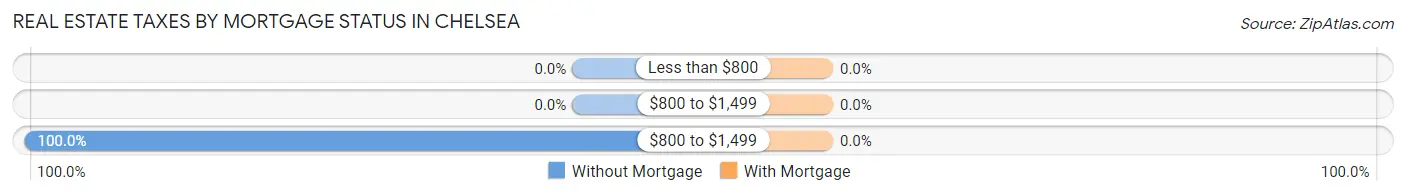
| Property Taxes | Without Mortgage | With Mortgage |
| Less than $800 | 0 (0.0%) | 0 (0.0%) |
| $800 to $1,499 | 0 (0.0%) | 0 (0.0%) |
| $800 to $1,499 | 101 (100.0%) | 0 (0.0%) |
| Total | 101 (100.0%) | 57 (100.0%) |
Health & Disability in Chelsea
Health Insurance Coverage by Age in Chelsea
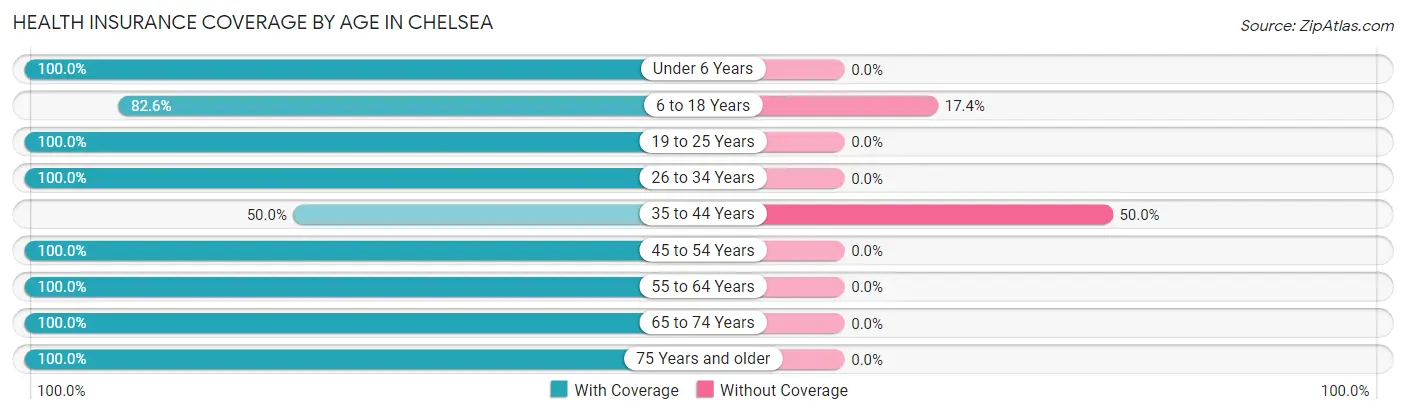
| Age Bracket | With Coverage | Without Coverage |
| Under 6 Years | 25 (100.0%) | 0 (0.0%) |
| 6 to 18 Years | 90 (82.6%) | 19 (17.4%) |
| 19 to 25 Years | 14 (100.0%) | 0 (0.0%) |
| 26 to 34 Years | 105 (100.0%) | 0 (0.0%) |
| 35 to 44 Years | 22 (50.0%) | 22 (50.0%) |
| 45 to 54 Years | 34 (100.0%) | 0 (0.0%) |
| 55 to 64 Years | 40 (100.0%) | 0 (0.0%) |
| 65 to 74 Years | 41 (100.0%) | 0 (0.0%) |
| 75 Years and older | 48 (100.0%) | 0 (0.0%) |
| Total | 419 (91.1%) | 41 (8.9%) |
Health Insurance Coverage by Citizenship Status in Chelsea
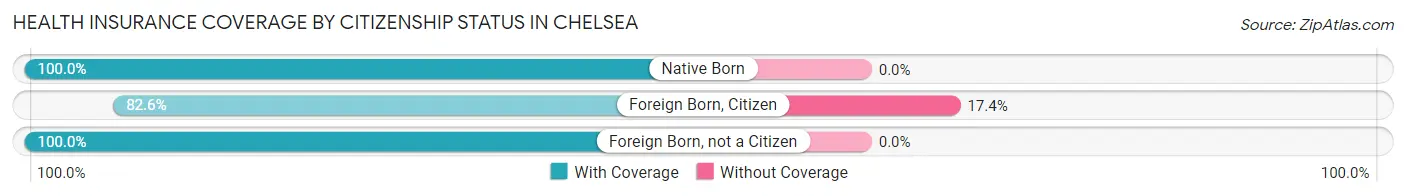
| Citizenship Status | With Coverage | Without Coverage |
| Native Born | 25 (100.0%) | 0 (0.0%) |
| Foreign Born, Citizen | 90 (82.6%) | 19 (17.4%) |
| Foreign Born, not a Citizen | 14 (100.0%) | 0 (0.0%) |
Health Insurance Coverage by Household Income in Chelsea
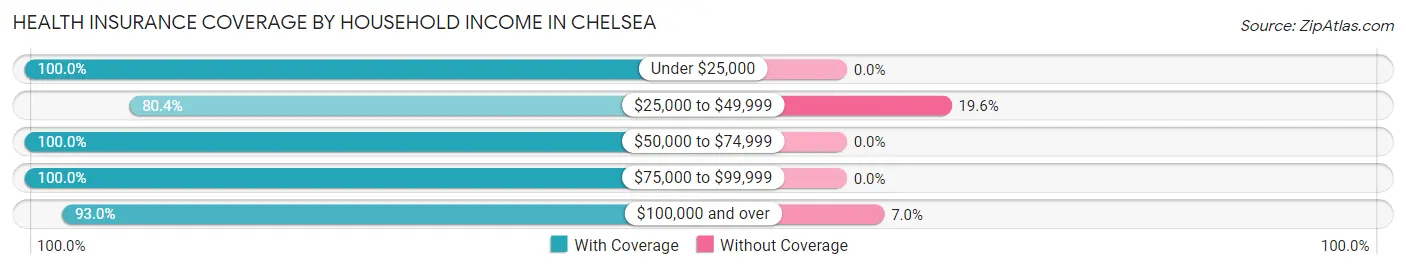
| Household Income | With Coverage | Without Coverage |
| Under $25,000 | 92 (100.0%) | 0 (0.0%) |
| $25,000 to $49,999 | 123 (80.4%) | 30 (19.6%) |
| $50,000 to $74,999 | 42 (100.0%) | 0 (0.0%) |
| $75,000 to $99,999 | 16 (100.0%) | 0 (0.0%) |
| $100,000 and over | 146 (93.0%) | 11 (7.0%) |
Public vs Private Health Insurance Coverage by Age in Chelsea
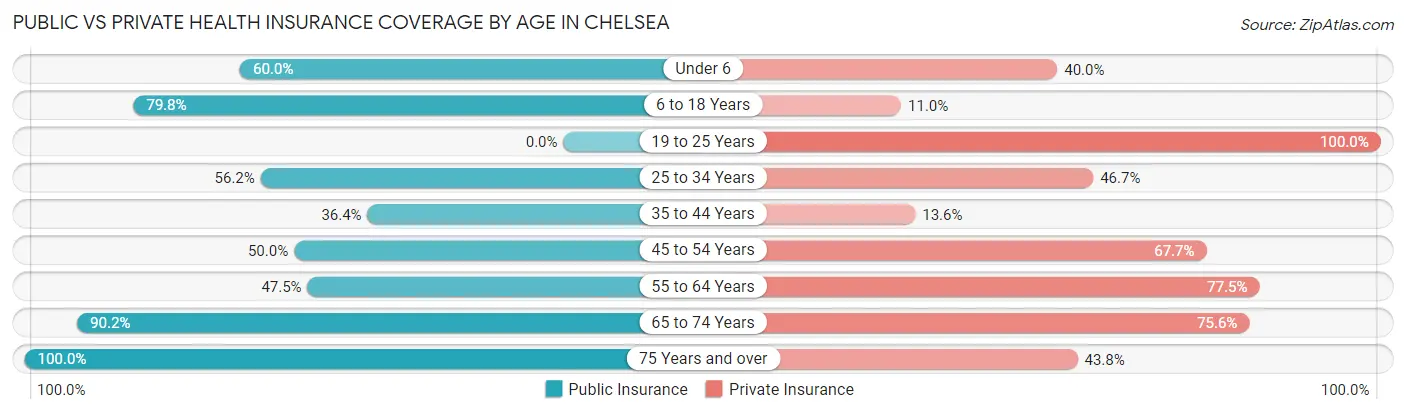
| Age Bracket | Public Insurance | Private Insurance |
| Under 6 | 15 (60.0%) | 10 (40.0%) |
| 6 to 18 Years | 87 (79.8%) | 12 (11.0%) |
| 19 to 25 Years | 0 (0.0%) | 14 (100.0%) |
| 25 to 34 Years | 59 (56.2%) | 49 (46.7%) |
| 35 to 44 Years | 16 (36.4%) | 6 (13.6%) |
| 45 to 54 Years | 17 (50.0%) | 23 (67.6%) |
| 55 to 64 Years | 19 (47.5%) | 31 (77.5%) |
| 65 to 74 Years | 37 (90.2%) | 31 (75.6%) |
| 75 Years and over | 48 (100.0%) | 21 (43.8%) |
| Total | 298 (64.8%) | 197 (42.8%) |
Disability Status by Sex by Age in Chelsea
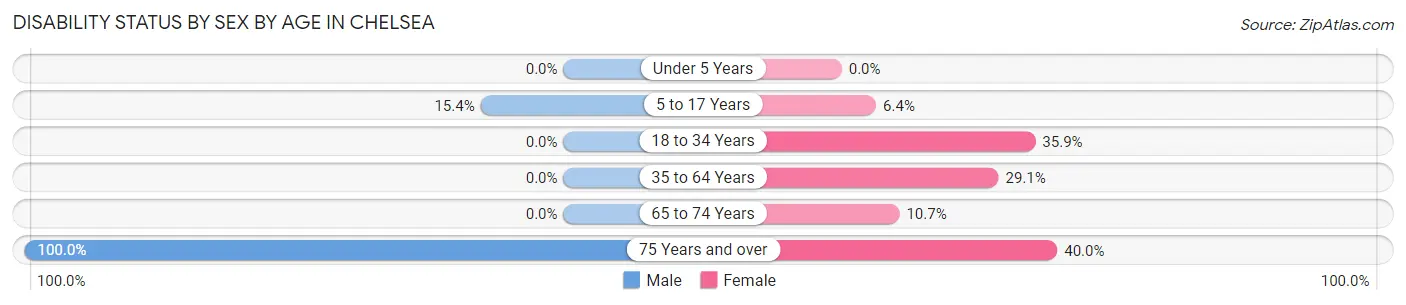
| Age Bracket | Male | Female |
| Under 5 Years | 0 (0.0%) | 0 (0.0%) |
| 5 to 17 Years | 10 (15.4%) | 3 (6.4%) |
| 18 to 34 Years | 0 (0.0%) | 23 (35.9%) |
| 35 to 64 Years | 0 (0.0%) | 16 (29.1%) |
| 65 to 74 Years | 0 (0.0%) | 3 (10.7%) |
| 75 Years and over | 23 (100.0%) | 10 (40.0%) |
Disability Class by Sex by Age in Chelsea
Disability Class: Hearing Difficulty
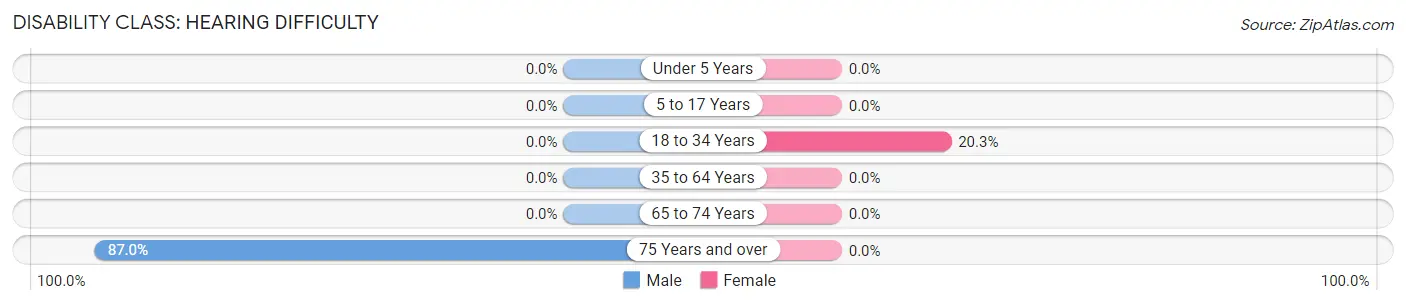
| Age Bracket | Male | Female |
| Under 5 Years | 0 (0.0%) | 0 (0.0%) |
| 5 to 17 Years | 0 (0.0%) | 0 (0.0%) |
| 18 to 34 Years | 0 (0.0%) | 13 (20.3%) |
| 35 to 64 Years | 0 (0.0%) | 0 (0.0%) |
| 65 to 74 Years | 0 (0.0%) | 0 (0.0%) |
| 75 Years and over | 20 (87.0%) | 0 (0.0%) |
Disability Class: Vision Difficulty
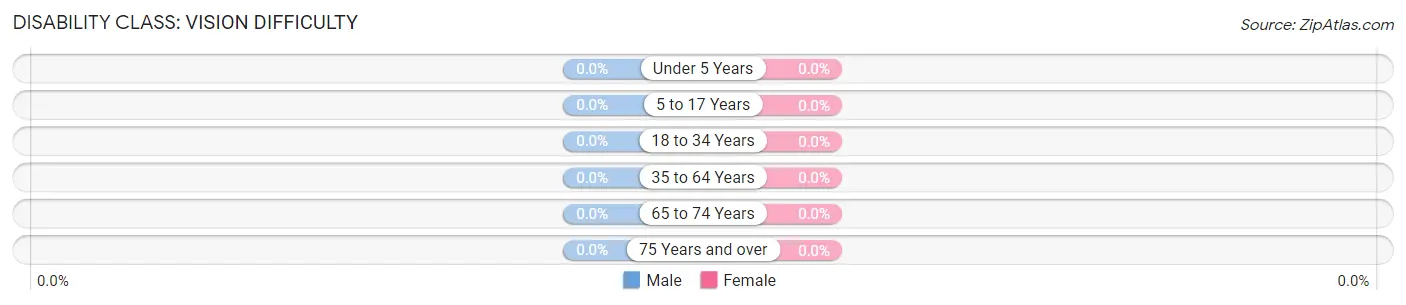
| Age Bracket | Male | Female |
| Under 5 Years | 0 (0.0%) | 0 (0.0%) |
| 5 to 17 Years | 0 (0.0%) | 0 (0.0%) |
| 18 to 34 Years | 0 (0.0%) | 0 (0.0%) |
| 35 to 64 Years | 0 (0.0%) | 0 (0.0%) |
| 65 to 74 Years | 0 (0.0%) | 0 (0.0%) |
| 75 Years and over | 0 (0.0%) | 0 (0.0%) |
Disability Class: Cognitive Difficulty
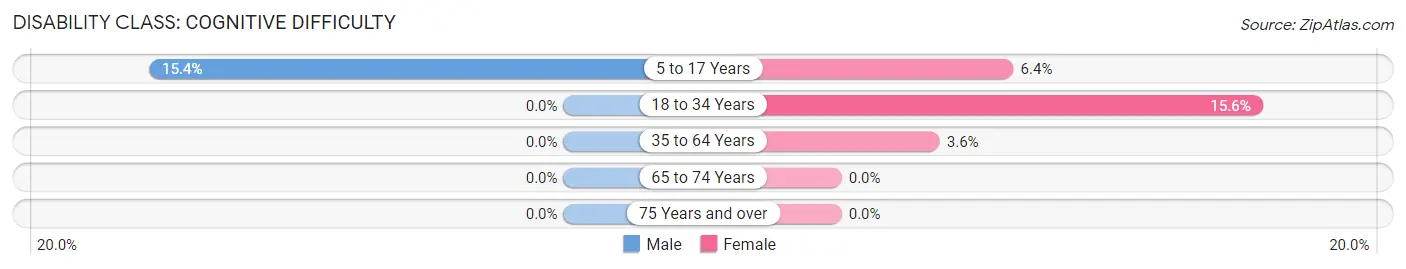
| Age Bracket | Male | Female |
| 5 to 17 Years | 10 (15.4%) | 3 (6.4%) |
| 18 to 34 Years | 0 (0.0%) | 10 (15.6%) |
| 35 to 64 Years | 0 (0.0%) | 2 (3.6%) |
| 65 to 74 Years | 0 (0.0%) | 0 (0.0%) |
| 75 Years and over | 0 (0.0%) | 0 (0.0%) |
Disability Class: Ambulatory Difficulty
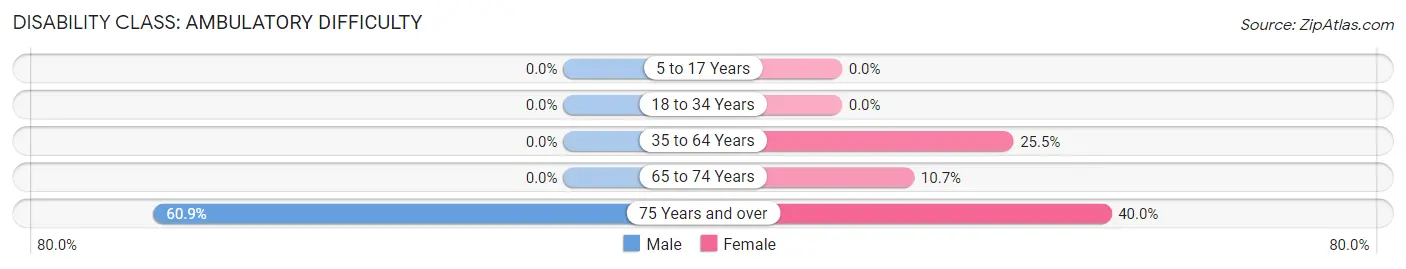
| Age Bracket | Male | Female |
| 5 to 17 Years | 0 (0.0%) | 0 (0.0%) |
| 18 to 34 Years | 0 (0.0%) | 0 (0.0%) |
| 35 to 64 Years | 0 (0.0%) | 14 (25.5%) |
| 65 to 74 Years | 0 (0.0%) | 3 (10.7%) |
| 75 Years and over | 14 (60.9%) | 10 (40.0%) |
Disability Class: Self-Care Difficulty
| Age Bracket | Male | Female |
| 5 to 17 Years | 0 (0.0%) | 0 (0.0%) |
| 18 to 34 Years | 0 (0.0%) | 0 (0.0%) |
| 35 to 64 Years | 0 (0.0%) | 0 (0.0%) |
| 65 to 74 Years | 0 (0.0%) | 0 (0.0%) |
| 75 Years and over | 0 (0.0%) | 0 (0.0%) |
Technology Access in Chelsea
Computing Device Access in Chelsea
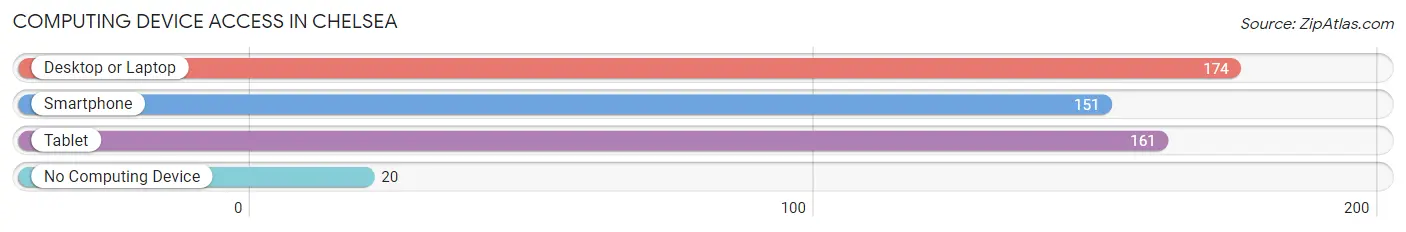
| Device Type | # Households | % Households |
| Desktop or Laptop | 174 | 82.1% |
| Smartphone | 151 | 71.2% |
| Tablet | 161 | 75.9% |
| No Computing Device | 20 | 9.4% |
| Total | 212 | 100.0% |
Internet Access in Chelsea
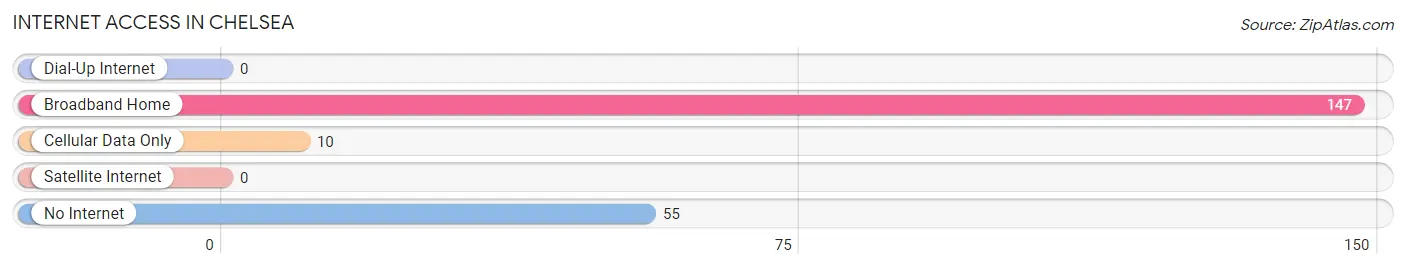
| Internet Type | # Households | % Households |
| Dial-Up Internet | 0 | 0.0% |
| Broadband Home | 147 | 69.3% |
| Cellular Data Only | 10 | 4.7% |
| Satellite Internet | 0 | 0.0% |
| No Internet | 55 | 25.9% |
| Total | 212 | 100.0% |
Chelsea Summary
Chelsea is a small town located in Orange County, Vermont. It is situated in the Connecticut River Valley, and is bordered by the towns of Tunbridge, Vershire, and Strafford. The town has a population of 1,092 people, according to the 2010 census.
History
The town of Chelsea was first settled in 1780 by a group of settlers from Connecticut. The town was originally called “New Connecticut”, but was later changed to Chelsea in 1810. The town was named after the Chelsea neighborhood of London, England.
The town was primarily an agricultural community, with the main crops being corn, potatoes, and hay. The town also had a number of small mills, including a sawmill, gristmill, and a woolen mill.
Geography
Chelsea is located in the Connecticut River Valley, and is bordered by the towns of Tunbridge, Vershire, and Strafford. The town is situated on the western side of the Connecticut River, and is approximately 25 miles south of Montpelier, the state capital.
The town has a total area of 24.2 square miles, of which 24.1 square miles is land and 0.1 square miles is water. The terrain is mostly rolling hills, with some flat areas near the river.
Economy
The economy of Chelsea is primarily based on agriculture and tourism. The town is home to several small farms, which produce a variety of crops, including corn, potatoes, hay, and apples. The town also has a number of small businesses, including a general store, a restaurant, and a bed and breakfast.
The town is also a popular tourist destination, due to its proximity to the Connecticut River and its many outdoor activities. The town is home to a number of hiking trails, as well as a number of lakes and ponds.
Demographics
According to the 2010 census, the population of Chelsea was 1,092 people. The racial makeup of the town was 97.3% White, 0.7% African American, 0.2% Native American, 0.2% Asian, 0.1% Pacific Islander, 0.2% from other races, and 1.3% from two or more races.
The median household income in Chelsea was $45,000, and the median family income was $50,000. The per capita income was $20,000. The town had a poverty rate of 8.3%.
Conclusion
Chelsea is a small town located in Orange County, Vermont. It is situated in the Connecticut River Valley, and is bordered by the towns of Tunbridge, Vershire, and Strafford. The town has a population of 1,092 people, according to the 2010 census. The economy of Chelsea is primarily based on agriculture and tourism, and the town is a popular tourist destination due to its proximity to the Connecticut River and its many outdoor activities.
Common Questions
What is Per Capita Income in Chelsea?
Per Capita income in Chelsea is $35,192.
What is the Median Household income in Chelsea?
Median Household Income in Chelsea is $42,969.
What is Income or Wage Gap in Chelsea?
Income or Wage Gap in Chelsea is 16.7%.
Women in Chelsea earn 83.3 cents for every dollar earned by a man.
What is Inequality or Gini Index in Chelsea?
Inequality or Gini Index in Chelsea is 0.50.
What is the Total Population of Chelsea?
Total Population of Chelsea is 486.
What is the Total Male Population of Chelsea?
Total Male Population of Chelsea is 244.
What is the Total Female Population of Chelsea?
Total Female Population of Chelsea is 242.
What is the Ratio of Males per 100 Females in Chelsea?
There are 100.83 Males per 100 Females in Chelsea.
What is the Ratio of Females per 100 Males in Chelsea?
There are 99.18 Females per 100 Males in Chelsea.
What is the Median Population Age in Chelsea?
Median Population Age in Chelsea is 34.6 Years.
What is the Average Family Size in Chelsea
Average Family Size in Chelsea is 3.0 People.
What is the Average Household Size in Chelsea
Average Household Size in Chelsea is 2.2 People.
How Large is the Labor Force in Chelsea?
There are 202 People in the Labor Forcein in Chelsea.
What is the Percentage of People in the Labor Force in Chelsea?
56.4% of People are in the Labor Force in Chelsea.
What is the Unemployment Rate in Chelsea?
Unemployment Rate in Chelsea is 7.4%.