Zip Codes with the Highest Percentage of Population Employed in Health Diagnosing & Treating in Kentucky
RELATED REPORTS & OPTIONS
Health Diagnosing & Treating
Kentucky
Compare Zip Codes
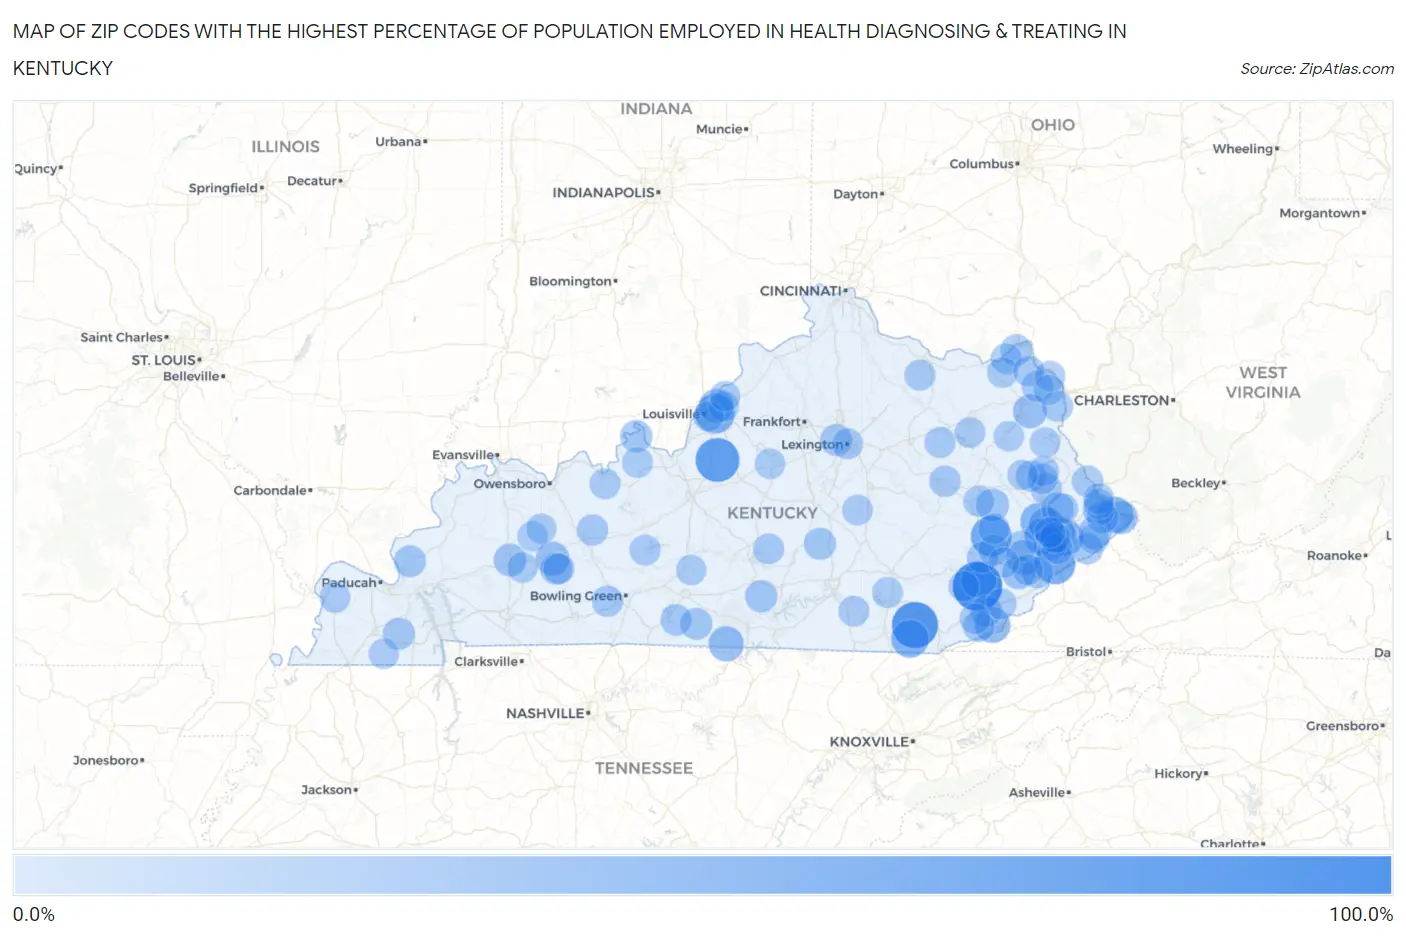
Map of Zip Codes with the Highest Percentage of Population Employed in Health Diagnosing & Treating in Kentucky
0.0%
100.0%
Zip Codes with the Highest Percentage of Population Employed in Health Diagnosing & Treating in Kentucky
| Zip Code | % Employed | vs State | vs National | |
| 1. | 40844 | 100.0% | 7.2%(+92.8)#1 | 6.2%(+93.8)#9 |
| 2. | 40921 | 84.6% | 7.2%(+77.4)#2 | 6.2%(+78.4)#22 |
| 3. | 40110 | 73.5% | 7.2%(+66.3)#3 | 6.2%(+67.3)#26 |
| 4. | 41835 | 60.1% | 7.2%(+52.9)#4 | 6.2%(+53.9)#39 |
| 5. | 41367 | 59.5% | 7.2%(+52.3)#5 | 6.2%(+53.2)#42 |
| 6. | 40041 | 52.9% | 7.2%(+45.7)#6 | 6.2%(+46.7)#56 |
| 7. | 40763 | 45.5% | 7.2%(+38.2)#7 | 6.2%(+39.2)#86 |
| 8. | 41560 | 41.7% | 7.2%(+34.5)#8 | 6.2%(+35.4)#105 |
| 9. | 41622 | 41.3% | 7.2%(+34.1)#9 | 6.2%(+35.1)#109 |
| 10. | 41528 | 39.8% | 7.2%(+32.6)#10 | 6.2%(+33.6)#117 |
| 11. | 41859 | 38.9% | 7.2%(+31.7)#11 | 6.2%(+32.6)#123 |
| 12. | 40815 | 37.0% | 7.2%(+29.7)#12 | 6.2%(+30.7)#133 |
| 13. | 41775 | 36.8% | 7.2%(+29.6)#13 | 6.2%(+30.6)#134 |
| 14. | 42151 | 34.1% | 7.2%(+26.8)#14 | 6.2%(+27.8)#156 |
| 15. | 41660 | 33.9% | 7.2%(+26.7)#15 | 6.2%(+27.7)#157 |
| 16. | 41619 | 33.8% | 7.2%(+26.6)#16 | 6.2%(+27.6)#159 |
| 17. | 41834 | 32.0% | 7.2%(+24.8)#17 | 6.2%(+25.7)#186 |
| 18. | 40025 | 30.3% | 7.2%(+23.1)#18 | 6.2%(+24.1)#215 |
| 19. | 41146 | 28.7% | 7.2%(+21.5)#19 | 6.2%(+22.4)#249 |
| 20. | 42332 | 28.3% | 7.2%(+21.1)#20 | 6.2%(+22.1)#255 |
| 21. | 41612 | 27.5% | 7.2%(+20.2)#21 | 6.2%(+21.2)#265 |
| 22. | 41804 | 25.5% | 7.2%(+18.3)#22 | 6.2%(+19.3)#307 |
| 23. | 41554 | 25.0% | 7.2%(+17.8)#23 | 6.2%(+18.8)#319 |
| 24. | 41547 | 25.0% | 7.2%(+17.8)#24 | 6.2%(+18.8)#323 |
| 25. | 41366 | 24.1% | 7.2%(+16.9)#25 | 6.2%(+17.9)#356 |
| 26. | 42440 | 23.3% | 7.2%(+16.1)#26 | 6.2%(+17.1)#380 |
| 27. | 41642 | 21.8% | 7.2%(+14.6)#27 | 6.2%(+15.6)#442 |
| 28. | 40104 | 21.2% | 7.2%(+14.0)#28 | 6.2%(+15.0)#468 |
| 29. | 42741 | 21.0% | 7.2%(+13.8)#29 | 6.2%(+14.8)#482 |
| 30. | 40442 | 20.2% | 7.2%(+13.0)#30 | 6.2%(+14.0)#539 |
| 31. | 42157 | 19.9% | 7.2%(+12.7)#31 | 6.2%(+13.7)#559 |
| 32. | 42054 | 19.8% | 7.2%(+12.6)#32 | 6.2%(+13.6)#565 |
| 33. | 42028 | 19.7% | 7.2%(+12.5)#33 | 6.2%(+13.5)#571 |
| 34. | 42321 | 19.5% | 7.2%(+12.3)#34 | 6.2%(+13.3)#583 |
| 35. | 40510 | 19.5% | 7.2%(+12.3)#35 | 6.2%(+13.2)#584 |
| 36. | 41555 | 19.1% | 7.2%(+11.9)#36 | 6.2%(+12.8)#609 |
| 37. | 41535 | 19.0% | 7.2%(+11.8)#37 | 6.2%(+12.8)#615 |
| 38. | 40806 | 18.2% | 7.2%(+11.0)#38 | 6.2%(+11.9)#688 |
| 39. | 41360 | 17.7% | 7.2%(+10.5)#39 | 6.2%(+11.5)#741 |
| 40. | 41858 | 17.6% | 7.2%(+10.4)#40 | 6.2%(+11.3)#755 |
| 41. | 41231 | 17.5% | 7.2%(+10.3)#41 | 6.2%(+11.3)#764 |
| 42. | 40831 | 17.5% | 7.2%(+10.3)#42 | 6.2%(+11.3)#766 |
| 43. | 41602 | 17.2% | 7.2%(+10.0)#43 | 6.2%(+11.0)#793 |
| 44. | 42274 | 17.2% | 7.2%(+9.96)#44 | 6.2%(+10.9)#798 |
| 45. | 41121 | 17.1% | 7.2%(+9.86)#45 | 6.2%(+10.8)#808 |
| 46. | 42123 | 17.0% | 7.2%(+9.81)#46 | 6.2%(+10.8)#812 |
| 47. | 42370 | 17.0% | 7.2%(+9.81)#47 | 6.2%(+10.8)#813 |
| 48. | 41174 | 16.8% | 7.2%(+9.62)#48 | 6.2%(+10.6)#836 |
| 49. | 41522 | 16.5% | 7.2%(+9.27)#49 | 6.2%(+10.2)#886 |
| 50. | 41723 | 16.1% | 7.2%(+8.88)#50 | 6.2%(+9.85)#943 |
| 51. | 41256 | 16.0% | 7.2%(+8.76)#51 | 6.2%(+9.73)#958 |
| 52. | 41822 | 16.0% | 7.2%(+8.75)#52 | 6.2%(+9.71)#960 |
| 53. | 41659 | 15.8% | 7.2%(+8.56)#53 | 6.2%(+9.52)#994 |
| 54. | 41129 | 15.6% | 7.2%(+8.44)#54 | 6.2%(+9.40)#1,009 |
| 55. | 41701 | 15.6% | 7.2%(+8.44)#55 | 6.2%(+9.40)#1,010 |
| 56. | 40507 | 15.6% | 7.2%(+8.41)#56 | 6.2%(+9.37)#1,016 |
| 57. | 41055 | 15.6% | 7.2%(+8.37)#57 | 6.2%(+9.33)#1,020 |
| 58. | 40358 | 15.5% | 7.2%(+8.32)#58 | 6.2%(+9.29)#1,032 |
| 59. | 41317 | 15.5% | 7.2%(+8.27)#59 | 6.2%(+9.23)#1,043 |
| 60. | 41166 | 15.3% | 7.2%(+8.11)#60 | 6.2%(+9.07)#1,084 |
| 61. | 41385 | 15.2% | 7.2%(+7.96)#61 | 6.2%(+8.92)#1,116 |
| 62. | 42733 | 15.0% | 7.2%(+7.80)#62 | 6.2%(+8.77)#1,146 |
| 63. | 40111 | 15.0% | 7.2%(+7.75)#63 | 6.2%(+8.72)#1,163 |
| 64. | 42323 | 14.9% | 7.2%(+7.74)#64 | 6.2%(+8.70)#1,169 |
| 65. | 41572 | 14.9% | 7.2%(+7.69)#65 | 6.2%(+8.65)#1,177 |
| 66. | 40176 | 14.9% | 7.2%(+7.68)#66 | 6.2%(+8.64)#1,183 |
| 67. | 41141 | 14.7% | 7.2%(+7.45)#67 | 6.2%(+8.41)#1,226 |
| 68. | 41144 | 14.6% | 7.2%(+7.44)#68 | 6.2%(+8.40)#1,228 |
| 69. | 40737 | 14.6% | 7.2%(+7.42)#69 | 6.2%(+8.39)#1,231 |
| 70. | 42207 | 14.5% | 7.2%(+7.31)#70 | 6.2%(+8.27)#1,254 |
| 71. | 40870 | 14.5% | 7.2%(+7.25)#71 | 6.2%(+8.21)#1,275 |
| 72. | 41826 | 14.4% | 7.2%(+7.23)#72 | 6.2%(+8.20)#1,281 |
| 73. | 41503 | 14.4% | 7.2%(+7.22)#73 | 6.2%(+8.18)#1,286 |
| 74. | 40827 | 14.4% | 7.2%(+7.19)#74 | 6.2%(+8.16)#1,291 |
| 75. | 42087 | 14.4% | 7.2%(+7.17)#75 | 6.2%(+8.14)#1,300 |
| 76. | 40824 | 14.2% | 7.2%(+7.03)#76 | 6.2%(+7.99)#1,344 |
| 77. | 41240 | 14.2% | 7.2%(+7.00)#77 | 6.2%(+7.97)#1,350 |
| 78. | 41169 | 14.2% | 7.2%(+6.99)#78 | 6.2%(+7.95)#1,355 |
| 79. | 42634 | 14.2% | 7.2%(+6.96)#79 | 6.2%(+7.93)#1,362 |
| 80. | 42464 | 14.0% | 7.2%(+6.76)#80 | 6.2%(+7.73)#1,419 |
| 81. | 41604 | 14.0% | 7.2%(+6.74)#81 | 6.2%(+7.71)#1,421 |
| 82. | 40461 | 13.8% | 7.2%(+6.62)#82 | 6.2%(+7.59)#1,458 |
| 83. | 41263 | 13.6% | 7.2%(+6.37)#83 | 6.2%(+7.34)#1,548 |
| 84. | 41647 | 13.5% | 7.2%(+6.30)#84 | 6.2%(+7.27)#1,563 |
| 85. | 40313 | 13.5% | 7.2%(+6.29)#85 | 6.2%(+7.25)#1,570 |
| 86. | 40241 | 13.4% | 7.2%(+6.19)#86 | 6.2%(+7.15)#1,614 |
| 87. | 42372 | 13.2% | 7.2%(+5.97)#87 | 6.2%(+6.94)#1,677 |
| 88. | 41751 | 13.2% | 7.2%(+5.95)#88 | 6.2%(+6.91)#1,686 |
| 89. | 41171 | 13.2% | 7.2%(+5.94)#89 | 6.2%(+6.91)#1,691 |
| 90. | 41201 | 13.0% | 7.2%(+5.78)#90 | 6.2%(+6.74)#1,747 |
| 91. | 40012 | 12.9% | 7.2%(+5.74)#91 | 6.2%(+6.70)#1,759 |
| 92. | 41527 | 12.9% | 7.2%(+5.69)#92 | 6.2%(+6.66)#1,777 |
| 93. | 42079 | 12.8% | 7.2%(+5.63)#93 | 6.2%(+6.59)#1,811 |
| 94. | 40204 | 12.7% | 7.2%(+5.47)#94 | 6.2%(+6.44)#1,873 |
| 95. | 40059 | 12.7% | 7.2%(+5.45)#95 | 6.2%(+6.42)#1,885 |
| 96. | 41540 | 12.7% | 7.2%(+5.45)#96 | 6.2%(+6.41)#1,887 |
| 97. | 41238 | 12.6% | 7.2%(+5.44)#97 | 6.2%(+6.40)#1,891 |
| 98. | 42350 | 12.6% | 7.2%(+5.39)#98 | 6.2%(+6.35)#1,910 |
| 99. | 41102 | 12.5% | 7.2%(+5.32)#99 | 6.2%(+6.29)#1,940 |
| 100. | 42749 | 12.4% | 7.2%(+5.16)#100 | 6.2%(+6.13)#2,017 |
Common Questions
What are the Top 10 Zip Codes with the Highest Percentage of Population Employed in Health Diagnosing & Treating in Kentucky?
Top 10 Zip Codes with the Highest Percentage of Population Employed in Health Diagnosing & Treating in Kentucky are:
What zip code has the Highest Percentage of Population Employed in Health Diagnosing & Treating in Kentucky?
40844 has the Highest Percentage of Population Employed in Health Diagnosing & Treating in Kentucky with 100.0%.
What is the Percentage of Population Employed in Health Diagnosing & Treating in the State of Kentucky?
Percentage of Population Employed in Health Diagnosing & Treating in Kentucky is 7.2%.
What is the Percentage of Population Employed in Health Diagnosing & Treating in the United States?
Percentage of Population Employed in Health Diagnosing & Treating in the United States is 6.2%.