Zip Codes with the Highest Percentage of Families with Income Above $200,000 in Houston, TX
RELATED REPORTS & OPTIONS
Family Income | $200k+
Houston
Compare Zip Codes
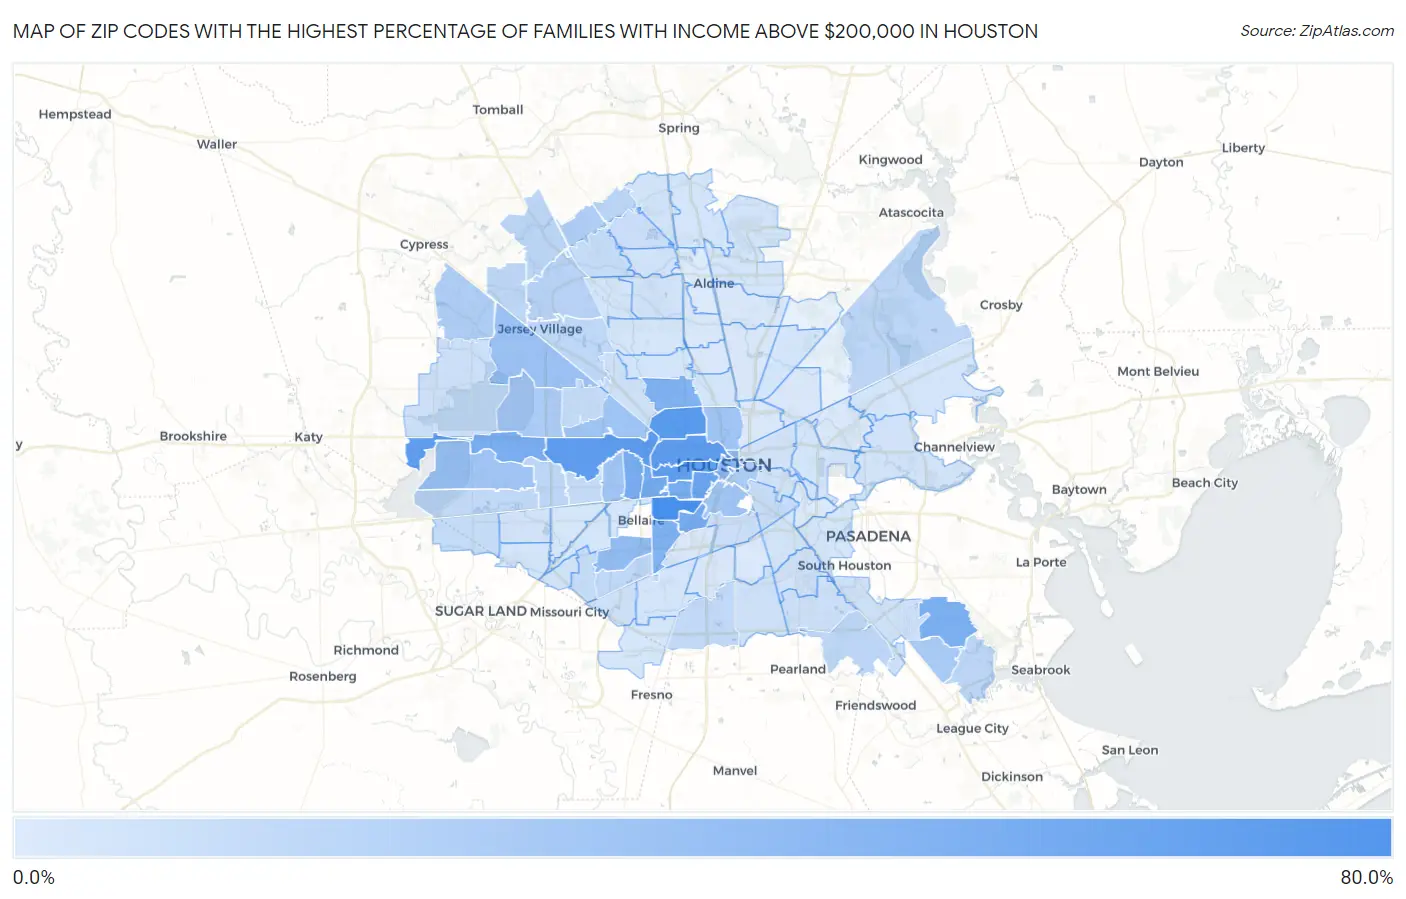
Map of Zip Codes with the Highest Percentage of Families with Income Above $200,000 in Houston
0.10%
63.9%
Zip Codes with the Highest Percentage of Families with Income Above $200,000 in Houston, TX
| Zip Code | Families with Income > $200k | vs State | vs National | |
| 1. | 77005 | 63.9% | 13.5%(+50.4)#8 | 14.8%(+49.1)#207 |
| 2. | 77008 | 55.4% | 13.5%(+41.9)#16 | 14.8%(+40.6)#440 |
| 3. | 77024 | 52.4% | 13.5%(+38.9)#23 | 14.8%(+37.6)#554 |
| 4. | 77007 | 52.3% | 13.5%(+38.8)#24 | 14.8%(+37.5)#559 |
| 5. | 77094 | 51.1% | 13.5%(+37.6)#28 | 14.8%(+36.3)#616 |
| 6. | 77019 | 50.3% | 13.5%(+36.8)#30 | 14.8%(+35.5)#647 |
| 7. | 77006 | 46.7% | 13.5%(+33.2)#33 | 14.8%(+31.9)#829 |
| 8. | 77027 | 40.6% | 13.5%(+27.1)#52 | 14.8%(+25.8)#1,265 |
| 9. | 77056 | 40.1% | 13.5%(+26.6)#56 | 14.8%(+25.3)#1,304 |
| 10. | 77030 | 39.7% | 13.5%(+26.2)#61 | 14.8%(+24.9)#1,339 |
| 11. | 77098 | 39.3% | 13.5%(+25.8)#63 | 14.8%(+24.5)#1,384 |
| 12. | 77010 | 39.2% | 13.5%(+25.7)#65 | 14.8%(+24.4)#1,399 |
| 13. | 77079 | 38.6% | 13.5%(+25.1)#67 | 14.8%(+23.8)#1,448 |
| 14. | 77059 | 38.1% | 13.5%(+24.6)#69 | 14.8%(+23.3)#1,495 |
| 15. | 77025 | 35.4% | 13.5%(+21.9)#80 | 14.8%(+20.6)#1,787 |
| 16. | 77018 | 35.2% | 13.5%(+21.7)#83 | 14.8%(+20.4)#1,818 |
| 17. | 77002 | 30.6% | 13.5%(+17.1)#112 | 14.8%(+15.8)#2,424 |
| 18. | 77046 | 29.4% | 13.5%(+15.9)#123 | 14.8%(+14.6)#2,609 |
| 19. | 77096 | 27.3% | 13.5%(+13.8)#149 | 14.8%(+12.5)#2,993 |
| 20. | 77041 | 24.0% | 13.5%(+10.5)#192 | 14.8%(+9.20)#3,699 |
| 21. | 77055 | 23.3% | 13.5%(+9.80)#198 | 14.8%(+8.50)#3,870 |
| 22. | 77057 | 22.1% | 13.5%(+8.60)#214 | 14.8%(+7.30)#4,178 |
| 23. | 77004 | 21.8% | 13.5%(+8.30)#217 | 14.8%(+7.00)#4,262 |
| 24. | 77077 | 21.6% | 13.5%(+8.10)#220 | 14.8%(+6.80)#4,317 |
| 25. | 77009 | 21.5% | 13.5%(+8.00)#222 | 14.8%(+6.70)#4,351 |
| 26. | 77062 | 18.8% | 13.5%(+5.30)#268 | 14.8%(+4.00)#5,236 |
| 27. | 77043 | 17.6% | 13.5%(+4.10)#293 | 14.8%(+2.80)#5,724 |
| 28. | 77003 | 17.6% | 13.5%(+4.10)#296 | 14.8%(+2.80)#5,737 |
| 29. | 77069 | 16.5% | 13.5%(+3.00)#312 | 14.8%(+1.70)#6,205 |
| 30. | 77095 | 16.1% | 13.5%(+2.60)#319 | 14.8%(+1.30)#6,387 |
| 31. | 77064 | 13.2% | 13.5%(-0.300)#433 | 14.8%(-1.60)#8,062 |
| 32. | 77068 | 12.2% | 13.5%(-1.30)#487 | 14.8%(-2.60)#8,821 |
| 33. | 77042 | 11.6% | 13.5%(-1.90)#510 | 14.8%(-3.20)#9,260 |
| 34. | 77058 | 11.3% | 13.5%(-2.20)#531 | 14.8%(-3.50)#9,543 |
| 35. | 77044 | 11.1% | 13.5%(-2.40)#542 | 14.8%(-3.70)#9,701 |
| 36. | 77070 | 11.0% | 13.5%(-2.50)#550 | 14.8%(-3.80)#9,803 |
| 37. | 77089 | 10.9% | 13.5%(-2.60)#557 | 14.8%(-3.90)#9,883 |
| 38. | 77035 | 10.5% | 13.5%(-3.00)#601 | 14.8%(-4.30)#10,286 |
| 39. | 77065 | 10.4% | 13.5%(-3.10)#606 | 14.8%(-4.40)#10,372 |
| 40. | 77040 | 10.2% | 13.5%(-3.30)#620 | 14.8%(-4.60)#10,572 |
| 41. | 77047 | 9.5% | 13.5%(-4.00)#672 | 14.8%(-5.30)#11,307 |
| 42. | 77082 | 9.4% | 13.5%(-4.10)#679 | 14.8%(-5.40)#11,404 |
| 43. | 77063 | 8.7% | 13.5%(-4.80)#731 | 14.8%(-6.10)#12,254 |
| 44. | 77071 | 8.3% | 13.5%(-5.20)#758 | 14.8%(-6.50)#12,784 |
| 45. | 77080 | 8.0% | 13.5%(-5.50)#784 | 14.8%(-6.80)#13,166 |
| 46. | 77066 | 7.8% | 13.5%(-5.70)#799 | 14.8%(-7.00)#13,436 |
| 47. | 77083 | 7.6% | 13.5%(-5.90)#820 | 14.8%(-7.20)#13,708 |
| 48. | 77023 | 7.4% | 13.5%(-6.10)#841 | 14.8%(-7.40)#14,029 |
| 49. | 77014 | 6.7% | 13.5%(-6.80)#910 | 14.8%(-8.10)#15,180 |
| 50. | 77021 | 6.2% | 13.5%(-7.30)#960 | 14.8%(-8.60)#16,089 |
| 51. | 77084 | 5.5% | 13.5%(-8.00)#1,022 | 14.8%(-9.30)#17,383 |
| 52. | 77075 | 5.2% | 13.5%(-8.30)#1,054 | 14.8%(-9.60)#17,980 |
| 53. | 77048 | 5.1% | 13.5%(-8.40)#1,066 | 14.8%(-9.70)#18,203 |
| 54. | 77085 | 5.1% | 13.5%(-8.40)#1,068 | 14.8%(-9.70)#18,214 |
| 55. | 77092 | 4.7% | 13.5%(-8.80)#1,118 | 14.8%(-10.1)#18,992 |
| 56. | 77034 | 4.4% | 13.5%(-9.10)#1,157 | 14.8%(-10.4)#19,590 |
| 57. | 77090 | 4.3% | 13.5%(-9.20)#1,167 | 14.8%(-10.5)#19,756 |
| 58. | 77061 | 4.3% | 13.5%(-9.20)#1,170 | 14.8%(-10.5)#19,770 |
| 59. | 77031 | 4.3% | 13.5%(-9.20)#1,173 | 14.8%(-10.5)#19,784 |
| 60. | 77020 | 4.2% | 13.5%(-9.30)#1,189 | 14.8%(-10.6)#20,000 |
| 61. | 77038 | 4.1% | 13.5%(-9.40)#1,202 | 14.8%(-10.7)#20,178 |
| 62. | 77067 | 4.0% | 13.5%(-9.50)#1,214 | 14.8%(-10.8)#20,394 |
| 63. | 77072 | 3.9% | 13.5%(-9.60)#1,227 | 14.8%(-10.9)#20,608 |
| 64. | 77011 | 3.9% | 13.5%(-9.60)#1,231 | 14.8%(-10.9)#20,638 |
| 65. | 77015 | 3.6% | 13.5%(-9.90)#1,255 | 14.8%(-11.2)#21,226 |
| 66. | 77073 | 3.5% | 13.5%(-10.00)#1,274 | 14.8%(-11.3)#21,457 |
| 67. | 77091 | 3.5% | 13.5%(-10.00)#1,275 | 14.8%(-11.3)#21,468 |
| 68. | 77022 | 3.5% | 13.5%(-10.00)#1,276 | 14.8%(-11.3)#21,474 |
| 69. | 77016 | 3.4% | 13.5%(-10.1)#1,290 | 14.8%(-11.4)#21,659 |
| 70. | 77087 | 3.3% | 13.5%(-10.2)#1,298 | 14.8%(-11.5)#21,858 |
| 71. | 77045 | 3.1% | 13.5%(-10.4)#1,318 | 14.8%(-11.7)#22,258 |
| 72. | 77086 | 3.1% | 13.5%(-10.4)#1,319 | 14.8%(-11.7)#22,263 |
| 73. | 77099 | 3.0% | 13.5%(-10.5)#1,330 | 14.8%(-11.8)#22,453 |
| 74. | 77029 | 3.0% | 13.5%(-10.5)#1,336 | 14.8%(-11.8)#22,484 |
| 75. | 77049 | 2.9% | 13.5%(-10.6)#1,350 | 14.8%(-11.9)#22,672 |
| 76. | 77032 | 2.9% | 13.5%(-10.6)#1,351 | 14.8%(-11.9)#22,705 |
| 77. | 77036 | 2.7% | 13.5%(-10.8)#1,372 | 14.8%(-12.1)#23,071 |
| 78. | 77074 | 2.7% | 13.5%(-10.8)#1,374 | 14.8%(-12.1)#23,080 |
| 79. | 77053 | 2.7% | 13.5%(-10.8)#1,380 | 14.8%(-12.1)#23,093 |
| 80. | 77081 | 2.6% | 13.5%(-10.9)#1,395 | 14.8%(-12.2)#23,292 |
| 81. | 77088 | 2.5% | 13.5%(-11.0)#1,406 | 14.8%(-12.3)#23,486 |
| 82. | 77017 | 2.4% | 13.5%(-11.1)#1,416 | 14.8%(-12.4)#23,691 |
| 83. | 77054 | 1.9% | 13.5%(-11.6)#1,461 | 14.8%(-12.9)#24,622 |
| 84. | 77093 | 1.8% | 13.5%(-11.7)#1,470 | 14.8%(-13.0)#24,775 |
| 85. | 77028 | 1.8% | 13.5%(-11.7)#1,472 | 14.8%(-13.0)#24,790 |
| 86. | 77037 | 1.8% | 13.5%(-11.7)#1,473 | 14.8%(-13.0)#24,792 |
| 87. | 77039 | 1.7% | 13.5%(-11.8)#1,486 | 14.8%(-13.1)#24,974 |
| 88. | 77051 | 1.3% | 13.5%(-12.2)#1,523 | 14.8%(-13.5)#25,628 |
| 89. | 77013 | 1.0% | 13.5%(-12.5)#1,552 | 14.8%(-13.8)#26,082 |
| 90. | 77076 | 0.90% | 13.5%(-12.6)#1,560 | 14.8%(-13.9)#26,210 |
| 91. | 77033 | 0.90% | 13.5%(-12.6)#1,562 | 14.8%(-13.9)#26,214 |
| 92. | 77026 | 0.80% | 13.5%(-12.7)#1,570 | 14.8%(-14.0)#26,349 |
| 93. | 77060 | 0.20% | 13.5%(-13.3)#1,605 | 14.8%(-14.6)#26,945 |
| 94. | 77012 | 0.10% | 13.5%(-13.4)#1,608 | 14.8%(-14.7)#26,992 |
1
Common Questions
What are the Top 10 Zip Codes with the Highest Percentage of Families with Income Above $200,000 in Houston, TX?
Top 10 Zip Codes with the Highest Percentage of Families with Income Above $200,000 in Houston, TX are:
What zip code has the Highest Percentage of Families with Income Above $200,000 in Houston, TX?
77005 has the Highest Percentage of Families with Income Above $200,000 in Houston, TX with 63.9%.
What is the Percentage of Families with Income Above $200,000 in Houston, TX?
Percentage of Families with Income Above $200,000 in Houston is 13.4%.
What is the Percentage of Families with Income Above $200,000 in Texas?
Percentage of Families with Income Above $200,000 in Texas is 13.5%.
What is the Percentage of Families with Income Above $200,000 in the United States?
Percentage of Families with Income Above $200,000 in the United States is 14.8%.