Zip Codes with the Highest Percentage of Population with a Degree in Communications in Houston, TX
RELATED REPORTS & OPTIONS
Communications
Houston
Compare Zip Codes
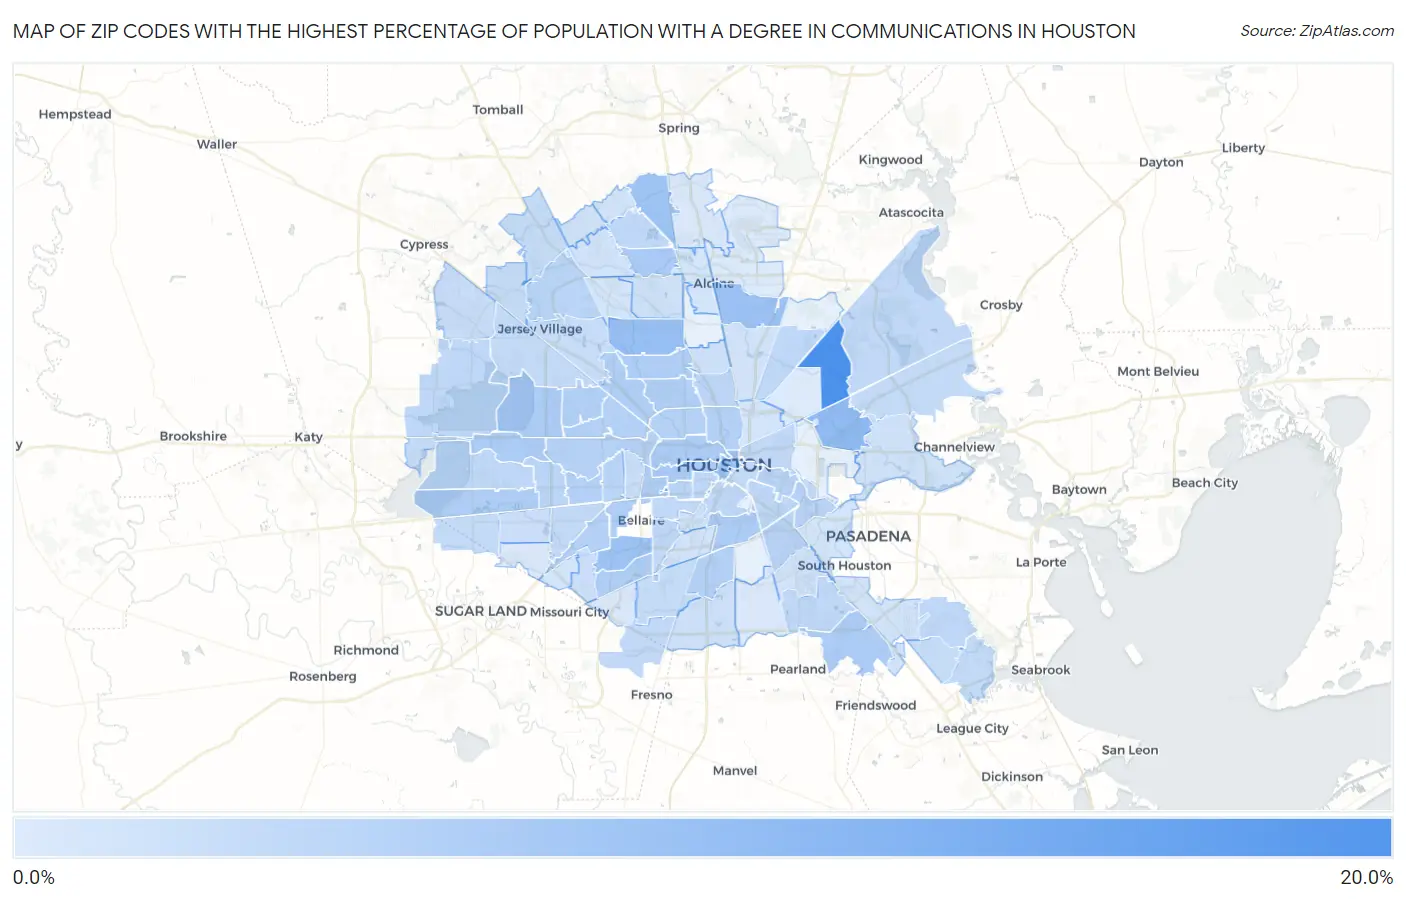
Map of Zip Codes with the Highest Percentage of Population with a Degree in Communications in Houston
0.48%
16.8%
Zip Codes with the Highest Percentage of Population with a Degree in Communications in Houston, TX
| Zip Code | % Graduates | vs State | vs National | |
| 1. | 77046 | 16.8% | 4.1%(+12.7)#32 | 4.1%(+12.7)#449 |
| 2. | 77078 | 16.4% | 4.1%(+12.3)#33 | 4.1%(+12.3)#475 |
| 3. | 77013 | 8.4% | 4.1%(+4.34)#97 | 4.1%(+4.29)#1,666 |
| 4. | 77088 | 7.6% | 4.1%(+3.55)#129 | 4.1%(+3.51)#2,104 |
| 5. | 77039 | 7.5% | 4.1%(+3.46)#134 | 4.1%(+3.41)#2,164 |
| 6. | 77096 | 7.0% | 4.1%(+2.96)#155 | 4.1%(+2.91)#2,562 |
| 7. | 77090 | 7.0% | 4.1%(+2.88)#159 | 4.1%(+2.84)#2,631 |
| 8. | 77002 | 6.9% | 4.1%(+2.86)#161 | 4.1%(+2.81)#2,652 |
| 9. | 77067 | 5.8% | 4.1%(+1.75)#238 | 4.1%(+1.71)#4,042 |
| 10. | 77019 | 5.7% | 4.1%(+1.61)#250 | 4.1%(+1.56)#4,278 |
| 11. | 77007 | 5.5% | 4.1%(+1.46)#261 | 4.1%(+1.41)#4,568 |
| 12. | 77043 | 5.5% | 4.1%(+1.43)#265 | 4.1%(+1.38)#4,613 |
| 13. | 77021 | 5.4% | 4.1%(+1.33)#278 | 4.1%(+1.28)#4,808 |
| 14. | 77089 | 5.4% | 4.1%(+1.31)#280 | 4.1%(+1.27)#4,835 |
| 15. | 77079 | 5.4% | 4.1%(+1.29)#285 | 4.1%(+1.25)#4,875 |
| 16. | 77082 | 5.4% | 4.1%(+1.28)#291 | 4.1%(+1.23)#4,916 |
| 17. | 77035 | 5.3% | 4.1%(+1.23)#295 | 4.1%(+1.18)#5,001 |
| 18. | 77081 | 5.3% | 4.1%(+1.19)#302 | 4.1%(+1.15)#5,072 |
| 19. | 77027 | 5.2% | 4.1%(+1.10)#313 | 4.1%(+1.06)#5,272 |
| 20. | 77091 | 5.2% | 4.1%(+1.08)#316 | 4.1%(+1.03)#5,322 |
| 21. | 77018 | 4.9% | 4.1%(+0.837)#345 | 4.1%(+0.792)#5,863 |
| 22. | 77092 | 4.9% | 4.1%(+0.809)#347 | 4.1%(+0.764)#5,919 |
| 23. | 77074 | 4.8% | 4.1%(+0.751)#357 | 4.1%(+0.706)#6,087 |
| 24. | 77009 | 4.8% | 4.1%(+0.696)#363 | 4.1%(+0.650)#6,212 |
| 25. | 77055 | 4.8% | 4.1%(+0.685)#368 | 4.1%(+0.640)#6,240 |
| 26. | 77051 | 4.8% | 4.1%(+0.672)#369 | 4.1%(+0.627)#6,267 |
| 27. | 77063 | 4.7% | 4.1%(+0.633)#373 | 4.1%(+0.588)#6,352 |
| 28. | 77080 | 4.7% | 4.1%(+0.577)#383 | 4.1%(+0.532)#6,503 |
| 29. | 77024 | 4.6% | 4.1%(+0.477)#405 | 4.1%(+0.432)#6,783 |
| 30. | 77008 | 4.5% | 4.1%(+0.372)#419 | 4.1%(+0.326)#7,061 |
| 31. | 77012 | 4.4% | 4.1%(+0.289)#427 | 4.1%(+0.243)#7,313 |
| 32. | 77011 | 4.2% | 4.1%(+0.120)#456 | 4.1%(+0.075)#7,865 |
| 33. | 77087 | 4.2% | 4.1%(+0.076)#463 | 4.1%(+0.030)#8,012 |
| 34. | 77057 | 4.1% | 4.1%(-0.037)#489 | 4.1%(-0.083)#8,405 |
| 35. | 77098 | 3.9% | 4.1%(-0.140)#509 | 4.1%(-0.185)#8,742 |
| 36. | 77064 | 3.9% | 4.1%(-0.147)#510 | 4.1%(-0.192)#8,770 |
| 37. | 77042 | 3.9% | 4.1%(-0.165)#517 | 4.1%(-0.210)#8,827 |
| 38. | 77022 | 3.9% | 4.1%(-0.221)#529 | 4.1%(-0.267)#9,026 |
| 39. | 77084 | 3.6% | 4.1%(-0.465)#577 | 4.1%(-0.510)#9,879 |
| 40. | 77059 | 3.6% | 4.1%(-0.490)#583 | 4.1%(-0.535)#9,950 |
| 41. | 77075 | 3.6% | 4.1%(-0.536)#591 | 4.1%(-0.582)#10,126 |
| 42. | 77023 | 3.5% | 4.1%(-0.547)#594 | 4.1%(-0.593)#10,162 |
| 43. | 77014 | 3.5% | 4.1%(-0.548)#596 | 4.1%(-0.594)#10,167 |
| 44. | 77077 | 3.5% | 4.1%(-0.570)#602 | 4.1%(-0.615)#10,253 |
| 45. | 77004 | 3.5% | 4.1%(-0.588)#606 | 4.1%(-0.634)#10,324 |
| 46. | 77016 | 3.5% | 4.1%(-0.588)#607 | 4.1%(-0.634)#10,326 |
| 47. | 77006 | 3.4% | 4.1%(-0.645)#618 | 4.1%(-0.690)#10,540 |
| 48. | 77036 | 3.4% | 4.1%(-0.657)#624 | 4.1%(-0.702)#10,583 |
| 49. | 77025 | 3.4% | 4.1%(-0.660)#626 | 4.1%(-0.705)#10,596 |
| 50. | 77020 | 3.4% | 4.1%(-0.710)#638 | 4.1%(-0.755)#10,780 |
| 51. | 77005 | 3.3% | 4.1%(-0.749)#643 | 4.1%(-0.795)#10,911 |
| 52. | 77044 | 3.3% | 4.1%(-0.797)#654 | 4.1%(-0.843)#11,089 |
| 53. | 77053 | 3.2% | 4.1%(-0.847)#666 | 4.1%(-0.893)#11,289 |
| 54. | 77049 | 3.1% | 4.1%(-1.02)#700 | 4.1%(-1.07)#11,939 |
| 55. | 77058 | 3.0% | 4.1%(-1.06)#711 | 4.1%(-1.11)#12,104 |
| 56. | 77003 | 3.0% | 4.1%(-1.08)#713 | 4.1%(-1.12)#12,141 |
| 57. | 77083 | 3.0% | 4.1%(-1.11)#720 | 4.1%(-1.15)#12,265 |
| 58. | 77041 | 3.0% | 4.1%(-1.12)#724 | 4.1%(-1.17)#12,312 |
| 59. | 77070 | 2.9% | 4.1%(-1.16)#739 | 4.1%(-1.21)#12,493 |
| 60. | 77062 | 2.9% | 4.1%(-1.16)#740 | 4.1%(-1.21)#12,498 |
| 61. | 77045 | 2.9% | 4.1%(-1.18)#744 | 4.1%(-1.22)#12,540 |
| 62. | 77094 | 2.8% | 4.1%(-1.27)#767 | 4.1%(-1.31)#12,898 |
| 63. | 77065 | 2.8% | 4.1%(-1.29)#777 | 4.1%(-1.34)#13,001 |
| 64. | 77095 | 2.7% | 4.1%(-1.42)#805 | 4.1%(-1.47)#13,536 |
| 65. | 77056 | 2.6% | 4.1%(-1.49)#814 | 4.1%(-1.53)#13,766 |
| 66. | 77010 | 2.6% | 4.1%(-1.52)#821 | 4.1%(-1.57)#13,896 |
| 67. | 77040 | 2.5% | 4.1%(-1.57)#832 | 4.1%(-1.62)#14,078 |
| 68. | 77072 | 2.4% | 4.1%(-1.72)#855 | 4.1%(-1.77)#14,602 |
| 69. | 77071 | 2.4% | 4.1%(-1.73)#857 | 4.1%(-1.78)#14,622 |
| 70. | 77076 | 2.2% | 4.1%(-1.87)#889 | 4.1%(-1.92)#15,116 |
| 71. | 77047 | 2.1% | 4.1%(-1.96)#901 | 4.1%(-2.01)#15,402 |
| 72. | 77015 | 2.0% | 4.1%(-2.10)#926 | 4.1%(-2.15)#15,943 |
| 73. | 77038 | 2.0% | 4.1%(-2.11)#930 | 4.1%(-2.16)#15,979 |
| 74. | 77069 | 1.8% | 4.1%(-2.28)#964 | 4.1%(-2.32)#16,540 |
| 75. | 77030 | 1.8% | 4.1%(-2.28)#968 | 4.1%(-2.33)#16,562 |
| 76. | 77093 | 1.8% | 4.1%(-2.33)#974 | 4.1%(-2.38)#16,705 |
| 77. | 77068 | 1.7% | 4.1%(-2.38)#985 | 4.1%(-2.42)#16,854 |
| 78. | 77066 | 1.7% | 4.1%(-2.39)#987 | 4.1%(-2.44)#16,883 |
| 79. | 77061 | 1.6% | 4.1%(-2.48)#1,006 | 4.1%(-2.53)#17,173 |
| 80. | 77054 | 1.6% | 4.1%(-2.50)#1,014 | 4.1%(-2.54)#17,236 |
| 81. | 77034 | 1.6% | 4.1%(-2.50)#1,015 | 4.1%(-2.54)#17,238 |
| 82. | 77086 | 1.5% | 4.1%(-2.63)#1,040 | 4.1%(-2.68)#17,649 |
| 83. | 77060 | 1.4% | 4.1%(-2.68)#1,048 | 4.1%(-2.73)#17,792 |
| 84. | 77026 | 1.4% | 4.1%(-2.71)#1,056 | 4.1%(-2.76)#17,884 |
| 85. | 77017 | 1.4% | 4.1%(-2.73)#1,059 | 4.1%(-2.78)#17,947 |
| 86. | 77031 | 1.3% | 4.1%(-2.77)#1,066 | 4.1%(-2.81)#18,060 |
| 87. | 77073 | 0.84% | 4.1%(-3.25)#1,142 | 4.1%(-3.29)#19,383 |
| 88. | 77099 | 0.76% | 4.1%(-3.33)#1,155 | 4.1%(-3.37)#19,586 |
| 89. | 77085 | 0.66% | 4.1%(-3.43)#1,165 | 4.1%(-3.48)#19,830 |
| 90. | 77048 | 0.64% | 4.1%(-3.45)#1,167 | 4.1%(-3.49)#19,854 |
| 91. | 77032 | 0.50% | 4.1%(-3.59)#1,185 | 4.1%(-3.63)#20,114 |
| 92. | 77028 | 0.48% | 4.1%(-3.61)#1,188 | 4.1%(-3.65)#20,163 |
1
Common Questions
What are the Top 10 Zip Codes with the Highest Percentage of Population with a Degree in Communications in Houston, TX?
Top 10 Zip Codes with the Highest Percentage of Population with a Degree in Communications in Houston, TX are:
What zip code has the Highest Percentage of Population with a Degree in Communications in Houston, TX?
77046 has the Highest Percentage of Population with a Degree in Communications in Houston, TX with 16.8%.
What is the Percentage of Population with a Degree in Communications in Houston, TX?
Percentage of Population with a Degree in Communications in Houston is 4.2%.
What is the Percentage of Population with a Degree in Communications in Texas?
Percentage of Population with a Degree in Communications in Texas is 4.1%.
What is the Percentage of Population with a Degree in Communications in the United States?
Percentage of Population with a Degree in Communications in the United States is 4.1%.