Zip Codes with the Highest Percentage of Self-Employed / Not Incorporated in Houston, TX
RELATED REPORTS & OPTIONS
Self-Employed / Not Incorporated
Houston
Compare Zip Codes
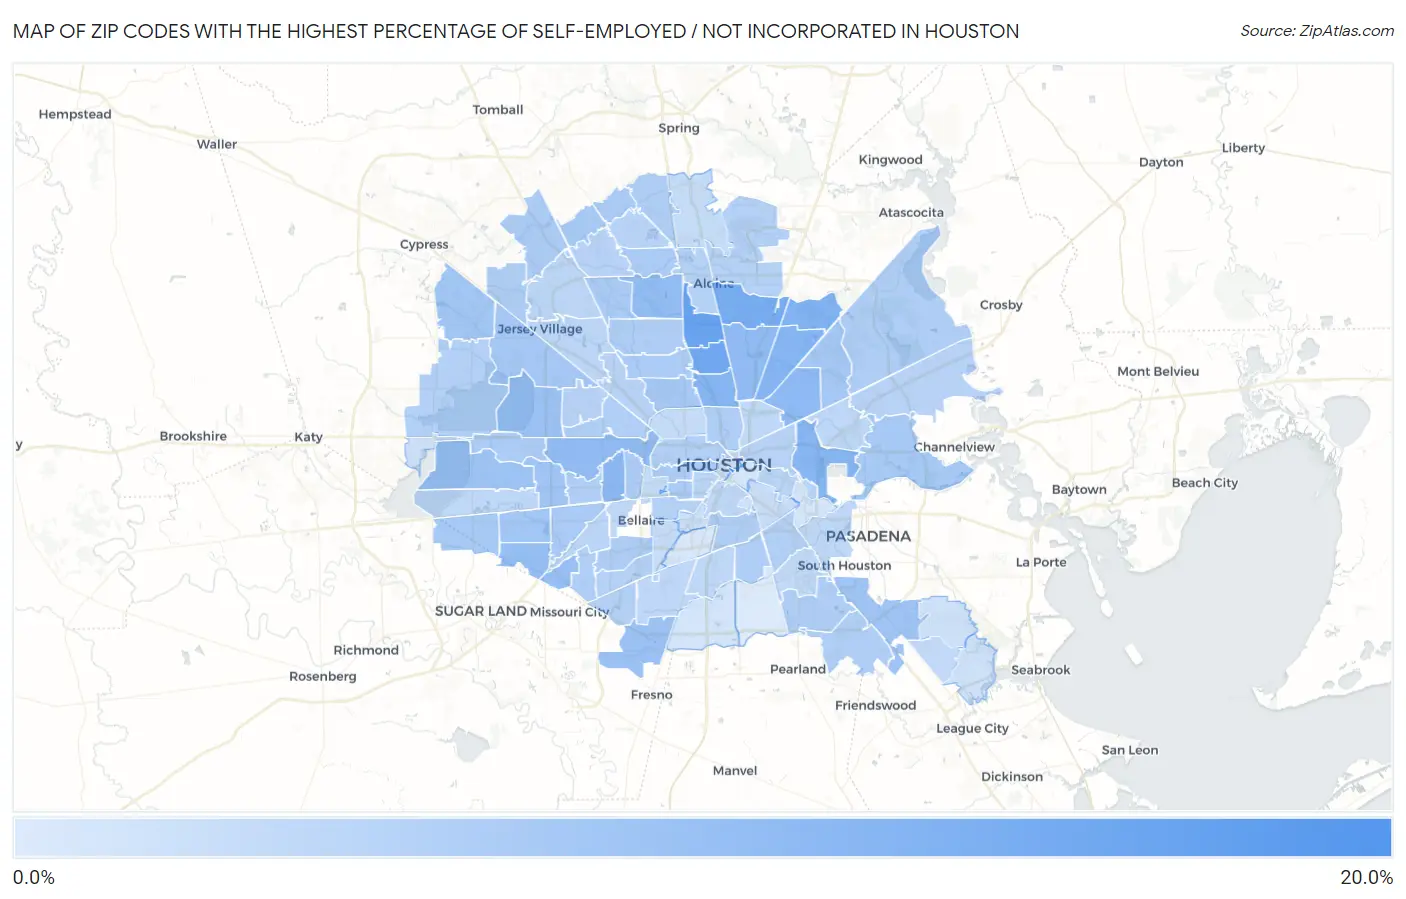
Map of Zip Codes with the Highest Percentage of Self-Employed / Not Incorporated in Houston
0.0%
20.0%
Zip Codes with the Highest Percentage of Self-Employed / Not Incorporated in Houston, TX
| Zip Code | % Self-Employed / Not Incorporated | vs State | vs National | |
| 1. | 77010 | 18.1% | 6.7%(+11.4)#124 | 5.8%(+12.3)#2,279 |
| 2. | 77037 | 14.4% | 6.7%(+7.71)#196 | 5.8%(+8.63)#3,679 |
| 3. | 77076 | 13.4% | 6.7%(+6.70)#247 | 5.8%(+7.62)#4,226 |
| 4. | 77039 | 12.6% | 6.7%(+5.89)#285 | 5.8%(+6.80)#4,786 |
| 5. | 77050 | 11.7% | 6.7%(+4.92)#335 | 5.8%(+5.84)#5,569 |
| 6. | 77022 | 11.3% | 6.7%(+4.54)#356 | 5.8%(+5.46)#5,925 |
| 7. | 77016 | 11.1% | 6.7%(+4.36)#371 | 5.8%(+5.28)#6,114 |
| 8. | 77029 | 11.0% | 6.7%(+4.29)#379 | 5.8%(+5.21)#6,188 |
| 9. | 77057 | 10.4% | 6.7%(+3.70)#423 | 5.8%(+4.62)#6,847 |
| 10. | 77028 | 10.1% | 6.7%(+3.35)#458 | 5.8%(+4.27)#7,251 |
| 11. | 77093 | 10.0% | 6.7%(+3.26)#466 | 5.8%(+4.18)#7,373 |
| 12. | 77024 | 9.9% | 6.7%(+3.21)#473 | 5.8%(+4.12)#7,440 |
| 13. | 77038 | 9.8% | 6.7%(+3.09)#489 | 5.8%(+4.00)#7,600 |
| 14. | 77099 | 9.4% | 6.7%(+2.72)#522 | 5.8%(+3.63)#8,080 |
| 15. | 77031 | 9.2% | 6.7%(+2.45)#551 | 5.8%(+3.37)#8,486 |
| 16. | 77053 | 8.8% | 6.7%(+2.03)#611 | 5.8%(+2.95)#9,211 |
| 17. | 77043 | 8.7% | 6.7%(+2.00)#618 | 5.8%(+2.92)#9,264 |
| 18. | 77077 | 8.4% | 6.7%(+1.65)#672 | 5.8%(+2.57)#9,880 |
| 19. | 77034 | 8.3% | 6.7%(+1.53)#686 | 5.8%(+2.45)#10,120 |
| 20. | 77042 | 8.1% | 6.7%(+1.42)#704 | 5.8%(+2.33)#10,350 |
| 21. | 77095 | 8.0% | 6.7%(+1.23)#741 | 5.8%(+2.15)#10,707 |
| 22. | 77072 | 7.9% | 6.7%(+1.19)#747 | 5.8%(+2.10)#10,810 |
| 23. | 77018 | 7.8% | 6.7%(+1.09)#762 | 5.8%(+2.01)#11,021 |
| 24. | 77041 | 7.8% | 6.7%(+1.02)#777 | 5.8%(+1.94)#11,177 |
| 25. | 77078 | 7.7% | 6.7%(+1.00)#781 | 5.8%(+1.92)#11,212 |
| 26. | 77069 | 7.6% | 6.7%(+0.847)#813 | 5.8%(+1.76)#11,590 |
| 27. | 77015 | 7.5% | 6.7%(+0.794)#824 | 5.8%(+1.71)#11,718 |
| 28. | 77083 | 7.5% | 6.7%(+0.758)#836 | 5.8%(+1.67)#11,802 |
| 29. | 77068 | 7.3% | 6.7%(+0.526)#871 | 5.8%(+1.44)#12,369 |
| 30. | 77098 | 7.2% | 6.7%(+0.469)#878 | 5.8%(+1.39)#12,504 |
| 31. | 77036 | 7.2% | 6.7%(+0.445)#884 | 5.8%(+1.36)#12,556 |
| 32. | 77086 | 7.2% | 6.7%(+0.443)#885 | 5.8%(+1.36)#12,559 |
| 33. | 77067 | 7.1% | 6.7%(+0.353)#903 | 5.8%(+1.27)#12,798 |
| 34. | 77070 | 7.0% | 6.7%(+0.315)#913 | 5.8%(+1.23)#12,916 |
| 35. | 77079 | 7.0% | 6.7%(+0.258)#923 | 5.8%(+1.17)#13,080 |
| 36. | 77056 | 7.0% | 6.7%(+0.240)#929 | 5.8%(+1.16)#13,126 |
| 37. | 77091 | 7.0% | 6.7%(+0.230)#931 | 5.8%(+1.15)#13,155 |
| 38. | 77019 | 6.9% | 6.7%(+0.198)#939 | 5.8%(+1.11)#13,239 |
| 39. | 77009 | 6.8% | 6.7%(+0.117)#956 | 5.8%(+1.03)#13,452 |
| 40. | 77044 | 6.8% | 6.7%(+0.112)#958 | 5.8%(+1.03)#13,467 |
| 41. | 77096 | 6.8% | 6.7%(+0.071)#966 | 5.8%(+0.988)#13,577 |
| 42. | 77065 | 6.8% | 6.7%(+0.054)#967 | 5.8%(+0.971)#13,621 |
| 43. | 77075 | 6.7% | 6.7%(-0.023)#983 | 5.8%(+0.894)#13,837 |
| 44. | 77088 | 6.7% | 6.7%(-0.032)#986 | 5.8%(+0.885)#13,861 |
| 45. | 77090 | 6.7% | 6.7%(-0.049)#990 | 5.8%(+0.868)#13,906 |
| 46. | 77021 | 6.7% | 6.7%(-0.067)#994 | 5.8%(+0.850)#13,955 |
| 47. | 77089 | 6.6% | 6.7%(-0.112)#1,001 | 5.8%(+0.805)#14,070 |
| 48. | 77033 | 6.6% | 6.7%(-0.134)#1,006 | 5.8%(+0.783)#14,138 |
| 49. | 77055 | 6.6% | 6.7%(-0.148)#1,010 | 5.8%(+0.769)#14,185 |
| 50. | 77063 | 6.5% | 6.7%(-0.205)#1,018 | 5.8%(+0.712)#14,380 |
| 51. | 77071 | 6.5% | 6.7%(-0.222)#1,024 | 5.8%(+0.695)#14,442 |
| 52. | 77085 | 6.4% | 6.7%(-0.315)#1,044 | 5.8%(+0.602)#14,713 |
| 53. | 77084 | 6.4% | 6.7%(-0.328)#1,046 | 5.8%(+0.589)#14,762 |
| 54. | 77007 | 6.3% | 6.7%(-0.432)#1,077 | 5.8%(+0.485)#15,096 |
| 55. | 77087 | 6.2% | 6.7%(-0.510)#1,091 | 5.8%(+0.406)#15,348 |
| 56. | 77060 | 6.2% | 6.7%(-0.572)#1,111 | 5.8%(+0.345)#15,545 |
| 57. | 77005 | 6.1% | 6.7%(-0.640)#1,126 | 5.8%(+0.277)#15,754 |
| 58. | 77035 | 6.1% | 6.7%(-0.658)#1,132 | 5.8%(+0.259)#15,812 |
| 59. | 77032 | 6.0% | 6.7%(-0.707)#1,151 | 5.8%(+0.210)#15,990 |
| 60. | 77066 | 5.9% | 6.7%(-0.807)#1,173 | 5.8%(+0.110)#16,307 |
| 61. | 77049 | 5.8% | 6.7%(-0.893)#1,197 | 5.8%(+0.024)#16,582 |
| 62. | 77080 | 5.8% | 6.7%(-0.933)#1,205 | 5.8%(-0.016)#16,709 |
| 63. | 77020 | 5.8% | 6.7%(-0.934)#1,207 | 5.8%(-0.017)#16,713 |
| 64. | 77092 | 5.8% | 6.7%(-0.964)#1,220 | 5.8%(-0.047)#16,817 |
| 65. | 77014 | 5.7% | 6.7%(-1.02)#1,233 | 5.8%(-0.108)#17,006 |
| 66. | 77011 | 5.6% | 6.7%(-1.08)#1,252 | 5.8%(-0.168)#17,236 |
| 67. | 77006 | 5.6% | 6.7%(-1.10)#1,256 | 5.8%(-0.186)#17,302 |
| 68. | 77074 | 5.5% | 6.7%(-1.19)#1,275 | 5.8%(-0.275)#17,639 |
| 69. | 77040 | 5.3% | 6.7%(-1.40)#1,321 | 5.8%(-0.483)#18,384 |
| 70. | 77064 | 5.3% | 6.7%(-1.42)#1,327 | 5.8%(-0.501)#18,459 |
| 71. | 77017 | 5.2% | 6.7%(-1.55)#1,356 | 5.8%(-0.631)#18,984 |
| 72. | 77081 | 5.2% | 6.7%(-1.55)#1,357 | 5.8%(-0.634)#18,994 |
| 73. | 77051 | 5.2% | 6.7%(-1.58)#1,363 | 5.8%(-0.661)#19,100 |
| 74. | 77004 | 5.1% | 6.7%(-1.60)#1,368 | 5.8%(-0.680)#19,157 |
| 75. | 77026 | 5.1% | 6.7%(-1.67)#1,374 | 5.8%(-0.749)#19,408 |
| 76. | 77045 | 5.0% | 6.7%(-1.69)#1,382 | 5.8%(-0.769)#19,495 |
| 77. | 77082 | 5.0% | 6.7%(-1.69)#1,383 | 5.8%(-0.772)#19,504 |
| 78. | 77013 | 5.0% | 6.7%(-1.71)#1,386 | 5.8%(-0.796)#19,598 |
| 79. | 77062 | 5.0% | 6.7%(-1.78)#1,397 | 5.8%(-0.865)#19,843 |
| 80. | 77061 | 4.6% | 6.7%(-2.13)#1,455 | 5.8%(-1.22)#21,168 |
| 81. | 77008 | 4.5% | 6.7%(-2.23)#1,470 | 5.8%(-1.32)#21,590 |
| 82. | 77027 | 4.4% | 6.7%(-2.36)#1,485 | 5.8%(-1.44)#22,056 |
| 83. | 77073 | 4.4% | 6.7%(-2.38)#1,487 | 5.8%(-1.46)#22,120 |
| 84. | 77025 | 4.3% | 6.7%(-2.45)#1,495 | 5.8%(-1.53)#22,392 |
| 85. | 77030 | 3.9% | 6.7%(-2.80)#1,540 | 5.8%(-1.88)#23,626 |
| 86. | 77023 | 3.9% | 6.7%(-2.80)#1,541 | 5.8%(-1.89)#23,633 |
| 87. | 77002 | 3.9% | 6.7%(-2.83)#1,546 | 5.8%(-1.91)#23,722 |
| 88. | 77059 | 3.6% | 6.7%(-3.14)#1,577 | 5.8%(-2.22)#24,744 |
| 89. | 77046 | 3.5% | 6.7%(-3.27)#1,591 | 5.8%(-2.35)#25,107 |
| 90. | 77204 | 3.5% | 6.7%(-3.28)#1,594 | 5.8%(-2.36)#25,129 |
| 91. | 77058 | 3.4% | 6.7%(-3.32)#1,600 | 5.8%(-2.40)#25,265 |
| 92. | 77094 | 3.4% | 6.7%(-3.36)#1,603 | 5.8%(-2.44)#25,385 |
| 93. | 77047 | 3.0% | 6.7%(-3.76)#1,636 | 5.8%(-2.84)#26,438 |
| 94. | 77012 | 2.7% | 6.7%(-3.98)#1,649 | 5.8%(-3.07)#26,936 |
| 95. | 77003 | 2.7% | 6.7%(-4.06)#1,655 | 5.8%(-3.14)#27,085 |
| 96. | 77054 | 2.6% | 6.7%(-4.13)#1,659 | 5.8%(-3.22)#27,245 |
| 97. | 77048 | 2.1% | 6.7%(-4.64)#1,682 | 5.8%(-3.73)#28,109 |
1
Common Questions
What are the Top 10 Zip Codes with the Highest Percentage of Self-Employed / Not Incorporated in Houston, TX?
Top 10 Zip Codes with the Highest Percentage of Self-Employed / Not Incorporated in Houston, TX are:
What zip code has the Highest Percentage of Self-Employed / Not Incorporated in Houston, TX?
77010 has the Highest Percentage of Self-Employed / Not Incorporated in Houston, TX with 18.1%.
What is the Percentage of Self-Employed / Not Incorporated in Houston, TX?
Percentage of Self-Employed / Not Incorporated in Houston is 6.5%.
What is the Percentage of Self-Employed / Not Incorporated in Texas?
Percentage of Self-Employed / Not Incorporated in Texas is 6.7%.
What is the Percentage of Self-Employed / Not Incorporated in the United States?
Percentage of Self-Employed / Not Incorporated in the United States is 5.8%.