Zip Codes with the Highest Percentage of Population with a Degree in Visual and Performing Arts in Houston, TX
RELATED REPORTS & OPTIONS
Visual and Performing Arts
Houston
Compare Zip Codes
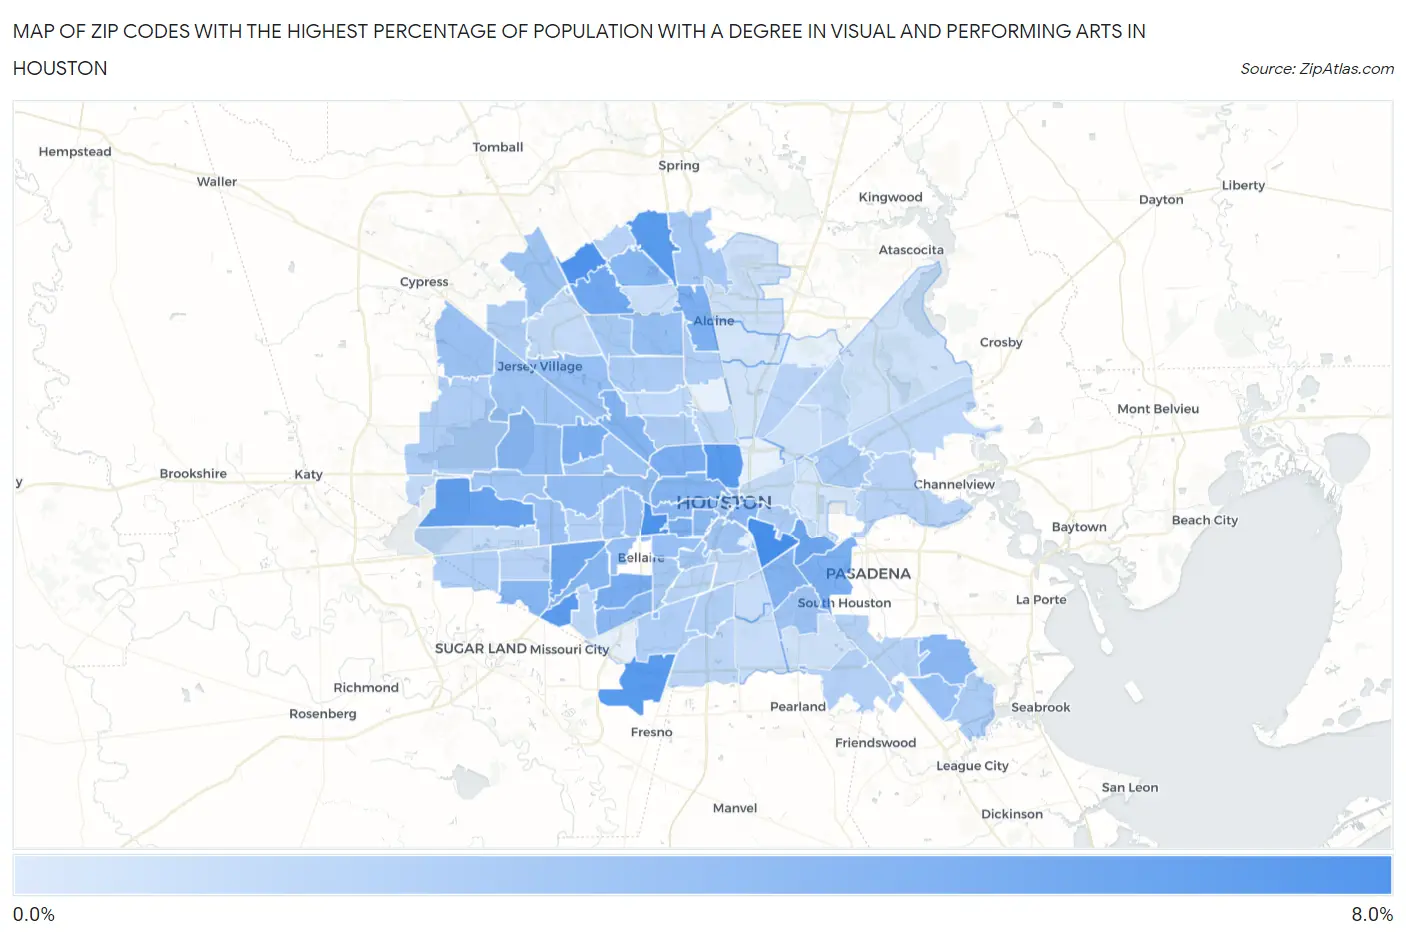
Map of Zip Codes with the Highest Percentage of Population with a Degree in Visual and Performing Arts in Houston
0.24%
7.1%
Zip Codes with the Highest Percentage of Population with a Degree in Visual and Performing Arts in Houston, TX
| Zip Code | % Graduates | vs State | vs National | |
| 1. | 77023 | 7.1% | 3.2%(+3.88)#128 | 4.3%(+2.83)#3,575 |
| 2. | 77069 | 6.7% | 3.2%(+3.48)#151 | 4.3%(+2.44)#3,995 |
| 3. | 77027 | 6.6% | 3.2%(+3.44)#153 | 4.3%(+2.40)#4,059 |
| 4. | 77053 | 6.3% | 3.2%(+3.14)#170 | 4.3%(+2.09)#4,414 |
| 5. | 77009 | 6.3% | 3.2%(+3.10)#175 | 4.3%(+2.05)#4,466 |
| 6. | 77090 | 6.3% | 3.2%(+3.07)#177 | 4.3%(+2.03)#4,493 |
| 7. | 77031 | 6.2% | 3.2%(+2.98)#186 | 4.3%(+1.94)#4,606 |
| 8. | 77077 | 5.6% | 3.2%(+2.35)#226 | 4.3%(+1.31)#5,561 |
| 9. | 77012 | 5.3% | 3.2%(+2.04)#255 | 4.3%(+1.00)#6,146 |
| 10. | 77036 | 5.2% | 3.2%(+1.99)#261 | 4.3%(+0.946)#6,239 |
| 11. | 77066 | 5.1% | 3.2%(+1.92)#268 | 4.3%(+0.879)#6,361 |
| 12. | 77096 | 4.7% | 3.2%(+1.51)#311 | 4.3%(+0.469)#7,254 |
| 13. | 77008 | 4.7% | 3.2%(+1.49)#313 | 4.3%(+0.444)#7,312 |
| 14. | 77098 | 4.6% | 3.2%(+1.40)#320 | 4.3%(+0.354)#7,537 |
| 15. | 77080 | 4.6% | 3.2%(+1.40)#321 | 4.3%(+0.353)#7,546 |
| 16. | 77017 | 4.6% | 3.2%(+1.37)#323 | 4.3%(+0.328)#7,596 |
| 17. | 77060 | 4.5% | 3.2%(+1.25)#338 | 4.3%(+0.208)#7,913 |
| 18. | 77087 | 4.3% | 3.2%(+1.07)#362 | 4.3%(+0.029)#8,405 |
| 19. | 77092 | 4.2% | 3.2%(+1.03)#368 | 4.3%(-0.011)#8,508 |
| 20. | 77007 | 4.2% | 3.2%(+0.964)#386 | 4.3%(-0.079)#8,709 |
| 21. | 77099 | 4.1% | 3.2%(+0.903)#399 | 4.3%(-0.140)#8,900 |
| 22. | 77074 | 4.0% | 3.2%(+0.834)#408 | 4.3%(-0.209)#9,111 |
| 23. | 77014 | 4.0% | 3.2%(+0.832)#409 | 4.3%(-0.211)#9,120 |
| 24. | 77035 | 4.0% | 3.2%(+0.810)#414 | 4.3%(-0.233)#9,197 |
| 25. | 77019 | 4.0% | 3.2%(+0.770)#421 | 4.3%(-0.273)#9,319 |
| 26. | 77003 | 3.9% | 3.2%(+0.731)#422 | 4.3%(-0.311)#9,438 |
| 27. | 77059 | 3.9% | 3.2%(+0.725)#424 | 4.3%(-0.318)#9,462 |
| 28. | 77006 | 3.8% | 3.2%(+0.638)#437 | 4.3%(-0.404)#9,727 |
| 29. | 77043 | 3.6% | 3.2%(+0.423)#470 | 4.3%(-0.620)#10,396 |
| 30. | 77024 | 3.6% | 3.2%(+0.353)#481 | 4.3%(-0.689)#10,650 |
| 31. | 77038 | 3.4% | 3.2%(+0.214)#504 | 4.3%(-0.829)#11,167 |
| 32. | 77062 | 3.4% | 3.2%(+0.172)#512 | 4.3%(-0.871)#11,316 |
| 33. | 77081 | 3.4% | 3.2%(+0.163)#514 | 4.3%(-0.879)#11,337 |
| 34. | 77005 | 3.4% | 3.2%(+0.150)#517 | 4.3%(-0.893)#11,395 |
| 35. | 77040 | 3.3% | 3.2%(+0.102)#526 | 4.3%(-0.941)#11,564 |
| 36. | 77042 | 3.3% | 3.2%(+0.049)#544 | 4.3%(-0.994)#11,776 |
| 37. | 77095 | 3.2% | 3.2%(+0.026)#548 | 4.3%(-1.02)#11,850 |
| 38. | 77056 | 3.2% | 3.2%(-0.024)#560 | 4.3%(-1.07)#12,044 |
| 39. | 77041 | 3.0% | 3.2%(-0.164)#598 | 4.3%(-1.21)#12,563 |
| 40. | 77070 | 3.0% | 3.2%(-0.181)#606 | 4.3%(-1.22)#12,649 |
| 41. | 77055 | 3.0% | 3.2%(-0.203)#610 | 4.3%(-1.25)#12,711 |
| 42. | 77004 | 3.0% | 3.2%(-0.244)#624 | 4.3%(-1.29)#12,860 |
| 43. | 77061 | 3.0% | 3.2%(-0.251)#628 | 4.3%(-1.29)#12,889 |
| 44. | 77057 | 2.9% | 3.2%(-0.271)#634 | 4.3%(-1.31)#12,959 |
| 45. | 77002 | 2.9% | 3.2%(-0.281)#637 | 4.3%(-1.32)#12,991 |
| 46. | 77030 | 2.9% | 3.2%(-0.342)#642 | 4.3%(-1.38)#13,226 |
| 47. | 77079 | 2.8% | 3.2%(-0.395)#653 | 4.3%(-1.44)#13,439 |
| 48. | 77073 | 2.7% | 3.2%(-0.534)#679 | 4.3%(-1.58)#13,998 |
| 49. | 77086 | 2.6% | 3.2%(-0.588)#689 | 4.3%(-1.63)#14,182 |
| 50. | 77025 | 2.6% | 3.2%(-0.643)#702 | 4.3%(-1.69)#14,379 |
| 51. | 77013 | 2.5% | 3.2%(-0.730)#725 | 4.3%(-1.77)#14,697 |
| 52. | 77018 | 2.4% | 3.2%(-0.770)#731 | 4.3%(-1.81)#14,824 |
| 53. | 77011 | 2.4% | 3.2%(-0.777)#734 | 4.3%(-1.82)#14,872 |
| 54. | 77088 | 2.4% | 3.2%(-0.817)#748 | 4.3%(-1.86)#15,033 |
| 55. | 77058 | 2.4% | 3.2%(-0.836)#752 | 4.3%(-1.88)#15,096 |
| 56. | 77084 | 2.3% | 3.2%(-0.869)#765 | 4.3%(-1.91)#15,205 |
| 57. | 77065 | 2.3% | 3.2%(-0.950)#790 | 4.3%(-1.99)#15,506 |
| 58. | 77037 | 2.2% | 3.2%(-0.976)#798 | 4.3%(-2.02)#15,596 |
| 59. | 77045 | 2.2% | 3.2%(-0.977)#799 | 4.3%(-2.02)#15,599 |
| 60. | 77051 | 2.2% | 3.2%(-1.02)#812 | 4.3%(-2.06)#15,752 |
| 61. | 77083 | 2.1% | 3.2%(-1.06)#821 | 4.3%(-2.10)#15,890 |
| 62. | 77063 | 2.1% | 3.2%(-1.09)#830 | 4.3%(-2.14)#16,015 |
| 63. | 77089 | 2.0% | 3.2%(-1.16)#853 | 4.3%(-2.20)#16,267 |
| 64. | 77034 | 2.0% | 3.2%(-1.25)#880 | 4.3%(-2.30)#16,608 |
| 65. | 77015 | 1.9% | 3.2%(-1.28)#888 | 4.3%(-2.32)#16,685 |
| 66. | 77016 | 1.9% | 3.2%(-1.30)#892 | 4.3%(-2.34)#16,741 |
| 67. | 77072 | 1.9% | 3.2%(-1.30)#894 | 4.3%(-2.34)#16,763 |
| 68. | 77068 | 1.9% | 3.2%(-1.35)#902 | 4.3%(-2.40)#16,930 |
| 69. | 77054 | 1.8% | 3.2%(-1.46)#937 | 4.3%(-2.50)#17,313 |
| 70. | 77047 | 1.7% | 3.2%(-1.48)#940 | 4.3%(-2.53)#17,389 |
| 71. | 77071 | 1.7% | 3.2%(-1.50)#943 | 4.3%(-2.55)#17,467 |
| 72. | 77091 | 1.6% | 3.2%(-1.61)#968 | 4.3%(-2.65)#17,843 |
| 73. | 77022 | 1.6% | 3.2%(-1.63)#973 | 4.3%(-2.67)#17,905 |
| 74. | 77021 | 1.6% | 3.2%(-1.66)#978 | 4.3%(-2.70)#17,987 |
| 75. | 77049 | 1.5% | 3.2%(-1.66)#981 | 4.3%(-2.70)#18,005 |
| 76. | 77078 | 1.5% | 3.2%(-1.75)#1,005 | 4.3%(-2.80)#18,304 |
| 77. | 77020 | 1.4% | 3.2%(-1.82)#1,019 | 4.3%(-2.87)#18,508 |
| 78. | 77082 | 1.4% | 3.2%(-1.84)#1,022 | 4.3%(-2.88)#18,545 |
| 79. | 77094 | 1.3% | 3.2%(-1.86)#1,031 | 4.3%(-2.90)#18,607 |
| 80. | 77064 | 1.3% | 3.2%(-1.87)#1,035 | 4.3%(-2.92)#18,653 |
| 81. | 77067 | 1.2% | 3.2%(-2.01)#1,062 | 4.3%(-3.06)#19,099 |
| 82. | 77033 | 1.2% | 3.2%(-2.03)#1,069 | 4.3%(-3.08)#19,157 |
| 83. | 77048 | 1.1% | 3.2%(-2.08)#1,078 | 4.3%(-3.13)#19,309 |
| 84. | 77032 | 0.91% | 3.2%(-2.30)#1,121 | 4.3%(-3.34)#19,915 |
| 85. | 77028 | 0.85% | 3.2%(-2.36)#1,134 | 4.3%(-3.41)#20,055 |
| 86. | 77075 | 0.84% | 3.2%(-2.37)#1,136 | 4.3%(-3.41)#20,063 |
| 87. | 77044 | 0.82% | 3.2%(-2.39)#1,140 | 4.3%(-3.44)#20,104 |
| 88. | 77093 | 0.75% | 3.2%(-2.46)#1,149 | 4.3%(-3.50)#20,256 |
| 89. | 77039 | 0.64% | 3.2%(-2.57)#1,172 | 4.3%(-3.62)#20,495 |
| 90. | 77029 | 0.63% | 3.2%(-2.58)#1,173 | 4.3%(-3.62)#20,498 |
| 91. | 77046 | 0.24% | 3.2%(-2.97)#1,217 | 4.3%(-4.01)#21,154 |
1
Common Questions
What are the Top 10 Zip Codes with the Highest Percentage of Population with a Degree in Visual and Performing Arts in Houston, TX?
Top 10 Zip Codes with the Highest Percentage of Population with a Degree in Visual and Performing Arts in Houston, TX are:
What zip code has the Highest Percentage of Population with a Degree in Visual and Performing Arts in Houston, TX?
77023 has the Highest Percentage of Population with a Degree in Visual and Performing Arts in Houston, TX with 7.1%.
What is the Percentage of Population with a Degree in Visual and Performing Arts in Houston, TX?
Percentage of Population with a Degree in Visual and Performing Arts in Houston is 3.4%.
What is the Percentage of Population with a Degree in Visual and Performing Arts in Texas?
Percentage of Population with a Degree in Visual and Performing Arts in Texas is 3.2%.
What is the Percentage of Population with a Degree in Visual and Performing Arts in the United States?
Percentage of Population with a Degree in Visual and Performing Arts in the United States is 4.3%.