Zip Codes with the Highest Percentage of Population with a Degree in Science and Engineering in Houston, TX
RELATED REPORTS & OPTIONS
Science and Engineering
Houston
Compare Zip Codes
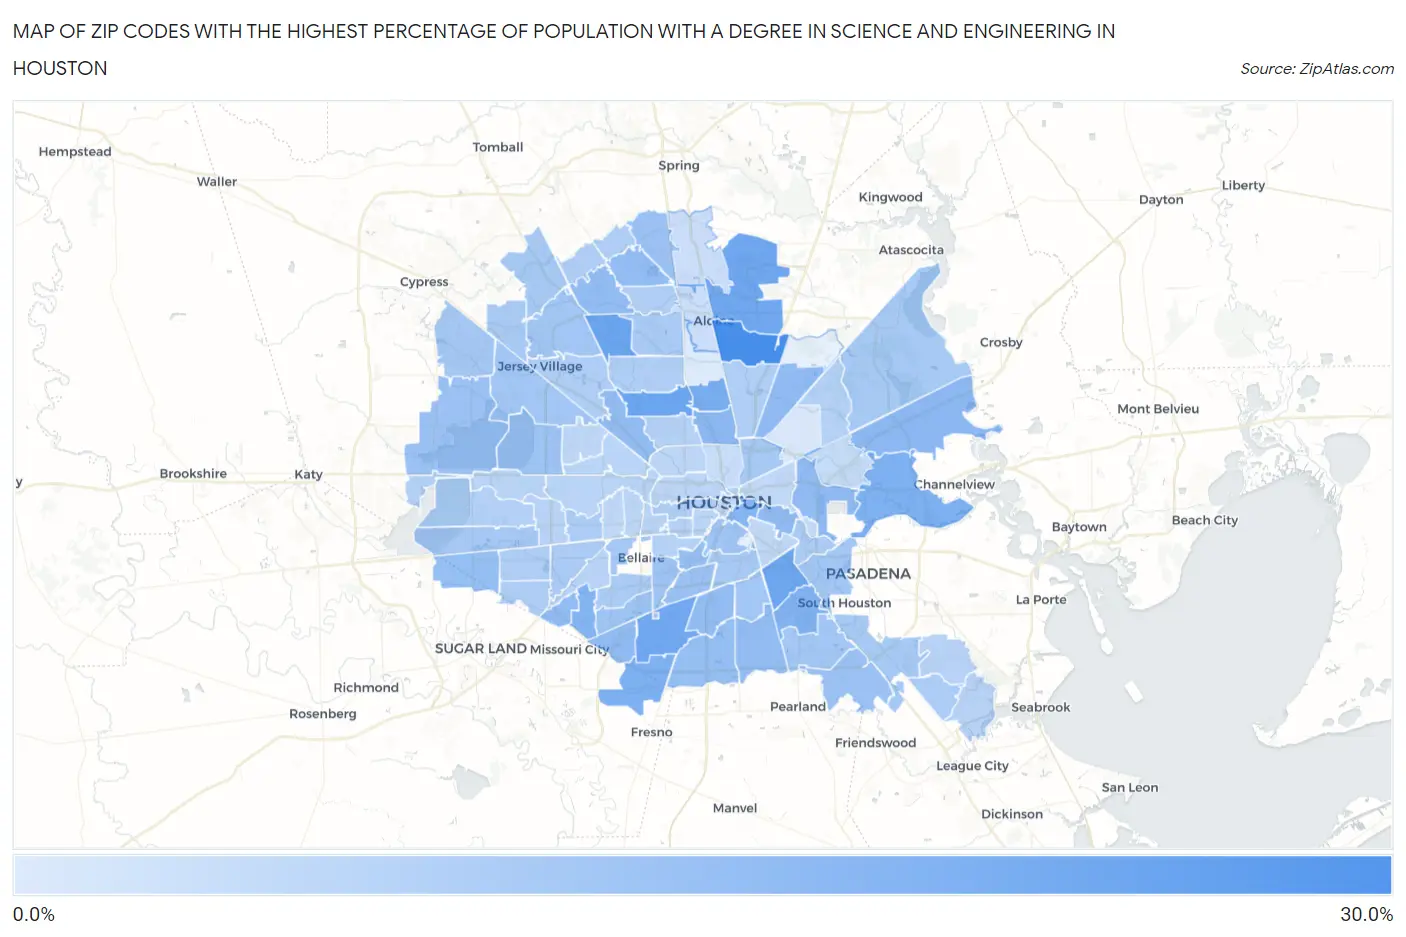
Map of Zip Codes with the Highest Percentage of Population with a Degree in Science and Engineering in Houston
0.96%
26.3%
Zip Codes with the Highest Percentage of Population with a Degree in Science and Engineering in Houston, TX
| Zip Code | % Graduates | vs State | vs National | |
| 1. | 77039 | 26.3% | 9.5%(+16.8)#56 | 9.8%(+16.5)#1,749 |
| 2. | 77091 | 19.6% | 9.5%(+10.1)#118 | 9.8%(+9.84)#3,505 |
| 3. | 77086 | 19.4% | 9.5%(+9.90)#121 | 9.8%(+9.64)#3,605 |
| 4. | 77087 | 19.0% | 9.5%(+9.45)#130 | 9.8%(+9.19)#3,813 |
| 5. | 77032 | 18.9% | 9.5%(+9.33)#133 | 9.8%(+9.07)#3,865 |
| 6. | 77045 | 18.5% | 9.5%(+8.96)#143 | 9.8%(+8.70)#4,052 |
| 7. | 77076 | 17.5% | 9.5%(+8.03)#171 | 9.8%(+7.77)#4,586 |
| 8. | 77053 | 16.4% | 9.5%(+6.83)#207 | 9.8%(+6.57)#5,472 |
| 9. | 77015 | 16.3% | 9.5%(+6.76)#210 | 9.8%(+6.50)#5,508 |
| 10. | 77071 | 15.5% | 9.5%(+5.97)#239 | 9.8%(+5.71)#6,194 |
| 11. | 77061 | 15.4% | 9.5%(+5.86)#245 | 9.8%(+5.60)#6,282 |
| 12. | 77003 | 15.2% | 9.5%(+5.68)#253 | 9.8%(+5.42)#6,502 |
| 13. | 77049 | 14.0% | 9.5%(+4.46)#321 | 9.8%(+4.20)#7,881 |
| 14. | 77022 | 13.8% | 9.5%(+4.32)#331 | 9.8%(+4.06)#8,054 |
| 15. | 77029 | 13.3% | 9.5%(+3.77)#368 | 9.8%(+3.51)#8,797 |
| 16. | 77016 | 13.2% | 9.5%(+3.69)#375 | 9.8%(+3.43)#8,906 |
| 17. | 77085 | 13.2% | 9.5%(+3.65)#381 | 9.8%(+3.39)#8,973 |
| 18. | 77031 | 13.2% | 9.5%(+3.63)#383 | 9.8%(+3.38)#9,000 |
| 19. | 77011 | 13.1% | 9.5%(+3.57)#386 | 9.8%(+3.31)#9,098 |
| 20. | 77092 | 12.9% | 9.5%(+3.38)#400 | 9.8%(+3.12)#9,385 |
| 21. | 77014 | 12.8% | 9.5%(+3.25)#415 | 9.8%(+2.99)#9,593 |
| 22. | 77048 | 12.7% | 9.5%(+3.22)#416 | 9.8%(+2.96)#9,641 |
| 23. | 77066 | 12.7% | 9.5%(+3.15)#423 | 9.8%(+2.89)#9,748 |
| 24. | 77051 | 12.5% | 9.5%(+3.03)#433 | 9.8%(+2.77)#9,946 |
| 25. | 77047 | 12.3% | 9.5%(+2.79)#451 | 9.8%(+2.53)#10,358 |
| 26. | 77083 | 12.3% | 9.5%(+2.78)#453 | 9.8%(+2.52)#10,375 |
| 27. | 77030 | 11.8% | 9.5%(+2.32)#502 | 9.8%(+2.06)#11,190 |
| 28. | 77054 | 11.7% | 9.5%(+2.18)#516 | 9.8%(+1.92)#11,474 |
| 29. | 77090 | 11.4% | 9.5%(+1.87)#542 | 9.8%(+1.61)#12,050 |
| 30. | 77089 | 11.3% | 9.5%(+1.82)#547 | 9.8%(+1.56)#12,156 |
| 31. | 77084 | 11.2% | 9.5%(+1.67)#568 | 9.8%(+1.41)#12,455 |
| 32. | 77035 | 10.9% | 9.5%(+1.39)#607 | 9.8%(+1.13)#13,070 |
| 33. | 77043 | 10.9% | 9.5%(+1.38)#609 | 9.8%(+1.12)#13,089 |
| 34. | 77025 | 10.3% | 9.5%(+0.785)#671 | 9.8%(+0.525)#14,375 |
| 35. | 77004 | 10.3% | 9.5%(+0.757)#673 | 9.8%(+0.498)#14,434 |
| 36. | 77064 | 10.2% | 9.5%(+0.680)#680 | 9.8%(+0.420)#14,593 |
| 37. | 77075 | 10.2% | 9.5%(+0.678)#681 | 9.8%(+0.418)#14,599 |
| 38. | 77017 | 10.1% | 9.5%(+0.571)#697 | 9.8%(+0.312)#14,831 |
| 39. | 77041 | 9.9% | 9.5%(+0.379)#728 | 9.8%(+0.119)#15,257 |
| 40. | 77033 | 9.9% | 9.5%(+0.373)#730 | 9.8%(+0.113)#15,271 |
| 41. | 77095 | 9.8% | 9.5%(+0.301)#738 | 9.8%(+0.042)#15,428 |
| 42. | 77082 | 9.7% | 9.5%(+0.188)#753 | 9.8%(-0.072)#15,688 |
| 43. | 77081 | 9.5% | 9.5%(-0.012)#785 | 9.8%(-0.272)#16,143 |
| 44. | 77034 | 9.4% | 9.5%(-0.112)#798 | 9.8%(-0.371)#16,371 |
| 45. | 77070 | 9.3% | 9.5%(-0.176)#810 | 9.8%(-0.436)#16,529 |
| 46. | 77026 | 9.1% | 9.5%(-0.372)#844 | 9.8%(-0.632)#16,970 |
| 47. | 77044 | 9.1% | 9.5%(-0.391)#848 | 9.8%(-0.651)#17,016 |
| 48. | 77021 | 9.1% | 9.5%(-0.426)#853 | 9.8%(-0.686)#17,077 |
| 49. | 77038 | 9.0% | 9.5%(-0.505)#863 | 9.8%(-0.765)#17,304 |
| 50. | 77065 | 9.0% | 9.5%(-0.547)#870 | 9.8%(-0.807)#17,395 |
| 51. | 77036 | 8.8% | 9.5%(-0.735)#902 | 9.8%(-0.995)#17,829 |
| 52. | 77096 | 8.7% | 9.5%(-0.838)#915 | 9.8%(-1.10)#18,078 |
| 53. | 77062 | 8.7% | 9.5%(-0.847)#917 | 9.8%(-1.11)#18,100 |
| 54. | 77063 | 8.4% | 9.5%(-1.09)#944 | 9.8%(-1.35)#18,628 |
| 55. | 77012 | 8.4% | 9.5%(-1.12)#949 | 9.8%(-1.38)#18,682 |
| 56. | 77069 | 8.3% | 9.5%(-1.22)#963 | 9.8%(-1.48)#18,967 |
| 57. | 77068 | 8.2% | 9.5%(-1.33)#981 | 9.8%(-1.59)#19,222 |
| 58. | 77019 | 8.2% | 9.5%(-1.34)#983 | 9.8%(-1.60)#19,235 |
| 59. | 77046 | 8.2% | 9.5%(-1.35)#989 | 9.8%(-1.61)#19,258 |
| 60. | 77072 | 8.2% | 9.5%(-1.37)#992 | 9.8%(-1.63)#19,315 |
| 61. | 77099 | 8.1% | 9.5%(-1.40)#995 | 9.8%(-1.66)#19,381 |
| 62. | 77040 | 8.0% | 9.5%(-1.56)#1,009 | 9.8%(-1.82)#19,717 |
| 63. | 77088 | 7.9% | 9.5%(-1.67)#1,034 | 9.8%(-1.93)#19,974 |
| 64. | 77093 | 7.8% | 9.5%(-1.75)#1,044 | 9.8%(-2.01)#20,137 |
| 65. | 77067 | 7.7% | 9.5%(-1.82)#1,054 | 9.8%(-2.08)#20,297 |
| 66. | 77077 | 7.3% | 9.5%(-2.21)#1,108 | 9.8%(-2.47)#21,107 |
| 67. | 77098 | 7.2% | 9.5%(-2.30)#1,115 | 9.8%(-2.56)#21,287 |
| 68. | 77094 | 7.2% | 9.5%(-2.36)#1,118 | 9.8%(-2.62)#21,413 |
| 69. | 77005 | 7.0% | 9.5%(-2.51)#1,139 | 9.8%(-2.77)#21,707 |
| 70. | 77078 | 7.0% | 9.5%(-2.53)#1,144 | 9.8%(-2.79)#21,744 |
| 71. | 77018 | 7.0% | 9.5%(-2.53)#1,146 | 9.8%(-2.79)#21,750 |
| 72. | 77058 | 6.8% | 9.5%(-2.75)#1,171 | 9.8%(-3.01)#22,122 |
| 73. | 77074 | 6.6% | 9.5%(-2.94)#1,189 | 9.8%(-3.20)#22,435 |
| 74. | 77059 | 6.6% | 9.5%(-2.96)#1,192 | 9.8%(-3.22)#22,471 |
| 75. | 77042 | 6.5% | 9.5%(-2.99)#1,200 | 9.8%(-3.25)#22,536 |
| 76. | 77006 | 6.4% | 9.5%(-3.12)#1,218 | 9.8%(-3.38)#22,768 |
| 77. | 77055 | 6.3% | 9.5%(-3.27)#1,232 | 9.8%(-3.53)#23,008 |
| 78. | 77079 | 6.2% | 9.5%(-3.28)#1,236 | 9.8%(-3.54)#23,053 |
| 79. | 77027 | 6.2% | 9.5%(-3.30)#1,240 | 9.8%(-3.56)#23,079 |
| 80. | 77024 | 6.2% | 9.5%(-3.31)#1,242 | 9.8%(-3.57)#23,091 |
| 81. | 77056 | 6.1% | 9.5%(-3.42)#1,254 | 9.8%(-3.68)#23,290 |
| 82. | 77007 | 6.0% | 9.5%(-3.55)#1,277 | 9.8%(-3.81)#23,487 |
| 83. | 77008 | 5.9% | 9.5%(-3.58)#1,281 | 9.8%(-3.84)#23,522 |
| 84. | 77080 | 5.6% | 9.5%(-3.97)#1,317 | 9.8%(-4.23)#24,044 |
| 85. | 77057 | 5.4% | 9.5%(-4.11)#1,332 | 9.8%(-4.37)#24,228 |
| 86. | 77023 | 5.2% | 9.5%(-4.32)#1,352 | 9.8%(-4.58)#24,505 |
| 87. | 77002 | 5.2% | 9.5%(-4.33)#1,353 | 9.8%(-4.59)#24,507 |
| 88. | 77020 | 5.2% | 9.5%(-4.37)#1,361 | 9.8%(-4.63)#24,562 |
| 89. | 77013 | 4.6% | 9.5%(-4.89)#1,407 | 9.8%(-5.15)#25,156 |
| 90. | 77009 | 4.1% | 9.5%(-5.40)#1,440 | 9.8%(-5.66)#25,631 |
| 91. | 77073 | 3.8% | 9.5%(-5.71)#1,458 | 9.8%(-5.97)#25,903 |
| 92. | 77060 | 3.7% | 9.5%(-5.82)#1,462 | 9.8%(-6.08)#25,999 |
| 93. | 77010 | 2.6% | 9.5%(-6.95)#1,507 | 9.8%(-7.21)#26,710 |
| 94. | 77028 | 1.6% | 9.5%(-7.95)#1,540 | 9.8%(-8.21)#27,177 |
| 95. | 77037 | 0.96% | 9.5%(-8.56)#1,560 | 9.8%(-8.82)#27,357 |
1
Common Questions
What are the Top 10 Zip Codes with the Highest Percentage of Population with a Degree in Science and Engineering in Houston, TX?
Top 10 Zip Codes with the Highest Percentage of Population with a Degree in Science and Engineering in Houston, TX are:
What zip code has the Highest Percentage of Population with a Degree in Science and Engineering in Houston, TX?
77039 has the Highest Percentage of Population with a Degree in Science and Engineering in Houston, TX with 26.3%.
What is the Percentage of Population with a Degree in Science and Engineering in Houston, TX?
Percentage of Population with a Degree in Science and Engineering in Houston is 8.2%.
What is the Percentage of Population with a Degree in Science and Engineering in Texas?
Percentage of Population with a Degree in Science and Engineering in Texas is 9.5%.
What is the Percentage of Population with a Degree in Science and Engineering in the United States?
Percentage of Population with a Degree in Science and Engineering in the United States is 9.8%.