Zip Codes with the Highest Percentage of Population with a Degree in Engineering in Houston, TX
RELATED REPORTS & OPTIONS
Engineering
Houston
Compare Zip Codes
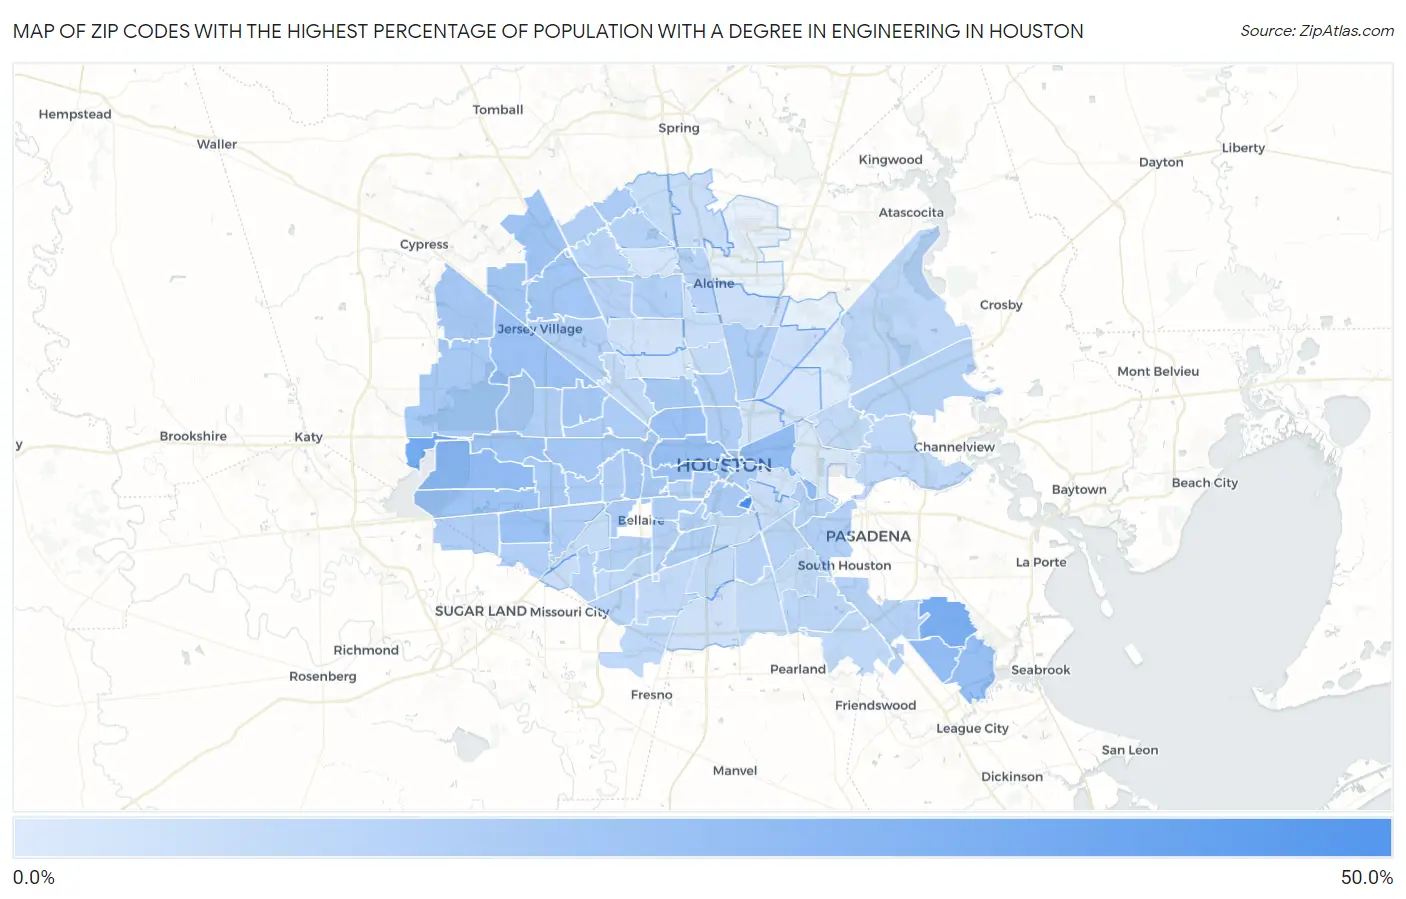
Map of Zip Codes with the Highest Percentage of Population with a Degree in Engineering in Houston
0.29%
42.1%
Zip Codes with the Highest Percentage of Population with a Degree in Engineering in Houston, TX
| Zip Code | % Graduates | vs State | vs National | |
| 1. | 77204 | 42.1% | 9.5%(+32.6)#13 | 7.6%(+34.5)#197 |
| 2. | 77094 | 27.8% | 9.5%(+18.2)#26 | 7.6%(+20.1)#441 |
| 3. | 77010 | 26.2% | 9.5%(+16.7)#31 | 7.6%(+18.6)#491 |
| 4. | 77059 | 26.0% | 9.5%(+16.4)#32 | 7.6%(+18.3)#502 |
| 5. | 77062 | 20.0% | 9.5%(+10.5)#59 | 7.6%(+12.4)#905 |
| 6. | 77077 | 19.9% | 9.5%(+10.3)#60 | 7.6%(+12.2)#928 |
| 7. | 77020 | 19.5% | 9.5%(+9.91)#61 | 7.6%(+11.8)#969 |
| 8. | 77058 | 17.8% | 9.5%(+8.27)#80 | 7.6%(+10.2)#1,182 |
| 9. | 77007 | 17.8% | 9.5%(+8.25)#81 | 7.6%(+10.1)#1,183 |
| 10. | 77019 | 17.4% | 9.5%(+7.86)#86 | 7.6%(+9.75)#1,233 |
| 11. | 77008 | 17.2% | 9.5%(+7.69)#89 | 7.6%(+9.59)#1,272 |
| 12. | 77041 | 16.5% | 9.5%(+6.95)#96 | 7.6%(+8.85)#1,402 |
| 13. | 77072 | 16.3% | 9.5%(+6.76)#98 | 7.6%(+8.65)#1,438 |
| 14. | 77002 | 16.2% | 9.5%(+6.64)#102 | 7.6%(+8.53)#1,465 |
| 15. | 77082 | 15.8% | 9.5%(+6.28)#107 | 7.6%(+8.18)#1,534 |
| 16. | 77079 | 15.8% | 9.5%(+6.27)#108 | 7.6%(+8.16)#1,541 |
| 17. | 77070 | 15.4% | 9.5%(+5.86)#120 | 7.6%(+7.75)#1,640 |
| 18. | 77065 | 14.8% | 9.5%(+5.27)#136 | 7.6%(+7.16)#1,797 |
| 19. | 77064 | 14.4% | 9.5%(+4.88)#147 | 7.6%(+6.78)#1,885 |
| 20. | 77046 | 14.4% | 9.5%(+4.88)#148 | 7.6%(+6.78)#1,886 |
| 21. | 77056 | 14.3% | 9.5%(+4.76)#153 | 7.6%(+6.65)#1,925 |
| 22. | 77080 | 14.2% | 9.5%(+4.68)#156 | 7.6%(+6.57)#1,959 |
| 23. | 77095 | 14.2% | 9.5%(+4.66)#159 | 7.6%(+6.55)#1,965 |
| 24. | 77024 | 13.9% | 9.5%(+4.35)#169 | 7.6%(+6.24)#2,058 |
| 25. | 77018 | 13.6% | 9.5%(+4.08)#176 | 7.6%(+5.97)#2,165 |
| 26. | 77042 | 13.5% | 9.5%(+3.96)#179 | 7.6%(+5.85)#2,219 |
| 27. | 77027 | 13.5% | 9.5%(+3.95)#180 | 7.6%(+5.84)#2,224 |
| 28. | 77084 | 13.3% | 9.5%(+3.80)#186 | 7.6%(+5.69)#2,274 |
| 29. | 77004 | 12.8% | 9.5%(+3.28)#200 | 7.6%(+5.17)#2,478 |
| 30. | 77081 | 12.7% | 9.5%(+3.19)#203 | 7.6%(+5.09)#2,523 |
| 31. | 77003 | 12.5% | 9.5%(+3.00)#210 | 7.6%(+4.89)#2,598 |
| 32. | 77055 | 12.5% | 9.5%(+2.96)#216 | 7.6%(+4.85)#2,640 |
| 33. | 77068 | 12.4% | 9.5%(+2.91)#219 | 7.6%(+4.80)#2,655 |
| 34. | 77093 | 12.4% | 9.5%(+2.81)#221 | 7.6%(+4.70)#2,711 |
| 35. | 77006 | 12.3% | 9.5%(+2.78)#223 | 7.6%(+4.67)#2,734 |
| 36. | 77063 | 12.1% | 9.5%(+2.57)#228 | 7.6%(+4.47)#2,839 |
| 37. | 77009 | 11.8% | 9.5%(+2.22)#246 | 7.6%(+4.11)#3,025 |
| 38. | 77083 | 11.6% | 9.5%(+2.09)#251 | 7.6%(+3.98)#3,087 |
| 39. | 77005 | 11.5% | 9.5%(+1.97)#256 | 7.6%(+3.86)#3,163 |
| 40. | 77036 | 11.2% | 9.5%(+1.69)#267 | 7.6%(+3.58)#3,376 |
| 41. | 77057 | 11.1% | 9.5%(+1.56)#278 | 7.6%(+3.45)#3,500 |
| 42. | 77022 | 11.1% | 9.5%(+1.54)#280 | 7.6%(+3.43)#3,512 |
| 43. | 77043 | 10.9% | 9.5%(+1.33)#292 | 7.6%(+3.22)#3,630 |
| 44. | 77054 | 10.9% | 9.5%(+1.32)#294 | 7.6%(+3.21)#3,649 |
| 45. | 77040 | 10.7% | 9.5%(+1.14)#306 | 7.6%(+3.03)#3,799 |
| 46. | 77069 | 10.6% | 9.5%(+1.01)#318 | 7.6%(+2.91)#3,929 |
| 47. | 77017 | 10.4% | 9.5%(+0.892)#323 | 7.6%(+2.79)#4,045 |
| 48. | 77030 | 10.4% | 9.5%(+0.868)#326 | 7.6%(+2.76)#4,066 |
| 49. | 77099 | 10.3% | 9.5%(+0.757)#337 | 7.6%(+2.65)#4,175 |
| 50. | 77038 | 10.2% | 9.5%(+0.633)#350 | 7.6%(+2.53)#4,291 |
| 51. | 77034 | 10.1% | 9.5%(+0.599)#353 | 7.6%(+2.49)#4,327 |
| 52. | 77049 | 10.1% | 9.5%(+0.517)#360 | 7.6%(+2.41)#4,392 |
| 53. | 77014 | 10.0% | 9.5%(+0.410)#368 | 7.6%(+2.30)#4,491 |
| 54. | 77098 | 9.9% | 9.5%(+0.348)#371 | 7.6%(+2.24)#4,546 |
| 55. | 77025 | 9.8% | 9.5%(+0.260)#379 | 7.6%(+2.15)#4,625 |
| 56. | 77096 | 9.7% | 9.5%(+0.188)#389 | 7.6%(+2.08)#4,717 |
| 57. | 77012 | 9.6% | 9.5%(+0.092)#396 | 7.6%(+1.98)#4,824 |
| 58. | 77086 | 9.4% | 9.5%(-0.123)#420 | 7.6%(+1.77)#5,069 |
| 59. | 77033 | 9.2% | 9.5%(-0.388)#432 | 7.6%(+1.51)#5,379 |
| 60. | 77071 | 9.1% | 9.5%(-0.405)#433 | 7.6%(+1.49)#5,402 |
| 61. | 77060 | 9.1% | 9.5%(-0.444)#435 | 7.6%(+1.45)#5,445 |
| 62. | 77085 | 8.9% | 9.5%(-0.594)#445 | 7.6%(+1.30)#5,683 |
| 63. | 77066 | 8.8% | 9.5%(-0.787)#460 | 7.6%(+1.11)#5,936 |
| 64. | 77087 | 8.4% | 9.5%(-1.13)#488 | 7.6%(+0.760)#6,410 |
| 65. | 77044 | 8.3% | 9.5%(-1.19)#495 | 7.6%(+0.702)#6,495 |
| 66. | 77075 | 8.3% | 9.5%(-1.26)#501 | 7.6%(+0.635)#6,611 |
| 67. | 77089 | 7.6% | 9.5%(-1.92)#577 | 7.6%(-0.027)#7,794 |
| 68. | 77053 | 7.4% | 9.5%(-2.18)#597 | 7.6%(-0.283)#8,262 |
| 69. | 77015 | 7.3% | 9.5%(-2.19)#599 | 7.6%(-0.298)#8,299 |
| 70. | 77035 | 7.3% | 9.5%(-2.26)#603 | 7.6%(-0.366)#8,429 |
| 71. | 77092 | 6.9% | 9.5%(-2.67)#656 | 7.6%(-0.774)#9,259 |
| 72. | 77045 | 6.7% | 9.5%(-2.82)#672 | 7.6%(-0.923)#9,565 |
| 73. | 77076 | 6.7% | 9.5%(-2.88)#683 | 7.6%(-0.988)#9,709 |
| 74. | 77048 | 6.6% | 9.5%(-2.95)#690 | 7.6%(-1.05)#9,834 |
| 75. | 77013 | 6.5% | 9.5%(-3.01)#697 | 7.6%(-1.12)#9,949 |
| 76. | 77090 | 5.9% | 9.5%(-3.65)#785 | 7.6%(-1.76)#11,456 |
| 77. | 77021 | 5.8% | 9.5%(-3.72)#797 | 7.6%(-1.82)#11,632 |
| 78. | 77074 | 5.8% | 9.5%(-3.75)#802 | 7.6%(-1.86)#11,724 |
| 79. | 77061 | 5.7% | 9.5%(-3.79)#809 | 7.6%(-1.90)#11,817 |
| 80. | 77051 | 5.7% | 9.5%(-3.88)#824 | 7.6%(-1.98)#12,039 |
| 81. | 77073 | 5.5% | 9.5%(-4.07)#849 | 7.6%(-2.18)#12,528 |
| 82. | 77031 | 5.3% | 9.5%(-4.20)#867 | 7.6%(-2.31)#12,824 |
| 83. | 77037 | 5.1% | 9.5%(-4.44)#901 | 7.6%(-2.54)#13,424 |
| 84. | 77016 | 4.9% | 9.5%(-4.64)#934 | 7.6%(-2.75)#13,965 |
| 85. | 77023 | 4.5% | 9.5%(-5.09)#992 | 7.6%(-3.20)#15,187 |
| 86. | 77039 | 4.4% | 9.5%(-5.18)#1,000 | 7.6%(-3.28)#15,413 |
| 87. | 77047 | 3.8% | 9.5%(-5.71)#1,062 | 7.6%(-3.82)#16,830 |
| 88. | 77026 | 3.2% | 9.5%(-6.30)#1,139 | 7.6%(-4.41)#18,302 |
| 89. | 77088 | 2.9% | 9.5%(-6.60)#1,181 | 7.6%(-4.71)#19,035 |
| 90. | 77067 | 2.7% | 9.5%(-6.84)#1,198 | 7.6%(-4.95)#19,526 |
| 91. | 77091 | 2.6% | 9.5%(-6.99)#1,214 | 7.6%(-5.09)#19,859 |
| 92. | 77011 | 2.4% | 9.5%(-7.11)#1,229 | 7.6%(-5.22)#20,112 |
| 93. | 77028 | 2.4% | 9.5%(-7.12)#1,231 | 7.6%(-5.23)#20,141 |
| 94. | 77029 | 1.5% | 9.5%(-8.06)#1,333 | 7.6%(-6.17)#21,867 |
| 95. | 77078 | 0.29% | 9.5%(-9.25)#1,408 | 7.6%(-7.36)#23,309 |
1
Common Questions
What are the Top 10 Zip Codes with the Highest Percentage of Population with a Degree in Engineering in Houston, TX?
Top 10 Zip Codes with the Highest Percentage of Population with a Degree in Engineering in Houston, TX are:
What zip code has the Highest Percentage of Population with a Degree in Engineering in Houston, TX?
77204 has the Highest Percentage of Population with a Degree in Engineering in Houston, TX with 42.1%.
What is the Percentage of Population with a Degree in Engineering in Houston, TX?
Percentage of Population with a Degree in Engineering in Houston is 12.7%.
What is the Percentage of Population with a Degree in Engineering in Texas?
Percentage of Population with a Degree in Engineering in Texas is 9.5%.
What is the Percentage of Population with a Degree in Engineering in the United States?
Percentage of Population with a Degree in Engineering in the United States is 7.6%.