Zip Codes with the Highest Percentage of Population Employed in Education Instruction & Library in Houston, TX
RELATED REPORTS & OPTIONS
Education Instruction & Library
Houston
Compare Zip Codes
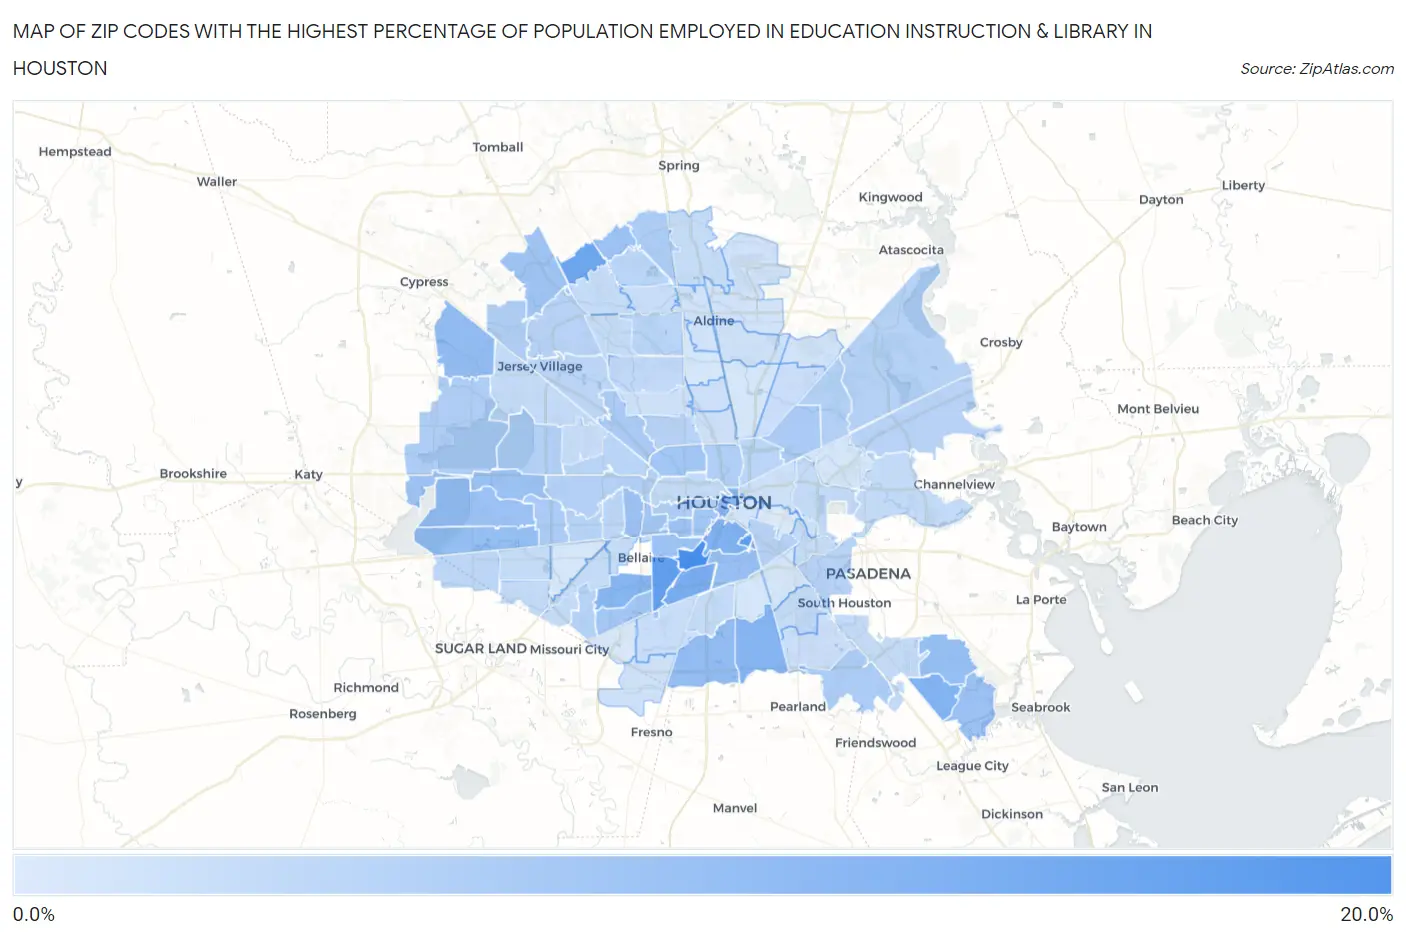
Map of Zip Codes with the Highest Percentage of Population Employed in Education Instruction & Library in Houston
1.4%
16.2%
Zip Codes with the Highest Percentage of Population Employed in Education Instruction & Library in Houston, TX
| Zip Code | % Employed | vs State | vs National | |
| 1. | 77030 | 16.2% | 6.4%(+9.88)#68 | 6.2%(+10.1)#1,060 |
| 2. | 77204 | 14.4% | 6.4%(+8.00)#94 | 6.2%(+8.18)#1,426 |
| 3. | 77025 | 13.3% | 6.4%(+6.91)#117 | 6.2%(+7.09)#1,792 |
| 4. | 77069 | 12.1% | 6.4%(+5.74)#148 | 6.2%(+5.93)#2,331 |
| 5. | 77054 | 11.0% | 6.4%(+4.62)#197 | 6.2%(+4.80)#3,067 |
| 6. | 77004 | 10.4% | 6.4%(+4.00)#232 | 6.2%(+4.18)#3,585 |
| 7. | 77062 | 10.2% | 6.4%(+3.85)#248 | 6.2%(+4.03)#3,726 |
| 8. | 77048 | 9.9% | 6.4%(+3.49)#270 | 6.2%(+3.67)#4,112 |
| 9. | 77096 | 9.5% | 6.4%(+3.15)#300 | 6.2%(+3.33)#4,505 |
| 10. | 77002 | 9.1% | 6.4%(+2.69)#348 | 6.2%(+2.87)#5,147 |
| 11. | 77095 | 8.6% | 6.4%(+2.21)#399 | 6.2%(+2.40)#5,961 |
| 12. | 77047 | 8.4% | 6.4%(+2.04)#419 | 6.2%(+2.22)#6,282 |
| 13. | 77082 | 8.3% | 6.4%(+1.95)#436 | 6.2%(+2.14)#6,487 |
| 14. | 77059 | 8.2% | 6.4%(+1.83)#450 | 6.2%(+2.01)#6,727 |
| 15. | 77021 | 8.0% | 6.4%(+1.67)#476 | 6.2%(+1.85)#7,081 |
| 16. | 77058 | 7.8% | 6.4%(+1.42)#509 | 6.2%(+1.60)#7,677 |
| 17. | 77077 | 7.7% | 6.4%(+1.36)#519 | 6.2%(+1.54)#7,805 |
| 18. | 77005 | 7.7% | 6.4%(+1.36)#520 | 6.2%(+1.54)#7,817 |
| 19. | 77068 | 7.7% | 6.4%(+1.35)#522 | 6.2%(+1.54)#7,841 |
| 20. | 77010 | 7.7% | 6.4%(+1.30)#527 | 6.2%(+1.49)#7,996 |
| 21. | 77098 | 7.6% | 6.4%(+1.23)#542 | 6.2%(+1.41)#8,182 |
| 22. | 77056 | 7.5% | 6.4%(+1.15)#553 | 6.2%(+1.33)#8,396 |
| 23. | 77079 | 7.5% | 6.4%(+1.13)#555 | 6.2%(+1.31)#8,435 |
| 24. | 77094 | 7.4% | 6.4%(+1.08)#566 | 6.2%(+1.26)#8,570 |
| 25. | 77070 | 7.1% | 6.4%(+0.768)#640 | 6.2%(+0.951)#9,480 |
| 26. | 77008 | 6.9% | 6.4%(+0.577)#677 | 6.2%(+0.759)#10,100 |
| 27. | 77035 | 6.8% | 6.4%(+0.457)#696 | 6.2%(+0.640)#10,494 |
| 28. | 77027 | 6.8% | 6.4%(+0.449)#699 | 6.2%(+0.631)#10,529 |
| 29. | 77006 | 6.8% | 6.4%(+0.426)#709 | 6.2%(+0.608)#10,603 |
| 30. | 77042 | 6.3% | 6.4%(-0.047)#803 | 6.2%(+0.136)#12,281 |
| 31. | 77028 | 6.2% | 6.4%(-0.139)#825 | 6.2%(+0.044)#12,662 |
| 32. | 77092 | 6.2% | 6.4%(-0.139)#826 | 6.2%(+0.043)#12,663 |
| 33. | 77090 | 6.0% | 6.4%(-0.328)#872 | 6.2%(-0.146)#13,343 |
| 34. | 77089 | 6.0% | 6.4%(-0.340)#874 | 6.2%(-0.158)#13,388 |
| 35. | 77019 | 5.8% | 6.4%(-0.577)#935 | 6.2%(-0.395)#14,356 |
| 36. | 77084 | 5.7% | 6.4%(-0.648)#949 | 6.2%(-0.465)#14,654 |
| 37. | 77065 | 5.6% | 6.4%(-0.775)#979 | 6.2%(-0.593)#15,190 |
| 38. | 77009 | 5.5% | 6.4%(-0.861)#994 | 6.2%(-0.678)#15,535 |
| 39. | 77043 | 5.4% | 6.4%(-0.994)#1,038 | 6.2%(-0.811)#16,103 |
| 40. | 77024 | 5.4% | 6.4%(-1.00)#1,041 | 6.2%(-0.821)#16,131 |
| 41. | 77078 | 5.2% | 6.4%(-1.12)#1,079 | 6.2%(-0.938)#16,621 |
| 42. | 77071 | 5.1% | 6.4%(-1.25)#1,105 | 6.2%(-1.07)#17,129 |
| 43. | 77044 | 5.1% | 6.4%(-1.29)#1,113 | 6.2%(-1.11)#17,312 |
| 44. | 77063 | 5.0% | 6.4%(-1.35)#1,125 | 6.2%(-1.17)#17,604 |
| 45. | 77018 | 5.0% | 6.4%(-1.39)#1,136 | 6.2%(-1.21)#17,771 |
| 46. | 77023 | 4.9% | 6.4%(-1.49)#1,153 | 6.2%(-1.31)#18,195 |
| 47. | 77017 | 4.8% | 6.4%(-1.56)#1,167 | 6.2%(-1.38)#18,479 |
| 48. | 77064 | 4.8% | 6.4%(-1.57)#1,169 | 6.2%(-1.39)#18,519 |
| 49. | 77049 | 4.8% | 6.4%(-1.57)#1,171 | 6.2%(-1.39)#18,527 |
| 50. | 77014 | 4.7% | 6.4%(-1.65)#1,188 | 6.2%(-1.47)#18,861 |
| 51. | 77026 | 4.7% | 6.4%(-1.68)#1,200 | 6.2%(-1.50)#18,976 |
| 52. | 77038 | 4.7% | 6.4%(-1.70)#1,207 | 6.2%(-1.52)#19,058 |
| 53. | 77055 | 4.6% | 6.4%(-1.74)#1,213 | 6.2%(-1.55)#19,214 |
| 54. | 77057 | 4.5% | 6.4%(-1.83)#1,229 | 6.2%(-1.65)#19,601 |
| 55. | 77083 | 4.5% | 6.4%(-1.84)#1,231 | 6.2%(-1.66)#19,621 |
| 56. | 77040 | 4.5% | 6.4%(-1.88)#1,238 | 6.2%(-1.70)#19,773 |
| 57. | 77088 | 3.9% | 6.4%(-2.42)#1,359 | 6.2%(-2.24)#21,854 |
| 58. | 77099 | 3.9% | 6.4%(-2.45)#1,366 | 6.2%(-2.27)#21,974 |
| 59. | 77051 | 3.9% | 6.4%(-2.47)#1,369 | 6.2%(-2.29)#22,065 |
| 60. | 77034 | 3.9% | 6.4%(-2.50)#1,374 | 6.2%(-2.31)#22,138 |
| 61. | 77031 | 3.9% | 6.4%(-2.50)#1,376 | 6.2%(-2.32)#22,160 |
| 62. | 77041 | 3.7% | 6.4%(-2.65)#1,402 | 6.2%(-2.47)#22,657 |
| 63. | 77015 | 3.7% | 6.4%(-2.65)#1,404 | 6.2%(-2.47)#22,677 |
| 64. | 77007 | 3.7% | 6.4%(-2.66)#1,406 | 6.2%(-2.48)#22,685 |
| 65. | 77029 | 3.7% | 6.4%(-2.66)#1,407 | 6.2%(-2.48)#22,687 |
| 66. | 77046 | 3.7% | 6.4%(-2.69)#1,409 | 6.2%(-2.51)#22,796 |
| 67. | 77073 | 3.6% | 6.4%(-2.75)#1,417 | 6.2%(-2.57)#22,992 |
| 68. | 77012 | 3.6% | 6.4%(-2.75)#1,418 | 6.2%(-2.57)#22,993 |
| 69. | 77072 | 3.6% | 6.4%(-2.78)#1,422 | 6.2%(-2.60)#23,086 |
| 70. | 77081 | 3.6% | 6.4%(-2.79)#1,424 | 6.2%(-2.60)#23,105 |
| 71. | 77074 | 3.6% | 6.4%(-2.80)#1,431 | 6.2%(-2.62)#23,172 |
| 72. | 77061 | 3.6% | 6.4%(-2.81)#1,434 | 6.2%(-2.63)#23,209 |
| 73. | 77066 | 3.6% | 6.4%(-2.82)#1,435 | 6.2%(-2.63)#23,211 |
| 74. | 77086 | 3.5% | 6.4%(-2.82)#1,436 | 6.2%(-2.64)#23,215 |
| 75. | 77080 | 3.4% | 6.4%(-2.99)#1,464 | 6.2%(-2.81)#23,755 |
| 76. | 77045 | 3.4% | 6.4%(-3.02)#1,467 | 6.2%(-2.83)#23,826 |
| 77. | 77067 | 3.3% | 6.4%(-3.07)#1,479 | 6.2%(-2.89)#24,042 |
| 78. | 77075 | 3.2% | 6.4%(-3.12)#1,493 | 6.2%(-2.94)#24,208 |
| 79. | 77016 | 3.1% | 6.4%(-3.27)#1,509 | 6.2%(-3.09)#24,612 |
| 80. | 77076 | 3.0% | 6.4%(-3.39)#1,520 | 6.2%(-3.21)#24,903 |
| 81. | 77022 | 2.9% | 6.4%(-3.47)#1,526 | 6.2%(-3.29)#25,080 |
| 82. | 77091 | 2.8% | 6.4%(-3.55)#1,537 | 6.2%(-3.37)#25,263 |
| 83. | 77053 | 2.8% | 6.4%(-3.58)#1,544 | 6.2%(-3.40)#25,326 |
| 84. | 77020 | 2.7% | 6.4%(-3.68)#1,555 | 6.2%(-3.49)#25,570 |
| 85. | 77039 | 2.6% | 6.4%(-3.72)#1,558 | 6.2%(-3.54)#25,685 |
| 86. | 77060 | 2.6% | 6.4%(-3.81)#1,570 | 6.2%(-3.63)#25,896 |
| 87. | 77032 | 2.4% | 6.4%(-3.94)#1,587 | 6.2%(-3.76)#26,176 |
| 88. | 77050 | 2.4% | 6.4%(-3.96)#1,589 | 6.2%(-3.78)#26,201 |
| 89. | 77003 | 2.3% | 6.4%(-4.11)#1,601 | 6.2%(-3.93)#26,500 |
| 90. | 77037 | 2.2% | 6.4%(-4.20)#1,610 | 6.2%(-4.02)#26,663 |
| 91. | 77087 | 2.1% | 6.4%(-4.23)#1,614 | 6.2%(-4.05)#26,711 |
| 92. | 77033 | 2.1% | 6.4%(-4.23)#1,615 | 6.2%(-4.05)#26,714 |
| 93. | 77013 | 2.1% | 6.4%(-4.24)#1,618 | 6.2%(-4.06)#26,731 |
| 94. | 77036 | 2.1% | 6.4%(-4.30)#1,624 | 6.2%(-4.12)#26,848 |
| 95. | 77093 | 2.0% | 6.4%(-4.39)#1,629 | 6.2%(-4.21)#26,980 |
| 96. | 77085 | 1.9% | 6.4%(-4.49)#1,636 | 6.2%(-4.31)#27,140 |
| 97. | 77011 | 1.4% | 6.4%(-4.92)#1,658 | 6.2%(-4.74)#27,747 |
1
Common Questions
What are the Top 10 Zip Codes with the Highest Percentage of Population Employed in Education Instruction & Library in Houston, TX?
Top 10 Zip Codes with the Highest Percentage of Population Employed in Education Instruction & Library in Houston, TX are:
What zip code has the Highest Percentage of Population Employed in Education Instruction & Library in Houston, TX?
77030 has the Highest Percentage of Population Employed in Education Instruction & Library in Houston, TX with 16.2%.
What is the Percentage of Population Employed in Education Instruction & Library in Houston, TX?
Percentage of Population Employed in Education Instruction & Library in Houston is 5.5%.
What is the Percentage of Population Employed in Education Instruction & Library in Texas?
Percentage of Population Employed in Education Instruction & Library in Texas is 6.4%.
What is the Percentage of Population Employed in Education Instruction & Library in the United States?
Percentage of Population Employed in Education Instruction & Library in the United States is 6.2%.