Zip Codes with the Highest Percentage of Population Employed in Health Diagnosing & Treating in Maryland
RELATED REPORTS & OPTIONS
Health Diagnosing & Treating
Maryland
Compare Zip Codes
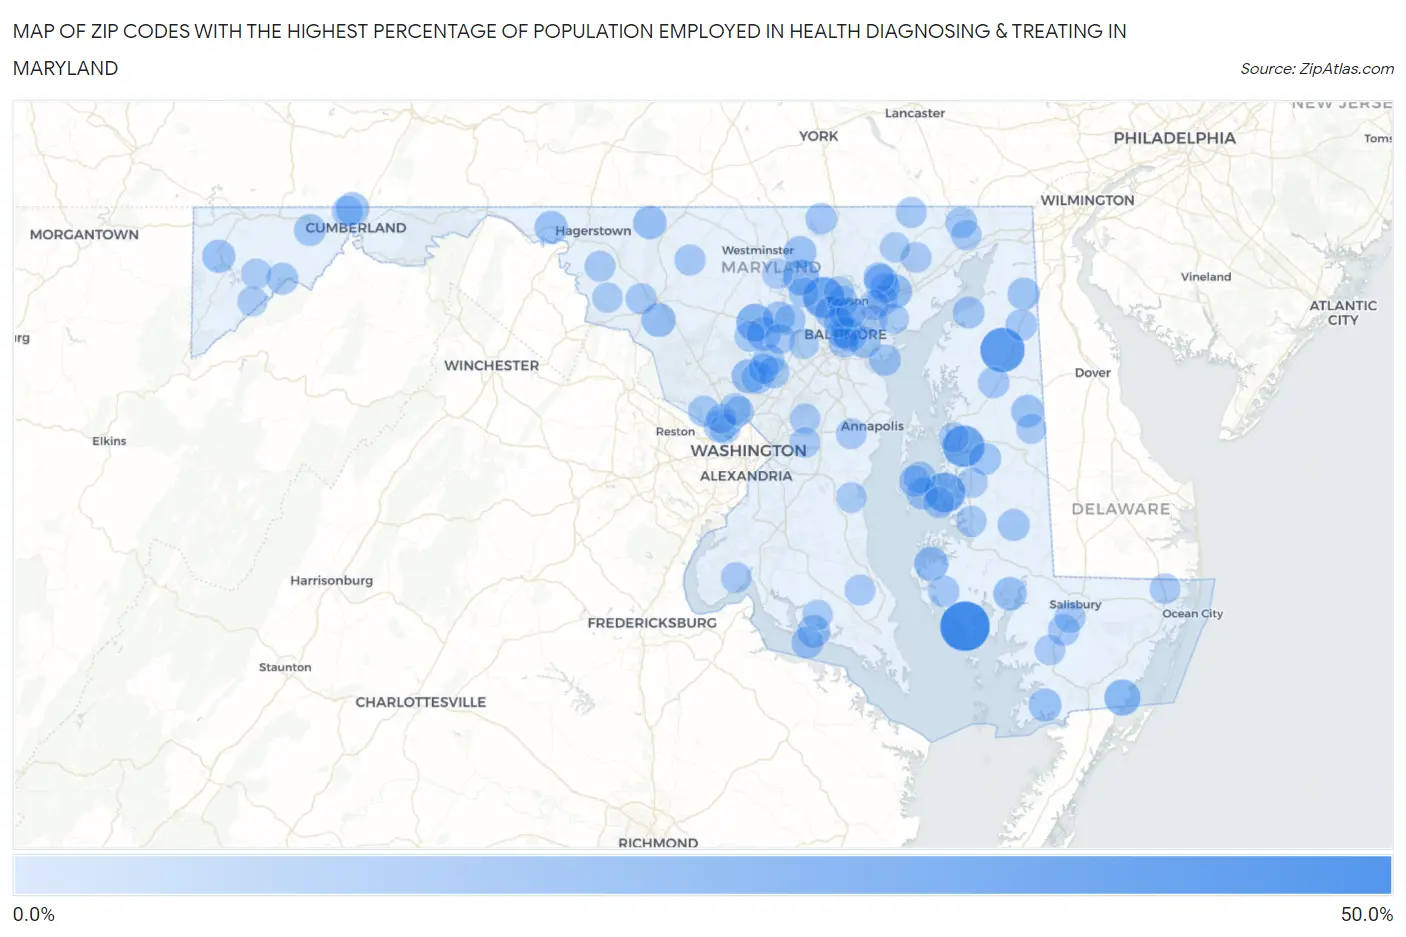
Map of Zip Codes with the Highest Percentage of Population Employed in Health Diagnosing & Treating in Maryland
0.0%
50.0%
Zip Codes with the Highest Percentage of Population Employed in Health Diagnosing & Treating in Maryland
| Zip Code | % Employed | vs State | vs National | |
| 1. | 21675 | 50.0% | 6.2%(+43.8)#1 | 6.2%(+43.8)#69 |
| 2. | 21628 | 38.5% | 6.2%(+32.3)#2 | 6.2%(+32.3)#125 |
| 3. | 21679 | 32.4% | 6.2%(+26.2)#3 | 6.2%(+26.2)#176 |
| 4. | 21153 | 31.4% | 6.2%(+25.2)#4 | 6.2%(+25.1)#197 |
| 5. | 21653 | 29.4% | 6.2%(+23.2)#5 | 6.2%(+23.2)#232 |
| 6. | 21723 | 23.2% | 6.2%(+17.0)#6 | 6.2%(+17.0)#382 |
| 7. | 21864 | 20.6% | 6.2%(+14.4)#7 | 6.2%(+14.3)#513 |
| 8. | 21071 | 20.0% | 6.2%(+13.8)#8 | 6.2%(+13.8)#546 |
| 9. | 20860 | 16.9% | 6.2%(+10.7)#9 | 6.2%(+10.7)#823 |
| 10. | 21156 | 16.8% | 6.2%(+10.6)#10 | 6.2%(+10.6)#842 |
| 11. | 21648 | 16.5% | 6.2%(+10.3)#11 | 6.2%(+10.3)#882 |
| 12. | 21717 | 16.3% | 6.2%(+10.1)#12 | 6.2%(+10.1)#906 |
| 13. | 21794 | 15.9% | 6.2%(+9.70)#13 | 6.2%(+9.67)#968 |
| 14. | 21051 | 15.7% | 6.2%(+9.51)#14 | 6.2%(+9.47)#1,000 |
| 15. | 21231 | 15.0% | 6.2%(+8.79)#15 | 6.2%(+8.75)#1,155 |
| 16. | 21869 | 14.9% | 6.2%(+8.65)#16 | 6.2%(+8.61)#1,187 |
| 17. | 21780 | 14.8% | 6.2%(+8.64)#17 | 6.2%(+8.60)#1,189 |
| 18. | 21722 | 14.6% | 6.2%(+8.36)#18 | 6.2%(+8.32)#1,243 |
| 19. | 21541 | 14.5% | 6.2%(+8.30)#19 | 6.2%(+8.26)#1,260 |
| 20. | 21529 | 14.4% | 6.2%(+8.19)#20 | 6.2%(+8.15)#1,294 |
| 21. | 21838 | 14.1% | 6.2%(+7.89)#21 | 6.2%(+7.86)#1,381 |
| 22. | 21155 | 13.9% | 6.2%(+7.69)#22 | 6.2%(+7.66)#1,437 |
| 23. | 20609 | 13.6% | 6.2%(+7.40)#23 | 6.2%(+7.36)#1,538 |
| 24. | 21636 | 13.3% | 6.2%(+7.11)#24 | 6.2%(+7.07)#1,633 |
| 25. | 21209 | 13.2% | 6.2%(+6.96)#25 | 6.2%(+6.92)#1,684 |
| 26. | 21912 | 12.8% | 6.2%(+6.59)#26 | 6.2%(+6.55)#1,831 |
| 27. | 21625 | 12.7% | 6.2%(+6.52)#27 | 6.2%(+6.49)#1,852 |
| 28. | 20818 | 12.7% | 6.2%(+6.47)#28 | 6.2%(+6.43)#1,875 |
| 29. | 20861 | 12.4% | 6.2%(+6.23)#29 | 6.2%(+6.19)#1,991 |
| 30. | 21643 | 12.0% | 6.2%(+5.84)#30 | 6.2%(+5.80)#2,207 |
| 31. | 21104 | 12.0% | 6.2%(+5.82)#31 | 6.2%(+5.78)#2,216 |
| 32. | 20626 | 12.0% | 6.2%(+5.75)#32 | 6.2%(+5.71)#2,243 |
| 33. | 21201 | 11.8% | 6.2%(+5.56)#33 | 6.2%(+5.52)#2,343 |
| 34. | 21612 | 11.7% | 6.2%(+5.54)#34 | 6.2%(+5.50)#2,360 |
| 35. | 21647 | 11.7% | 6.2%(+5.53)#35 | 6.2%(+5.49)#2,366 |
| 36. | 21610 | 11.7% | 6.2%(+5.46)#36 | 6.2%(+5.42)#2,409 |
| 37. | 21543 | 11.7% | 6.2%(+5.46)#37 | 6.2%(+5.42)#2,410 |
| 38. | 21029 | 11.5% | 6.2%(+5.31)#38 | 6.2%(+5.28)#2,512 |
| 39. | 21052 | 11.5% | 6.2%(+5.28)#39 | 6.2%(+5.24)#2,530 |
| 40. | 21676 | 11.5% | 6.2%(+5.27)#40 | 6.2%(+5.23)#2,541 |
| 41. | 21523 | 11.3% | 6.2%(+5.08)#41 | 6.2%(+5.05)#2,669 |
| 42. | 21202 | 11.3% | 6.2%(+5.07)#42 | 6.2%(+5.04)#2,675 |
| 43. | 21822 | 11.3% | 6.2%(+5.06)#43 | 6.2%(+5.02)#2,690 |
| 44. | 20759 | 11.1% | 6.2%(+4.94)#44 | 6.2%(+4.90)#2,778 |
| 45. | 21635 | 11.1% | 6.2%(+4.91)#45 | 6.2%(+4.88)#2,791 |
| 46. | 21917 | 11.0% | 6.2%(+4.78)#46 | 6.2%(+4.75)#2,893 |
| 47. | 21623 | 10.9% | 6.2%(+4.67)#47 | 6.2%(+4.63)#2,986 |
| 48. | 21053 | 10.8% | 6.2%(+4.57)#48 | 6.2%(+4.54)#3,071 |
| 49. | 21714 | 10.8% | 6.2%(+4.55)#49 | 6.2%(+4.51)#3,099 |
| 50. | 20854 | 10.7% | 6.2%(+4.46)#50 | 6.2%(+4.42)#3,167 |
| 51. | 21622 | 10.6% | 6.2%(+4.38)#51 | 6.2%(+4.34)#3,233 |
| 52. | 21224 | 10.6% | 6.2%(+4.36)#52 | 6.2%(+4.32)#3,253 |
| 53. | 21662 | 10.3% | 6.2%(+4.09)#53 | 6.2%(+4.05)#3,532 |
| 54. | 21798 | 10.2% | 6.2%(+3.99)#54 | 6.2%(+3.95)#3,647 |
| 55. | 21204 | 10.2% | 6.2%(+3.96)#55 | 6.2%(+3.93)#3,670 |
| 56. | 21128 | 10.1% | 6.2%(+3.91)#56 | 6.2%(+3.87)#3,735 |
| 57. | 21524 | 10.0% | 6.2%(+3.83)#57 | 6.2%(+3.79)#3,851 |
| 58. | 21160 | 10.0% | 6.2%(+3.80)#58 | 6.2%(+3.76)#3,879 |
| 59. | 21826 | 9.9% | 6.2%(+3.67)#59 | 6.2%(+3.63)#4,021 |
| 60. | 21738 | 9.8% | 6.2%(+3.63)#60 | 6.2%(+3.59)#4,071 |
| 61. | 20896 | 9.8% | 6.2%(+3.58)#61 | 6.2%(+3.55)#4,125 |
| 62. | 21163 | 9.7% | 6.2%(+3.53)#62 | 6.2%(+3.49)#4,203 |
| 63. | 21713 | 9.7% | 6.2%(+3.50)#63 | 6.2%(+3.46)#4,247 |
| 64. | 21673 | 9.6% | 6.2%(+3.43)#64 | 6.2%(+3.39)#4,342 |
| 65. | 20777 | 9.6% | 6.2%(+3.41)#65 | 6.2%(+3.37)#4,382 |
| 66. | 20615 | 9.6% | 6.2%(+3.37)#66 | 6.2%(+3.33)#4,434 |
| 67. | 21042 | 9.4% | 6.2%(+3.24)#67 | 6.2%(+3.20)#4,623 |
| 68. | 21140 | 9.4% | 6.2%(+3.17)#68 | 6.2%(+3.14)#4,714 |
| 69. | 21087 | 9.4% | 6.2%(+3.15)#69 | 6.2%(+3.12)#4,741 |
| 70. | 21904 | 9.3% | 6.2%(+3.11)#70 | 6.2%(+3.07)#4,829 |
| 71. | 21813 | 9.3% | 6.2%(+3.11)#71 | 6.2%(+3.07)#4,835 |
| 72. | 21082 | 9.2% | 6.2%(+3.04)#72 | 6.2%(+3.00)#4,957 |
| 73. | 20693 | 9.2% | 6.2%(+3.01)#73 | 6.2%(+2.97)#4,993 |
| 74. | 21015 | 9.1% | 6.2%(+2.88)#74 | 6.2%(+2.84)#5,218 |
| 75. | 21230 | 9.0% | 6.2%(+2.81)#75 | 6.2%(+2.77)#5,358 |
| 76. | 21236 | 8.9% | 6.2%(+2.73)#76 | 6.2%(+2.69)#5,475 |
| 77. | 21779 | 8.9% | 6.2%(+2.72)#77 | 6.2%(+2.69)#5,481 |
| 78. | 21048 | 8.9% | 6.2%(+2.68)#78 | 6.2%(+2.65)#5,542 |
| 79. | 20720 | 8.9% | 6.2%(+2.68)#79 | 6.2%(+2.64)#5,554 |
| 80. | 21658 | 8.9% | 6.2%(+2.67)#80 | 6.2%(+2.63)#5,568 |
| 81. | 21212 | 8.9% | 6.2%(+2.66)#81 | 6.2%(+2.63)#5,592 |
| 82. | 21853 | 8.9% | 6.2%(+2.66)#82 | 6.2%(+2.62)#5,600 |
| 83. | 21237 | 8.9% | 6.2%(+2.66)#83 | 6.2%(+2.62)#5,608 |
| 84. | 21117 | 8.9% | 6.2%(+2.65)#84 | 6.2%(+2.61)#5,614 |
| 85. | 20758 | 8.8% | 6.2%(+2.64)#85 | 6.2%(+2.60)#5,631 |
| 86. | 21043 | 8.8% | 6.2%(+2.61)#86 | 6.2%(+2.57)#5,708 |
| 87. | 20721 | 8.8% | 6.2%(+2.60)#87 | 6.2%(+2.56)#5,722 |
| 88. | 20624 | 8.8% | 6.2%(+2.57)#88 | 6.2%(+2.53)#5,783 |
| 89. | 20812 | 8.8% | 6.2%(+2.55)#89 | 6.2%(+2.51)#5,815 |
| 90. | 21050 | 8.7% | 6.2%(+2.53)#90 | 6.2%(+2.49)#5,856 |
| 91. | 21211 | 8.7% | 6.2%(+2.51)#91 | 6.2%(+2.48)#5,898 |
| 92. | 21561 | 8.7% | 6.2%(+2.47)#92 | 6.2%(+2.43)#5,973 |
| 93. | 21239 | 8.7% | 6.2%(+2.46)#93 | 6.2%(+2.42)#6,002 |
| 94. | 21601 | 8.6% | 6.2%(+2.42)#94 | 6.2%(+2.39)#6,076 |
| 95. | 21538 | 8.5% | 6.2%(+2.33)#95 | 6.2%(+2.30)#6,258 |
| 96. | 21220 | 8.5% | 6.2%(+2.33)#96 | 6.2%(+2.29)#6,265 |
| 97. | 21093 | 8.5% | 6.2%(+2.24)#97 | 6.2%(+2.21)#6,430 |
| 98. | 21639 | 8.4% | 6.2%(+2.20)#98 | 6.2%(+2.17)#6,508 |
| 99. | 20817 | 8.4% | 6.2%(+2.18)#99 | 6.2%(+2.14)#6,551 |
| 100. | 20895 | 8.4% | 6.2%(+2.16)#100 | 6.2%(+2.12)#6,604 |
Common Questions
What are the Top 10 Zip Codes with the Highest Percentage of Population Employed in Health Diagnosing & Treating in Maryland?
Top 10 Zip Codes with the Highest Percentage of Population Employed in Health Diagnosing & Treating in Maryland are:
What zip code has the Highest Percentage of Population Employed in Health Diagnosing & Treating in Maryland?
21675 has the Highest Percentage of Population Employed in Health Diagnosing & Treating in Maryland with 50.0%.
What is the Percentage of Population Employed in Health Diagnosing & Treating in the State of Maryland?
Percentage of Population Employed in Health Diagnosing & Treating in Maryland is 6.2%.
What is the Percentage of Population Employed in Health Diagnosing & Treating in the United States?
Percentage of Population Employed in Health Diagnosing & Treating in the United States is 6.2%.