Zip Codes with the Highest Percentage of Population Carpooling to Work in Houston, TX
RELATED REPORTS & OPTIONS
Drive | Carpool
Houston
Compare Zip Codes
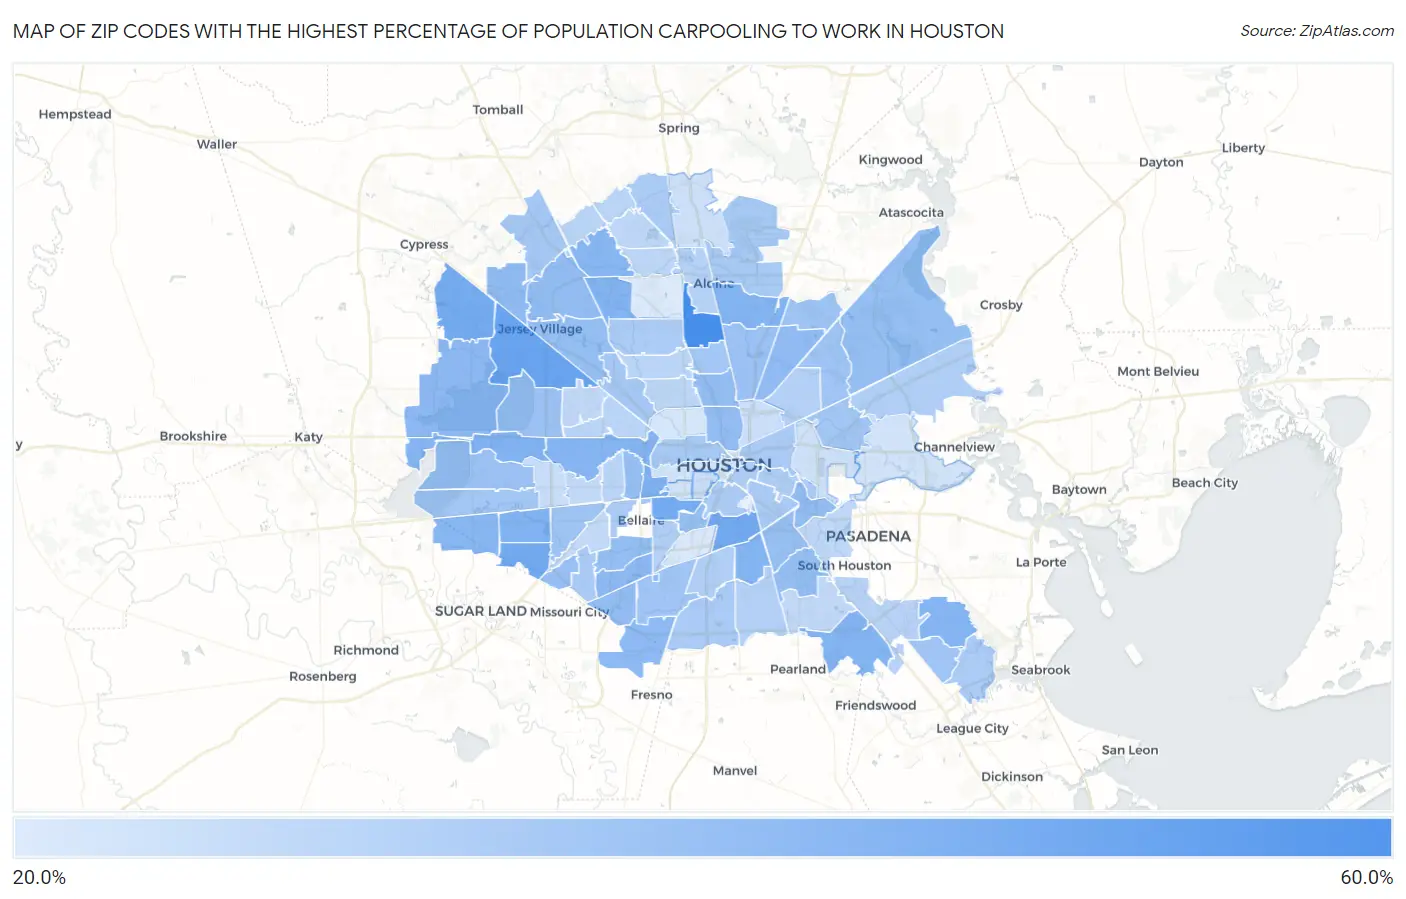
Map of Zip Codes with the Highest Percentage of Population Carpooling to Work in Houston
28.7%
53.9%
Zip Codes with the Highest Percentage of Population Carpooling to Work in Houston, TX
| Zip Code | % Carpool | vs State | vs National | |
| 1. | 77037 | 53.9% | 37.6%(+16.3)#61 | 38.2%(+15.7)#1,565 |
| 2. | 77041 | 47.8% | 37.6%(+10.2)#167 | 38.2%(+9.60)#3,905 |
| 3. | 77099 | 46.0% | 37.6%(+8.40)#213 | 38.2%(+7.80)#5,113 |
| 4. | 77021 | 46.0% | 37.6%(+8.40)#214 | 38.2%(+7.80)#5,119 |
| 5. | 77005 | 45.6% | 37.6%(+8.00)#222 | 38.2%(+7.40)#5,351 |
| 6. | 77095 | 45.5% | 37.6%(+7.90)#229 | 38.2%(+7.30)#5,407 |
| 7. | 77027 | 43.9% | 37.6%(+6.30)#297 | 38.2%(+5.70)#6,780 |
| 8. | 77072 | 43.6% | 37.6%(+6.00)#308 | 38.2%(+5.40)#7,013 |
| 9. | 77079 | 43.5% | 37.6%(+5.90)#314 | 38.2%(+5.30)#7,115 |
| 10. | 77089 | 43.4% | 37.6%(+5.80)#320 | 38.2%(+5.20)#7,233 |
| 11. | 77039 | 43.3% | 37.6%(+5.70)#332 | 38.2%(+5.10)#7,355 |
| 12. | 77033 | 43.2% | 37.6%(+5.60)#339 | 38.2%(+5.00)#7,469 |
| 13. | 77086 | 43.1% | 37.6%(+5.50)#345 | 38.2%(+4.90)#7,572 |
| 14. | 77059 | 42.8% | 37.6%(+5.20)#365 | 38.2%(+4.60)#7,881 |
| 15. | 77024 | 42.7% | 37.6%(+5.10)#372 | 38.2%(+4.50)#7,965 |
| 16. | 77094 | 42.5% | 37.6%(+4.90)#391 | 38.2%(+4.30)#8,210 |
| 17. | 77066 | 42.4% | 37.6%(+4.80)#393 | 38.2%(+4.20)#8,318 |
| 18. | 77083 | 42.3% | 37.6%(+4.70)#401 | 38.2%(+4.10)#8,417 |
| 19. | 77084 | 41.9% | 37.6%(+4.30)#433 | 38.2%(+3.70)#8,889 |
| 20. | 77035 | 41.7% | 37.6%(+4.10)#441 | 38.2%(+3.50)#9,146 |
| 21. | 77053 | 41.3% | 37.6%(+3.70)#465 | 38.2%(+3.10)#9,656 |
| 22. | 77016 | 40.9% | 37.6%(+3.30)#493 | 38.2%(+2.70)#10,124 |
| 23. | 77065 | 40.8% | 37.6%(+3.20)#502 | 38.2%(+2.60)#10,230 |
| 24. | 77009 | 40.7% | 37.6%(+3.10)#516 | 38.2%(+2.50)#10,382 |
| 25. | 77064 | 40.6% | 37.6%(+3.00)#524 | 38.2%(+2.40)#10,490 |
| 26. | 77012 | 40.6% | 37.6%(+3.00)#529 | 38.2%(+2.40)#10,538 |
| 27. | 77022 | 40.5% | 37.6%(+2.90)#540 | 38.2%(+2.30)#10,688 |
| 28. | 77085 | 40.4% | 37.6%(+2.80)#554 | 38.2%(+2.20)#10,874 |
| 29. | 77056 | 40.2% | 37.6%(+2.60)#575 | 38.2%(+2.00)#11,157 |
| 30. | 77044 | 40.1% | 37.6%(+2.50)#580 | 38.2%(+1.90)#11,223 |
| 31. | 77040 | 40.1% | 37.6%(+2.50)#583 | 38.2%(+1.90)#11,227 |
| 32. | 77061 | 40.1% | 37.6%(+2.50)#589 | 38.2%(+1.90)#11,263 |
| 33. | 77096 | 40.0% | 37.6%(+2.40)#596 | 38.2%(+1.80)#11,385 |
| 34. | 77087 | 39.9% | 37.6%(+2.30)#606 | 38.2%(+1.70)#11,529 |
| 35. | 77031 | 39.6% | 37.6%(+2.00)#634 | 38.2%(+1.40)#11,950 |
| 36. | 77030 | 39.6% | 37.6%(+2.00)#635 | 38.2%(+1.40)#11,960 |
| 37. | 77093 | 39.5% | 37.6%(+1.90)#642 | 38.2%(+1.30)#12,053 |
| 38. | 77077 | 39.4% | 37.6%(+1.80)#660 | 38.2%(+1.20)#12,247 |
| 39. | 77043 | 39.2% | 37.6%(+1.60)#686 | 38.2%(+1.00)#12,580 |
| 40. | 77036 | 38.6% | 37.6%(+1.00)#731 | 38.2%(+0.400)#13,378 |
| 41. | 77050 | 38.6% | 37.6%(+1.00)#742 | 38.2%(+0.400)#13,467 |
| 42. | 77045 | 38.2% | 37.6%(+0.600)#775 | 38.2%(=0.000)#14,011 |
| 43. | 77062 | 38.2% | 37.6%(+0.600)#776 | 38.2%(=0.000)#14,027 |
| 44. | 77078 | 38.1% | 37.6%(+0.500)#787 | 38.2%(-0.100)#14,174 |
| 45. | 77082 | 37.9% | 37.6%(+0.300)#802 | 38.2%(-0.300)#14,379 |
| 46. | 77076 | 37.8% | 37.6%(+0.200)#816 | 38.2%(-0.400)#14,518 |
| 47. | 77013 | 37.8% | 37.6%(+0.200)#817 | 38.2%(-0.400)#14,552 |
| 48. | 77070 | 37.5% | 37.6%(-0.100)#844 | 38.2%(-0.700)#14,960 |
| 49. | 77092 | 37.4% | 37.6%(-0.200)#858 | 38.2%(-0.800)#15,160 |
| 50. | 77007 | 37.1% | 37.6%(-0.500)#875 | 38.2%(-1.10)#15,575 |
| 51. | 77032 | 37.1% | 37.6%(-0.500)#881 | 38.2%(-1.10)#15,619 |
| 52. | 77081 | 36.9% | 37.6%(-0.700)#900 | 38.2%(-1.30)#15,835 |
| 53. | 77071 | 36.9% | 37.6%(-0.700)#904 | 38.2%(-1.30)#15,872 |
| 54. | 77090 | 36.6% | 37.6%(-1.00)#928 | 38.2%(-1.60)#16,282 |
| 55. | 77047 | 36.6% | 37.6%(-1.00)#929 | 38.2%(-1.60)#16,289 |
| 56. | 77020 | 36.6% | 37.6%(-1.00)#933 | 38.2%(-1.60)#16,304 |
| 57. | 77088 | 36.5% | 37.6%(-1.10)#938 | 38.2%(-1.70)#16,407 |
| 58. | 77023 | 36.4% | 37.6%(-1.20)#953 | 38.2%(-1.80)#16,603 |
| 59. | 77058 | 36.4% | 37.6%(-1.20)#955 | 38.2%(-1.80)#16,617 |
| 60. | 77004 | 36.3% | 37.6%(-1.30)#963 | 38.2%(-1.90)#16,726 |
| 61. | 77011 | 36.1% | 37.6%(-1.50)#979 | 38.2%(-2.10)#17,016 |
| 62. | 77003 | 36.1% | 37.6%(-1.50)#980 | 38.2%(-2.10)#17,023 |
| 63. | 77049 | 35.6% | 37.6%(-2.00)#1,027 | 38.2%(-2.60)#17,667 |
| 64. | 77051 | 35.5% | 37.6%(-2.10)#1,037 | 38.2%(-2.70)#17,855 |
| 65. | 77025 | 35.4% | 37.6%(-2.20)#1,047 | 38.2%(-2.80)#17,997 |
| 66. | 77028 | 35.4% | 37.6%(-2.20)#1,048 | 38.2%(-2.80)#18,016 |
| 67. | 77048 | 35.1% | 37.6%(-2.50)#1,079 | 38.2%(-3.10)#18,368 |
| 68. | 77060 | 35.0% | 37.6%(-2.60)#1,083 | 38.2%(-3.20)#18,434 |
| 69. | 77034 | 34.6% | 37.6%(-3.00)#1,112 | 38.2%(-3.60)#18,901 |
| 70. | 77057 | 34.3% | 37.6%(-3.30)#1,131 | 38.2%(-3.90)#19,255 |
| 71. | 77055 | 34.3% | 37.6%(-3.30)#1,132 | 38.2%(-3.90)#19,256 |
| 72. | 77091 | 34.3% | 37.6%(-3.30)#1,133 | 38.2%(-3.90)#19,267 |
| 73. | 77069 | 34.2% | 37.6%(-3.40)#1,143 | 38.2%(-4.00)#19,417 |
| 74. | 77068 | 34.1% | 37.6%(-3.50)#1,150 | 38.2%(-4.10)#19,517 |
| 75. | 77018 | 33.9% | 37.6%(-3.70)#1,158 | 38.2%(-4.30)#19,647 |
| 76. | 77067 | 33.7% | 37.6%(-3.90)#1,177 | 38.2%(-4.50)#19,872 |
| 77. | 77014 | 33.6% | 37.6%(-4.00)#1,181 | 38.2%(-4.60)#19,970 |
| 78. | 77017 | 33.3% | 37.6%(-4.30)#1,207 | 38.2%(-4.90)#20,291 |
| 79. | 77074 | 33.2% | 37.6%(-4.40)#1,217 | 38.2%(-5.00)#20,383 |
| 80. | 77063 | 33.1% | 37.6%(-4.50)#1,220 | 38.2%(-5.10)#20,447 |
| 81. | 77080 | 33.0% | 37.6%(-4.60)#1,227 | 38.2%(-5.20)#20,510 |
| 82. | 77075 | 33.0% | 37.6%(-4.60)#1,229 | 38.2%(-5.20)#20,518 |
| 83. | 77006 | 32.3% | 37.6%(-5.30)#1,268 | 38.2%(-5.90)#21,193 |
| 84. | 77042 | 32.1% | 37.6%(-5.50)#1,280 | 38.2%(-6.10)#21,312 |
| 85. | 77026 | 31.5% | 37.6%(-6.10)#1,302 | 38.2%(-6.70)#21,760 |
| 86. | 77073 | 31.3% | 37.6%(-6.30)#1,306 | 38.2%(-6.90)#21,909 |
| 87. | 77029 | 30.7% | 37.6%(-6.90)#1,344 | 38.2%(-7.50)#22,290 |
| 88. | 77015 | 30.5% | 37.6%(-7.10)#1,349 | 38.2%(-7.70)#22,404 |
| 89. | 77098 | 30.4% | 37.6%(-7.20)#1,353 | 38.2%(-7.80)#22,504 |
| 90. | 77019 | 30.3% | 37.6%(-7.30)#1,356 | 38.2%(-7.90)#22,546 |
| 91. | 77008 | 29.9% | 37.6%(-7.70)#1,366 | 38.2%(-8.30)#22,702 |
| 92. | 77002 | 29.8% | 37.6%(-7.80)#1,372 | 38.2%(-8.40)#22,766 |
| 93. | 77054 | 28.9% | 37.6%(-8.70)#1,406 | 38.2%(-9.30)#23,238 |
| 94. | 77038 | 28.7% | 37.6%(-8.90)#1,420 | 38.2%(-9.50)#23,361 |
1
Common Questions
What are the Top 10 Zip Codes with the Highest Percentage of Population Carpooling to Work in Houston, TX?
Top 10 Zip Codes with the Highest Percentage of Population Carpooling to Work in Houston, TX are:
What zip code has the Highest Percentage of Population Carpooling to Work in Houston, TX?
77037 has the Highest Percentage of Population Carpooling to Work in Houston, TX with 53.9%.
What is the Percentage of Population Carpooling to Work in Houston, TX?
Percentage of Population Carpooling to Work in Houston is 37.3%.
What is the Percentage of Population Carpooling to Work in Texas?
Percentage of Population Carpooling to Work in Texas is 37.6%.
What is the Percentage of Population Carpooling to Work in the United States?
Percentage of Population Carpooling to Work in the United States is 38.2%.