Zip Codes with the Lowest Percentage of Owner-Occupied Units in Houston, TX
RELATED REPORTS & OPTIONS
Lowest Owner-Occupied
Houston
Compare Zip Codes
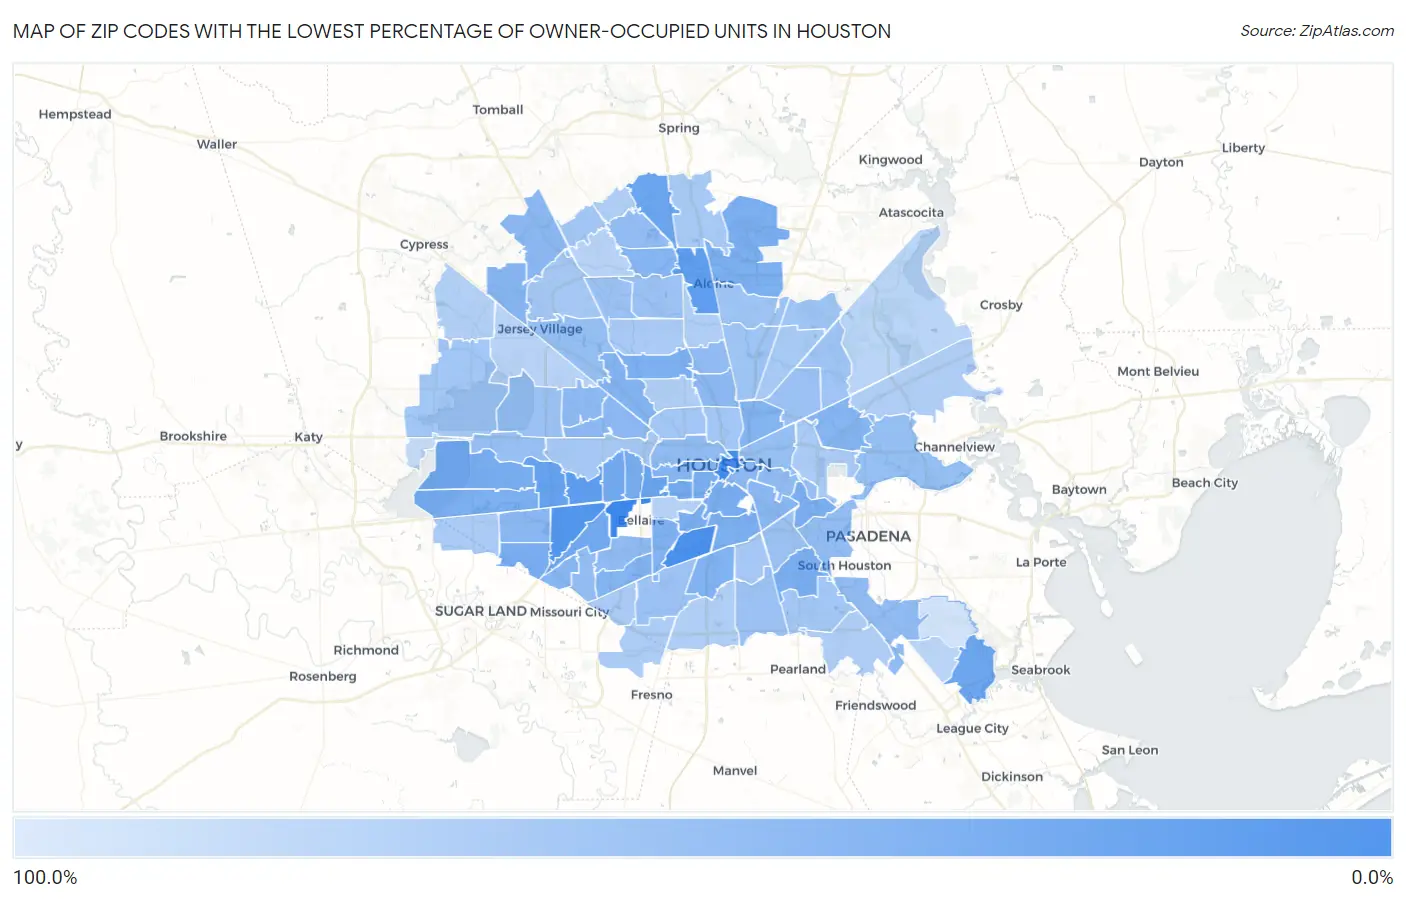
Map of Zip Codes with the Lowest Percentage of Owner-Occupied Units in Houston
92.9%
6.1%
Zip Codes with the Lowest Percentage of Owner-Occupied Units in Houston, TX
| Zip Code | % Owner-Occupied | vs State | vs National | |
| 1. | 77081 | 6.1% | 62.4%(-56.3)#10 | 64.8%(-58.7)#93 |
| 2. | 77002 | 10.1% | 62.4%(-52.3)#17 | 64.8%(-54.7)#172 |
| 3. | 77054 | 11.7% | 62.4%(-50.7)#22 | 64.8%(-53.1)#209 |
| 4. | 77036 | 16.4% | 62.4%(-46.0)#31 | 64.8%(-48.4)#285 |
| 5. | 77063 | 22.0% | 62.4%(-40.4)#46 | 64.8%(-42.8)#443 |
| 6. | 77060 | 23.4% | 62.4%(-38.9)#48 | 64.8%(-41.4)#487 |
| 7. | 77042 | 25.6% | 62.4%(-36.7)#56 | 64.8%(-39.2)#556 |
| 8. | 77027 | 27.1% | 62.4%(-35.3)#59 | 64.8%(-37.7)#619 |
| 9. | 77090 | 28.3% | 62.4%(-34.1)#63 | 64.8%(-36.5)#673 |
| 10. | 77058 | 29.9% | 62.4%(-32.5)#69 | 64.8%(-34.9)#757 |
| 11. | 77057 | 31.8% | 62.4%(-30.6)#79 | 64.8%(-33.0)#865 |
| 12. | 77098 | 32.2% | 62.4%(-30.2)#82 | 64.8%(-32.6)#892 |
| 13. | 77074 | 32.4% | 62.4%(-30.0)#84 | 64.8%(-32.4)#907 |
| 14. | 77006 | 34.3% | 62.4%(-28.1)#96 | 64.8%(-30.5)#1,033 |
| 15. | 77056 | 34.8% | 62.4%(-27.6)#98 | 64.8%(-30.0)#1,073 |
| 16. | 77077 | 35.1% | 62.4%(-27.3)#99 | 64.8%(-29.7)#1,089 |
| 17. | 77099 | 36.4% | 62.4%(-26.0)#103 | 64.8%(-28.4)#1,203 |
| 18. | 77004 | 36.5% | 62.4%(-25.9)#104 | 64.8%(-28.3)#1,213 |
| 19. | 77082 | 36.8% | 62.4%(-25.6)#106 | 64.8%(-28.0)#1,239 |
| 20. | 77091 | 37.2% | 62.4%(-25.2)#109 | 64.8%(-27.7)#1,265 |
| 21. | 77021 | 37.3% | 62.4%(-25.1)#110 | 64.8%(-27.5)#1,277 |
| 22. | 77030 | 38.0% | 62.4%(-24.4)#115 | 64.8%(-26.9)#1,332 |
| 23. | 77012 | 38.0% | 62.4%(-24.4)#118 | 64.8%(-26.8)#1,339 |
| 24. | 77061 | 38.3% | 62.4%(-24.1)#119 | 64.8%(-26.5)#1,362 |
| 25. | 77032 | 38.9% | 62.4%(-23.5)#126 | 64.8%(-25.9)#1,403 |
| 26. | 77051 | 39.4% | 62.4%(-23.0)#130 | 64.8%(-25.4)#1,450 |
| 27. | 77025 | 40.1% | 62.4%(-22.3)#135 | 64.8%(-24.7)#1,520 |
| 28. | 77092 | 40.6% | 62.4%(-21.8)#138 | 64.8%(-24.3)#1,561 |
| 29. | 77026 | 40.7% | 62.4%(-21.7)#139 | 64.8%(-24.1)#1,578 |
| 30. | 77035 | 41.4% | 62.4%(-21.0)#146 | 64.8%(-23.4)#1,635 |
| 31. | 77019 | 42.6% | 62.4%(-19.8)#152 | 64.8%(-22.3)#1,760 |
| 32. | 77067 | 43.0% | 62.4%(-19.4)#154 | 64.8%(-21.8)#1,803 |
| 33. | 77013 | 43.1% | 62.4%(-19.3)#155 | 64.8%(-21.8)#1,815 |
| 34. | 77065 | 43.2% | 62.4%(-19.2)#157 | 64.8%(-21.7)#1,823 |
| 35. | 77031 | 44.1% | 62.4%(-18.3)#161 | 64.8%(-20.8)#1,918 |
| 36. | 77023 | 44.5% | 62.4%(-17.9)#166 | 64.8%(-20.3)#1,963 |
| 37. | 77072 | 45.0% | 62.4%(-17.4)#169 | 64.8%(-19.8)#2,033 |
| 38. | 77003 | 45.8% | 62.4%(-16.6)#173 | 64.8%(-19.1)#2,136 |
| 39. | 77055 | 45.9% | 62.4%(-16.5)#174 | 64.8%(-18.9)#2,154 |
| 40. | 77070 | 46.0% | 62.4%(-16.4)#177 | 64.8%(-18.8)#2,167 |
| 41. | 77022 | 46.6% | 62.4%(-15.8)#183 | 64.8%(-18.2)#2,263 |
| 42. | 77080 | 47.3% | 62.4%(-15.1)#191 | 64.8%(-17.5)#2,367 |
| 43. | 77007 | 48.8% | 62.4%(-13.6)#212 | 64.8%(-16.0)#2,609 |
| 44. | 77096 | 49.1% | 62.4%(-13.3)#215 | 64.8%(-15.7)#2,654 |
| 45. | 77034 | 49.1% | 62.4%(-13.3)#216 | 64.8%(-15.7)#2,656 |
| 46. | 77076 | 49.2% | 62.4%(-13.1)#218 | 64.8%(-15.6)#2,678 |
| 47. | 77011 | 49.5% | 62.4%(-12.9)#222 | 64.8%(-15.3)#2,714 |
| 48. | 77017 | 50.0% | 62.4%(-12.4)#229 | 64.8%(-14.8)#2,801 |
| 49. | 77071 | 50.2% | 62.4%(-12.2)#233 | 64.8%(-14.6)#2,828 |
| 50. | 77014 | 50.4% | 62.4%(-12.0)#237 | 64.8%(-14.4)#2,865 |
| 51. | 77040 | 51.2% | 62.4%(-11.2)#249 | 64.8%(-13.6)#3,012 |
| 52. | 77020 | 51.8% | 62.4%(-10.6)#263 | 64.8%(-13.0)#3,112 |
| 53. | 77015 | 52.5% | 62.4%(-9.87)#278 | 64.8%(-12.3)#3,254 |
| 54. | 77079 | 53.0% | 62.4%(-9.44)#284 | 64.8%(-11.9)#3,342 |
| 55. | 77046 | 54.2% | 62.4%(-8.16)#307 | 64.8%(-10.6)#3,596 |
| 56. | 77043 | 55.6% | 62.4%(-6.78)#330 | 64.8%(-9.20)#3,926 |
| 57. | 77087 | 56.1% | 62.4%(-6.29)#337 | 64.8%(-8.71)#4,045 |
| 58. | 77028 | 56.4% | 62.4%(-5.97)#349 | 64.8%(-8.39)#4,128 |
| 59. | 77048 | 56.5% | 62.4%(-5.89)#351 | 64.8%(-8.31)#4,149 |
| 60. | 77086 | 56.6% | 62.4%(-5.81)#353 | 64.8%(-8.23)#4,165 |
| 61. | 77038 | 56.7% | 62.4%(-5.71)#354 | 64.8%(-8.13)#4,194 |
| 62. | 77045 | 56.8% | 62.4%(-5.55)#359 | 64.8%(-7.97)#4,243 |
| 63. | 77050 | 57.0% | 62.4%(-5.38)#366 | 64.8%(-7.80)#4,279 |
| 64. | 77093 | 58.0% | 62.4%(-4.38)#382 | 64.8%(-6.80)#4,551 |
| 65. | 77039 | 58.2% | 62.4%(-4.24)#387 | 64.8%(-6.66)#4,578 |
| 66. | 77078 | 58.6% | 62.4%(-3.81)#397 | 64.8%(-6.23)#4,692 |
| 67. | 77009 | 59.8% | 62.4%(-2.57)#431 | 64.8%(-4.99)#5,061 |
| 68. | 77075 | 60.3% | 62.4%(-2.10)#439 | 64.8%(-4.52)#5,199 |
| 69. | 77084 | 60.4% | 62.4%(-1.99)#442 | 64.8%(-4.41)#5,229 |
| 70. | 77069 | 60.7% | 62.4%(-1.74)#450 | 64.8%(-4.16)#5,308 |
| 71. | 77008 | 61.0% | 62.4%(-1.37)#456 | 64.8%(-3.79)#5,432 |
| 72. | 77033 | 61.3% | 62.4%(-1.09)#464 | 64.8%(-3.51)#5,525 |
| 73. | 77064 | 61.4% | 62.4%(-1.04)#466 | 64.8%(-3.46)#5,542 |
| 74. | 77024 | 61.8% | 62.4%(-0.576)#480 | 64.8%(-3.00)#5,735 |
| 75. | 77073 | 62.9% | 62.4%(+0.548)#502 | 64.8%(-1.87)#6,159 |
| 76. | 77016 | 63.5% | 62.4%(+1.10)#517 | 64.8%(-1.32)#6,414 |
| 77. | 77083 | 64.3% | 62.4%(+1.86)#537 | 64.8%(-0.561)#6,712 |
| 78. | 77029 | 65.2% | 62.4%(+2.77)#567 | 64.8%(+0.355)#7,143 |
| 79. | 77085 | 65.2% | 62.4%(+2.82)#571 | 64.8%(+0.402)#7,163 |
| 80. | 77088 | 65.4% | 62.4%(+3.01)#576 | 64.8%(+0.593)#7,258 |
| 81. | 77053 | 66.9% | 62.4%(+4.46)#630 | 64.8%(+2.04)#7,952 |
| 82. | 77089 | 67.8% | 62.4%(+5.38)#657 | 64.8%(+2.96)#8,422 |
| 83. | 77049 | 68.3% | 62.4%(+5.94)#677 | 64.8%(+3.52)#8,754 |
| 84. | 77068 | 68.5% | 62.4%(+6.15)#686 | 64.8%(+3.73)#8,875 |
| 85. | 77018 | 69.4% | 62.4%(+6.99)#712 | 64.8%(+4.57)#9,361 |
| 86. | 77047 | 69.7% | 62.4%(+7.30)#732 | 64.8%(+4.88)#9,567 |
| 87. | 77037 | 70.4% | 62.4%(+7.99)#763 | 64.8%(+5.57)#10,027 |
| 88. | 77095 | 70.7% | 62.4%(+8.34)#782 | 64.8%(+5.92)#10,239 |
| 89. | 77005 | 72.7% | 62.4%(+10.3)#860 | 64.8%(+7.92)#11,622 |
| 90. | 77066 | 73.9% | 62.4%(+11.5)#901 | 64.8%(+9.04)#12,405 |
| 91. | 77041 | 74.6% | 62.4%(+12.2)#934 | 64.8%(+9.82)#13,009 |
| 92. | 77044 | 75.2% | 62.4%(+12.8)#975 | 64.8%(+10.4)#13,550 |
| 93. | 77062 | 76.3% | 62.4%(+13.9)#1,030 | 64.8%(+11.5)#14,473 |
| 94. | 77094 | 82.6% | 62.4%(+20.2)#1,341 | 64.8%(+17.8)#20,432 |
| 95. | 77059 | 92.9% | 62.4%(+30.5)#1,711 | 64.8%(+28.1)#28,876 |
1
Common Questions
What are the Top 10 Zip Codes with the Lowest Percentage of Owner-Occupied Units in Houston, TX?
Top 10 Zip Codes with the Lowest Percentage of Owner-Occupied Units in Houston, TX are:
What zip code has the Lowest Percentage of Owner-Occupied Units in Houston, TX?
77081 has the Lowest Percentage of Owner-Occupied Units in Houston, TX with 6.1%.
What is the Percentage of Owner-Occupied Units in Houston, TX?
Percentage of Owner-Occupied Units in Houston is 42.0%.
What is the Percentage of Owner-Occupied Units in Texas?
Percentage of Owner-Occupied Units in Texas is 62.4%.
What is the Percentage of Owner-Occupied Units in the United States?
Percentage of Owner-Occupied Units in the United States is 64.8%.