Zip Codes with the Highest Percentage of Population Employed in Cleaning & Maintenance in Houston, TX
RELATED REPORTS & OPTIONS
Cleaning & Maintenance
Houston
Compare Zip Codes
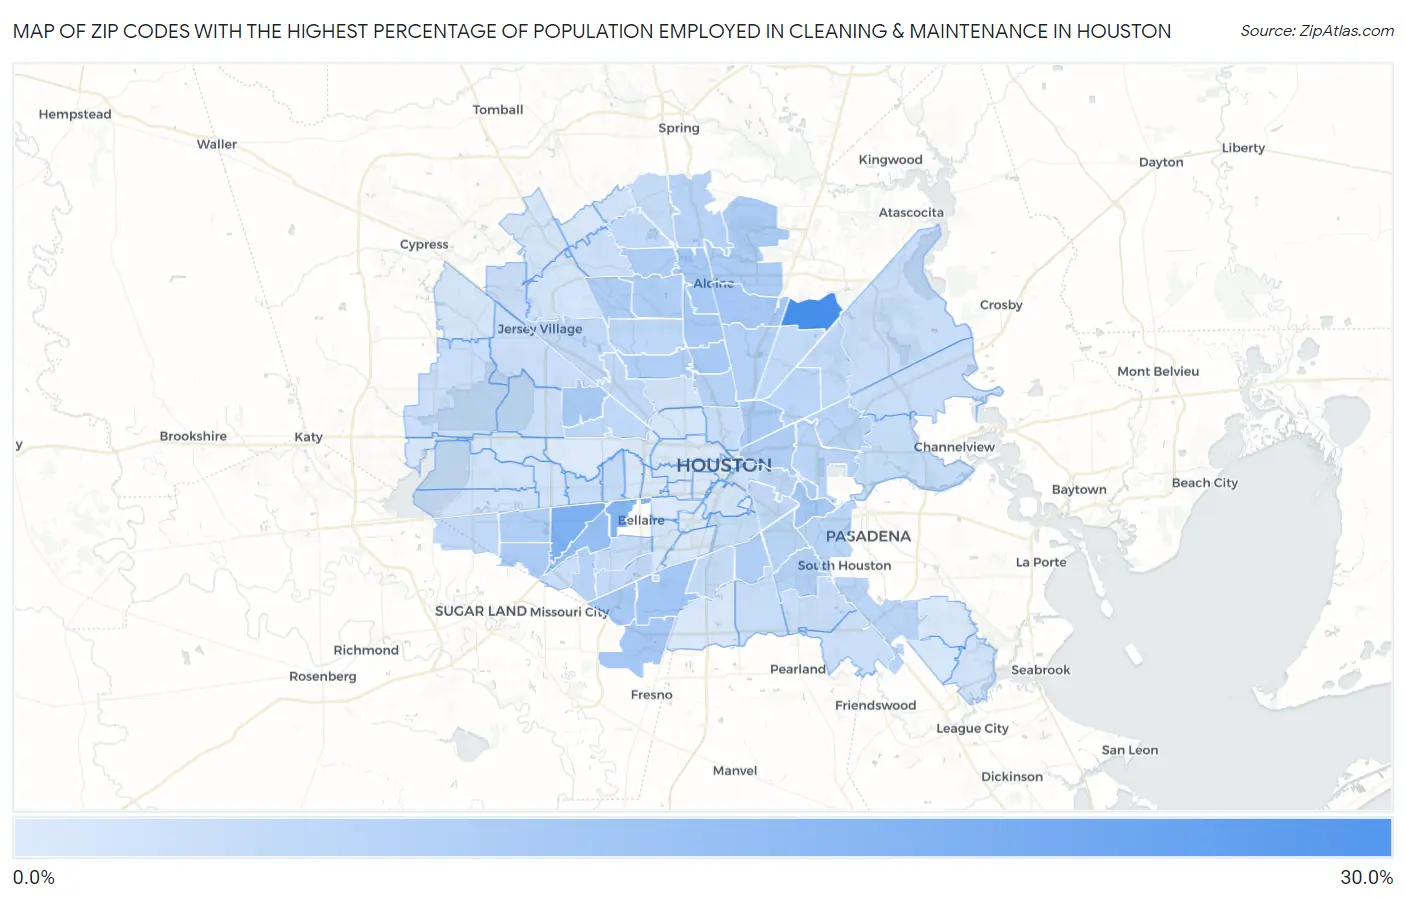
Map of Zip Codes with the Highest Percentage of Population Employed in Cleaning & Maintenance in Houston
0.13%
28.8%
Zip Codes with the Highest Percentage of Population Employed in Cleaning & Maintenance in Houston, TX
| Zip Code | % Employed | vs State | vs National | |
| 1. | 77050 | 28.8% | 3.6%(+25.2)#14 | 3.5%(+25.3)#189 |
| 2. | 77036 | 17.3% | 3.6%(+13.7)#37 | 3.5%(+13.8)#544 |
| 3. | 77081 | 16.3% | 3.6%(+12.7)#42 | 3.5%(+12.8)#630 |
| 4. | 77074 | 12.7% | 3.6%(+9.14)#64 | 3.5%(+9.22)#1,060 |
| 5. | 77045 | 10.1% | 3.6%(+6.56)#100 | 3.5%(+6.64)#1,755 |
| 6. | 77039 | 10.1% | 3.6%(+6.51)#101 | 3.5%(+6.59)#1,778 |
| 7. | 77053 | 9.7% | 3.6%(+6.18)#114 | 3.5%(+6.26)#1,931 |
| 8. | 77012 | 9.7% | 3.6%(+6.12)#116 | 3.5%(+6.20)#1,958 |
| 9. | 77060 | 9.6% | 3.6%(+6.06)#121 | 3.5%(+6.14)#1,988 |
| 10. | 77037 | 9.6% | 3.6%(+6.05)#122 | 3.5%(+6.13)#1,993 |
| 11. | 77085 | 9.5% | 3.6%(+5.96)#125 | 3.5%(+6.04)#2,037 |
| 12. | 77076 | 9.5% | 3.6%(+5.90)#127 | 3.5%(+5.98)#2,065 |
| 13. | 77080 | 9.3% | 3.6%(+5.70)#132 | 3.5%(+5.78)#2,162 |
| 14. | 77026 | 9.0% | 3.6%(+5.45)#143 | 3.5%(+5.53)#2,293 |
| 15. | 77032 | 8.5% | 3.6%(+4.95)#162 | 3.5%(+5.04)#2,595 |
| 16. | 77099 | 8.4% | 3.6%(+4.84)#165 | 3.5%(+4.92)#2,681 |
| 17. | 77067 | 8.4% | 3.6%(+4.83)#166 | 3.5%(+4.91)#2,697 |
| 18. | 77086 | 8.3% | 3.6%(+4.71)#174 | 3.5%(+4.79)#2,807 |
| 19. | 77020 | 8.1% | 3.6%(+4.58)#185 | 3.5%(+4.66)#2,916 |
| 20. | 77091 | 7.9% | 3.6%(+4.37)#209 | 3.5%(+4.45)#3,096 |
| 21. | 77033 | 7.9% | 3.6%(+4.33)#212 | 3.5%(+4.41)#3,133 |
| 22. | 77038 | 7.9% | 3.6%(+4.33)#214 | 3.5%(+4.41)#3,139 |
| 23. | 77072 | 7.8% | 3.6%(+4.24)#221 | 3.5%(+4.32)#3,218 |
| 24. | 77093 | 7.4% | 3.6%(+3.87)#253 | 3.5%(+3.95)#3,622 |
| 25. | 77022 | 7.1% | 3.6%(+3.53)#285 | 3.5%(+3.62)#3,962 |
| 26. | 77061 | 6.9% | 3.6%(+3.29)#305 | 3.5%(+3.37)#4,259 |
| 27. | 77071 | 6.7% | 3.6%(+3.10)#323 | 3.5%(+3.18)#4,544 |
| 28. | 77073 | 6.3% | 3.6%(+2.76)#356 | 3.5%(+2.84)#5,057 |
| 29. | 77029 | 6.3% | 3.6%(+2.75)#357 | 3.5%(+2.83)#5,089 |
| 30. | 77087 | 6.2% | 3.6%(+2.63)#377 | 3.5%(+2.71)#5,299 |
| 31. | 77034 | 6.2% | 3.6%(+2.62)#379 | 3.5%(+2.70)#5,307 |
| 32. | 77028 | 6.1% | 3.6%(+2.57)#389 | 3.5%(+2.65)#5,395 |
| 33. | 77013 | 6.0% | 3.6%(+2.41)#408 | 3.5%(+2.49)#5,707 |
| 34. | 77017 | 5.9% | 3.6%(+2.35)#416 | 3.5%(+2.43)#5,816 |
| 35. | 77011 | 5.6% | 3.6%(+2.00)#461 | 3.5%(+2.08)#6,558 |
| 36. | 77088 | 5.4% | 3.6%(+1.82)#481 | 3.5%(+1.90)#6,967 |
| 37. | 77055 | 5.1% | 3.6%(+1.57)#511 | 3.5%(+1.65)#7,592 |
| 38. | 77035 | 5.0% | 3.6%(+1.45)#523 | 3.5%(+1.53)#7,938 |
| 39. | 77040 | 5.0% | 3.6%(+1.41)#531 | 3.5%(+1.49)#8,055 |
| 40. | 77023 | 4.9% | 3.6%(+1.35)#540 | 3.5%(+1.43)#8,196 |
| 41. | 77078 | 4.9% | 3.6%(+1.32)#544 | 3.5%(+1.40)#8,294 |
| 42. | 77014 | 4.9% | 3.6%(+1.30)#552 | 3.5%(+1.38)#8,349 |
| 43. | 77092 | 4.9% | 3.6%(+1.29)#555 | 3.5%(+1.37)#8,360 |
| 44. | 77083 | 4.7% | 3.6%(+1.14)#576 | 3.5%(+1.22)#8,817 |
| 45. | 77051 | 4.5% | 3.6%(+0.945)#614 | 3.5%(+1.03)#9,477 |
| 46. | 77016 | 4.4% | 3.6%(+0.869)#630 | 3.5%(+0.949)#9,709 |
| 47. | 77090 | 4.4% | 3.6%(+0.850)#633 | 3.5%(+0.931)#9,780 |
| 48. | 77015 | 4.2% | 3.6%(+0.656)#659 | 3.5%(+0.736)#10,477 |
| 49. | 77021 | 4.2% | 3.6%(+0.624)#665 | 3.5%(+0.704)#10,600 |
| 50. | 77057 | 4.1% | 3.6%(+0.568)#674 | 3.5%(+0.648)#10,823 |
| 51. | 77063 | 3.8% | 3.6%(+0.247)#751 | 3.5%(+0.327)#12,106 |
| 52. | 77031 | 3.8% | 3.6%(+0.216)#758 | 3.5%(+0.297)#12,241 |
| 53. | 77044 | 3.7% | 3.6%(+0.183)#766 | 3.5%(+0.264)#12,370 |
| 54. | 77009 | 3.7% | 3.6%(+0.166)#770 | 3.5%(+0.246)#12,434 |
| 55. | 77048 | 3.7% | 3.6%(+0.129)#785 | 3.5%(+0.209)#12,591 |
| 56. | 77096 | 3.6% | 3.6%(-0.009)#808 | 3.5%(+0.072)#13,194 |
| 57. | 77049 | 3.5% | 3.6%(-0.044)#813 | 3.5%(+0.036)#13,350 |
| 58. | 77075 | 3.5% | 3.6%(-0.066)#819 | 3.5%(+0.015)#13,442 |
| 59. | 77041 | 3.3% | 3.6%(-0.297)#877 | 3.5%(-0.216)#14,536 |
| 60. | 77084 | 3.2% | 3.6%(-0.386)#898 | 3.5%(-0.305)#14,991 |
| 61. | 77065 | 3.1% | 3.6%(-0.471)#922 | 3.5%(-0.390)#15,407 |
| 62. | 77089 | 3.1% | 3.6%(-0.488)#930 | 3.5%(-0.407)#15,505 |
| 63. | 77003 | 3.1% | 3.6%(-0.488)#931 | 3.5%(-0.408)#15,510 |
| 64. | 77043 | 3.0% | 3.6%(-0.596)#952 | 3.5%(-0.516)#16,045 |
| 65. | 77066 | 2.9% | 3.6%(-0.706)#982 | 3.5%(-0.626)#16,652 |
| 66. | 77018 | 2.2% | 3.6%(-1.31)#1,128 | 3.5%(-1.23)#19,782 |
| 67. | 77082 | 2.2% | 3.6%(-1.41)#1,164 | 3.5%(-1.33)#20,305 |
| 68. | 77058 | 2.1% | 3.6%(-1.51)#1,196 | 3.5%(-1.43)#20,812 |
| 69. | 77077 | 2.0% | 3.6%(-1.56)#1,210 | 3.5%(-1.48)#21,036 |
| 70. | 77042 | 2.0% | 3.6%(-1.56)#1,212 | 3.5%(-1.48)#21,041 |
| 71. | 77068 | 1.9% | 3.6%(-1.64)#1,238 | 3.5%(-1.56)#21,455 |
| 72. | 77064 | 1.8% | 3.6%(-1.80)#1,275 | 3.5%(-1.72)#22,253 |
| 73. | 77004 | 1.7% | 3.6%(-1.82)#1,284 | 3.5%(-1.74)#22,344 |
| 74. | 77062 | 1.5% | 3.6%(-2.07)#1,339 | 3.5%(-1.99)#23,520 |
| 75. | 77095 | 1.4% | 3.6%(-2.15)#1,356 | 3.5%(-2.07)#23,863 |
| 76. | 77070 | 1.4% | 3.6%(-2.19)#1,367 | 3.5%(-2.11)#24,061 |
| 77. | 77025 | 1.4% | 3.6%(-2.21)#1,375 | 3.5%(-2.13)#24,169 |
| 78. | 77008 | 1.2% | 3.6%(-2.34)#1,406 | 3.5%(-2.26)#24,709 |
| 79. | 77079 | 1.1% | 3.6%(-2.42)#1,422 | 3.5%(-2.34)#25,005 |
| 80. | 77047 | 1.00% | 3.6%(-2.56)#1,452 | 3.5%(-2.48)#25,525 |
| 81. | 77019 | 0.95% | 3.6%(-2.61)#1,459 | 3.5%(-2.53)#25,657 |
| 82. | 77054 | 0.91% | 3.6%(-2.65)#1,470 | 3.5%(-2.57)#25,802 |
| 83. | 77059 | 0.90% | 3.6%(-2.66)#1,471 | 3.5%(-2.58)#25,816 |
| 84. | 77094 | 0.73% | 3.6%(-2.83)#1,506 | 3.5%(-2.75)#26,355 |
| 85. | 77069 | 0.73% | 3.6%(-2.83)#1,507 | 3.5%(-2.75)#26,368 |
| 86. | 77056 | 0.59% | 3.6%(-2.97)#1,530 | 3.5%(-2.89)#26,739 |
| 87. | 77007 | 0.44% | 3.6%(-3.12)#1,556 | 3.5%(-3.04)#27,118 |
| 88. | 77005 | 0.34% | 3.6%(-3.22)#1,571 | 3.5%(-3.14)#27,305 |
| 89. | 77006 | 0.34% | 3.6%(-3.22)#1,574 | 3.5%(-3.14)#27,313 |
| 90. | 77098 | 0.33% | 3.6%(-3.23)#1,575 | 3.5%(-3.15)#27,333 |
| 91. | 77024 | 0.27% | 3.6%(-3.29)#1,580 | 3.5%(-3.21)#27,402 |
| 92. | 77027 | 0.27% | 3.6%(-3.29)#1,581 | 3.5%(-3.21)#27,403 |
| 93. | 77204 | 0.19% | 3.6%(-3.37)#1,597 | 3.5%(-3.29)#27,500 |
| 94. | 77030 | 0.13% | 3.6%(-3.43)#1,600 | 3.5%(-3.35)#27,555 |
1
Common Questions
What are the Top 10 Zip Codes with the Highest Percentage of Population Employed in Cleaning & Maintenance in Houston, TX?
Top 10 Zip Codes with the Highest Percentage of Population Employed in Cleaning & Maintenance in Houston, TX are:
What zip code has the Highest Percentage of Population Employed in Cleaning & Maintenance in Houston, TX?
77050 has the Highest Percentage of Population Employed in Cleaning & Maintenance in Houston, TX with 28.8%.
What is the Percentage of Population Employed in Cleaning & Maintenance in Houston, TX?
Percentage of Population Employed in Cleaning & Maintenance in Houston is 5.0%.
What is the Percentage of Population Employed in Cleaning & Maintenance in Texas?
Percentage of Population Employed in Cleaning & Maintenance in Texas is 3.6%.
What is the Percentage of Population Employed in Cleaning & Maintenance in the United States?
Percentage of Population Employed in Cleaning & Maintenance in the United States is 3.5%.