Zip Codes with the Highest Poverty Level Among Children Under the Age of 5 in Houston, TX
RELATED REPORTS & OPTIONS
Highest Poverty | Child 0-5
Houston
Compare Zip Codes
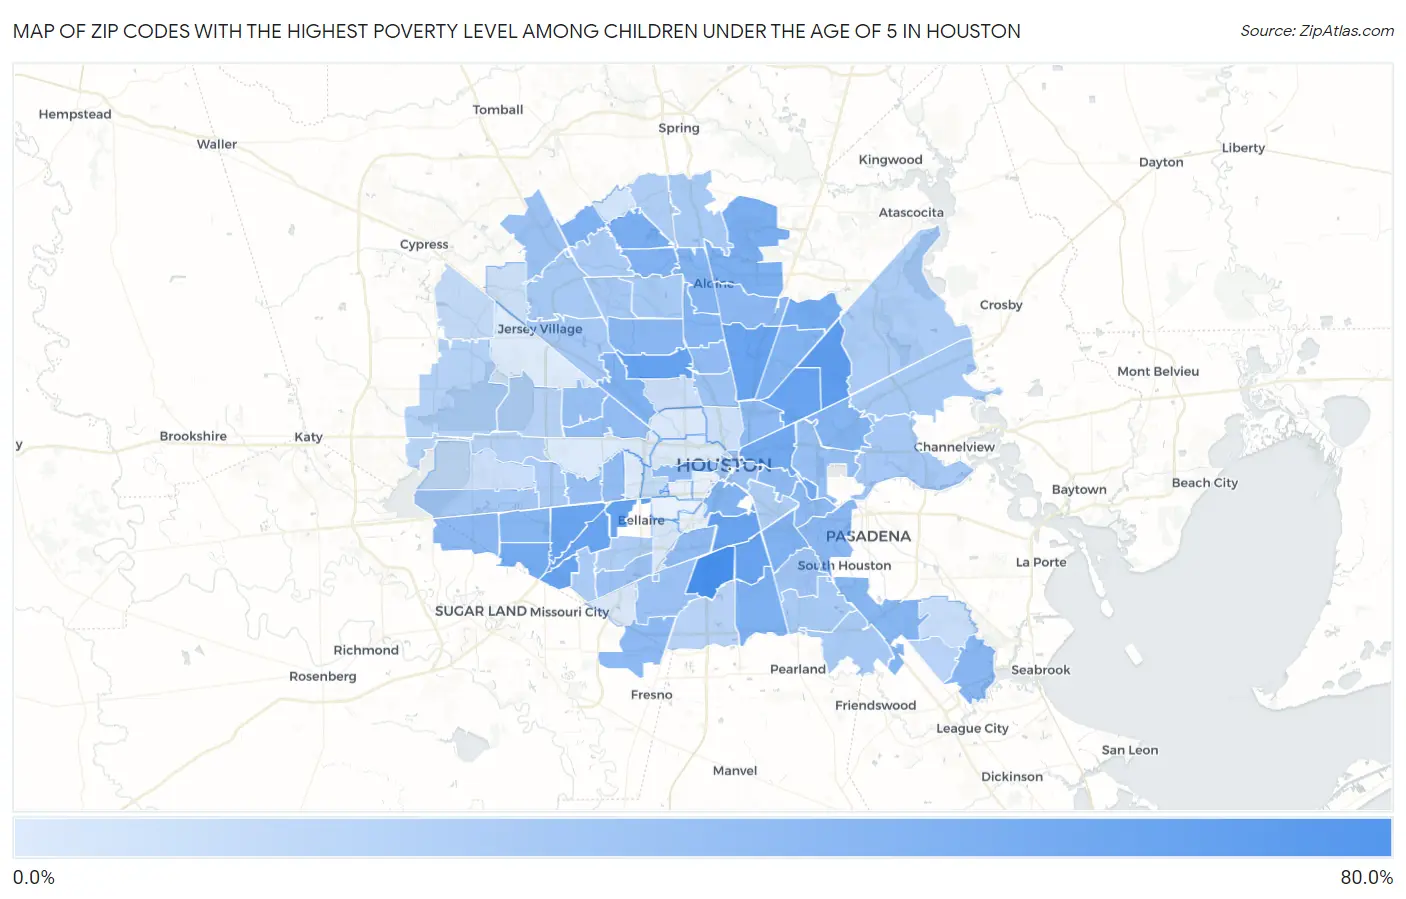
Map of Zip Codes with the Highest Poverty Level Among Children Under the Age of 5 in Houston
1.8%
73.8%
Zip Codes with the Highest Poverty Level Among Children Under the Age of 5 in Houston, TX
| Zip Code | Child Poverty | vs State | vs National | |
| 1. | 77051 | 73.8% | 21.1%(+52.8)#44 | 18.1%(+55.8)#1,013 |
| 2. | 77078 | 60.3% | 21.1%(+39.2)#82 | 18.1%(+42.2)#1,659 |
| 3. | 77091 | 56.5% | 21.1%(+35.4)#102 | 18.1%(+38.5)#1,942 |
| 4. | 77081 | 55.7% | 21.1%(+34.6)#107 | 18.1%(+37.7)#2,009 |
| 5. | 77033 | 55.0% | 21.1%(+34.0)#113 | 18.1%(+37.0)#2,066 |
| 6. | 77093 | 54.2% | 21.1%(+33.1)#115 | 18.1%(+36.2)#2,123 |
| 7. | 77028 | 54.0% | 21.1%(+32.9)#116 | 18.1%(+35.9)#2,141 |
| 8. | 77021 | 54.0% | 21.1%(+32.9)#117 | 18.1%(+35.9)#2,145 |
| 9. | 77036 | 53.9% | 21.1%(+32.8)#118 | 18.1%(+35.8)#2,153 |
| 10. | 77031 | 53.2% | 21.1%(+32.1)#122 | 18.1%(+35.1)#2,234 |
| 11. | 77074 | 53.1% | 21.1%(+32.1)#123 | 18.1%(+35.1)#2,237 |
| 12. | 77020 | 48.8% | 21.1%(+27.7)#149 | 18.1%(+30.8)#2,715 |
| 13. | 77099 | 47.9% | 21.1%(+26.8)#153 | 18.1%(+29.8)#2,820 |
| 14. | 77050 | 47.0% | 21.1%(+25.9)#160 | 18.1%(+29.0)#2,922 |
| 15. | 77014 | 45.3% | 21.1%(+24.2)#175 | 18.1%(+27.2)#3,137 |
| 16. | 77032 | 44.2% | 21.1%(+23.1)#188 | 18.1%(+26.1)#3,312 |
| 17. | 77048 | 42.3% | 21.1%(+21.2)#210 | 18.1%(+24.2)#3,615 |
| 18. | 77069 | 41.6% | 21.1%(+20.5)#223 | 18.1%(+23.5)#3,728 |
| 19. | 77087 | 41.3% | 21.1%(+20.2)#229 | 18.1%(+23.3)#3,773 |
| 20. | 77092 | 41.3% | 21.1%(+20.2)#230 | 18.1%(+23.3)#3,776 |
| 21. | 77067 | 41.1% | 21.1%(+20.0)#232 | 18.1%(+23.0)#3,812 |
| 22. | 77016 | 40.5% | 21.1%(+19.4)#249 | 18.1%(+22.5)#3,930 |
| 23. | 77004 | 39.9% | 21.1%(+18.9)#254 | 18.1%(+21.9)#4,047 |
| 24. | 77037 | 39.0% | 21.1%(+17.9)#271 | 18.1%(+20.9)#4,218 |
| 25. | 77060 | 38.9% | 21.1%(+17.8)#273 | 18.1%(+20.8)#4,236 |
| 26. | 77013 | 38.7% | 21.1%(+17.6)#276 | 18.1%(+20.7)#4,261 |
| 27. | 77034 | 38.3% | 21.1%(+17.2)#284 | 18.1%(+20.2)#4,347 |
| 28. | 77072 | 38.0% | 21.1%(+16.9)#290 | 18.1%(+19.9)#4,412 |
| 29. | 77017 | 37.4% | 21.1%(+16.4)#296 | 18.1%(+19.4)#4,513 |
| 30. | 77058 | 37.1% | 21.1%(+16.0)#301 | 18.1%(+19.0)#4,581 |
| 31. | 77088 | 36.9% | 21.1%(+15.8)#304 | 18.1%(+18.8)#4,616 |
| 32. | 77039 | 35.6% | 21.1%(+14.5)#322 | 18.1%(+17.6)#4,921 |
| 33. | 77083 | 35.4% | 21.1%(+14.3)#330 | 18.1%(+17.3)#4,980 |
| 34. | 77012 | 34.9% | 21.1%(+13.8)#336 | 18.1%(+16.9)#5,086 |
| 35. | 77011 | 34.9% | 21.1%(+13.8)#338 | 18.1%(+16.8)#5,093 |
| 36. | 77026 | 34.7% | 21.1%(+13.7)#341 | 18.1%(+16.7)#5,131 |
| 37. | 77053 | 34.6% | 21.1%(+13.5)#342 | 18.1%(+16.6)#5,159 |
| 38. | 77054 | 33.7% | 21.1%(+12.7)#359 | 18.1%(+15.7)#5,361 |
| 39. | 77019 | 33.6% | 21.1%(+12.5)#363 | 18.1%(+15.6)#5,387 |
| 40. | 77076 | 33.4% | 21.1%(+12.3)#372 | 18.1%(+15.3)#5,428 |
| 41. | 77057 | 32.1% | 21.1%(+11.0)#396 | 18.1%(+14.0)#5,822 |
| 42. | 77055 | 32.0% | 21.1%(+10.9)#398 | 18.1%(+14.0)#5,837 |
| 43. | 77080 | 30.8% | 21.1%(+9.75)#420 | 18.1%(+12.8)#6,137 |
| 44. | 77063 | 30.0% | 21.1%(+8.93)#442 | 18.1%(+12.0)#6,336 |
| 45. | 77029 | 29.9% | 21.1%(+8.79)#448 | 18.1%(+11.8)#6,384 |
| 46. | 77035 | 29.7% | 21.1%(+8.62)#453 | 18.1%(+11.6)#6,447 |
| 47. | 77045 | 29.6% | 21.1%(+8.50)#456 | 18.1%(+11.5)#6,486 |
| 48. | 77003 | 29.4% | 21.1%(+8.36)#459 | 18.1%(+11.4)#6,517 |
| 49. | 77002 | 28.2% | 21.1%(+7.15)#495 | 18.1%(+10.2)#6,903 |
| 50. | 77070 | 28.2% | 21.1%(+7.09)#497 | 18.1%(+10.1)#6,923 |
| 51. | 77022 | 27.3% | 21.1%(+6.26)#523 | 18.1%(+9.29)#7,185 |
| 52. | 77061 | 25.8% | 21.1%(+4.70)#568 | 18.1%(+7.72)#7,714 |
| 53. | 77015 | 23.9% | 21.1%(+2.86)#606 | 18.1%(+5.89)#8,367 |
| 54. | 77082 | 23.9% | 21.1%(+2.81)#607 | 18.1%(+5.83)#8,398 |
| 55. | 77040 | 23.7% | 21.1%(+2.63)#614 | 18.1%(+5.65)#8,480 |
| 56. | 77086 | 23.5% | 21.1%(+2.46)#622 | 18.1%(+5.48)#8,554 |
| 57. | 77075 | 23.2% | 21.1%(+2.12)#631 | 18.1%(+5.14)#8,683 |
| 58. | 77049 | 23.0% | 21.1%(+1.91)#639 | 18.1%(+4.93)#8,770 |
| 59. | 77073 | 23.0% | 21.1%(+1.87)#640 | 18.1%(+4.89)#8,786 |
| 60. | 77064 | 22.9% | 21.1%(+1.85)#641 | 18.1%(+4.88)#8,788 |
| 61. | 77038 | 22.7% | 21.1%(+1.66)#644 | 18.1%(+4.68)#8,862 |
| 62. | 77089 | 22.7% | 21.1%(+1.63)#645 | 18.1%(+4.65)#8,881 |
| 63. | 77066 | 22.1% | 21.1%(+0.990)#661 | 18.1%(+4.01)#9,164 |
| 64. | 77042 | 21.9% | 21.1%(+0.828)#665 | 18.1%(+3.85)#9,230 |
| 65. | 77071 | 21.3% | 21.1%(+0.224)#680 | 18.1%(+3.25)#9,479 |
| 66. | 77044 | 21.1% | 21.1%(+0.025)#685 | 18.1%(+3.05)#9,548 |
| 67. | 77096 | 20.2% | 21.1%(-0.896)#710 | 18.1%(+2.13)#9,946 |
| 68. | 77090 | 20.1% | 21.1%(-0.946)#711 | 18.1%(+2.08)#9,960 |
| 69. | 77023 | 19.6% | 21.1%(-1.44)#724 | 18.1%(+1.59)#10,203 |
| 70. | 77079 | 17.2% | 21.1%(-3.91)#792 | 18.1%(-0.888)#11,342 |
| 71. | 77084 | 16.7% | 21.1%(-4.39)#802 | 18.1%(-1.37)#11,527 |
| 72. | 77062 | 16.6% | 21.1%(-4.49)#806 | 18.1%(-1.47)#11,596 |
| 73. | 77043 | 16.6% | 21.1%(-4.51)#807 | 18.1%(-1.49)#11,606 |
| 74. | 77047 | 16.2% | 21.1%(-4.84)#818 | 18.1%(-1.81)#11,789 |
| 75. | 77094 | 14.9% | 21.1%(-6.23)#877 | 18.1%(-3.21)#12,554 |
| 76. | 77095 | 11.4% | 21.1%(-9.73)#1,006 | 18.1%(-6.71)#14,609 |
| 77. | 77027 | 10.8% | 21.1%(-10.3)#1,028 | 18.1%(-7.29)#14,962 |
| 78. | 77059 | 10.1% | 21.1%(-11.0)#1,054 | 18.1%(-7.98)#15,360 |
| 79. | 77018 | 8.8% | 21.1%(-12.3)#1,099 | 18.1%(-9.26)#16,193 |
| 80. | 77077 | 8.6% | 21.1%(-12.5)#1,104 | 18.1%(-9.45)#16,329 |
| 81. | 77009 | 8.2% | 21.1%(-12.9)#1,117 | 18.1%(-9.86)#16,635 |
| 82. | 77065 | 7.8% | 21.1%(-13.3)#1,129 | 18.1%(-10.3)#16,876 |
| 83. | 77068 | 5.2% | 21.1%(-15.9)#1,221 | 18.1%(-12.9)#18,638 |
| 84. | 77085 | 3.2% | 21.1%(-17.9)#1,291 | 18.1%(-14.9)#20,055 |
| 85. | 77025 | 2.7% | 21.1%(-18.4)#1,307 | 18.1%(-15.4)#20,384 |
| 86. | 77008 | 2.2% | 21.1%(-18.8)#1,321 | 18.1%(-15.8)#20,671 |
| 87. | 77024 | 2.1% | 21.1%(-18.9)#1,322 | 18.1%(-15.9)#20,738 |
| 88. | 77007 | 1.9% | 21.1%(-19.2)#1,325 | 18.1%(-16.2)#20,906 |
| 89. | 77041 | 1.8% | 21.1%(-19.2)#1,327 | 18.1%(-16.2)#20,938 |
| 90. | 77056 | 1.8% | 21.1%(-19.3)#1,328 | 18.1%(-16.2)#20,954 |
1
Common Questions
What are the Top 10 Zip Codes with the Highest Poverty Level Among Children Under the Age of 5 in Houston, TX?
Top 10 Zip Codes with the Highest Poverty Level Among Children Under the Age of 5 in Houston, TX are:
What zip code has the Highest Poverty Level Among Children Under the Age of 5 in Houston, TX?
77051 has the Highest Poverty Level Among Children Under the Age of 5 in Houston, TX with 73.8%.
What is the Poverty Level Among Children Under the Age of 5 in Houston, TX?
Poverty Level Among Children Under the Age of 5 in Houston is 31.0%.
What is the Poverty Level Among Children Under the Age of 5 in Texas?
Poverty Level Among Children Under the Age of 5 in Texas is 21.1%.
What is the Poverty Level Among Children Under the Age of 5 in the United States?
Poverty Level Among Children Under the Age of 5 in the United States is 18.1%.