Zip Codes with the Highest Percentage of Population Employed in Computer & Mathematics in Houston, TX
RELATED REPORTS & OPTIONS
Computer & Mathematics
Houston
Compare Zip Codes
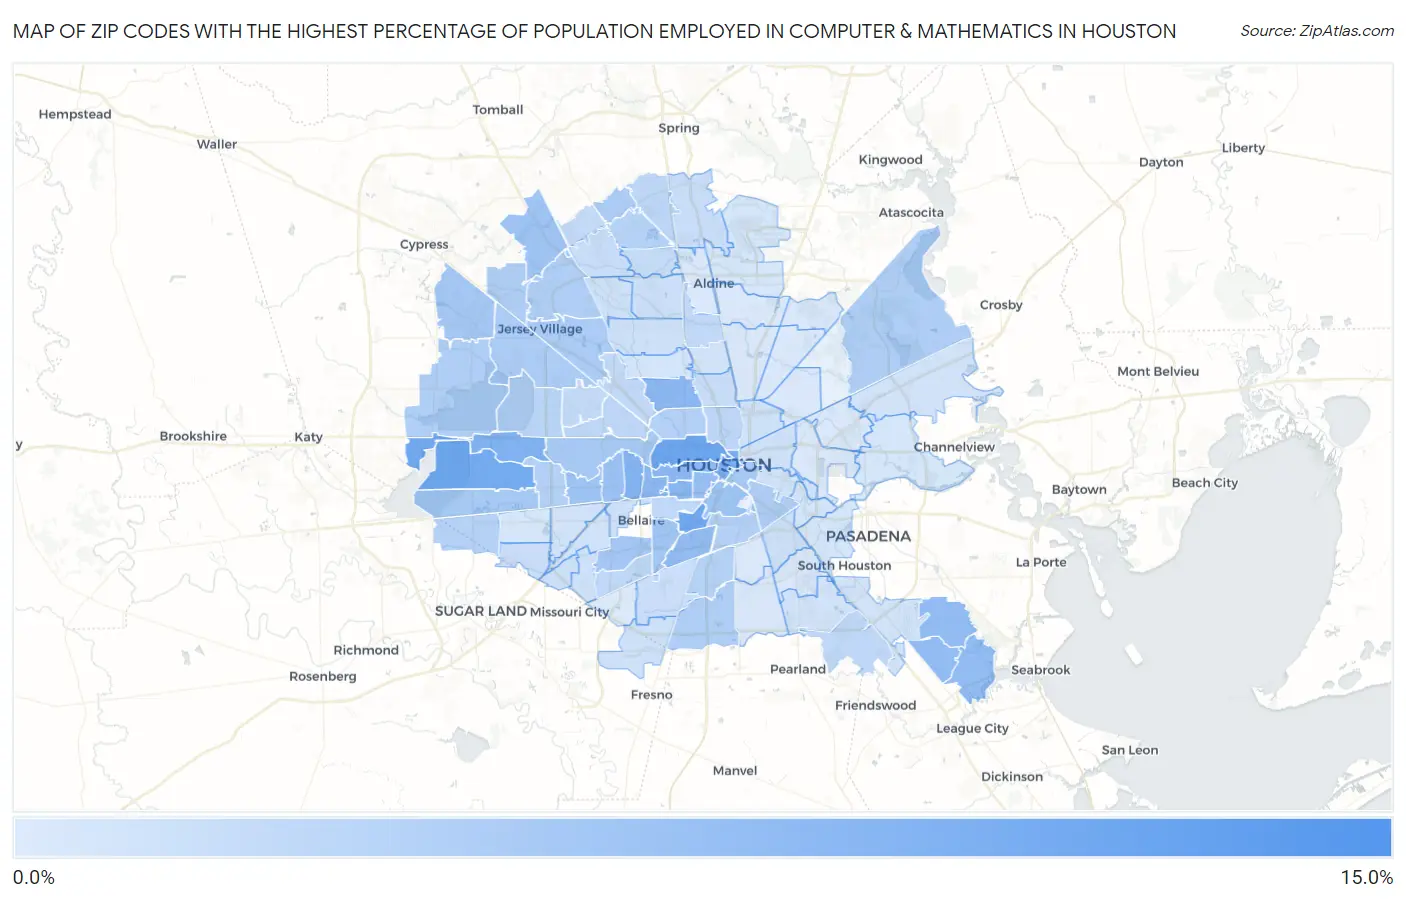
Map of Zip Codes with the Highest Percentage of Population Employed in Computer & Mathematics in Houston
0.32%
10.3%
Zip Codes with the Highest Percentage of Population Employed in Computer & Mathematics in Houston, TX
| Zip Code | % Employed | vs State | vs National | |
| 1. | 77046 | 10.3% | 3.4%(+6.85)#44 | 3.5%(+6.76)#663 |
| 2. | 77007 | 7.7% | 3.4%(+4.22)#89 | 3.5%(+4.13)#1,333 |
| 3. | 77030 | 7.5% | 3.4%(+4.05)#94 | 3.5%(+3.96)#1,393 |
| 4. | 77094 | 7.3% | 3.4%(+3.91)#98 | 3.5%(+3.82)#1,445 |
| 5. | 77077 | 7.1% | 3.4%(+3.67)#109 | 3.5%(+3.58)#1,569 |
| 6. | 77002 | 6.6% | 3.4%(+3.14)#120 | 3.5%(+3.05)#1,872 |
| 7. | 77079 | 6.3% | 3.4%(+2.83)#128 | 3.5%(+2.74)#2,104 |
| 8. | 77056 | 6.2% | 3.4%(+2.80)#130 | 3.5%(+2.71)#2,123 |
| 9. | 77098 | 5.9% | 3.4%(+2.47)#143 | 3.5%(+2.38)#2,402 |
| 10. | 77027 | 5.6% | 3.4%(+2.15)#160 | 3.5%(+2.06)#2,695 |
| 11. | 77019 | 5.5% | 3.4%(+2.08)#163 | 3.5%(+1.99)#2,770 |
| 12. | 77018 | 5.5% | 3.4%(+2.08)#164 | 3.5%(+1.99)#2,771 |
| 13. | 77058 | 5.2% | 3.4%(+1.74)#180 | 3.5%(+1.65)#3,159 |
| 14. | 77059 | 5.1% | 3.4%(+1.67)#184 | 3.5%(+1.58)#3,222 |
| 15. | 77054 | 5.1% | 3.4%(+1.62)#190 | 3.5%(+1.54)#3,287 |
| 16. | 77062 | 5.0% | 3.4%(+1.60)#191 | 3.5%(+1.52)#3,318 |
| 17. | 77006 | 4.8% | 3.4%(+1.32)#218 | 3.5%(+1.23)#3,703 |
| 18. | 77057 | 4.5% | 3.4%(+1.04)#236 | 3.5%(+0.951)#4,123 |
| 19. | 77004 | 4.4% | 3.4%(+0.922)#247 | 3.5%(+0.833)#4,332 |
| 20. | 77063 | 4.3% | 3.4%(+0.881)#250 | 3.5%(+0.792)#4,403 |
| 21. | 77070 | 4.2% | 3.4%(+0.744)#266 | 3.5%(+0.655)#4,647 |
| 22. | 77025 | 4.0% | 3.4%(+0.575)#290 | 3.5%(+0.487)#5,015 |
| 23. | 77095 | 3.9% | 3.4%(+0.492)#298 | 3.5%(+0.403)#5,196 |
| 24. | 77096 | 3.8% | 3.4%(+0.388)#302 | 3.5%(+0.299)#5,415 |
| 25. | 77024 | 3.8% | 3.4%(+0.368)#307 | 3.5%(+0.280)#5,470 |
| 26. | 77082 | 3.8% | 3.4%(+0.338)#309 | 3.5%(+0.249)#5,547 |
| 27. | 77003 | 3.7% | 3.4%(+0.245)#320 | 3.5%(+0.156)#5,779 |
| 28. | 77040 | 3.5% | 3.4%(+0.068)#339 | 3.5%(-0.021)#6,197 |
| 29. | 77068 | 3.5% | 3.4%(+0.029)#348 | 3.5%(-0.060)#6,296 |
| 30. | 77041 | 3.4% | 3.4%(-0.023)#355 | 3.5%(-0.112)#6,450 |
| 31. | 77044 | 3.4% | 3.4%(-0.085)#367 | 3.5%(-0.174)#6,622 |
| 32. | 77065 | 3.2% | 3.4%(-0.210)#382 | 3.5%(-0.298)#7,008 |
| 33. | 77023 | 3.2% | 3.4%(-0.210)#383 | 3.5%(-0.299)#7,010 |
| 34. | 77064 | 3.1% | 3.4%(-0.287)#400 | 3.5%(-0.376)#7,270 |
| 35. | 77047 | 3.1% | 3.4%(-0.292)#402 | 3.5%(-0.380)#7,281 |
| 36. | 77084 | 3.1% | 3.4%(-0.344)#410 | 3.5%(-0.433)#7,433 |
| 37. | 77021 | 3.0% | 3.4%(-0.401)#416 | 3.5%(-0.489)#7,618 |
| 38. | 77008 | 3.0% | 3.4%(-0.431)#421 | 3.5%(-0.520)#7,724 |
| 39. | 77042 | 3.0% | 3.4%(-0.456)#426 | 3.5%(-0.544)#7,814 |
| 40. | 77051 | 2.9% | 3.4%(-0.573)#446 | 3.5%(-0.662)#8,238 |
| 41. | 77014 | 2.8% | 3.4%(-0.597)#450 | 3.5%(-0.686)#8,312 |
| 42. | 77083 | 2.8% | 3.4%(-0.600)#452 | 3.5%(-0.688)#8,323 |
| 43. | 77043 | 2.5% | 3.4%(-0.909)#507 | 3.5%(-0.998)#9,529 |
| 44. | 77055 | 2.4% | 3.4%(-1.00)#532 | 3.5%(-1.09)#9,915 |
| 45. | 77090 | 2.4% | 3.4%(-1.06)#545 | 3.5%(-1.15)#10,147 |
| 46. | 77009 | 2.3% | 3.4%(-1.12)#560 | 3.5%(-1.21)#10,375 |
| 47. | 77089 | 2.3% | 3.4%(-1.12)#562 | 3.5%(-1.21)#10,386 |
| 48. | 77005 | 2.3% | 3.4%(-1.16)#574 | 3.5%(-1.25)#10,572 |
| 49. | 77035 | 2.2% | 3.4%(-1.25)#594 | 3.5%(-1.34)#10,964 |
| 50. | 77092 | 2.1% | 3.4%(-1.34)#608 | 3.5%(-1.43)#11,347 |
| 51. | 77037 | 2.1% | 3.4%(-1.34)#609 | 3.5%(-1.43)#11,350 |
| 52. | 77080 | 1.9% | 3.4%(-1.54)#655 | 3.5%(-1.63)#12,312 |
| 53. | 77069 | 1.9% | 3.4%(-1.56)#660 | 3.5%(-1.65)#12,399 |
| 54. | 77067 | 1.7% | 3.4%(-1.71)#699 | 3.5%(-1.80)#13,118 |
| 55. | 77066 | 1.7% | 3.4%(-1.74)#709 | 3.5%(-1.83)#13,272 |
| 56. | 77022 | 1.7% | 3.4%(-1.77)#724 | 3.5%(-1.86)#13,422 |
| 57. | 77073 | 1.6% | 3.4%(-1.80)#734 | 3.5%(-1.89)#13,607 |
| 58. | 77045 | 1.6% | 3.4%(-1.87)#754 | 3.5%(-1.96)#14,022 |
| 59. | 77099 | 1.6% | 3.4%(-1.88)#755 | 3.5%(-1.97)#14,030 |
| 60. | 77038 | 1.4% | 3.4%(-2.01)#798 | 3.5%(-2.10)#14,810 |
| 61. | 77031 | 1.4% | 3.4%(-2.06)#816 | 3.5%(-2.15)#15,087 |
| 62. | 77087 | 1.4% | 3.4%(-2.08)#821 | 3.5%(-2.17)#15,196 |
| 63. | 77010 | 1.3% | 3.4%(-2.11)#831 | 3.5%(-2.20)#15,359 |
| 64. | 77053 | 1.3% | 3.4%(-2.16)#851 | 3.5%(-2.25)#15,694 |
| 65. | 77081 | 1.2% | 3.4%(-2.19)#862 | 3.5%(-2.28)#15,841 |
| 66. | 77086 | 1.2% | 3.4%(-2.20)#867 | 3.5%(-2.29)#15,945 |
| 67. | 77088 | 1.2% | 3.4%(-2.21)#874 | 3.5%(-2.30)#15,991 |
| 68. | 77026 | 1.2% | 3.4%(-2.25)#891 | 3.5%(-2.33)#16,190 |
| 69. | 77020 | 1.2% | 3.4%(-2.27)#898 | 3.5%(-2.36)#16,329 |
| 70. | 77071 | 1.1% | 3.4%(-2.30)#909 | 3.5%(-2.38)#16,481 |
| 71. | 77074 | 1.1% | 3.4%(-2.31)#916 | 3.5%(-2.40)#16,574 |
| 72. | 77075 | 1.1% | 3.4%(-2.34)#928 | 3.5%(-2.43)#16,764 |
| 73. | 77049 | 1.1% | 3.4%(-2.35)#932 | 3.5%(-2.44)#16,859 |
| 74. | 77034 | 1.0% | 3.4%(-2.40)#950 | 3.5%(-2.48)#17,136 |
| 75. | 77011 | 1.0% | 3.4%(-2.43)#965 | 3.5%(-2.52)#17,340 |
| 76. | 77036 | 1.0% | 3.4%(-2.43)#966 | 3.5%(-2.52)#17,367 |
| 77. | 77076 | 1.0% | 3.4%(-2.44)#968 | 3.5%(-2.52)#17,384 |
| 78. | 77091 | 0.97% | 3.4%(-2.46)#981 | 3.5%(-2.55)#17,539 |
| 79. | 77012 | 0.92% | 3.4%(-2.51)#1,007 | 3.5%(-2.60)#17,880 |
| 80. | 77032 | 0.78% | 3.4%(-2.65)#1,058 | 3.5%(-2.74)#18,728 |
| 81. | 77015 | 0.77% | 3.4%(-2.66)#1,062 | 3.5%(-2.75)#18,805 |
| 82. | 77072 | 0.73% | 3.4%(-2.71)#1,079 | 3.5%(-2.80)#19,084 |
| 83. | 77017 | 0.72% | 3.4%(-2.72)#1,084 | 3.5%(-2.81)#19,152 |
| 84. | 77093 | 0.61% | 3.4%(-2.83)#1,132 | 3.5%(-2.92)#19,815 |
| 85. | 77050 | 0.60% | 3.4%(-2.83)#1,134 | 3.5%(-2.92)#19,863 |
| 86. | 77048 | 0.55% | 3.4%(-2.88)#1,152 | 3.5%(-2.97)#20,149 |
| 87. | 77029 | 0.50% | 3.4%(-2.94)#1,178 | 3.5%(-3.03)#20,496 |
| 88. | 77028 | 0.47% | 3.4%(-2.96)#1,186 | 3.5%(-3.05)#20,648 |
| 89. | 77060 | 0.47% | 3.4%(-2.96)#1,188 | 3.5%(-3.05)#20,670 |
| 90. | 77039 | 0.44% | 3.4%(-2.99)#1,198 | 3.5%(-3.08)#20,833 |
| 91. | 77016 | 0.44% | 3.4%(-3.00)#1,203 | 3.5%(-3.09)#20,872 |
| 92. | 77033 | 0.43% | 3.4%(-3.01)#1,204 | 3.5%(-3.10)#20,914 |
| 93. | 77061 | 0.41% | 3.4%(-3.02)#1,213 | 3.5%(-3.11)#20,991 |
| 94. | 77013 | 0.41% | 3.4%(-3.03)#1,214 | 3.5%(-3.11)#21,001 |
| 95. | 77085 | 0.32% | 3.4%(-3.11)#1,252 | 3.5%(-3.20)#21,506 |
1
Common Questions
What are the Top 10 Zip Codes with the Highest Percentage of Population Employed in Computer & Mathematics in Houston, TX?
Top 10 Zip Codes with the Highest Percentage of Population Employed in Computer & Mathematics in Houston, TX are:
What zip code has the Highest Percentage of Population Employed in Computer & Mathematics in Houston, TX?
77046 has the Highest Percentage of Population Employed in Computer & Mathematics in Houston, TX with 10.3%.
What is the Percentage of Population Employed in Computer & Mathematics in Houston, TX?
Percentage of Population Employed in Computer & Mathematics in Houston is 2.9%.
What is the Percentage of Population Employed in Computer & Mathematics in Texas?
Percentage of Population Employed in Computer & Mathematics in Texas is 3.4%.
What is the Percentage of Population Employed in Computer & Mathematics in the United States?
Percentage of Population Employed in Computer & Mathematics in the United States is 3.5%.