Zip Codes with the Highest Percentage of Population Employed in Architecture & Engineering in Houston, TX
RELATED REPORTS & OPTIONS
Architecture & Engineering
Houston
Compare Zip Codes
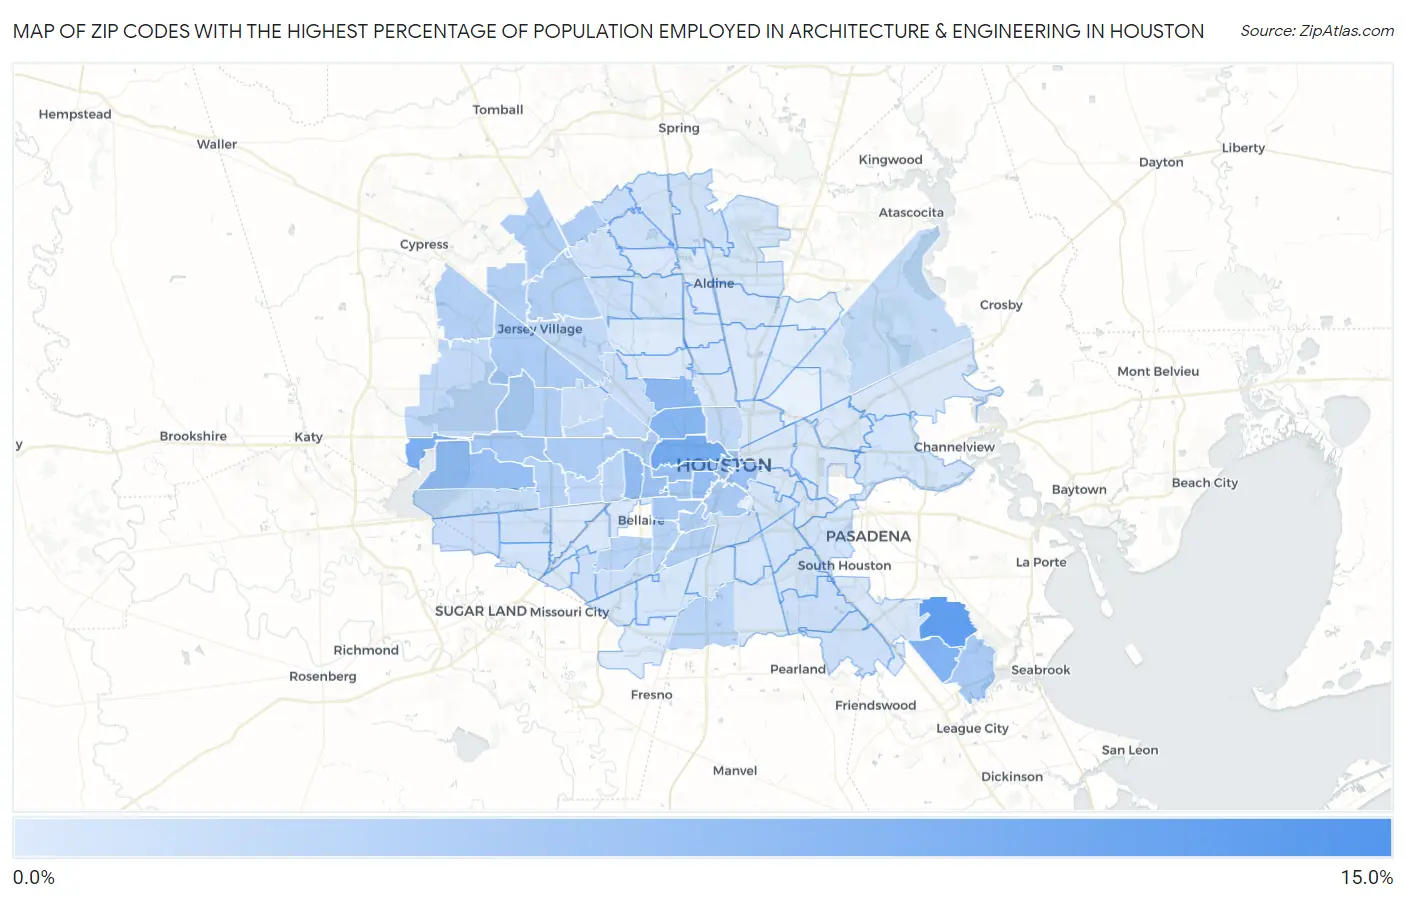
Map of Zip Codes with the Highest Percentage of Population Employed in Architecture & Engineering in Houston
0.29%
14.0%
Zip Codes with the Highest Percentage of Population Employed in Architecture & Engineering in Houston, TX
| Zip Code | % Employed | vs State | vs National | |
| 1. | 77046 | 14.0% | 2.2%(+11.7)#8 | 2.1%(+11.8)#175 |
| 2. | 77059 | 11.6% | 2.2%(+9.37)#11 | 2.1%(+9.44)#256 |
| 3. | 77007 | 9.6% | 2.2%(+7.39)#16 | 2.1%(+7.46)#368 |
| 4. | 77094 | 8.7% | 2.2%(+6.53)#21 | 2.1%(+6.60)#452 |
| 5. | 77062 | 8.5% | 2.2%(+6.25)#24 | 2.1%(+6.33)#486 |
| 6. | 77008 | 7.9% | 2.2%(+5.70)#30 | 2.1%(+5.77)#586 |
| 7. | 77018 | 7.1% | 2.2%(+4.91)#36 | 2.1%(+4.98)#718 |
| 8. | 77056 | 7.0% | 2.2%(+4.76)#40 | 2.1%(+4.84)#753 |
| 9. | 77006 | 6.5% | 2.2%(+4.26)#45 | 2.1%(+4.34)#894 |
| 10. | 77019 | 6.5% | 2.2%(+4.23)#46 | 2.1%(+4.30)#907 |
| 11. | 77077 | 6.3% | 2.2%(+4.08)#47 | 2.1%(+4.16)#956 |
| 12. | 77003 | 6.0% | 2.2%(+3.76)#57 | 2.1%(+3.83)#1,088 |
| 13. | 77027 | 5.7% | 2.2%(+3.52)#65 | 2.1%(+3.60)#1,199 |
| 14. | 77002 | 5.6% | 2.2%(+3.43)#67 | 2.1%(+3.50)#1,244 |
| 15. | 77098 | 5.1% | 2.2%(+2.93)#85 | 2.1%(+3.00)#1,561 |
| 16. | 77079 | 5.1% | 2.2%(+2.91)#87 | 2.1%(+2.98)#1,580 |
| 17. | 77005 | 5.0% | 2.2%(+2.76)#92 | 2.1%(+2.84)#1,670 |
| 18. | 77010 | 4.9% | 2.2%(+2.65)#101 | 2.1%(+2.72)#1,771 |
| 19. | 77004 | 4.8% | 2.2%(+2.54)#103 | 2.1%(+2.62)#1,861 |
| 20. | 77058 | 4.8% | 2.2%(+2.54)#104 | 2.1%(+2.61)#1,865 |
| 21. | 77041 | 4.5% | 2.2%(+2.26)#117 | 2.1%(+2.33)#2,154 |
| 22. | 77024 | 4.4% | 2.2%(+2.22)#118 | 2.1%(+2.29)#2,201 |
| 23. | 77069 | 4.2% | 2.2%(+1.94)#128 | 2.1%(+2.02)#2,525 |
| 24. | 77030 | 4.0% | 2.2%(+1.81)#144 | 2.1%(+1.89)#2,722 |
| 25. | 77043 | 4.0% | 2.2%(+1.77)#148 | 2.1%(+1.84)#2,775 |
| 26. | 77070 | 3.9% | 2.2%(+1.70)#158 | 2.1%(+1.77)#2,903 |
| 27. | 77054 | 3.9% | 2.2%(+1.69)#161 | 2.1%(+1.76)#2,917 |
| 28. | 77095 | 3.8% | 2.2%(+1.56)#172 | 2.1%(+1.64)#3,124 |
| 29. | 77065 | 3.7% | 2.2%(+1.53)#175 | 2.1%(+1.60)#3,200 |
| 30. | 77042 | 3.7% | 2.2%(+1.51)#178 | 2.1%(+1.59)#3,226 |
| 31. | 77064 | 3.7% | 2.2%(+1.50)#180 | 2.1%(+1.57)#3,256 |
| 32. | 77096 | 3.3% | 2.2%(+1.08)#239 | 2.1%(+1.15)#4,185 |
| 33. | 77025 | 3.2% | 2.2%(+0.984)#255 | 2.1%(+1.06)#4,446 |
| 34. | 77047 | 3.2% | 2.2%(+0.982)#256 | 2.1%(+1.05)#4,453 |
| 35. | 77057 | 3.2% | 2.2%(+0.954)#262 | 2.1%(+1.03)#4,525 |
| 36. | 77063 | 2.9% | 2.2%(+0.718)#309 | 2.1%(+0.791)#5,275 |
| 37. | 77055 | 2.9% | 2.2%(+0.685)#312 | 2.1%(+0.758)#5,393 |
| 38. | 77040 | 2.7% | 2.2%(+0.514)#334 | 2.1%(+0.587)#6,014 |
| 39. | 77084 | 2.7% | 2.2%(+0.471)#347 | 2.1%(+0.544)#6,190 |
| 40. | 77009 | 2.6% | 2.2%(+0.394)#357 | 2.1%(+0.467)#6,509 |
| 41. | 77044 | 2.5% | 2.2%(+0.325)#370 | 2.1%(+0.398)#6,802 |
| 42. | 77082 | 2.3% | 2.2%(+0.063)#436 | 2.1%(+0.136)#8,030 |
| 43. | 77068 | 2.1% | 2.2%(-0.130)#496 | 2.1%(-0.057)#9,092 |
| 44. | 77092 | 1.9% | 2.2%(-0.299)#551 | 2.1%(-0.226)#10,079 |
| 45. | 77083 | 1.8% | 2.2%(-0.398)#575 | 2.1%(-0.325)#10,697 |
| 46. | 77089 | 1.8% | 2.2%(-0.468)#600 | 2.1%(-0.396)#11,115 |
| 47. | 77075 | 1.7% | 2.2%(-0.526)#627 | 2.1%(-0.453)#11,519 |
| 48. | 77071 | 1.6% | 2.2%(-0.588)#658 | 2.1%(-0.515)#11,950 |
| 49. | 77086 | 1.6% | 2.2%(-0.614)#664 | 2.1%(-0.541)#12,132 |
| 50. | 77080 | 1.6% | 2.2%(-0.618)#666 | 2.1%(-0.545)#12,162 |
| 51. | 77035 | 1.6% | 2.2%(-0.633)#675 | 2.1%(-0.560)#12,256 |
| 52. | 77014 | 1.5% | 2.2%(-0.684)#687 | 2.1%(-0.611)#12,589 |
| 53. | 77073 | 1.5% | 2.2%(-0.726)#709 | 2.1%(-0.653)#12,905 |
| 54. | 77072 | 1.4% | 2.2%(-0.797)#733 | 2.1%(-0.725)#13,395 |
| 55. | 77021 | 1.4% | 2.2%(-0.821)#744 | 2.1%(-0.748)#13,575 |
| 56. | 77066 | 1.3% | 2.2%(-0.934)#782 | 2.1%(-0.861)#14,389 |
| 57. | 77090 | 1.2% | 2.2%(-1.03)#812 | 2.1%(-0.957)#15,144 |
| 58. | 77023 | 1.1% | 2.2%(-1.09)#833 | 2.1%(-1.02)#15,600 |
| 59. | 77038 | 1.1% | 2.2%(-1.13)#852 | 2.1%(-1.06)#15,958 |
| 60. | 77099 | 1.1% | 2.2%(-1.16)#866 | 2.1%(-1.09)#16,181 |
| 61. | 77087 | 1.1% | 2.2%(-1.17)#871 | 2.1%(-1.10)#16,237 |
| 62. | 77076 | 1.0% | 2.2%(-1.19)#882 | 2.1%(-1.12)#16,402 |
| 63. | 77017 | 1.0% | 2.2%(-1.21)#893 | 2.1%(-1.14)#16,507 |
| 64. | 77015 | 0.99% | 2.2%(-1.24)#904 | 2.1%(-1.16)#16,707 |
| 65. | 77033 | 0.98% | 2.2%(-1.24)#907 | 2.1%(-1.17)#16,748 |
| 66. | 77045 | 0.98% | 2.2%(-1.24)#909 | 2.1%(-1.17)#16,768 |
| 67. | 77061 | 0.87% | 2.2%(-1.36)#954 | 2.1%(-1.28)#17,634 |
| 68. | 77051 | 0.82% | 2.2%(-1.40)#973 | 2.1%(-1.33)#17,969 |
| 69. | 77032 | 0.80% | 2.2%(-1.42)#982 | 2.1%(-1.35)#18,129 |
| 70. | 77085 | 0.79% | 2.2%(-1.44)#988 | 2.1%(-1.36)#18,230 |
| 71. | 77049 | 0.77% | 2.2%(-1.45)#997 | 2.1%(-1.38)#18,359 |
| 72. | 77039 | 0.74% | 2.2%(-1.48)#1,009 | 2.1%(-1.41)#18,597 |
| 73. | 77074 | 0.74% | 2.2%(-1.48)#1,010 | 2.1%(-1.41)#18,602 |
| 74. | 77036 | 0.71% | 2.2%(-1.51)#1,022 | 2.1%(-1.43)#18,790 |
| 75. | 77020 | 0.70% | 2.2%(-1.52)#1,032 | 2.1%(-1.45)#18,880 |
| 76. | 77048 | 0.70% | 2.2%(-1.52)#1,034 | 2.1%(-1.45)#18,885 |
| 77. | 77022 | 0.70% | 2.2%(-1.53)#1,041 | 2.1%(-1.45)#18,919 |
| 78. | 77026 | 0.67% | 2.2%(-1.55)#1,054 | 2.1%(-1.48)#19,116 |
| 79. | 77037 | 0.66% | 2.2%(-1.56)#1,056 | 2.1%(-1.49)#19,150 |
| 80. | 77012 | 0.66% | 2.2%(-1.56)#1,057 | 2.1%(-1.49)#19,154 |
| 81. | 77034 | 0.63% | 2.2%(-1.60)#1,079 | 2.1%(-1.52)#19,429 |
| 82. | 77029 | 0.56% | 2.2%(-1.66)#1,102 | 2.1%(-1.59)#19,911 |
| 83. | 77031 | 0.53% | 2.2%(-1.70)#1,114 | 2.1%(-1.62)#20,111 |
| 84. | 77078 | 0.51% | 2.2%(-1.72)#1,124 | 2.1%(-1.64)#20,242 |
| 85. | 77060 | 0.45% | 2.2%(-1.77)#1,146 | 2.1%(-1.70)#20,576 |
| 86. | 77067 | 0.45% | 2.2%(-1.78)#1,150 | 2.1%(-1.70)#20,607 |
| 87. | 77013 | 0.42% | 2.2%(-1.80)#1,164 | 2.1%(-1.72)#20,784 |
| 88. | 77011 | 0.42% | 2.2%(-1.80)#1,167 | 2.1%(-1.73)#20,802 |
| 89. | 77091 | 0.41% | 2.2%(-1.81)#1,172 | 2.1%(-1.74)#20,862 |
| 90. | 77081 | 0.41% | 2.2%(-1.82)#1,175 | 2.1%(-1.74)#20,905 |
| 91. | 77093 | 0.39% | 2.2%(-1.83)#1,186 | 2.1%(-1.76)#21,029 |
| 92. | 77053 | 0.32% | 2.2%(-1.90)#1,217 | 2.1%(-1.83)#21,424 |
| 93. | 77088 | 0.30% | 2.2%(-1.92)#1,220 | 2.1%(-1.85)#21,536 |
| 94. | 77016 | 0.29% | 2.2%(-1.93)#1,228 | 2.1%(-1.86)#21,627 |
1
Common Questions
What are the Top 10 Zip Codes with the Highest Percentage of Population Employed in Architecture & Engineering in Houston, TX?
Top 10 Zip Codes with the Highest Percentage of Population Employed in Architecture & Engineering in Houston, TX are:
What zip code has the Highest Percentage of Population Employed in Architecture & Engineering in Houston, TX?
77046 has the Highest Percentage of Population Employed in Architecture & Engineering in Houston, TX with 14.0%.
What is the Percentage of Population Employed in Architecture & Engineering in Houston, TX?
Percentage of Population Employed in Architecture & Engineering in Houston is 2.9%.
What is the Percentage of Population Employed in Architecture & Engineering in Texas?
Percentage of Population Employed in Architecture & Engineering in Texas is 2.2%.
What is the Percentage of Population Employed in Architecture & Engineering in the United States?
Percentage of Population Employed in Architecture & Engineering in the United States is 2.1%.